Embed Size (px)
Citation preview

First quarter results 2018

Disclaimer
This presentation contains forward-looking statements that reflect management’s current views with
respect to certain future events and potential financial performance. Although Nordea believes that
the expectations reflected in such forward-looking statements are reasonable, no assurance can be
given that such expectations will prove to have been correct. Accordingly, results could differ
materially from those set out in the forward-looking statements as a result of various factors.
Important factors that may cause such a difference for Nordea include, but are not limited to: (i) the
macroeconomic development, (ii) change in the competitive climate, (iii) change in the regulatory
environment and other government actions and (iv) change in interest rate and foreign exchange
rate levels.
This presentation does not imply that Nordea has undertaken to revise these forward-looking
statements, beyond what is required by applicable law or applicable stock exchange regulations if
and when circumstances arise that will lead to changes compared to the date when these
statements were provided.
2

Profitability has improved from previous quarter• Operating income +4% compared to previous quarter
We are delivering on the cost reductions• Confident to deliver on 2018 cost target
Credit quality strongest since 2007
Capital ratios at all-time-high• Highest capital ratio in Europe post methodology change from SFSA
Significant improvements in compliance
Underlying revenues softer than expected• Increased focus to improve business momentum
• More challenging to reach FY revenue guidance
Confident net profit will grow in 2018 vs 2017• Cost target for 2018 of EUR 4.9bn reiterated

4
Q1 2018 Group financial highlights
Credit quality • Loan loss level 7 (9) bps 7 (14) bps
Capital• CET1 ratio 19.8% (19.5) 19.8% (18.8)
• Management buffer 230 (190) bps 230 (120) bps
Costs • Total expenses -11% -1%
Income• Operating income 4% -4%
• Net Interest Income -5% -9%
Q118 vs. Q417* Q118 vs. Q117*
* In local currencies
Profit • Operating profit 35% -1%

Net Interest Income
5
• Minor impact from volumes and margins
• Lower lending margins and increased deposit
margins
• Higher regulatory and funding costs
• Two fewer interest days
• Minor negative FX effects
Q118 vs Q417, EURm QoQ trend
31
28
9
4
Day
count
Funding
&
regulatory
cost
Volumes
3
Q118
Local
curr.
1,056
OtherMargin
0
FX
1,053
Q118
1,109
Q417
-5%
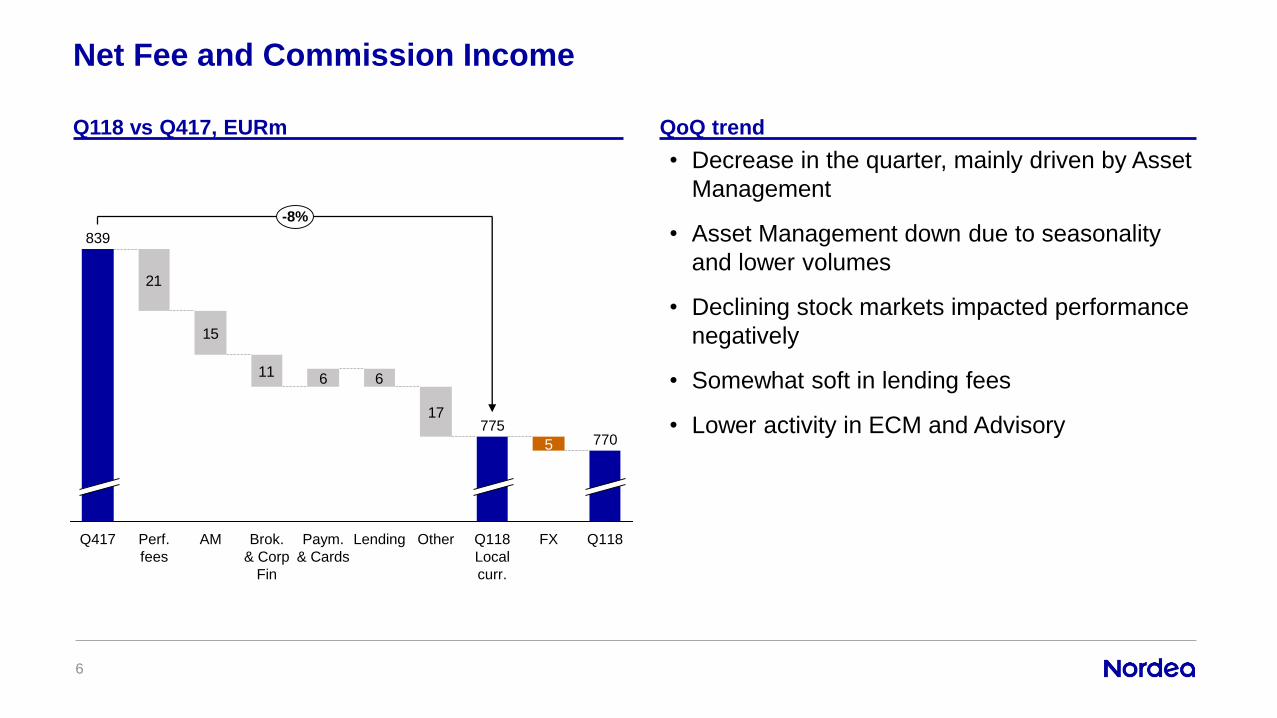
Net Fee and Commission Income
6
• Decrease in the quarter, mainly driven by Asset
Management
• Asset Management down due to seasonality
and lower volumes
• Declining stock markets impacted performance
negatively
• Somewhat soft in lending fees
• Lower activity in ECM and Advisory
Q118 vs Q417, EURm QoQ trend
21
15
11 6 6
17
5
-8%
Q118
770
Perf.
fees
Q417
839
Paym.
& Cards
Brok.
& Corp
Fin
AM FXQ118
Local
curr.
775
OtherLending

Net Fair Value
7
-41
88
8864
262 209 204
241
92
3939
5025
25 8
225
135
Q118
235
Q417
-19
441
Q317
357
Q217
361
Q117
375
322 10 0
Customer areas
Buy-backs
WB Other ex XVAIFRS13 effect
XVA
Other and eliminations
• Underlying level higher than Q4 mainly driven
by higher trading income
• Customer demand still subdued
• Reported NFV lifted by EUR 135m positive
impact from new valuation model (IFRS 13)
• No impact from XVA’s in the quarter
5 quarters development, EURm QoQ trend

Costs
8
• On track to deliver on 2018 target of EUR
4.9bn
• Increase in staff costs mainly due to
periodisation
• Number of staff down by 317
• Lower costs for group projects and
consultants
• Other costs down due to cost initiatives
Q118 vs Q417, EURm Comments
127
65
26
19
38
11
Q118
1,205
FXQ118
Local
curr.
1,216
OtherGroup
Projects
Q417
1,361
-11%
ConsultantsStaffQ4
Provis.

Significant reduction in cash spending
9
Q118 vs Q117, EURm Comments
• Total cash spending in the P&L and balance
sheet is down 7% YoY
• Well on track to meet 2018 cash spending
target of EUR 5.1bn (down from EUR 5.5bn
in 2017)
• Cash spending target of EUR 4.5-4.7bn in
2021 reiterated
• Lower cash spending will significantly improve
capital generation
150162
150
175
114
Q117
1,186
-7%
Q118
1,134
Q417
1,286
Q317
1,134
Q217
1,228
Operating expenses excl. depreciations and amortisations
Capitalisations in the balance sheet

Improved asset quality
10
• Net loan loss ratio for Q1 7 bps (Q4 9 bps)
• Net loan losses in Q1 mainly related to one
large new impaired customer in Wholesale
Banking Denmark as well as Oil & Offshore
• Net loan loss outlook
• Loan losses expected to be below long term
average in coming quarters
• Impaired loans (Stage 3) EUR 5.2bn
• Evenly split between servicing and non-
servicing
• 215 bps of total lending is impaired (Stage 3)
• Reserved allowances to cover 36% of the
impaired loans
* Total net loan losses: Includes Baltics up until Q317
Total net loan losses*, EURm Comments
40
7179
106113
129127135
Q118Q417Q216 Q317Q217Q117Q416Q316

• CET1 ratio continued to strengthen to 19.8%
in Q1
• Management buffer all-time-high at 230 bps
compared to target range of 50-150 bps
• Improved credit quality the key driver of
improvement
Common Equity Tier 1 ratio development Q118 vs Q417
11
Q118
19.8
Other
0.1
Credit quality
0.4
FX effect
0.1
Q417
19.5
Quarterly development Comments

• With the proposed move of the Swedish
mortgage risk floors from Pillar 2 to Pillar 1,
Nordea will have the highest CET1 ratio in
Europe
• Capital in nominal terms unchanged
• Management buffer largely unchanged
SFSA proposal on mortgage risk floors
12
Expected impact* Comments
12.3
Int.
peer
13.3
Int.
peer
Int.
peer
13.7
Int.
peer
14.0
Int.
peer
14.1
Nordic
peer
16.4
Nordic
peer
16.5
24.6
Nordic
peer
17.3
19.9
Nordic
peer
17.3
17.6
Nordic
peer
17.3
22.7
Int.
peer
17.7
Nordea
18.0
19.5
* Note that the figures above are based on proforma Q417 and not the forecasted amounts for Q418 included in the memo on the subject

13
Re-domiciliation • 96% of shareholders approved the re-domiciliation to Banking Union (Finland)
• The merger is tentatively to be effected October 1, 2018
Simplification
• Migrated 250,000 household customer accounts in Finland onto the new core banking
platform
• New savings and deposit accounts being opened on the new core banking platform
• All SEPA Credit Transfer Interbank payments now running on the new Global Payment
Engine
• Reduced IT complexity; 190 data warehouse applications closed down
De-risking• De-risking in Russia, Shipping, Oil & Offshore coming to an end
• International Private Banking divested
• Increased financial crime preventions
Digital • Fin-tech collaborations (Ex.Tink, Betalo, Wrapp, Fitbit and Garmin)
• Joined the first blockchain-based trade finance platform as founding partner (we.trade)
• Creating next-gen intelligent banking experiences and growing our robotics family
Status on our transformation

*Nordic region. **The following transactions are included: IPOs, convertibles and follow-ons
Source: Dealogic
League tables Selected credentials
Create
tombstone here
Public takeover offer
(pending)
DKK 67.8bn
Lead Financial adviser
to the Consortium
Deal value Public offer for
February 2018
March 2018
IPO
NOK 7,397m
Joint Bookrunner
Deal value
March 2018
USD 500m
5.875% due Mar ‘25
Senior Unsecured Notes
Joint Global Coordinator
Total notes
February 2018
Total notes
EUR 210m
4.000% due Feb ’23
Senior Secured Notes
Joint Bookrunner
Refinancing
Create
tombstone here
February 2018
Republic of Finland
EUR 3bn
1.125% due Apr ’34
Euro Government Bond
Total notes
Joint Bookrunner
#1
ECM**
Q1-2018
1,482
1,315
1,252
1,196
1,043
Nordea
Int. peer
Int. peer
Int. peer
Nordic peer
#2
M&A*
Q1-2018
15,052
12,250
11,338
8,538
4,324
Int. peer
Nordea
Int. peer
Int. peer
Int. peer
#1
Corp. Bonds*
Q1-2018
1,765
1,728
1,082
860
709
Nordea
Nordic peer
Nordic peer
Nordic peer
Nordic peer
General Corporate Purposes
EURm
EURm
EURm
#1
Syndicated
Loans*
Q1-2018
1,500
900
621
373
331
Nordea
Nordic peer
Nordic peer
Intl. peer
Intl. peer
EURm
Advis
ory
DC
M
January 2018
Merger of Tele2 and
Com Hem
SEK 98bn
Deal value
Financial Adviser to
Tele2
Merger with
#1 Corporate & Investment Bank in the Nordics
14

Recognition of our strong investment performance
15
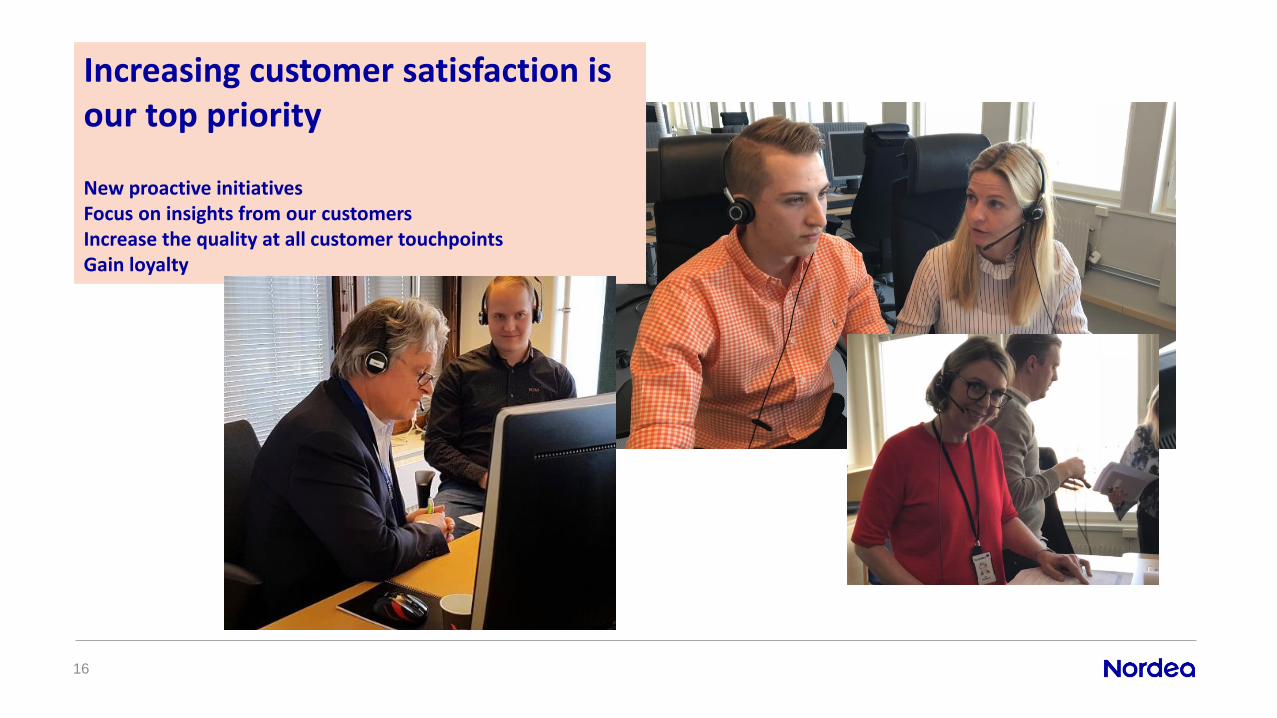
Increasing customer satisfaction is our top priority
New proactive initiatives Focus on insights from our customers Increase the quality at all customer touchpoints Gain loyalty
16

First quarter results 2018


![H1 2019 RESULTS BUSINESS UPDATE 31.07.19 [Sola lettura] · 6 Income Statement by Quarter € mn H1 2019 Group Q118 Q218 Q318 Q418 Q119 Q219 Entry fees 14.1 11.6 9.0 10.0 8.8 9.0 Management](https://img.pdfslide.us/doc/110x75/5ecc220eb5cb1834f63f26d5/h1-2019-results-business-update-310719-sola-lettura-6-income-statement-by-quarter.jpg)