Embed Size (px)
Citation preview
BXE TSX NYSE
q1FIRST QUARTER REPORT
For the three months endedMarch 31, 2017
1
2
4
11
39
40
41
42
43
58
First Quarter 2017 Highlights
President’s Message
Management’s Discussion and Analysis
Condensed Consolidated Balance Sheets
Condensed Consolidated Statements of Comprehensive Income
Condensed Consolidated Statements of Shareholders’ Equity
Condensed Consolidated Statements of Cash Flows
Notes to the Condensed Consolidated Financial Statements
Corporate Information
AECO a storage and pricing hub for Canadian natural gas markets/d per dayboe barrels of oil equivalent (6 mcf of natural gas = 1 barrel of oil equivalent)bbl or bbls barrelsGORR gross overriding royaltymboe thousand boemcf thousand cubic feetmmboe million barrels of oil equivalentmmbtu million British thermal unitsMMcf million cubic feetNGL natural gas liquids (ethane, propane, butane, and pentane)WTI West Texas Intermediate, a benchmark crude oil used for pricing comparisonNI 51-101 National Instrument 51-101
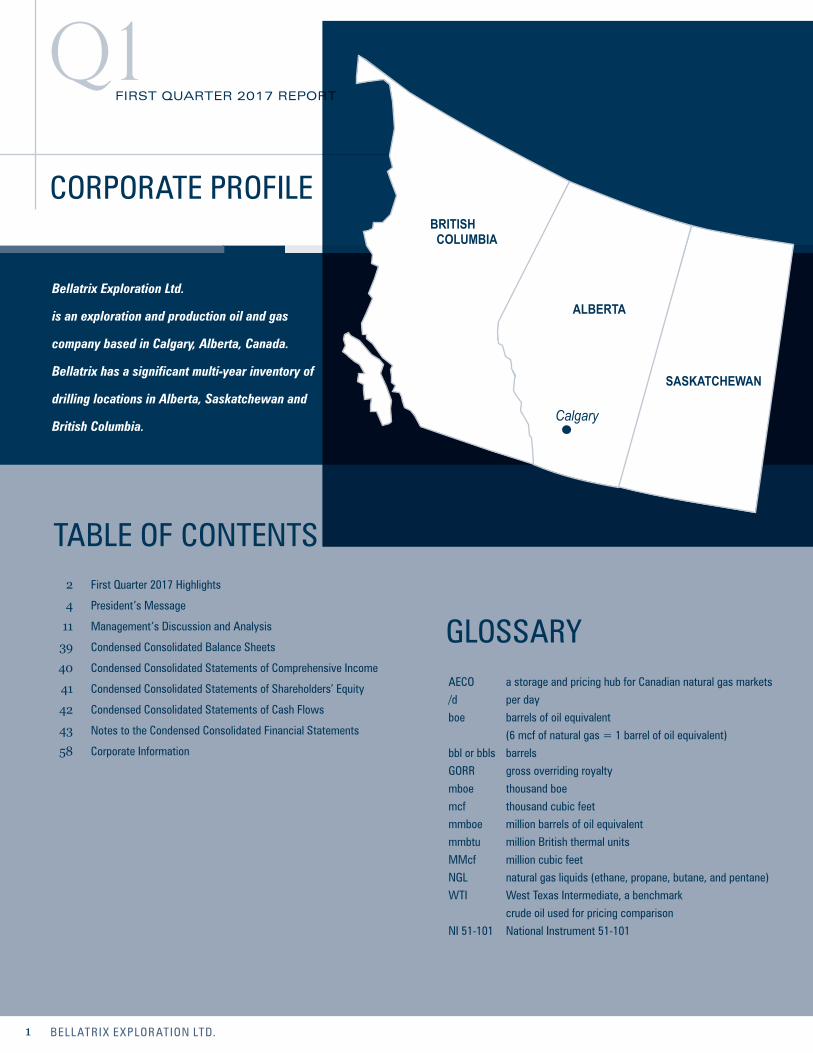
Bellatrix Exploration Ltd.
is an exploration and production oil and gas
company based in Calgary, Alberta, Canada.
Bellatrix has a significant multi-year inventory of
drilling locations in Alberta, Saskatchewan and
British Columbia.
CORPORATE PROFILE
GLOSSARY
TABLE OF CONTENTS
BELLATRIX EXPLORATION LTD.
q1FIRST QUARTER 2017 REPORT
BRITISH COLUMBIA
ALBERTA
SASKATCHEWAN
Calgary
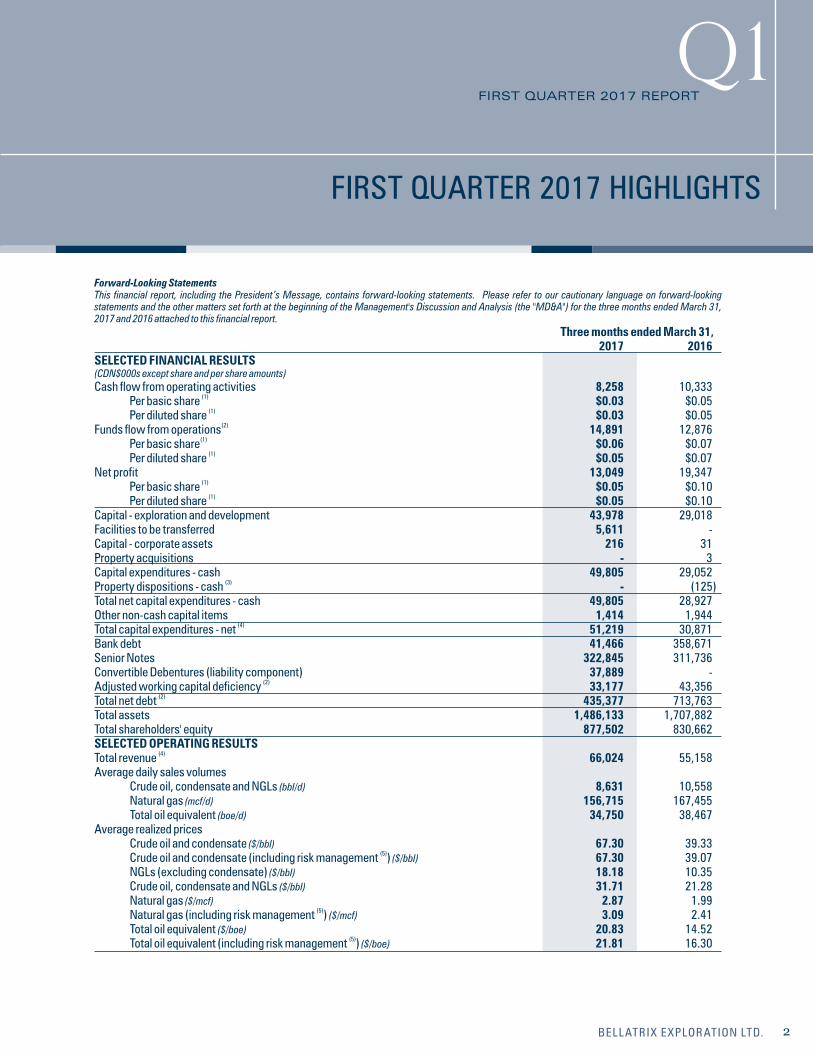
Forward-Looking StatementsThis financial report, including the President’s Message, contains forward-looking statements. Please refer to our cautionary language on forward-looking statements and the other matters set forth at the beginning of the Management's Discussion and Analysis (the "MD&A") for the three months ended March 31, 2017 and 2016 attached to this financial report. Three months ended March 31, 2017 2016SELECTED FINANCIAL RESULTS (CDN$000s except share and per share amounts) Cash flow from operating activities 8,258 10,333
(1) Per basic share $0.03 $0.05(1) Per diluted share $0.03 $0.05
(2)Funds flow from operations 14,891 12,876 (1) Per basic share $0.06 $0.07
(1) Per diluted share $0.05 $0.07Net profit 13,049 19,347
(1) Per basic share $0.05 $0.10(1) Per diluted share $0.05 $0.10
Capital - exploration and development 43,978 29,018Facilities to be transferred 5,611 -Capital - corporate assets 216 31Property acquisitions - 3Capital expenditures - cash 49,805 29,052
(3)Property dispositions - cash - (125)Total net capital expenditures - cash 49,805 28,927Other non-cash capital items 1,414 1,944
(4)Total capital expenditures - net 51,219 30,871Bank debt 41,466 358,671Senior Notes 322,845 311,736Convertible Debentures (liability component) 37,889 -
(2)Adjusted working capital deficiency 33,177 43,356(2)Total net debt 435,377 713,763
Total assets 1,486,133 1,707,882Total shareholders' equity 877,502 830,662SELECTED OPERATING RESULTS
(4)Total revenue 66,024 55,158Average daily sales volumes Crude oil, condensate and NGLs (bbl/d) 8,631 10,558 Natural gas (mcf/d) 156,715 167,455 Total oil equivalent (boe/d) 34,750 38,467Average realized prices Crude oil and condensate ($/bbl) 67.30 39.33
(5) Crude oil and condensate (including risk management ) ($/bbl) 67.30 39.07 NGLs (excluding condensate) ($/bbl) 18.18 10.35 Crude oil, condensate and NGLs ($/bbl) 31.71 21.28 Natural gas ($/mcf) 2.87 1.99
(5) Natural gas (including risk management ) ($/mcf) 3.09 2.41 Total oil equivalent ($/boe) 20.83 14.52
(5) Total oil equivalent (including risk management ) ($/boe) 21.81 16.30
FIRST QUARTER 2017 HIGHLIGHTS
2BELLATRIX EXPLORATION LTD.
q1FIRST QUARTER 2017 REPORT
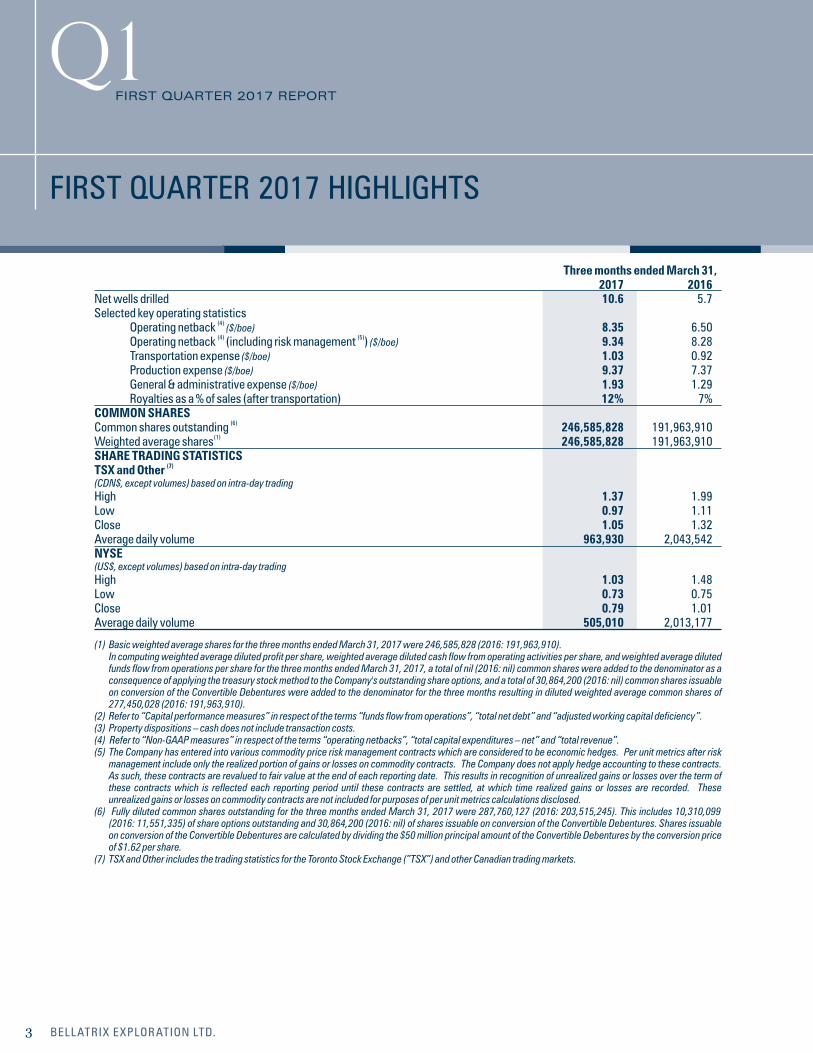
Three months ended March 31, 2017 2016Net wells drilled 10.6 5.7Selected key operating statistics
(4) Operating netback ($/boe) 8.35 6.50(4) (5) Operating netback (including risk management ) ($/boe) 9.34 8.28
Transportation expense ($/boe) 1.03 0.92 Production expense ($/boe) 9.37 7.37 General & administrative expense ($/boe) 1.93 1.29 Royalties as a % of sales (after transportation) 12% 7%COMMON SHARES
(6)Common shares outstanding 246,585,828 191,963,910 (1)Weighted average shares 246,585,828 191,963,910
SHARE TRADING STATISTICS (7)TSX and Other
(CDN$, except volumes) based on intra-day trading High 1.37 1.99Low 0.97 1.11Close 1.05 1.32Average daily volume 963,930 2,043,542NYSE (US$, except volumes) based on intra-day trading High 1.03 1.48Low 0.73 0.75Close 0.79 1.01Average daily volume 505,010 2,013,177
(1) Basic weighted average shares for the three months ended March 31, 2017 were 246,585,828 (2016: 191,963,910). In computing weighted average diluted profit per share, weighted average diluted cash flow from operating activities per share, and weighted average diluted
funds flow from operations per share for the three months ended March 31, 2017, a total of nil (2016: nil) common shares were added to the denominator as a consequence of applying the treasury stock method to the Company's outstanding share options, and a total of 30,864,200 (2016: nil) common shares issuable on conversion of the Convertible Debentures were added to the denominator for the three months resulting in diluted weighted average common shares of 277,450,028 (2016: 191,963,910).
(2) Refer to “Capital performance measures” in respect of the terms “funds flow from operations”, “total net debt” and “adjusted working capital deficiency”.(3) Property dispositions – cash does not include transaction costs. (4) Refer to “Non-GAAP measures” in respect of the terms “operating netbacks”, “total capital expenditures – net” and “total revenue”. (5) The Company has entered into various commodity price risk management contracts which are considered to be economic hedges. Per unit metrics after risk
management include only the realized portion of gains or losses on commodity contracts. The Company does not apply hedge accounting to these contracts. As such, these contracts are revalued to fair value at the end of each reporting date. This results in recognition of unrealized gains or losses over the term of these contracts which is reflected each reporting period until these contracts are settled, at which time realized gains or losses are recorded. These unrealized gains or losses on commodity contracts are not included for purposes of per unit metrics calculations disclosed.
(6) Fully diluted common shares outstanding for the three months ended March 31, 2017 were 287,760,127 (2016: 203,515,245). This includes 10,310,099 (2016: 11,551,335) of share options outstanding and 30,864,200 (2016: nil) of shares issuable on conversion of the Convertible Debentures. Shares issuable on conversion of the Convertible Debentures are calculated by dividing the $50 million principal amount of the Convertible Debentures by the conversion price of $1.62 per share.
(7) TSX and Other includes the trading statistics for the Toronto Stock Exchange (”TSX”) and other Canadian trading markets.
FIRST QUARTER 2017 HIGHLIGHTS
3 BELLATRIX EXPLORATION LTD.
q1FIRST QUARTER 2017 REPORT
Execution of our strategic three year development plan previously announced in January 2017 began in earnest during the first quarter of 2017, marking the resumption of Bellatrix's long term profitable growth. The Company delivered on its objectives, exceeding the previously set full year 2017 production guidance target and providing clear line of sight to deliver +/-15% compound annual growth in production volumes over the next three years. First quarter 2017 performance included the following operational and financial achievements:
Production volumes of 34,750 boe/d represented average volume growth of 9% compared with the previous quarter
Funds flow from operations of $14.9 million grew 77% compared with the previous quarter
Production expenditures of $9.37/boe were reduced by $1.20/boe or 11% from the previous quarter
Bellatrix has built a strong and sustainable business anchored by three pillars that provide the foundation for long term profitable growth: 1) high quality assets and acreage, 2) infrastructure ownership and control and 3) takeaway capacity and market egress.
High Quality Assets & Acreage
Bellatrix is positioned to accelerate profitable growth of our large asset base as evidenced by our first quarter 2017 operational performance. The core foundational assets for the Company reside in a proven area of the Deep Basin in west central Alberta, known for its exceptional geologic and hydrocarbon bearing characteristics. Bellatrix maintains a dominant core acreage position along the Deep Basin fairway with decades of development ready opportunities anchored by our large inventory of net identified Spirit River and Cardium well locations and the Company retains significant torque to a higher crude oil price environment through its Cardium position.
The Spirit River liquids rich natural gas play represents one of North America's lowest supply cost natural gas plays and delivers strong rates of return at current natural gas prices. Rate of return expectations for the Spirit River continue to rank among the highest within our portfolio of investment opportunities thereby attracting the majority of anticipated capital investment in 2017. Bellatrix has proven itself as a premier operator within the Spirit River play, consistently delivering industry leading well productivity results which drive strong rates of return for every capital dollar invested. To that end, the first two wells completed in early February of Bellatrix's 2017 Spirit River program ranked as two of the best wells in Alberta during the month, followed by the remaining first quarter program wells being completed and placed on stream at or above internal expectations. Our top tier acreage position and material running room provide a key long term competitive advantage for the Company.
Infrastructure Ownership and Control
Infrastructure ownership, operatorship and control creates significant barriers to competition within our core area thus ensuring operational flexibility and reliability to profitably process our production volumes and extract maximum value from each product stream. Since 2013, Bellatrix has invested approximately $350 million in strategic infrastructure assets within its core west central Alberta area providing above ground control of the region and creating significant barriers to industry competition. The capital build out for our long term growth strategy is nearly complete with investment in the Bellatrix O'Chiese Nees-Ohpawganu'ck deep-cut gas plant at Alder Flats (the "Alder Flats Plant"), ownership in two other major natural gas processing plants, operatorship and control of nine major compressor stations, and direct operatorship in over 1,000 kilometres of strategic gathering systems and pipelines. Bellatrix's historic investment in key strategic infrastructure and facilities provide the processing capacity and capability to grow net Company production volumes beyond 60,000 boe/d, with minimal future facility related capital. With the proportion of capital to facilities projects expected to materially reduce in 2018 and beyond, Bellatrix anticipates directing incremental capital directly to the drill bit, thereby enhancing already industry leading corporate capital efficiency metrics.
PRESIDENT’S MESSAGE
4BELLATRIX EXPLORATION LTD.
q1FIRST QUARTER 2017 REPORT
Takeaway Capacity and Market Egress
The third pillar that provides a key competitive advantage and underpins the Company's long term profitable growth profile is ensuring ample takeaway capacity and market egress for our production volumes. Bellatrix maintains several long term firm transportation ("FT") agreements, ensuring market egress for current and forecast production, currently representing approximately 120% of current gross operated natural gas volumes at multiple receipt points on the Nova Gas Transmission Ltd. (the "NGTL") system. The NGTL system has experienced, and is expected to experience further curtailments of both interruptible and firm service capacity as the operator continues work through 2017 to expand capacity along the system. With excess FT relative to current production levels, Bellatrix is well positioned to deliver volumes with minimal impacts during periods of system curtailments. Bellatrix previously negotiated additional FT capacity to facilitate increased growth volumes from Phase 2 of its Alder Flats Plant which provides additional strategic long term value for the Company. Bellatrix also maintains firm service contracts through a number of third party processing plants in its greater core Ferrier region to ensure unfettered delivery capability for current and planned production growth, with staggered contract maturity dates to align with the in-service date of Phase 2 of the Alder Flats Plant. Finally, Bellatrix has secured fractionation capacity for its natural gas liquids ("NGL") volumes by way of long term agreements providing 100% coverage for current and forecast NGL volumes from both Phase 1 and Phase 2 of its Alder Flats Plant. The foresight to obtain and control firm transportation along the main transmission system for not only current but also forecast growth volumes provides a key competitive long term advantage for the Company.
ENHANCED OUR ALREADY STRONG RISK MANAGEMENT POSITION
Bellatrix continued to protect its long term strategic plan by adding to its already strong risk management position during the first quarter of 2017. Bellatrix maintains approximately 64% of forecast gross natural gas volumes in 2017 hedged at an average fixed price of approximately $3.36/mcf (based on the mid-point of the updated 2017 average gross production guidance of 34,500 boe/d; 76% natural gas weighted). In addition, the Company has in place material risk management protection in 2018 with a total of 65.6 MMcf/d of 2018 natural gas volumes hedged at an average fixed price of approximately $3.08/mcf; this represents approximately 42% of volumes compared to the mid-point of the updated 2017 full year average guidance. Strong propane prices in the first quarter of 2017 provided an attractive opportunity for Bellatrix to hedge 1,500 bbl/d of propane volumes at an average price of 51% of WTI light oil prices from February through December of 2017, and 1,000 bbl/d of propane volumes at an average price of 47% of WTI light oil prices in 2018, both meaningfully above long term historical averages. Bellatrix's hedging program is part of its overall risk management strategy focused on providing reduced commodity price volatility and greater assurance over future revenue and cash flows which help drive the capital and reinvestment decisions within our business.
STRONG OPERATIONAL PERFORMANCE ACHIEVED IN THE FIRST QUARTER OF 2017
Bellatrix delivered strong operational performance through the first quarter of 2017. First quarter average production of 34,750 boe/d (75% natural gas weighted) surpassed the Company's 2017 prior average annual guidance (mid-point) estimate of 33,500 boe/d. With first quarter objectives solidly met, Bellatrix remains favourably positioned to deliver strong results through 2017 with second quarter production levels currently exceeding management expectations. With strong operational performance and momentum, Bellatrix is increasing its 2017 production guidance target as discussed in the Outlook section of this release.
Our focus on operational execution and delivery of our three year growth strategy was evident by the strong results achieved during the first quarter of 2017. Bellatrix participated in 13 gross (10.6 net) wells in the first quarter which included 8 gross (7.6 net) operated Spirit River wells, 2 gross (2.0 net) operated Cardium wells and also 3 gross (1.0 net) non-operated wells in the Spirit River and Ellerslie formations. Of the ten gross operated wells drilled during the first quarter, eight were brought on-stream during the first three months of the year, with the remaining operated Spirit River well subsequently brought on-stream in early April, and the one remaining Cardium operated well drilled and planned for completion and on-stream delivery in the third quarter of 2017.
Bellatrix completed its planned first quarter capital program with exploration and development expenditures of $44.0 million and an unchanged expectation to spend approximately half of the full year's net capital expenditure budget of $105 million within the first six months of the year.
PRESIDENT’S MESSAGE
5 BELLATRIX EXPLORATION LTD.
q1FIRST QUARTER 2017 REPORT
First quarter production expenses averaged $9.37/boe, representing a marked reduction of $1.20/boe from the $10.57/boe production expenditure level in the fourth quarter of 2016. First quarter production expenditure levels and anticipated production and expense levels position Bellatrix to maintain its full year average production expenditure guidance of approximately $9.00/boe. Previously set year 2017 guidance expectations refer to Bellatrix's guidance as announced on January 5, 2017.
First Quarter 2017 Actual Performance Versus Previously Set 2017 Annual Guidance First Quarter Previously Set Actual Versus 2017 Results 2017 Annual Guidance GuidanceAverage daily production (boe/d) 34,750 33,500 +4%Average product mix Crude oil, condensate and NGLs (%) 25 24 +1% Natural gas (%) 75 76 -1%
(1) Net capital spending ($ millions) 44 105 n/aExpenses ($/boe)
(2) Production 9.37 9.00 +4%
(1) Capital spending includes exploration and development capital projects and corporate assets, and excludes property acquisitions, property dispositions, and facilities to be transferred.
(2) Production expenses before net processing revenue/fees.
OPERATIONAL UPDATE
With the conclusion of all joint venture drilling in 2016, Bellatrix has demonstrated the flexibility in 2017 to balance infill development drilling and expanded core area development. The Company remains focused on growing production, adding reserves, and increasing our inventory of development drilling locations. Bellatrix's working interest in operated wells drilled in the first quarter of 2017 averaged 96%. Well results from the first quarter program continue to meet and exceed management expectations. To that end, Bellatrix is pleased to provide enhanced transparency for its operated 2017 development program results including the:
100/1-30-44-09W5 Spirit River (100% working interest) well IP85: 14.5 MMcf/d
102/1-6-45-09W5 Spirit River (100% working interest) well IP50: 10.6 MMcf/d
102/1-19-44-09W5 Spirit River (67% working interest) well IP70: 12.1 MMcf/d
102/16-30-44-09W5 Spirit River (100% working interest) well IP50: 11.3 MMcf/d
100/4-06-45-09W5 Spirit River (100% working interest) well IP35: 10.0 MMcf/d
102/16-11-45-07W5 Spirit River (100% working interest) well IP20: 8.6 MMcf/d
100/3-6-45-09W5 Spirit River (100% working interest) well IP30: 9.9 MMcf/d
100/5-19-43-09W5 Spirit River (92% working interest) well IP20: 5.9 MMcf/d
100/1-30-45-08W5 Cardium (100% working interest) well IP55: 550 boe/d
Bellatrix completed the majority of its first half program in the first three months of the year (in advance of the seasonal spring break-up period) with exploration and development capital expenditures invested during the first quarter of $44.0 million. The Company's capital expenditure plans remain on target and in line with previously stated guidance levels for $105 million in 2017 with approximately 50% of capital expenditures to be invested within the first half of the year.
PRESIDENT’S MESSAGE
6BELLATRIX EXPLORATION LTD.
q1FIRST QUARTER 2017 REPORT
ALDER FLATS PHASE 2 EXPANSION NEARING COMPLETION WHICH REPRESENTS THE FINAL STAGE OF THE COMPANY'S LONG TERM STRATEGIC INFRASTRUCTURE BUILD-OUT
The Alder Flats Plant represents a highly strategic asset for the Company as we continue to execute on our three year development plan to profitably grow production, expand netbacks and grow cash flow. Phase 1 of the Alder Flats Plant has been on-stream for 21 continuous months delivering an average 96% capacity utilization rate over that period and firmly establishing the Bellatrix Alder Flats Plant as the most efficient plant in our greater west central Alberta core area.
The Phase 2 expansion project, which will more than double gross throughput capacity at the plant to 230 MMcf/d (from 110 MMcf/d currently) remains on time and on budget for completion in the second quarter of 2018. The Plant expansion is anticipated to drive improved revenue generation through additional higher margin NGL extraction, and provide further reductions to corporate operating costs, driving expanded corporate profit margins and cash flow. Fabrication of all major equipment for Phase 2 is complete including compressors and propane bullets. Fabrication and packaging of other material equipment including the condensate stabilizer, production tanks, heat medium package, and electrical equipment continues to progress according to plan and is expected to arrive on site for installation over the next several quarters. Site construction activity will recommence late in the second quarter with scheduled pile driving activity anticipated to begin in June. Major equipment will begin being delivered to site, with installation activities and mechanical work planned to begin in the third quarter of 2017.
Bellatrix's investment in strategic infrastructure assets within the greater Ferrier and Willesden Green areas of west central Alberta provide the above ground control of the region and create significant barriers to industry competition. The capital build out for our long term growth strategy is nearly complete given prior period investment in the Alder Flats Plant, major compressor stations, and strategic gathering systems and pipelines. Bellatrix forecasts net capital expenditures of approximately $13 million in 2017 and $3 million in 2018 (excluding received partner prepayment) required to complete Phase 2 of the Alder Flats Plant which will solidify our infrastructure control, and provide the facilities and processing capacity to grow net production volumes beyond 60,000 boe/d, with minimal future facility related capital.
Completion of Phase 2 of the Alder Flats Plant, which will add an incremental 30 MMcf/d ownership capacity net to Bellatrix's 25% working interest, is expected to deliver a favourable step change reduction in operating costs down by approximately $1.00/boe relative to current full year 2017 average production expense guidance.
INDUSTRY LEADING WELL RESULTS AND CONTINUED CAPITAL COST SUPPRESSION EFFORTS
Bellatrix has established itself as a premier operator in west central Alberta, continuously delivering top tier well results from its Spirit River development program through the first quarter of 2017, coupled with continued capital cost reductions which in combination delivered another extremely capital efficient quarter. All-in (drill, complete, equip and tie-in) estimated well costs in the first quarter of 2017 averaged $3.8 million, unchanged from average costs of $3.8 million achieved in 2016 despite modest upward pressure on select completion service costs in 2017. Bellatrix continues to supress costs and mitigate inflationary pressure on capital costs, given structural and sustainable improvements achieved within both drilling and completion practices.
ENHANCED LIQUIDITY POSITION WITH BORROWING BASE INCREASED 20%
Subsequent to the end of the first quarter, Bellatrix amended and restated the terms of its syndicated revolving credit facilities (the “Credit Facilities”). Effective May 9, 2017, the total commitments under the Credit Facilities were set at $120 million, comprised of a $25 million operating facility provided by a Canadian bank and a $95 million syndicated facility provided by four financial institutions. Total commitments under the Credit Facilities were increased 20% relative to total commitments at year end 2016. The borrowing base increase provides enhanced liquidity relative to prior levels, while maintaining Bellatrix's financial resources at a level that minimizes standby fees. The Company remains committed to continued fiscal prudence, and achieving near term growth objectives within current capital spending guidance levels.
Other than the $41.5 million outstanding as at March 31, 2017 on the Credit Facilities, the Company has no debt maturities until 2020 and 2021.
PRESIDENT’S MESSAGE
7 BELLATRIX EXPLORATION LTD.
q1FIRST QUARTER 2017 REPORT
Subsequent to the end of the first quarter 2017, Bellatrix completed two separate transactions whereby it monetized its $15 million vendor take back loan receivable and divested its marketable securities for combined net proceeds of approximately $20 million. Bellatrix utilized proceeds from these two transactions to reduce the amount outstanding on its bank credit facilities to approximately $21 million as at April 30, 2017.
OPERATIONAL AND FINANCIAL HIGHLIGHTS
Production volumes in the first quarter of 2017 averaged 34,750 boe/d (75% natural gas weighted), ahead of the Company's previously set full year 2017 guidance. Production levels in the first quarter 2017 increased 9% relative to fourth quarter 2016 levels, reflecting strong results achieved from the first quarter capital program. The Company was able to proactively manage system wide interruptible and firm takeaway constraints through the utilization of its strategic infrastructure including the Alder Flats Plant.
Exploration and development capital expenditures were $44.0 million in the first quarter of 2017. Capital expenditures in the quarter were focused on drilling and completion activity with 13 gross (10.6 net) wells drilled and/or participated in during the quarter. Facilities related investment net of transfers was focused primarily on the Phase 2 expansion project of the Alder Flats Plant.
In the first quarter of 2017, Bellatrix drilled and/or participated in nine gross (7.8 net) Spirit River liquids rich natural gas wells, two gross (0.8 net) Ellerslie gas wells, and two gross (2.0 net) Cardium wells.
Compared to first quarter 2016 levels, Bellatrix reduced bank debt by $317.2 million. At March 31, 2017, Bellatrix reduced outstanding bank debt to $41.5 million and total net debt to $435.4 million representing year over year reductions of 88% and 39%, respectively. The total net debt was reduced as proceeds from several non-core asset dispositions, facilities monetization transactions and capital financings completed in 2016 was used to reduce outstanding bank indebtedness.
At March 31, 2017, Bellatrix had $58.5 million of undrawn capacity (approximately 59% undrawn) on its $100 million Credit Facilities excluding outstanding letters of credit of $12.9 million that reduce the amount otherwise available to be drawn on the facilities. Subsequent to quarter end, the Company entered into an amended and restated syndicated revolving credit facility agreement increasing the borrowing base of the Credit Facilities to $120 million providing enhanced liquidity compared with March 31, 2017 levels.
For the year ended March 31, 2017, Bellatrix's Senior Debt to EBITDA (as defined below) ratio was 1.81 times, well below the financial covenant of 3.5 times as permitted by the agreement governing the credit facilities.
Total revenue increased by 20% to $66.0 million for the first quarter 2017, compared to $55.2 million realized in the first quarter 2016 mainly attributable to an increase in commodity prices for oil, NGLs and natural gas from the comparative periods.
The corporate royalty rate in the three months ended March 31, 2017 averaged 12% of sales (after transportation), compared to 7% in the first quarter of 2016. Higher average royalty rates over the comparative periods reflect higher commodity prices, and decreased gas cost allowance (“GCA”) credits associated with prior period facilities monetization transactions completed in 2016.
Production expenses in the first quarter 2017 averaged $9.37/boe. Production expenditures are expected to decline during 2017 and average approximately $9.00/boe during the year, as a result of cost suppression initiatives and increased production volumes which will reduce overall production expenditures on a per unit of production basis.
The corporate operating netback (including risk management) realized for the three months ended March 31, 2017 was $9.34/boe. Before risk management, the first quarter 2017 operating netback was $8.35/boe, an increase of 28% compared to the $6.50/boe netback realized in the first quarter 2016 reflecting improved realized commodity prices over the comparable periods.
PRESIDENT’S MESSAGE
8BELLATRIX EXPLORATION LTD.
q1FIRST QUARTER 2017 REPORT
Net general and administrative (“G&A”) expenses (after capitalized costs and recoveries) for the three months ended March 31, 2017 were $6.0 million ($1.93/boe), compared to $4.5 million ($1.29/boe) in the comparative 2016 period. Net G&A costs increased in the current period due to an increase in gross expenses related to workforce restructuring costs and a decrease in capital recoveries from partners as a result of an increase in Bellatrix's average working interest in the operated wells drilled in the first quarter of 2017 compared with the prior period.
Funds flow from operations generated in the three months ended March 31, 2017 was $14.9 million ($0.06 per basic and $0.05 per diluted share), an increase of 16% from $12.9 million ($0.07 per basic and diluted share) in the first quarter of 2016. Cash flow from operating activities was $8.3 million in the first quarter 2017 ($0.03 per basic and diluted share) a decrease of 19% from $10.3 million ($0.05 per basic and diluted share) in the first quarter of 2016.
The net profit for the three months ended March 31, 2017 was $13.0 million compared to a net profit of $19.3 million for the three months ended March 31, 2016. The decrease in net profit period over period is due to a decrease in the unrealized foreign exchange gain, offset by an increase in the operating netbacks realized.
As at March 31, 2017, Bellatrix had approximately 173,595 net undeveloped acres of land in Alberta, British Columbia, and Saskatchewan.
At March 31, 2017, Bellatrix had approximately $1.49 billion in tax pools available for deduction against future income.
OUTLOOK
Management's acute focus on operational execution during the first quarter of 2017 resulted in production volume outperformance relative to previously set full year 2017 average guidance levels, enabling management to increase our full year guidance expectations as described below. The majority of our first half capital investment program was completed during the first three months of the year, as capital investment activities are customarily curtailed during the second quarter, given the seasonal spring break-up period. Average second quarter 2017 production levels are anticipated to commensurately meet the revised full year average guidance of 34,500 boe/d given strong well results and strong operational momentum achieved during the first quarter of 2017.
Our capital investment plans for 2017 remain unchanged; Bellatrix plans to expand its drilling efforts across our core west central Alberta acreage including expanded development of the Spirit River formation in the Willesden Green area, following on our success in the Ferrier area. With the completion of joint venture programs in 2016, Bellatrix has strategically reviewed its drilling program to optimize capital investment, forecast rates of return, and long term net asset value and reserve growth potential. Our current 2017 capital expenditure guidance anticipates drilling approximately 19 net wells during the year, of which approximately 10.6 wells were drilled during the first quarter of the year with one operated Cardium well currently uncompleted. Our focused capital investment program is supported by an active risk management program, and will continue to target the low cost and high return Spirit River liquids rich natural gas play which delivers strong rates of return.
INCREASED 2017 PRODUCTION GUIDANCE WITH NO CHANGE TO CAPITAL EXPENDITURES GIVEN STRONG OPERATIONAL PERFORMANCE
Strong first quarter operational results and positive momentum into the second quarter provide visibility to meaningfully outperform prior forecast guidance expectation levels. To that end, Bellatrix is increasing its full year 2017 average production guidance expectation to 34,500 boe/d, an increase of 1,000 boe/d from prior guidance announced on January 5, 2017. Bellatrix has maintained its full year capital expenditure guidance at $105 million despite the increase in average production levels. Bellatrix remains committed to providing sustainable long term growth for shareholders including delivery of our 2017 capital program providing +/-15% forecast production growth.
PRESIDENT’S MESSAGE
9 BELLATRIX EXPLORATION LTD.
q1FIRST QUARTER 2017 REPORT
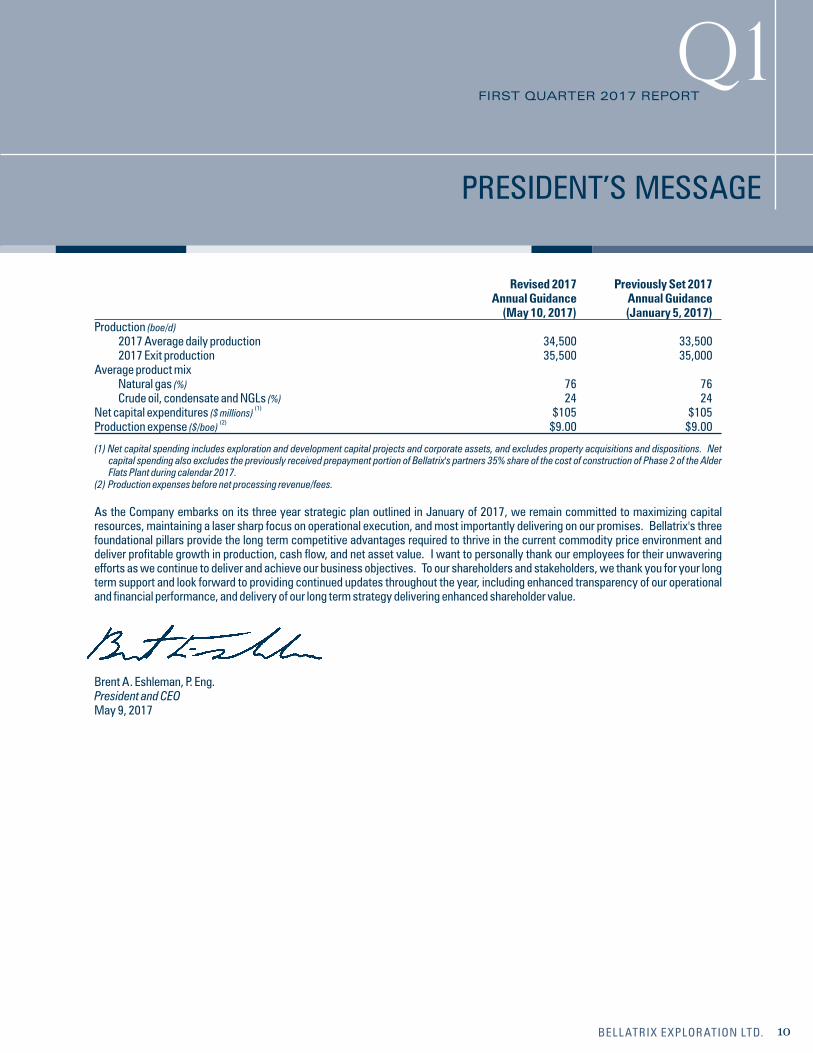
Revised 2017 Previously Set 2017 Annual Guidance Annual Guidance (May 10, 2017) (January 5, 2017) Production (boe/d) 2017 Average daily production 34,500 33,500 2017 Exit production 35,500 35,000 Average product mix Natural gas (%) 76 76 Crude oil, condensate and NGLs (%) 24 24
(1) Net capital expenditures ($ millions) $105 $105 (2)Production expense ($/boe) $9.00 $9.00
(1) Net capital spending includes exploration and development capital projects and corporate assets, and excludes property acquisitions and dispositions. Net capital spending also excludes the previously received prepayment portion of Bellatrix's partners 35% share of the cost of construction of Phase 2 of the Alder Flats Plant during calendar 2017.
(2) Production expenses before net processing revenue/fees.
As the Company embarks on its three year strategic plan outlined in January of 2017, we remain committed to maximizing capital resources, maintaining a laser sharp focus on operational execution, and most importantly delivering on our promises. Bellatrix's three foundational pillars provide the long term competitive advantages required to thrive in the current commodity price environment and deliver profitable growth in production, cash flow, and net asset value. I want to personally thank our employees for their unwavering efforts as we continue to deliver and achieve our business objectives. To our shareholders and stakeholders, we thank you for your long term support and look forward to providing continued updates throughout the year, including enhanced transparency of our operational and financial performance, and delivery of our long term strategy delivering enhanced shareholder value.
Brent A. Eshleman, P. Eng.President and CEOMay 9, 2017
PRESIDENT’S MESSAGE
10BELLATRIX EXPLORATION LTD.
q1FIRST QUARTER 2017 REPORT
May 9, 2017 – The following Management's Discussion and Analysis of financial results (“MD&A”) as provided by the management of Bellatrix Exploration Ltd. (“Bellatrix” or the “Company”) should be read in conjunction with the unaudited interim condensed consolidated financial statements of the Company for the three months ended March 31, 2017 and 2016, the audited consolidated financial statements of the Company for the years ended December 31, 2016 and 2015 and the related MD&A, and Bellatrix's Annual Information Form, all of which are filed on SEDAR at www.sedar.com and on the Company's website at www.bellatrixexploration.com. The Company's EDGAR filings and forms are available through the US Securities and Exchange Commission at www.sec.gov. Disclosure which is unchanged from the MD&A for the year ended December 31, 2016 may not be repeated herein. This commentary is based on information available to, and is dated as of, May 9, 2017. The financial data presented is in Canadian dollars, except where indicated otherwise.
CONVERSION: The term barrels of oil equivalent (“boe”) may be misleading, particularly if used in isolation. A boe conversion ratio of six thousand cubic feet of natural gas to one barrel of oil equivalent (6 mcf/bbl) is based on an energy equivalency conversion method primarily applicable at the burner tip and does not represent a value equivalency at the wellhead. Given that the value ratio based on the current price of crude oil as compared to natural gas is significantly different from the energy equivalency of 6:1, utilizing a conversion on a 6:1 basis may be misleading as an indication of value. All boe conversions in this report are derived from converting gas to oil in the ratio of six thousand cubic feet of gas to one barrel of oil.
NON-GAAP MEASURES: Throughout Bellatrix's MD&A, the Company uses terms that are commonly used in the oil and natural gas industry, but do not have a standardized meaning presented by International Financial Reporting Standards (“IFRS”) and therefore may not be comparable to the calculations of similar measures for other entities. Management believes that the presentation of these non-GAAP measures provide useful information to investors and shareholders as the measure provide increased transparency and the ability to better analyze performance against prior periods on a comparable basis.
Operating netbacks are calculated by subtracting royalties, transportation, and operating expenses from total revenue. Management believes this measure is a useful supplemental measure of the amount of total revenue received after transportation, royalties and operating expenses. The Company's calculation of total revenue includes petroleum and natural gas sales and other income, and excludes commodity price risk management. Total capital expenditures – net includes the cash impact of capital expenditures and property dispositions, as well as the non-cash capital impacts of corporate acquisitions, property acquisitions, adjustments to the Company's decommissioning liabilities, and share based compensation. Bellatrix's method of calculating these measures may differ from other entities, and accordingly, may not be comparable to measures used by other companies.
CAPITAL PERFORMANCE MEASURES: In addition to the non-GAAP measures described above, there are also terms that have been reconciled in the Company's financial statements to the most comparable IFRS measures. These terms do not have any standardized meaning prescribed by IFRS and therefore may not be comparable with the calculations of similar measures for other entities. These terms have been referenced in the Company's MD&A and financial statements. These terms are used by management to analyze operating performance on a comparable basis with prior periods and to analyze the liquidity of the Company.
This MD&A contains the term “funds flow from operations” which should not be considered an alternative to, or more meaningful than “cash flow from operating activities” as determined in accordance with GAAP as an indicator of the Company's performance. Therefore reference to funds flow from operations or funds flow from operations per share may not be comparable with the calculation of similar measures for other entities. Management uses funds flow from operations to analyze operating performance and leverage and considers funds flow from operations to be a key measure as it demonstrates the Company's ability to generate the cash necessary to fund future capital investments and to repay debt. Funds flow from operations is calculated as cash flow from operating activities, excluding decommissioning costs incurred and changes in non-cash working capital incurred. The reconciliation between cash flow from operating activities and funds flow from operations can be found in this MD&A. Funds flow from operations per share is calculated using the weighted average number of shares for the period.
This MD&A also contains the terms “net debt”, “total net debt”, and “adjusted working capital deficiency”, which also are not recognized measures under GAAP. Therefore reference to total net debt, net debt and adjusted working capital deficiency may not be comparable with the calculation of similar measures for other entities. The Company's calculation of total net debt excludes other deferred liabilities, deferred capital obligations, long-term risk management contract liabilities, decommissioning liabilities, and deferred tax liabilities. Total net debt includes the adjusted working capital deficiency, the liability component of the Convertible Debentures (as defined below), current bank debt and long term bank debt. Net debt excludes the liability component of the Convertible Debentures. The adjusted working capital deficiency is a non-GAAP measure calculated as net working capital deficiency excluding current risk management contract assets and liabilities, current portion of other deferred liabilities, current portion of deferred capital obligation and the current bank debt. Management believes these measures are useful supplementary measures of the total amount of current and long-term debt.
FORWARD LOOKING STATEMENTS: Certain information contained herein and in the accompanying report to shareholders may contain forward looking statements within the meaning of applicable securities laws. The use of any of the words “position”, “continue”, “opportunity”, “expect”, “plan”, “maintain”, “estimate”, “assume”, “target”, “believe” “forecast”, “intend”, “strategy”, “will”, “elect”, “anticipate”, “enhance” and similar expressions are intended to identify forward-looking statements. More particularly and without limitation, this document contains forward-looking statements concerning management's assessment of future plans, Bellatrix's intent to maintain focused on maintaining financial strength and liquidity and on profitable resource development in 2017, details of Bellatrix's intention to deliver 10% to 15% annual growth in production volumes in 2017, the belief that Bellatrix has built a strong and sustainable business that provide the foundation for long term profitable growth, the expectation that 2017 capital is expected to be directed towards drilling, completion and tie-in activity, primarily in the Spirit River formation and investment in strategic infrastructure projects, including the Phase 2 expansion project of the Alder Flats Plant, expected future abandonment and reclamations costs, expectation of percentage of production hedged in 2017 and 2018, the expectation that Bellatrix's hedging program will provide reduced commodity price volatility and greater assurance over future revenue and cash flows, the expectations for timing for drilling, completing and bringing on-stream of certain wells, the expectation to spend approximately half of the full year's 2017 net capital expenditure budget of $105 million within the first six months of the year, full year average production expenditure guidance, the expected capacity of Phase 2 of the Alder Flats Plant, the expectation that construction of Phase 2 of the Alder Flats Plant will be completed on time and on budget in the second quarter of 2018, expectation of timing of specific tasks required for construction and completion of Phase 2 of the Alder Flats Plant, expected net capital expenditures in 2017 and 2018 required to complete Phase 2 of the Alder Flats Plant, the expectation that completion of Phase 2 of the Alder Flats Plant may deliver a reduction in operating costs, Bellatrix's plans to expand its drilling efforts across our core west central Alberta acreage including expanded development of the Spirit River formation in the Willesden Green area, details of Bellatrix's current 2017 capital expenditure budget and the goals of such budget, guidance relating to 2017 average daily production and exit production (including the product mix), Bellatrix's intent to focus on key business objectives of maintaining financial strength and liquidity and optimizing capital investments in the current commodity price environment, Bellatrix's expectation to be able to fund its 2017 capital program by reinvesting cash flow, the intent to meet future anticipated obligations incurred from normal ongoing operations with funds flow from operations and borrowings under its Credit Facilities, future commitments and the timing thereof, sensitivities of funds flow from operations changes in commodity prices, interest rates and exchange rates, and the expectation that Bellatrix's business provide the long term competitive advantages required to thrive in the current commodity price environment and deliver profitable growth in production, cash flow, and net asset value, may constitute forward-looking statements under applicable securities laws.
MANAGEMENT’S DISCUSSION AND ANALYSIS
11 BELLATRIX EXPLORATION LTD.
q1FIRST QUARTER 2017 REPORT
To the extent that any forward-looking information contained herein constitute a financial outlook, they were approved by management on May 9, 2017 and are included herein to provide readers with an understanding of the anticipated funds available to Bellatrix to fund its operations and readers are cautioned that the information may not be appropriate for other purposes. Forward-looking statements necessarily involve risks, including, without limitation, risks associated with oil and gas exploration, development, exploitation, production, marketing and transportation, loss of markets, volatility of commodity prices, currency fluctuations, imprecision of reserve estimates, environmental risks, competition from other producers, inability to retain drilling rigs and other services, incorrect assessment of the value of acquisitions, failure to realize the anticipated benefits of acquisitions, delays resulting from or inability to obtain required regulatory approvals, actions taken by the Company's lenders that reduce the Company's available credit and ability to access sufficient capital from internal and external sources. Events or circumstances may cause actual results to differ materially from those predicted, as a result of the risk factors set out and other known and unknown risks, uncertainties, and other factors, many of which are beyond the control of Bellatrix. In addition, forward looking statements or information are based on a number of factors and assumptions which have been used to develop such statements and information but which may prove to be incorrect and which have been used to develop such statements and information in order to provide shareholders with a more complete perspective on Bellatrix's future operations. Such information may prove to be incorrect and readers are cautioned that the information may not be appropriate for other purposes. Although the Company believes that the expectations reflected in such forward looking statements or information are reasonable, undue reliance should not be placed on forward looking statements because the Company can give no assurance that such expectations will prove to be correct. In addition to other factors and assumptions which may be identified herein, assumptions have been made regarding, among other things: the impact of increasing competition; the general stability of the economic and political environment in which the Company operates; the timely receipt of any required regulatory approvals; the ability of the Company to obtain qualified staff, equipment and services in a timely and cost efficient manner; drilling results; the ability of the operator of the projects which the Company has an interest in to operate the field in a safe, efficient and effective manner; the ability of the Company to obtain financing on acceptable terms; field production rates and decline rates; the ability to replace and expand oil and natural gas reserves through acquisition, development of exploration; the timing and costs of pipeline, storage and facility construction and expansion and the ability of the Company to secure adequate product transportation; future commodity prices; currency, exchange and interest rates; the regulatory framework regarding royalties, taxes and environmental matters in the jurisdictions in which the Company operates; and the ability of the Company to successfully market its oil and natural gas products. Readers are cautioned that the foregoing list is not exhaustive of all factors and assumptions which have been used. As a consequence, actual results may differ materially from those anticipated in the forward-looking statements. Additional information on these and other factors that could affect Bellatrix's operations and financial results are included in reports on file with Canadian and United States securities regulatory authorities and may be accessed through the SEDAR website (www.sedar.com), through the SEC website (www.sec.gov), and at Bellatrix's website (www.bellatrixexploration.com). Furthermore, the forward looking statements contained herein are made as at the date hereof and Bellatrix does not undertake any obligation to update publicly or to revise any of the included forward looking statements, whether as a result of new information, future events or otherwise, except as may be required by applicable securities laws.
The reader is further cautioned that the preparation of financial statements in accordance with GAAP requires management to make certain judgments and estimates that affect the reported amounts of assets, liabilities, revenues and expenses. Estimating reserves is also critical to several accounting estimates and requires judgments and decisions based upon available geological, geophysical, engineering and economic data. These estimates may change, having either a negative or positive effect on net earnings as further information becomes available, and as the economic environment changes.
MANAGEMENT’S DISCUSSION AND ANALYSIS
12BELLATRIX EXPLORATION LTD.
q1FIRST QUARTER 2017 REPORT
MANAGEMENT’S DISCUSSION AND ANALYSIS
13 BELLATRIX EXPLORATION LTD.
OVERVIEW AND DESCRIPTION OF THE BUSINESS
Bellatrix Exploration Ltd. (“Bellatrix” or the “Company”) is a publicly traded Western Canadian based growth oriented oil and gas company engaged in the exploration for, and the acquisition, development and production of oil and natural gas reserves in the provinces of Alberta, British Columbia and Saskatchewan.
Common shares of Bellatrix trade on the Toronto Stock Exchange (“TSX”) and on the New York Stock Exchange (“NYSE”) under the symbol “BXE”.
2017 FIRST QUARTER FINANCIAL AND OPERATIONAL RESULTS
SALES VOLUMES
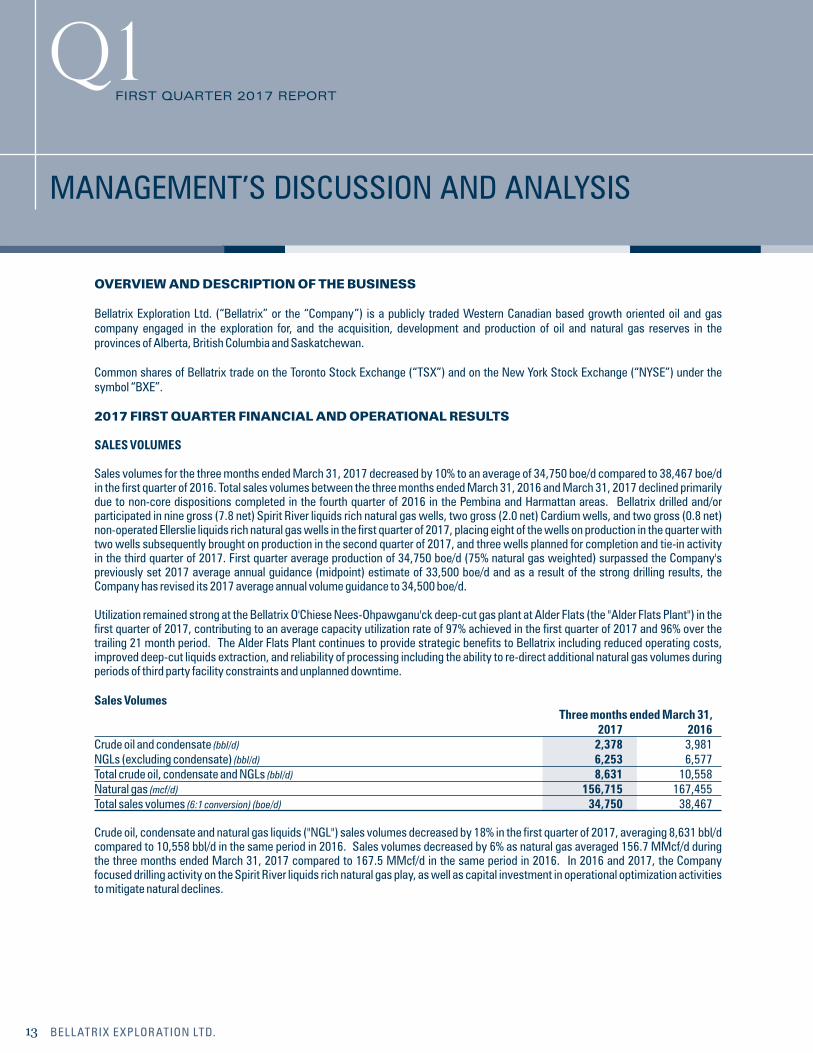
Sales volumes for the three months ended March 31, 2017 decreased by 10% to an average of 34,750 boe/d compared to 38,467 boe/d in the first quarter of 2016. Total sales volumes between the three months ended March 31, 2016 and March 31, 2017 declined primarily due to non-core dispositions completed in the fourth quarter of 2016 in the Pembina and Harmattan areas. Bellatrix drilled and/or participated in nine gross (7.8 net) Spirit River liquids rich natural gas wells, two gross (2.0 net) Cardium wells, and two gross (0.8 net) non-operated Ellerslie liquids rich natural gas wells in the first quarter of 2017, placing eight of the wells on production in the quarter with two wells subsequently brought on production in the second quarter of 2017, and three wells planned for completion and tie-in activity in the third quarter of 2017. First quarter average production of 34,750 boe/d (75% natural gas weighted) surpassed the Company's previously set 2017 average annual guidance (midpoint) estimate of 33,500 boe/d and as a result of the strong drilling results, the Company has revised its 2017 average annual volume guidance to 34,500 boe/d.
Utilization remained strong at the Bellatrix O'Chiese Nees-Ohpawganu'ck deep-cut gas plant at Alder Flats (the "Alder Flats Plant") in the first quarter of 2017, contributing to an average capacity utilization rate of 97% achieved in the first quarter of 2017 and 96% over the trailing 21 month period. The Alder Flats Plant continues to provide strategic benefits to Bellatrix including reduced operating costs, improved deep-cut liquids extraction, and reliability of processing including the ability to re-direct additional natural gas volumes during periods of third party facility constraints and unplanned downtime.
Sales Volumes Three months ended March 31, 2017 2016Crude oil and condensate (bbl/d) 2,378 3,981NGLs (excluding condensate) (bbl/d) 6,253 6,577Total crude oil, condensate and NGLs (bbl/d) 8,631 10,558Natural gas (mcf/d) 156,715 167,455Total sales volumes (6:1 conversion) (boe/d) 34,750 38,467 Crude oil, condensate and natural gas liquids ("NGL") sales volumes decreased by 18% in the first quarter of 2017, averaging 8,631 bbl/d compared to 10,558 bbl/d in the same period in 2016. Sales volumes decreased by 6% as natural gas averaged 156.7 MMcf/d during the three months ended March 31, 2017 compared to 167.5 MMcf/d in the same period in 2016. In 2016 and 2017, the Company focused drilling activity on the Spirit River liquids rich natural gas play, as well as capital investment in operational optimization activities to mitigate natural declines.
q1FIRST QUARTER 2017 REPORT
MANAGEMENT’S DISCUSSION AND ANALYSIS
14BELLATRIX EXPLORATION LTD.
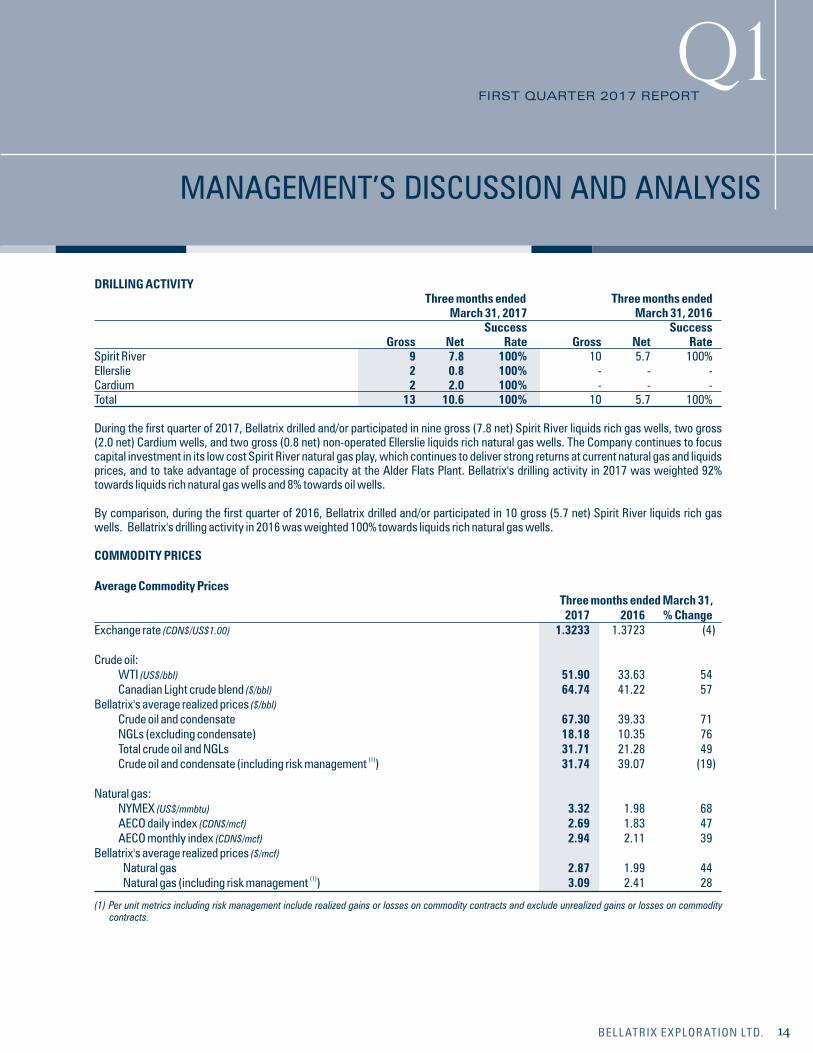
DRILLING ACTIVITY Three months ended Three months ended March 31, 2017 March 31, 2016 Success Success Gross Net Rate Gross Net RateSpirit River 9 7.8 100% 10 5.7 100%Ellerslie 2 0.8 100% - - -Cardium 2 2.0 100% - - -Total 13 10.6 100% 10 5.7 100%
During the first quarter of 2017, Bellatrix drilled and/or participated in nine gross (7.8 net) Spirit River liquids rich gas wells, two gross (2.0 net) Cardium wells, and two gross (0.8 net) non-operated Ellerslie liquids rich natural gas wells. The Company continues to focus capital investment in its low cost Spirit River natural gas play, which continues to deliver strong returns at current natural gas and liquids prices, and to take advantage of processing capacity at the Alder Flats Plant. Bellatrix's drilling activity in 2017 was weighted 92% towards liquids rich natural gas wells and 8% towards oil wells.
By comparison, during the first quarter of 2016, Bellatrix drilled and/or participated in 10 gross (5.7 net) Spirit River liquids rich gas wells. Bellatrix's drilling activity in 2016 was weighted 100% towards liquids rich natural gas wells.
COMMODITY PRICES
Average Commodity Prices Three months ended March 31, 2017 2016 % ChangeExchange rate (CDN$/US$1.00) 1.3233 1.3723 (4) Crude oil: WTI (US$/bbl) 51.90 33.63 54 Canadian Light crude blend ($/bbl) 64.74 41.22 57Bellatrix's average realized prices ($/bbl) Crude oil and condensate 67.30 39.33 71 NGLs (excluding condensate) 18.18 10.35 76 Total crude oil and NGLs 31.71 21.28 49
(1) Crude oil and condensate (including risk management ) 31.74 39.07 (19) Natural gas: NYMEX (US$/mmbtu) 3.32 1.98 68 AECO daily index (CDN$/mcf) 2.69 1.83 47 AECO monthly index (CDN$/mcf) 2.94 2.11 39Bellatrix's average realized prices ($/mcf) Natural gas 2.87 1.99 44
(1) Natural gas (including risk management ) 3.09 2.41 28
(1) Per unit metrics including risk management include realized gains or losses on commodity contracts and exclude unrealized gains or losses on commodity contracts.
q1FIRST QUARTER 2017 REPORT
The average CDN$/US$1.00 foreign exchange rate was 1.3233 for the quarter ended March 31, 2017, compared to an average rate of 1.3723 in the same period of 2016. The average foreign exchange rate remained relatively unchanged in the comparative first quarter 2017 and 2016 periods, as the relative strength of the United States economy and increased Unites States interest rates has helped to further strengthen the United States dollar as compared to the Canadian dollar, offset by higher crude prices early in first quarter 2017 which tends to add strength to the Canadian dollar.
Global crude oil prices fluctuated during the first quarter 2017 as the Organization of the Petroleum Exporting Countries (“OPEC”) members worked to achieve production cuts and add stability to crude oil prices. Despite the collaborative efforts between OPEC and non-OPEC producing countries in stabilizing prices, WTI oil prices exhibited volatility, opening the year at US$53.72/bbl, reaching a low of US$47.00/bbl during the first quarter of 2017, before recovering to US$50.60/bbl at March 31, 2017. Robust global crude inventories and weekly increases in the United States oil directed drilling rig count are factors that tempered oil prices strengthening during the first quarter of 2017.
North American natural gas prices declined during February of 2017 as warmer than normal weather kept heating demand at lower than expected levels. United States natural gas storage inventories at March 31, 2017 were 427 Bcf below last year's record high level, while declining United States production levels have added support to natural gas prices, rebounding from US$2.44/MMBtu in late February to close the first quarter at US$3.10/MMBtu. Total United States natural gas production continues to decline despite increased drilling activity. The combination of lower production, higher exports of liquefied natural gas and increased gas supplies to Mexico improved supply/demand dynamics in the market. Overall, industry activity levels are causing a slower supply response given backwardation in the forward pricing market.
In the first quarter of 2017 Bellatrix realized an average price of $67.30/bbl before commodity price risk management contracts for crude oil and condensate, an increase of 71% from the average price of $39.33/bbl received in the first quarter of 2016. By comparison, Canadian Light crude blend price increased by 57% and the average WTI crude oil benchmark price increased by 54% between the first quarters of 2017 and 2016. The WTI/Canadian Light sweet differential has remained in a historically tight range, averaging -US$3.54/bbl for the quarter.
Bellatrix's average realized price for NGLs (excluding condensate) increased by 76% to $18.18/bbl during the first quarter of 2017, compared to $10.35/bbl received in the comparable 2016 period. NGL pricing in Western Canada improved significantly through the fourth quarter of 2016 given stronger underlying light oil prices and improved individual market conditions for propane and butane products. Normal winter demand through the first quarter of 2017 kept North American propane demand firm, while exports materially reduced robust storage levels resulting in much stronger propane prices through the quarter. Butane prices closely track the trend in WTI pricing and thus exhibited similar volatility to oil prices during the first quarter of 2017. Butane prices improved in the first quarter of 2017 compared to the first quarter of 2016 and Bellatrix's average realized NGL price reflected the improvement in butane prices by 75% year over year.
Natural gas prices increased during the first quarter of 2017 given strong demand and lower United States production resulting in reduced storage levels. Bellatrix's natural gas sales are priced with reference to the daily or monthly AECO indices. Bellatrix's natural gas sold has a higher heat content than the industry average, which results in slightly higher realized prices per mcf than the AECO daily index. During the first quarter of 2017, the AECO daily reference price increased by 47% and the AECO monthly reference price increased by approximately 39% compared to the first quarter of 2016. Bellatrix's natural gas average sales price before commodity price risk management contracts for the first quarter of 2017 increased by 44% to $2.87/mcf compared to $1.99/mcf in the same period in 2016. Bellatrix's natural gas average price after including commodity price risk management contracts for the three months ended March 31, 2017 averaged $3.09/mcf compared to $2.41/mcf in the comparative 2016 period.
MANAGEMENT’S DISCUSSION AND ANALYSIS
15 BELLATRIX EXPLORATION LTD.
q1FIRST QUARTER 2017 REPORT
Bellatrix was active in the first quarter of 2017 increasing its 2017 risk management protection, with approximately 64% of forecast 2017 gross natural gas volumes hedged at an average fixed price of approximately $3.36/mcf (based on the mid-point of the updated 2017 average gross production guidance of 34,500 boe/d; 76% natural gas weighted). In addition, Bellatrix added to its 2018 risk management protection with a total of 65.6 MMcf/d of 2018 natural gas volumes hedged at an average fixed price of approximately $3.08/mcf; this represents approximately 42% of volumes compared to the mid-point of 2017 full year average guidance. Finally, stronger propane prices in 2017 provided an attractive opportunity for Bellatrix to hedge 1,500 bbl/d of propane volumes at an average price of 51% of WTI light oil prices, from February through December of 2017, and 1,000 bbl/d of propane volumes at an average price of 47% of WTI light oil prices in 2018, both meaningfully above long term historical averages.
REVENUE
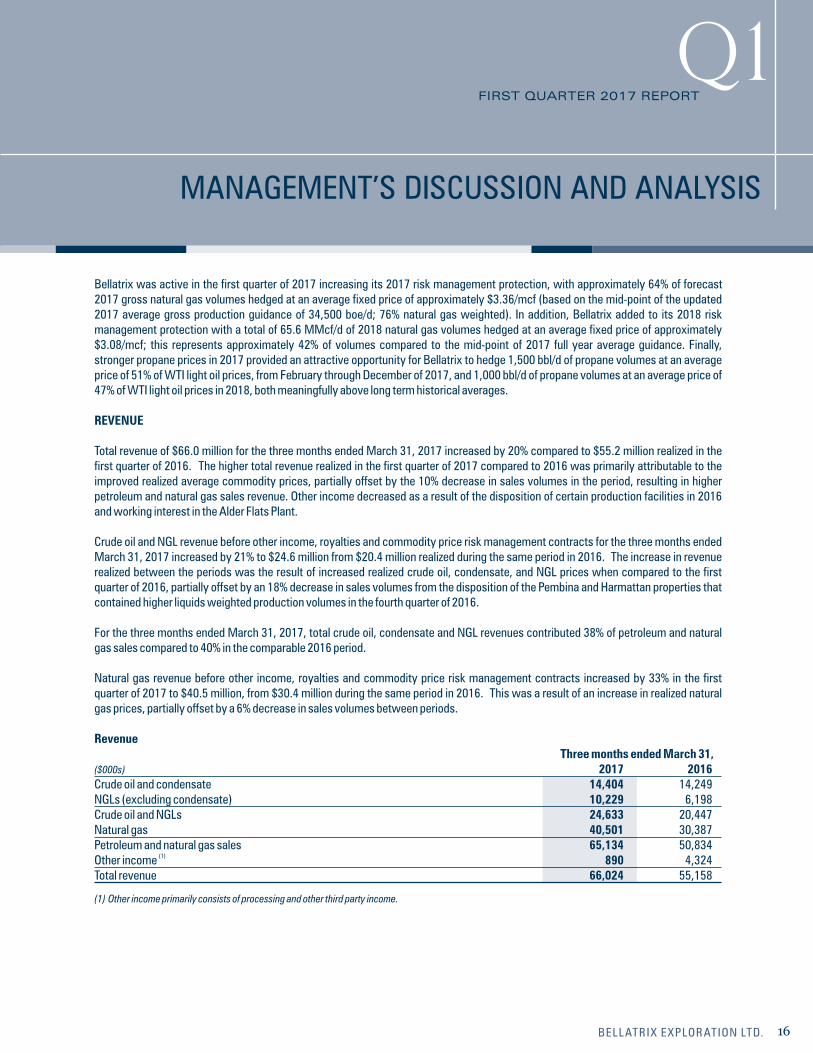
Total revenue of $66.0 million for the three months ended March 31, 2017 increased by 20% compared to $55.2 million realized in the first quarter of 2016. The higher total revenue realized in the first quarter of 2017 compared to 2016 was primarily attributable to the improved realized average commodity prices, partially offset by the 10% decrease in sales volumes in the period, resulting in higher petroleum and natural gas sales revenue. Other income decreased as a result of the disposition of certain production facilities in 2016 and working interest in the Alder Flats Plant.
Crude oil and NGL revenue before other income, royalties and commodity price risk management contracts for the three months ended March 31, 2017 increased by 21% to $24.6 million from $20.4 million realized during the same period in 2016. The increase in revenue realized between the periods was the result of increased realized crude oil, condensate, and NGL prices when compared to the first quarter of 2016, partially offset by an 18% decrease in sales volumes from the disposition of the Pembina and Harmattan properties that contained higher liquids weighted production volumes in the fourth quarter of 2016.
For the three months ended March 31, 2017, total crude oil, condensate and NGL revenues contributed 38% of petroleum and natural gas sales compared to 40% in the comparable 2016 period.
Natural gas revenue before other income, royalties and commodity price risk management contracts increased by 33% in the first quarter of 2017 to $40.5 million, from $30.4 million during the same period in 2016. This was a result of an increase in realized natural gas prices, partially offset by a 6% decrease in sales volumes between periods.
Revenue Three months ended March 31,($000s) 2017 2016Crude oil and condensate 14,404 14,249NGLs (excluding condensate) 10,229 6,198Crude oil and NGLs 24,633 20,447Natural gas 40,501 30,387Petroleum and natural gas sales 65,134 50,834
(1)Other income 890 4,324Total revenue 66,024 55,158
(1) Other income primarily consists of processing and other third party income.
MANAGEMENT’S DISCUSSION AND ANALYSIS
16BELLATRIX EXPLORATION LTD.
q1FIRST QUARTER 2017 REPORT
COMMODITY PRICE RISK MANAGEMENT
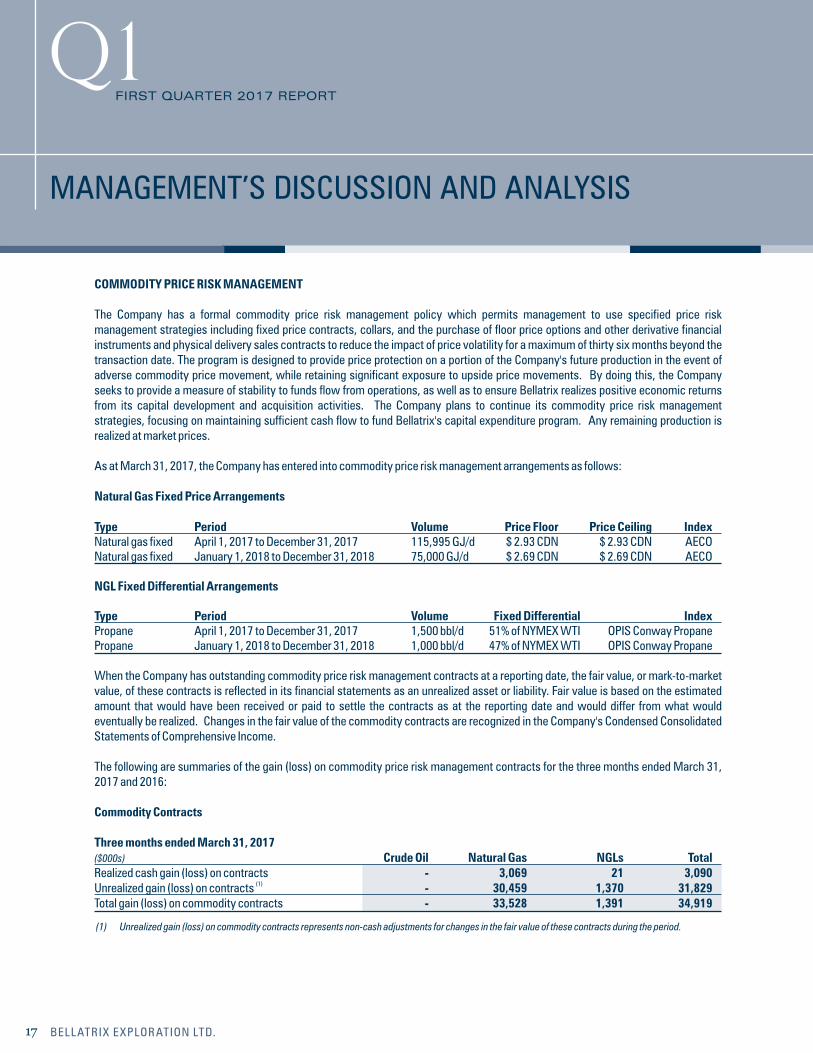
The Company has a formal commodity price risk management policy which permits management to use specified price risk management strategies including fixed price contracts, collars, and the purchase of floor price options and other derivative financial instruments and physical delivery sales contracts to reduce the impact of price volatility for a maximum of thirty six months beyond the transaction date. The program is designed to provide price protection on a portion of the Company's future production in the event of adverse commodity price movement, while retaining significant exposure to upside price movements. By doing this, the Company seeks to provide a measure of stability to funds flow from operations, as well as to ensure Bellatrix realizes positive economic returns from its capital development and acquisition activities. The Company plans to continue its commodity price risk management strategies, focusing on maintaining sufficient cash flow to fund Bellatrix's capital expenditure program. Any remaining production is realized at market prices.
As at March 31, 2017, the Company has entered into commodity price risk management arrangements as follows:
Natural Gas Fixed Price Arrangements
Type Period Volume Price Floor Price Ceiling IndexNatural gas fixed April 1, 2017 to December 31, 2017 115,995 GJ/d $ 2.93 CDN $ 2.93 CDN AECONatural gas fixed January 1, 2018 to December 31, 2018 75,000 GJ/d $ 2.69 CDN $ 2.69 CDN AECO
NGL Fixed Differential Arrangements
Type Period Volume Fixed Differential IndexPropane April 1, 2017 to December 31, 2017 1,500 bbl/d 51% of NYMEX WTI OPIS Conway PropanePropane January 1, 2018 to December 31, 2018 1,000 bbl/d 47% of NYMEX WTI OPIS Conway Propane
When the Company has outstanding commodity price risk management contracts at a reporting date, the fair value, or mark-to-market value, of these contracts is reflected in its financial statements as an unrealized asset or liability. Fair value is based on the estimated amount that would have been received or paid to settle the contracts as at the reporting date and would differ from what would eventually be realized. Changes in the fair value of the commodity contracts are recognized in the Company's Condensed Consolidated Statements of Comprehensive Income.
The following are summaries of the gain (loss) on commodity price risk management contracts for the three months ended March 31, 2017 and 2016:
Commodity Contracts
Three months ended March 31, 2017($000s) Crude Oil Natural Gas NGLs TotalRealized cash gain (loss) on contracts - 3,069 21 3,090
(1)Unrealized gain (loss) on contracts - 30,459 1,370 31,829Total gain (loss) on commodity contracts - 33,528 1,391 34,919
(1) Unrealized gain (loss) on commodity contracts represents non-cash adjustments for changes in the fair value of these contracts during the period.
MANAGEMENT’S DISCUSSION AND ANALYSIS
17 BELLATRIX EXPLORATION LTD.
q1FIRST QUARTER 2017 REPORT
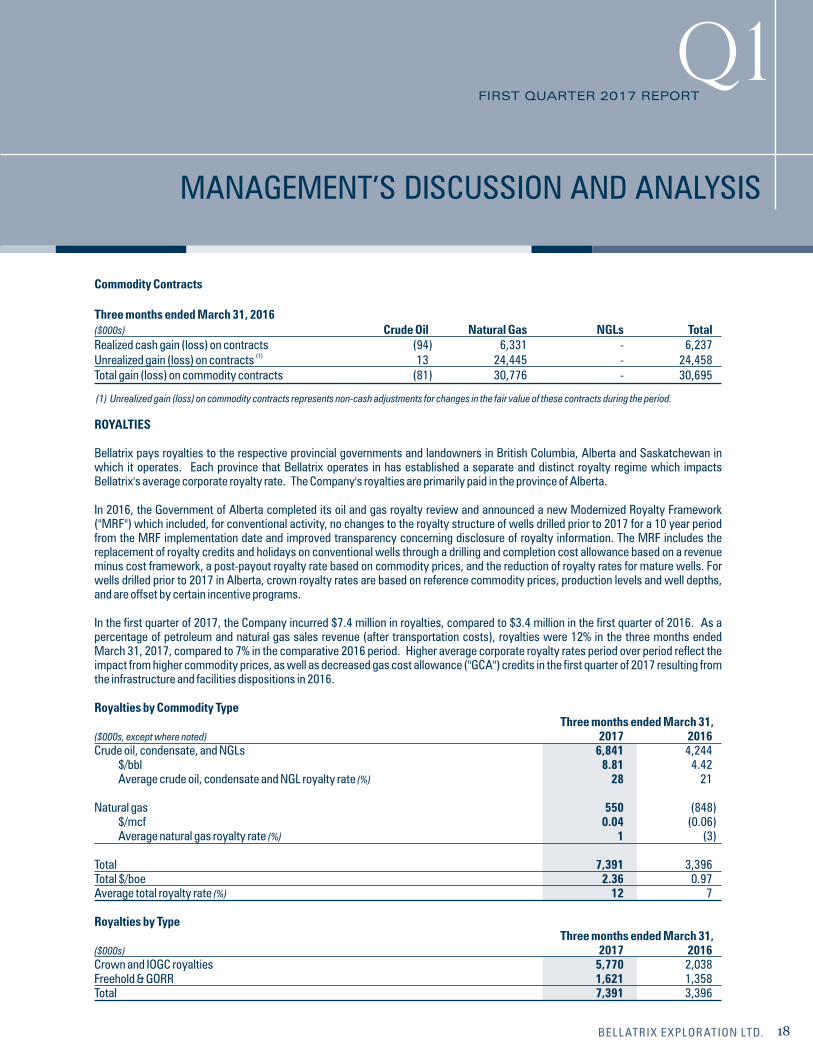
Commodity Contracts
Three months ended March 31, 2016($000s) Crude Oil Natural Gas NGLs TotalRealized cash gain (loss) on contracts (94) 6,331 - 6,237
(1)Unrealized gain (loss) on contracts 13 24,445 - 24,458Total gain (loss) on commodity contracts (81) 30,776 - 30,695
(1) Unrealized gain (loss) on commodity contracts represents non-cash adjustments for changes in the fair value of these contracts during the period.
ROYALTIES
Bellatrix pays royalties to the respective provincial governments and landowners in British Columbia, Alberta and Saskatchewan in which it operates. Each province that Bellatrix operates in has established a separate and distinct royalty regime which impacts Bellatrix's average corporate royalty rate. The Company's royalties are primarily paid in the province of Alberta.
In 2016, the Government of Alberta completed its oil and gas royalty review and announced a new Modernized Royalty Framework ("MRF") which included, for conventional activity, no changes to the royalty structure of wells drilled prior to 2017 for a 10 year period from the MRF implementation date and improved transparency concerning disclosure of royalty information. The MRF includes the replacement of royalty credits and holidays on conventional wells through a drilling and completion cost allowance based on a revenue minus cost framework, a post-payout royalty rate based on commodity prices, and the reduction of royalty rates for mature wells. For wells drilled prior to 2017 in Alberta, crown royalty rates are based on reference commodity prices, production levels and well depths, and are offset by certain incentive programs.
In the first quarter of 2017, the Company incurred $7.4 million in royalties, compared to $3.4 million in the first quarter of 2016. As a percentage of petroleum and natural gas sales revenue (after transportation costs), royalties were 12% in the three months ended March 31, 2017, compared to 7% in the comparative 2016 period. Higher average corporate royalty rates period over period reflect the impact from higher commodity prices, as well as decreased gas cost allowance ("GCA") credits in the first quarter of 2017 resulting from the infrastructure and facilities dispositions in 2016.
Royalties by Commodity Type Three months ended March 31,($000s, except where noted) 2017 2016Crude oil, condensate, and NGLs 6,841 4,244 $/bbl 8.81 4.42 Average crude oil, condensate and NGL royalty rate (%) 28 21 Natural gas 550 (848) $/mcf 0.04 (0.06) Average natural gas royalty rate (%) 1 (3) Total 7,391 3,396Total $/boe 2.36 0.97Average total royalty rate (%) 12 7
Royalties by Type Three months ended March 31,($000s) 2017 2016Crown and IOGC royalties 5,770 2,038Freehold & GORR 1,621 1,358Total 7,391 3,396
MANAGEMENT’S DISCUSSION AND ANALYSIS
18BELLATRIX EXPLORATION LTD.
q1FIRST QUARTER 2017 REPORT
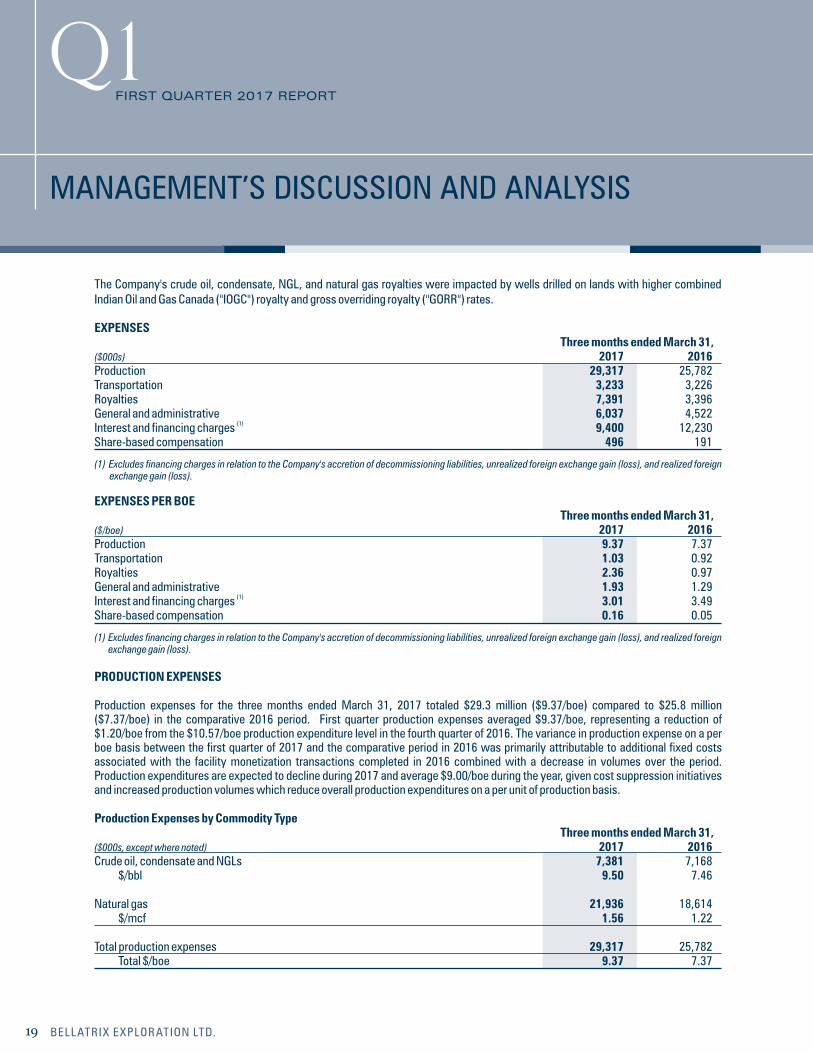
The Company's crude oil, condensate, NGL, and natural gas royalties were impacted by wells drilled on lands with higher combined Indian Oil and Gas Canada ("IOGC") royalty and gross overriding royalty ("GORR") rates.
EXPENSES Three months ended March 31,($000s) 2017 2016Production 29,317 25,782Transportation 3,233 3,226Royalties 7,391 3,396General and administrative 6,037 4,522
(1)Interest and financing charges 9,400 12,230Share-based compensation 496 191
(1) Excludes financing charges in relation to the Company's accretion of decommissioning liabilities, unrealized foreign exchange gain (loss), and realized foreign exchange gain (loss).
EXPENSES PER BOE Three months ended March 31,($/boe) 2017 2016Production 9.37 7.37Transportation 1.03 0.92Royalties 2.36 0.97General and administrative 1.93 1.29
(1)Interest and financing charges 3.01 3.49Share-based compensation 0.16 0.05
(1) Excludes financing charges in relation to the Company's accretion of decommissioning liabilities, unrealized foreign exchange gain (loss), and realized foreign exchange gain (loss).
PRODUCTION EXPENSES
Production expenses for the three months ended March 31, 2017 totaled $29.3 million ($9.37/boe) compared to $25.8 million ($7.37/boe) in the comparative 2016 period. First quarter production expenses averaged $9.37/boe, representing a reduction of $1.20/boe from the $10.57/boe production expenditure level in the fourth quarter of 2016. The variance in production expense on a per boe basis between the first quarter of 2017 and the comparative period in 2016 was primarily attributable to additional fixed costs associated with the facility monetization transactions completed in 2016 combined with a decrease in volumes over the period. Production expenditures are expected to decline during 2017 and average $9.00/boe during the year, given cost suppression initiatives and increased production volumes which reduce overall production expenditures on a per unit of production basis.
Production Expenses by Commodity Type Three months ended March 31,($000s, except where noted) 2017 2016Crude oil, condensate and NGLs 7,381 7,168 $/bbl 9.50 7.46 Natural gas 21,936 18,614 $/mcf 1.56 1.22 Total production expenses 29,317 25,782 Total $/boe 9.37 7.37
MANAGEMENT’S DISCUSSION AND ANALYSIS
19 BELLATRIX EXPLORATION LTD.
q1FIRST QUARTER 2017 REPORT
TRANSPORTATION
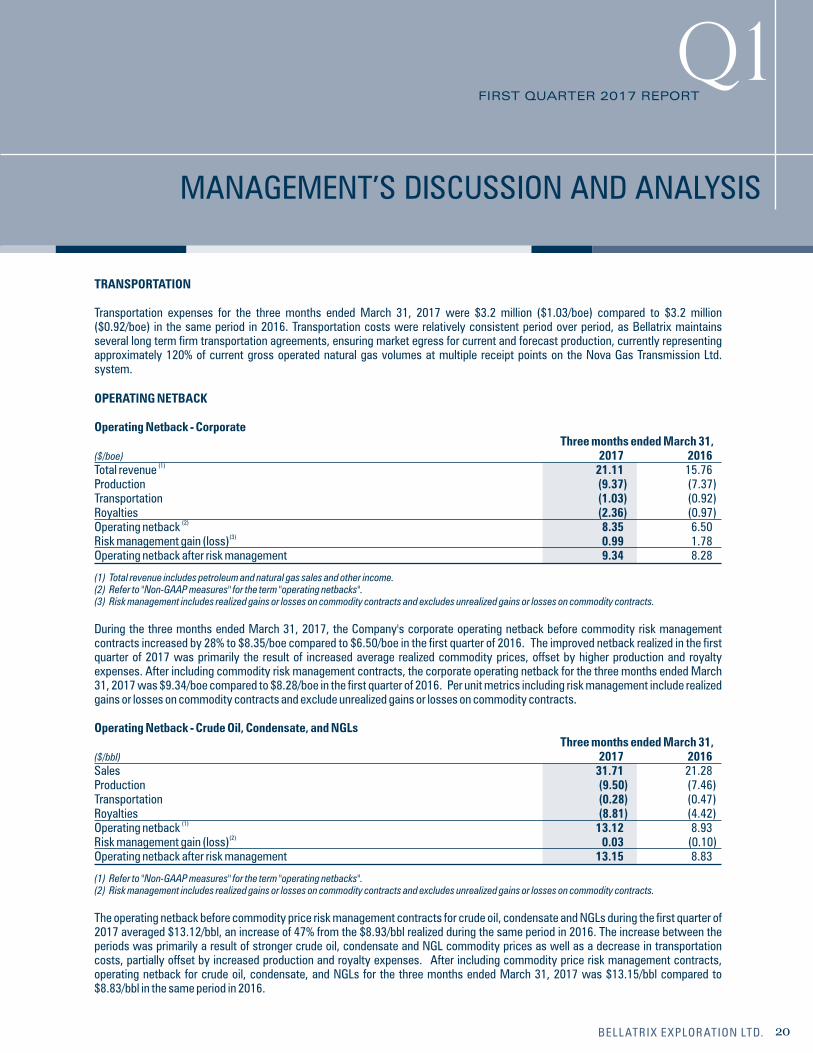
Transportation expenses for the three months ended March 31, 2017 were $3.2 million ($1.03/boe) compared to $3.2 million ($0.92/boe) in the same period in 2016. Transportation costs were relatively consistent period over period, as Bellatrix maintains several long term firm transportation agreements, ensuring market egress for current and forecast production, currently representing approximately 120% of current gross operated natural gas volumes at multiple receipt points on the Nova Gas Transmission Ltd. system.
OPERATING NETBACK
Operating Netback - Corporate Three months ended March 31,($/boe) 2017 2016
(1)Total revenue 21.11 15.76Production (9.37) (7.37)Transportation (1.03) (0.92)Royalties (2.36) (0.97)
(2)Operating netback 8.35 6.50 (3)Risk management gain (loss) 0.99 1.78
Operating netback after risk management 9.34 8.28
(1) Total revenue includes petroleum and natural gas sales and other income.(2) Refer to "Non-GAAP measures" for the term "operating netbacks".(3) Risk management includes realized gains or losses on commodity contracts and excludes unrealized gains or losses on commodity contracts.
During the three months ended March 31, 2017, the Company's corporate operating netback before commodity risk management contracts increased by 28% to $8.35/boe compared to $6.50/boe in the first quarter of 2016. The improved netback realized in the first quarter of 2017 was primarily the result of increased average realized commodity prices, offset by higher production and royalty expenses. After including commodity risk management contracts, the corporate operating netback for the three months ended March 31, 2017 was $9.34/boe compared to $8.28/boe in the first quarter of 2016. Per unit metrics including risk management include realized gains or losses on commodity contracts and exclude unrealized gains or losses on commodity contracts.
Operating Netback - Crude Oil, Condensate, and NGLs Three months ended March 31,($/bbl) 2017 2016Sales 31.71 21.28Production (9.50) (7.46)Transportation (0.28) (0.47)Royalties (8.81) (4.42)
(1)Operating netback 13.12 8.93 (2)Risk management gain (loss) 0.03 (0.10)
Operating netback after risk management 13.15 8.83
(1) Refer to "Non-GAAP measures" for the term "operating netbacks".(2) Risk management includes realized gains or losses on commodity contracts and excludes unrealized gains or losses on commodity contracts.
The operating netback before commodity price risk management contracts for crude oil, condensate and NGLs during the first quarter of 2017 averaged $13.12/bbl, an increase of 47% from the $8.93/bbl realized during the same period in 2016. The increase between the periods was primarily a result of stronger crude oil, condensate and NGL commodity prices as well as a decrease in transportation costs, partially offset by increased production and royalty expenses. After including commodity price risk management contracts, operating netback for crude oil, condensate, and NGLs for the three months ended March 31, 2017 was $13.15/bbl compared to $8.83/bbl in the same period in 2016.
MANAGEMENT’S DISCUSSION AND ANALYSIS
20BELLATRIX EXPLORATION LTD.
q1FIRST QUARTER 2017 REPORT
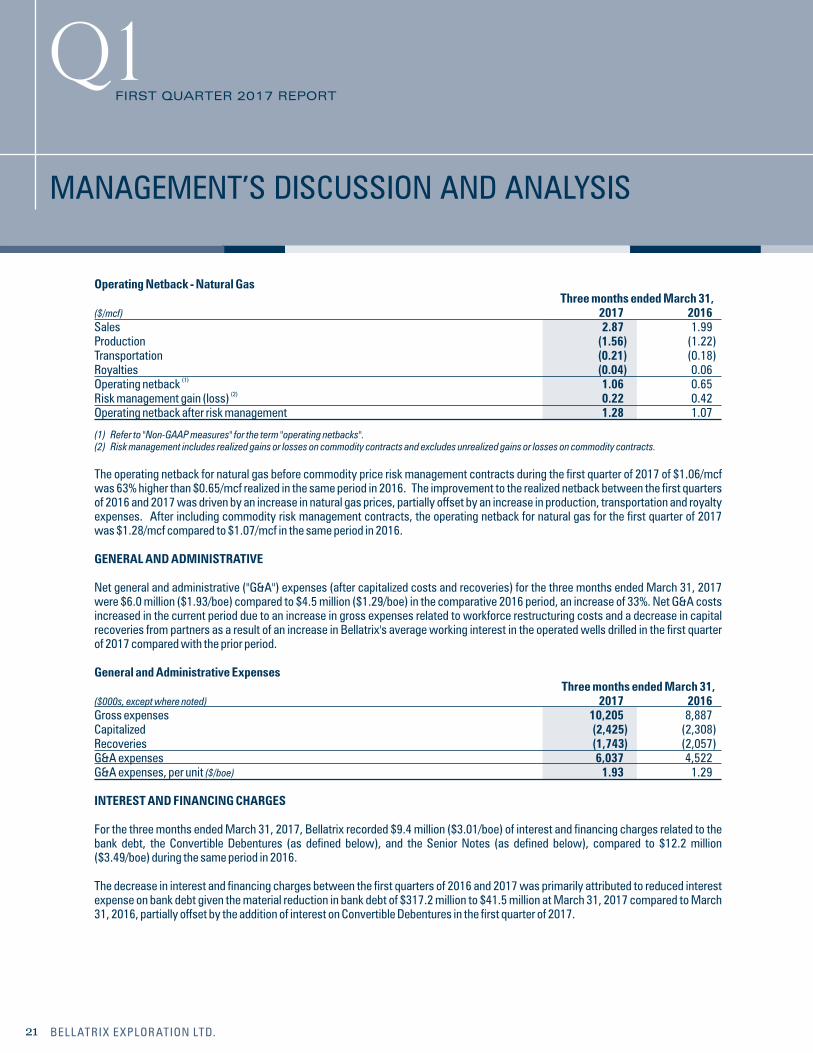
Operating Netback - Natural Gas Three months ended March 31,($/mcf) 2017 2016Sales 2.87 1.99Production (1.56) (1.22)Transportation (0.21) (0.18)Royalties (0.04) 0.06
(1)Operating netback 1.06 0.65(2)Risk management gain (loss) 0.22 0.42
Operating netback after risk management 1.28 1.07
(1) Refer to "Non-GAAP measures" for the term "operating netbacks".(2) Risk management includes realized gains or losses on commodity contracts and excludes unrealized gains or losses on commodity contracts.
The operating netback for natural gas before commodity price risk management contracts during the first quarter of 2017 of $1.06/mcf was 63% higher than $0.65/mcf realized in the same period in 2016. The improvement to the realized netback between the first quarters of 2016 and 2017 was driven by an increase in natural gas prices, partially offset by an increase in production, transportation and royalty expenses. After including commodity risk management contracts, the operating netback for natural gas for the first quarter of 2017 was $1.28/mcf compared to $1.07/mcf in the same period in 2016.
GENERAL AND ADMINISTRATIVE
Net general and administrative ("G&A") expenses (after capitalized costs and recoveries) for the three months ended March 31, 2017 were $6.0 million ($1.93/boe) compared to $4.5 million ($1.29/boe) in the comparative 2016 period, an increase of 33%. Net G&A costs increased in the current period due to an increase in gross expenses related to workforce restructuring costs and a decrease in capital recoveries from partners as a result of an increase in Bellatrix's average working interest in the operated wells drilled in the first quarter of 2017 compared with the prior period.
General and Administrative Expenses Three months ended March 31,($000s, except where noted) 2017 2016Gross expenses 10,205 8,887Capitalized (2,425) (2,308)Recoveries (1,743) (2,057)G&A expenses 6,037 4,522G&A expenses, per unit ($/boe) 1.93 1.29
INTEREST AND FINANCING CHARGES
For the three months ended March 31, 2017, Bellatrix recorded $9.4 million ($3.01/boe) of interest and financing charges related to the bank debt, the Convertible Debentures (as defined below), and the Senior Notes (as defined below), compared to $12.2 million ($3.49/boe) during the same period in 2016.
The decrease in interest and financing charges between the first quarters of 2016 and 2017 was primarily attributed to reduced interest expense on bank debt given the material reduction in bank debt of $317.2 million to $41.5 million at March 31, 2017 compared to March 31, 2016, partially offset by the addition of interest on Convertible Debentures in the first quarter of 2017.
MANAGEMENT’S DISCUSSION AND ANALYSIS
21 BELLATRIX EXPLORATION LTD.
q1FIRST QUARTER 2017 REPORT
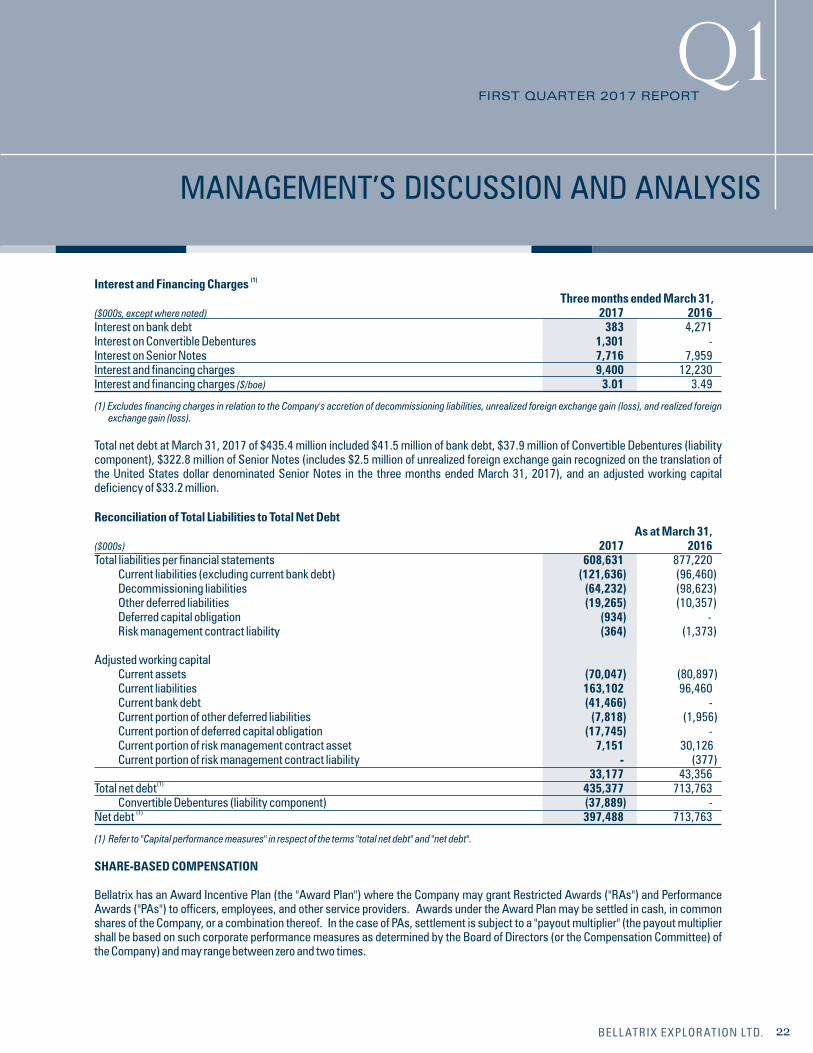
(1) Interest and Financing Charges Three months ended March 31,($000s, except where noted) 2017 2016Interest on bank debt 383 4,271Interest on Convertible Debentures 1,301 -Interest on Senior Notes 7,716 7,959Interest and financing charges 9,400 12,230Interest and financing charges ($/boe) 3.01 3.49
(1) Excludes financing charges in relation to the Company's accretion of decommissioning liabilities, unrealized foreign exchange gain (loss), and realized foreign exchange gain (loss).
Total net debt at March 31, 2017 of $435.4 million included $41.5 million of bank debt, $37.9 million of Convertible Debentures (liability component), $322.8 million of Senior Notes (includes $2.5 million of unrealized foreign exchange gain recognized on the translation of the United States dollar denominated Senior Notes in the three months ended March 31, 2017), and an adjusted working capital deficiency of $33.2 million.
Reconciliation of Total Liabilities to Total Net Debt As at March 31,($000s) 2017 2016Total liabilities per financial statements 608,631 877,220 Current liabilities (excluding current bank debt) (121,636) (96,460) Decommissioning liabilities (64,232) (98,623) Other deferred liabilities (19,265) (10,357) Deferred capital obligation (934) - Risk management contract liability (364) (1,373) Adjusted working capital Current assets (70,047) (80,897) Current liabilities 163,102 96,460 Current bank debt (41,466) - Current portion of other deferred liabilities (7,818) (1,956) Current portion of deferred capital obligation (17,745) - Current portion of risk management contract asset 7,151 30,126 Current portion of risk management contract liability - (377) 33,177 43,356
(1)Total net debt 435,377 713,763 Convertible Debentures (liability component) (37,889) -
(1)Net debt 397,488 713,763
(1) Refer to "Capital performance measures" in respect of the terms "total net debt" and "net debt".
SHARE-BASED COMPENSATION
Bellatrix has an Award Incentive Plan (the "Award Plan") where the Company may grant Restricted Awards ("RAs") and Performance Awards ("PAs") to officers, employees, and other service providers. Awards under the Award Plan may be settled in cash, in common shares of the Company, or a combination thereof. In the case of PAs, settlement is subject to a "payout multiplier" (the payout multiplier shall be based on such corporate performance measures as determined by the Board of Directors (or the Compensation Committee) of the Company) and may range between zero and two times.
MANAGEMENT’S DISCUSSION AND ANALYSIS
22BELLATRIX EXPLORATION LTD.
q1FIRST QUARTER 2017 REPORT
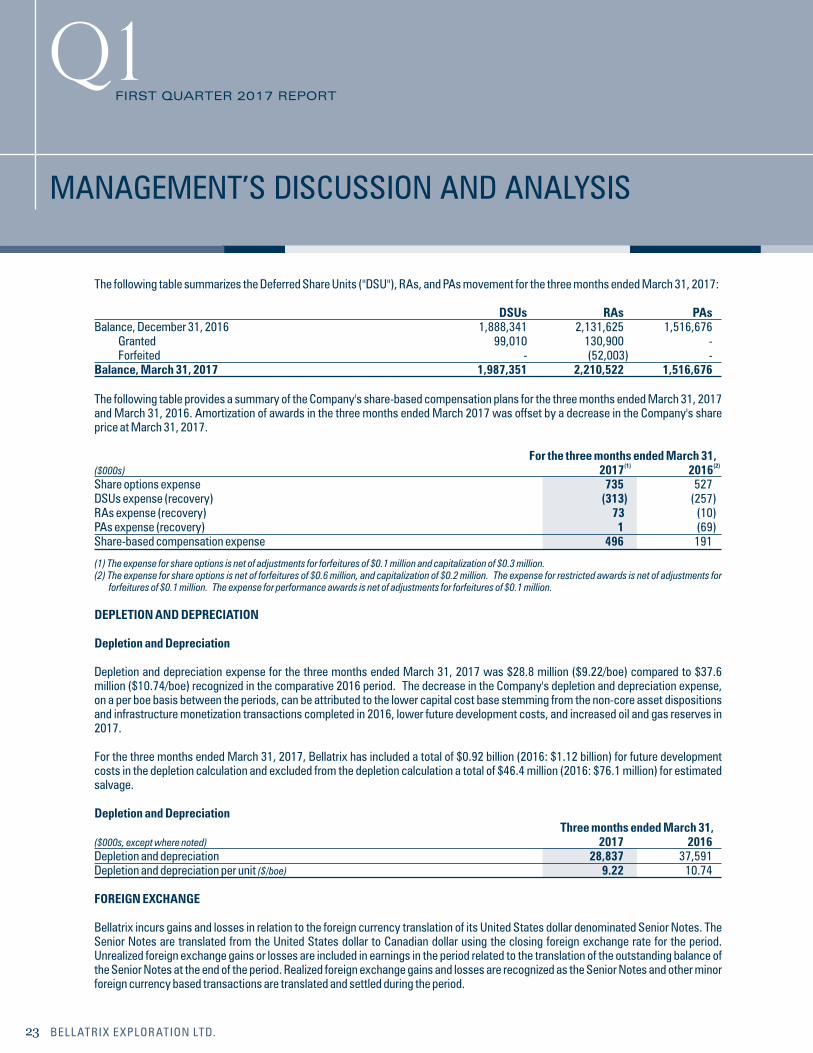
The following table summarizes the Deferred Share Units ("DSU"), RAs, and PAs movement for the three months ended March 31, 2017:
DSUs RAs PAsBalance, December 31, 2016 1,888,341 2,131,625 1,516,676 Granted 99,010 130,900 - Forfeited - (52,003) -Balance, March 31, 2017 1,987,351 2,210,522 1,516,676
The following table provides a summary of the Company's share-based compensation plans for the three months ended March 31, 2017 and March 31, 2016. Amortization of awards in the three months ended March 2017 was offset by a decrease in the Company's share price at March 31, 2017.
For the three months ended March 31,(1) (2)($000s) 2017 2016
Share options expense 735 527DSUs expense (recovery) (313) (257)RAs expense (recovery) 73 (10)PAs expense (recovery) 1 (69)Share-based compensation expense 496 191
(1) The expense for share options is net of adjustments for forfeitures of $0.1 million and capitalization of $0.3 million.(2) The expense for share options is net of forfeitures of $0.6 million, and capitalization of $0.2 million. The expense for restricted awards is net of adjustments for
forfeitures of $0.1 million. The expense for performance awards is net of adjustments for forfeitures of $0.1 million.
DEPLETION AND DEPRECIATION
Depletion and Depreciation
Depletion and depreciation expense for the three months ended March 31, 2017 was $28.8 million ($9.22/boe) compared to $37.6 million ($10.74/boe) recognized in the comparative 2016 period. The decrease in the Company's depletion and depreciation expense, on a per boe basis between the periods, can be attributed to the lower capital cost base stemming from the non-core asset dispositions and infrastructure monetization transactions completed in 2016, lower future development costs, and increased oil and gas reserves in 2017.
For the three months ended March 31, 2017, Bellatrix has included a total of $0.92 billion (2016: $1.12 billion) for future development costs in the depletion calculation and excluded from the depletion calculation a total of $46.4 million (2016: $76.1 million) for estimated salvage.
Depletion and Depreciation Three months ended March 31,($000s, except where noted) 2017 2016Depletion and depreciation 28,837 37,591Depletion and depreciation per unit ($/boe) 9.22 10.74
FOREIGN EXCHANGE
Bellatrix incurs gains and losses in relation to the foreign currency translation of its United States dollar denominated Senior Notes. The Senior Notes are translated from the United States dollar to Canadian dollar using the closing foreign exchange rate for the period. Unrealized foreign exchange gains or losses are included in earnings in the period related to the translation of the outstanding balance of the Senior Notes at the end of the period. Realized foreign exchange gains and losses are recognized as the Senior Notes and other minor foreign currency based transactions are translated and settled during the period.
MANAGEMENT’S DISCUSSION AND ANALYSIS
23 BELLATRIX EXPLORATION LTD.
q1FIRST QUARTER 2017 REPORT
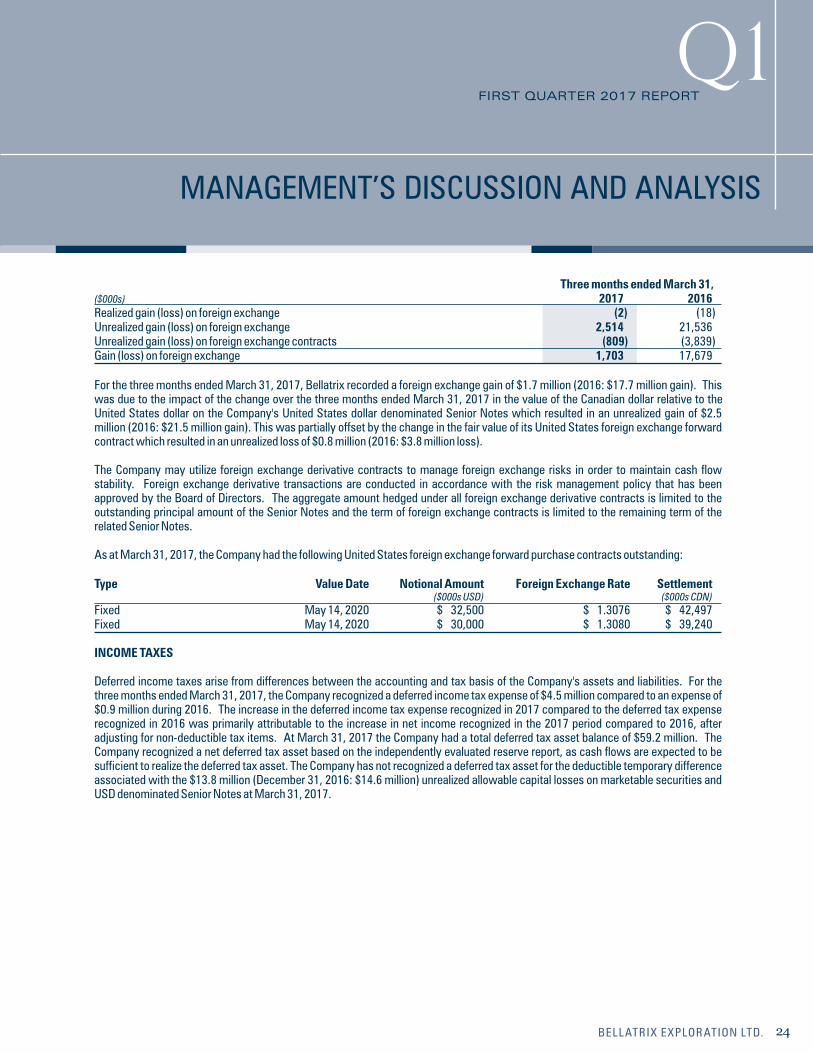
Three months ended March 31,($000s) 2017 2016Realized gain (loss) on foreign exchange (2) (18)Unrealized gain (loss) on foreign exchange 2,514 21,536Unrealized gain (loss) on foreign exchange contracts (809) (3,839)Gain (loss) on foreign exchange 1,703 17,679
For the three months ended March 31, 2017, Bellatrix recorded a foreign exchange gain of $1.7 million (2016: $17.7 million gain). This was due to the impact of the change over the three months ended March 31, 2017 in the value of the Canadian dollar relative to the United States dollar on the Company's United States dollar denominated Senior Notes which resulted in an unrealized gain of $2.5 million (2016: $21.5 million gain). This was partially offset by the change in the fair value of its United States foreign exchange forward contract which resulted in an unrealized loss of $0.8 million (2016: $3.8 million loss).
The Company may utilize foreign exchange derivative contracts to manage foreign exchange risks in order to maintain cash flow stability. Foreign exchange derivative transactions are conducted in accordance with the risk management policy that has been approved by the Board of Directors. The aggregate amount hedged under all foreign exchange derivative contracts is limited to the outstanding principal amount of the Senior Notes and the term of foreign exchange contracts is limited to the remaining term of the related Senior Notes.
As at March 31, 2017, the Company had the following United States foreign exchange forward purchase contracts outstanding:
Type Value Date Notional Amount Foreign Exchange Rate Settlement ($000s USD) ($000s CDN)Fixed May 14, 2020 $ 32,500 $ 1.3076 $ 42,497Fixed May 14, 2020 $ 30,000 $ 1.3080 $ 39,240
INCOME TAXES
Deferred income taxes arise from differences between the accounting and tax basis of the Company's assets and liabilities. For the three months ended March 31, 2017, the Company recognized a deferred income tax expense of $4.5 million compared to an expense of $0.9 million during 2016. The increase in the deferred income tax expense recognized in 2017 compared to the deferred tax expense recognized in 2016 was primarily attributable to the increase in net income recognized in the 2017 period compared to 2016, after adjusting for non-deductible tax items. At March 31, 2017 the Company had a total deferred tax asset balance of $59.2 million. The Company recognized a net deferred tax asset based on the independently evaluated reserve report, as cash flows are expected to be sufficient to realize the deferred tax asset. The Company has not recognized a deferred tax asset for the deductible temporary difference associated with the $13.8 million (December 31, 2016: $14.6 million) unrealized allowable capital losses on marketable securities and USD denominated Senior Notes at March 31, 2017.
MANAGEMENT’S DISCUSSION AND ANALYSIS
24BELLATRIX EXPLORATION LTD.
q1FIRST QUARTER 2017 REPORT
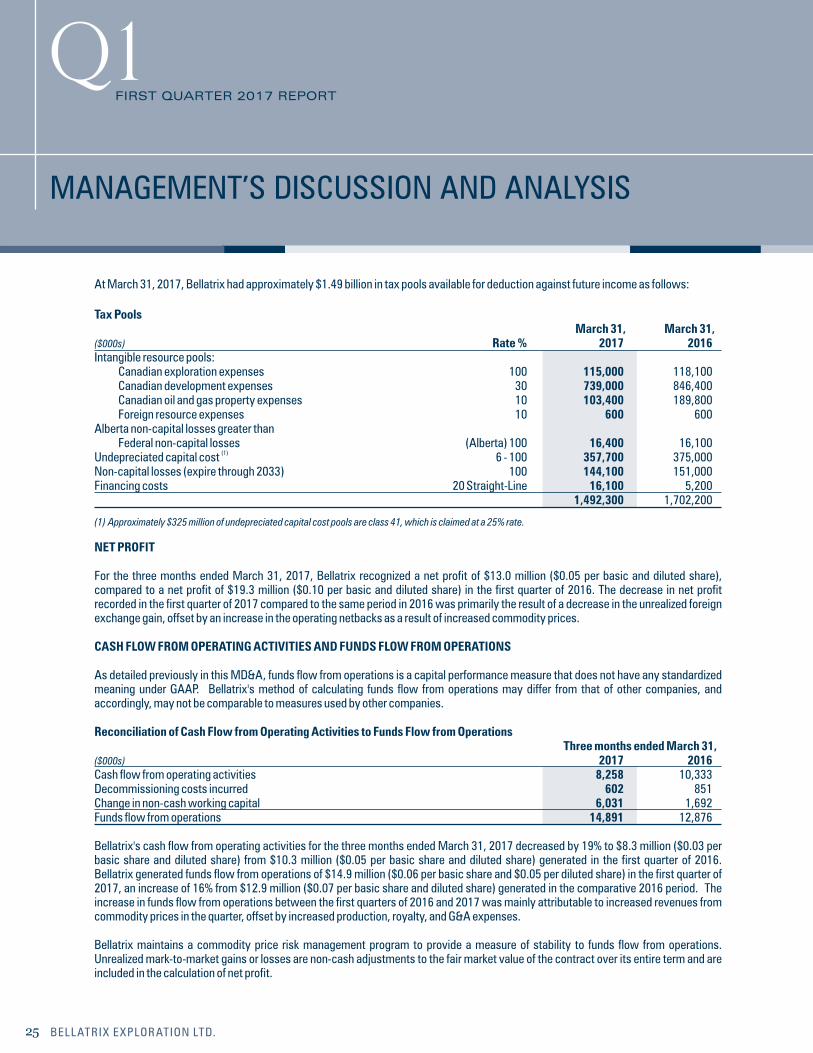
At March 31, 2017, Bellatrix had approximately $1.49 billion in tax pools available for deduction against future income as follows:
Tax Pools March 31, March 31,($000s) Rate % 2017 2016Intangible resource pools: Canadian exploration expenses 100 115,000 118,100 Canadian development expenses 30 739,000 846,400 Canadian oil and gas property expenses 10 103,400 189,800 Foreign resource expenses 10 600 600Alberta non-capital losses greater than Federal non-capital losses (Alberta) 100 16,400 16,100
(1)Undepreciated capital cost 6 - 100 357,700 375,000Non-capital losses (expire through 2033) 100 144,100 151,000Financing costs 20 Straight-Line 16,100 5,200 1,492,300 1,702,200
(1) Approximately $325 million of undepreciated capital cost pools are class 41, which is claimed at a 25% rate.
NET PROFIT
For the three months ended March 31, 2017, Bellatrix recognized a net profit of $13.0 million ($0.05 per basic and diluted share), compared to a net profit of $19.3 million ($0.10 per basic and diluted share) in the first quarter of 2016. The decrease in net profit recorded in the first quarter of 2017 compared to the same period in 2016 was primarily the result of a decrease in the unrealized foreign exchange gain, offset by an increase in the operating netbacks as a result of increased commodity prices.
CASH FLOW FROM OPERATING ACTIVITIES AND FUNDS FLOW FROM OPERATIONS
As detailed previously in this MD&A, funds flow from operations is a capital performance measure that does not have any standardized meaning under GAAP. Bellatrix's method of calculating funds flow from operations may differ from that of other companies, and accordingly, may not be comparable to measures used by other companies.
Reconciliation of Cash Flow from Operating Activities to Funds Flow from Operations Three months ended March 31,($000s) 2017 2016Cash flow from operating activities 8,258 10,333Decommissioning costs incurred 602 851Change in non-cash working capital 6,031 1,692Funds flow from operations 14,891 12,876
Bellatrix's cash flow from operating activities for the three months ended March 31, 2017 decreased by 19% to $8.3 million ($0.03 per basic share and diluted share) from $10.3 million ($0.05 per basic share and diluted share) generated in the first quarter of 2016. Bellatrix generated funds flow from operations of $14.9 million ($0.06 per basic share and $0.05 per diluted share) in the first quarter of 2017, an increase of 16% from $12.9 million ($0.07 per basic share and diluted share) generated in the comparative 2016 period. The increase in funds flow from operations between the first quarters of 2016 and 2017 was mainly attributable to increased revenues from commodity prices in the quarter, offset by increased production, royalty, and G&A expenses.
Bellatrix maintains a commodity price risk management program to provide a measure of stability to funds flow from operations. Unrealized mark-to-market gains or losses are non-cash adjustments to the fair market value of the contract over its entire term and are included in the calculation of net profit.
MANAGEMENT’S DISCUSSION AND ANALYSIS
25 BELLATRIX EXPLORATION LTD.
q1FIRST QUARTER 2017 REPORT
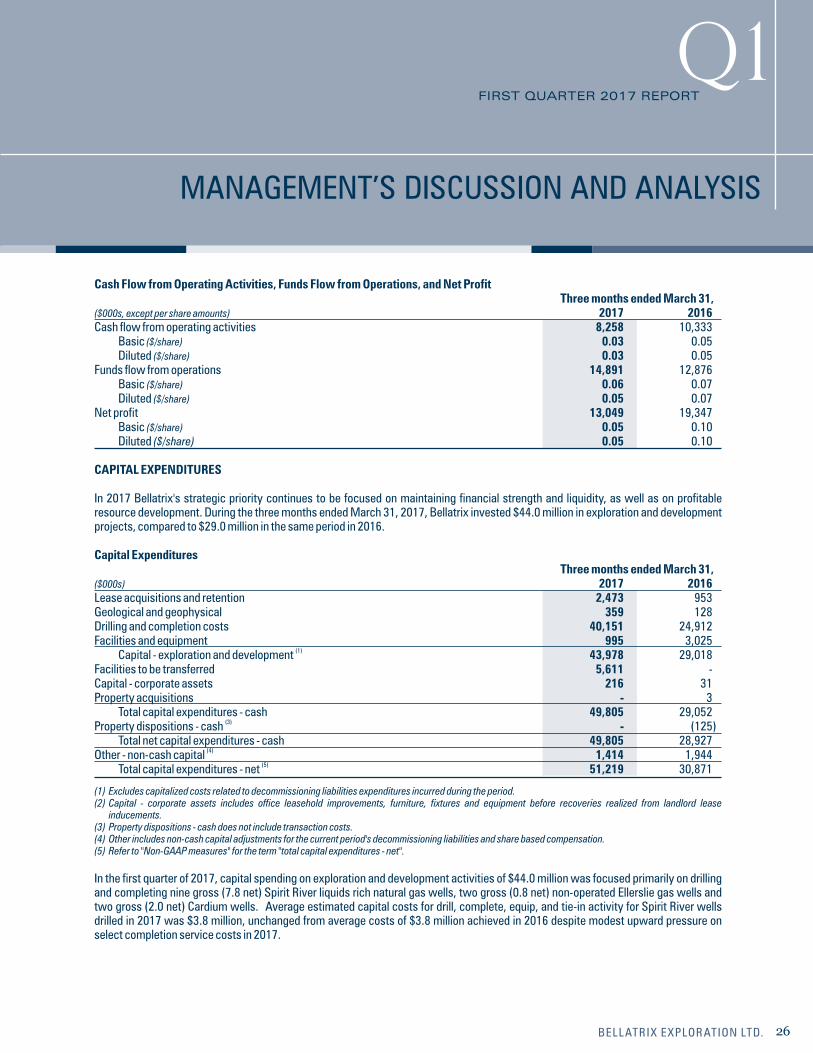
MANAGEMENT’S DISCUSSION AND ANALYSIS
26BELLATRIX EXPLORATION LTD.
q1FIRST QUARTER 2017 REPORT
Cash Flow from Operating Activities, Funds Flow from Operations, and Net Profit Three months ended March 31,($000s, except per share amounts) 2017 2016Cash flow from operating activities 8,258 10,333 Basic ($/share) 0.03 0.05 Diluted ($/share) 0.03 0.05Funds flow from operations 14,891 12,876 Basic ($/share) 0.06 0.07 Diluted ($/share) 0.05 0.07Net profit 13,049 19,347 Basic ($/share) 0.05 0.10 Diluted ($/share) 0.05 0.10
CAPITAL EXPENDITURES
In 2017 Bellatrix's strategic priority continues to be focused on maintaining financial strength and liquidity, as well as on profitable resource development. During the three months ended March 31, 2017, Bellatrix invested $44.0 million in exploration and development projects, compared to $29.0 million in the same period in 2016.
Capital Expenditures Three months ended March 31,($000s) 2017 2016Lease acquisitions and retention 2,473 953Geological and geophysical 359 128Drilling and completion costs 40,151 24,912Facilities and equipment 995 3,025
(1) Capital - exploration and development 43,978 29,018Facilities to be transferred 5,611 -Capital - corporate assets 216 31Property acquisitions - 3 Total capital expenditures - cash 49,805 29,052
(3)Property dispositions - cash - (125) Total net capital expenditures - cash 49,805 28,927
(4)Other - non-cash capital 1,414 1,944(5) Total capital expenditures - net 51,219 30,871
(1) Excludes capitalized costs related to decommissioning liabilities expenditures incurred during the period. (2) Capital - corporate assets includes office leasehold improvements, furniture, fixtures and equipment before recoveries realized from landlord lease
inducements.(3) Property dispositions - cash does not include transaction costs. (4) Other includes non-cash capital adjustments for the current period's decommissioning liabilities and share based compensation. (5) Refer to "Non-GAAP measures" for the term "total capital expenditures - net".
In the first quarter of 2017, capital spending on exploration and development activities of $44.0 million was focused primarily on drilling and completing nine gross (7.8 net) Spirit River liquids rich natural gas wells, two gross (0.8 net) non-operated Ellerslie gas wells and two gross (2.0 net) Cardium wells. Average estimated capital costs for drill, complete, equip, and tie-in activity for Spirit River wells drilled in 2017 was $3.8 million, unchanged from average costs of $3.8 million achieved in 2016 despite modest upward pressure on select completion service costs in 2017.
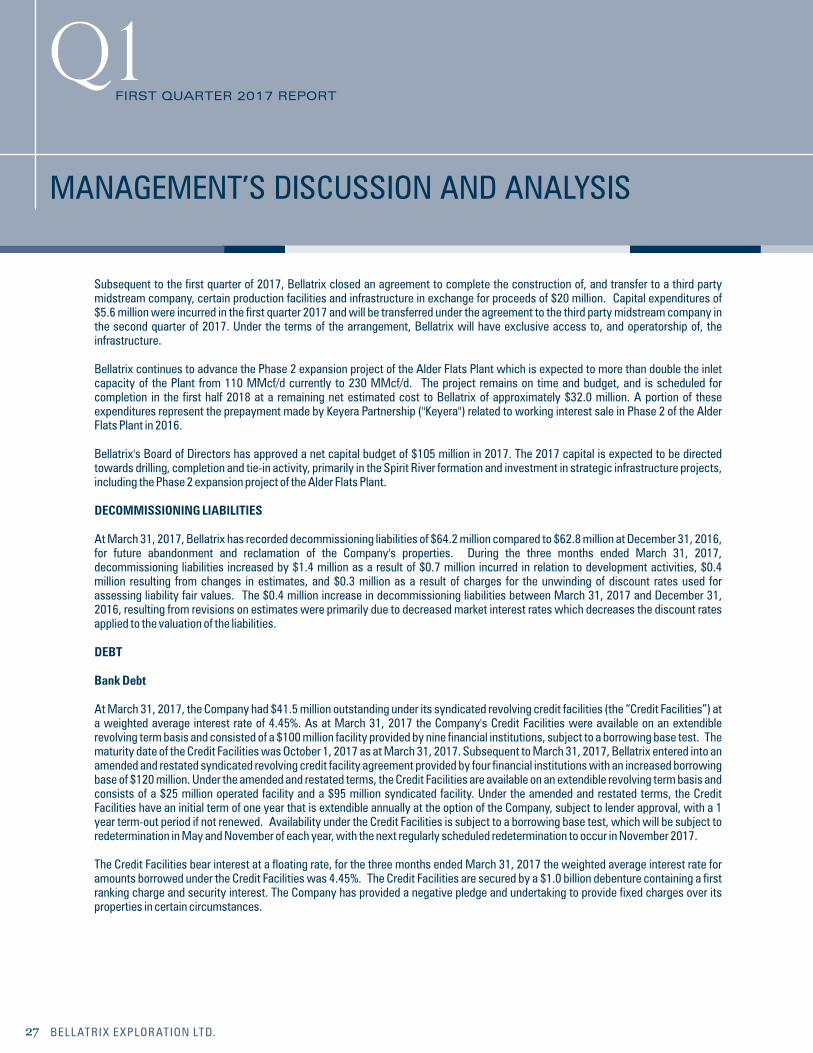
MANAGEMENT’S DISCUSSION AND ANALYSIS
27 BELLATRIX EXPLORATION LTD.
q1FIRST QUARTER 2017 REPORT
Subsequent to the first quarter of 2017, Bellatrix closed an agreement to complete the construction of, and transfer to a third party midstream company, certain production facilities and infrastructure in exchange for proceeds of $20 million. Capital expenditures of $5.6 million were incurred in the first quarter 2017 and will be transferred under the agreement to the third party midstream company in the second quarter of 2017. Under the terms of the arrangement, Bellatrix will have exclusive access to, and operatorship of, the infrastructure.
Bellatrix continues to advance the Phase 2 expansion project of the Alder Flats Plant which is expected to more than double the inlet capacity of the Plant from 110 MMcf/d currently to 230 MMcf/d. The project remains on time and budget, and is scheduled for completion in the first half 2018 at a remaining net estimated cost to Bellatrix of approximately $32.0 million. A portion of these expenditures represent the prepayment made by Keyera Partnership ("Keyera") related to working interest sale in Phase 2 of the Alder Flats Plant in 2016.
Bellatrix's Board of Directors has approved a net capital budget of $105 million in 2017. The 2017 capital is expected to be directed towards drilling, completion and tie-in activity, primarily in the Spirit River formation and investment in strategic infrastructure projects, including the Phase 2 expansion project of the Alder Flats Plant.
DECOMMISSIONING LIABILITIES
At March 31, 2017, Bellatrix has recorded decommissioning liabilities of $64.2 million compared to $62.8 million at December 31, 2016, for future abandonment and reclamation of the Company's properties. During the three months ended March 31, 2017, decommissioning liabilities increased by $1.4 million as a result of $0.7 million incurred in relation to development activities, $0.4 million resulting from changes in estimates, and $0.3 million as a result of charges for the unwinding of discount rates used for assessing liability fair values. The $0.4 million increase in decommissioning liabilities between March 31, 2017 and December 31, 2016, resulting from revisions on estimates were primarily due to decreased market interest rates which decreases the discount rates applied to the valuation of the liabilities.
DEBT
Bank Debt
At March 31, 2017, the Company had $41.5 million outstanding under its syndicated revolving credit facilities (the “Credit Facilities”) at a weighted average interest rate of 4.45%. As at March 31, 2017 the Company's Credit Facilities were available on an extendible revolving term basis and consisted of a $100 million facility provided by nine financial institutions, subject to a borrowing base test. The maturity date of the Credit Facilities was October 1, 2017 as at March 31, 2017. Subsequent to March 31, 2017, Bellatrix entered into an amended and restated syndicated revolving credit facility agreement provided by four financial institutions with an increased borrowing base of $120 million. Under the amended and restated terms, the Credit Facilities are available on an extendible revolving term basis and consists of a $25 million operated facility and a $95 million syndicated facility. Under the amended and restated terms, the Credit Facilities have an initial term of one year that is extendible annually at the option of the Company, subject to lender approval, with a 1 year term-out period if not renewed. Availability under the Credit Facilities is subject to a borrowing base test, which will be subject to redetermination in May and November of each year, with the next regularly scheduled redetermination to occur in November 2017.
The Credit Facilities bear interest at a floating rate, for the three months ended March 31, 2017 the weighted average interest rate for amounts borrowed under the Credit Facilities was 4.45%. The Credit Facilities are secured by a $1.0 billion debenture containing a first ranking charge and security interest. The Company has provided a negative pledge and undertaking to provide fixed charges over its properties in certain circumstances.
MANAGEMENT’S DISCUSSION AND ANALYSIS
28BELLATRIX EXPLORATION LTD.
q1FIRST QUARTER 2017 REPORT
The agreement governing the Credit Facilities contains market standard terms and conditions, and includes, for instance, restrictions on asset dispositions and hedging. Generally, dispositions of properties to which the Company is given lending value in the determination of the borrowing base require lender approval if the net present value at 10% attributed to all properties sold in a fiscal year exceeds 5% of the borrowing base in effect at the time of such disposition. However, the agreement governing the Credit Facilities also provides that, at any time when there is a borrowing base shortfall, the value of the properties being sold or disposed cannot exceed 5% of the borrowing base in aggregate in any fiscal year without approval of a majority of lenders. In addition, asset dispositions are generally not permitted unless there would be no borrowing base shortfall as a result of such properties being sold. Commodity risk management transactions must not be done for speculative purposes. The term of any contract for commodity swaps cannot exceed 3 years. The aggregate amount hedged under all oil and gas commodity swaps cannot exceed 70% of the Company's average daily sales volume for the first year of a rolling 3 year period, 60% for the second year of such period or 50% for the third year of such period, with the average daily sales volume being based on the Company's production for the previous fiscal quarter. The aggregate amount hedged under all interest rate swaps, relating to unsecured note debt, cannot exceed the outstanding principal amount of any unsecured note debt or have a term exceeding the remaining term of the unsecured note debt. For interest rate swaps, unrelated to any unsecured note debt, the aggregate amount hedged cannot exceed 60% of the amount of the commitment under the Credit Facilities or exceed a term of three years. The aggregate amount hedged under all exchange rate swaps, relating to unsecured note debt, cannot exceed the outstanding principal amount of any unsecured note debt or have a term exceeding the remaining term of the unsecured note debt.
As at March 31, 2017, total outstanding letters of credit were $12.9 million which reduced the amount otherwise available to be drawn under the Credit Facilities.
Convertible Debentures
At March 31, 2017 Bellatrix had outstanding $50 million principal amount of 6.75% convertible unsecured subordinated debentures (the “Convertible Debentures”). The Convertible Debentures bear interest at a rate of 6.75% per annum, payable semiannually in arrears on September 30 and March 31 of each year. The maturity date of the Convertible Debentures is September 30, 2021 (the “Maturity Date”). Each $1,000 principal amount of Convertible Debenture is convertible at the option of the holder into approximately 617.2840 common shares of Bellatrix (representing a conversion price of $1.62). The Convertible Debentures are not redeemable prior to September 30, 2019, except in limited circumstances following a Change of Control (as defined by the terms of the indenture agreement). The Convertible Debentures are direct, subordinated unsecured obligations of the Company, subordinated to the Credit Facilities, the Senior Notes and any other senior indebtedness.
Senior Notes
The Company has US$250 million of 8.50% senior unsecured notes maturing May 15, 2020 (the “Senior Notes”) all of which remained outstanding as at March 31, 2017. Interest is payable on the Senior Notes semi-annually and the Senior Notes are redeemable at the Company's option, in whole or in part, commencing on May 15, 2017 at specified redemption prices. The Senior Notes are carried at amortized cost, net of debt issuance costs of $7.7 million, which accrete up to the principal balance at maturity using the effective interest rate of 9.6%. The Senior Notes were initially recognized at fair value, net of debt issue costs, and have subsequently been carried at amortized cost.
MANAGEMENT’S DISCUSSION AND ANALYSIS
29 BELLATRIX EXPLORATION LTD.
q1FIRST QUARTER 2017 REPORT
($000s) AmountBalance, December 31, 2015 332,024
(1) (2)Unrealized foreign exchange gain (9,879)Amortization of discount and debt issue costs 2,601 324,746Debt issue costs (55)Balance, December 31, 2016 324,691
(1) (2) Unrealized foreign exchange gain (2,534)Amortization of discount and debt issue costs 688Balance, March 31, 2017 322,845
(1) Exchange rate (CDN$/US$1.00) at March 31, 2017 was 1.3322 (December 31, 2016: 1.3427).(2) Amount does not include unrealized loss on foreign exchange contracts of $0.8 million (December 31, 2016: $2.0 million).
Covenants
The agreement governing the Credit Facilities contains one financial covenant (referred to above as the Senior Debt Covenant), which requires that the Company will not permit its ratio of outstanding Senior Debt to consolidated earnings before interest, taxes, depletion, depreciation and amortization ("EBITDA"), as defined by the terms of the agreement governing the Credit Facilities and adjusted for non-cash charges, for a trailing 12-month period to exceed a specified amount (the "Senior Debt Covenant"). Specifically, the Senior Debt Covenant requires that the Company maintain a Senior Debt to EBITDA ratio of not more than 3.5 times for the fiscal quarters ending on or before March 31, 2017. Under the amended and restated terms of the Credit Facilities, the maximum Senior Debt to EBITDA ratio has been reduced to 3.0 times (3.5 times for the two fiscal quarters immediately following a material acquisition). As at March 31, 2017, the Company was in compliance with the Senior Debt Covenant with a Senior Debt to EBITDA ratio of 1.81 times.
The indenture governing the Senior Notes does not contain any maintenance financial covenants but does contain an incurrence-based minimum fixed charge coverage ratio covenant which, if not met, limits the Company's ability to incur additional indebtedness beyond its existing Senior Notes and its Credit Facilities.
The following table lists the covenant under the Credit Facilities and Senior Notes and the Company's compliance therewith, as at March 31, 2017: Covenant as at Position at March 31, 2017 March 31, 2017Credit Facilities - Senior Debt Covenant Maximum Ratio
(1) (2) Senior Debt to EBITDA for the last four fiscal quarters 3.50x 1.81
Senior Notes - Incurrence Covenant Minimum Ratio (3) Fixed charge coverage 2.25x 1.71
(1) "Senior Debt" is defined as Consolidated Total Debt, excluding any unsecured or subordinated debt (Senior Notes and Convertible Debentures (liability component)). "Consolidated Total Debt" is defined as determined on a consolidated basis in accordance with GAAP and without duplication, all Debt of the Borrower. The Company's calculation of Consolidated Total Debt excludes decommissioning liabilities and deferred tax liability. The calculation includes outstanding letters of credit, bank debt, finance lease obligations, deferred lease inducements, deferred capital obligations, deferred financing obligations and net working capital deficiency, calculated as working capital deficiency excluding current risk management contract assets and liabilities. Senior Debt at March 31, 2017 was $122.6 million.
(2) EBITDA is calculated based on terms and definitions set out in the Credit Agreement which adjusts net income (loss) for financing costs, certain specific unrealized and non-cash transactions, and acquisition and disposition activity and is calculated based on a trailing twelve month basis. EBITDA for the trailing twelve months ended March 31, 2017 was $67.7 million.
(3) Fixed charge coverage is computed as the ratio of fixed charges (as defined in the indenture governing the Senior Notes fixed charges generally includes interest expense plus paid or accrued dividends, if any) to trailing twelve month consolidated cash flow (as defined in the indenture governing the Senior Notes, consolidated cash flow includes the consolidated net profit (loss) and adds back unrealized foreign exchange, provision for taxes, fixed charges, depletion, and various other non-recurring expenses and charges). For the trailing twelve months ended March 31, 2017, fixed charges were $41.1 million and consolidated cash flow was $70.3 million.
Bellatrix currently has commitments associated with the Credit Facilities outlined above and the commitments outlined under the "Commitments" section.
MANAGEMENT’S DISCUSSION AND ANALYSIS
30BELLATRIX EXPLORATION LTD.
q1FIRST QUARTER 2017 REPORT
LIQUIDITY AND CAPITAL RESOURCES
As an oil and gas company, Bellatrix has a declining asset base and therefore relies on ongoing development and acquisitions to replace production and add additional reserves. Future oil and natural gas production and reserves are highly dependent on the success of exploiting the Company's existing asset base and in identifying or acquiring additional reserves. To the extent Bellatrix is successful or unsuccessful in these activities, cash flow could be increased or decreased. In addition, the Company's cash flow depends on a number of factors, including commodity prices, production and sales volumes, production expenses, taxes, and royalties.
Bellatrix remains highly focused on key business objectives of maintaining financial strength and liquidity, and optimizing capital investments in the current commodity price environment. Bellatrix expects to be able to fund its 2017 capital program by reinvesting cash flow and drawing on debt. In January 2017, Bellatrix's Board of Directors approved a 2017 net capital budget of $105 million. Bellatrix continually monitors its capital spending program in light of prevailing commodity prices and the United States/Canadian dollar exchange rate with the aim of ensuring the Company will be able to meet future anticipated obligations incurred from normal ongoing operations with funds flow from operations and borrowings under its Credit Facilities, as necessary.
In addition to cash flow from operations, the Company's other main source of liquidity is its Credit Facilities. At March 31, 2017, the Company had $41.5 million outstanding under the Company's Credit Facilities (excluding letters of credit) at a weighted average interest rate of 4.45%.
At March 31, 2017, the borrowing base under the Company's Credit Facilities was $100 million, providing the Company with approximately $59 million of available liquidity (excluding outstanding letters of credit). Subsequent to March 31, 2017, Bellatrix entered into an amended and restated syndicated revolving credit facility agreement with four financial institutions providing for an increased borrowing base under the Credit Facilities of $120 million. Under the amended and restated terms, the Credit Facilities have an initial term of one year that is extendible annually at the option of the Company, subject to lender approval, with a 1 year term-out period if not renewed (refer to "Bank Debt" above).
In addition to the semi-annual borrowing base redeterminations, the Credit Facilities incorporate the Senior Debt Covenant (as discussed above) which also has the ability to effectively limit the Company's maximum drawings permitted under the Credit Facilities. As at March 31, 2017, the Company's trailing twelve-month EBITDA was $67.7 million and Senior Debt was $122.6 million, resulting in a Senior Debt to EBITDA ratio of 1.81 times.
Total net debt at March 31, 2017 includes bank debt, Convertible Debentures (liability component), Senior Notes, and the net balance of an adjusted working capital deficiency of $33.2 million. Total net debt excludes unrealized risk management contract assets and liabilities, deferred taxes, other deferred liabilities, deferred capital obligation and decommissioning liabilities.
Total net debt levels of $435.4 million at March 31, 2017 decreased by $278.4 million from $713.8 million at March 31, 2016. The reduction in total net debt reflects a decrease in the bank debt and adjusted working capital deficiency period over period. The decrease of $327.4 million to the bank debt and adjusted working capital deficiency is mainly attributable to non-core dispositions and monetization of facilities, issuance of Convertible Debentures, and issuance of common shares in 2016.
MANAGEMENT’S DISCUSSION AND ANALYSIS
31 BELLATRIX EXPLORATION LTD.
q1FIRST QUARTER 2017 REPORT
Debt to Funds Flow from Operations Ratio Three months ended March 31,($000s, except where noted) 2017 2016 Shareholders' equity 877,502 830,662 Bank debt 41,466 358,671
(1)Adjusted working capital deficiency 33,177 43,356Subtotal 74,643 402,027
(2)Senior Notes (mature on May 15, 2020) 322,845 311,736(1)Net debt 397,488 713,763
Convertible Debentures (liability component) 37,889 -(1)Total net debt at period end 435,377 713,763
(3) (4)Debt to funds flow from operations ratio (annualized)
(4)Funds flow from operations (annualized) 59,564 51,504(1) (3) Net debt to periods funds flow from operations ratio (annualized) 6.7x 13.9x
(3)Total net debt to periods funds flow from operations ratio (annualized) 7.3x 13.9x
(4)Debt to funds flow from operations ratio (trailing) (4)Funds flow from operations (trailing) 42,932 97,505
(1) (4) (5)Net debt to funds flow from operations ratio (trailing) 9.3x 7.3x(1) (4) (5) Total net debt to funds flow from operations ratio (trailing) 10.1x 7.3x
(1) Refer to "Non-GAAP measures" for the terms "net debt" and "total net debt".(2) For the three months ended March 31, 2017, includes unrealized foreign exchange gain of $2.5 million (2016: $21.5 million gain) and does not include an
unrealized loss of $0.8 million (2016: $3.8 million loss) on foreign exchange contracts.(3) For the three months ended March 31, 2017 and 2016, total net debt to period's funds flow from operations ratio (annualized) is calculated based upon first quarter funds flow from operations annualized.(4) Refer to "Non-GAAP measures" for the term "funds flow from operations".(5) Trailing period funds flow from operations ratio annualized is based upon the twelve month periods ended March 31, 2017 and March 31, 2016.
As at March 31, 2017 the Company's ratio of total net debt to annualized funds flow from operations (based on first quarter funds flow from operations) was 7.3 times. The total net debt to annualized funds flow from operations ratio as at March 31, 2017 decreased from March 31, 2016 of 13.9 times primarily due to the decrease in total net debt between the periods as a result of non-core dispositions in the fourth quarter of 2016 and increased funds flow from operations mainly driven by an escalation in commodity prices. The Company continues to preserve liquidity through the priority use of funds flow from operations.
Liquidity Risk
Liquidity risk is the risk that Bellatrix will not be able to meet its financial obligations as they become due. Bellatrix actively manages its liquidity through daily and longer-term cash, debt, and equity management strategies. Such strategies encompass, among other factors: having adequate sources of financing available through its Credit Facilities, estimating future cash generated from operations based on reasonable production and pricing assumptions, analysis of economic risk management opportunities, and maintaining sufficient cash flows to ensure compliance with the Credit Facilities Senior Debt Covenant described above. Subsequent to March 31, 2017, Bellatrix entered into an amended and restated syndicated revolving credit facility agreement with four financial institutions providing for an increased borrowing base under the Credit Facilities of $120 million. Under the amended and restated terms, the Credit Facilities have an initial term of one year that is extendible annually at the option of the Company, subject to lender approval, with a 1 year term-out period if not renewed (refer to “Bank Debt” above).
MANAGEMENT’S DISCUSSION AND ANALYSIS
32BELLATRIX EXPLORATION LTD.
q1FIRST QUARTER 2017 REPORT
Subsequent to the end of the first quarter 2017, Bellatrix completed two separate transactions whereby it monetized its $15 million vendor take back loan receivable and divested its marketable securities for combined net proceeds of approximately $20 million. Bellatrix utilized proceeds from these two transactions to reduce the amount outstanding on its bank credit facilities.
Future liquidity depends primarily on cash flow generated from operations, availability under the Credit Facilities and Bellatrix's ability to comply with the Senior Debt Covenant and other covenants contained therein, and the ability to access debt and equity markets.
Bellatrix also has Senior Notes and Convertible Debentures outstanding with fixed interest rates (as outlined in above in “Senior Notes” and “Convertible Debentures”), which mature on May 15, 2020 and September 30, 2021, respectively. The Company also mitigates liquidity risk by maintaining an insurance program to minimize exposure to insurable losses.
From time to time, the Company accesses capital markets to meet its additional financing needs and to maintain flexibility in funding its capital programs. As at March 31, 2017, the Company has the ability to offer to sell up to an additional $470.8 million in securities under its $500 million Shelf Prospectus, which expires on June 30, 2018.
There can be no assurance that future debt or equity financing, additional credit under the Credit Facilities, or cash generated by operations will be available or sufficient to meet these requirements or for other corporate purposes or, if debt or equity financing is available, that it will be on terms acceptable to Bellatrix.
As at May 9, 2017, Bellatrix had outstanding a total of 9,722,433 options at an average exercise price of $3.38 per share and had 246,585,828 common shares outstanding. Additionally, Bellatrix had 1,756,676 PAs and 2,242,354 RAs outstanding as of May 9, 2017. Awards under the Award Plan may be settled in cash, in common shares of the Company, or a combination thereof. In the case of PAs, settlement is subject to a “payout multiplier” (the payout multiplier shall be based on such corporate performance measures as determined by the Board of Directors (or the Compensation Committee) of the Company) and may range between zero and two times.
In addition, as at May 9, 2017, there was $50 million principal amount of Convertible Debentures outstanding which are convertible into approximately 30,864,200 common shares of the Company based on a conversion price of $1.62 per share at the option of the holder. The Company may elect to issue common shares of the Company to satisfy the obligation to repay, in whole or in part, the principal amount of the Convertible Debentures upon redemption or maturity of the Convertible Debentures (any accrued and unpaid interest on such redemption or maturity will be paid in cash). The exact number of common shares of the Company that may be issuable on redemption or maturity would be determined by dividing the principal amount of the Convertible Debentures by 95% of the current market price of the common shares on the redemption date or maturity date, as applicable.
Credit Risk
Credit risk is the risk of financial loss to Bellatrix if a customer or counterparty to a financial instrument fails to meet its contractual obligations, and arises principally from Bellatrix's trade receivables from joint venture partners, petroleum and natural gas marketers, and financial derivative counterparties.
A substantial portion of Bellatrix's accounts receivable are with customers and joint venture partners in the petroleum and natural gas industry and are subject to normal industry credit risks. Bellatrix currently sells substantially all of its production to ten primary purchasers under standard industry sale and payment terms. The most significant 60 day exposure to a single counterparty is approximately $16.7 million. Purchasers of Bellatrix's natural gas, crude oil and natural gas liquids are subject to a periodic internal credit review to minimize the risk of non-payment. Bellatrix has continued to closely monitor and reassess the creditworthiness of its counterparties, including financial institutions. This has resulted in Bellatrix mitigating its exposures to certain counterparties by obtaining financial assurances or reducing credit where it is deemed warranted and permitted under contractual terms.
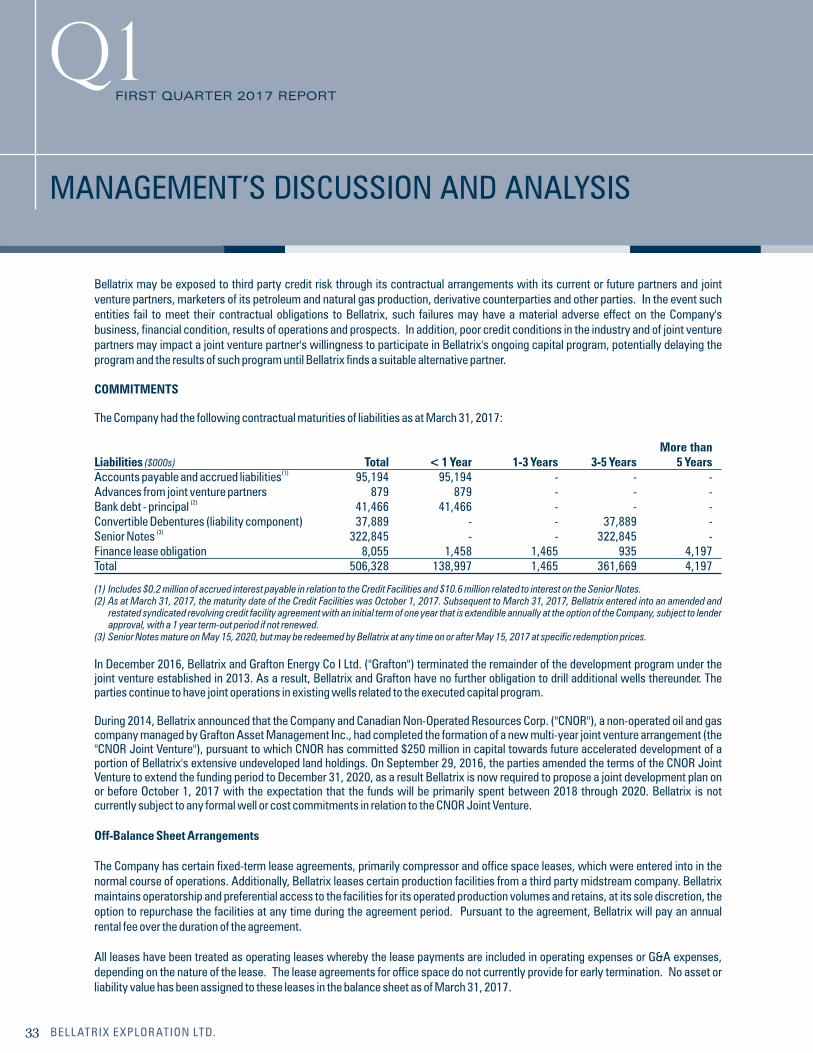
MANAGEMENT’S DISCUSSION AND ANALYSIS
33 BELLATRIX EXPLORATION LTD.
q1FIRST QUARTER 2017 REPORT
Bellatrix may be exposed to third party credit risk through its contractual arrangements with its current or future partners and joint venture partners, marketers of its petroleum and natural gas production, derivative counterparties and other parties. In the event such entities fail to meet their contractual obligations to Bellatrix, such failures may have a material adverse effect on the Company's business, financial condition, results of operations and prospects. In addition, poor credit conditions in the industry and of joint venture partners may impact a joint venture partner's willingness to participate in Bellatrix's ongoing capital program, potentially delaying the program and the results of such program until Bellatrix finds a suitable alternative partner.
COMMITMENTS
The Company had the following contractual maturities of liabilities as at March 31, 2017: More than Liabilities ($000s) Total < 1 Year 1-3 Years 3-5 Years 5 Years
(1)Accounts payable and accrued liabilities 95,194 95,194 - - -Advances from joint venture partners 879 879 - - -
(2)Bank debt - principal 41,466 41,466 - - -Convertible Debentures (liability component) 37,889 - - 37,889 -
(3)Senior Notes 322,845 - - 322,845 -Finance lease obligation 8,055 1,458 1,465 935 4,197Total 506,328 138,997 1,465 361,669 4,197
(1) Includes $0.2 million of accrued interest payable in relation to the Credit Facilities and $10.6 million related to interest on the Senior Notes.(2) As at March 31, 2017, the maturity date of the Credit Facilities was October 1, 2017. Subsequent to March 31, 2017, Bellatrix entered into an amended and
restated syndicated revolving credit facility agreement with an initial term of one year that is extendible annually at the option of the Company, subject to lender approval, with a 1 year term-out period if not renewed.
(3) Senior Notes mature on May 15, 2020, but may be redeemed by Bellatrix at any time on or after May 15, 2017 at specific redemption prices.
In December 2016, Bellatrix and Grafton Energy Co I Ltd. ("Grafton") terminated the remainder of the development program under the joint venture established in 2013. As a result, Bellatrix and Grafton have no further obligation to drill additional wells thereunder. The parties continue to have joint operations in existing wells related to the executed capital program.
During 2014, Bellatrix announced that the Company and Canadian Non-Operated Resources Corp. ("CNOR"), a non-operated oil and gas company managed by Grafton Asset Management Inc., had completed the formation of a new multi-year joint venture arrangement (the "CNOR Joint Venture"), pursuant to which CNOR has committed $250 million in capital towards future accelerated development of a portion of Bellatrix's extensive undeveloped land holdings. On September 29, 2016, the parties amended the terms of the CNOR Joint Venture to extend the funding period to December 31, 2020, as a result Bellatrix is now required to propose a joint development plan on or before October 1, 2017 with the expectation that the funds will be primarily spent between 2018 through 2020. Bellatrix is not currently subject to any formal well or cost commitments in relation to the CNOR Joint Venture.
Off-Balance Sheet Arrangements
The Company has certain fixed-term lease agreements, primarily compressor and office space leases, which were entered into in the normal course of operations. Additionally, Bellatrix leases certain production facilities from a third party midstream company. Bellatrix maintains operatorship and preferential access to the facilities for its operated production volumes and retains, at its sole discretion, the option to repurchase the facilities at any time during the agreement period. Pursuant to the agreement, Bellatrix will pay an annual rental fee over the duration of the agreement.
All leases have been treated as operating leases whereby the lease payments are included in operating expenses or G&A expenses, depending on the nature of the lease. The lease agreements for office space do not currently provide for early termination. No asset or liability value has been assigned to these leases in the balance sheet as of March 31, 2017.
MANAGEMENT’S DISCUSSION AND ANALYSIS
34BELLATRIX EXPLORATION LTD.
q1FIRST QUARTER 2017 REPORT
Bellatrix and Keyera previously entered into a midstream services and governance agreement pursuant to which Bellatrix will have exclusive access to the purchased capacity (approximately 80.5 MMcf/d post commissioning of Phase 2) for a term of 10 years, and will remain the operator of the Alder Flats Plant. In exchange for exclusive access to the purchased capacity during the term, Keyera will be entitled to receive, on an annual basis, a guaranteed fee calculated with reference to the capital fees that Keyera will otherwise receive in accordance with the terms of the construction, ownership and operation agreement governing the Alder Flats Plant.
2017 OPERATIONAL PERFORMANCE AND 2017 OUTLOOK
Management's focus on operational execution during the first quarter of 2017 resulted in production volume outperformance relative to previously set full year 2017 average guidance levels, enabling management to increase the Company's full year guidance expectations as described below. The majority of the first half capital investment program was completed during the first three months of the year, as capital investment activities are customarily curtailed during the second quarter, given the seasonal spring break-up period. Average second quarter 2017 production levels are anticipated to commensurately meet the revised full year average guidance of 34,500 boe/d given strong well results and strong operational momentum achieved during the first quarter of 2017.
The Company's capital investment plans for 2017 remain unchanged; Bellatrix plans to expand its drilling efforts across its core west central Alberta acreage including expanded development of the Spirit River formation in the Willesden Green area, following on the success in the Ferrier area. With the completion of joint venture programs in 2016, Bellatrix has strategically reviewed its drilling program to optimize capital investment, forecast rates of return, and long term net asset value and reserve growth potential. The Company's current 2017 capital expenditure guidance anticipates drilling approximately 19 net wells during the year, of which approximately 10.6 wells were drilled during the first half of the year. Bellatrix's focused capital investment program is supported by an active risk management program, and will continue to target the low cost and high return Spirit River liquids rich natural gas play which delivers strong rates of return.
UPDATED 2017 GUIDANCE
Strong first quarter operational results and positive momentum into the second quarter provide visibility to meaningfully outperform prior forecast guidance expectation levels. To that end, Bellatrix is increasing its full year 2017 average production guidance expectation to 34,500 boe/d, an increase of 1,000 boe/d from prior guidance announced on January 5, 2017. Bellatrix has maintained its full year capital expenditure guidance at $105 million despite the increase in average production levels. Bellatrix remains committed to providing sustainable long term growth for shareholders including delivery of its 2017 capital program providing +/-15% forecast production growth.
2017 Actual Performance Versus Guidance Previously Set First Quarter 2017 Annual Actual Versus 2017 Results Guidance Guidance (January 5, 2017) Average daily production (boe/d) 34,750 33,500 +4%Average product mix Crude oil, condensate and NGLs (%) 25 24 +1% Natural gas (%) 75 76 -1%
(1) Net capital spending ($ millions) $44 $105 n/aExpenses ($/boe)
(2) Production $9.37 $9.00 +4%
(1) Capital spending includes exploration and development capital projects and corporate assets, and excludes property acquisitions, property dispositions, and facilities to be transferred.
(2) Production expenses before net processing revenue/fees.
MANAGEMENT’S DISCUSSION AND ANALYSIS
35 BELLATRIX EXPLORATION LTD.
q1FIRST QUARTER 2017 REPORT
As the Company embarks on its three year strategic plan outlined in January of 2017, Bellatrix remain committed to maximizing capital resources, maintaining a laser sharp focus on operational execution, and most importantly delivering on its promises. Bellatrix's three foundational pillars provide the long term competitive advantages required to thrive in the current commodity price environment and deliver profitable growth in production, cash flow, and net asset value.
CRITICAL ACCOUNTING ESTIMATES AND ACCOUNTING POLICIES
The reader is advised that the critical accounting estimates, policies, and practices as described in the Company's MD&A for the year ended December 31, 2016 continue to be critical in determining Bellatrix's financial results as of March 31, 2017.
A summary of future accounting pronouncements is found in the Company's MD&A for the year ended December 31, 2016. A copy of the Company's MD&A for the year ended December 31, 2016 is available at www.sedar.com or as part of the Company's annual report on Form 40-F for the year ended December 31, 2016, which may be found at www.sec.gov.
LEGAL, ENVIRONMENTAL REMEDIATION AND OTHER CONTINGENT MATTERS
The Company is involved in various claims and litigation arising in the normal course of business. While the outcome of these matters is uncertain and there can be no assurance that such matters will be resolved in the Company's favor, the Company does not currently believe that the outcome of adverse decisions in any pending or threatened proceeding related to these and other matters or any amount which it may be required to pay by reason thereof would have a material adverse impact on its financial position or results of operations.
The Company reviews legal, environmental remediation and other contingent matters to both determine whether a loss is probable based on judgment and interpretation of laws and regulations and determine that the loss can reasonably be estimated. When the loss is determined, it is charged to earnings. The Company's management monitors known and potential contingent matters and make appropriate provisions by charges to earnings when warranted by the circumstances.
With the above risks and uncertainties the reader is cautioned that future events and results may vary substantially from that which Bellatrix currently foresees.
CONTROLS AND PROCEDURES
Disclosure Controls and Procedures
The Company's President and Chief Executive Officer (“CEO”) and Executive Vice President, Finance and Chief Financial Officer (“CFO”) have designed, or caused to be designed under their supervision, disclosure controls and procedures (as defined in Rules 13(a) - 15(e) and 15d – 15(e) under the United States Securities Exchange Act of 1934, as amended (the “Exchange Act”) and National Instrument 52-109, Certification of Disclosure in Issuer's Annual and Interim Filings (“NI 52-109”)) to provide reasonable assurance that: (i) material information relating to the Company is made known to the Company's CEO and CFO by others, particularly during the period in which the annual and interim filings are being prepared; and (ii) information required to be disclosed by the Company in its annual filings, interim filings (as these terms are defined in NI 52-109) or other reports filed or submitted by it under securities legislation is recorded, processed, summarized and reported within the time period specified in securities legislation.
Internal Control over Financial Reporting
Management is responsible for establishing and maintaining adequate internal control over the Company's financial reporting (as defined in Rules 13(a) – 15(f) and 15(d) – 15(f) under the Exchange Act and NI 52-109). Internal control over the Company's financial reporting is a process designed by, or designed under the supervision of, our CEO and our CFO, and effected by our board of directors, management and other personnel, to provide reasonable assurance regarding the reliability of financial reporting and the preparation of financial statements for the external purposes in accordance with GAAP.
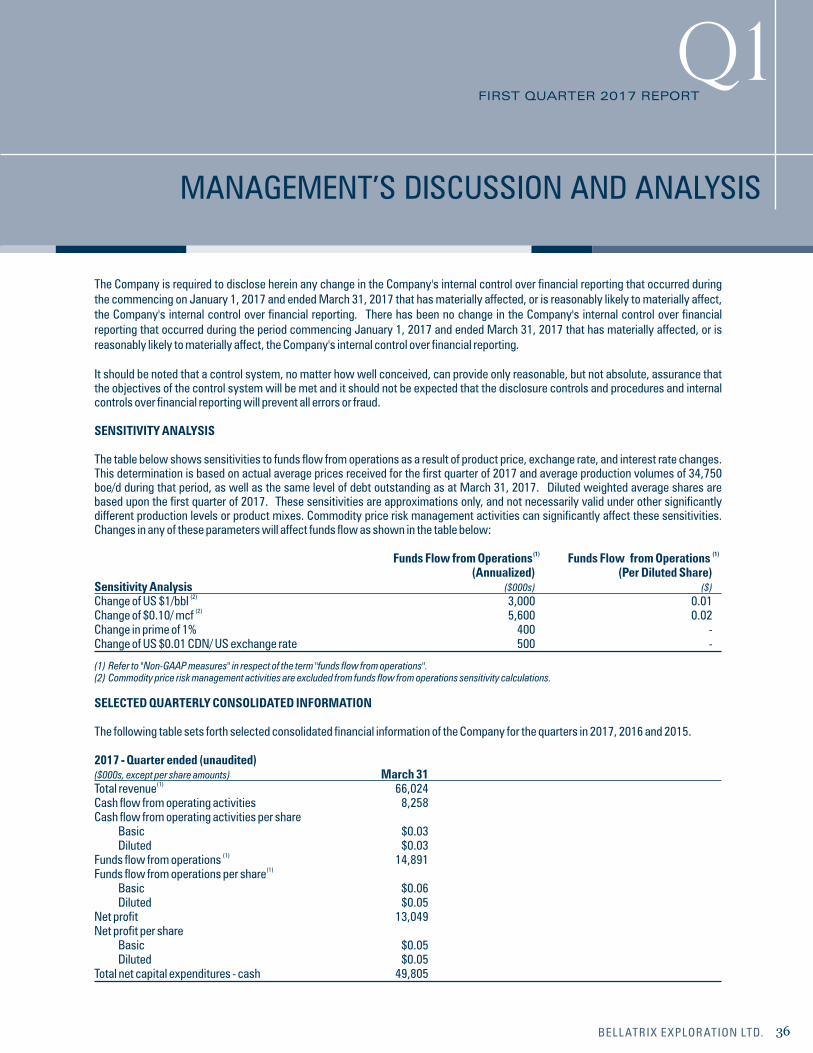
MANAGEMENT’S DISCUSSION AND ANALYSIS
36BELLATRIX EXPLORATION LTD.
q1FIRST QUARTER 2017 REPORT
The Company is required to disclose herein any change in the Company's internal control over financial reporting that occurred during the commencing on January 1, 2017 and ended March 31, 2017 that has materially affected, or is reasonably likely to materially affect, the Company's internal control over financial reporting. There has been no change in the Company's internal control over financial reporting that occurred during the period commencing January 1, 2017 and ended March 31, 2017 that has materially affected, or is reasonably likely to materially affect, the Company's internal control over financial reporting.
It should be noted that a control system, no matter how well conceived, can provide only reasonable, but not absolute, assurance that the objectives of the control system will be met and it should not be expected that the disclosure controls and procedures and internal controls over financial reporting will prevent all errors or fraud. SENSITIVITY ANALYSIS
The table below shows sensitivities to funds flow from operations as a result of product price, exchange rate, and interest rate changes. This determination is based on actual average prices received for the first quarter of 2017 and average production volumes of 34,750 boe/d during that period, as well as the same level of debt outstanding as at March 31, 2017. Diluted weighted average shares are based upon the first quarter of 2017. These sensitivities are approximations only, and not necessarily valid under other significantly different production levels or product mixes. Commodity price risk management activities can significantly affect these sensitivities. Changes in any of these parameters will affect funds flow as shown in the table below:
(1) (1) Funds Flow from Operations Funds Flow from Operations (Annualized) (Per Diluted Share)Sensitivity Analysis ($000s) ($)
(2)Change of US $1/bbl 3,000 0.01(2)Change of $0.10/ mcf 5,600 0.02
Change in prime of 1% 400 -Change of US $0.01 CDN/ US exchange rate 500 -
(1) Refer to "Non-GAAP measures" in respect of the term "funds flow from operations".(2) Commodity price risk management activities are excluded from funds flow from operations sensitivity calculations.
SELECTED QUARTERLY CONSOLIDATED INFORMATION
The following table sets forth selected consolidated financial information of the Company for the quarters in 2017, 2016 and 2015.
2017 - Quarter ended (unaudited)($000s, except per share amounts) March 31
(1)Total revenue 66,024 Cash flow from operating activities 8,258 Cash flow from operating activities per share Basic $0.03 Diluted $0.03
(1)Funds flow from operations 14,891 (1)Funds flow from operations per share
Basic $0.06 Diluted $0.05 Net profit 13,049 Net profit per share Basic $0.05 Diluted $0.05 Total net capital expenditures - cash 49,805
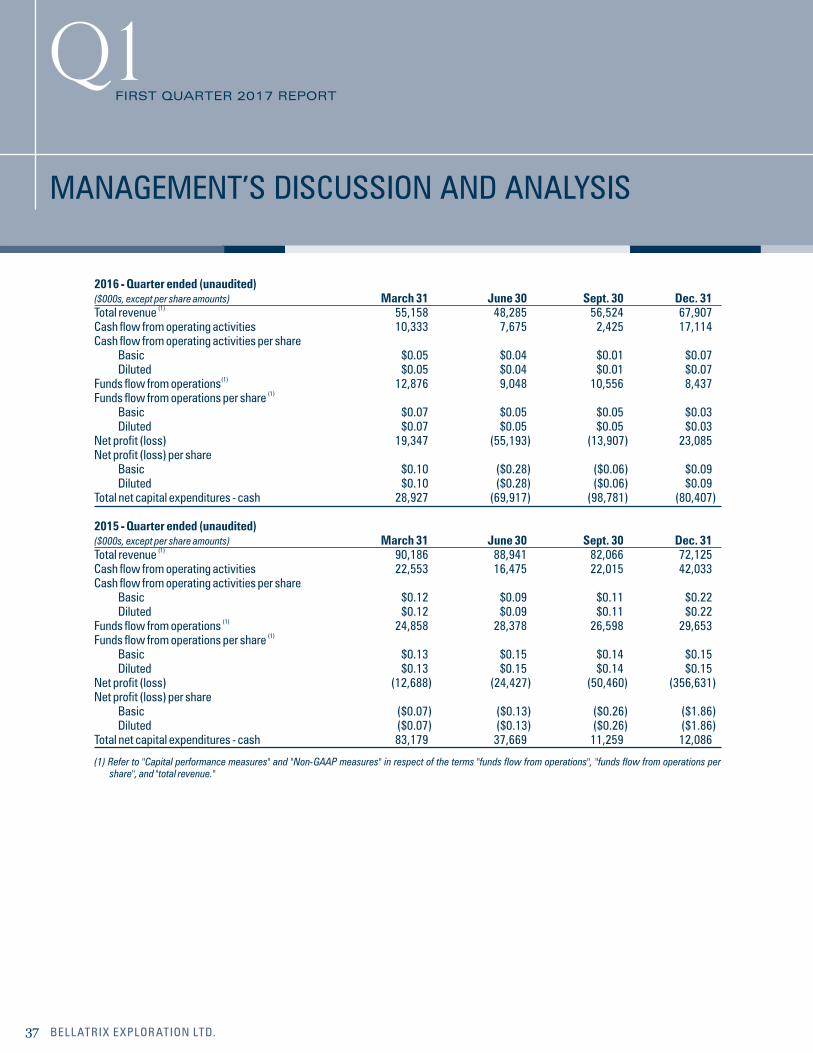
MANAGEMENT’S DISCUSSION AND ANALYSIS
37 BELLATRIX EXPLORATION LTD.
q1FIRST QUARTER 2017 REPORT
2016 - Quarter ended (unaudited)($000s, except per share amounts) March 31 June 30 Sept. 30 Dec. 31
(1)Total revenue 55,158 48,285 56,524 67,907Cash flow from operating activities 10,333 7,675 2,425 17,114Cash flow from operating activities per share Basic $0.05 $0.04 $0.01 $0.07 Diluted $0.05 $0.04 $0.01 $0.07
(1)Funds flow from operations 12,876 9,048 10,556 8,437(1)Funds flow from operations per share
Basic $0.07 $0.05 $0.05 $0.03 Diluted $0.07 $0.05 $0.05 $0.03Net profit (loss) 19,347 (55,193) (13,907) 23,085Net profit (loss) per share Basic $0.10 ($0.28) ($0.06) $0.09 Diluted $0.10 ($0.28) ($0.06) $0.09Total net capital expenditures - cash 28,927 (69,917) (98,781) (80,407)
2015 - Quarter ended (unaudited)($000s, except per share amounts) March 31 June 30 Sept. 30 Dec. 31
(1)Total revenue 90,186 88,941 82,066 72,125Cash flow from operating activities 22,553 16,475 22,015 42,033Cash flow from operating activities per share Basic $0.12 $0.09 $0.11 $0.22 Diluted $0.12 $0.09 $0.11 $0.22
(1)Funds flow from operations 24,858 28,378 26,598 29,653(1)Funds flow from operations per share
Basic $0.13 $0.15 $0.14 $0.15 Diluted $0.13 $0.15 $0.14 $0.15Net profit (loss) (12,688) (24,427) (50,460) (356,631)Net profit (loss) per share Basic ($0.07) ($0.13) ($0.26) ($1.86) Diluted ($0.07) ($0.13) ($0.26) ($1.86)Total net capital expenditures - cash 83,179 37,669 11,259 12,086
(1) Refer to "Capital performance measures" and "Non-GAAP measures" in respect of the terms "funds flow from operations", "funds flow from operations per share", and "total revenue."
MANAGEMENT’S DISCUSSION AND ANALYSIS
38BELLATRIX EXPLORATION LTD.
q1FIRST QUARTER 2017 REPORT
In the first quarter of 2017, Bellatrix drilled and/or participated in thirteen gross (10.6 net) wells. Total net cash capital expenditures were $49.8 million in the three months ended March 31, 2017, compared to a negative $80.4 million in the three months ended December 31, 2016, as a result of non-core property disposition in the fourth quarter of 2016. The non-core property dispositions also significantly contributed to sales volumes decreasing 10% from 38,467 in the first quarter of 2016 to 34,750 in the first quarter of 2017. Total revenue increased 20% to $66.0 million in the three months ended March 31, 2017, from $55.2 million in the three months ended March 31, 2016 due to improved commodity prices in the period, partially offset by decreased sales volumes.
In the fourth quarter of 2016, Bellatrix reduced its outstanding bank debt and working capital deficiency by approximately $102 million (or 70%) from the third quarter of 2016 through the use of proceeds from the non-core Pembina and Harmattan asset dispositions. In the three months ended December 31, 2016, the Company's net cash capital expenditures were negative $80.4 million, compared to expenditures of $12.1 million in the fourth quarter of 2015, primarily as a result of the asset dispositions in the fourth quarter 2016. Sales volumes decreased 22% to 31,888 boe/d from 40,705 boe/d realized in the fourth quarter of 2015, further reflecting the impact from the Pembina and Harmattan asset dispositions. The Company's total revenue generated in the quarter ending December 31, 2016, decreased 6% to $67.9 million from $72.1 million in the fourth quarter of 2015 as a result of decreased sales volumes in the 2016 period compared to the 2015 period.
In the third quarter of 2016 Bellatrix reduced outstanding bank debt and working capital by approximately $180.2 million (or 55%) from the second quarter of 2016 through the use of net proceeds from the $112.5 million Alder Flats Plant Sale and the issuance of common shares and Convertible Debentures for combined gross proceeds of $80 million, which were completed in the period. Bellatrix incurred $17.2 million of total cash capital expenditures in the third quarter of 2016 compared to $54.1 million in the comparative 2015 period. Bellatrix focused its capital activity in the third quarter primarily on drilling and completion projects and on expenditures related to the construction of Phase 2 of the Alder Flats Plant. The Company drilled four gross (2.3 net) wells, compared to 12 gross (5.4 net) wells in the same period of 2015. The low levels of capital activity for the three months ended September 30, 2016, has resulted in a 15% decrease in sales volumes to 34,409 boe/d from 40,277 boe/d realized in the third quarter of 2015.
In the second quarter of 2016 Bellatrix reduced outstanding bank debt and working capital by approximately $77.3 million (or 19%) from the first quarter of 2016 through the use of proceeds of approximately $75 million from a facilities monetization transaction. The Company incurred $7.8 million of total cash capital expenditures in the three months ended June 30, 2016, compared to $37.5 million in the comparative 2015 period. Bellatrix focused its capital activity in the second quarter primarily on facilities and equipment expenditures related to the construction of Phase 2 of the Alder Flats Plant. The decrease in capital expenditures was due to Bellatrix proactively curtailing development drilling activity in the quarter in response to significantly depressed natural gas prices. The decrease in capital activity for the three months ended June 30, 2016, coincided with a 6% decrease in sales volumes to 38,000 boe/d from 40,426 boe/d realized in the second quarter of 2015.
Bellatrix's first quarter 2016 results were impacted by a weak global commodity price environment which continued from the fourth quarter of 2015 through the first quarter of 2016. Total net debt was reduced in the quarter by $3.8 million. In the three months ended March 31, 2016, the Company incurred $28.9 million of net cash capital expenditures, compared to $83.2 million in the first quarter of 2015. The decrease in capital expenditures is primarily attributable to the decrease in facilities and equipment spending period over period in relation to the Alder Flats Plant which was commissioned in the second quarter of 2015. The Company drilled 10 gross (5.7 net) wells, compared to 6 gross (3.2 net) wells in the same period of 2015. Sales volumes decreased 13% to 38,467 boe/d from 44,408 boe/d realized in the first quarter of 2015, the decrease was due to a significant number of wells being tied-in during the first quarter of 2015 relating to the fourth quarter 2014 drilling program and a decrease in drilling activity throughout 2015 and into 2016 due to continued depressed commodity prices. The Company's total revenue generated in the quarter ending March 31, 2016, decreased 39% to $55.2 million from $90.2 million in the first quarter of 2015 as a result of the continued, weak global commodity price environment.
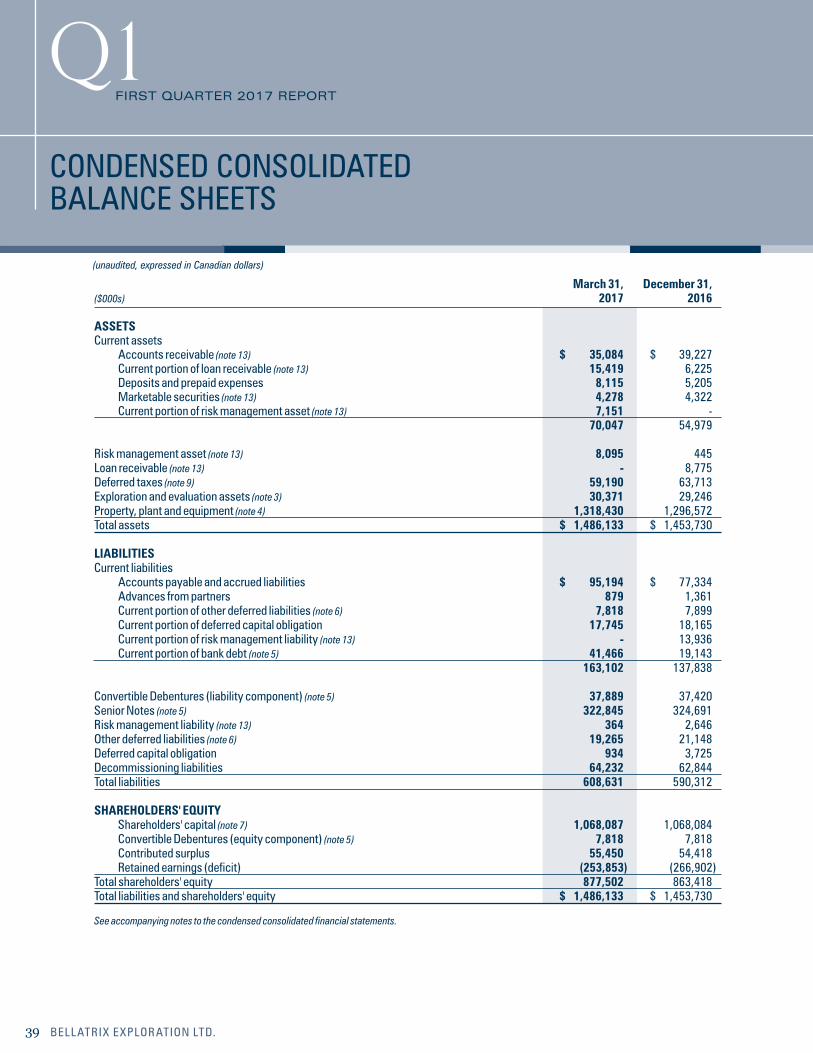
CONDENSED CONSOLIDATEDBALANCE SHEETS
39 BELLATRIX EXPLORATION LTD.
q1FIRST QUARTER 2017 REPORT
(unaudited, expressed in Canadian dollars)
March 31, December 31, ($000s) 2017 2016
ASSETS Current assets Accounts receivable (note 13) $ 35,084 $ 39,227 Current portion of loan receivable (note 13) 15,419 6,225 Deposits and prepaid expenses 8,115 5,205 Marketable securities (note 13) 4,278 4,322 Current portion of risk management asset (note 13) 7,151 - 70,047 54,979
Risk management asset (note 13) 8,095 445Loan receivable (note 13) - 8,775Deferred taxes (note 9) 59,190 63,713Exploration and evaluation assets (note 3) 30,371 29,246Property, plant and equipment (note 4) 1,318,430 1,296,572Total assets $ 1,486,133 $ 1,453,730 LIABILITIES Current liabilities Accounts payable and accrued liabilities $ 95,194 $ 77,334 Advances from partners 879 1,361 Current portion of other deferred liabilities (note 6) 7,818 7,899 Current portion of deferred capital obligation 17,745 18,165 Current portion of risk management liability (note 13) - 13,936 Current portion of bank debt (note 5) 41,466 19,143 163,102 137,838 Convertible Debentures (liability component) (note 5) 37,889 37,420Senior Notes (note 5) 322,845 324,691Risk management liability (note 13) 364 2,646Other deferred liabilities (note 6) 19,265 21,148Deferred capital obligation 934 3,725Decommissioning liabilities 64,232 62,844Total liabilities 608,631 590,312 SHAREHOLDERS' EQUITY Shareholders' capital (note 7) 1,068,087 1,068,084 Convertible Debentures (equity component) (note 5) 7,818 7,818 Contributed surplus 55,450 54,418 Retained earnings (deficit) (253,853) (266,902)Total shareholders' equity 877,502 863,418Total liabilities and shareholders' equity $ 1,486,133 $ 1,453,730
See accompanying notes to the condensed consolidated financial statements.
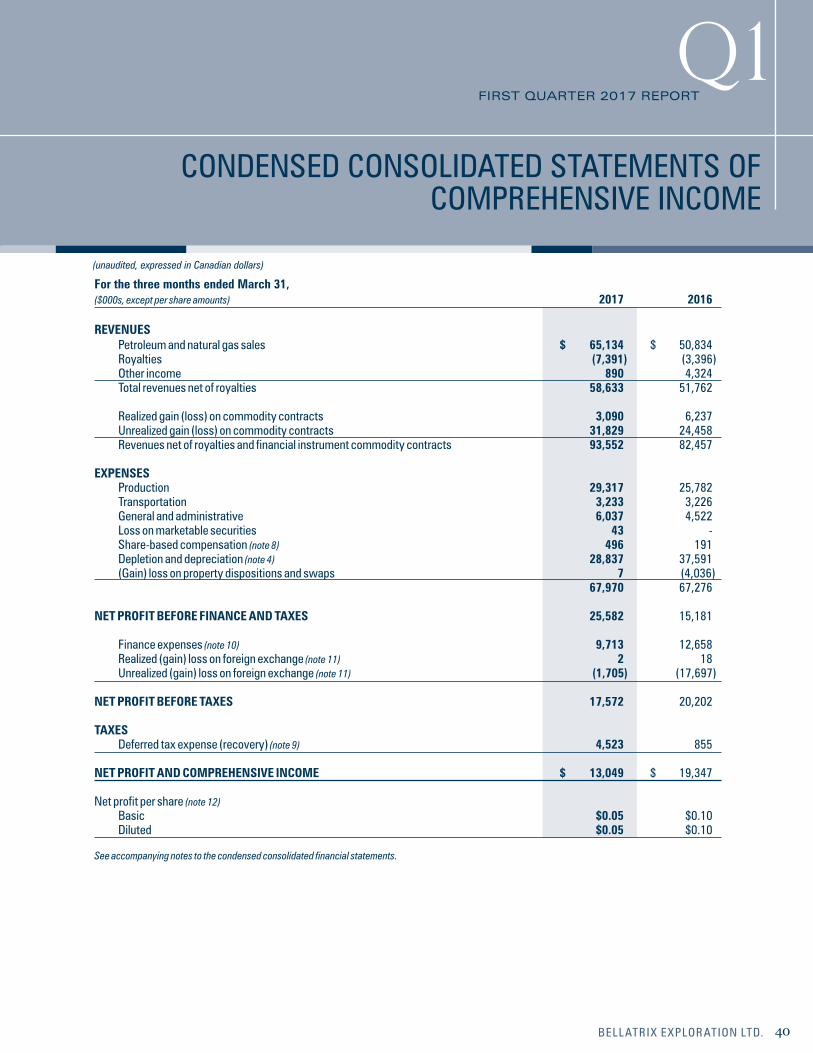
(unaudited, expressed in Canadian dollars)
For the three months ended March 31, ($000s, except per share amounts) 2017 2016 REVENUES Petroleum and natural gas sales $ 65,134 $ 50,834 Royalties (7,391) (3,396) Other income 890 4,324 Total revenues net of royalties 58,633 51,762 Realized gain (loss) on commodity contracts 3,090 6,237 Unrealized gain (loss) on commodity contracts 31,829 24,458 Revenues net of royalties and financial instrument commodity contracts 93,552 82,457 EXPENSES Production 29,317 25,782 Transportation 3,233 3,226 General and administrative 6,037 4,522 Loss on marketable securities 43 - Share-based compensation (note 8) 496 191 Depletion and depreciation (note 4) 28,837 37,591 (Gain) loss on property dispositions and swaps 7 (4,036) 67,970 67,276 NET PROFIT BEFORE FINANCE AND TAXES 25,582 15,181 Finance expenses (note 10) 9,713 12,658 Realized (gain) loss on foreign exchange (note 11) 2 18 Unrealized (gain) loss on foreign exchange (note 11) (1,705) (17,697) NET PROFIT BEFORE TAXES 17,572 20,202 TAXES Deferred tax expense (recovery) (note 9) 4,523 855 NET PROFIT AND COMPREHENSIVE INCOME $ 13,049 $ 19,347 Net profit per share (note 12) Basic $0.05 $0.10 Diluted $0.05 $0.10
See accompanying notes to the condensed consolidated financial statements.
40BELLATRIX EXPLORATION LTD.
q1FIRST QUARTER 2017 REPORT
CONDENSED CONSOLIDATED STATEMENTS OFCOMPREHENSIVE INCOME
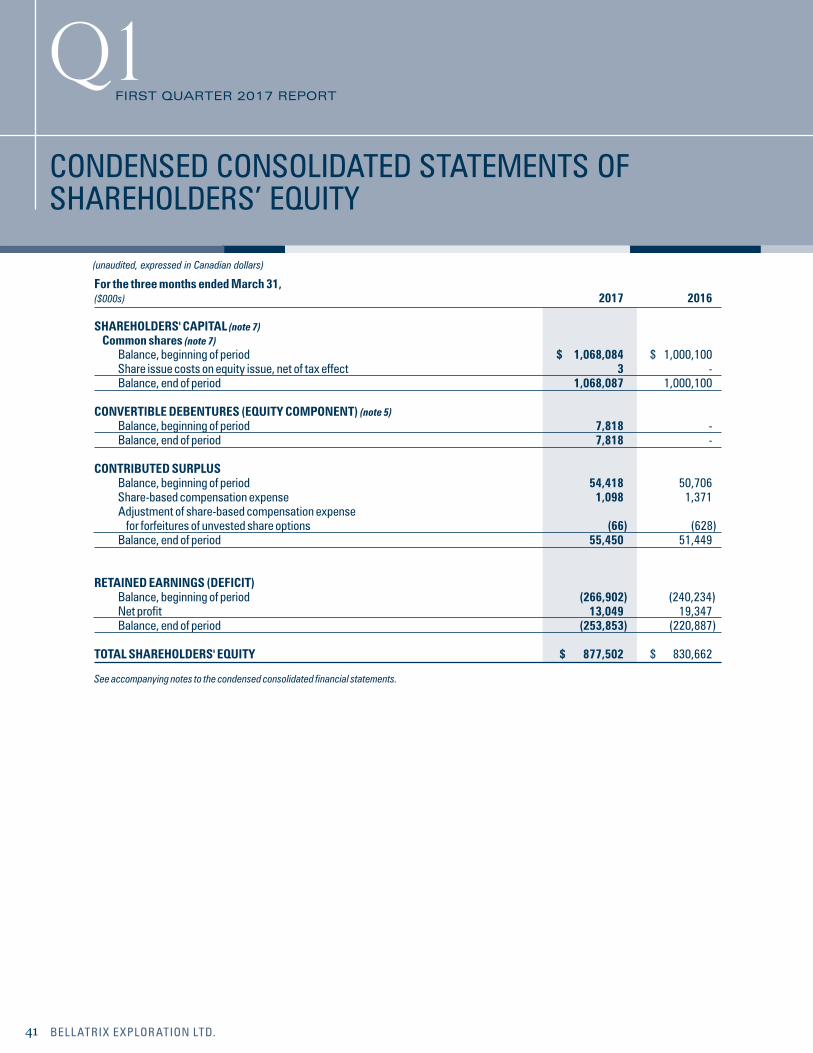
For the three months ended March 31, ($000s) 2017 2016 SHAREHOLDERS' CAPITAL (note 7) Common shares (note 7) Balance, beginning of period $ 1,068,084 $ 1,000,100 Share issue costs on equity issue, net of tax effect 3 - Balance, end of period 1,068,087 1,000,100 CONVERTIBLE DEBENTURES (EQUITY COMPONENT) (note 5) Balance, beginning of period 7,818 - Balance, end of period 7,818 - CONTRIBUTED SURPLUS Balance, beginning of period 54,418 50,706 Share-based compensation expense 1,098 1,371 Adjustment of share-based compensation expense for forfeitures of unvested share options (66) (628) Balance, end of period 55,450 51,449 RETAINED EARNINGS (DEFICIT) Balance, beginning of period (266,902) (240,234) Net profit 13,049 19,347 Balance, end of period (253,853) (220,887) TOTAL SHAREHOLDERS' EQUITY $ 877,502 $ 830,662 See accompanying notes to the condensed consolidated financial statements.
(unaudited, expressed in Canadian dollars)
CONDENSED CONSOLIDATED STATEMENTS OFSHAREHOLDERS’ EQUITY
41 BELLATRIX EXPLORATION LTD.
q1FIRST QUARTER 2017 REPORT
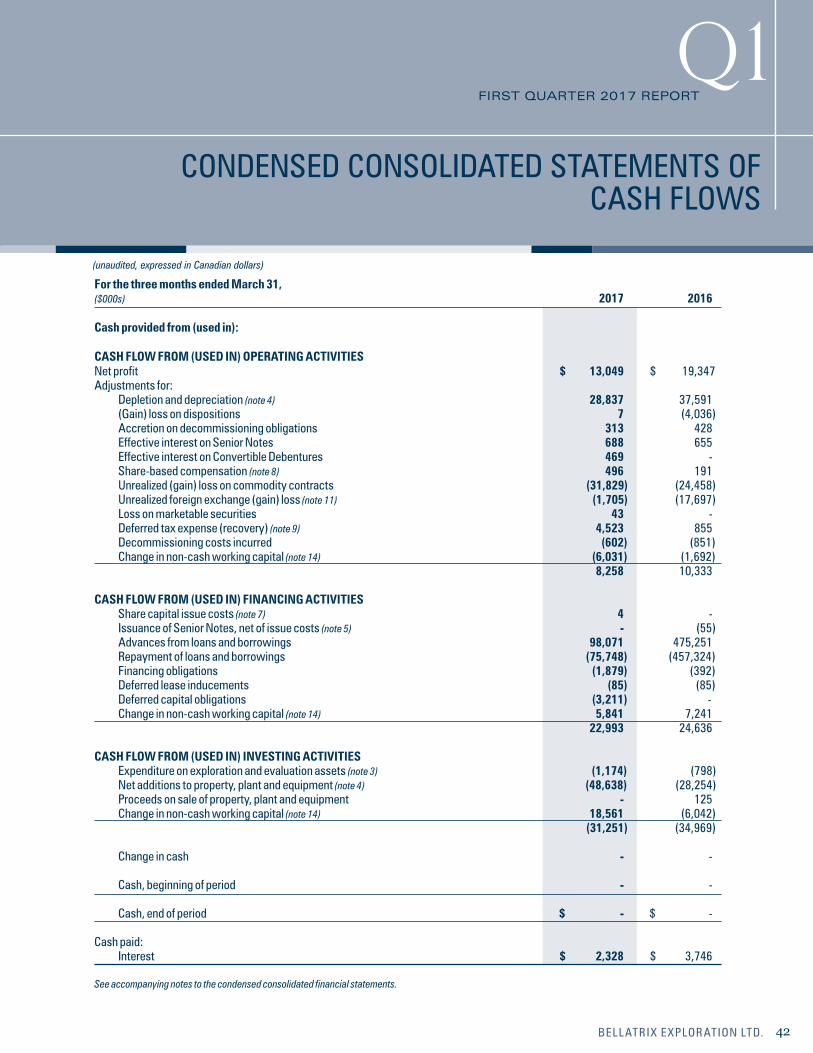
For the three months ended March 31, ($000s) 2017 2016 Cash provided from (used in): CASH FLOW FROM (USED IN) OPERATING ACTIVITIES Net profit $ 13,049 $ 19,347Adjustments for: Depletion and depreciation (note 4) 28,837 37,591 (Gain) loss on dispositions 7 (4,036) Accretion on decommissioning obligations 313 428 Effective interest on Senior Notes 688 655 Effective interest on Convertible Debentures 469 - Share-based compensation (note 8) 496 191 Unrealized (gain) loss on commodity contracts (31,829) (24,458) Unrealized foreign exchange (gain) loss (note 11) (1,705) (17,697) Loss on marketable securities 43 - Deferred tax expense (recovery) (note 9) 4,523 855 Decommissioning costs incurred (602) (851) Change in non-cash working capital (note 14) (6,031) (1,692) 8,258 10,333 CASH FLOW FROM (USED IN) FINANCING ACTIVITIES Share capital issue costs (note 7) 4 - Issuance of Senior Notes, net of issue costs (note 5) - (55) Advances from loans and borrowings 98,071 475,251 Repayment of loans and borrowings (75,748) (457,324) Financing obligations (1,879) (392) Deferred lease inducements (85) (85) Deferred capital obligations (3,211) - Change in non-cash working capital (note 14) 5,841 7,241 22,993 24,636 CASH FLOW FROM (USED IN) INVESTING ACTIVITIES Expenditure on exploration and evaluation assets (note 3) (1,174) (798) Net additions to property, plant and equipment (note 4) (48,638) (28,254) Proceeds on sale of property, plant and equipment - 125 Change in non-cash working capital (note 14) 18,561 (6,042) (31,251) (34,969) Change in cash - - Cash, beginning of period - - Cash, end of period $ - $ - Cash paid: Interest $ 2,328 $ 3,746 See accompanying notes to the condensed consolidated financial statements.
(unaudited, expressed in Canadian dollars)
42BELLATRIX EXPLORATION LTD.
q1FIRST QUARTER 2017 REPORT
CONDENSED CONSOLIDATED STATEMENTS OFCASH FLOWS
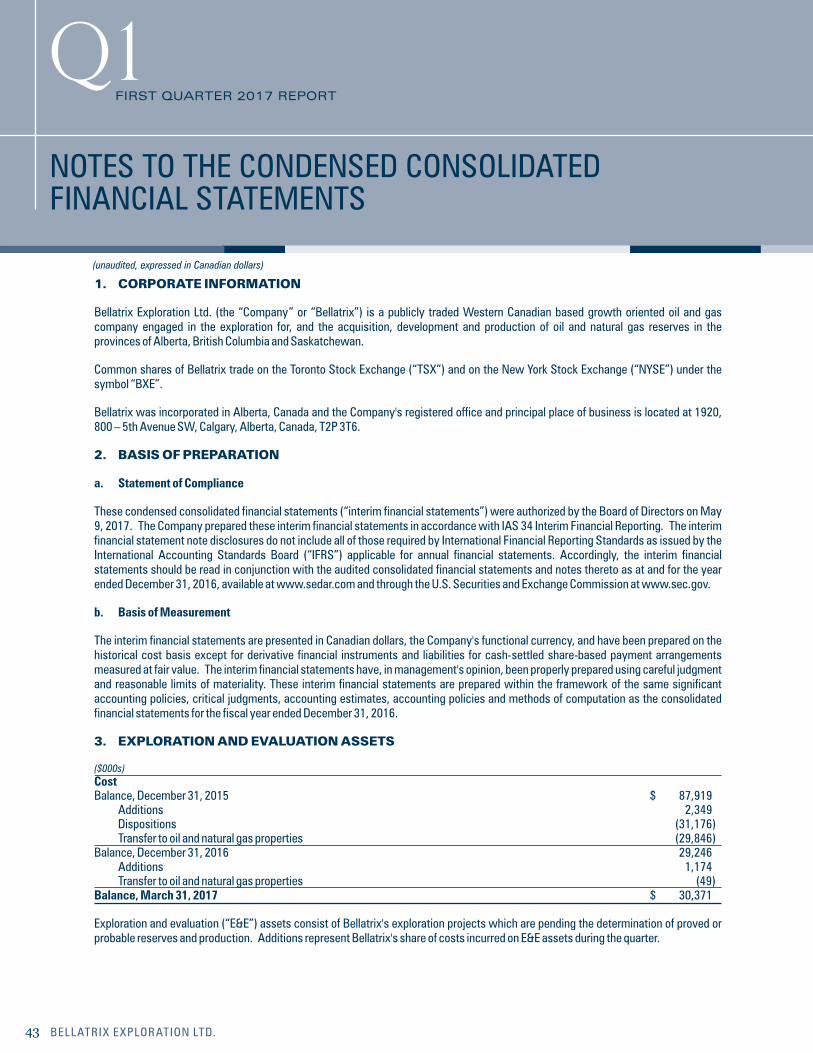
1. CORPORATE INFORMATION
Bellatrix Exploration Ltd. (the “Company” or “Bellatrix”) is a publicly traded Western Canadian based growth oriented oil and gas company engaged in the exploration for, and the acquisition, development and production of oil and natural gas reserves in the provinces of Alberta, British Columbia and Saskatchewan.
Common shares of Bellatrix trade on the Toronto Stock Exchange (“TSX”) and on the New York Stock Exchange (“NYSE”) under the symbol “BXE”.
Bellatrix was incorporated in Alberta, Canada and the Company's registered office and principal place of business is located at 1920, 800 – 5th Avenue SW, Calgary, Alberta, Canada, T2P 3T6. 2. BASIS OF PREPARATION
a. Statement of Compliance
These condensed consolidated financial statements (“interim financial statements”) were authorized by the Board of Directors on May 9, 2017. The Company prepared these interim financial statements in accordance with IAS 34 Interim Financial Reporting. The interim financial statement note disclosures do not include all of those required by International Financial Reporting Standards as issued by the International Accounting Standards Board (“IFRS”) applicable for annual financial statements. Accordingly, the interim financial statements should be read in conjunction with the audited consolidated financial statements and notes thereto as at and for the year ended December 31, 2016, available at www.sedar.com and through the U.S. Securities and Exchange Commission at www.sec.gov.
b. Basis of Measurement
The interim financial statements are presented in Canadian dollars, the Company's functional currency, and have been prepared on the historical cost basis except for derivative financial instruments and liabilities for cash-settled share-based payment arrangements measured at fair value. The interim financial statements have, in management's opinion, been properly prepared using careful judgment and reasonable limits of materiality. These interim financial statements are prepared within the framework of the same significant accounting policies, critical judgments, accounting estimates, accounting policies and methods of computation as the consolidated financial statements for the fiscal year ended December 31, 2016. 3. EXPLORATION AND EVALUATION ASSETS
($000s) Cost Balance, December 31, 2015 $ 87,919 Additions 2,349 Dispositions (31,176) Transfer to oil and natural gas properties (29,846)Balance, December 31, 2016 29,246 Additions 1,174 Transfer to oil and natural gas properties (49)Balance, March 31, 2017 $ 30,371
Exploration and evaluation (“E&E”) assets consist of Bellatrix's exploration projects which are pending the determination of proved or probable reserves and production. Additions represent Bellatrix's share of costs incurred on E&E assets during the quarter.
(unaudited, expressed in Canadian dollars)
NOTES TO THE CONDENSED CONSOLIDATEDFINANCIAL STATEMENTS
43 BELLATRIX EXPLORATION LTD.
q1FIRST QUARTER 2017 REPORT
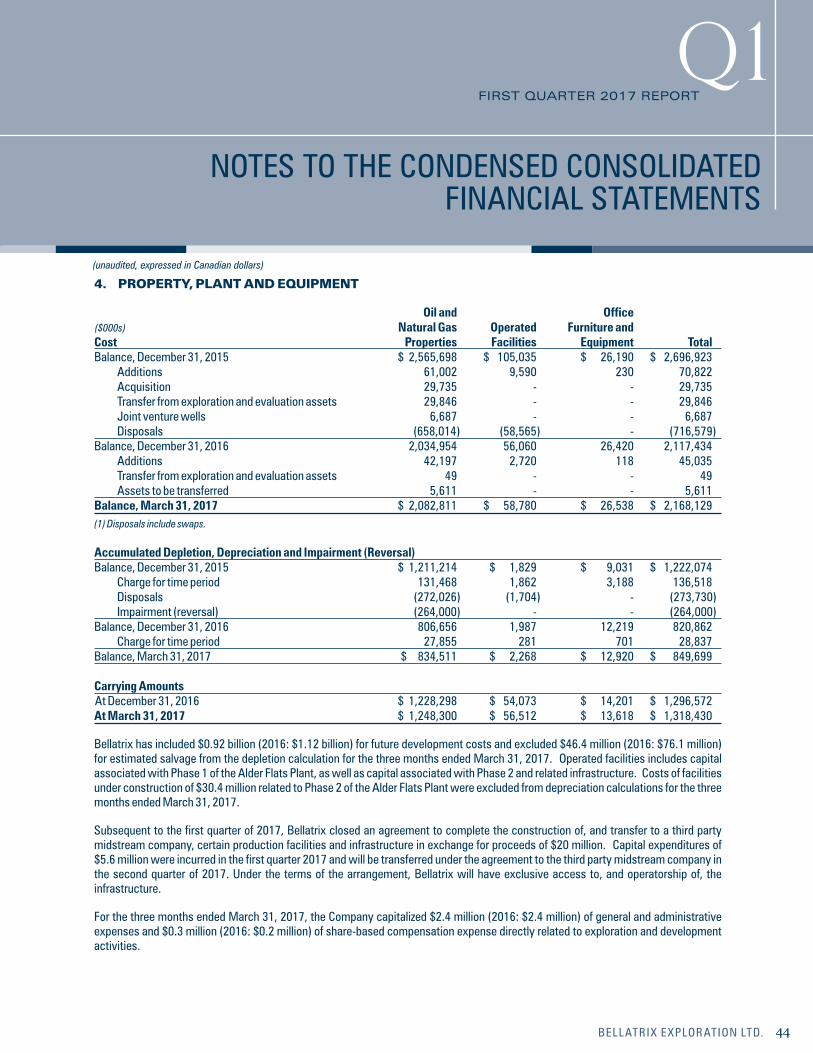
4. PROPERTY, PLANT AND EQUIPMENT
Oil and Office ($000s) Natural Gas Operated Furniture andCost Properties Facilities Equipment TotalBalance, December 31, 2015 $ 2,565,698 $ 105,035 $ 26,190 $ 2,696,923 Additions 61,002 9,590 230 70,822 Acquisition 29,735 - - 29,735 Transfer from exploration and evaluation assets 29,846 - - 29,846 Joint venture wells 6,687 - - 6,687 Disposals (658,014) (58,565) - (716,579)Balance, December 31, 2016 2,034,954 56,060 26,420 2,117,434 Additions 42,197 2,720 118 45,035 Transfer from exploration and evaluation assets 49 - - 49 Assets to be transferred 5,611 - - 5,611Balance, March 31, 2017 $ 2,082,811 $ 58,780 $ 26,538 $ 2,168,129(1) Disposals include swaps. Accumulated Depletion, Depreciation and Impairment (Reversal) Balance, December 31, 2015 $ 1,211,214 $ 1,829 $ 9,031 $ 1,222,074 Charge for time period 131,468 1,862 3,188 136,518 Disposals (272,026) (1,704) - (273,730) Impairment (reversal) (264,000) - - (264,000)Balance, December 31, 2016 806,656 1,987 12,219 820,862 Charge for time period 27,855 281 701 28,837Balance, March 31, 2017 $ 834,511 $ 2,268 $ 12,920 $ 849,699 Carrying Amounts At December 31, 2016 $ 1,228,298 $ 54,073 $ 14,201 $ 1,296,572At March 31, 2017 $ 1,248,300 $ 56,512 $ 13,618 $ 1,318,430
Bellatrix has included $0.92 billion (2016: $1.12 billion) for future development costs and excluded $46.4 million (2016: $76.1 million) for estimated salvage from the depletion calculation for the three months ended March 31, 2017. Operated facilities includes capital associated with Phase 1 of the Alder Flats Plant, as well as capital associated with Phase 2 and related infrastructure. Costs of facilities under construction of $30.4 million related to Phase 2 of the Alder Flats Plant were excluded from depreciation calculations for the three months ended March 31, 2017.
Subsequent to the first quarter of 2017, Bellatrix closed an agreement to complete the construction of, and transfer to a third party midstream company, certain production facilities and infrastructure in exchange for proceeds of $20 million. Capital expenditures of $5.6 million were incurred in the first quarter 2017 and will be transferred under the agreement to the third party midstream company in the second quarter of 2017. Under the terms of the arrangement, Bellatrix will have exclusive access to, and operatorship of, the infrastructure.
For the three months ended March 31, 2017, the Company capitalized $2.4 million (2016: $2.4 million) of general and administrative expenses and $0.3 million (2016: $0.2 million) of share-based compensation expense directly related to exploration and development activities.
(unaudited, expressed in Canadian dollars)
44BELLATRIX EXPLORATION LTD.
q1FIRST QUARTER 2017 REPORT
NOTES TO THE CONDENSED CONSOLIDATEDFINANCIAL STATEMENTS
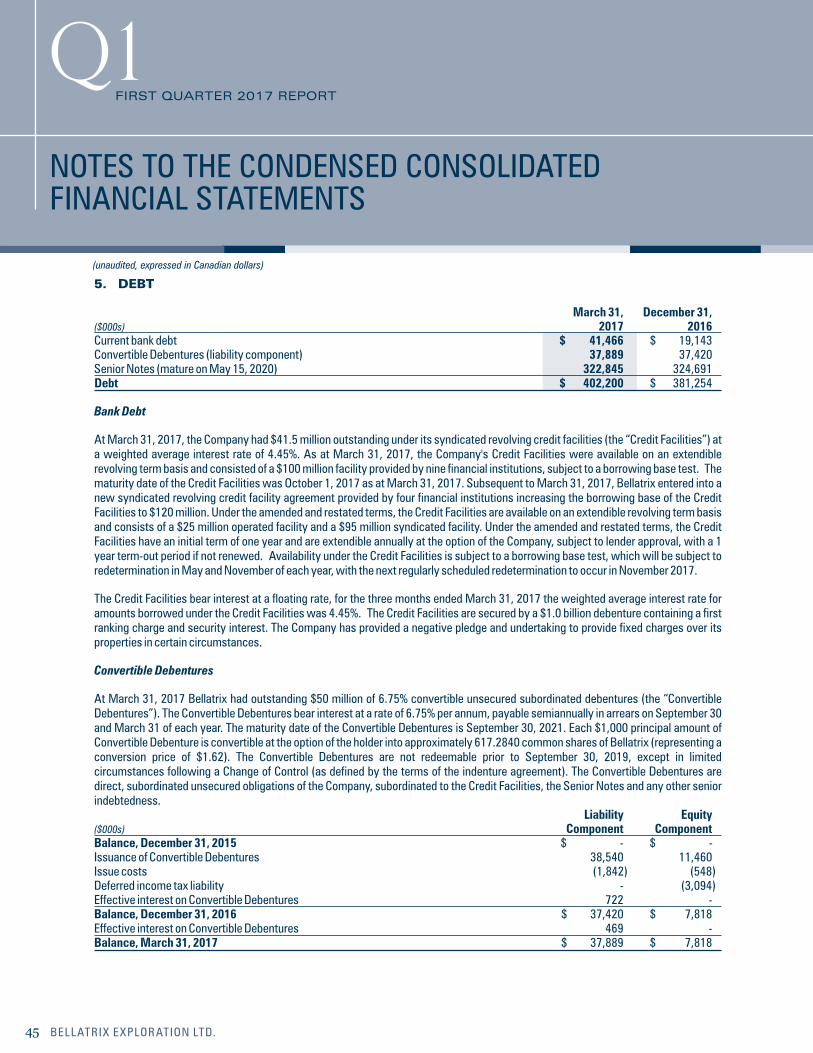
5. DEBT
March 31, December 31,($000s) 2017 2016Current bank debt $ 41,466 $ 19,143Convertible Debentures (liability component) 37,889 37,420Senior Notes (mature on May 15, 2020) 322,845 324,691Debt $ 402,200 $ 381,254
Bank Debt
At March 31, 2017, the Company had $41.5 million outstanding under its syndicated revolving credit facilities (the “Credit Facilities”) at a weighted average interest rate of 4.45%. As at March 31, 2017, the Company's Credit Facilities were available on an extendible revolving term basis and consisted of a $100 million facility provided by nine financial institutions, subject to a borrowing base test. The maturity date of the Credit Facilities was October 1, 2017 as at March 31, 2017. Subsequent to March 31, 2017, Bellatrix entered into a new syndicated revolving credit facility agreement provided by four financial institutions increasing the borrowing base of the Credit Facilities to $120 million. Under the amended and restated terms, the Credit Facilities are available on an extendible revolving term basis and consists of a $25 million operated facility and a $95 million syndicated facility. Under the amended and restated terms, the Credit Facilities have an initial term of one year and are extendible annually at the option of the Company, subject to lender approval, with a 1 year term-out period if not renewed. Availability under the Credit Facilities is subject to a borrowing base test, which will be subject to redetermination in May and November of each year, with the next regularly scheduled redetermination to occur in November 2017.
The Credit Facilities bear interest at a floating rate, for the three months ended March 31, 2017 the weighted average interest rate for amounts borrowed under the Credit Facilities was 4.45%. The Credit Facilities are secured by a $1.0 billion debenture containing a first ranking charge and security interest. The Company has provided a negative pledge and undertaking to provide fixed charges over its properties in certain circumstances.
Convertible Debentures
At March 31, 2017 Bellatrix had outstanding $50 million of 6.75% convertible unsecured subordinated debentures (the “Convertible Debentures”). The Convertible Debentures bear interest at a rate of 6.75% per annum, payable semiannually in arrears on September 30 and March 31 of each year. The maturity date of the Convertible Debentures is September 30, 2021. Each $1,000 principal amount of Convertible Debenture is convertible at the option of the holder into approximately 617.2840 common shares of Bellatrix (representing a conversion price of $1.62). The Convertible Debentures are not redeemable prior to September 30, 2019, except in limited circumstances following a Change of Control (as defined by the terms of the indenture agreement). The Convertible Debentures are direct, subordinated unsecured obligations of the Company, subordinated to the Credit Facilities, the Senior Notes and any other senior indebtedness. Liability Equity($000s) Component ComponentBalance, December 31, 2015 $ - $ -Issuance of Convertible Debentures 38,540 11,460Issue costs (1,842) (548)Deferred income tax liability - (3,094)Effective interest on Convertible Debentures 722 -Balance, December 31, 2016 $ 37,420 $ 7,818Effective interest on Convertible Debentures 469 -Balance, March 31, 2017 $ 37,889 $ 7,818
(unaudited, expressed in Canadian dollars)
NOTES TO THE CONDENSED CONSOLIDATEDFINANCIAL STATEMENTS
45 BELLATRIX EXPLORATION LTD.
q1FIRST QUARTER 2017 REPORT
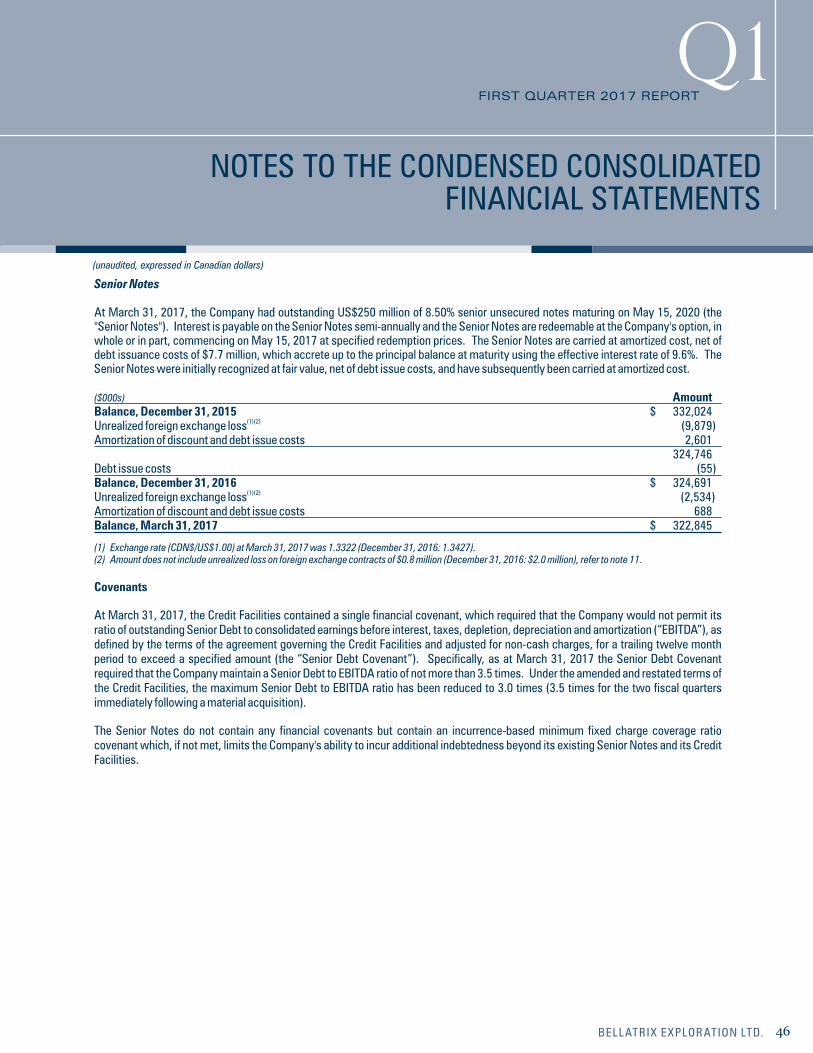
Senior Notes
At March 31, 2017, the Company had outstanding US$250 million of 8.50% senior unsecured notes maturing on May 15, 2020 (the "Senior Notes"). Interest is payable on the Senior Notes semi-annually and the Senior Notes are redeemable at the Company's option, in whole or in part, commencing on May 15, 2017 at specified redemption prices. The Senior Notes are carried at amortized cost, net of debt issuance costs of $7.7 million, which accrete up to the principal balance at maturity using the effective interest rate of 9.6%. The Senior Notes were initially recognized at fair value, net of debt issue costs, and have subsequently been carried at amortized cost.
($000s) AmountBalance, December 31, 2015 $ 332,024
(1) (2)Unrealized foreign exchange loss (9,879)Amortization of discount and debt issue costs 2,601 324,746Debt issue costs (55)Balance, December 31, 2016 $ 324,691
(1) (2)Unrealized foreign exchange loss (2,534)Amortization of discount and debt issue costs 688Balance, March 31, 2017 $ 322,845
(1) Exchange rate (CDN$/US$1.00) at March 31, 2017 was 1.3322 (December 31, 2016: 1.3427).(2) Amount does not include unrealized loss on foreign exchange contracts of $0.8 million (December 31, 2016: $2.0 million), refer to note 11.
Covenants
At March 31, 2017, the Credit Facilities contained a single financial covenant, which required that the Company would not permit its ratio of outstanding Senior Debt to consolidated earnings before interest, taxes, depletion, depreciation and amortization (“EBITDA”), as defined by the terms of the agreement governing the Credit Facilities and adjusted for non-cash charges, for a trailing twelve month period to exceed a specified amount (the “Senior Debt Covenant”). Specifically, as at March 31, 2017 the Senior Debt Covenant required that the Company maintain a Senior Debt to EBITDA ratio of not more than 3.5 times. Under the amended and restated terms of the Credit Facilities, the maximum Senior Debt to EBITDA ratio has been reduced to 3.0 times (3.5 times for the two fiscal quarters immediately following a material acquisition).
The Senior Notes do not contain any financial covenants but contain an incurrence-based minimum fixed charge coverage ratio covenant which, if not met, limits the Company's ability to incur additional indebtedness beyond its existing Senior Notes and its Credit Facilities.
(unaudited, expressed in Canadian dollars)
46BELLATRIX EXPLORATION LTD.
q1FIRST QUARTER 2017 REPORT
NOTES TO THE CONDENSED CONSOLIDATEDFINANCIAL STATEMENTS
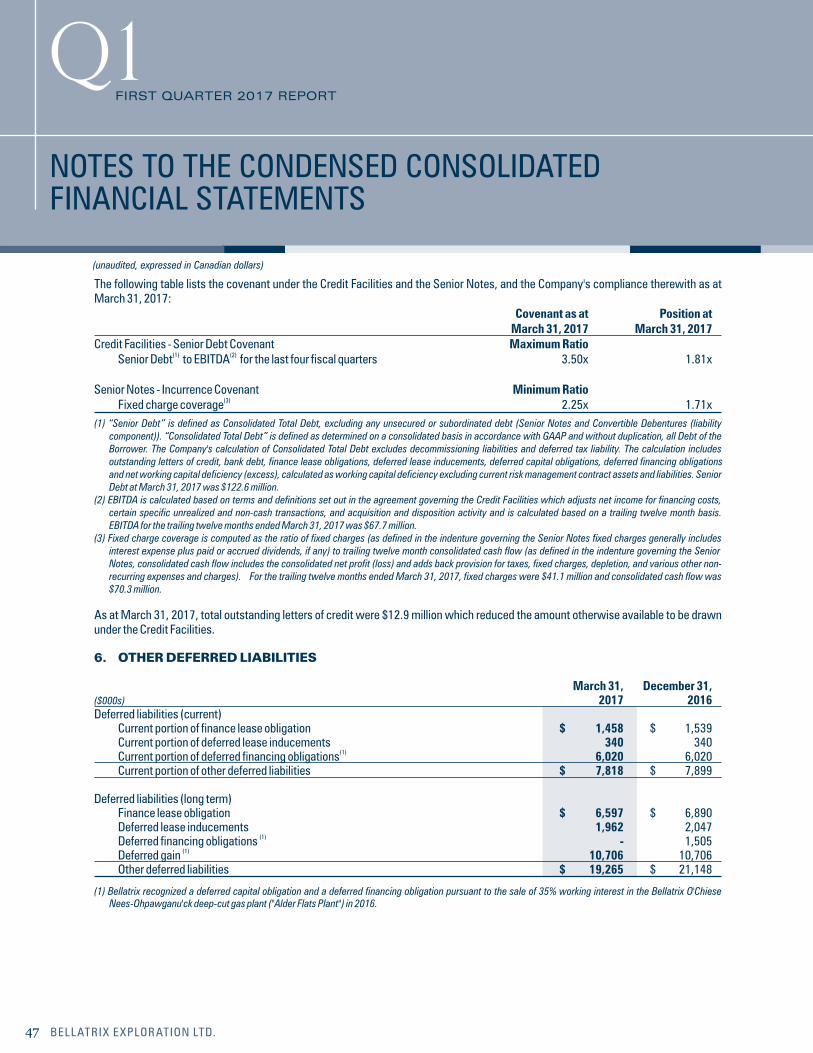
The following table lists the covenant under the Credit Facilities and the Senior Notes, and the Company's compliance therewith as at March 31, 2017: Covenant as at Position at March 31, 2017 March 31, 2017Credit Facilities - Senior Debt Covenant Maximum Ratio
(1) (2) Senior Debt to EBITDA for the last four fiscal quarters 3.50x 1.81x Senior Notes - Incurrence Covenant Minimum Ratio
(3) Fixed charge coverage 2.25x 1.71x(1) “Senior Debt” is defined as Consolidated Total Debt, excluding any unsecured or subordinated debt (Senior Notes and Convertible Debentures (liability
component)). “Consolidated Total Debt” is defined as determined on a consolidated basis in accordance with GAAP and without duplication, all Debt of the Borrower. The Company's calculation of Consolidated Total Debt excludes decommissioning liabilities and deferred tax liability. The calculation includes outstanding letters of credit, bank debt, finance lease obligations, deferred lease inducements, deferred capital obligations, deferred financing obligations and net working capital deficiency (excess), calculated as working capital deficiency excluding current risk management contract assets and liabilities. Senior Debt at March 31, 2017 was $122.6 million.
(2) EBITDA is calculated based on terms and definitions set out in the agreement governing the Credit Facilities which adjusts net income for financing costs, certain specific unrealized and non-cash transactions, and acquisition and disposition activity and is calculated based on a trailing twelve month basis. EBITDA for the trailing twelve months ended March 31, 2017 was $67.7 million.
(3) Fixed charge coverage is computed as the ratio of fixed charges (as defined in the indenture governing the Senior Notes fixed charges generally includes interest expense plus paid or accrued dividends, if any) to trailing twelve month consolidated cash flow (as defined in the indenture governing the Senior Notes, consolidated cash flow includes the consolidated net profit (loss) and adds back provision for taxes, fixed charges, depletion, and various other non-recurring expenses and charges). For the trailing twelve months ended March 31, 2017, fixed charges were $41.1 million and consolidated cash flow was $70.3 million.
As at March 31, 2017, total outstanding letters of credit were $12.9 million which reduced the amount otherwise available to be drawn under the Credit Facilities.
6. OTHER DEFERRED LIABILITIES
March 31, December 31,($000s) 2017 2016Deferred liabilities (current) Current portion of finance lease obligation $ 1,458 $ 1,539 Current portion of deferred lease inducements 340 340
(1) Current portion of deferred financing obligations 6,020 6,020 Current portion of other deferred liabilities $ 7,818 $ 7,899 Deferred liabilities (long term) Finance lease obligation $ 6,597 $ 6,890 Deferred lease inducements 1,962 2,047
(1) Deferred financing obligations - 1,505(1) Deferred gain 10,706 10,706
Other deferred liabilities $ 19,265 $ 21,148
(1) Bellatrix recognized a deferred capital obligation and a deferred financing obligation pursuant to the sale of 35% working interest in the Bellatrix O'Chiese Nees-Ohpawganu'ck deep-cut gas plant ("Alder Flats Plant") in 2016.
(unaudited, expressed in Canadian dollars)
NOTES TO THE CONDENSED CONSOLIDATEDFINANCIAL STATEMENTS
47 BELLATRIX EXPLORATION LTD.
q1FIRST QUARTER 2017 REPORT
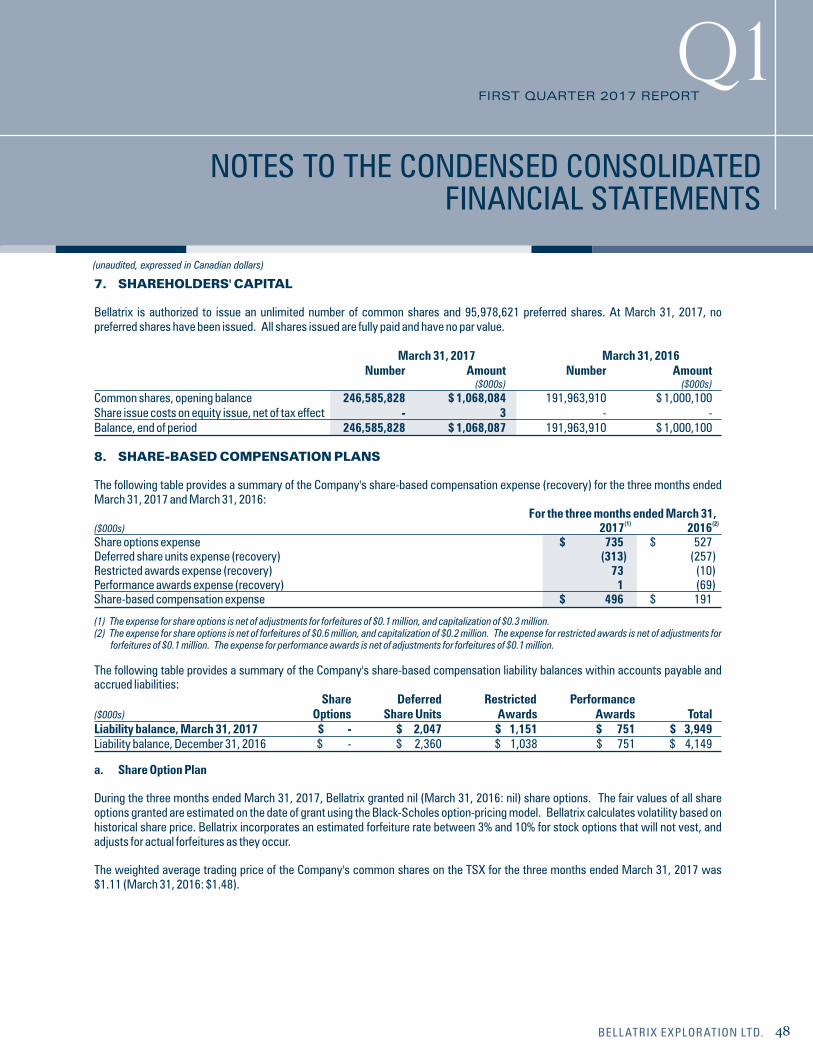
7. SHAREHOLDERS' CAPITAL
Bellatrix is authorized to issue an unlimited number of common shares and 95,978,621 preferred shares. At March 31, 2017, no preferred shares have been issued. All shares issued are fully paid and have no par value.
March 31, 2017 March 31, 2016 Number Amount Number Amount ($000s) ($000s)Common shares, opening balance 246,585,828 $ 1,068,084 191,963,910 $ 1,000,100Share issue costs on equity issue, net of tax effect - 3 - -Balance, end of period 246,585,828 $ 1,068,087 191,963,910 $ 1,000,100
8. SHARE-BASED COMPENSATION PLANS
The following table provides a summary of the Company's share-based compensation expense (recovery) for the three months ended March 31, 2017 and March 31, 2016: For the three months ended March 31,
(1) (2)($000s) 2017 2016Share options expense $ 735 $ 527Deferred share units expense (recovery) (313) (257)Restricted awards expense (recovery) 73 (10)Performance awards expense (recovery) 1 (69)Share-based compensation expense $ 496 $ 191
(1) The expense for share options is net of adjustments for forfeitures of $0.1 million, and capitalization of $0.3 million. (2) The expense for share options is net of forfeitures of $0.6 million, and capitalization of $0.2 million. The expense for restricted awards is net of adjustments for
forfeitures of $0.1 million. The expense for performance awards is net of adjustments for forfeitures of $0.1 million.
The following table provides a summary of the Company's share-based compensation liability balances within accounts payable and accrued liabilities: Share Deferred Restricted Performance ($000s) Options Share Units Awards Awards TotalLiability balance, March 31, 2017 $ - $ 2,047 $ 1,151 $ 751 $ 3,949Liability balance, December 31, 2016 $ - $ 2,360 $ 1,038 $ 751 $ 4,149
a. Share Option Plan
During the three months ended March 31, 2017, Bellatrix granted nil (March 31, 2016: nil) share options. The fair values of all share options granted are estimated on the date of grant using the Black-Scholes option-pricing model. Bellatrix calculates volatility based on historical share price. Bellatrix incorporates an estimated forfeiture rate between 3% and 10% for stock options that will not vest, and adjusts for actual forfeitures as they occur.
The weighted average trading price of the Company's common shares on the TSX for the three months ended March 31, 2017 was $1.11 (March 31, 2016: $1.48).
(unaudited, expressed in Canadian dollars)
48BELLATRIX EXPLORATION LTD.
q1FIRST QUARTER 2017 REPORT
NOTES TO THE CONDENSED CONSOLIDATEDFINANCIAL STATEMENTS
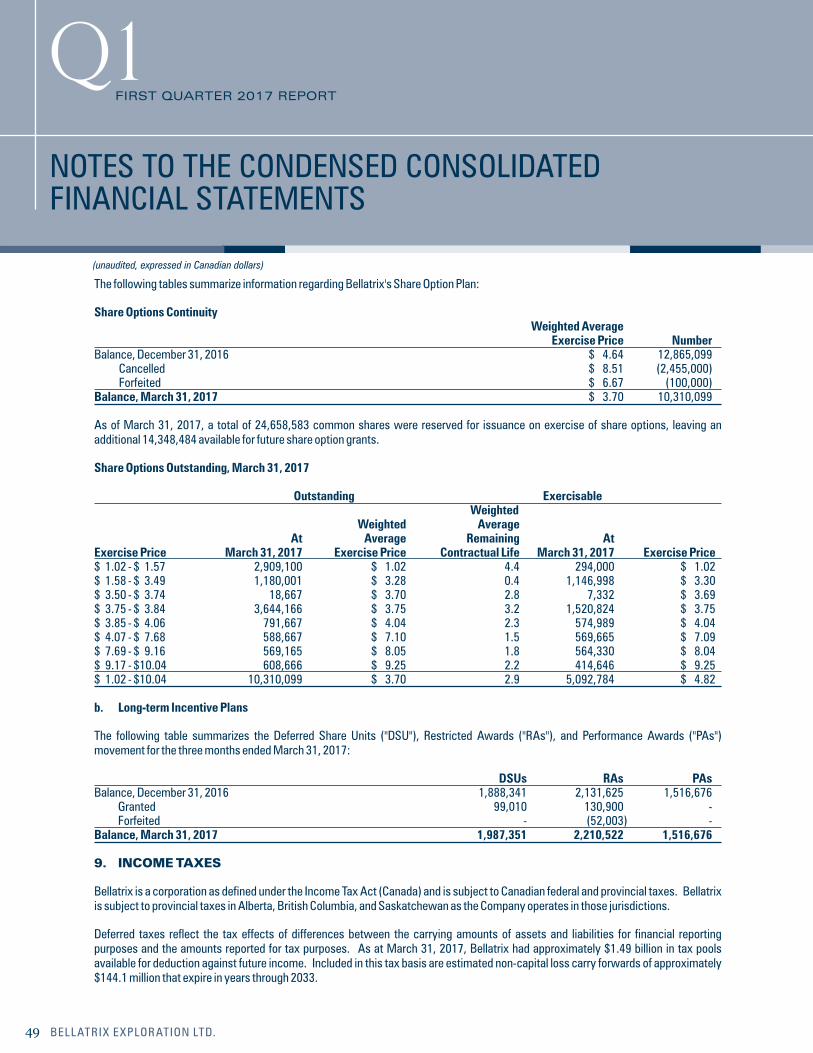
The following tables summarize information regarding Bellatrix's Share Option Plan:
Share Options Continuity Weighted Average Exercise Price NumberBalance, December 31, 2016 $ 4.64 12,865,099 Cancelled $ 8.51 (2,455,000) Forfeited $ 6.67 (100,000)Balance, March 31, 2017 $ 3.70 10,310,099
As of March 31, 2017, a total of 24,658,583 common shares were reserved for issuance on exercise of share options, leaving an additional 14,348,484 available for future share option grants.
Share Options Outstanding, March 31, 2017 Outstanding Exercisable Weighted Weighted Average At Average Remaining At Exercise Price March 31, 2017 Exercise Price Contractual Life March 31, 2017 Exercise Price$ 1.02 - $ 1.57 2,909,100 $ 1.02 4.4 294,000 $ 1.02$ 1.58 - $ 3.49 1,180,001 $ 3.28 0.4 1,146,998 $ 3.30$ 3.50 - $ 3.74 18,667 $ 3.70 2.8 7,332 $ 3.69$ 3.75 - $ 3.84 3,644,166 $ 3.75 3.2 1,520,824 $ 3.75$ 3.85 - $ 4.06 791,667 $ 4.04 2.3 574,989 $ 4.04$ 4.07 - $ 7.68 588,667 $ 7.10 1.5 569,665 $ 7.09$ 7.69 - $ 9.16 569,165 $ 8.05 1.8 564,330 $ 8.04$ 9.17 - $10.04 608,666 $ 9.25 2.2 414,646 $ 9.25$ 1.02 - $10.04 10,310,099 $ 3.70 2.9 5,092,784 $ 4.82
b. Long-term Incentive Plans
The following table summarizes the Deferred Share Units ("DSU"), Restricted Awards ("RAs"), and Performance Awards ("PAs") movement for the three months ended March 31, 2017:
DSUs RAs PAsBalance, December 31, 2016 1,888,341 2,131,625 1,516,676 Granted 99,010 130,900 - Forfeited - (52,003) -Balance, March 31, 2017 1,987,351 2,210,522 1,516,676
9. INCOME TAXES
Bellatrix is a corporation as defined under the Income Tax Act (Canada) and is subject to Canadian federal and provincial taxes. Bellatrix is subject to provincial taxes in Alberta, British Columbia, and Saskatchewan as the Company operates in those jurisdictions.
Deferred taxes reflect the tax effects of differences between the carrying amounts of assets and liabilities for financial reporting purposes and the amounts reported for tax purposes. As at March 31, 2017, Bellatrix had approximately $1.49 billion in tax pools available for deduction against future income. Included in this tax basis are estimated non-capital loss carry forwards of approximately $144.1 million that expire in years through 2033.
(unaudited, expressed in Canadian dollars)
NOTES TO THE CONDENSED CONSOLIDATEDFINANCIAL STATEMENTS
49 BELLATRIX EXPLORATION LTD.
q1FIRST QUARTER 2017 REPORT
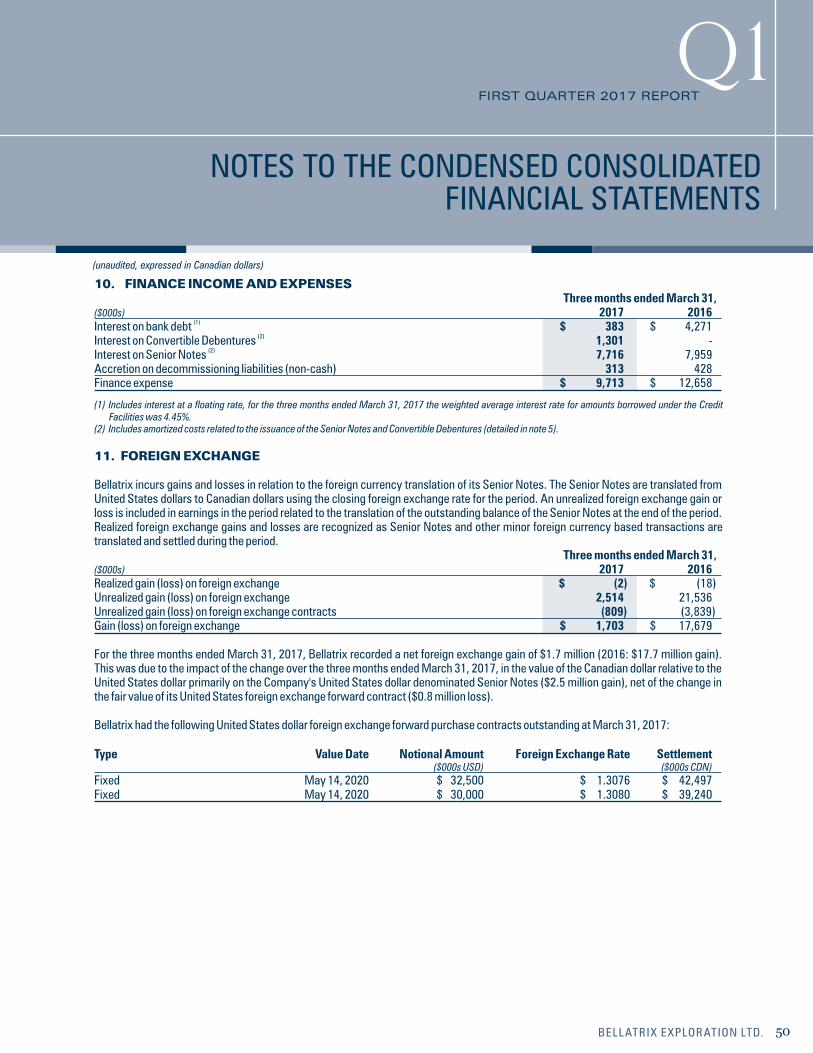
10. FINANCE INCOME AND EXPENSES Three months ended March 31, ($000s) 2017 2016
(1)Interest on bank debt $ 383 $ 4,271(2)Interest on Convertible Debentures 1,301 -
(2)Interest on Senior Notes 7,716 7,959Accretion on decommissioning liabilities (non-cash) 313 428Finance expense $ 9,713 $ 12,658
(1) Includes interest at a floating rate, for the three months ended March 31, 2017 the weighted average interest rate for amounts borrowed under the Credit Facilities was 4.45%.
(2) Includes amortized costs related to the issuance of the Senior Notes and Convertible Debentures (detailed in note 5).
11. FOREIGN EXCHANGE
Bellatrix incurs gains and losses in relation to the foreign currency translation of its Senior Notes. The Senior Notes are translated from United States dollars to Canadian dollars using the closing foreign exchange rate for the period. An unrealized foreign exchange gain or loss is included in earnings in the period related to the translation of the outstanding balance of the Senior Notes at the end of the period. Realized foreign exchange gains and losses are recognized as Senior Notes and other minor foreign currency based transactions are translated and settled during the period. Three months ended March 31, ($000s) 2017 2016Realized gain (loss) on foreign exchange $ (2) $ (18) Unrealized gain (loss) on foreign exchange 2,514 21,536Unrealized gain (loss) on foreign exchange contracts (809) (3,839)Gain (loss) on foreign exchange $ 1,703 $ 17,679
For the three months ended March 31, 2017, Bellatrix recorded a net foreign exchange gain of $1.7 million (2016: $17.7 million gain). This was due to the impact of the change over the three months ended March 31, 2017, in the value of the Canadian dollar relative to the United States dollar primarily on the Company's United States dollar denominated Senior Notes ($2.5 million gain), net of the change in the fair value of its United States foreign exchange forward contract ($0.8 million loss).
Bellatrix had the following United States dollar foreign exchange forward purchase contracts outstanding at March 31, 2017:
Type Value Date Notional Amount Foreign Exchange Rate Settlement ($000s USD) ($000s CDN)Fixed May 14, 2020 $ 32,500 $ 1.3076 $ 42,497Fixed May 14, 2020 $ 30,000 $ 1.3080 $ 39,240
(unaudited, expressed in Canadian dollars)
50BELLATRIX EXPLORATION LTD.
q1FIRST QUARTER 2017 REPORT
NOTES TO THE CONDENSED CONSOLIDATEDFINANCIAL STATEMENTS
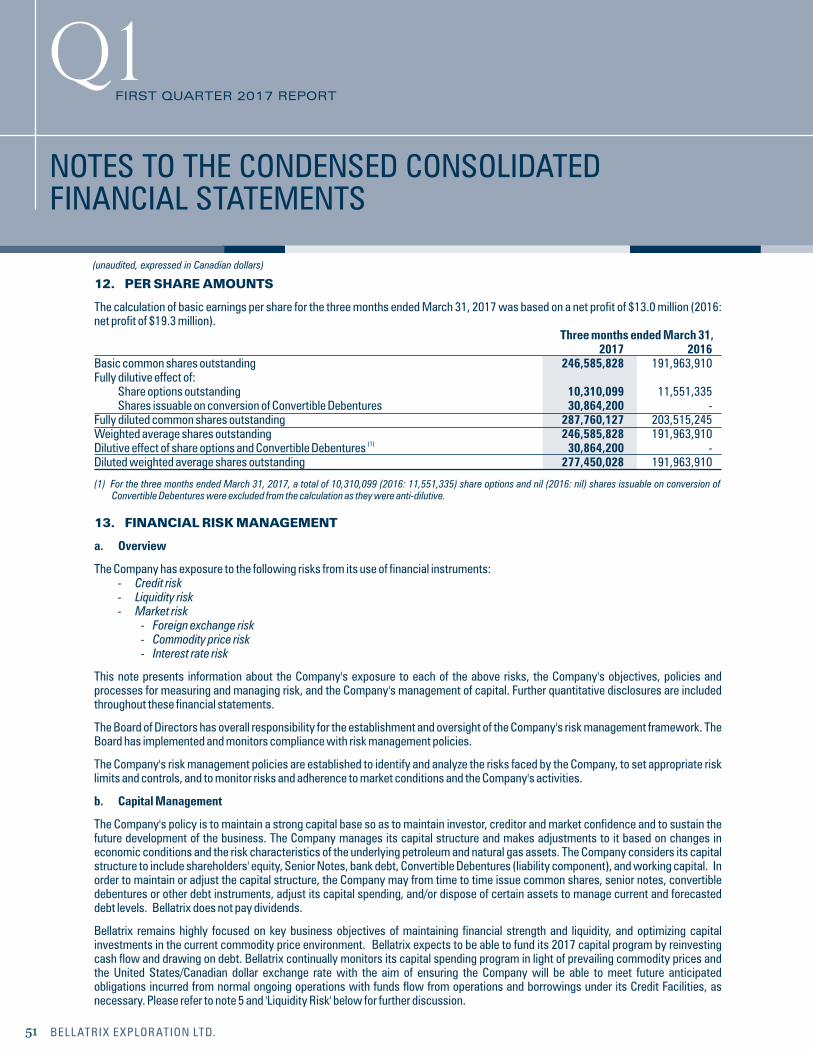
12. PER SHARE AMOUNTS
The calculation of basic earnings per share for the three months ended March 31, 2017 was based on a net profit of $13.0 million (2016: net profit of $19.3 million). Three months ended March 31, 2017 2016Basic common shares outstanding 246,585,828 191,963,910Fully dilutive effect of: Share options outstanding 10,310,099 11,551,335 Shares issuable on conversion of Convertible Debentures 30,864,200 -Fully diluted common shares outstanding 287,760,127 203,515,245Weighted average shares outstanding 246,585,828 191,963,910
(1)Dilutive effect of share options and Convertible Debentures 30,864,200 -Diluted weighted average shares outstanding 277,450,028 191,963,910
(1) For the three months ended March 31, 2017, a total of 10,310,099 (2016: 11,551,335) share options and nil (2016: nil) shares issuable on conversion of Convertible Debentures were excluded from the calculation as they were anti-dilutive.
13. FINANCIAL RISK MANAGEMENT
a. Overview
The Company has exposure to the following risks from its use of financial instruments: - Credit risk - Liquidity risk - Market risk - Foreign exchange risk - Commodity price risk - Interest rate risk
This note presents information about the Company's exposure to each of the above risks, the Company's objectives, policies and processes for measuring and managing risk, and the Company's management of capital. Further quantitative disclosures are included throughout these financial statements.
The Board of Directors has overall responsibility for the establishment and oversight of the Company's risk management framework. The Board has implemented and monitors compliance with risk management policies.
The Company's risk management policies are established to identify and analyze the risks faced by the Company, to set appropriate risk limits and controls, and to monitor risks and adherence to market conditions and the Company's activities.
b. Capital Management
The Company's policy is to maintain a strong capital base so as to maintain investor, creditor and market confidence and to sustain the future development of the business. The Company manages its capital structure and makes adjustments to it based on changes in economic conditions and the risk characteristics of the underlying petroleum and natural gas assets. The Company considers its capital structure to include shareholders' equity, Senior Notes, bank debt, Convertible Debentures (liability component), and working capital. In order to maintain or adjust the capital structure, the Company may from time to time issue common shares, senior notes, convertible debentures or other debt instruments, adjust its capital spending, and/or dispose of certain assets to manage current and forecasted debt levels. Bellatrix does not pay dividends.
Bellatrix remains highly focused on key business objectives of maintaining financial strength and liquidity, and optimizing capital investments in the current commodity price environment. Bellatrix expects to be able to fund its 2017 capital program by reinvesting cash flow and drawing on debt. Bellatrix continually monitors its capital spending program in light of prevailing commodity prices and the United States/Canadian dollar exchange rate with the aim of ensuring the Company will be able to meet future anticipated obligations incurred from normal ongoing operations with funds flow from operations and borrowings under its Credit Facilities, as necessary. Please refer to note 5 and 'Liquidity Risk' below for further discussion.
(unaudited, expressed in Canadian dollars)
NOTES TO THE CONDENSED CONSOLIDATEDFINANCIAL STATEMENTS
51 BELLATRIX EXPLORATION LTD.
q1FIRST QUARTER 2017 REPORT
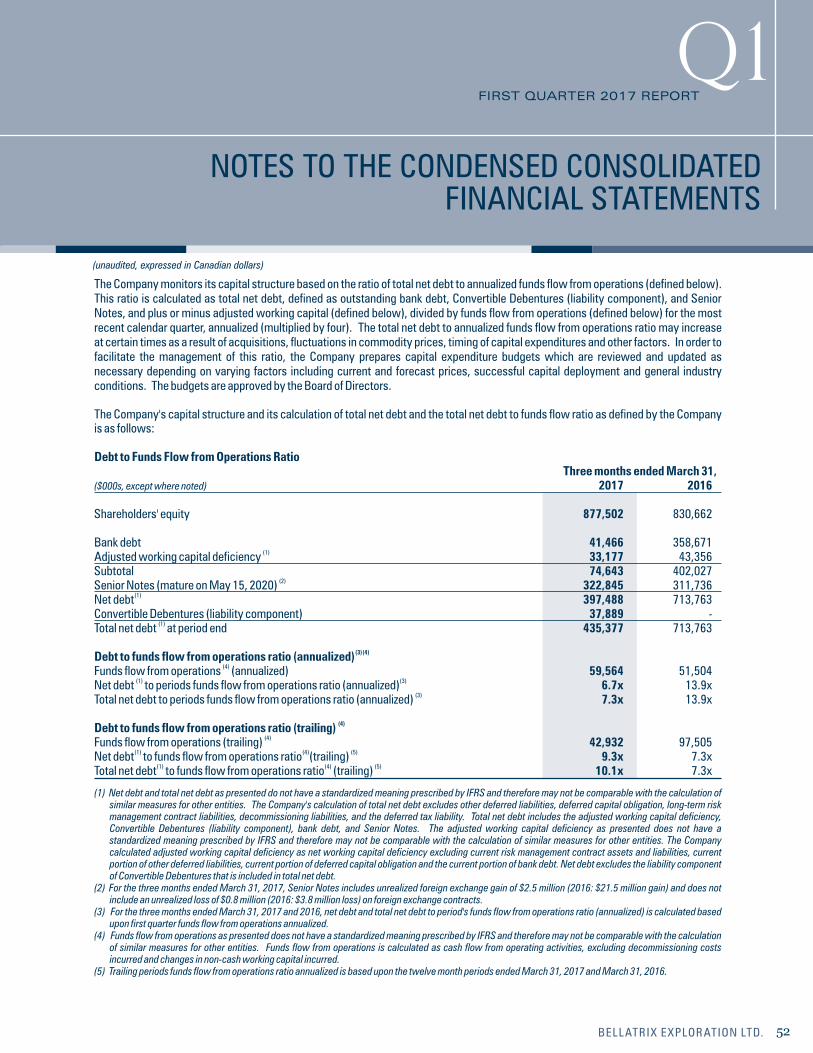
The Company monitors its capital structure based on the ratio of total net debt to annualized funds flow from operations (defined below). This ratio is calculated as total net debt, defined as outstanding bank debt, Convertible Debentures (liability component), and Senior Notes, and plus or minus adjusted working capital (defined below), divided by funds flow from operations (defined below) for the most recent calendar quarter, annualized (multiplied by four). The total net debt to annualized funds flow from operations ratio may increase at certain times as a result of acquisitions, fluctuations in commodity prices, timing of capital expenditures and other factors. In order to facilitate the management of this ratio, the Company prepares capital expenditure budgets which are reviewed and updated as necessary depending on varying factors including current and forecast prices, successful capital deployment and general industry conditions. The budgets are approved by the Board of Directors.
The Company's capital structure and its calculation of total net debt and the total net debt to funds flow ratio as defined by the Company is as follows:
Debt to Funds Flow from Operations Ratio Three months ended March 31,($000s, except where noted) 2017 2016 Shareholders' equity 877,502 830,662 Bank debt 41,466 358,671
(1)Adjusted working capital deficiency 33,177 43,356Subtotal 74,643 402,027
(2)Senior Notes (mature on May 15, 2020) 322,845 311,736 (1)Net debt 397,488 713,763
Convertible Debentures (liability component) 37,889 -(1)Total net debt at period end 435,377 713,763
(3) (4) Debt to funds flow from operations ratio (annualized)
(4)Funds flow from operations (annualized) 59,564 51,504(1) (3)Net debt to periods funds flow from operations ratio (annualized) 6.7x 13.9x
(3)Total net debt to periods funds flow from operations ratio (annualized) 7.3x 13.9x
(4)Debt to funds flow from operations ratio (trailing) (4)Funds flow from operations (trailing) 42,932 97,505
(1) (4) (5)Net debt to funds flow from operations ratio (trailing) 9.3x 7.3x (1) (4) (5) Total net debt to funds flow from operations ratio (trailing) 10.1x 7.3x
(1) Net debt and total net debt as presented do not have a standardized meaning prescribed by IFRS and therefore may not be comparable with the calculation of similar measures for other entities. The Company's calculation of total net debt excludes other deferred liabilities, deferred capital obligation, long-term risk management contract liabilities, decommissioning liabilities, and the deferred tax liability. Total net debt includes the adjusted working capital deficiency, Convertible Debentures (liability component), bank debt, and Senior Notes. The adjusted working capital deficiency as presented does not have a standardized meaning prescribed by IFRS and therefore may not be comparable with the calculation of similar measures for other entities. The Company calculated adjusted working capital deficiency as net working capital deficiency excluding current risk management contract assets and liabilities, current portion of other deferred liabilities, current portion of deferred capital obligation and the current portion of bank debt. Net debt excludes the liability component of Convertible Debentures that is included in total net debt.
(2) For the three months ended March 31, 2017, Senior Notes includes unrealized foreign exchange gain of $2.5 million (2016: $21.5 million gain) and does not include an unrealized loss of $0.8 million (2016: $3.8 million loss) on foreign exchange contracts.
(3) For the three months ended March 31, 2017 and 2016, net debt and total net debt to period's funds flow from operations ratio (annualized) is calculated based upon first quarter funds flow from operations annualized.
(4) Funds flow from operations as presented does not have a standardized meaning prescribed by IFRS and therefore may not be comparable with the calculation of similar measures for other entities. Funds flow from operations is calculated as cash flow from operating activities, excluding decommissioning costs incurred and changes in non-cash working capital incurred.
(5) Trailing periods funds flow from operations ratio annualized is based upon the twelve month periods ended March 31, 2017 and March 31, 2016.
(unaudited, expressed in Canadian dollars)
52BELLATRIX EXPLORATION LTD.
q1FIRST QUARTER 2017 REPORT
NOTES TO THE CONDENSED CONSOLIDATEDFINANCIAL STATEMENTS
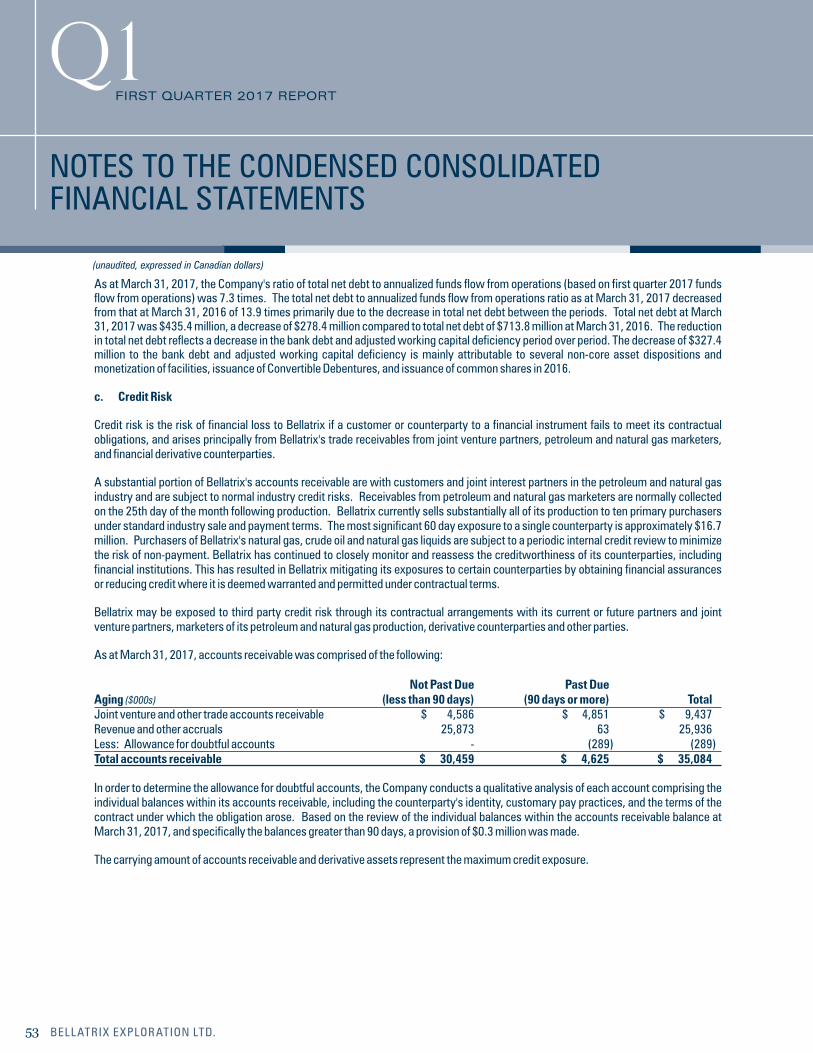
As at March 31, 2017, the Company's ratio of total net debt to annualized funds flow from operations (based on first quarter 2017 funds flow from operations) was 7.3 times. The total net debt to annualized funds flow from operations ratio as at March 31, 2017 decreased from that at March 31, 2016 of 13.9 times primarily due to the decrease in total net debt between the periods. Total net debt at March 31, 2017 was $435.4 million, a decrease of $278.4 million compared to total net debt of $713.8 million at March 31, 2016. The reduction in total net debt reflects a decrease in the bank debt and adjusted working capital deficiency period over period. The decrease of $327.4 million to the bank debt and adjusted working capital deficiency is mainly attributable to several non-core asset dispositions and monetization of facilities, issuance of Convertible Debentures, and issuance of common shares in 2016.
c. Credit Risk
Credit risk is the risk of financial loss to Bellatrix if a customer or counterparty to a financial instrument fails to meet its contractual obligations, and arises principally from Bellatrix's trade receivables from joint venture partners, petroleum and natural gas marketers, and financial derivative counterparties.
A substantial portion of Bellatrix's accounts receivable are with customers and joint interest partners in the petroleum and natural gas industry and are subject to normal industry credit risks. Receivables from petroleum and natural gas marketers are normally collected on the 25th day of the month following production. Bellatrix currently sells substantially all of its production to ten primary purchasers under standard industry sale and payment terms. The most significant 60 day exposure to a single counterparty is approximately $16.7 million. Purchasers of Bellatrix's natural gas, crude oil and natural gas liquids are subject to a periodic internal credit review to minimize the risk of non-payment. Bellatrix has continued to closely monitor and reassess the creditworthiness of its counterparties, including financial institutions. This has resulted in Bellatrix mitigating its exposures to certain counterparties by obtaining financial assurances or reducing credit where it is deemed warranted and permitted under contractual terms.
Bellatrix may be exposed to third party credit risk through its contractual arrangements with its current or future partners and joint venture partners, marketers of its petroleum and natural gas production, derivative counterparties and other parties.
As at March 31, 2017, accounts receivable was comprised of the following:
Not Past Due Past Due Aging ($000s) (less than 90 days) (90 days or more) TotalJoint venture and other trade accounts receivable $ 4,586 $ 4,851 $ 9,437Revenue and other accruals 25,873 63 25,936Less: Allowance for doubtful accounts - (289) (289)Total accounts receivable $ 30,459 $ 4,625 $ 35,084
In order to determine the allowance for doubtful accounts, the Company conducts a qualitative analysis of each account comprising the individual balances within its accounts receivable, including the counterparty's identity, customary pay practices, and the terms of the contract under which the obligation arose. Based on the review of the individual balances within the accounts receivable balance at March 31, 2017, and specifically the balances greater than 90 days, a provision of $0.3 million was made.
The carrying amount of accounts receivable and derivative assets represent the maximum credit exposure.
(unaudited, expressed in Canadian dollars)
NOTES TO THE CONDENSED CONSOLIDATEDFINANCIAL STATEMENTS
53 BELLATRIX EXPLORATION LTD.
q1FIRST QUARTER 2017 REPORT
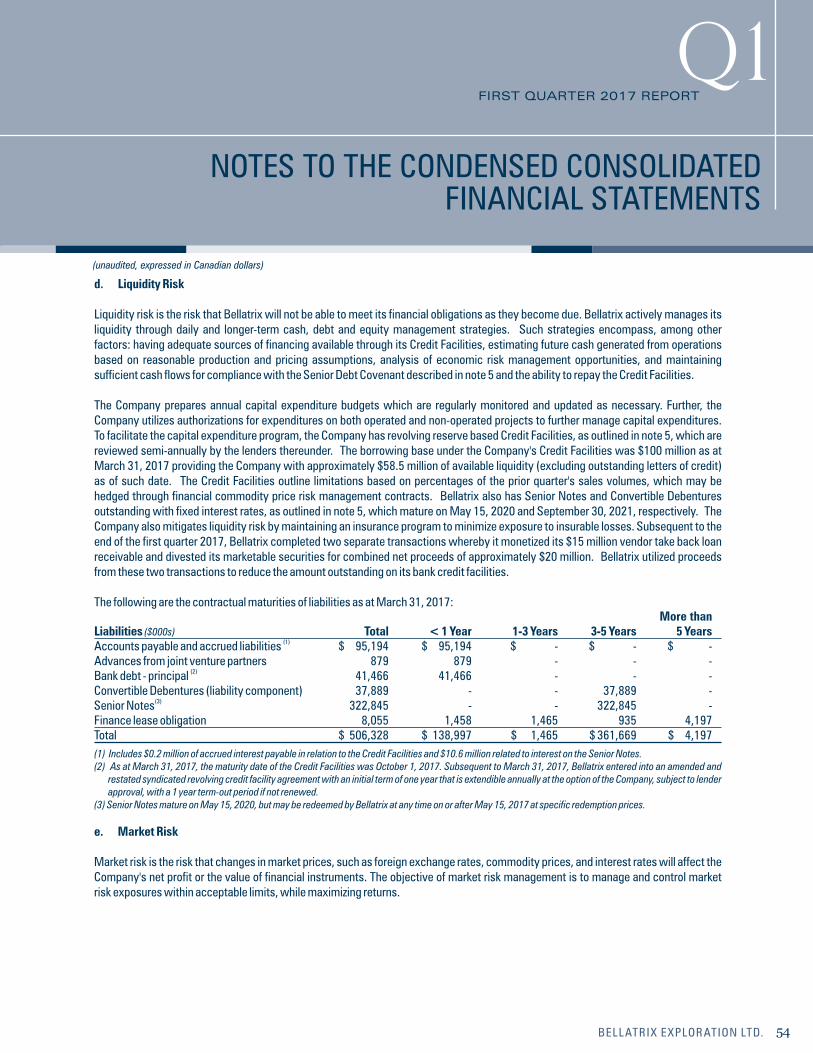
d. Liquidity Risk
Liquidity risk is the risk that Bellatrix will not be able to meet its financial obligations as they become due. Bellatrix actively manages its liquidity through daily and longer-term cash, debt and equity management strategies. Such strategies encompass, among other factors: having adequate sources of financing available through its Credit Facilities, estimating future cash generated from operations based on reasonable production and pricing assumptions, analysis of economic risk management opportunities, and maintaining sufficient cash flows for compliance with the Senior Debt Covenant described in note 5 and the ability to repay the Credit Facilities.
The Company prepares annual capital expenditure budgets which are regularly monitored and updated as necessary. Further, the Company utilizes authorizations for expenditures on both operated and non-operated projects to further manage capital expenditures. To facilitate the capital expenditure program, the Company has revolving reserve based Credit Facilities, as outlined in note 5, which are reviewed semi-annually by the lenders thereunder. The borrowing base under the Company's Credit Facilities was $100 million as at March 31, 2017 providing the Company with approximately $58.5 million of available liquidity (excluding outstanding letters of credit) as of such date. The Credit Facilities outline limitations based on percentages of the prior quarter's sales volumes, which may be hedged through financial commodity price risk management contracts. Bellatrix also has Senior Notes and Convertible Debentures outstanding with fixed interest rates, as outlined in note 5, which mature on May 15, 2020 and September 30, 2021, respectively. The Company also mitigates liquidity risk by maintaining an insurance program to minimize exposure to insurable losses. Subsequent to the end of the first quarter 2017, Bellatrix completed two separate transactions whereby it monetized its $15 million vendor take back loan receivable and divested its marketable securities for combined net proceeds of approximately $20 million. Bellatrix utilized proceeds from these two transactions to reduce the amount outstanding on its bank credit facilities.
The following are the contractual maturities of liabilities as at March 31, 2017: More than Liabilities ($000s) Total < 1 Year 1-3 Years 3-5 Years 5 Years
(1)Accounts payable and accrued liabilities $ 95,194 $ 95,194 $ - $ - $ -Advances from joint venture partners 879 879 - - -
(2)Bank debt - principal 41,466 41,466 - - -Convertible Debentures (liability component) 37,889 - - 37,889 -
(3)Senior Notes 322,845 - - 322,845 -Finance lease obligation 8,055 1,458 1,465 935 4,197Total $ 506,328 $ 138,997 $ 1,465 $ 361,669 $ 4,197
(1) Includes $0.2 million of accrued interest payable in relation to the Credit Facilities and $10.6 million related to interest on the Senior Notes.(2) As at March 31, 2017, the maturity date of the Credit Facilities was October 1, 2017. Subsequent to March 31, 2017, Bellatrix entered into an amended and
restated syndicated revolving credit facility agreement with an initial term of one year that is extendible annually at the option of the Company, subject to lender approval, with a 1 year term-out period if not renewed.
(3) Senior Notes mature on May 15, 2020, but may be redeemed by Bellatrix at any time on or after May 15, 2017 at specific redemption prices.
e. Market Risk
Market risk is the risk that changes in market prices, such as foreign exchange rates, commodity prices, and interest rates will affect the Company's net profit or the value of financial instruments. The objective of market risk management is to manage and control market risk exposures within acceptable limits, while maximizing returns.
(unaudited, expressed in Canadian dollars)
54BELLATRIX EXPLORATION LTD.
q1FIRST QUARTER 2017 REPORT
NOTES TO THE CONDENSED CONSOLIDATEDFINANCIAL STATEMENTS
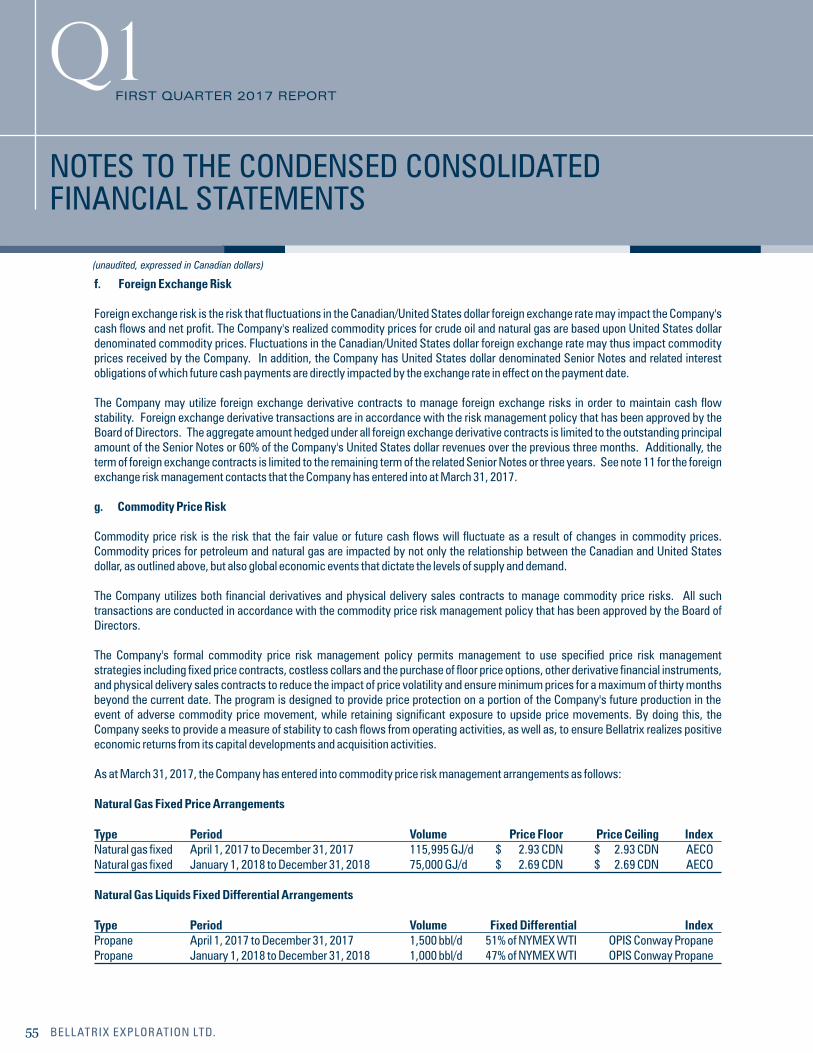
f. Foreign Exchange Risk
Foreign exchange risk is the risk that fluctuations in the Canadian/United States dollar foreign exchange rate may impact the Company's cash flows and net profit. The Company's realized commodity prices for crude oil and natural gas are based upon United States dollar denominated commodity prices. Fluctuations in the Canadian/United States dollar foreign exchange rate may thus impact commodity prices received by the Company. In addition, the Company has United States dollar denominated Senior Notes and related interest obligations of which future cash payments are directly impacted by the exchange rate in effect on the payment date.
The Company may utilize foreign exchange derivative contracts to manage foreign exchange risks in order to maintain cash flow stability. Foreign exchange derivative transactions are in accordance with the risk management policy that has been approved by the Board of Directors. The aggregate amount hedged under all foreign exchange derivative contracts is limited to the outstanding principal amount of the Senior Notes or 60% of the Company's United States dollar revenues over the previous three months. Additionally, the term of foreign exchange contracts is limited to the remaining term of the related Senior Notes or three years. See note 11 for the foreign exchange risk management contacts that the Company has entered into at March 31, 2017.
g. Commodity Price Risk
Commodity price risk is the risk that the fair value or future cash flows will fluctuate as a result of changes in commodity prices. Commodity prices for petroleum and natural gas are impacted by not only the relationship between the Canadian and United States dollar, as outlined above, but also global economic events that dictate the levels of supply and demand.
The Company utilizes both financial derivatives and physical delivery sales contracts to manage commodity price risks. All such transactions are conducted in accordance with the commodity price risk management policy that has been approved by the Board of Directors.
The Company's formal commodity price risk management policy permits management to use specified price risk management strategies including fixed price contracts, costless collars and the purchase of floor price options, other derivative financial instruments, and physical delivery sales contracts to reduce the impact of price volatility and ensure minimum prices for a maximum of thirty months beyond the current date. The program is designed to provide price protection on a portion of the Company's future production in the event of adverse commodity price movement, while retaining significant exposure to upside price movements. By doing this, the Company seeks to provide a measure of stability to cash flows from operating activities, as well as, to ensure Bellatrix realizes positive economic returns from its capital developments and acquisition activities.
As at March 31, 2017, the Company has entered into commodity price risk management arrangements as follows:
Natural Gas Fixed Price Arrangements
Type Period Volume Price Floor Price Ceiling IndexNatural gas fixed April 1, 2017 to December 31, 2017 115,995 GJ/d $ 2.93 CDN $ 2.93 CDN AECONatural gas fixed January 1, 2018 to December 31, 2018 75,000 GJ/d $ 2.69 CDN $ 2.69 CDN AECO
Natural Gas Liquids Fixed Differential Arrangements
Type Period Volume Fixed Differential IndexPropane April 1, 2017 to December 31, 2017 1,500 bbl/d 51% of NYMEX WTI OPIS Conway PropanePropane January 1, 2018 to December 31, 2018 1,000 bbl/d 47% of NYMEX WTI OPIS Conway Propane
(unaudited, expressed in Canadian dollars)
NOTES TO THE CONDENSED CONSOLIDATEDFINANCIAL STATEMENTS
55 BELLATRIX EXPLORATION LTD.
q1FIRST QUARTER 2017 REPORT
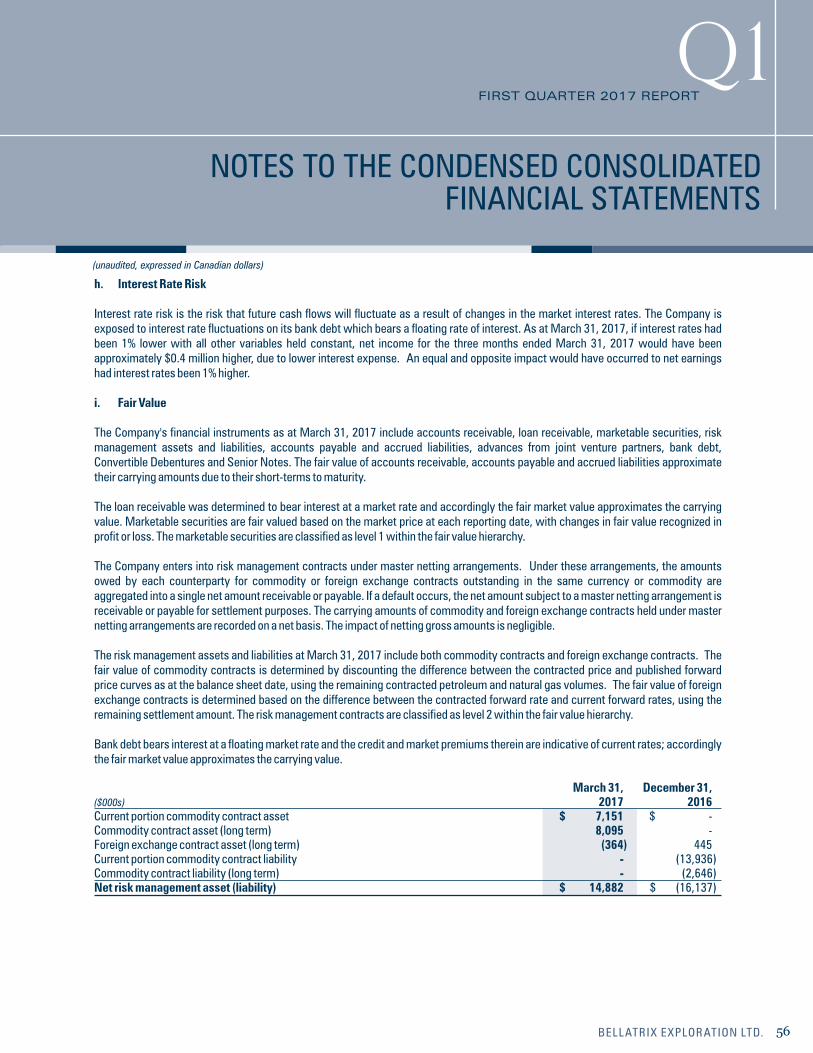
h. Interest Rate Risk
Interest rate risk is the risk that future cash flows will fluctuate as a result of changes in the market interest rates. The Company is exposed to interest rate fluctuations on its bank debt which bears a floating rate of interest. As at March 31, 2017, if interest rates had been 1% lower with all other variables held constant, net income for the three months ended March 31, 2017 would have been approximately $0.4 million higher, due to lower interest expense. An equal and opposite impact would have occurred to net earnings had interest rates been 1% higher.
i. Fair Value
The Company's financial instruments as at March 31, 2017 include accounts receivable, loan receivable, marketable securities, risk management assets and liabilities, accounts payable and accrued liabilities, advances from joint venture partners, bank debt, Convertible Debentures and Senior Notes. The fair value of accounts receivable, accounts payable and accrued liabilities approximate their carrying amounts due to their short-terms to maturity.
The loan receivable was determined to bear interest at a market rate and accordingly the fair market value approximates the carrying value. Marketable securities are fair valued based on the market price at each reporting date, with changes in fair value recognized in profit or loss. The marketable securities are classified as level 1 within the fair value hierarchy.
The Company enters into risk management contracts under master netting arrangements. Under these arrangements, the amounts owed by each counterparty for commodity or foreign exchange contracts outstanding in the same currency or commodity are aggregated into a single net amount receivable or payable. If a default occurs, the net amount subject to a master netting arrangement is receivable or payable for settlement purposes. The carrying amounts of commodity and foreign exchange contracts held under master netting arrangements are recorded on a net basis. The impact of netting gross amounts is negligible.
The risk management assets and liabilities at March 31, 2017 include both commodity contracts and foreign exchange contracts. The fair value of commodity contracts is determined by discounting the difference between the contracted price and published forward price curves as at the balance sheet date, using the remaining contracted petroleum and natural gas volumes. The fair value of foreign exchange contracts is determined based on the difference between the contracted forward rate and current forward rates, using the remaining settlement amount. The risk management contracts are classified as level 2 within the fair value hierarchy.
Bank debt bears interest at a floating market rate and the credit and market premiums therein are indicative of current rates; accordingly the fair market value approximates the carrying value.
March 31, December 31,($000s) 2017 2016Current portion commodity contract asset $ 7,151 $ -Commodity contract asset (long term) 8,095 - Foreign exchange contract asset (long term) (364) 445Current portion commodity contract liability - (13,936)Commodity contract liability (long term) - (2,646)Net risk management asset (liability) $ 14,882 $ (16,137)
(unaudited, expressed in Canadian dollars)
56BELLATRIX EXPLORATION LTD.
q1FIRST QUARTER 2017 REPORT
NOTES TO THE CONDENSED CONSOLIDATEDFINANCIAL STATEMENTS
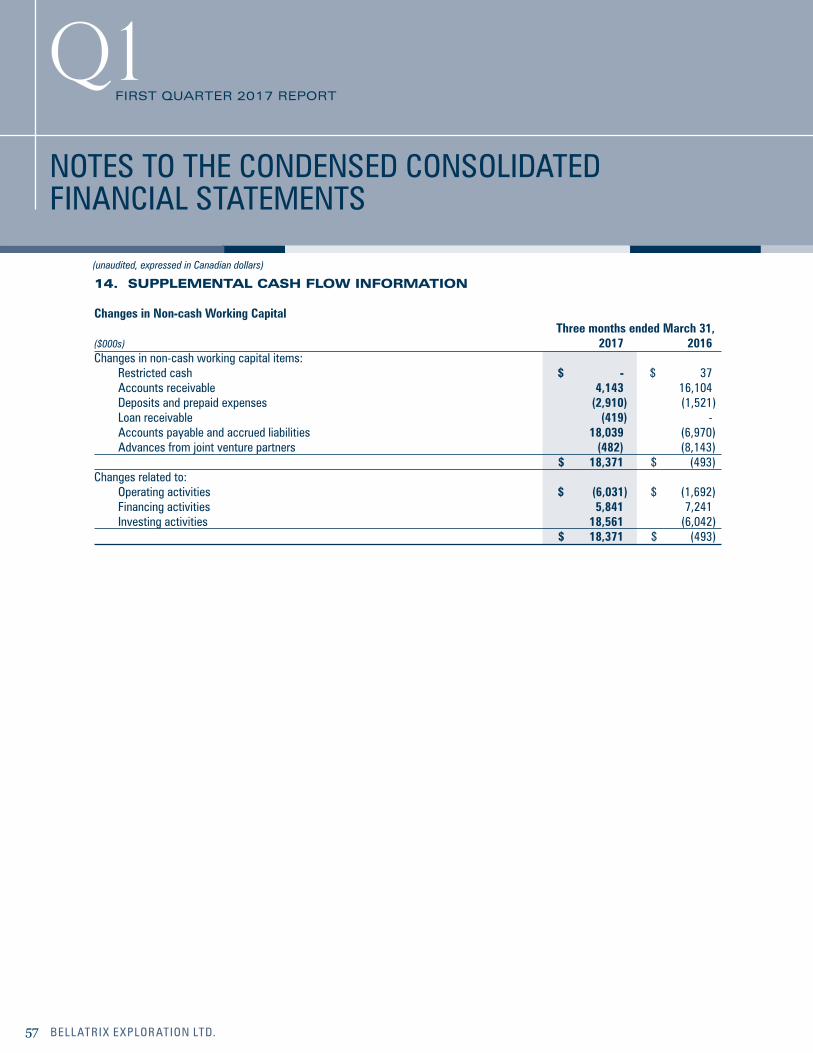
14. SUPPLEMENTAL CASH FLOW INFORMATION
Changes in Non-cash Working Capital Three months ended March 31, ($000s) 2017 2016Changes in non-cash working capital items: Restricted cash $ - $ 37 Accounts receivable 4,143 16,104 Deposits and prepaid expenses (2,910) (1,521) Loan receivable (419) - Accounts payable and accrued liabilities 18,039 (6,970) Advances from joint venture partners (482) (8,143) $ 18,371 $ (493)Changes related to: Operating activities $ (6,031) $ (1,692) Financing activities 5,841 7,241 Investing activities 18,561 (6,042) $ 18,371 $ (493)
(unaudited, expressed in Canadian dollars)
NOTES TO THE CONDENSED CONSOLIDATEDFINANCIAL STATEMENTS
57 BELLATRIX EXPLORATION LTD.
q1FIRST QUARTER 2017 REPORT
BOARD OF DIRECTORS
W.C. (Mickey) Dunn, Chairman Independent Businessman Edmonton, Alberta
John H. Cuthbertson, Q.C. Partner, Burnet, Duckworth & Palmer LLP Calgary, Alberta
Brent A. Eshleman, P. Eng.President and CEO, Bellatrix Exploration Ltd. Calgary, Alberta
Murray B. Todd, B. Sc., P. Eng.President, Canada Hibernia Holding CorporationCalgary, Alberta
Murray L. CobbeChairman, Trican Well Service Ltd.Calgary, Alberta
Keith E. Macdonald, CPA, CAIndependent BusinessmanCalgary, Alberta
Thomas E. MacInnis, B. Comm., MBAIndependent BusinessmanCalgary, Alberta
Steven J. Pully, Esq., CPA, CFA Independent BusinessmanDallas, Texas
Keith S. Turnbull, B.Sc., CPA, CAIndependent BusinessmanCalgary, Alberta
OFFICERS
Brent A. Eshleman, P. Eng.President and CEO
Edward J. Brown, CPA, CA Executive Vice President, Finance and CFO
Garrett K. Ulmer, P. Eng.Chief Operating Officer
Charles R. Kraus, Esq.Exectutive Vice President, General Counsel and Corporate Secretary
Timothy A. BlairVice President, Land
Duncan ChisholmVice President, Production
Chris D. Curry, CPA, CAVice President and Controller
Leanne K. Gress-Blue, CPA, CAVice President, Finance
Robert O. LeeVice President, Marketing
Russell G. Oicle, P. Geol.Vice President, Exploration
Mark L. Stephen, P. Eng.Vice President, Operations
Steve G. Toth, CFAVice President, Investor Relations
STOCK EXCHANGE LISTING
The Toronto Stock ExchangeTrading symbol: BXE
The New York Stock ExchangeTrading symbol: BXE
LEGAL COUNSEL
Burnet, Duckworth & Palmer LLP
AUDITORS
KPMG LLP
BANKERS
National Bank of CanadaAlberta Treasury BranchesThe Bank of Nova ScotiaCanadian Western Bank
EVALUATION ENGINEERS
InSite Petroleum Consultants Ltd.
REGISTRAR AND TRANSFER AGENT
Computershare Trust Company of Canada
HEAD OFFICE
1920, 800 - 5th Avenue S.W. Calgary, Alberta, Canada T2P 3T6 Phone: (403) 266-8670 Fax: (403) 264-8163 Email: [email protected]: www.bellatrixexploration.com
58BELLATRIX EXPLORATION LTD.
q1FIRST QUARTER 2017 REPORT
CORPORATE INFORMATION
1920, 800 - 5th Avenue S.W.
Calgary, Alberta, Canada T2P 3T6
Phone: (403) 266-8670
Fax: (403) 264-8163
www.bellatrixexploration.com
BXE TSX NYSE