Embed Size (px)
Citation preview
First Quarter 2020 Review
Stephan Tanda, CEO | Bob Kuhn, CFO | May 1, 2020 @ 8 a.m. Central Time
2
This presentation includes forward-looking statements. Forward-looking statements are made pursuant to the
safe harbor provisions of Section 27A of the Securities Act of 1933 and Section 21E of the Securities Exchange
Act of 1934 and are based on management’s beliefs and assumptions in light of information currently available
to management. Accordingly, the Company’s actual results may differ materially from those expressed or implied
in such forward-looking statements due to known or unknown risks and uncertainties that exist in the
Company’s operations and business environment, including, among other factors, those described in
documents filed by the Company with the Securities and Exchange Commission, specifically its Form 10-Ks and
10-Qs. The Company does not assume any obligation to update, amend or clarify such statements to reflect new
events, information or circumstances after the date of this presentation.
During the course of this presentation, certain non-GAAP financial information will be presented.
A reconciliation of those numbers to GAAP financial measures is available on the company’s website at
www.aptar.com on the Investor’s page (click on Events & Presentations).
Forward Looking Statements & Non-GAAP Financial Measures
3
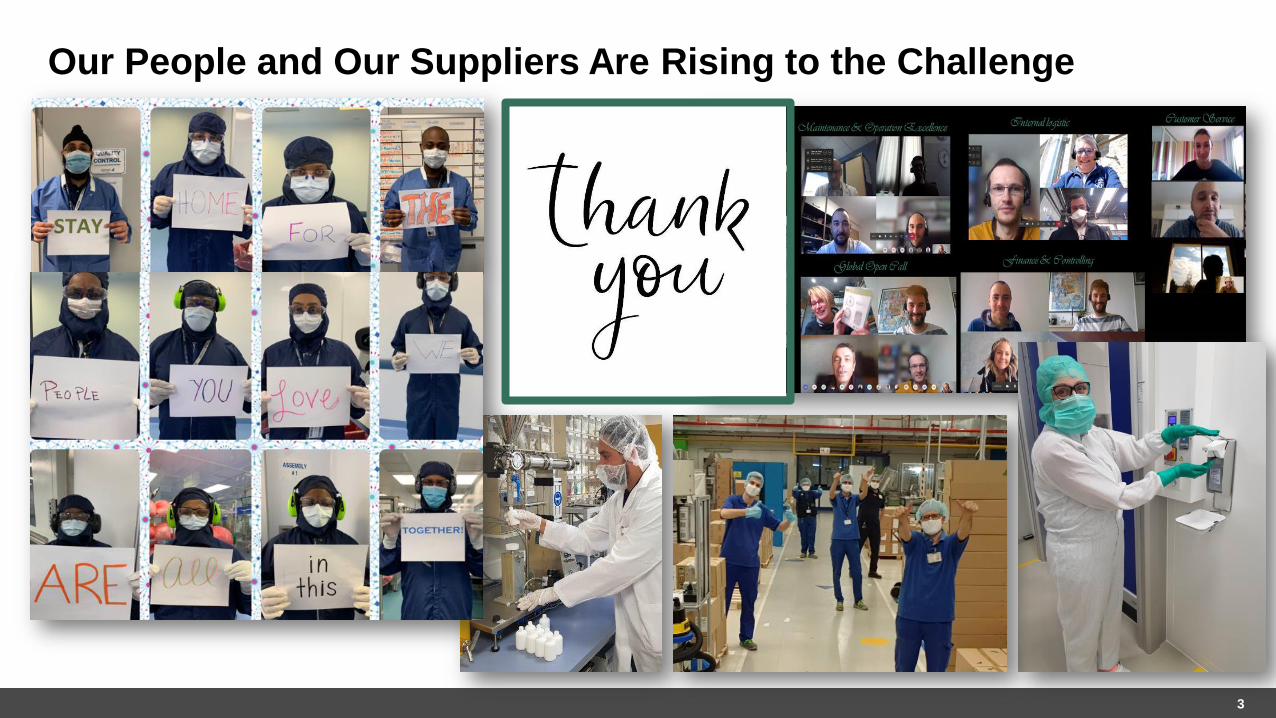
Our People and Our Suppliers Are Rising to the Challenge
4
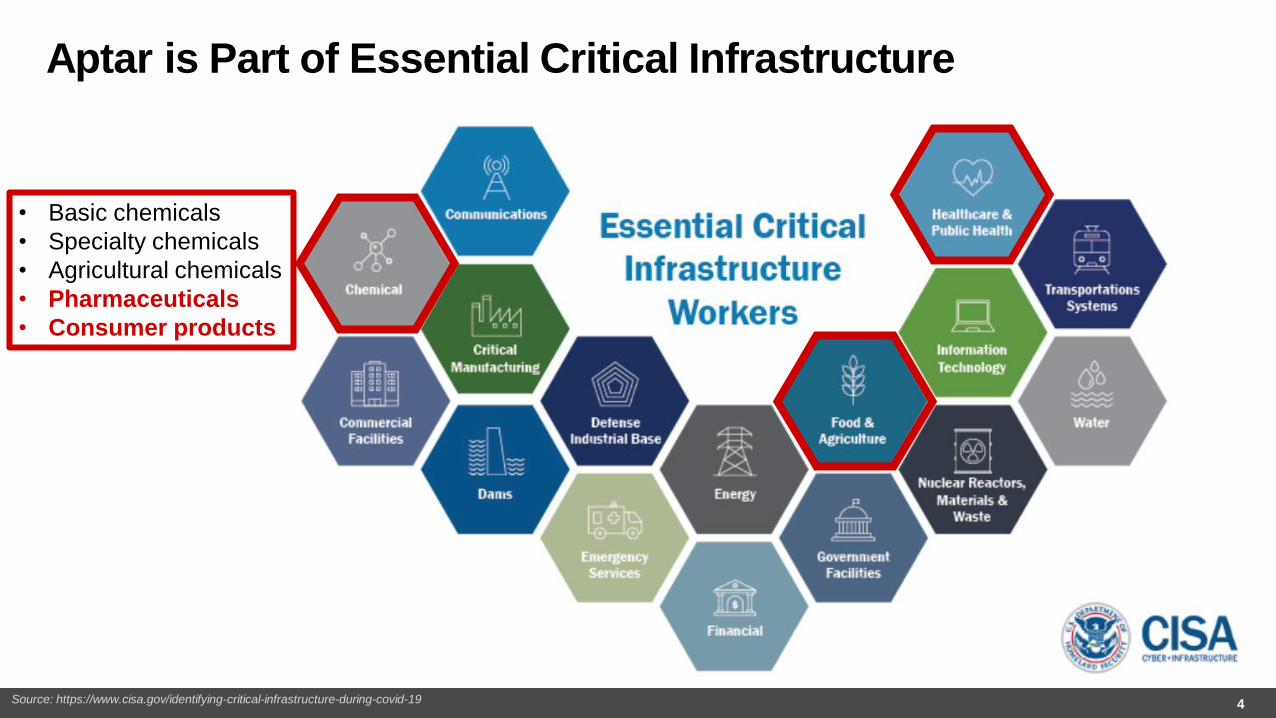
• Basic chemicals
• Specialty chemicals
• Agricultural chemicals
• Pharmaceuticals
• Consumer products
Aptar is Part of Essential Critical Infrastructure
Source: https://www.cisa.gov/identifying-critical-infrastructure-during-covid-19
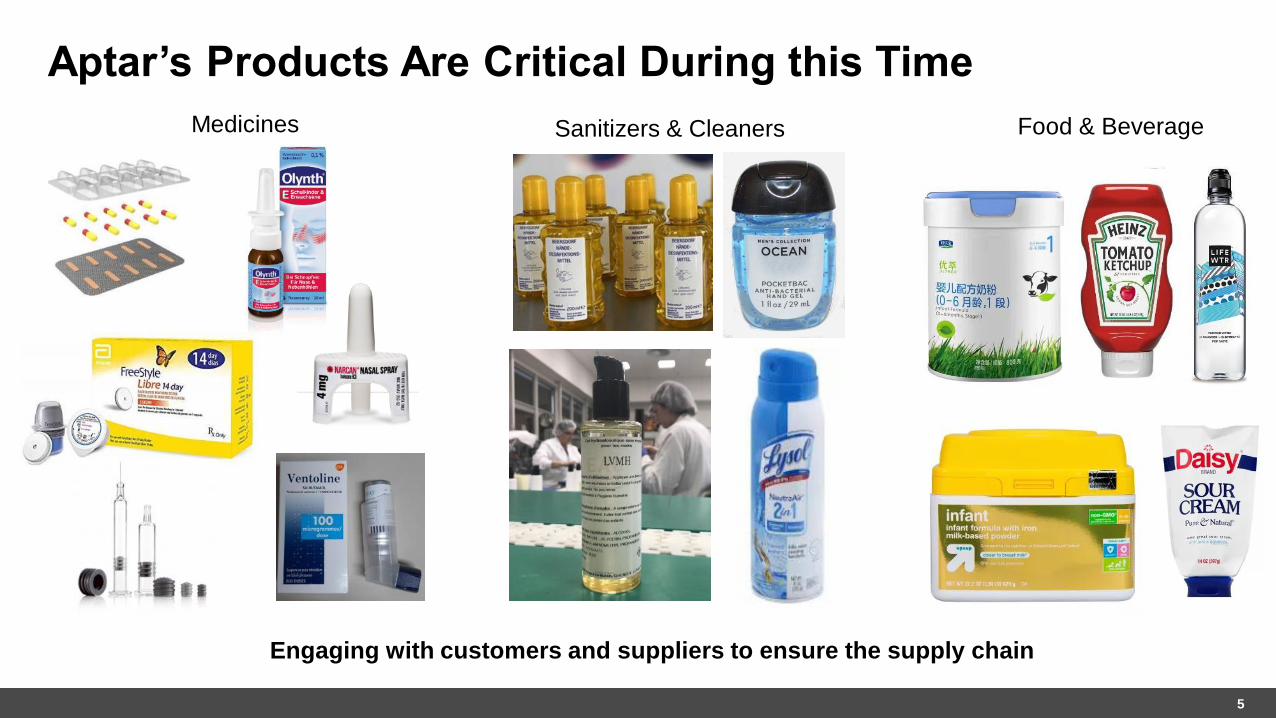
Aptar’s Products Are Critical During this Time
5
Medicines Sanitizers & Cleaners Food & Beverage
Engaging with customers and suppliers to ensure the supply chain
5
6
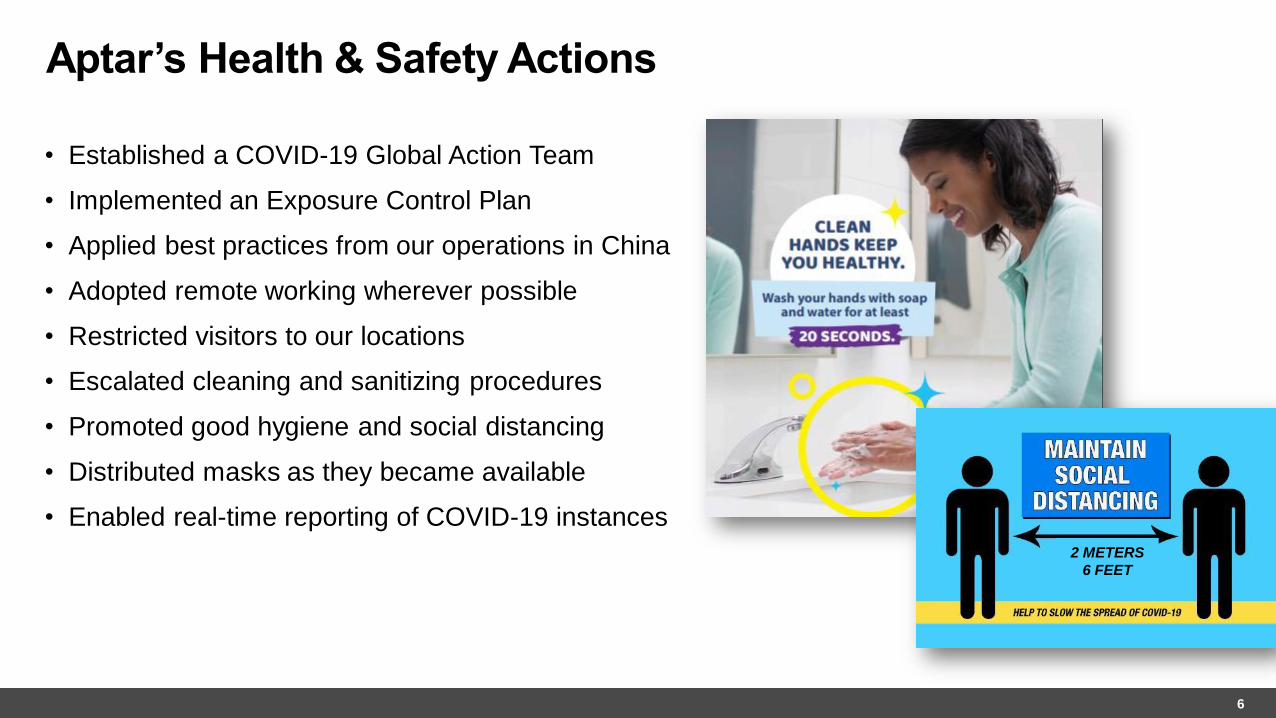
• Established a COVID-19 Global Action Team
• Implemented an Exposure Control Plan
• Applied best practices from our operations in China
• Adopted remote working wherever possible
• Restricted visitors to our locations
• Escalated cleaning and sanitizing procedures
• Promoted good hygiene and social distancing
• Distributed masks as they became available
• Enabled real-time reporting of COVID-19 instances
2 METERS
6 FEET
Aptar’s Health & Safety Actions
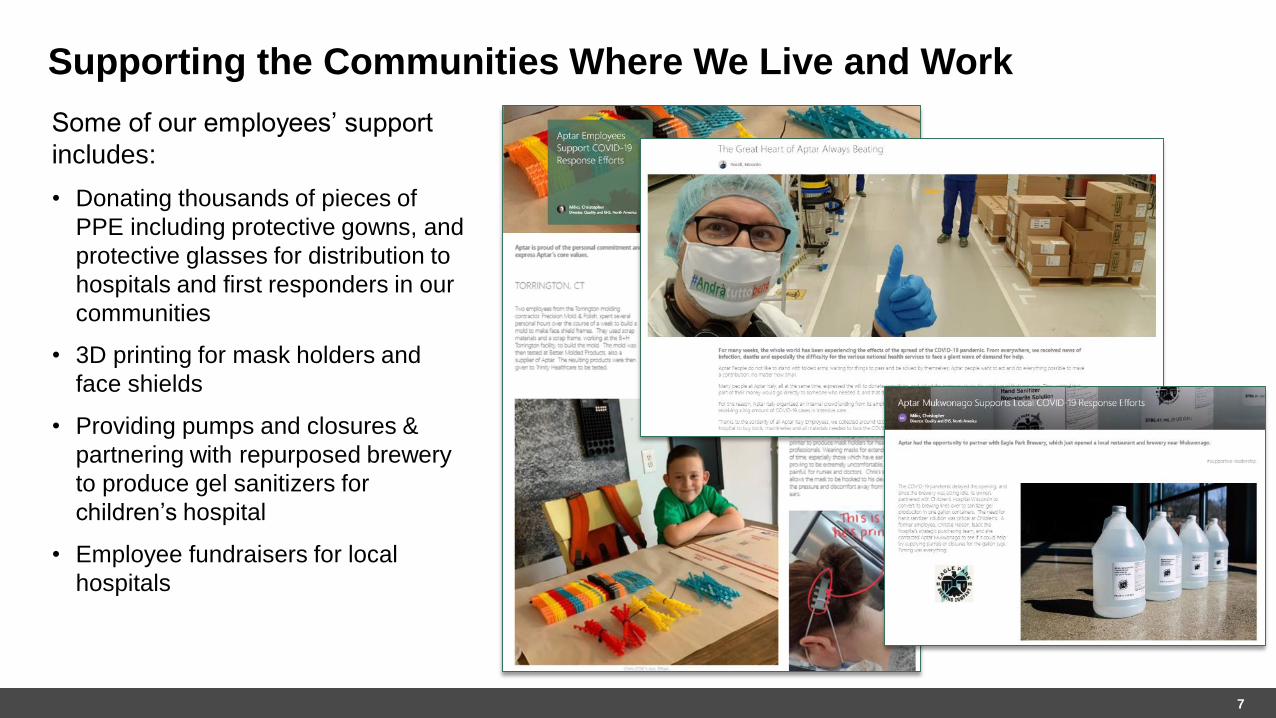
Some of our employees’ support
includes:
• Donating thousands of pieces of
PPE including protective gowns, and
protective glasses for distribution to
hospitals and first responders in our
communities
• 3D printing for mask holders and
face shields
• Providing pumps and closures &
partnering with repurposed brewery
to produce gel sanitizers for
children’s hospital
• Employee fundraisers for local
hospitals
Supporting the Communities Where We Live and Work
7
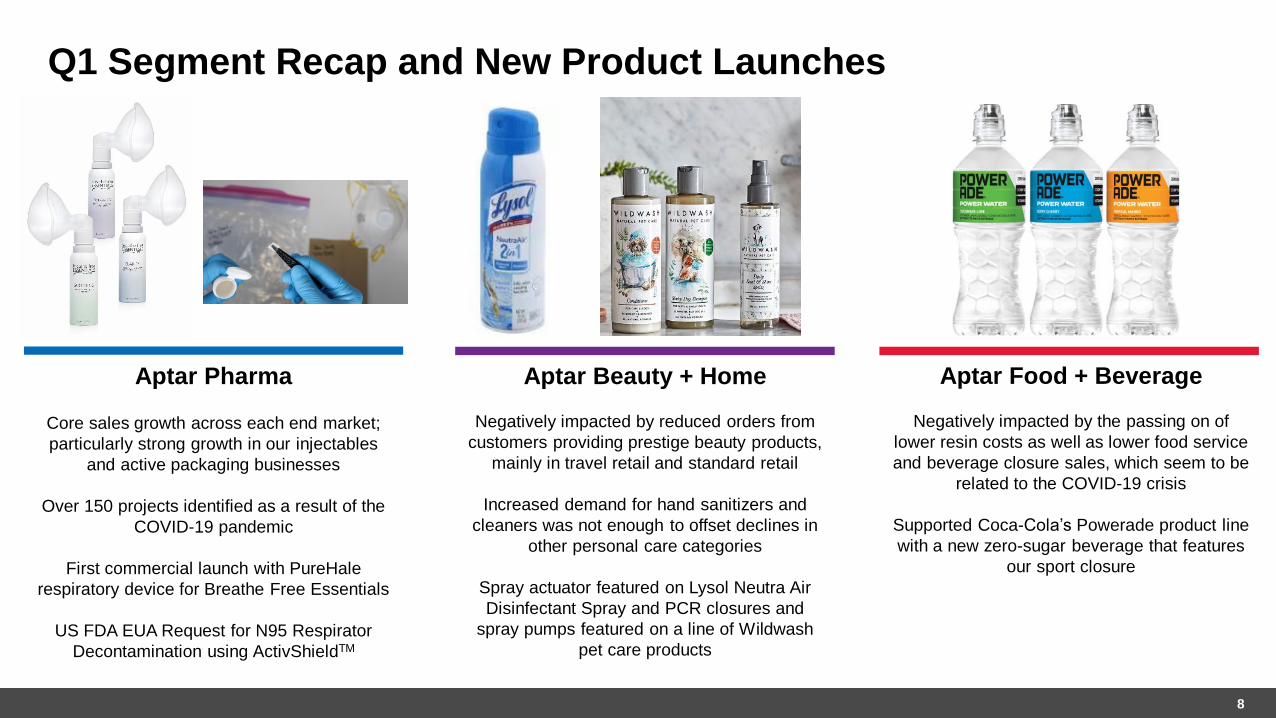
Q1 Segment Recap and New Product Launches
8
Aptar Pharma
Core sales growth across each end market;
particularly strong growth in our injectables
and active packaging businesses
Over 150 projects identified as a result of the
COVID-19 pandemic
First commercial launch with PureHale
respiratory device for Breathe Free Essentials
US FDA EUA Request for N95 Respirator
Decontamination using ActivShieldTM
Aptar Beauty + Home
Negatively impacted by reduced orders from
customers providing prestige beauty products,
mainly in travel retail and standard retail
Increased demand for hand sanitizers and
cleaners was not enough to offset declines in
other personal care categories
Spray actuator featured on Lysol Neutra Air
Disinfectant Spray and PCR closures and
spray pumps featured on a line of Wildwash
pet care products
Aptar Food + Beverage
Negatively impacted by the passing on of
lower resin costs as well as lower food service
and beverage closure sales, which seem to be
related to the COVID-19 crisis
Supported Coca-Cola’s Powerade product line
with a new zero-sugar beverage that features
our sport closure
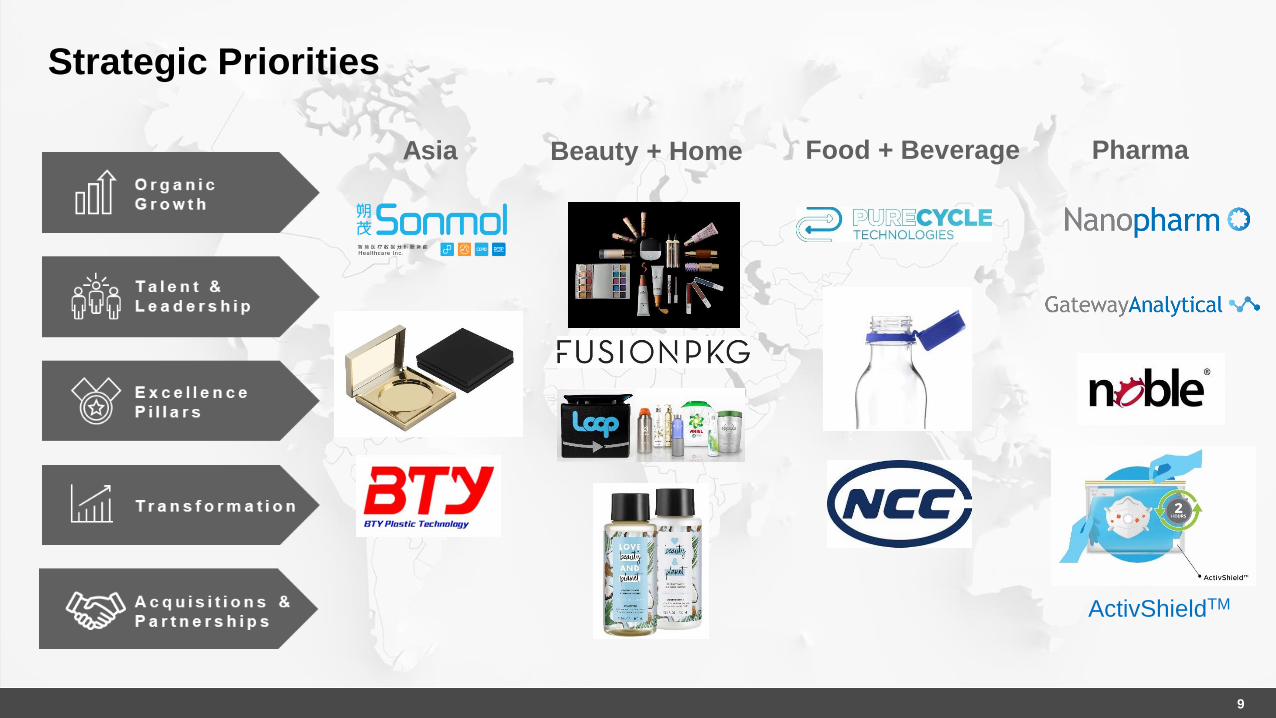
Strategic Priorities
9
Asia Beauty + Home Food + Beverage Pharma
ActivShieldTM
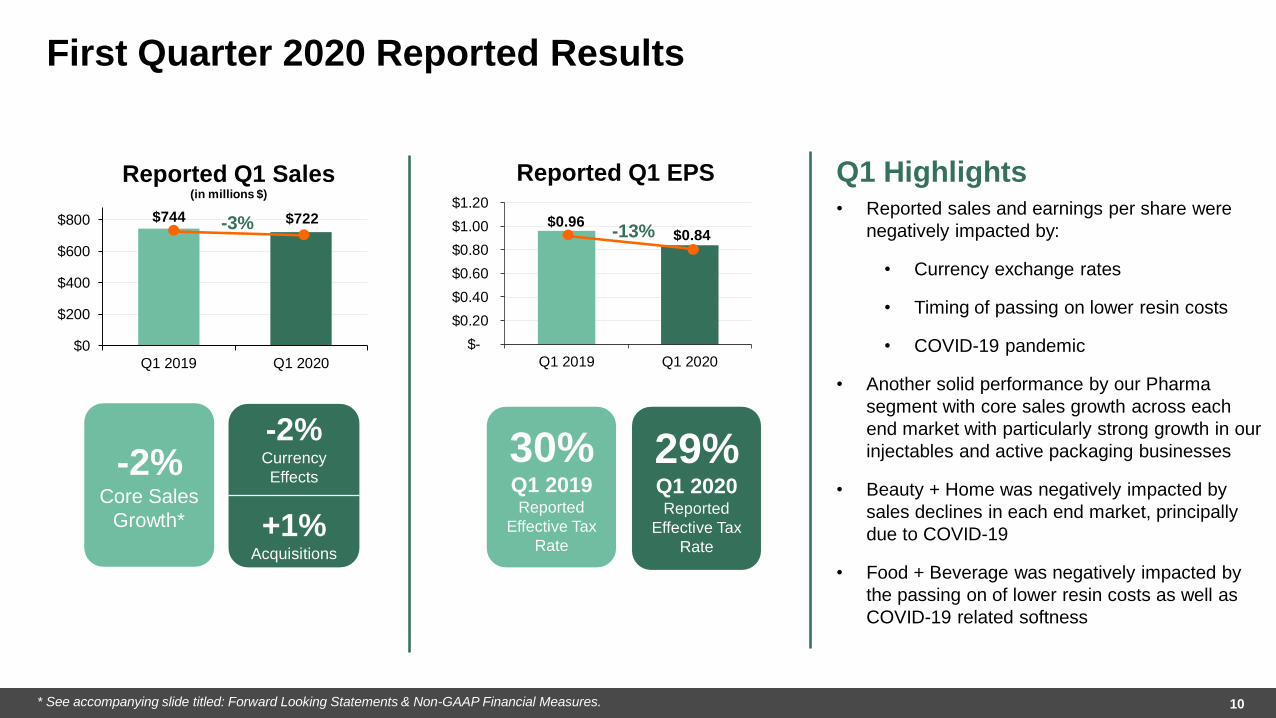
First Quarter 2020 Reported Results
10
Q1 Highlights• Reported sales and earnings per share were
negatively impacted by:
• Currency exchange rates
• Timing of passing on lower resin costs
• COVID-19 pandemic
• Another solid performance by our Pharma
segment with core sales growth across each
end market with particularly strong growth in our
injectables and active packaging businesses
• Beauty + Home was negatively impacted by
sales declines in each end market, principally
due to COVID-19
• Food + Beverage was negatively impacted by
the passing on of lower resin costs as well as
COVID-19 related softness
-2%Core Sales
Growth*
-2%Currency
Effects
+1%Acquisitions
30%Q1 2019Reported
Effective Tax
Rate
29%Q1 2020Reported
Effective Tax
Rate
$744 $722
$0
$200
$400
$600
$800
Q1 2019 Q1 2020
Reported Q1 Sales(in millions $)
-3% $0.96 $0.84
$-
$0.20
$0.40
$0.60
$0.80
$1.00
$1.20
Q1 2019 Q1 2020
Reported Q1 EPS
-13%
* See accompanying slide titled: Forward Looking Statements & Non-GAAP Financial Measures.
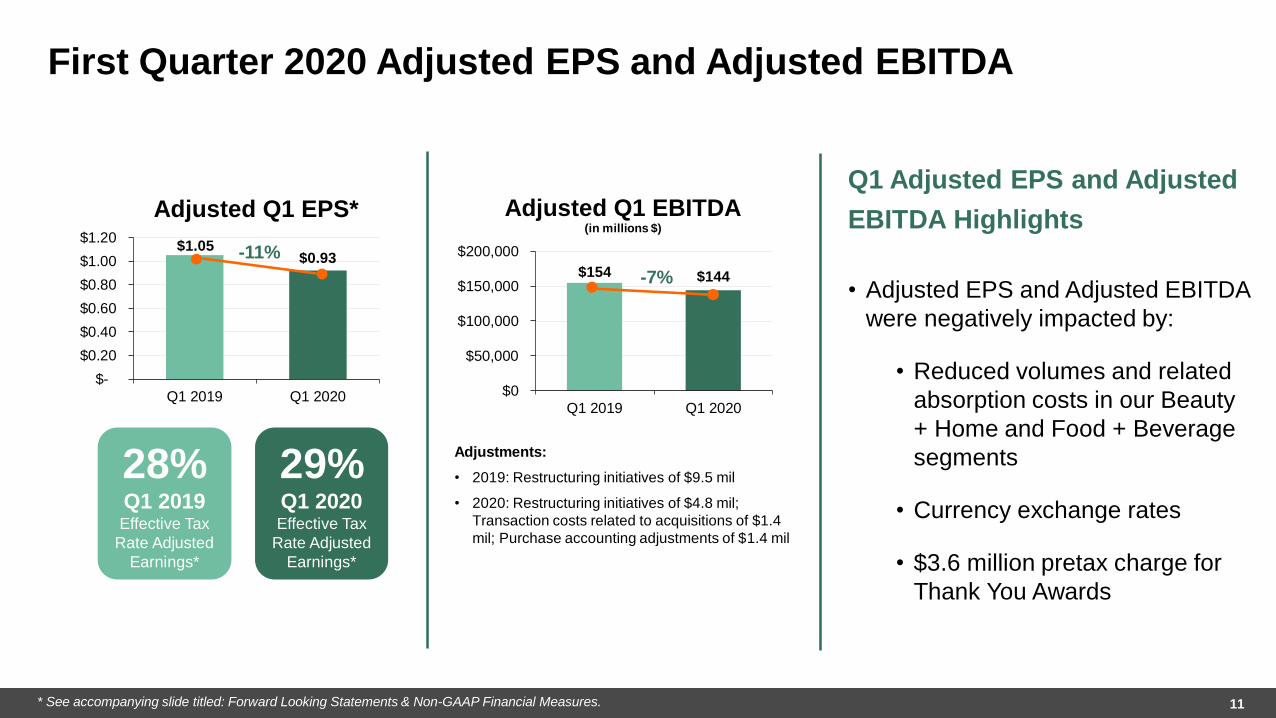
Adjustments:
• 2019: Restructuring initiatives of $9.5 mil
• 2020: Restructuring initiatives of $4.8 mil;
Transaction costs related to acquisitions of $1.4
mil; Purchase accounting adjustments of $1.4 mil
* See accompanying slide titled: Forward Looking Statements & Non-GAAP Financial Measures.
First Quarter 2020 Adjusted EPS and Adjusted EBITDA
11
28%Q1 2019Effective Tax
Rate Adjusted
Earnings*
29%Q1 2020Effective Tax
Rate Adjusted
Earnings*
Q1 Adjusted EPS and Adjusted
EBITDA Highlights
• Adjusted EPS and Adjusted EBITDA
were negatively impacted by:
• Reduced volumes and related
absorption costs in our Beauty
+ Home and Food + Beverage
segments
• Currency exchange rates
• $3.6 million pretax charge for
Thank You Awards
$1.05 $0.93
$-
$0.20
$0.40
$0.60
$0.80
$1.00
$1.20
Q1 2019 Q1 2020
Adjusted Q1 EPS*
-11%$154 $144
$0
$50,000
$100,000
$150,000
$200,000
Q1 2019 Q1 2020
Adjusted Q1 EBITDA(in millions $)
-7%
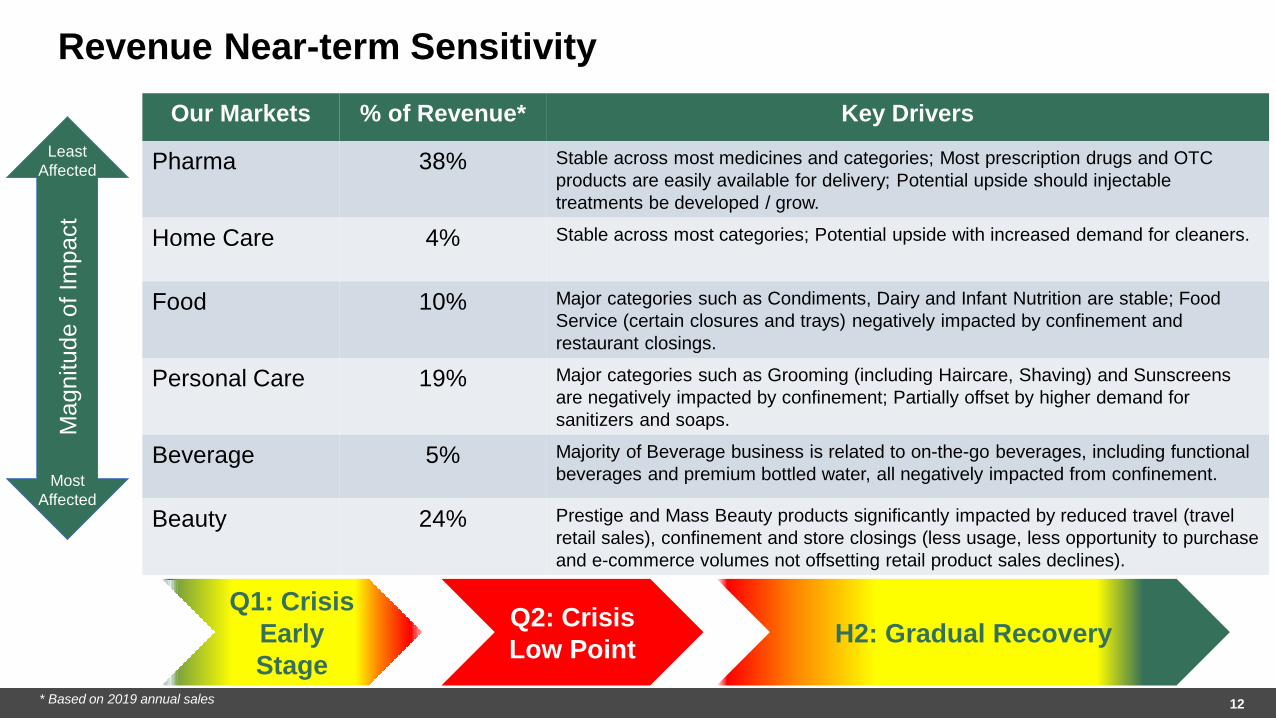
Revenue Near-term Sensitivity
12
Our Markets % of Revenue* Key Drivers
Pharma 38% Stable across most medicines and categories; Most prescription drugs and OTC
products are easily available for delivery; Potential upside should injectable
treatments be developed / grow.
Home Care 4% Stable across most categories; Potential upside with increased demand for cleaners.
Food 10% Major categories such as Condiments, Dairy and Infant Nutrition are stable; Food
Service (certain closures and trays) negatively impacted by confinement and
restaurant closings.
Personal Care 19% Major categories such as Grooming (including Haircare, Shaving) and Sunscreens
are negatively impacted by confinement; Partially offset by higher demand for
sanitizers and soaps.
Beverage 5% Majority of Beverage business is related to on-the-go beverages, including functional
beverages and premium bottled water, all negatively impacted from confinement.
Beauty 24% Prestige and Mass Beauty products significantly impacted by reduced travel (travel
retail sales), confinement and store closings (less usage, less opportunity to purchase
and e-commerce volumes not offsetting retail product sales declines).
Q1: Crisis
Early
Stage
Q2: Crisis
Low PointH2: Gradual Recovery
Ma
gn
itu
de
of Im
pa
ct
Least
Affected
Most
Affected
* Based on 2019 annual sales
13
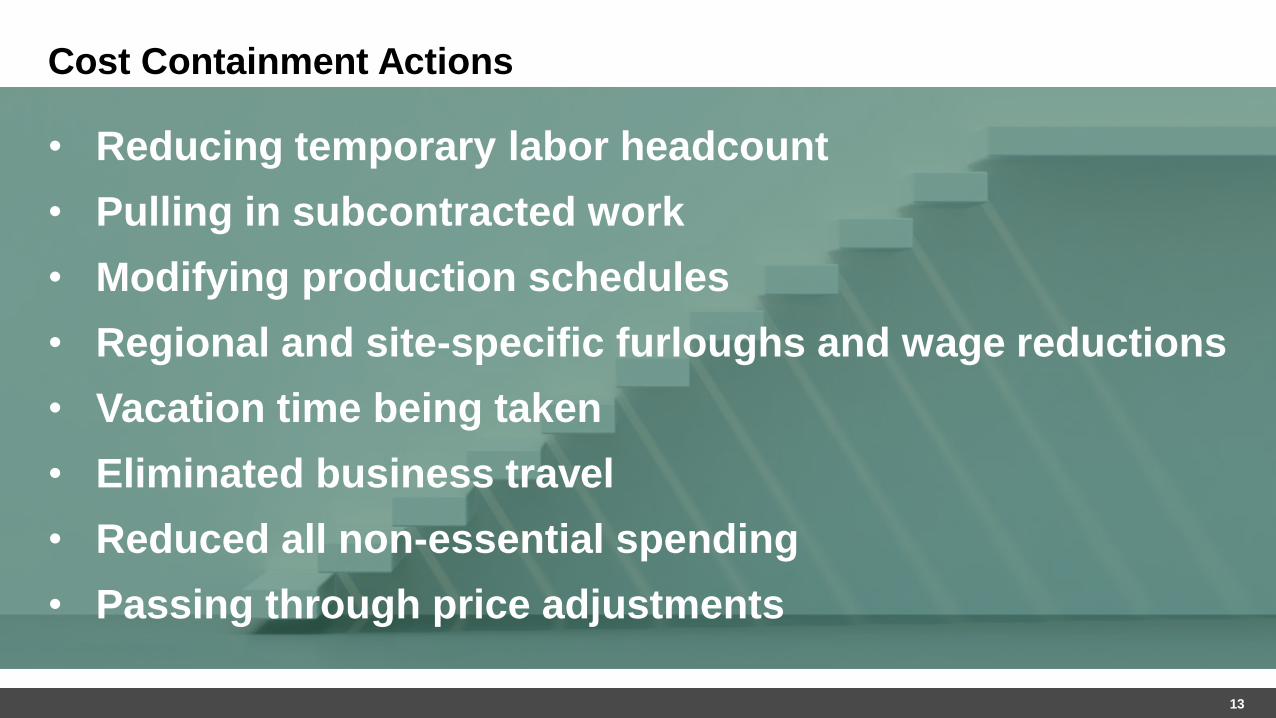
Cost Containment Actions
• Reducing temporary labor headcount
• Pulling in subcontracted work
• Modifying production schedules
• Regional and site-specific furloughs and wage reductions
• Vacation time being taken
• Eliminated business travel
• Reduced all non-essential spending
• Passing through price adjustments
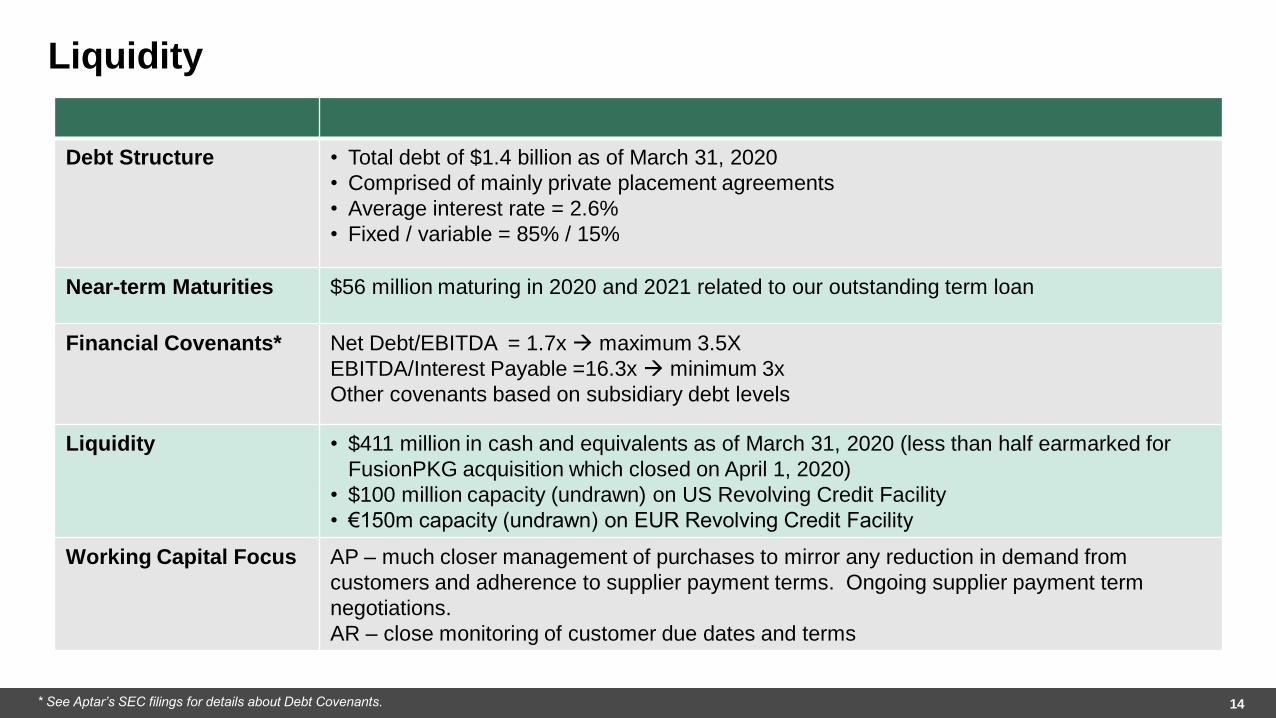
Liquidity
14
Debt Structure • Total debt of $1.4 billion as of March 31, 2020
• Comprised of mainly private placement agreements
• Average interest rate = 2.6%
• Fixed / variable = 85% / 15%
Near-term Maturities $56 million maturing in 2020 and 2021 related to our outstanding term loan
Financial Covenants* Net Debt/EBITDA = 1.7x → maximum 3.5X
EBITDA/Interest Payable =16.3x → minimum 3x
Other covenants based on subsidiary debt levels
Liquidity • $411 million in cash and equivalents as of March 31, 2020 (less than half earmarked for
FusionPKG acquisition which closed on April 1, 2020)
• $100 million capacity (undrawn) on US Revolving Credit Facility
• €150m capacity (undrawn) on EUR Revolving Credit Facility
Working Capital Focus AP – much closer management of purchases to mirror any reduction in demand from
customers and adherence to supplier payment terms. Ongoing supplier payment term
negotiations.
AR – close monitoring of customer due dates and terms
* See Aptar’s SEC filings for details about Debt Covenants.
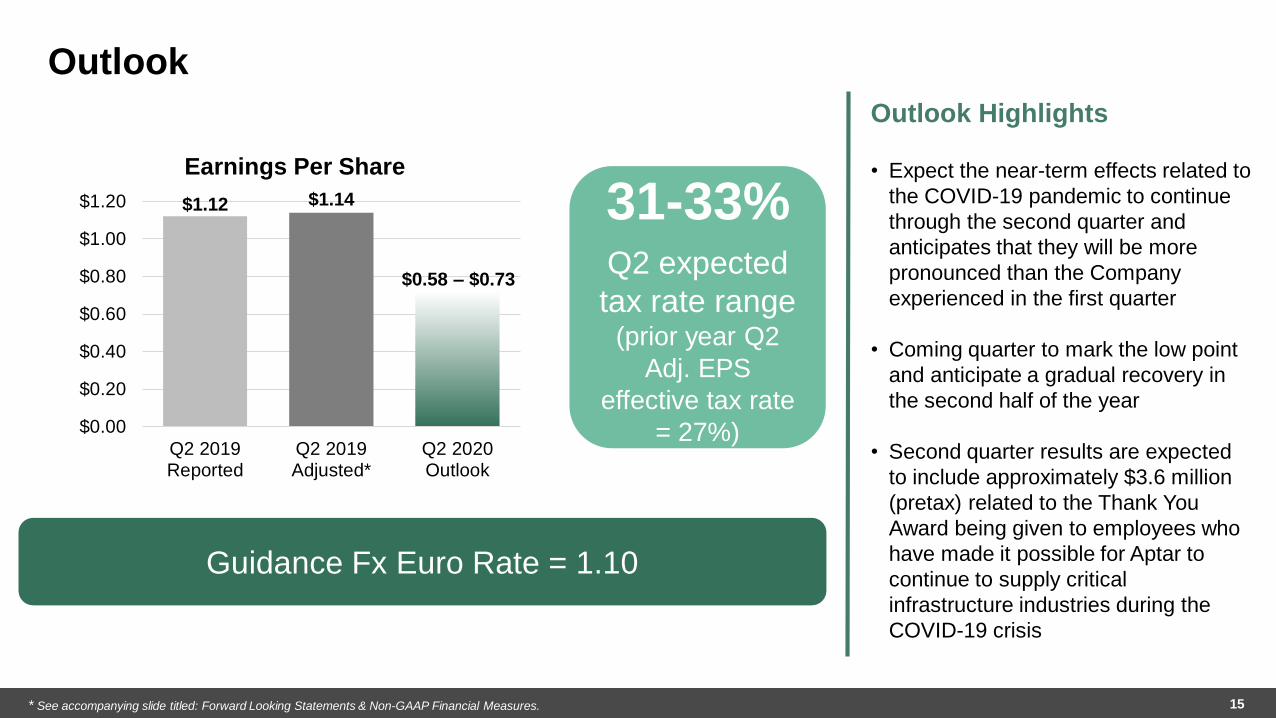
Outlook
31-33%Q2 expected
tax rate range(prior year Q2
Adj. EPS
effective tax rate
= 27%)
Outlook Highlights
• Expect the near-term effects related to
the COVID-19 pandemic to continue
through the second quarter and
anticipates that they will be more
pronounced than the Company
experienced in the first quarter
• Coming quarter to mark the low point
and anticipate a gradual recovery in
the second half of the year
• Second quarter results are expected
to include approximately $3.6 million
(pretax) related to the Thank You
Award being given to employees who
have made it possible for Aptar to
continue to supply critical
infrastructure industries during the
COVID-19 crisis
Guidance Fx Euro Rate = 1.10
$1.12 $1.14
$0.58 – $0.73
$0.00
$0.20
$0.40
$0.60
$0.80
$1.00
$1.20
Q2 2019Reported
Q2 2019Adjusted*
Q2 2020Outlook
Earnings Per Share
* See accompanying slide titled: Forward Looking Statements & Non-GAAP Financial Measures. 15
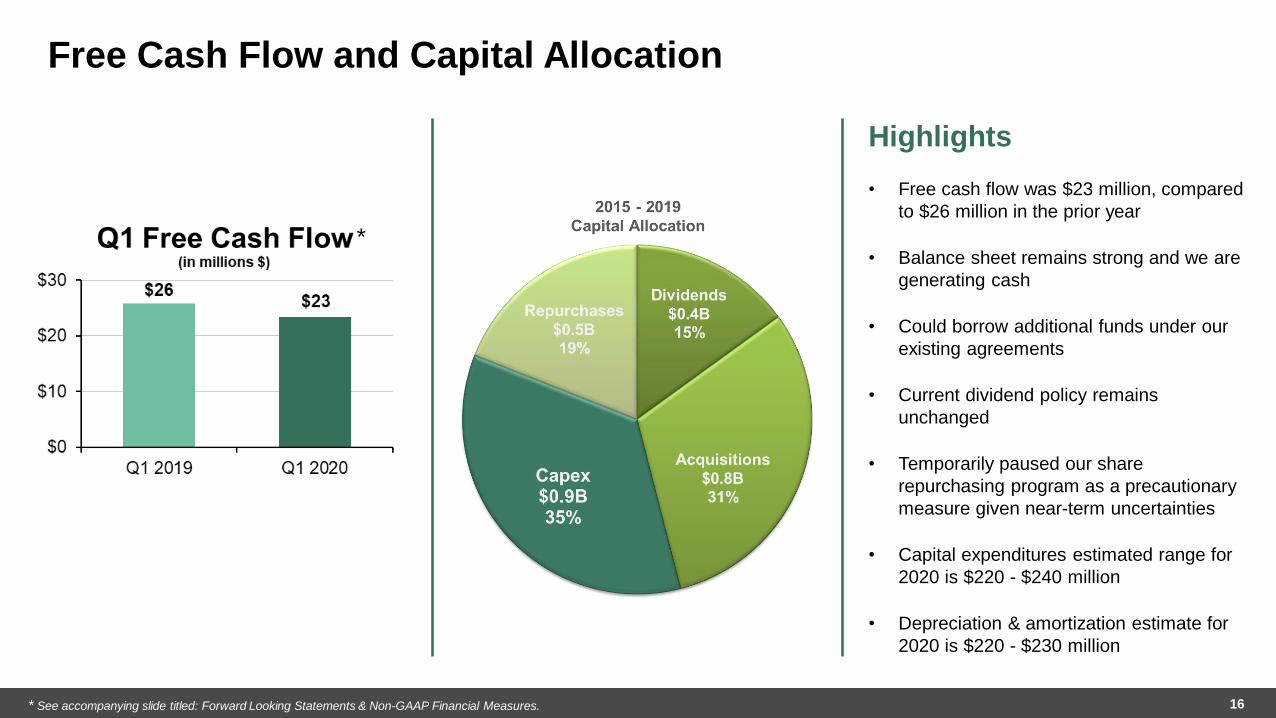
Free Cash Flow and Capital Allocation
16
Highlights
• Free cash flow was $23 million, compared
to $26 million in the prior year
• Balance sheet remains strong and we are
generating cash
• Could borrow additional funds under our
existing agreements
• Current dividend policy remains
unchanged
• Temporarily paused our share
repurchasing program as a precautionary
measure given near-term uncertainties
• Capital expenditures estimated range for
2020 is $220 - $240 million
• Depreciation & amortization estimate for
2020 is $220 - $230 million
* See accompanying slide titled: Forward Looking Statements & Non-GAAP Financial Measures.
*
17
Presentation Key Takeaways
• Living our purpose and responsibility to society
• Product solutions play an important role in everyday life
• Incredible employees who are rising to the challenge
• Long-term opportunities for growth and value creation are intact
• Operating in diverse and attractive markets with expansive
customer base
• Navigating near-term challenges with our strong balance sheet,
cash flow generation ability, cost containment efforts and focus
on our customers