Embed Size (px)
Citation preview

First Quarter 2019Financial Highlights
April 17, 2019
2 First Quarter 2019 – Financial HighlightsFirst Quarter 2019 – Financial Highlights2
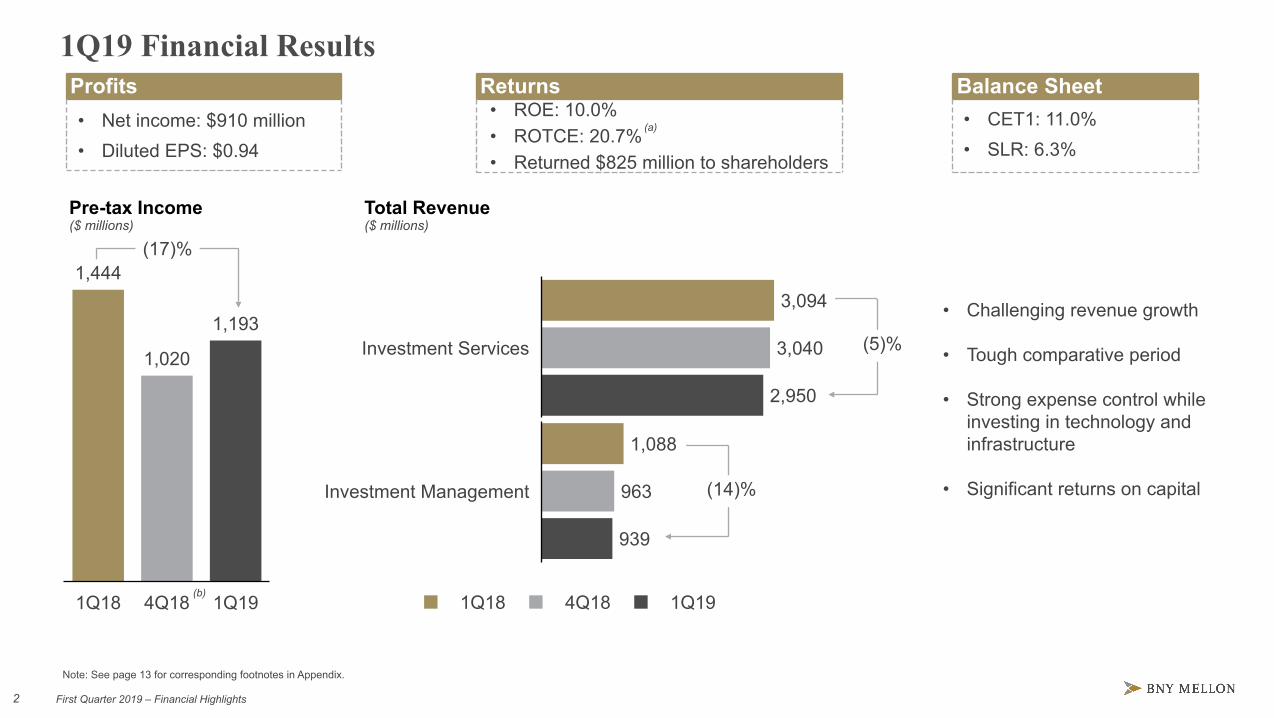
• ROE: 10.0%• ROTCE: 20.7%• Returned $825 million to shareholders
1Q19 Financial Results
1Q18 4Q18 1Q19
1,444
1,020
1,193
Profits• Net Income $910 million, (20)% y/y• Diluted EPS $0.94, (15)% y/y
Returns• ROE: X.X%• ROTCE: XX.X%• Returns XYZ to shareholders
Balance Sheet• CET1: 1X.X%• SLR: X.X%• LCR: XXX% Pre-tax Income
($ millions)
• Challenging revenue growth
• Tough comparative period
• Strong expense control whileinvesting in technology andinfrastructure
• Significant returns on capital
1Q18 4Q18 1Q19
Investment Services
Investment Management
3,094
1,088
3,040
963
2,950
939
(17)%
(14)%
Profits Returns Balance Sheet
Note: See page 13 for corresponding footnotes in Appendix.
(a)
(b)
Total Revenue($ millions)
(5)%
• Net income: $910 million• Diluted EPS: $0.94
• CET1: 11.0%• SLR: 6.3%
3 First Quarter 2019 – Financial HighlightsFirst Quarter 2019 – Financial Highlights3
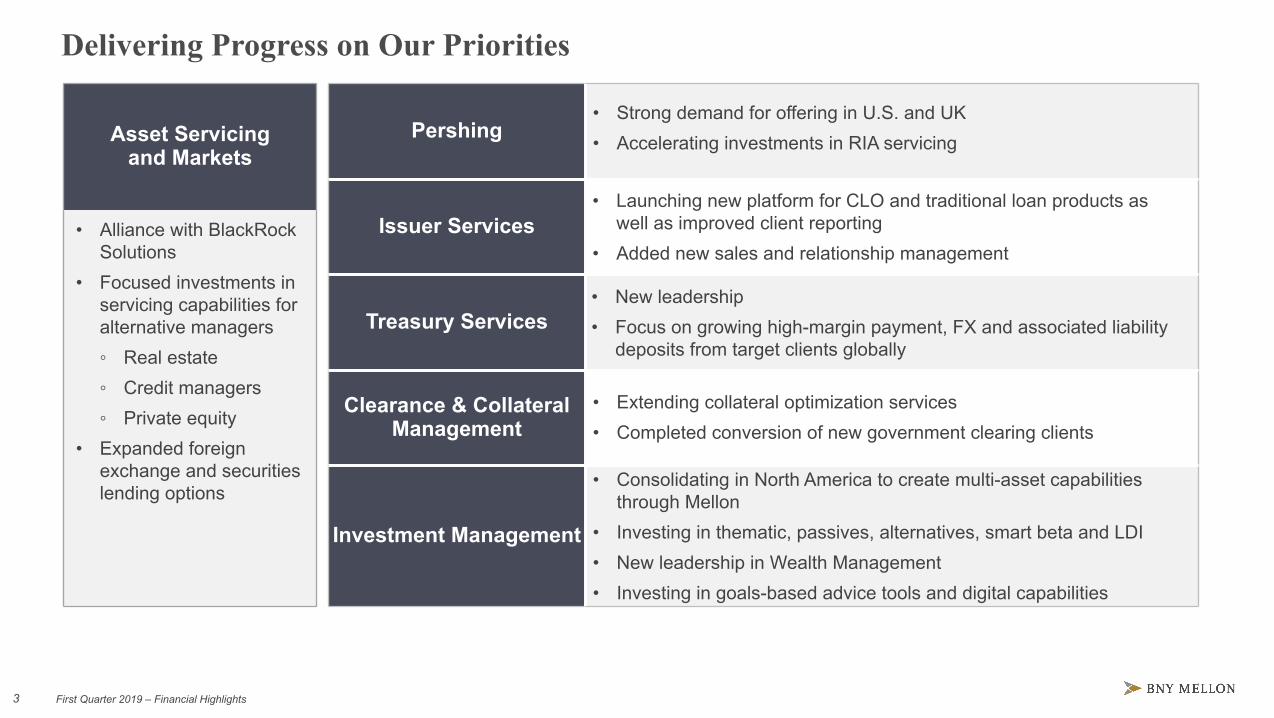
Asset Servicing and Markets
Pershing
Issuer Services
Treasury Services
Clearance & CollateralManagement
Investment Management
Delivering Progress on Our Priorities
• Strong demand for offering in U.S. and UK• Accelerating investments in RIA servicing
• Launching new platform for CLO and traditional loan products aswell as improved client reporting
• Added new sales and relationship management
• New leadership• Focus on growing high-margin payment, FX and associated liability
deposits from target clients globally
• Extending collateral optimization services• Completed conversion of new government clearing clients
• Consolidating in North America to create multi-asset capabilitiesthrough Mellon
• Investing in thematic, passives, alternatives, smart beta and LDI• New leadership in Wealth Management • Investing in goals-based advice tools and digital capabilities
• Alliance with BlackRockSolutions
• Focused investments inservicing capabilities foralternative managers◦ Real estate◦ Credit managers◦ Private equity
• Expanded foreignexchange and securitieslending options
4 First Quarter 2019 – Financial HighlightsFirst Quarter 2019 – Financial Highlights4
• Fee revenue, down 9%, primarily reflects◦ Adverse impact of currency, cumulative
AUM outflows during 2018 anddivestitures
• Net interest revenue, down 8%, primarilyreflects◦ Lower client deposits and loans
• Noninterest expense, down 1%, primarilyreflects◦ Increased investments in technology◦ Partially offset by favorable impact of a
stronger U.S. dollar, lower staff expenseand bank assessment charges
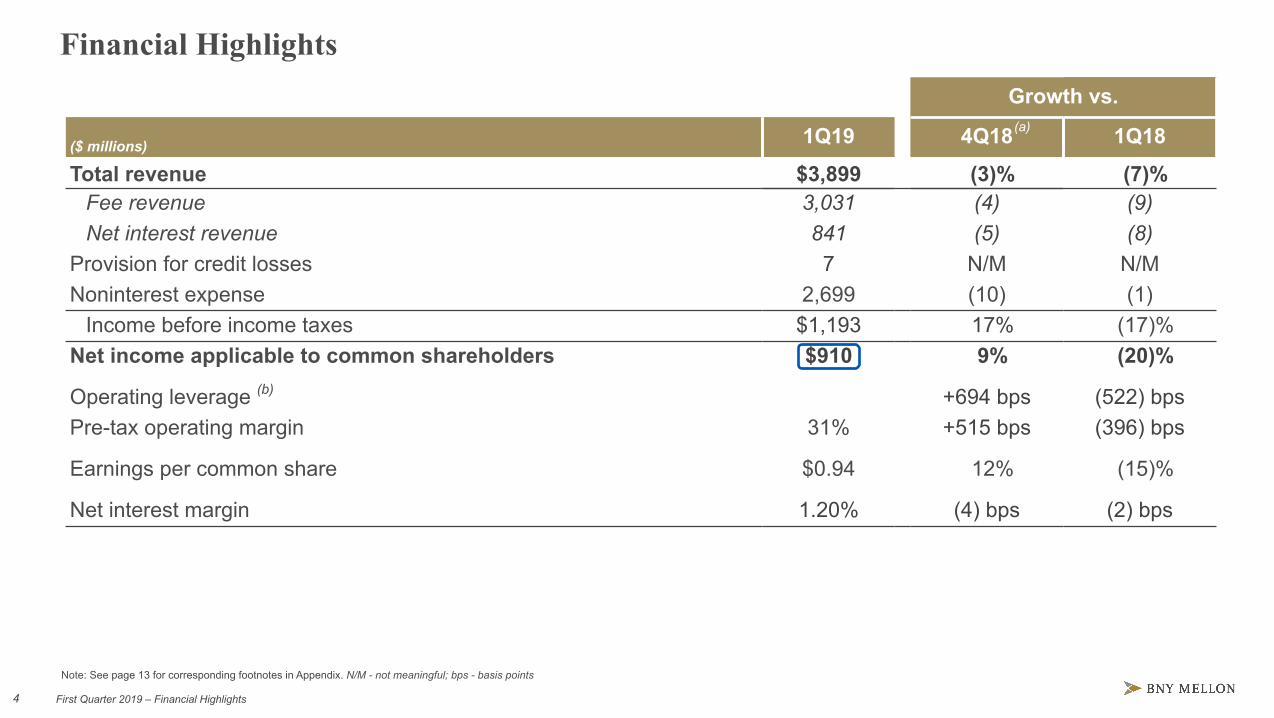
Financial HighlightsGrowth vs.
($ millions) 1Q19 4Q18 1Q18
Total revenue $3,899 (3)% (7)%Fee revenue 3,031 (4) (9)Net interest revenue 841 (5) (8)
Provision for credit losses 7 N/M N/MNoninterest expense 2,699 (10) (1)
Income before income taxes $1,193 17% (17)%Net income applicable to common shareholders $910 9% (20)%
Operating leverage (b) +694 bps (522) bpsPre-tax operating margin 31% +515 bps (396) bps
Earnings per common share $0.94 12% (15)%
Net interest margin 1.20% (4) bps (2) bps
Performance Commentaryyear-over-year
(a)
Note: See page 13 for corresponding footnotes in Appendix. N/M - not meaningful; bps - basis points
5 First Quarter 2019 – Financial HighlightsFirst Quarter 2019 – Financial Highlights5
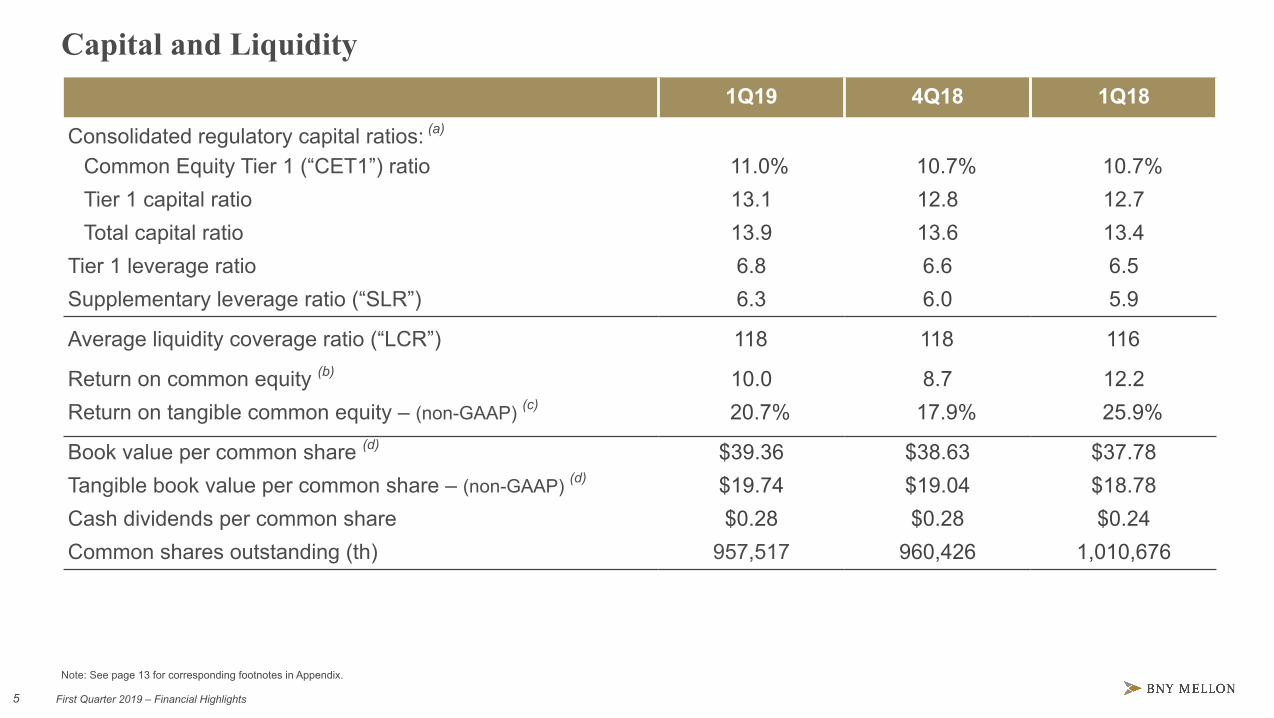
Capital and Liquidity1Q19 4Q18 1Q18
Consolidated regulatory capital ratios: (a)
Common Equity Tier 1 (“CET1”) ratio 11.0% 10.7% 10.7%Tier 1 capital ratio 13.1 12.8 12.7Total capital ratio 13.9 13.6 13.4
Tier 1 leverage ratio 6.8 6.6 6.5Supplementary leverage ratio (“SLR”) 6.3 6.0 5.9
Average liquidity coverage ratio (“LCR”) 118 118 116
Return on common equity (b) 10.0 8.7 12.2Return on tangible common equity – (non-GAAP) (c) 20.7% 17.9% 25.9%
Book value per common share (d) $39.36 $38.63 $37.78Tangible book value per common share – (non-GAAP) (d) $19.74 $19.04 $18.78Cash dividends per common share $0.28 $0.28 $0.24Common shares outstanding (th) 957,517 960,426 1,010,676
• Strong capital and shareholder returns
• In compliance with the new TLAC ratio requirementsthat became effective 1Q19
• Total Payout ratio: ~91%◦ Dividend: 30%◦ Share Repurchase: 61%
Performance Commentaryyear-over-year
Note: See page 13 for corresponding footnotes in Appendix.
6 First Quarter 2019 – Financial HighlightsFirst Quarter 2019 – Financial Highlights6
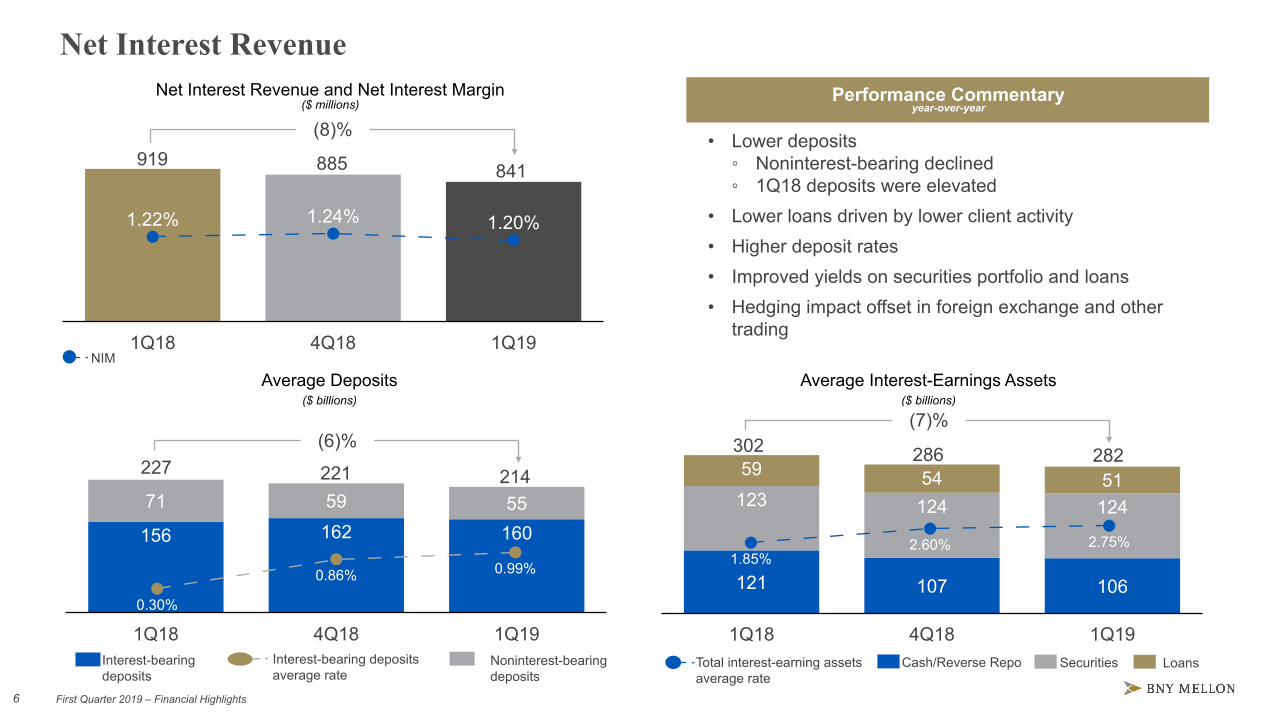
• Lower deposits◦ Noninterest-bearing declined◦ 1Q18 deposits were elevated
• Lower loans driven by lower client activity• Higher deposit rates• Improved yields on securities portfolio and loans• Hedging impact offset in foreign exchange and other
trading
Net Interest RevenuePerformance Commentary
year-over-year
1Q18 4Q18 1Q19
156 162 160
71 59 55
1Q18 4Q18 1Q19
121 107 106
123 124 124
59 54 51
Interest-bearingdeposits
Noninterest-bearing deposits
Net Interest Revenue and Net Interest Margin($ millions)
1Q18 4Q18 1Q19
1.22% 1.24% 1.20%
Average Interest-Earnings Assets ($ billions)
Average Deposits ($ billions)
302 286 282227 221 214
Securities LoansCash/Reverse Repo
NIM
0.30%
0.86% 0.99%
Interest-bearing depositsaverage rate
(7)%
919 885 841
1.85%2.60% 2.75%
Total interest-earning assetsaverage rate
(6)%
(8)%
7 First Quarter 2019 – Financial HighlightsFirst Quarter 2019 – Financial Highlights7
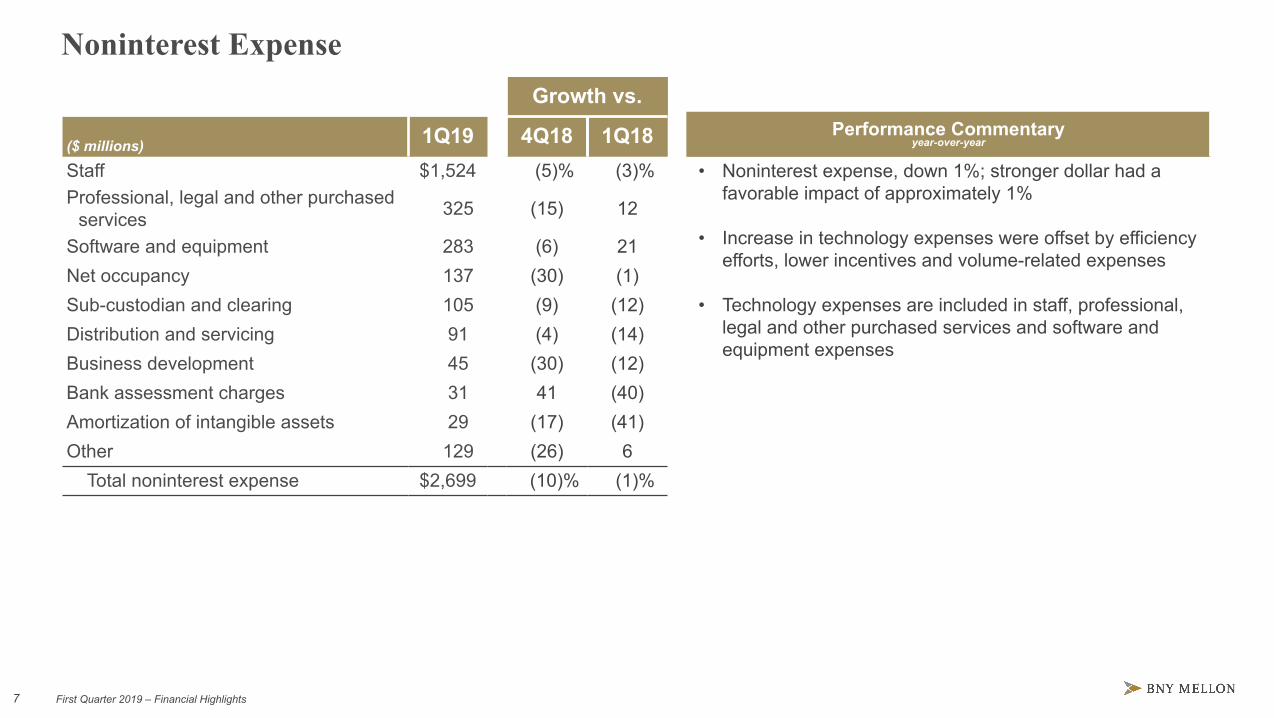
Noninterest ExpenseGrowth vs.
($ millions) 1Q19 4Q18 1Q18Staff $1,524 (5)% (3)%Professional, legal and other purchased
services 325 (15) 12
Software and equipment 283 (6) 21 Net occupancy 137 (30) (1) Sub-custodian and clearing 105 (9) (12) Distribution and servicing 91 (4) (14) Business development 45 (30) (12) Bank assessment charges 31 41 (40) Amortization of intangible assets 29 (17) (41) Other 129 (26) 6 Total noninterest expense $2,699 (10)% (1)%
• Noninterest expense, down 1%; stronger dollar had afavorable impact of approximately 1%
• Increase in technology expenses were offset by efficiencyefforts, lower incentives and volume-related expenses
• Technology expenses are included in staff, professional,legal and other purchased services and software andequipment expenses
Performance Commentaryyear-over-year
8 First Quarter 2019 – Financial HighlightsFirst Quarter 2019 – Financial Highlights8
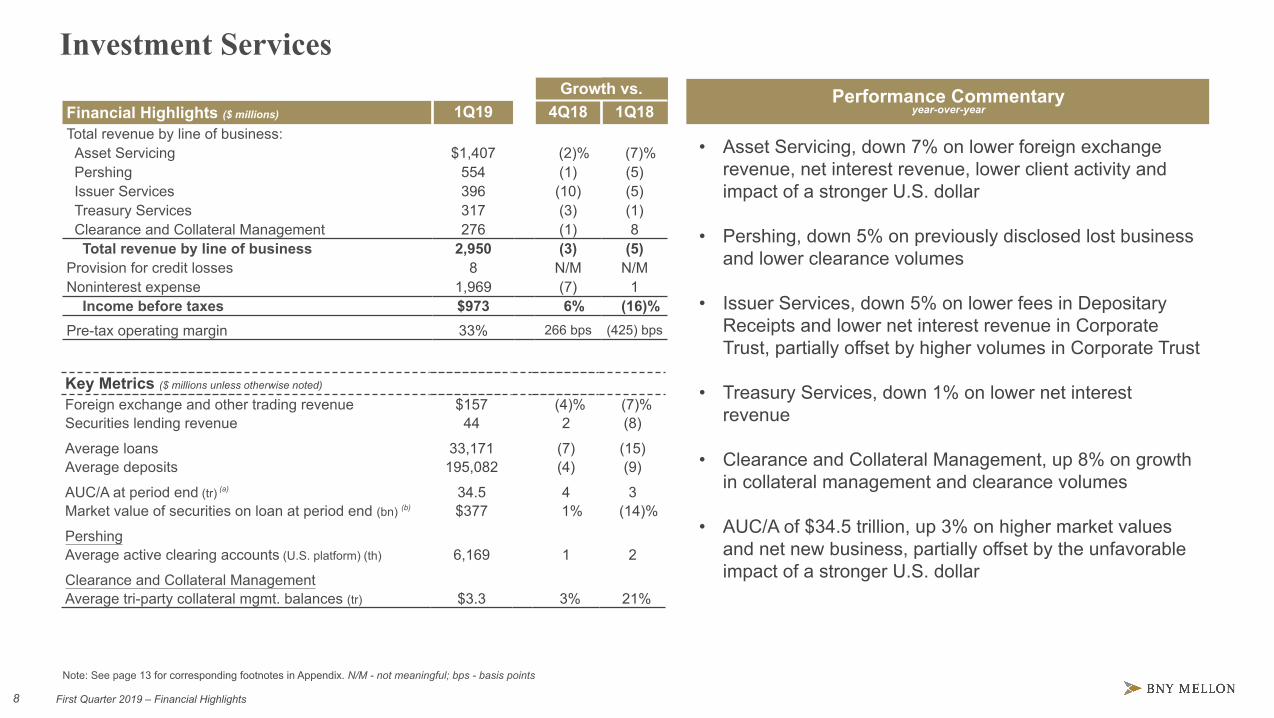
Key Metrics ($ millions unless otherwise noted)
Foreign exchange and other trading revenue $157 (4)% (7)%Securities lending revenue 44 2 (8)
Average loans 33,171 (7) (15)Average deposits 195,082 (4) (9)
AUC/A at period end (tr) (a) 34.5 4 3Market value of securities on loan at period end (bn) (b) $377 1% (14)%
PershingAverage active clearing accounts (U.S. platform) (th) 6,169 1 2
Clearance and Collateral ManagementAverage tri-party collateral mgmt. balances (tr) $3.3 3% 21%
Investment Services
Note: See page 13 for corresponding footnotes in Appendix. N/M - not meaningful; bps - basis points
Performance Commentaryyear-over-year
• Asset Servicing, down 7% on lower foreign exchangerevenue, net interest revenue, lower client activity andimpact of a stronger U.S. dollar
• Pershing, down 5% on previously disclosed lost businessand lower clearance volumes
• Issuer Services, down 5% on lower fees in DepositaryReceipts and lower net interest revenue in CorporateTrust, partially offset by higher volumes in Corporate Trust
• Treasury Services, down 1% on lower net interestrevenue
• Clearance and Collateral Management, up 8% on growthin collateral management and clearance volumes
• AUC/A of $34.5 trillion, up 3% on higher market valuesand net new business, partially offset by the unfavorableimpact of a stronger U.S. dollar
Growth vs.Financial Highlights ($ millions) 1Q19 4Q18 1Q18Total revenue by line of business:Asset Servicing $1,407 (2)% (7)%Pershing 554 (1) (5)Issuer Services 396 (10) (5)Treasury Services 317 (3) (1)Clearance and Collateral Management 276 (1) 8Total revenue by line of business 2,950 (3) (5)
Provision for credit losses 8 N/M N/MNoninterest expense 1,969 (7) 1
Income before taxes $973 6% (16)%Pre-tax operating margin 33% 266 bps (425) bps
9 First Quarter 2019 – Financial HighlightsFirst Quarter 2019 – Financial Highlights9
1Q18 1Q19
418 396
1Q18 1Q19
321 317
1Q18 1Q19
255 276
(5)%
Investment Services - Revenue Drivers
1Q18 1Q19
1,5191,407
(7)%
1Q18 1Q19
581 554
Asset Servicing Issuer ServicesPershing Treasury Services Clearance and Collateral
(5)%
(1)% 8%
- FX volumes andvolatility
- Deposit balances /pricing
- Client activity- Securities on loan
+ New clients+ Active clearing
accounts- Long-term mutual
fund assets- Transaction
volumes- Margin loans- Previously lost
business
+ Volumes inCorporate Trust
+ Depositary Receiptstransaction volume
- Deposit balances /pricing in CorporateTrust
- Depositary Receiptsfees timing
+ Interest-bearingdeposit balances
+ Payment volumes- Noninterest-bearing
deposits- Deposit pricing
+ Clients fully onboarded as of 4Q18
+ Average tri-partybalances
+ New clients- Loan balances
($ millions)
10 First Quarter 2019 – Financial HighlightsFirst Quarter 2019 – Financial Highlights10
Investment Management
Note: See page 13 for corresponding footnotes in Appendix. N/M - not meaningful; bps - basis points
Performance Commentaryyear-over-year
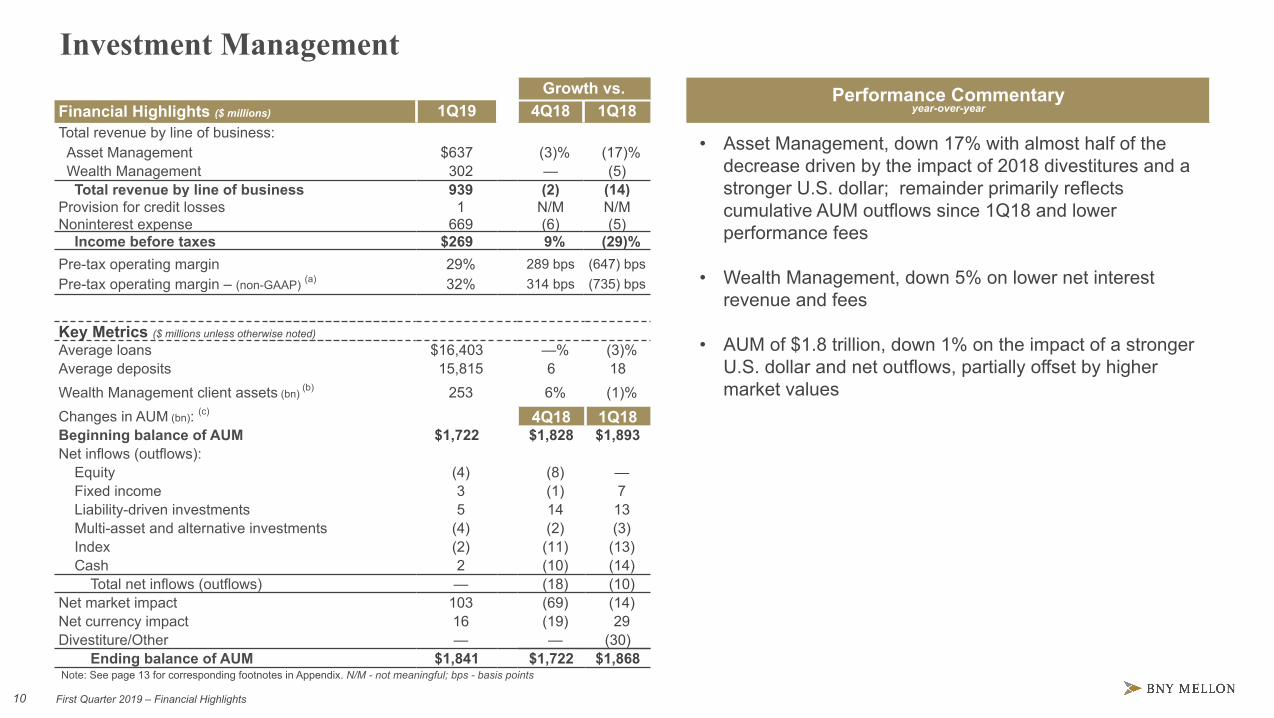
Growth vs.Financial Highlights ($ millions) 1Q19 4Q18 1Q18Total revenue by line of business:Asset Management $637 (3)% (17)%Wealth Management 302 — (5)Total revenue by line of business 939 (2) (14)
Provision for credit losses 1 N/M N/MNoninterest expense 669 (6) (5)
Income before taxes $269 9% (29)%Pre-tax operating margin 29% 289 bps (647) bpsPre-tax operating margin – (non-GAAP) (a) 32% 314 bps (735) bps
Key Metrics ($ millions unless otherwise noted)
Average loans $16,403 —% (3)%Average deposits 15,815 6 18Wealth Management client assets (bn) (b) 253 6% (1)%Changes in AUM (bn): (c) 4Q18 1Q18Beginning balance of AUM $1,722 $1,828 $1,893Net inflows (outflows):
Equity (4) (8) —Fixed income 3 (1) 7Liability-driven investments 5 14 13Multi-asset and alternative investments (4) (2) (3)Index (2) (11) (13)Cash 2 (10) (14)
Total net inflows (outflows) — (18) (10)Net market impact 103 (69) (14)Net currency impact 16 (19) 29Divestiture/Other — — (30)
Ending balance of AUM $1,841 $1,722 $1,868
• Asset Management, down 17% with almost half of thedecrease driven by the impact of 2018 divestitures and astronger U.S. dollar; remainder primarily reflectscumulative AUM outflows since 1Q18 and lowerperformance fees
• Wealth Management, down 5% on lower net interestrevenue and fees
• AUM of $1.8 trillion, down 1% on the impact of a strongerU.S. dollar and net outflows, partially offset by highermarket values
11 First Quarter 2019 – Financial HighlightsFirst Quarter 2019 – Financial Highlights11
Other SegmentPerformance Commentary
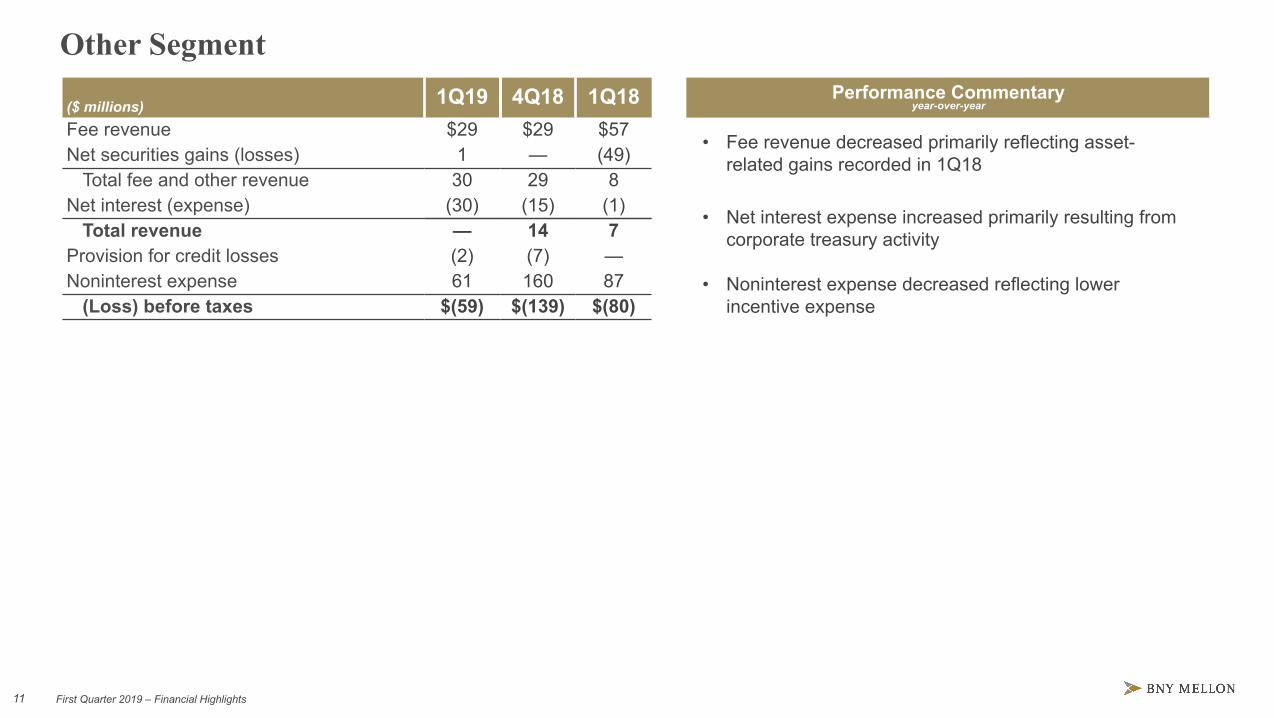
year-over-year($ millions) 1Q19 4Q18 1Q18Fee revenue $29 $29 $57Net securities gains (losses) 1 — (49)
Total fee and other revenue 30 29 8Net interest (expense) (30) (15) (1)
Total revenue — 14 7Provision for credit losses (2) (7) —Noninterest expense 61 160 87
(Loss) before taxes $(59) $(139) $(80)
• Fee revenue decreased primarily reflecting asset-related gains recorded in 1Q18
• Net interest expense increased primarily resulting fromcorporate treasury activity
• Noninterest expense decreased reflecting lowerincentive expense

Appendix
13 First Quarter 2019 – Financial HighlightsFirst Quarter 2019 – Financial Highlights13
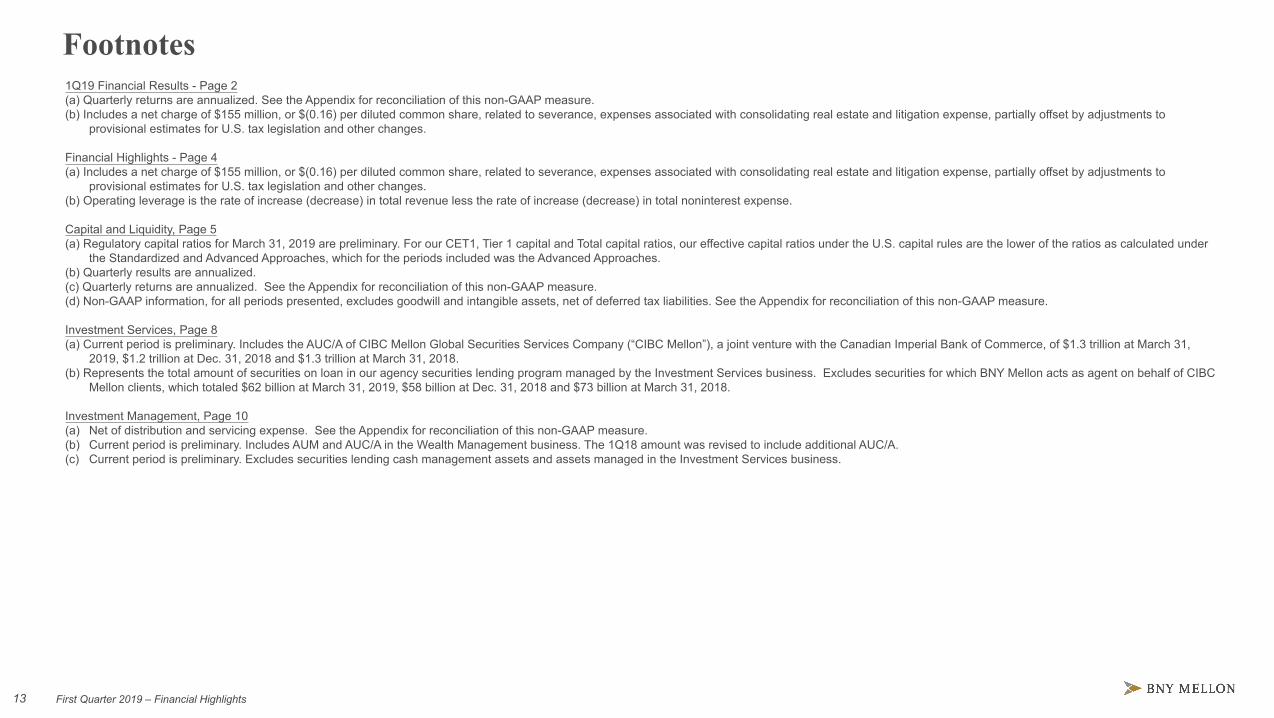
Footnotes1Q19 Financial Results - Page 2(a) Quarterly returns are annualized. See the Appendix for reconciliation of this non-GAAP measure. (b) Includes a net charge of $155 million, or $(0.16) per diluted common share, related to severance, expenses associated with consolidating real estate and litigation expense, partially offset by adjustments to
provisional estimates for U.S. tax legislation and other changes.
Financial Highlights - Page 4(a) Includes a net charge of $155 million, or $(0.16) per diluted common share, related to severance, expenses associated with consolidating real estate and litigation expense, partially offset by adjustments to
provisional estimates for U.S. tax legislation and other changes.(b) Operating leverage is the rate of increase (decrease) in total revenue less the rate of increase (decrease) in total noninterest expense.
Capital and Liquidity, Page 5(a) Regulatory capital ratios for March 31, 2019 are preliminary. For our CET1, Tier 1 capital and Total capital ratios, our effective capital ratios under the U.S. capital rules are the lower of the ratios as calculated under
the Standardized and Advanced Approaches, which for the periods included was the Advanced Approaches.(b) Quarterly results are annualized.(c) Quarterly returns are annualized. See the Appendix for reconciliation of this non-GAAP measure. (d) Non-GAAP information, for all periods presented, excludes goodwill and intangible assets, net of deferred tax liabilities. See the Appendix for reconciliation of this non-GAAP measure.
Investment Services, Page 8(a) Current period is preliminary. Includes the AUC/A of CIBC Mellon Global Securities Services Company (“CIBC Mellon”), a joint venture with the Canadian Imperial Bank of Commerce, of $1.3 trillion at March 31,
2019, $1.2 trillion at Dec. 31, 2018 and $1.3 trillion at March 31, 2018.(b) Represents the total amount of securities on loan in our agency securities lending program managed by the Investment Services business. Excludes securities for which BNY Mellon acts as agent on behalf of CIBC
Mellon clients, which totaled $62 billion at March 31, 2019, $58 billion at Dec. 31, 2018 and $73 billion at March 31, 2018.
Investment Management, Page 10(a) Net of distribution and servicing expense. See the Appendix for reconciliation of this non-GAAP measure. (b) Current period is preliminary. Includes AUM and AUC/A in the Wealth Management business. The 1Q18 amount was revised to include additional AUC/A.(c) Current period is preliminary. Excludes securities lending cash management assets and assets managed in the Investment Services business.
14 First Quarter 2019 – Financial HighlightsFirst Quarter 2019 – Financial Highlights14
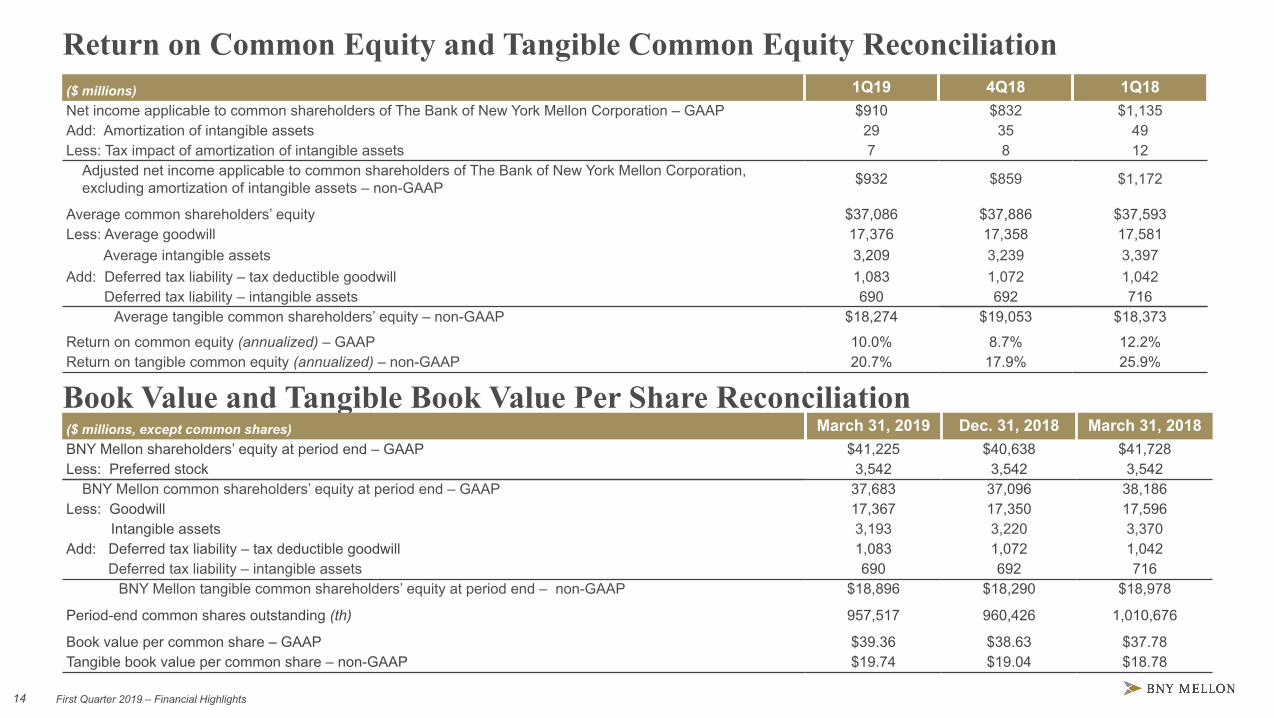
Return on Common Equity and Tangible Common Equity Reconciliation($ millions) 1Q19 4Q18 1Q18Net income applicable to common shareholders of The Bank of New York Mellon Corporation – GAAP $910 $832 $1,135Add: Amortization of intangible assets 29 35 49Less: Tax impact of amortization of intangible assets 7 8 12
Adjusted net income applicable to common shareholders of The Bank of New York Mellon Corporation,excluding amortization of intangible assets – non-GAAP $932 $859 $1,172
Average common shareholders’ equity $37,086 $37,886 $37,593Less: Average goodwill 17,376 17,358 17,581
Average intangible assets 3,209 3,239 3,397Add: Deferred tax liability – tax deductible goodwill 1,083 1,072 1,042
Deferred tax liability – intangible assets 690 692 716Average tangible common shareholders’ equity – non-GAAP $18,274 $19,053 $18,373
Return on common equity (annualized) – GAAP 10.0% 8.7% 12.2%Return on tangible common equity (annualized) – non-GAAP 20.7% 17.9% 25.9%
Book Value and Tangible Book Value Per Share Reconciliation($ millions, except common shares) March 31, 2019 Dec. 31, 2018 March 31, 2018BNY Mellon shareholders’ equity at period end – GAAP $41,225 $40,638 $41,728Less: Preferred stock 3,542 3,542 3,542
BNY Mellon common shareholders’ equity at period end – GAAP 37,683 37,096 38,186Less: Goodwill 17,367 17,350 17,596 Intangible assets 3,193 3,220 3,370Add: Deferred tax liability – tax deductible goodwill 1,083 1,072 1,042
Deferred tax liability – intangible assets 690 692 716 BNY Mellon tangible common shareholders’ equity at period end – non-GAAP $18,896 $18,290 $18,978
Period-end common shares outstanding (th) 957,517 960,426 1,010,676
Book value per common share – GAAP $39.36 $38.63 $37.78Tangible book value per common share – non-GAAP $19.74 $19.04 $18.78
15 First Quarter 2019 – Financial HighlightsFirst Quarter 2019 – Financial Highlights15
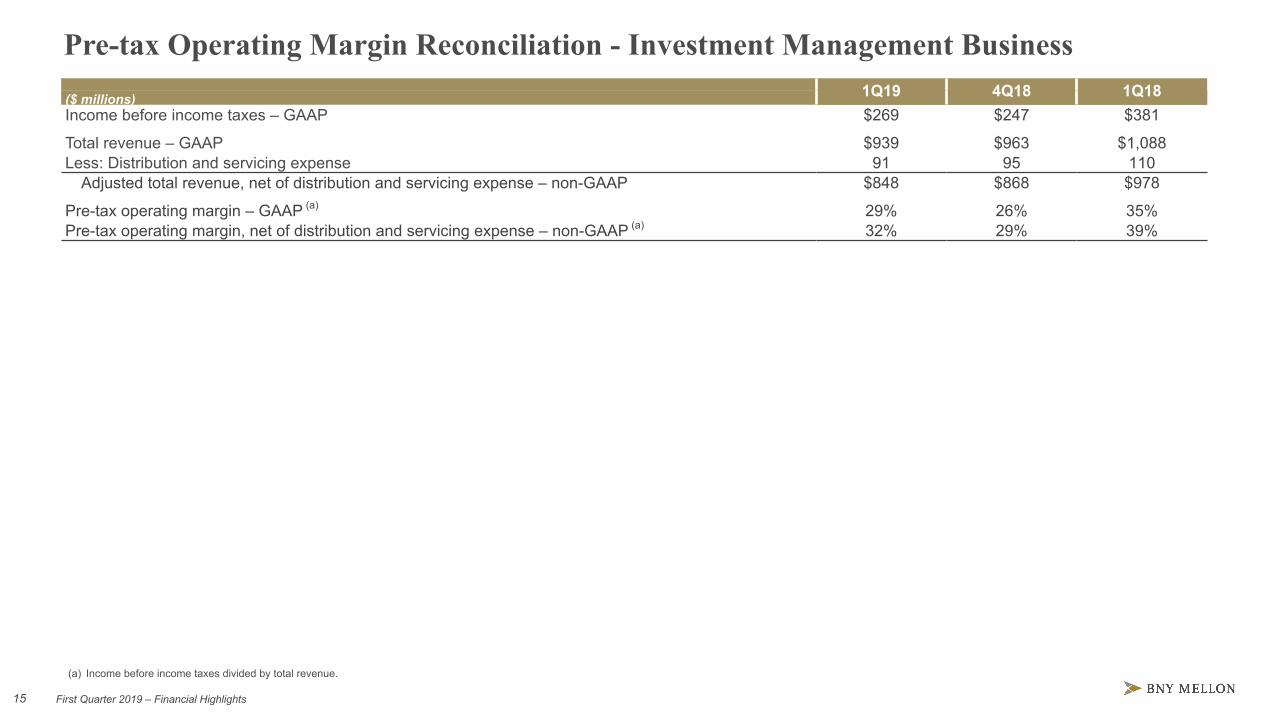
Pre-tax Operating Margin Reconciliation - Investment Management Business 1Q19 4Q18 1Q18($ millions)
Income before income taxes – GAAP $269 $247 $381
Total revenue – GAAP $939 $963 $1,088Less: Distribution and servicing expense 91 95 110
Adjusted total revenue, net of distribution and servicing expense – non-GAAP $848 $868 $978
Pre-tax operating margin – GAAP (a) 29% 26% 35%Pre-tax operating margin, net of distribution and servicing expense – non-GAAP (a) 32% 29% 39%
(a) Other charges include severance, litigation, an asset impairment and investment securities losses related to the sale of certain securities.
(a) Income before income taxes divided by total revenue.
16 First Quarter 2019 – Financial HighlightsFirst Quarter 2019 – Financial Highlights16
Cautionary StatementA number of statements in our presentations, the accompanying slides and the responses to your questions are “forward-lookingstatements.” Words such as “estimate,” “forecast,” “project,” “anticipate,” “likely,” “target,” “expect,” “intend,” “continue,” “seek,” “believe,”“plan,” “goal,” “could,” “should,” “would,” “may,” “might,” “will,” “strategy,” “synergies,” “opportunities,” “trends,” “future” and words of similarmeaning signify forward-looking statements. These statements relate to, among other things, The Bank of New York Mellon Corporation’s(the “Corporation”) expectations regarding: capital plans, strategic priorities, financial goals, organic growth and efficiency, investments,capabilities, revenue, expenses, deposits, interest rates and yield curves, taxes, business opportunities, preliminary business metrics andregulatory capital ratios; and statements regarding the Corporation's aspirations, as well as the Corporation’s overall plans, strategies,goals, objectives, expectations, outlooks, estimates, intentions, targets, opportunities and initiatives. These forward-looking statements arebased on assumptions that involve risks and uncertainties and that are subject to change based on various important factors (some ofwhich are beyond the Corporation’s control).
Actual outcomes may differ materially from those expressed or implied as a result of the factors described under “Forward LookingStatements” and “Risk Factors” in the Corporation’s Annual Report on Form 10-K for the year ended December 31, 2018 (the “2018 AnnualReport”) and in other filings of the Corporation with the Securities and Exchange Commission (the “SEC”). Such forward-looking statementsspeak only as of April 17, 2019, and the Corporation undertakes no obligation to update any forward-looking statement to reflect events orcircumstances after that date or to reflect the occurrence of unanticipated events. For additional information regarding the Corporation,please refer to the Corporation's SEC filings available at www.bnymellon.com/investorrelations.
Non-GAAP Measures: In this presentation we discuss some non-GAAP measures in detailing the Corporation’s performance, whichexclude certain items or otherwise include components that differ from GAAP. We believe these measures are useful to the investmentcommunity in analyzing the financial results and trends of ongoing operations. We believe they facilitate comparisons with prior periods andreflect the principal basis on which our management monitors financial performance. Additional disclosures relating to non-GAAP measuresare contained in the Corporation’s reports filed with the SEC, including the 2018 Annual Report, and are available at www.bnymellon.com/investorrelations.