Embed Size (px)
Citation preview

1
First Quarter 2019 Earnings Thursday, May 9, 2019
2
FIRST QUARTER 2019 EARNINGS
This presentation contains “forward-looking statements” as defined in the Private Securities Litigation Reform Act of 1995. Forward-lookingstatements contained herein speak only as of the date they are made and give our current expectations or forecasts of future events. Theseforward-looking statements can be identified by the use of forward-looking words, such as “may,” “could,” “should,” “estimate,” “project,”“forecast,” “intend,” “expect,” “anticipate,” “believe,” “target,” “plan” or other comparable words, or by discussions of strategy that may involverisks and uncertainties. These forward-looking statements are subject to numerous assumptions, risks and uncertainties which could materiallyaffect our business, financial condition or future results including, but not limited to, risks and uncertainties with respect to: the Company’sability to regain compliance with the NYSE’s continued listing standards and maintain such compliance; the Company’s leverage; liabilitiesimposed by the Company’s debt instruments; the Company’s ability to meet its covenants in the agreements governing its debt, includingthe requirement to reduce its first lien term loan, or obtain any amendments or waivers thereto; market demand; competitive factors; supplyconstraints; material and energy costs; technology factors; litigation; government and regulatory actions, including the impact of any tariffs,quotas or surcharges; the Company’s accounting policies; future trends; general economic and currency conditions; various conditionsspecific to the Company’s business and industry; the spin-off from TriMas Corporation; the success of our Action Plan, including the actualamount of savings and timing thereof; the success of our business improvement initiatives in Europe-Africa, including the amount of savingsand timing thereof; the Company's exposure to product liability claims from customers and end users, and the costs associated therewith;and other risks that are discussed in the Company’s most recent Annual Report on Form 10-K, Quarterly Reports on Form 10-Q or CurrentReports on Form 8-K. The risks described herein are not the only risks facing our Company. Additional risks and uncertainties not currentlyknown to us or that we currently deemed to be immaterial also may materially adversely affect our business, financial position and resultsof operations or cash flows. We caution readers not to place undue reliance on such statements, which speak only as of the date hereof.We do not undertake any obligation to review or confirm analysts’ expectations or estimates or to release publicly any revisions to any forward-looking statement to reflect events or circumstances after the date hereof or to reflect the occurrence of unanticipated events.
Forward-Looking Statements
3
FIRST QUARTER 2019 EARNINGS
Non-GAAP Financial Measures
(1) Refer to Appendix, "Company and Business Segment Financial Information" which details certain costs, expenses, other charges, and gains or income, collectively described as ''Special Items", that are includedin the determination of operating profit (loss) under GAAP, but that management would not consider important in evaluating the quality of the Company's operating results as they are not indicative of the Company'score operating results or may obscure trends useful in evaluating the Company's continuing activities. Accordingly, the Company presents adjusted operating profit (loss) and adjusted corporate expenses excludingthese Special Items to help investors evaluate our operating performance and trends in our business consistent with how management evaluates such performance and trends. Further, the Company presentsadjusted operating profit (loss) excluding these Special Items, to provide investors with a better understanding of the Company's view of the first quarter and full year results as compared to prior periods.
(2) We evaluate growth in our operations on both an as reported basis and a constant currency basis. The constant currency presentation, which is a non-GAAP measure, excludes the impact of fluctuations in foreigncurrency exchange rates. We believe providing constant currency information provides valuable supplemental information regarding our growth, consistent with how we evaluate our performance. Constant currencyrevenue results are calculated by translating current period revenue in local currency using the prior period’s currency conversion rate. This non-GAAP measure has limitations as an analytical tool and should notbe considered in isolation or as a substitute for an analysis of our results as reported under GAAP. Our use of this term may vary from the use of similarly-titled measures by other issuers due to the potentialinconsistencies in the method of calculation and differences due to items subject to interpretation. See Appendix, "Constant Currency Reconciliation".
(3) Refer to Appendix, "Additional Information Regarding Special Items Impacting Reported GAAP Financial Measures", which details certain costs, expenses, other charges, and gains or income, collectively describedas ''Special Items'' that are included in the determination of net income (loss) and earnings (loss) per share under GAAP, but that management would not consider important in evaluating the quality of the Company'soperating results as they are not indicative of the Company's core operating results or may obscure trends useful in evaluating the Company's continuing activities. Accordingly, the Company presents adjusted netincome (loss) and adjusted diluted earnings (loss) per share excluding these Special Items to help investors evaluate our operating performance and trends in our business consistent with how management evaluatessuch performance and trends.
(4) "Working Capital" defined as "total current assets" excluding "cash and cash equivalents" and "deferred income taxes", less "total current liabilities" excluding "current maturities, long-term debt" and "short-termoperating lease liabilities".
In this presentation, certain non-GAAP financial measures may be used. Except as otherwise disclosed herein, reconciliations of non-GAAP financial measures to the most directly comparableGAAP financial measure may be found at the end of this presentation. Additional information is available at www.horizonglobal.com.

4
FIRST QUARTER 2019 EARNINGS
OUR VISION: Empowering People to Live, Work, and Play
Our global business is focused on top-qualitytowing and trailering products and solutions forcommercial and recreational use:
WORKAgricultural, automotive, construction, fleet,industrial marine, military, mining, andmunicipalities
PLAYPower sports, equestrian, recreational vehicle,specialty automotive, and truck accessory
5
FIRST QUARTER 2019 EARNINGS
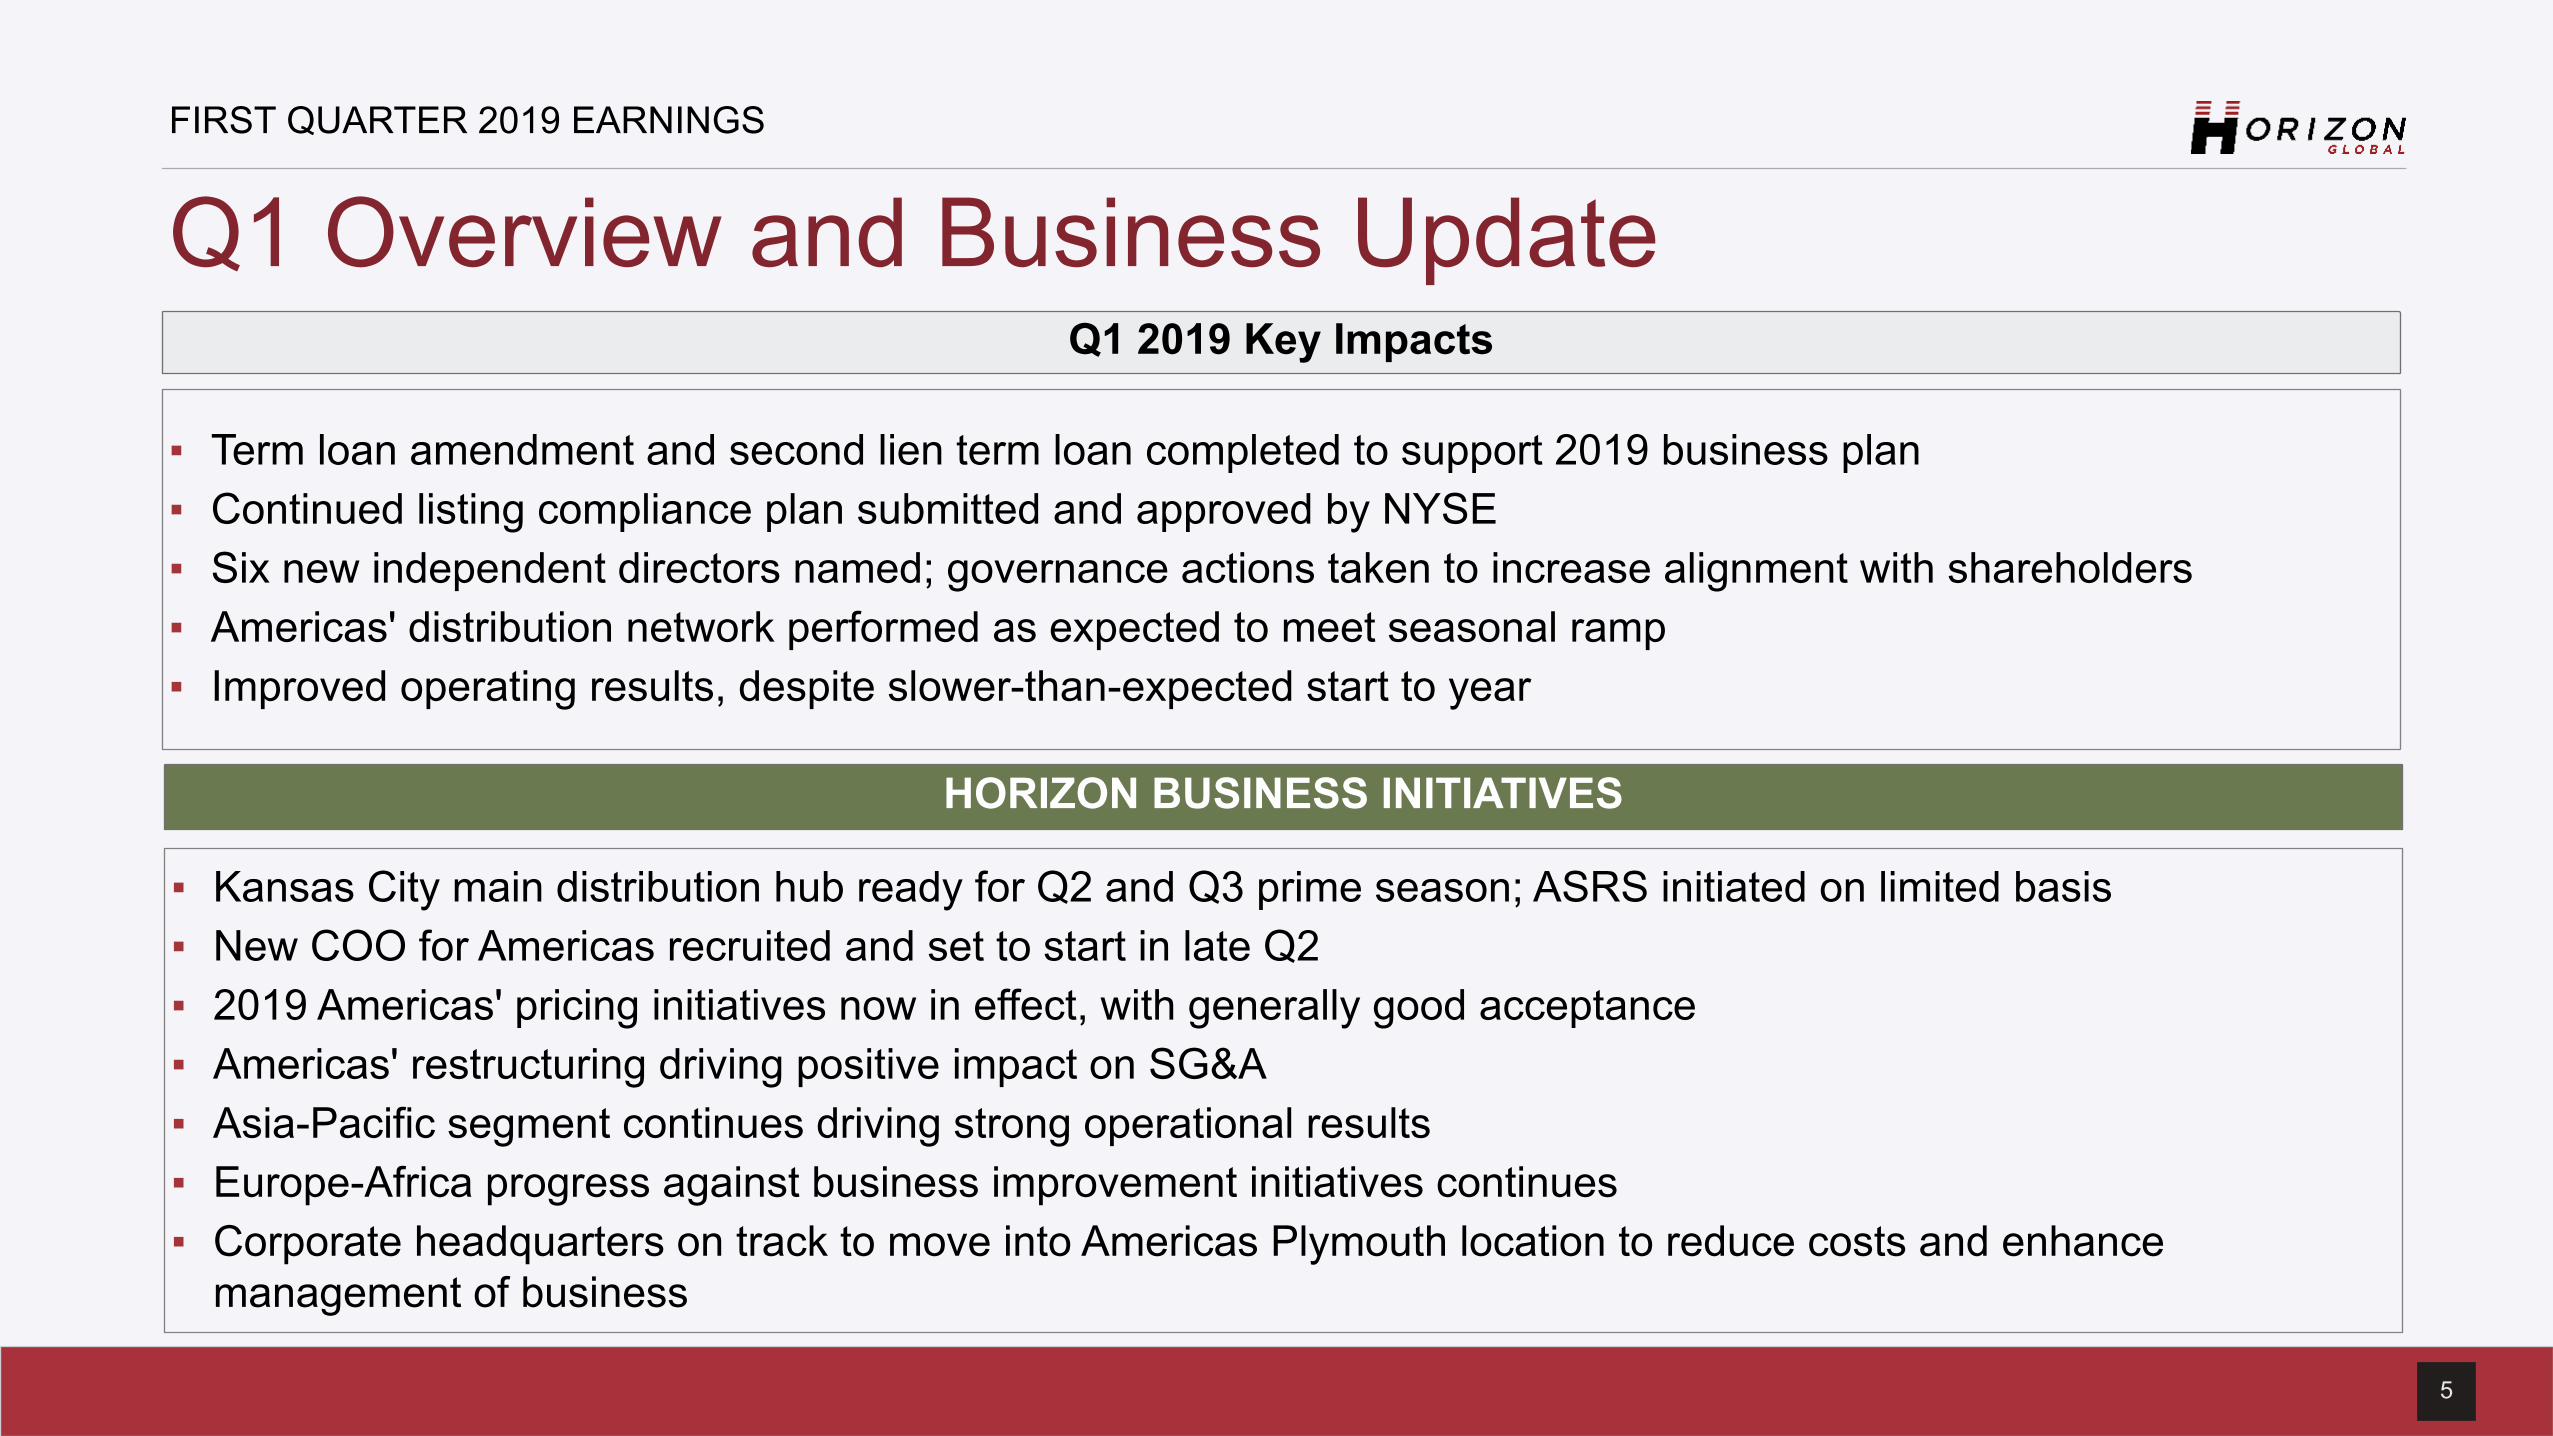
Q1 Overview and Business Update Q1 2019 Key Impacts
▪ Term loan amendment and second lien term loan completed to support 2019 business plan▪ Continued listing compliance plan submitted and approved by NYSE▪ Six new independent directors named; governance actions taken to increase alignment with shareholders▪ Americas' distribution network performed as expected to meet seasonal ramp▪ Improved operating results, despite slower-than-expected start to year
▪ Kansas City main distribution hub ready for Q2 and Q3 prime season; ASRS initiated on limited basis▪ New COO for Americas recruited and set to start in late Q2▪ 2019 Americas' pricing initiatives now in effect, with generally good acceptance▪ Americas' restructuring driving positive impact on SG&A ▪ Asia-Pacific segment continues driving strong operational results▪ Europe-Africa progress against business improvement initiatives continues▪ Corporate headquarters on track to move into Americas Plymouth location to reduce costs and enhance
management of business
HORIZON BUSINESS INITIATIVES
6
FIRST QUARTER 2019 EARNINGS
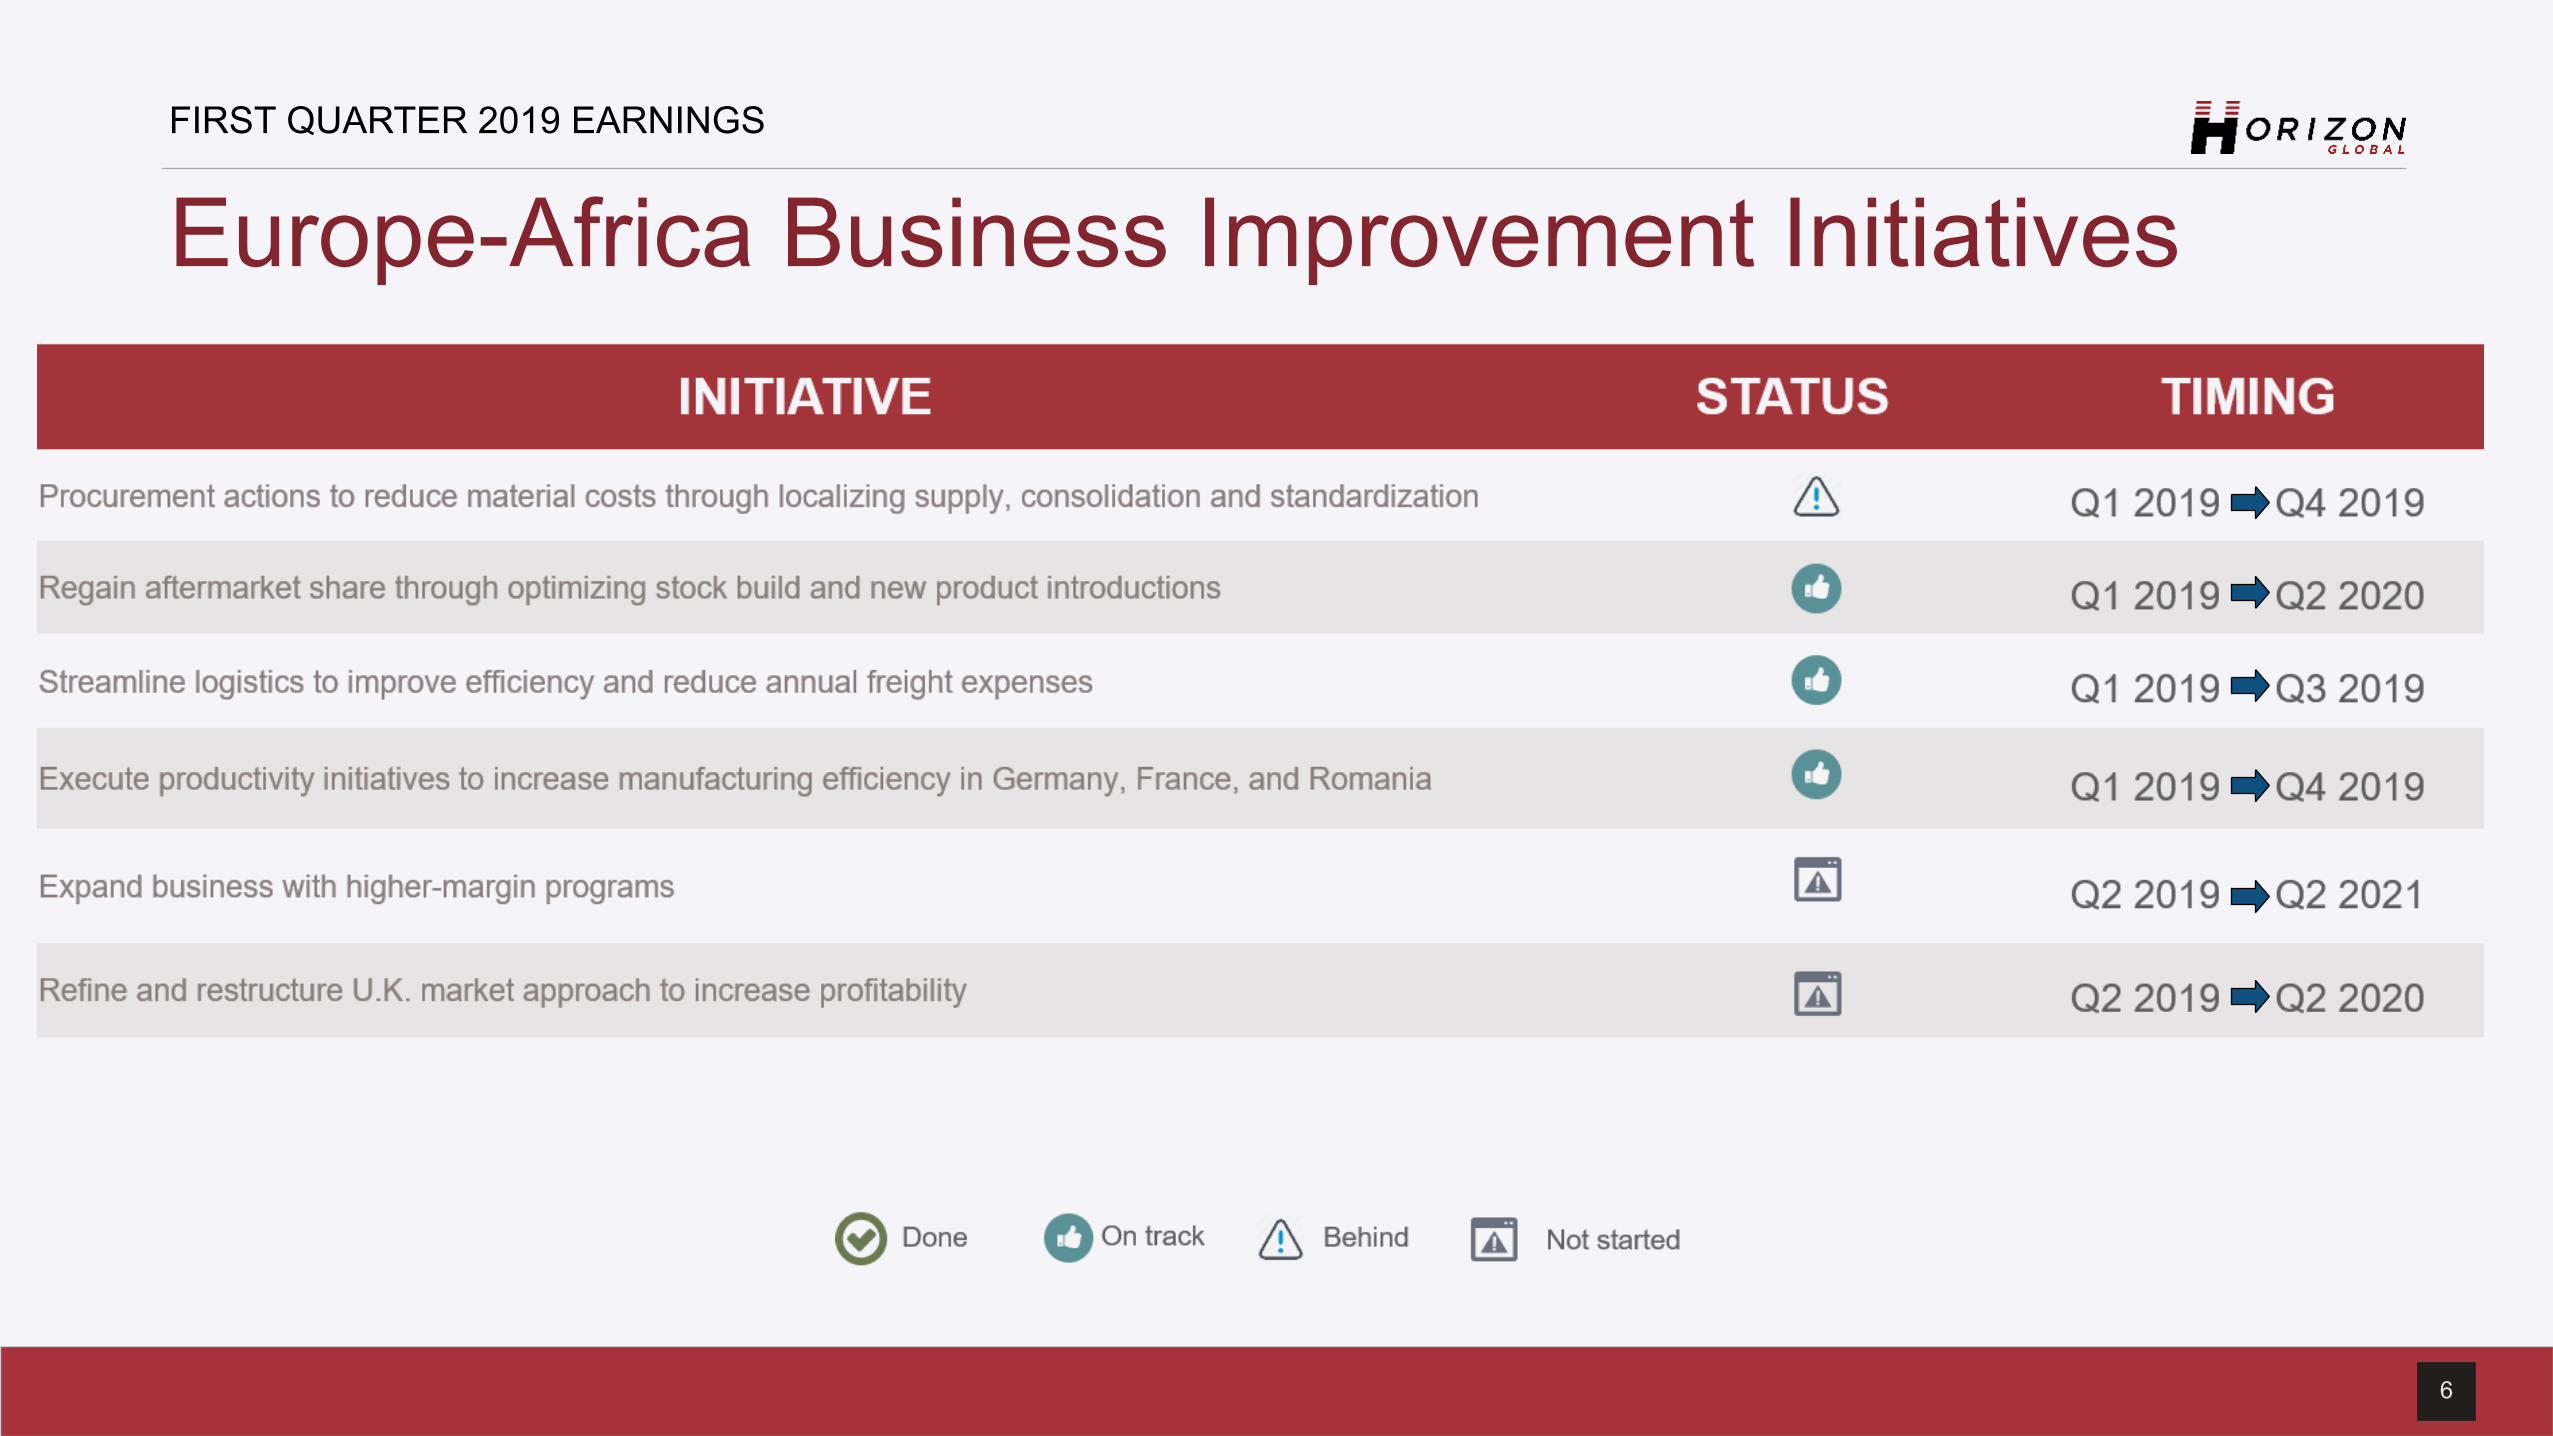
Europe-Africa Business Improvement Initiatives
7
FIRST QUARTER 2019 EARNINGS
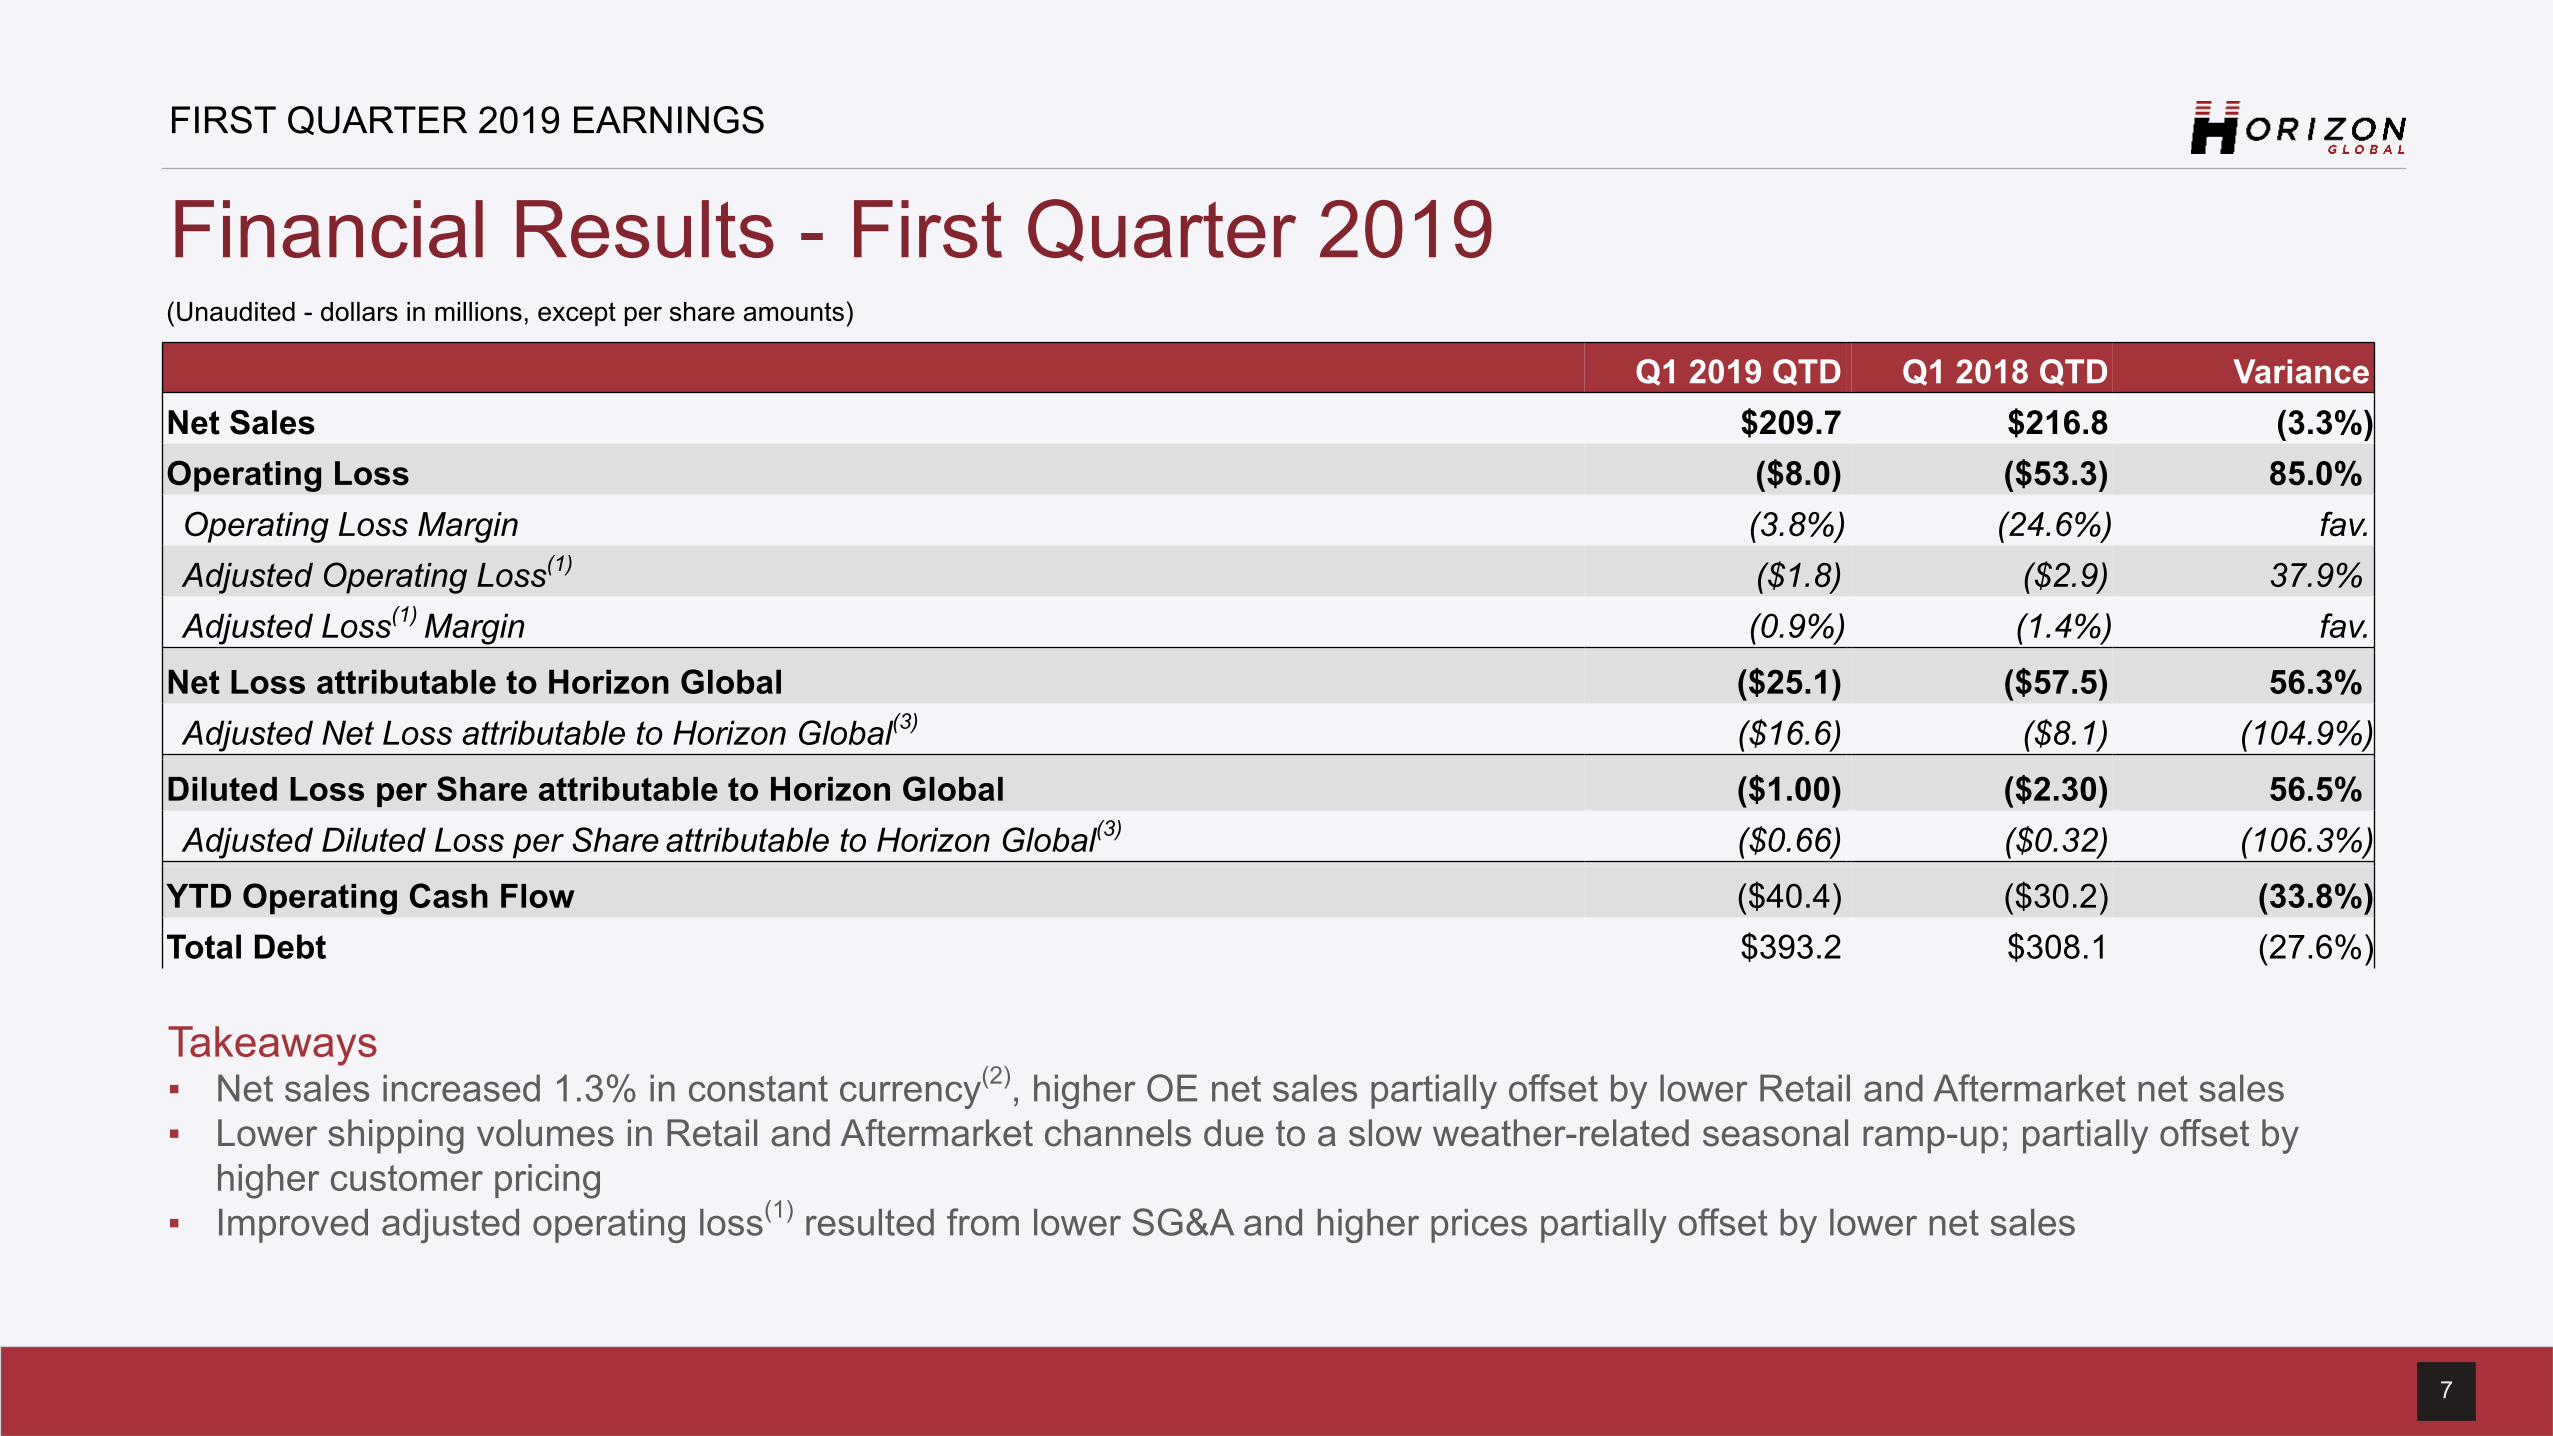
Financial Results - First Quarter 2019
Takeaways▪ Net sales increased 1.3% in constant currency(2), higher OE net sales partially offset by lower Retail and Aftermarket net sales▪ Lower shipping volumes in Retail and Aftermarket channels due to a slow weather-related seasonal ramp-up; partially offset by
higher customer pricing ▪ Improved adjusted operating loss(1) resulted from lower SG&A and higher prices partially offset by lower net sales
(Unaudited - dollars in millions, except per share amounts)
Q1 2019 QTD Q1 2018 QTD VarianceNet Sales $209.7 $216.8 (3.3%)Operating Loss ($8.0) ($53.3) 85.0%Operating Loss Margin (3.8%) (24.6%) fav.Adjusted Operating Loss(1) ($1.8) ($2.9) 37.9%Adjusted Loss(1) Margin (0.9%) (1.4%) fav.
Net Loss attributable to Horizon Global ($25.1) ($57.5) 56.3%Adjusted Net Loss attributable to Horizon Global(3) ($16.6) ($8.1) (104.9%)
Diluted Loss per Share attributable to Horizon Global ($1.00) ($2.30) 56.5%Adjusted Diluted Loss per Share attributable to Horizon Global(3) ($0.66) ($0.32) (106.3%)
YTD Operating Cash Flow ($40.4) ($30.2) (33.8%)Total Debt $393.2 $308.1 (27.6%)
8
FIRST QUARTER 2019 EARNINGS
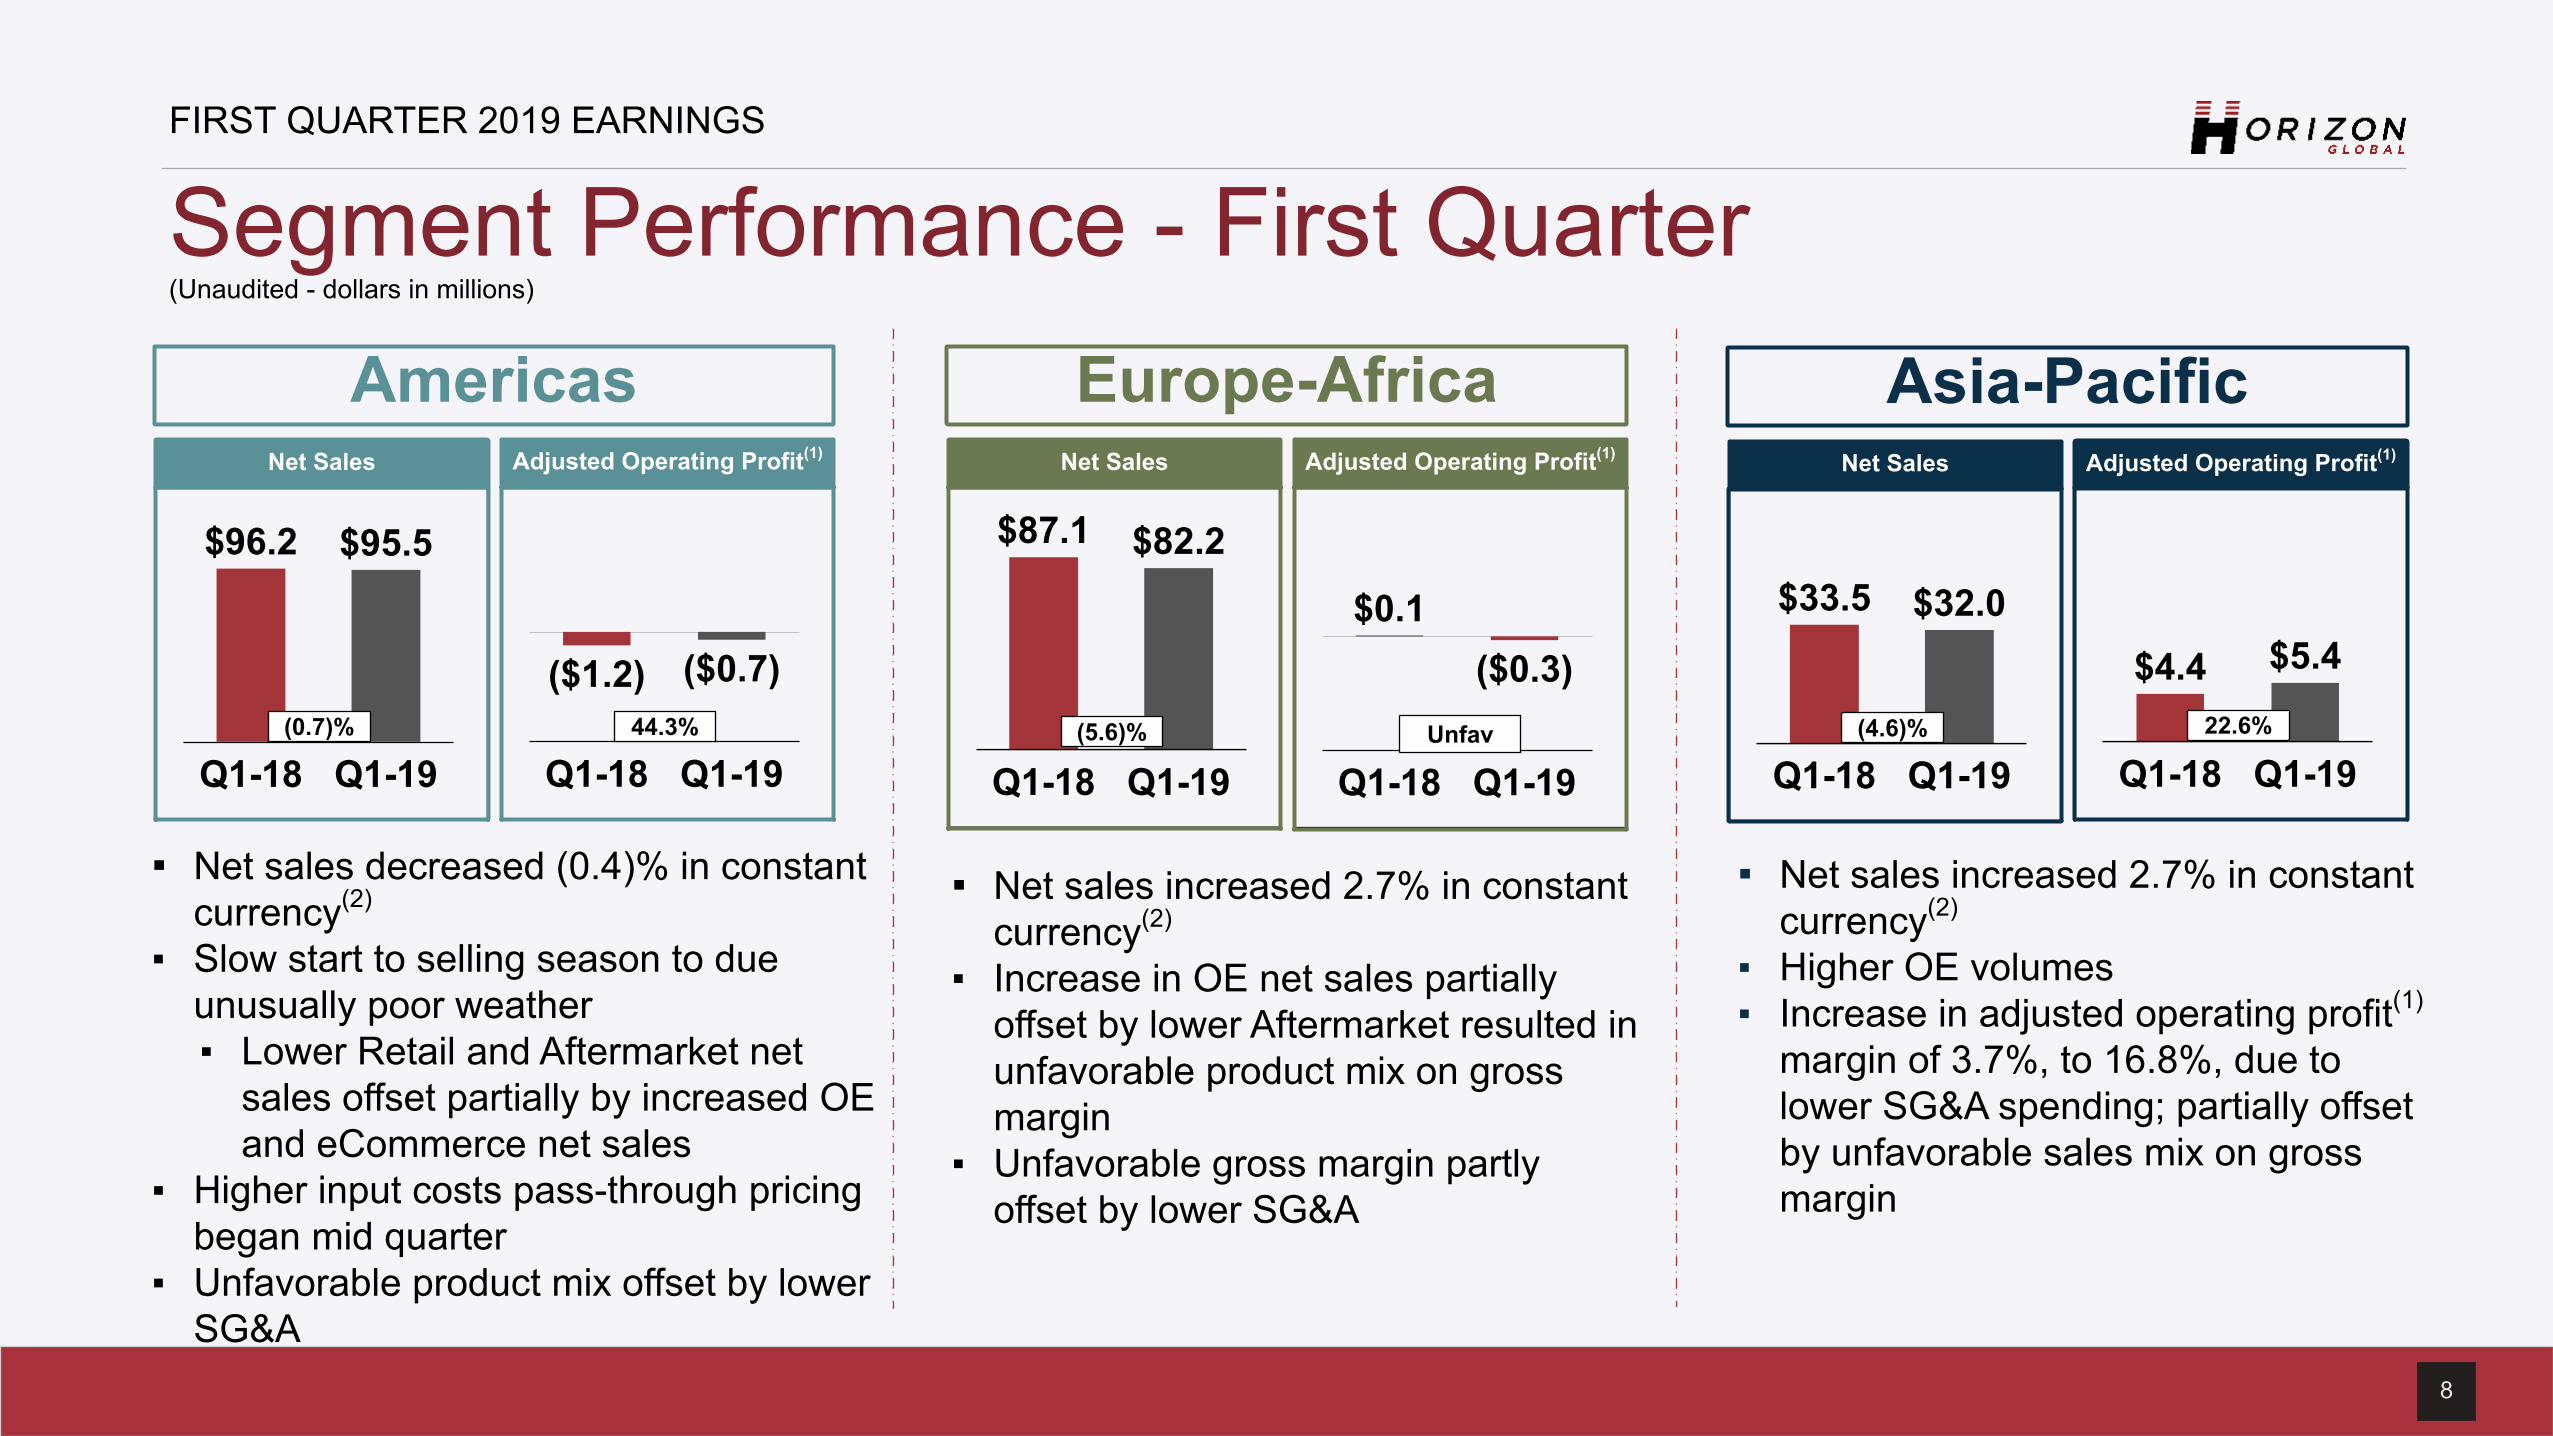
Segment Performance - First Quarter(Unaudited - dollars in millions)
Americas
▪ Net sales decreased (0.4)% in constantcurrency(2)
▪ Slow start to selling season to dueunusually poor weather ▪ Lower Retail and Aftermarket net
sales offset partially by increased OEand eCommerce net sales
▪ Higher input costs pass-through pricingbegan mid quarter
▪ Unfavorable product mix offset by lowerSG&A
Net Sales
Q1-18 Q1-19
$96.2 $95.5
Adjusted Operating Profit(1)
Q1-18 Q1-19
($1.2) ($0.7)
Europe-AfricaNet Sales
Q1-18 Q1-19
$87.1 $82.2
Adjusted Operating Profit(1)
Q1-18 Q1-19
$0.1($0.3)
Asia-PacificNet Sales
Q1-18 Q1-19
$33.5 $32.0
Adjusted Operating Profit(1)
Q1-18 Q1-19
$4.4 $5.4
▪ Net sales increased 2.7% in constantcurrency(2)
▪ Increase in OE net sales partiallyoffset by lower Aftermarket resulted inunfavorable product mix on grossmargin
▪ Unfavorable gross margin partlyoffset by lower SG&A
▪ Net sales increased 2.7% in constantcurrency(2)
▪ Higher OE volumes ▪ Increase in adjusted operating profit(1)
margin of 3.7%, to 16.8%, due tolower SG&A spending; partially offsetby unfavorable sales mix on grossmargin
(0.7)% 44.3% (5.6)% Unfav (4.6)% 22.6%
9
FIRST QUARTER 2019 EARNINGS
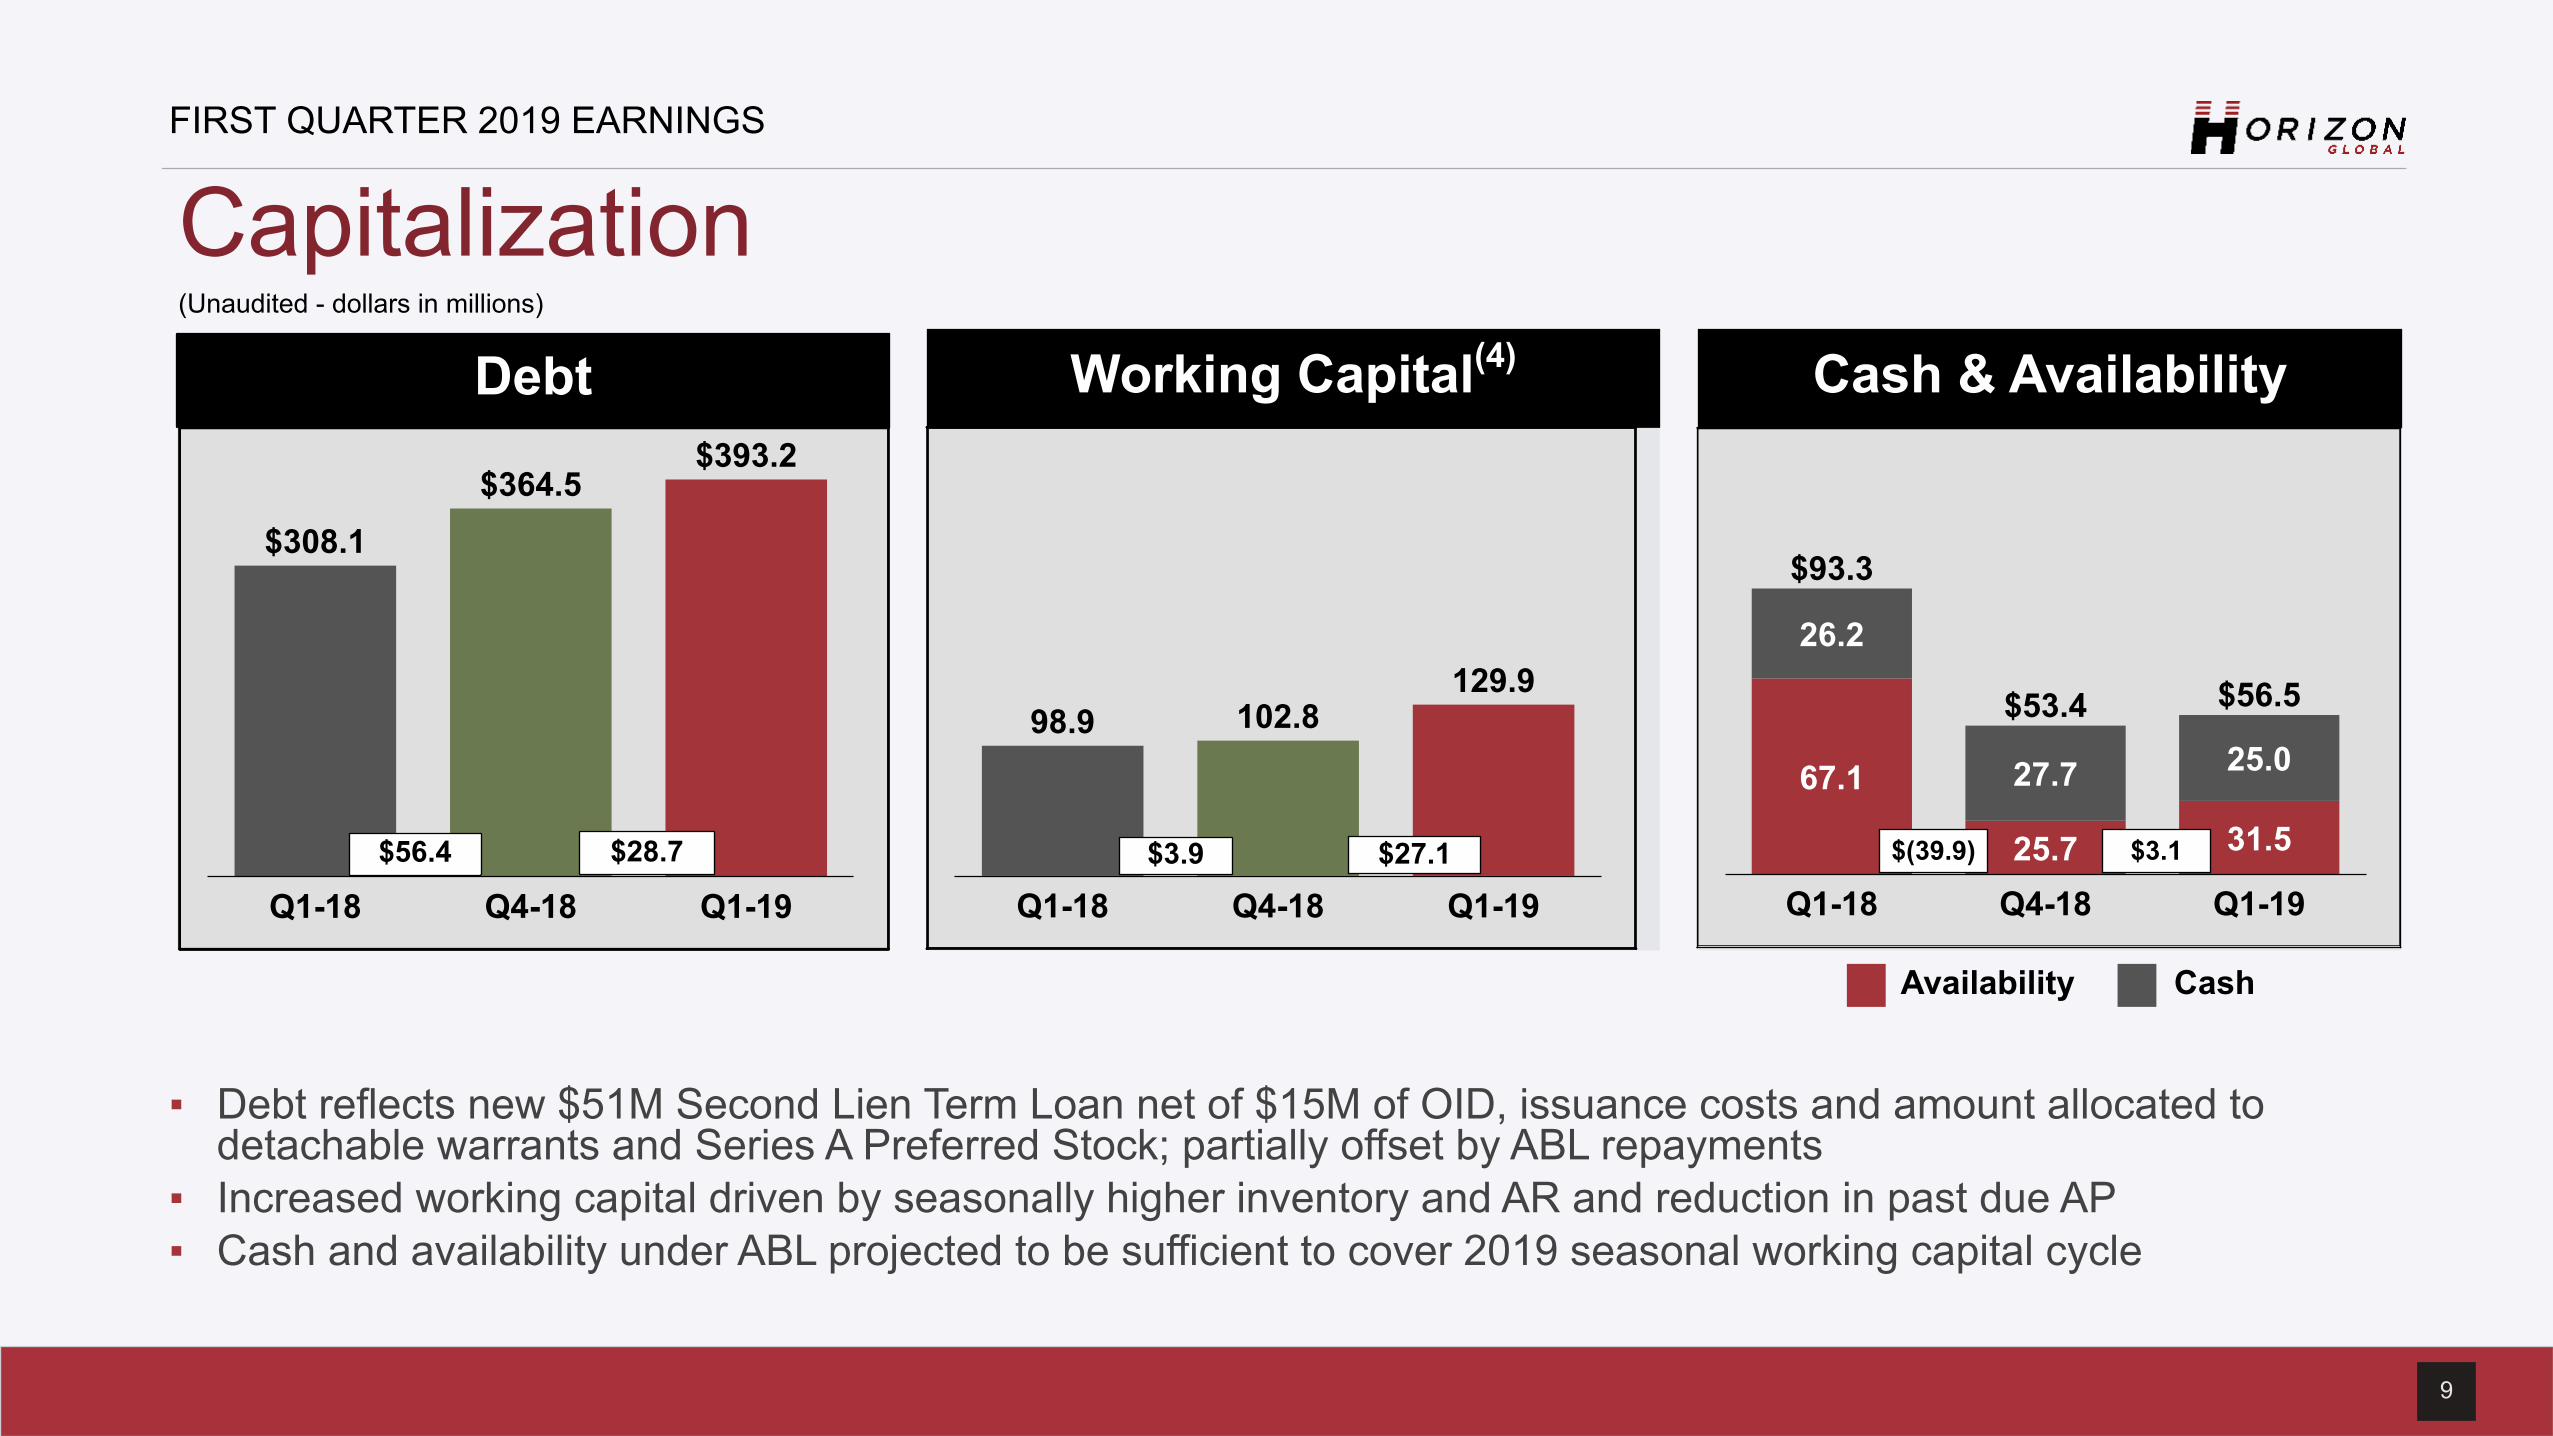
Capitalization (Unaudited - dollars in millions)
Debt Working Capital(4) Cash & Availability
▪ Debt reflects new $51M Second Lien Term Loan net of $15M of OID, issuance costs and amount allocated todetachable warrants and Series A Preferred Stock; partially offset by ABL repayments
▪ Increased working capital driven by seasonally higher inventory and AR and reduction in past due AP▪ Cash and availability under ABL projected to be sufficient to cover 2019 seasonal working capital cycle
Q1-18 Q4-18 Q1-19
$308.1$364.5
$393.2
$56.4 $28.7
Q1-18 Q4-18 Q1-19
98.9 102.8129.9
$3.9
Q1-18 Q4-18 Q1-19
67.1
25.7 31.5
26.2
$93.3
27.7
$53.425.0
$56.5
CashAvailability
$(39.9) $27.1 $3.1
10
FIRST QUARTER 2019 EARNINGS
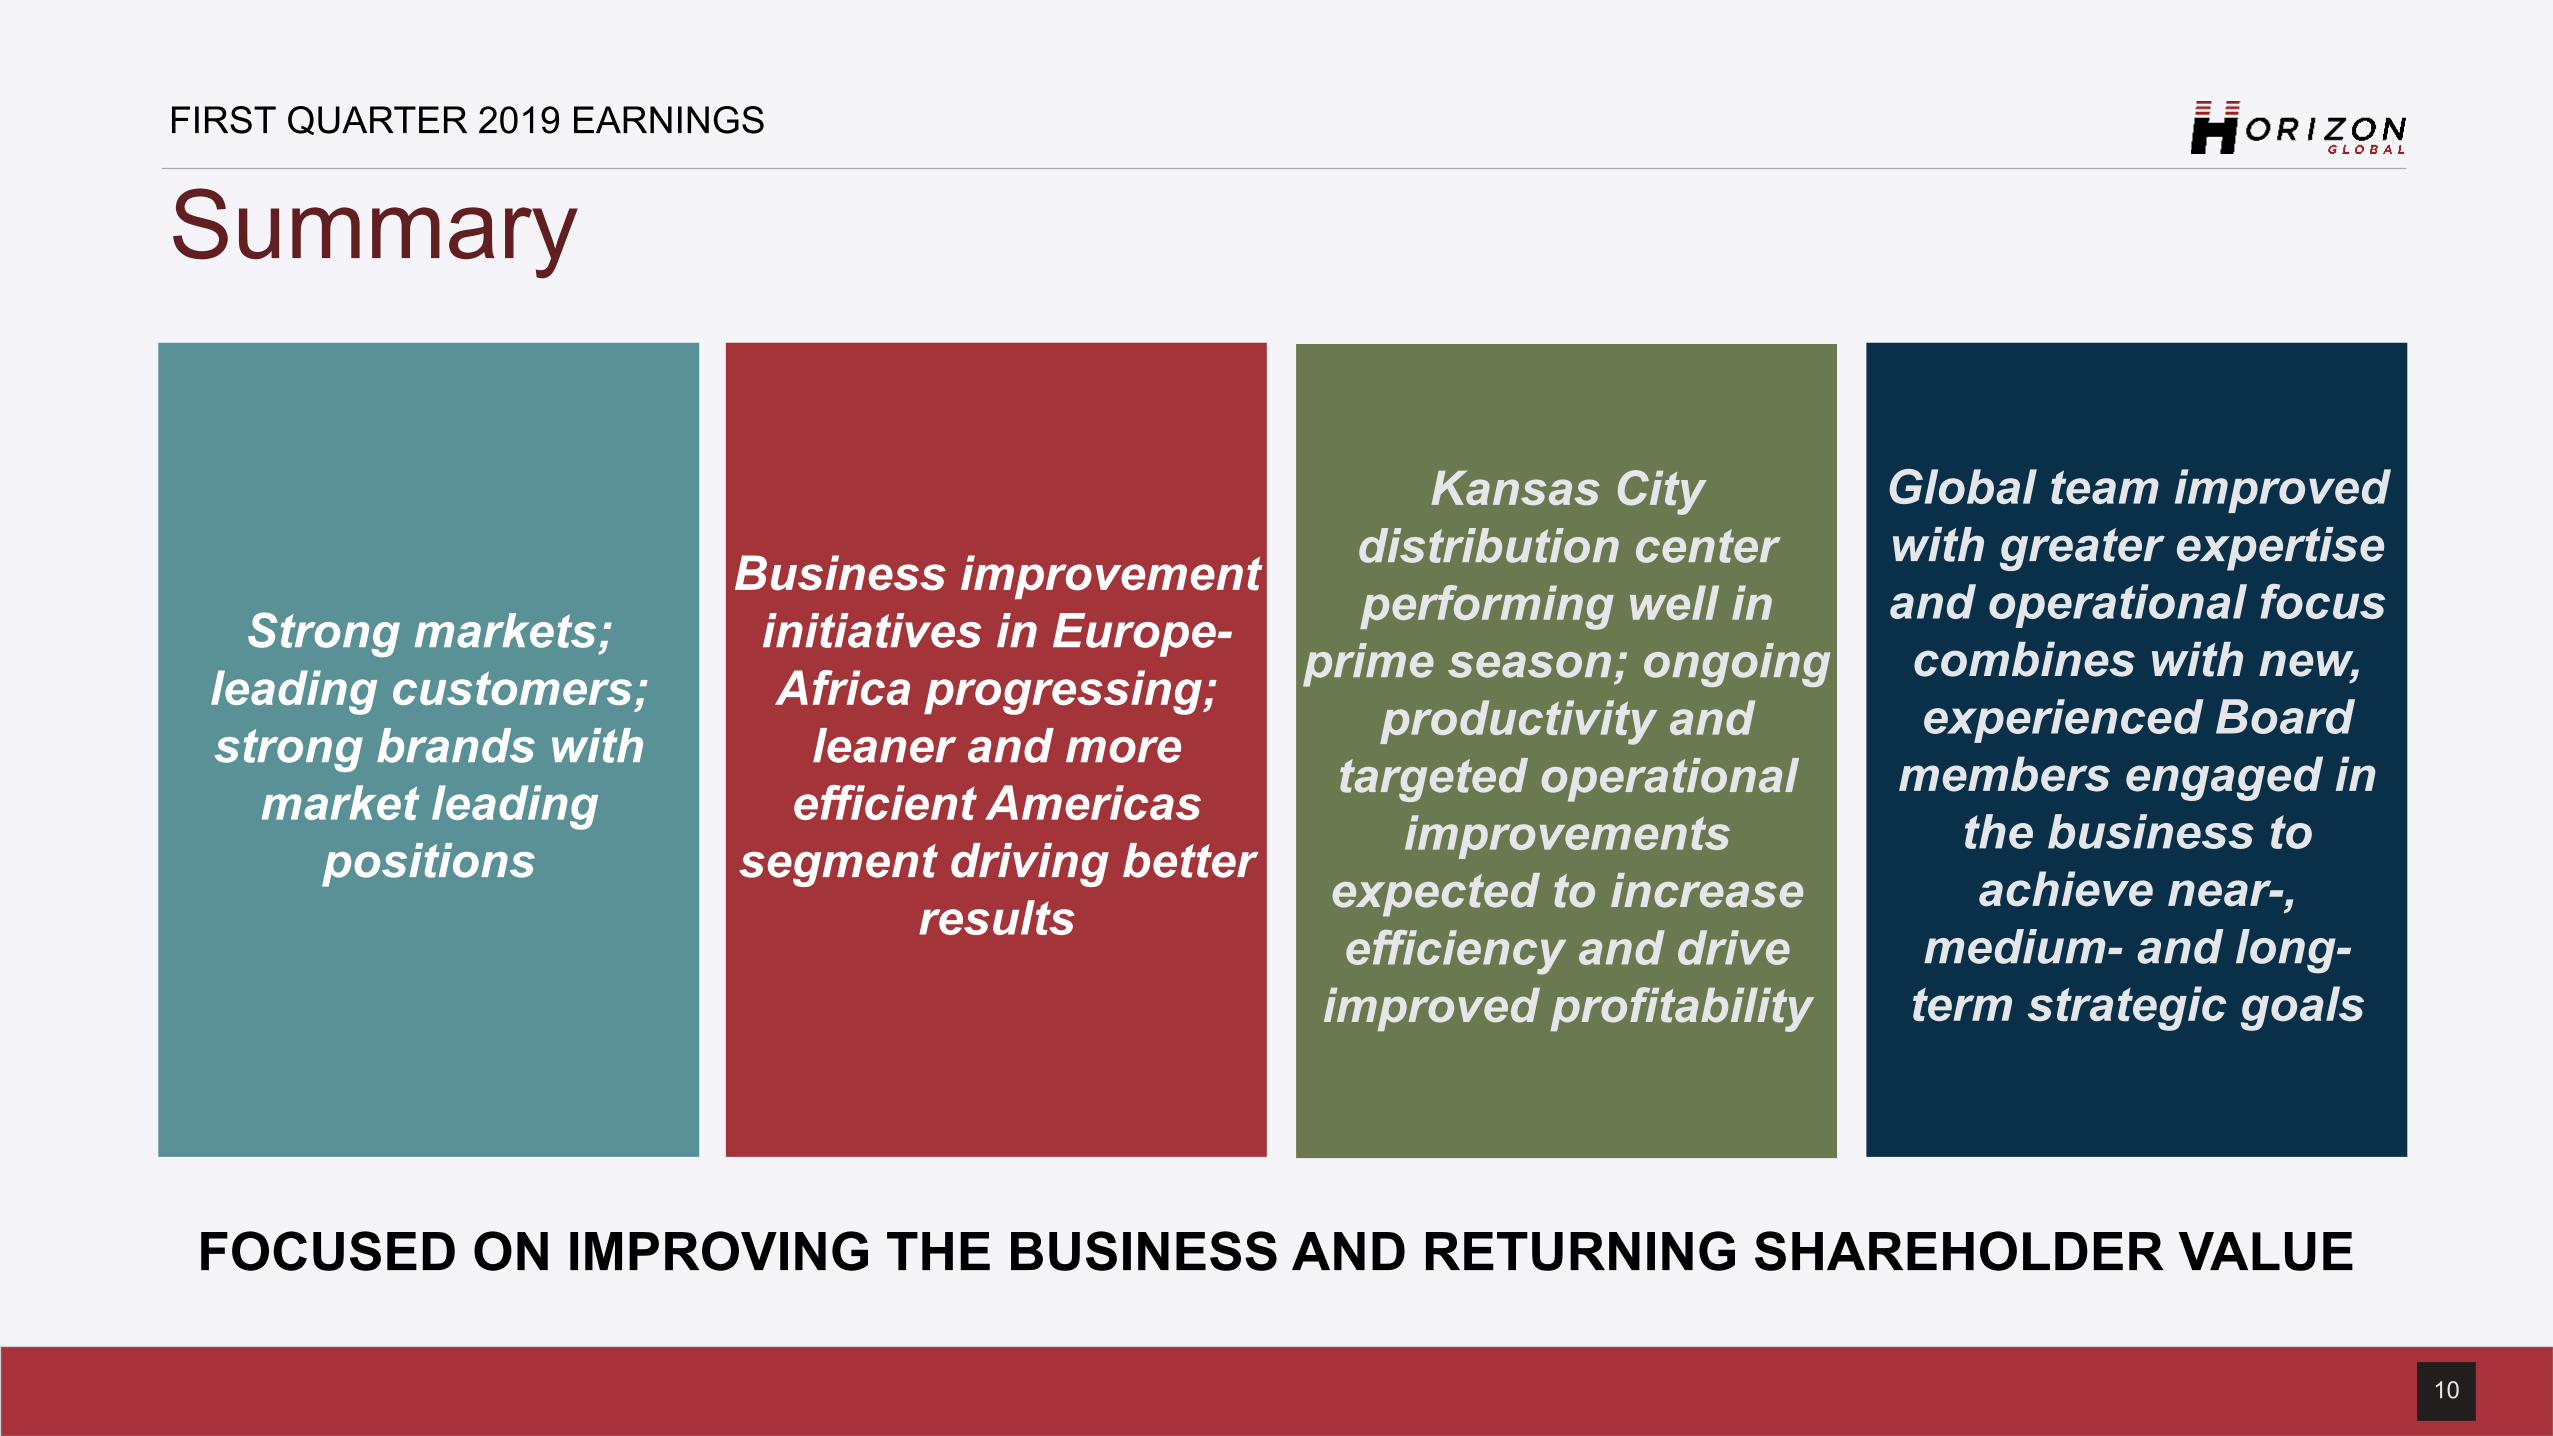
Global team improvedwith greater expertiseand operational focuscombines with new,experienced Board
members engaged inthe business toachieve near-,
medium- and long-term strategic goals
Kansas Citydistribution centerperforming well in
prime season; ongoingproductivity and
targeted operationalimprovements
expected to increaseefficiency and drive
improved profitability
Business improvementinitiatives in Europe-Africa progressing;
leaner and moreefficient Americas
segment driving betterresults
Strong markets;leading customers;strong brands with
market leadingpositions
Summary
FOCUSED ON IMPROVING THE BUSINESS AND RETURNING SHAREHOLDER VALUE

11
FIRST QUARTER 2019 EARNINGS
Q&A
11

1212
FIRST QUARTER 2019 EARNINGS
Appendix
12
13
FIRST QUARTER 2019 EARNINGS
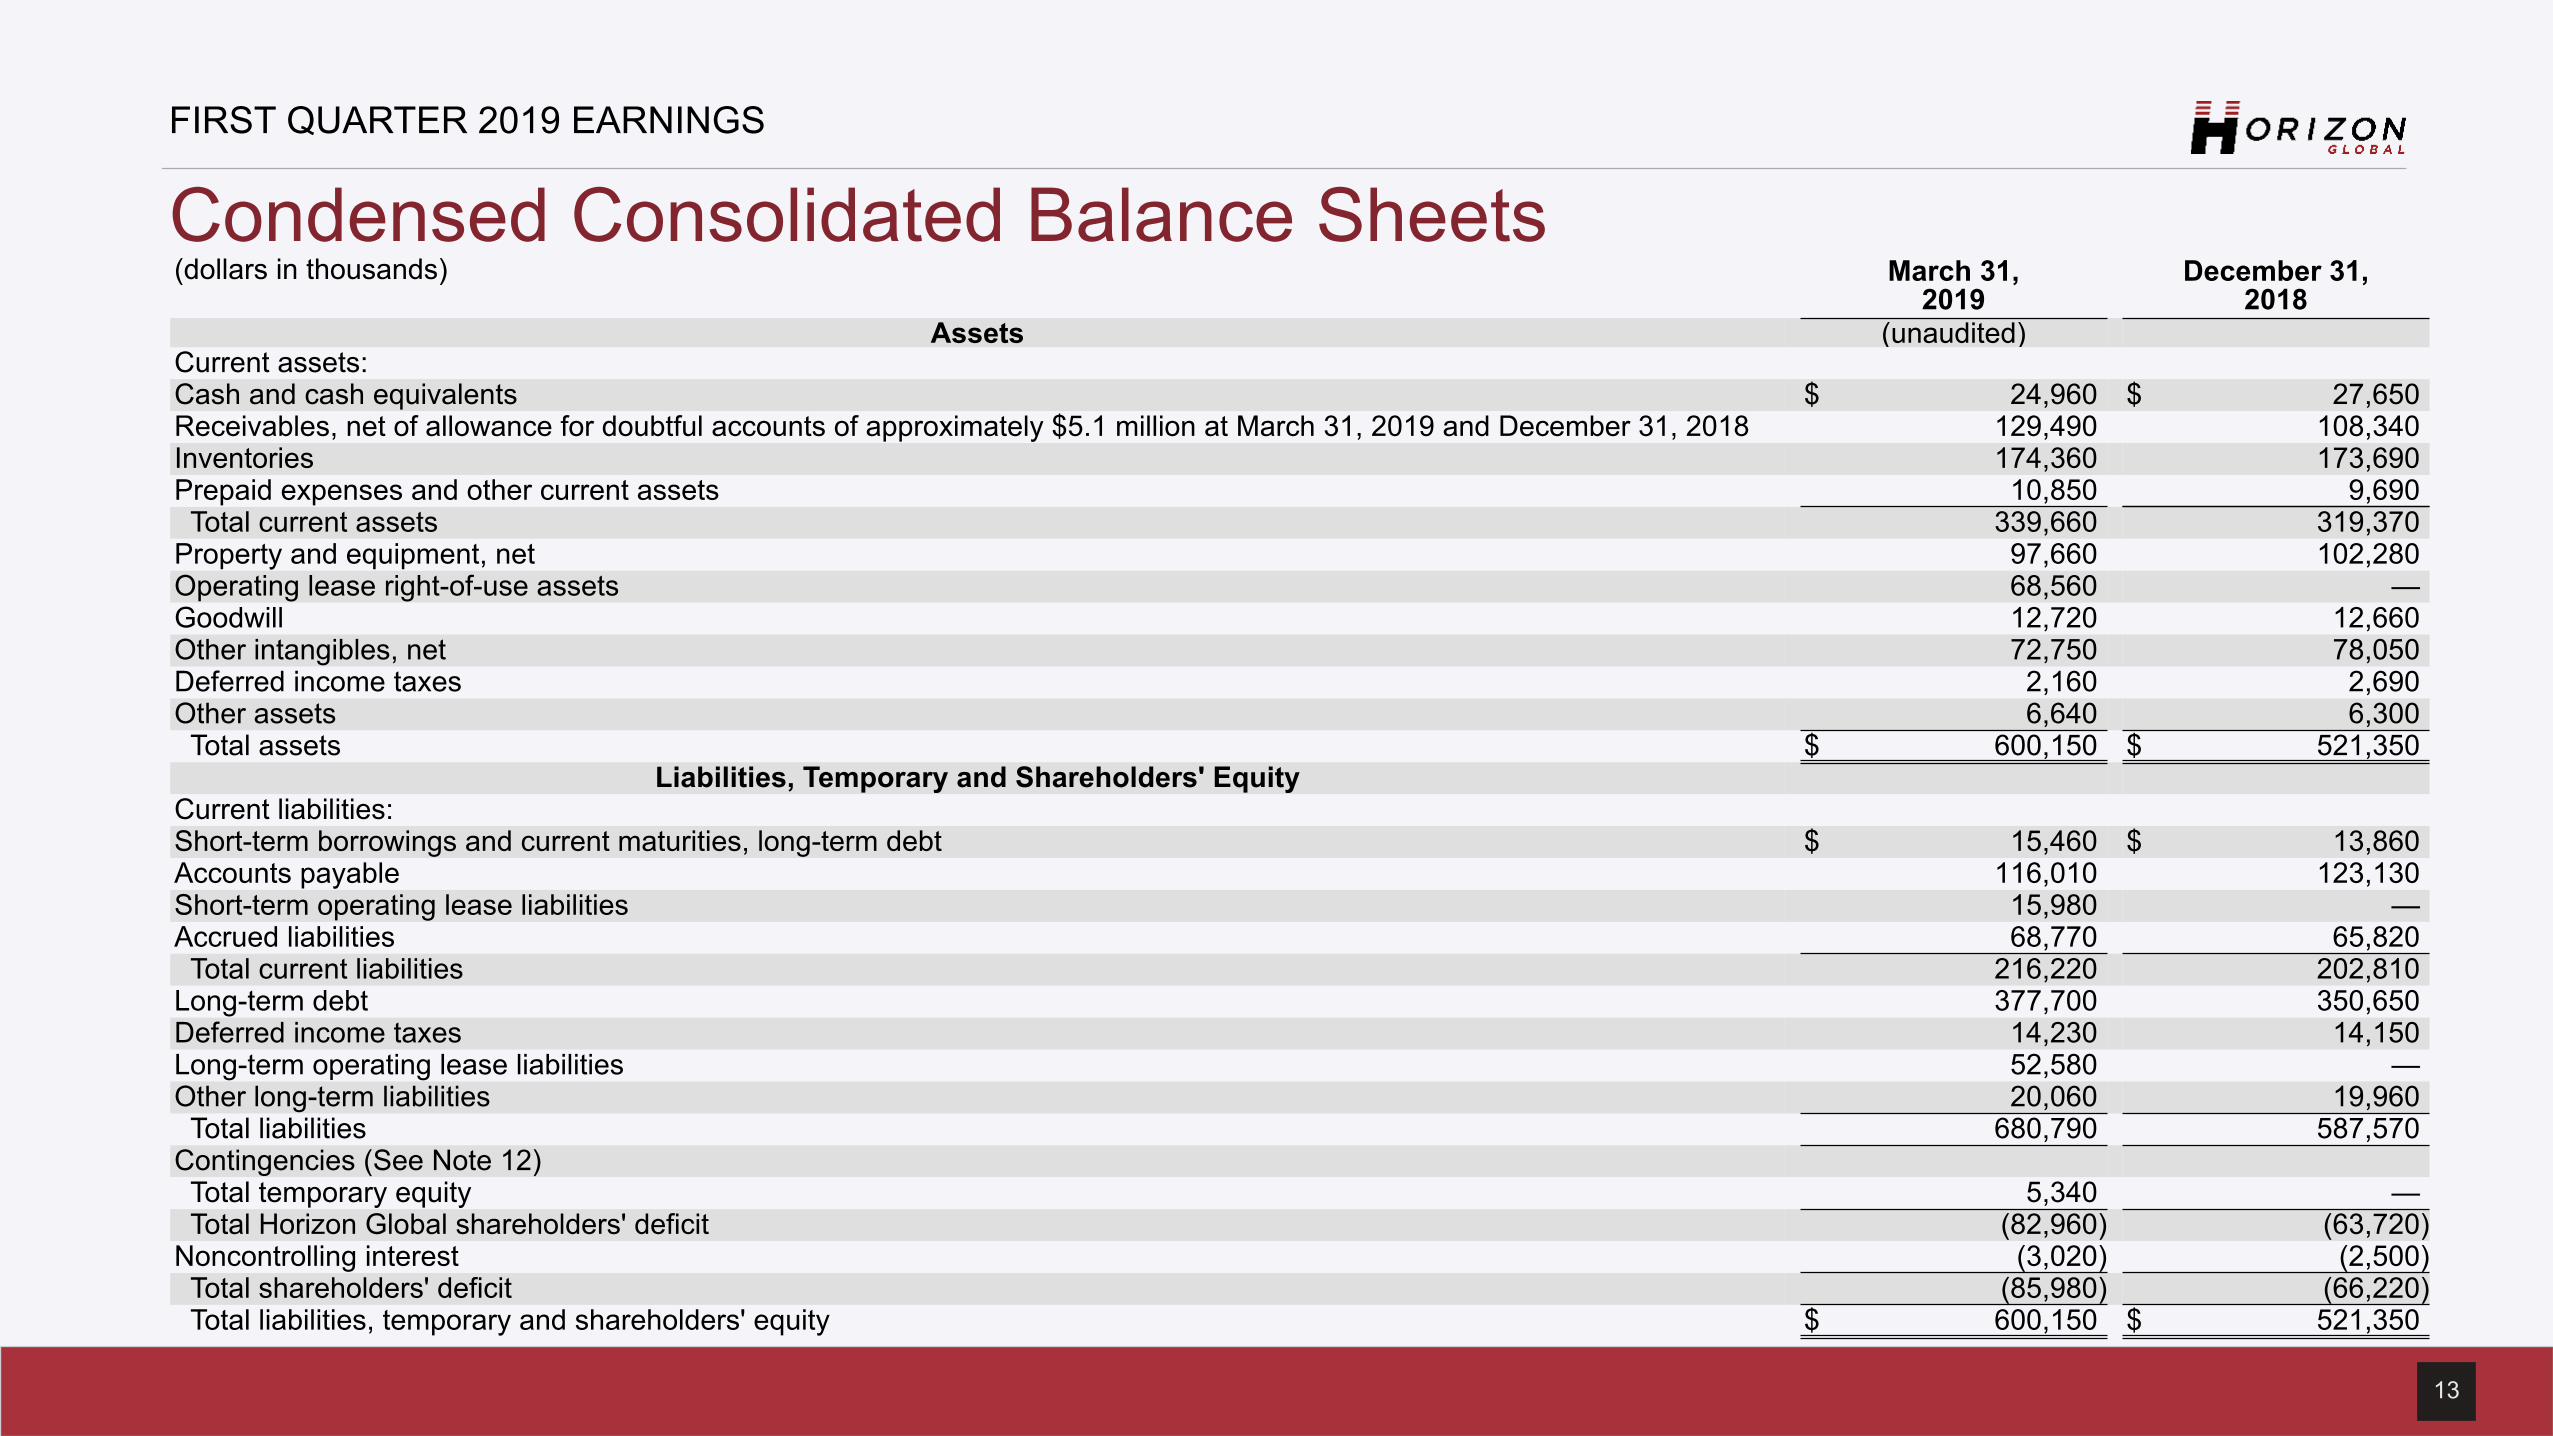
Condensed Consolidated Balance Sheets(dollars in thousands) March 31,
2019December 31,
2018Assets (unaudited)
Current assets:Cash and cash equivalents $ 24,960 $ 27,650Receivables, net of allowance for doubtful accounts of approximately $5.1 million at March 31, 2019 and December 31, 2018 129,490 108,340Inventories 174,360 173,690Prepaid expenses and other current assets 10,850 9,690
Total current assets 339,660 319,370Property and equipment, net 97,660 102,280Operating lease right-of-use assets 68,560 —Goodwill 12,720 12,660Other intangibles, net 72,750 78,050Deferred income taxes 2,160 2,690Other assets 6,640 6,300
Total assets $ 600,150 $ 521,350Liabilities, Temporary and Shareholders' Equity
Current liabilities:Short-term borrowings and current maturities, long-term debt $ 15,460 $ 13,860Accounts payable 116,010 123,130Short-term operating lease liabilities 15,980 —Accrued liabilities 68,770 65,820
Total current liabilities 216,220 202,810Long-term debt 377,700 350,650Deferred income taxes 14,230 14,150Long-term operating lease liabilities 52,580 —Other long-term liabilities 20,060 19,960
Total liabilities 680,790 587,570Contingencies (See Note 12)
Total temporary equity 5,340 —Total Horizon Global shareholders' deficit (82,960) (63,720)
Noncontrolling interest (3,020) (2,500)Total shareholders' deficit (85,980) (66,220)Total liabilities, temporary and shareholders' equity $ 600,150 $ 521,350
14
FIRST QUARTER 2019 EARNINGS
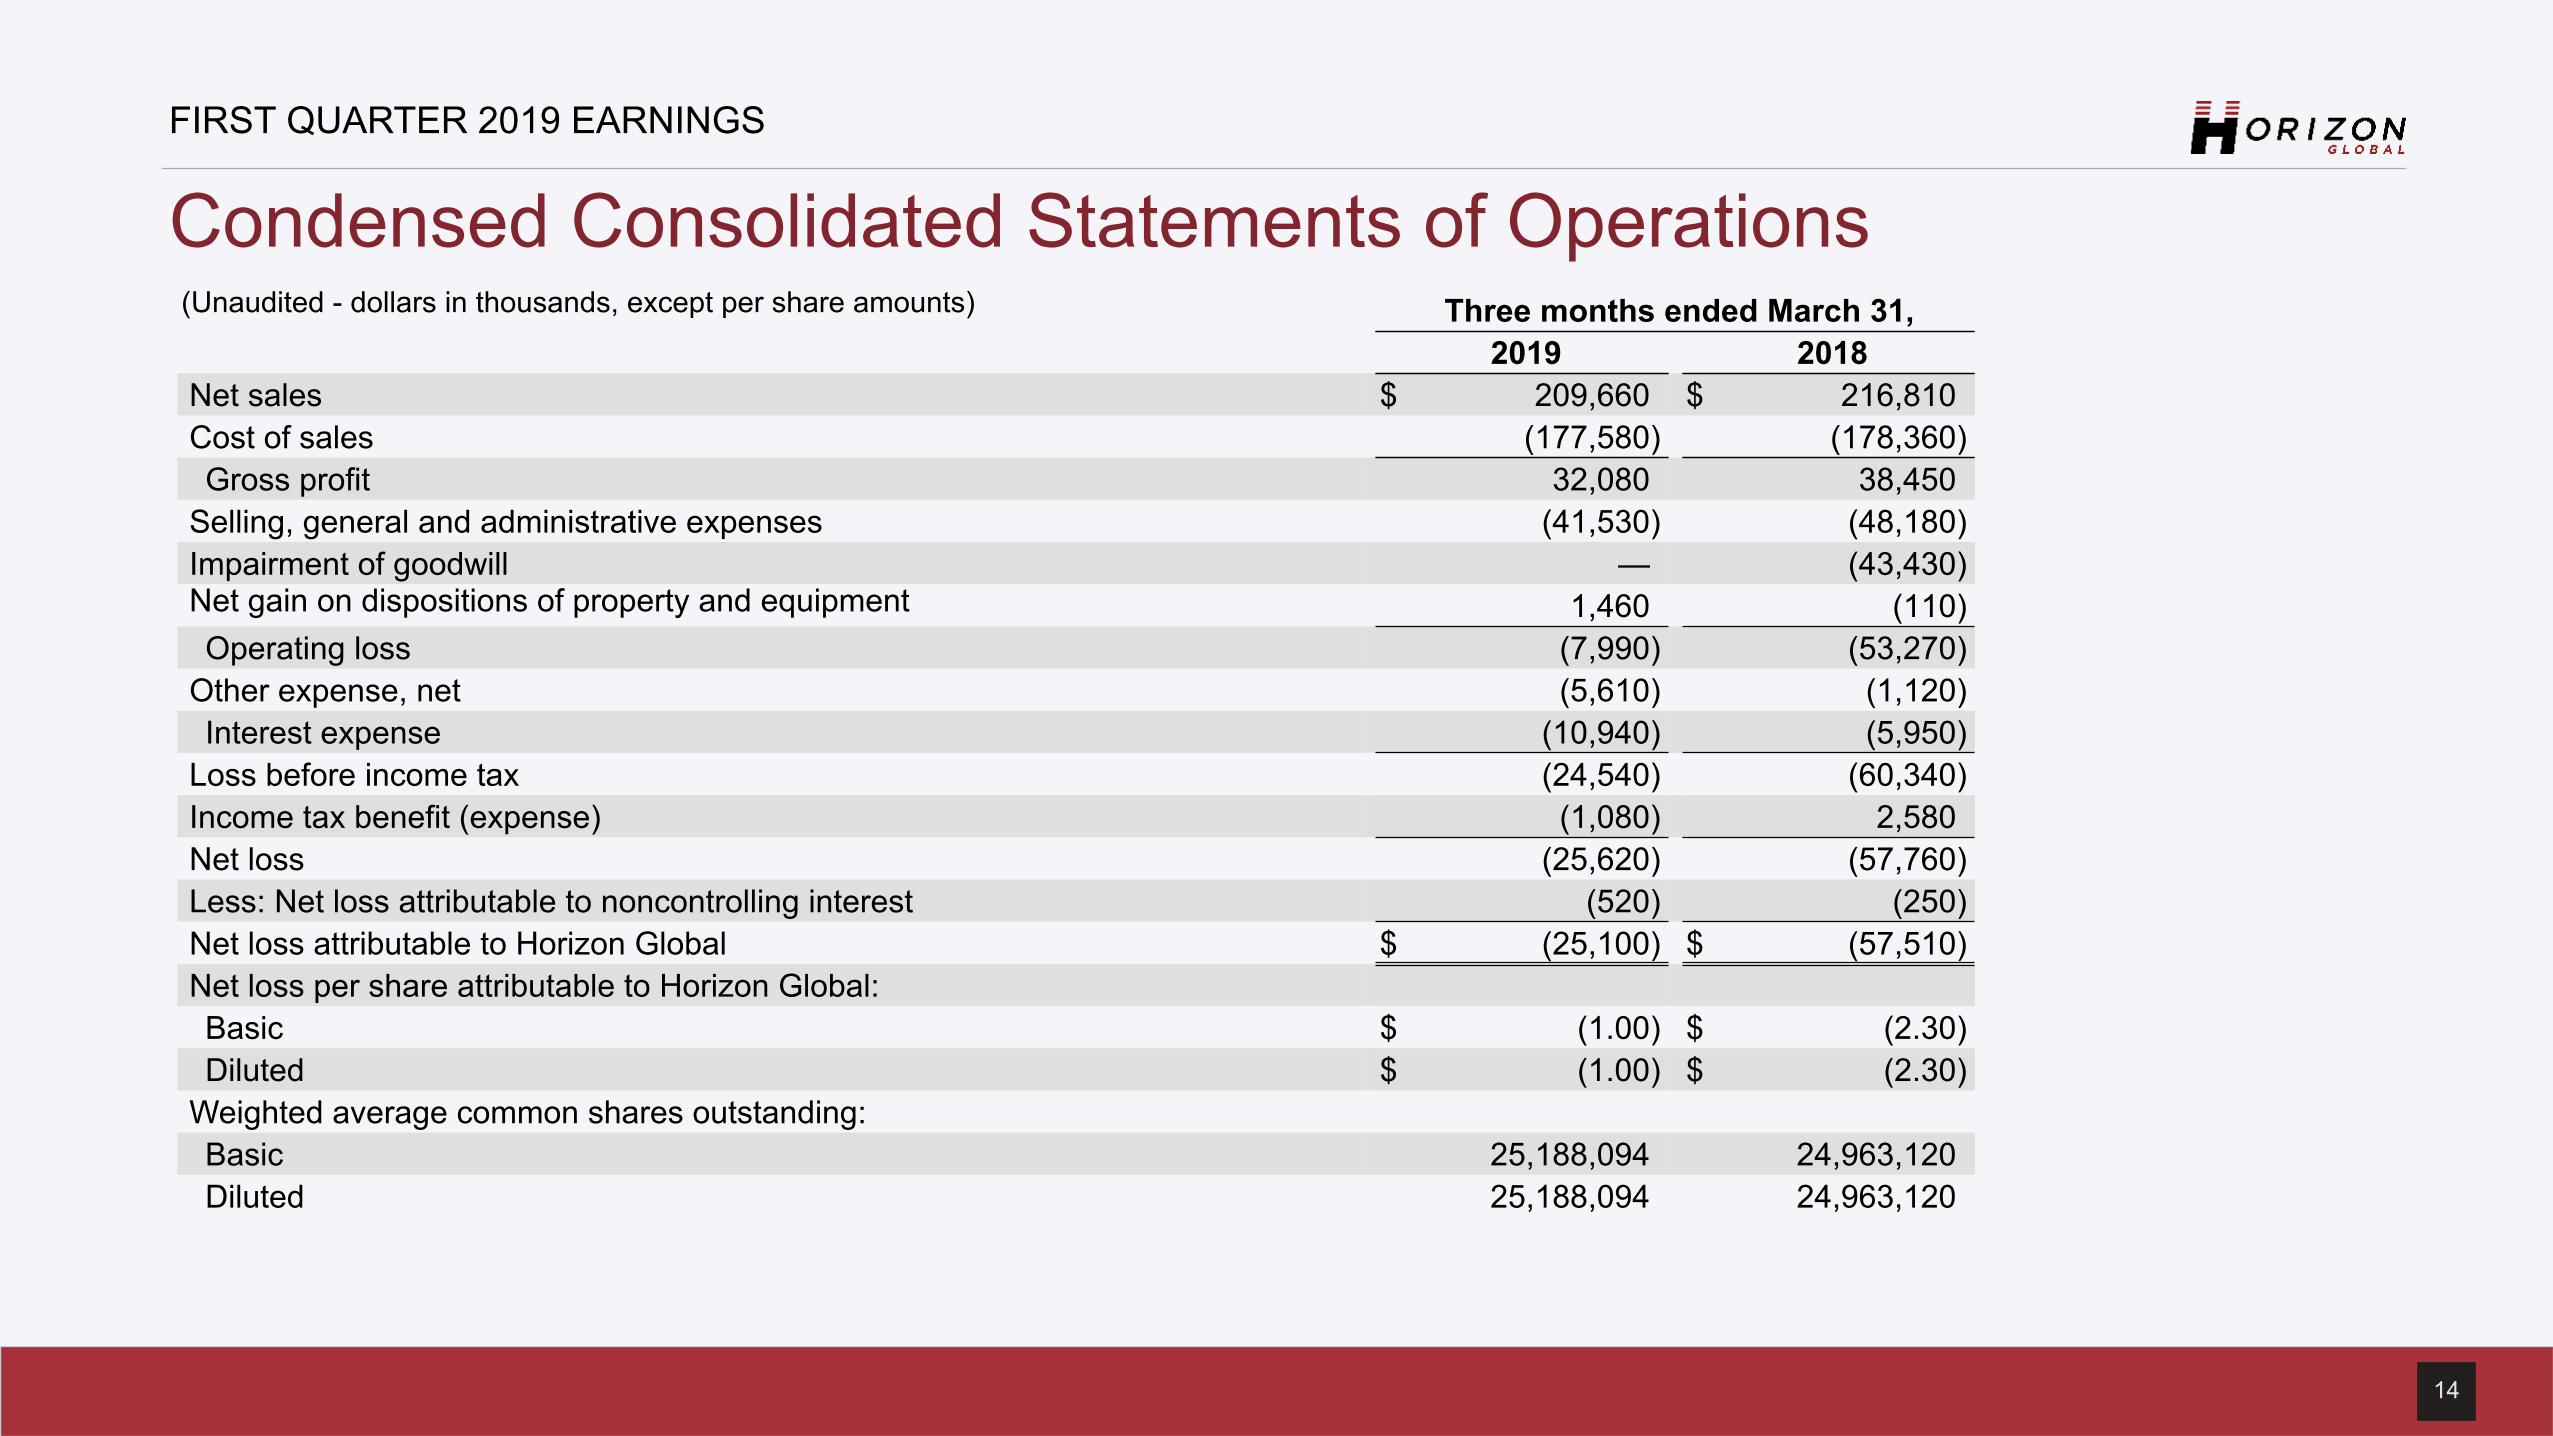
Condensed Consolidated Statements of Operations(Unaudited - dollars in thousands, except per share amounts) Three months ended March 31,
2019 2018Net sales $ 209,660 $ 216,810Cost of sales (177,580) (178,360)Gross profit 32,080 38,450
Selling, general and administrative expenses (41,530) (48,180)Impairment of goodwill — (43,430)Net gain on dispositions of property and equipment 1,460 (110)Operating loss (7,990) (53,270)
Other expense, net (5,610) (1,120)Interest expense (10,940) (5,950)
Loss before income tax (24,540) (60,340)Income tax benefit (expense) (1,080) 2,580Net loss (25,620) (57,760)Less: Net loss attributable to noncontrolling interest (520) (250)Net loss attributable to Horizon Global $ (25,100) $ (57,510)Net loss per share attributable to Horizon Global:Basic $ (1.00) $ (2.30)Diluted $ (1.00) $ (2.30)
Weighted average common shares outstanding:Basic 25,188,094 24,963,120Diluted 25,188,094 24,963,120
15
FIRST QUARTER 2019 EARNINGS
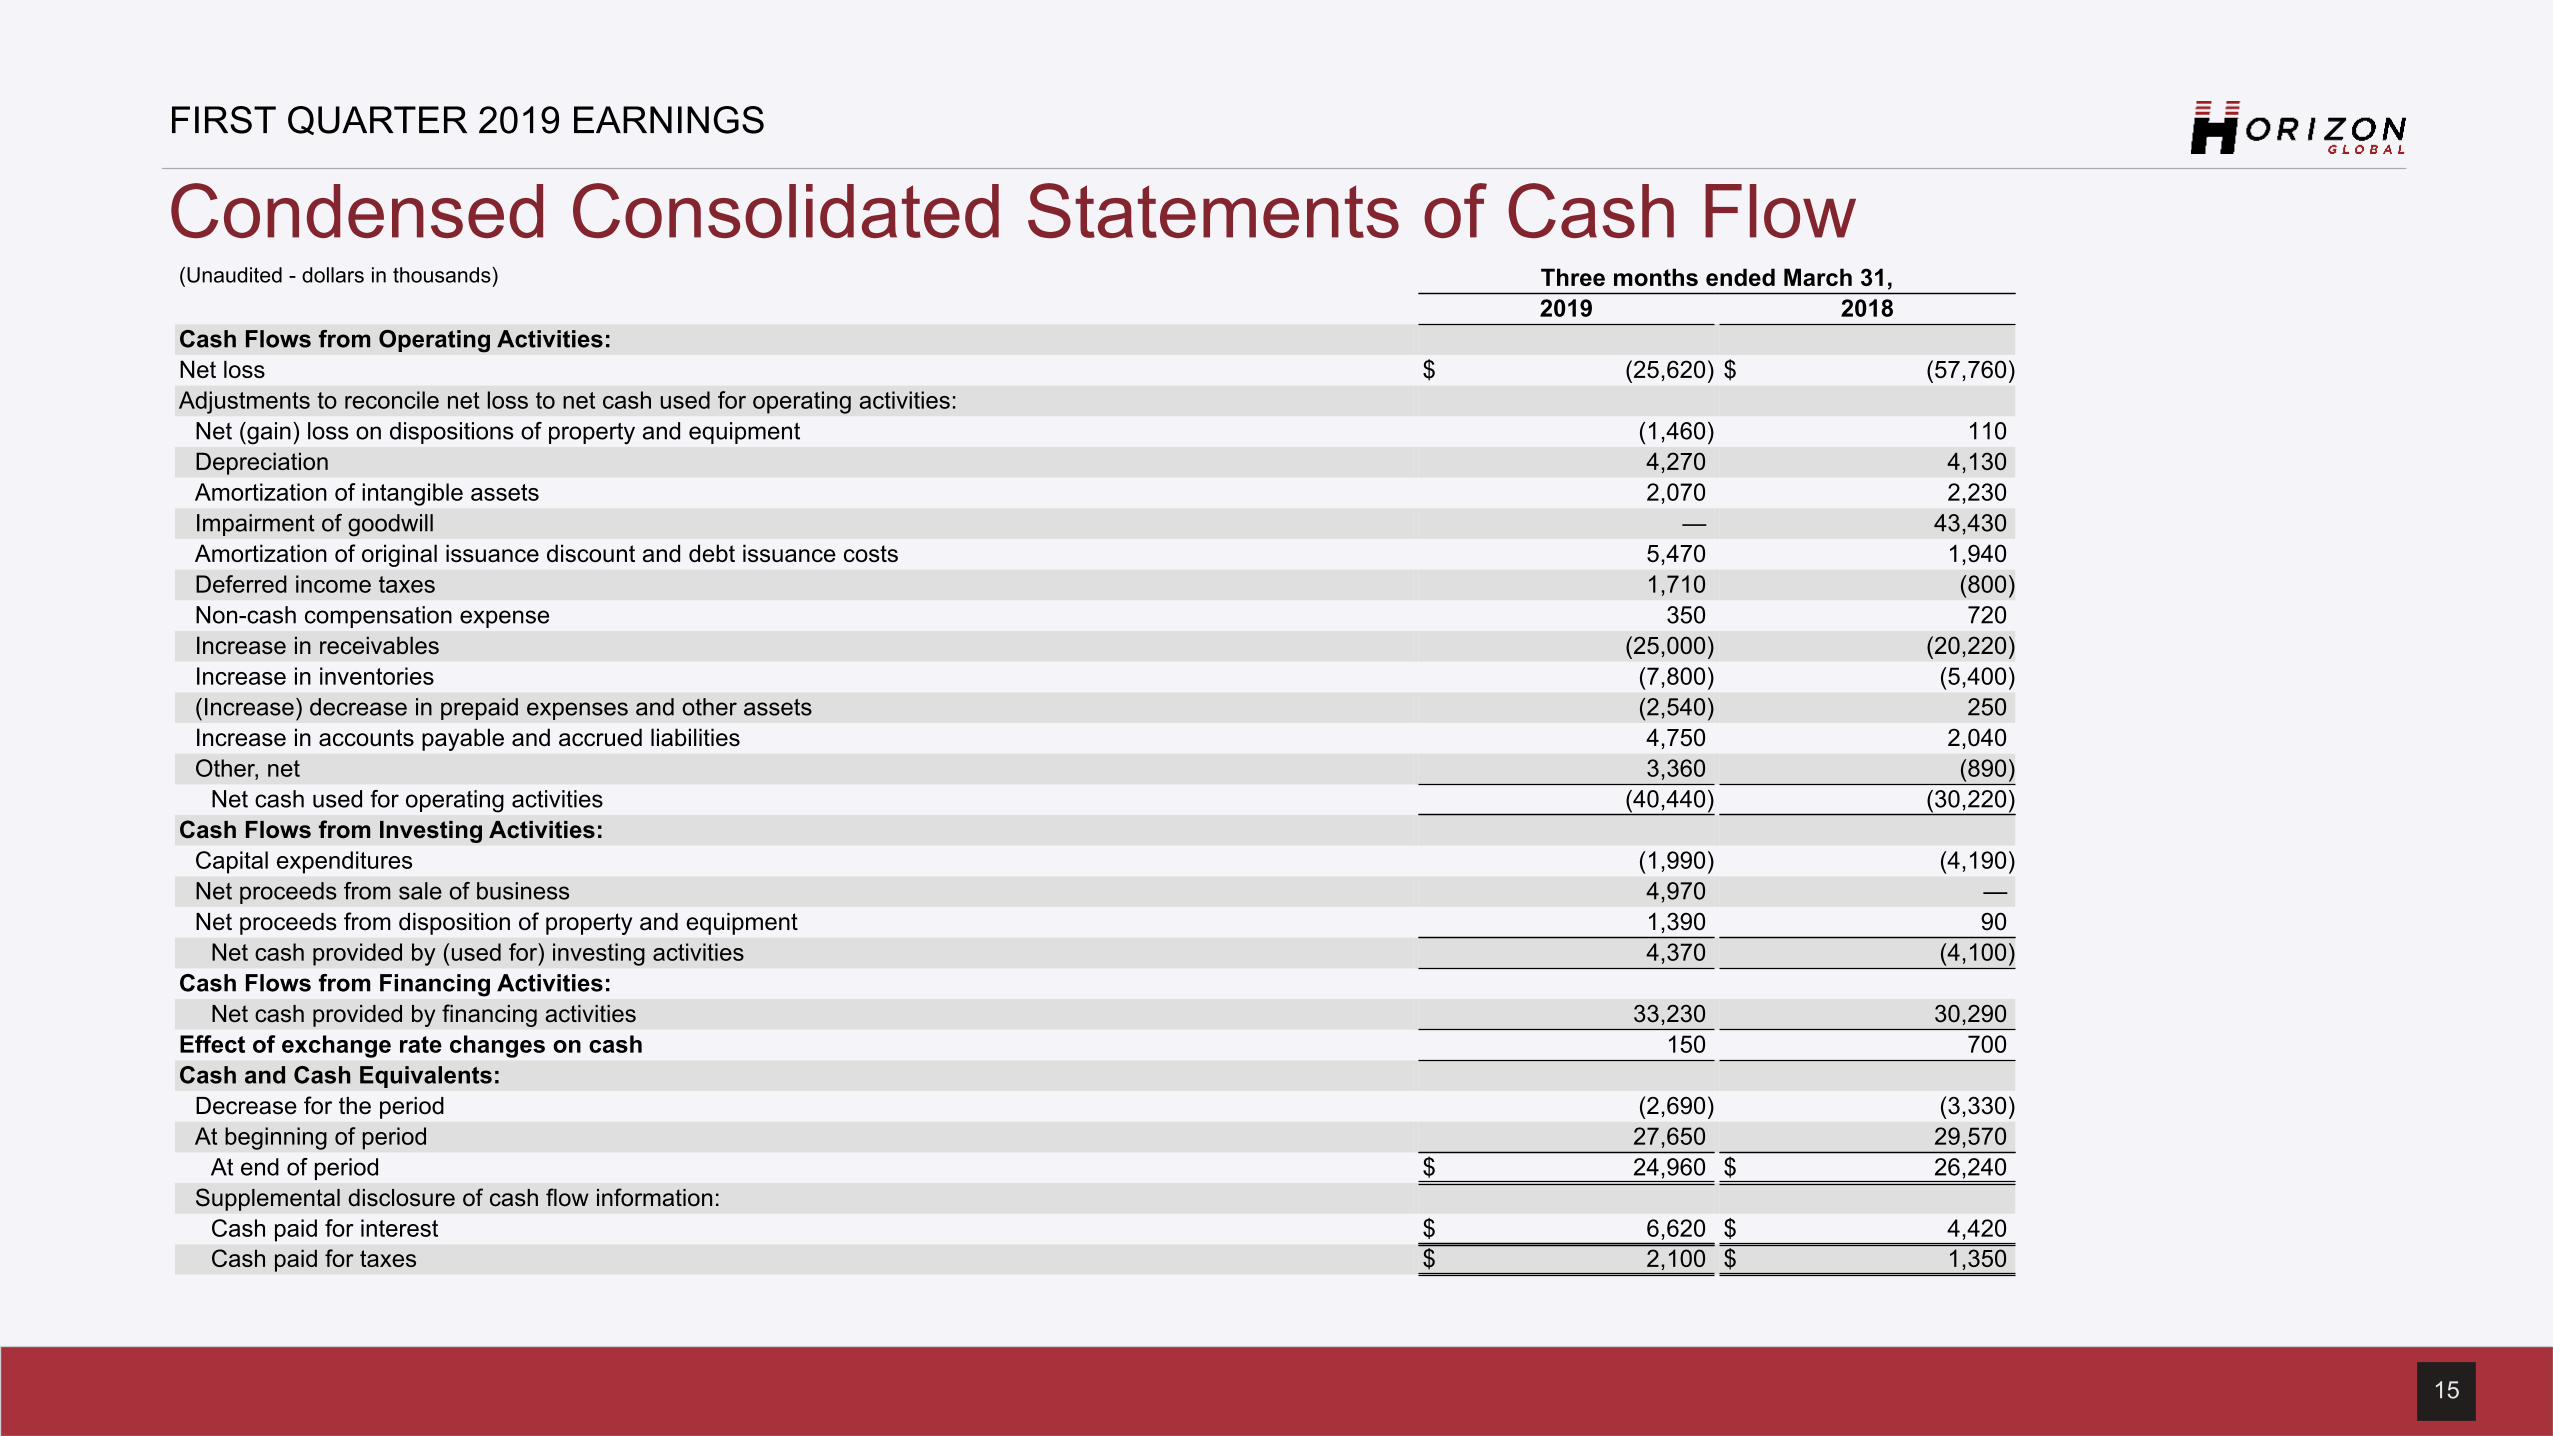
Condensed Consolidated Statements of Cash Flow(Unaudited - dollars in thousands) Three months ended March 31,
2019 2018Cash Flows from Operating Activities:Net loss $ (25,620) $ (57,760)Adjustments to reconcile net loss to net cash used for operating activities:
Net (gain) loss on dispositions of property and equipment (1,460) 110Depreciation 4,270 4,130Amortization of intangible assets 2,070 2,230Impairment of goodwill — 43,430Amortization of original issuance discount and debt issuance costs 5,470 1,940Deferred income taxes 1,710 (800)Non-cash compensation expense 350 720Increase in receivables (25,000) (20,220)Increase in inventories (7,800) (5,400)(Increase) decrease in prepaid expenses and other assets (2,540) 250Increase in accounts payable and accrued liabilities 4,750 2,040Other, net 3,360 (890)
Net cash used for operating activities (40,440) (30,220)Cash Flows from Investing Activities:
Capital expenditures (1,990) (4,190)Net proceeds from sale of business 4,970 —Net proceeds from disposition of property and equipment 1,390 90
Net cash provided by (used for) investing activities 4,370 (4,100)Cash Flows from Financing Activities:
Net cash provided by financing activities 33,230 30,290Effect of exchange rate changes on cash 150 700Cash and Cash Equivalents:
Decrease for the period (2,690) (3,330)At beginning of period 27,650 29,570
At end of period $ 24,960 $ 26,240Supplemental disclosure of cash flow information:
Cash paid for interest $ 6,620 $ 4,420Cash paid for taxes $ 2,100 $ 1,350
16
FIRST QUARTER 2019 EARNINGS
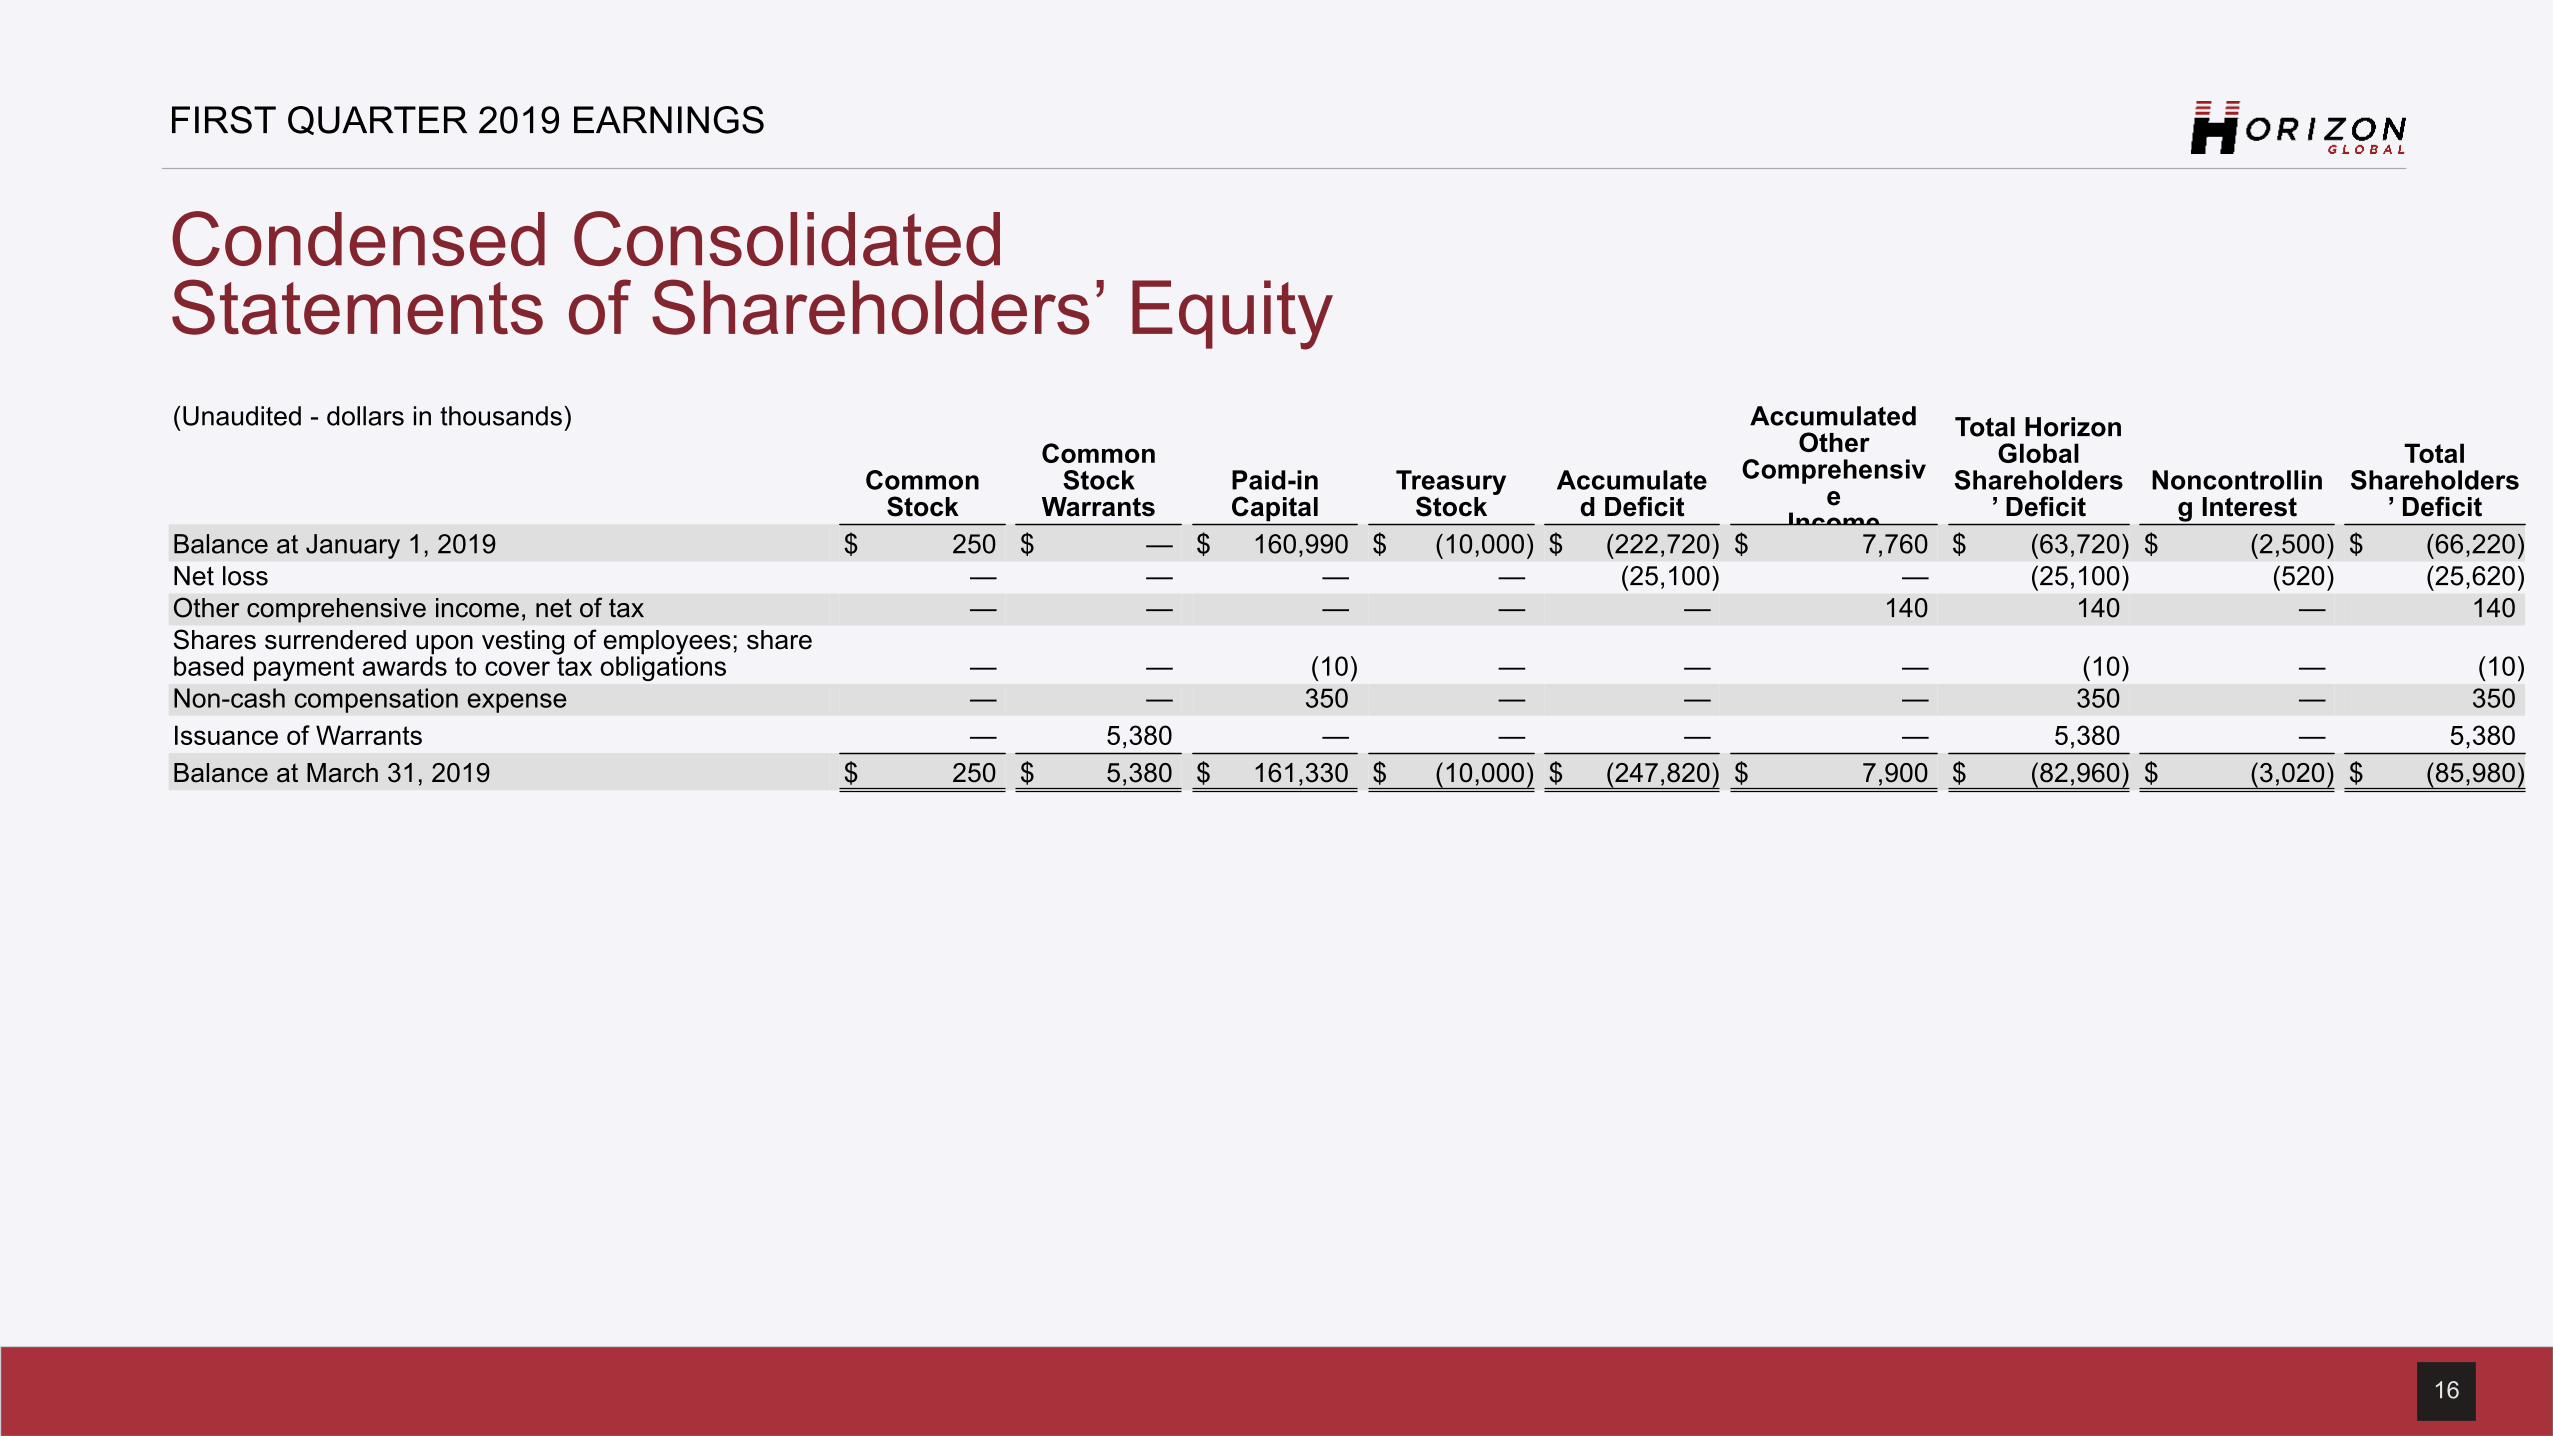
Condensed Consolidated Statements of Shareholders’ Equity(Unaudited - dollars in thousands)
CommonStock
CommonStock
WarrantsPaid-inCapital
TreasuryStock
Accumulated Deficit
AccumulatedOther
Comprehensive
Income
Total HorizonGlobal
Shareholders’ Deficit
Noncontrolling Interest
TotalShareholders
’ DeficitBalance at January 1, 2019 $ 250 $ — $ 160,990 $ (10,000) $ (222,720) $ 7,760 $ (63,720) $ (2,500) $ (66,220)Net loss — — — — (25,100) — (25,100) (520) (25,620)Other comprehensive income, net of tax — — — — — 140 140 — 140Shares surrendered upon vesting of employees; sharebased payment awards to cover tax obligations — — (10) — — — (10) — (10)Non-cash compensation expense — — 350 — — — 350 — 350Issuance of Warrants — 5,380 — — — — 5,380 — 5,380Balance at March 31, 2019 $ 250 $ 5,380 $ 161,330 $ (10,000) $ (247,820) $ 7,900 $ (82,960) $ (3,020) $ (85,980)
17
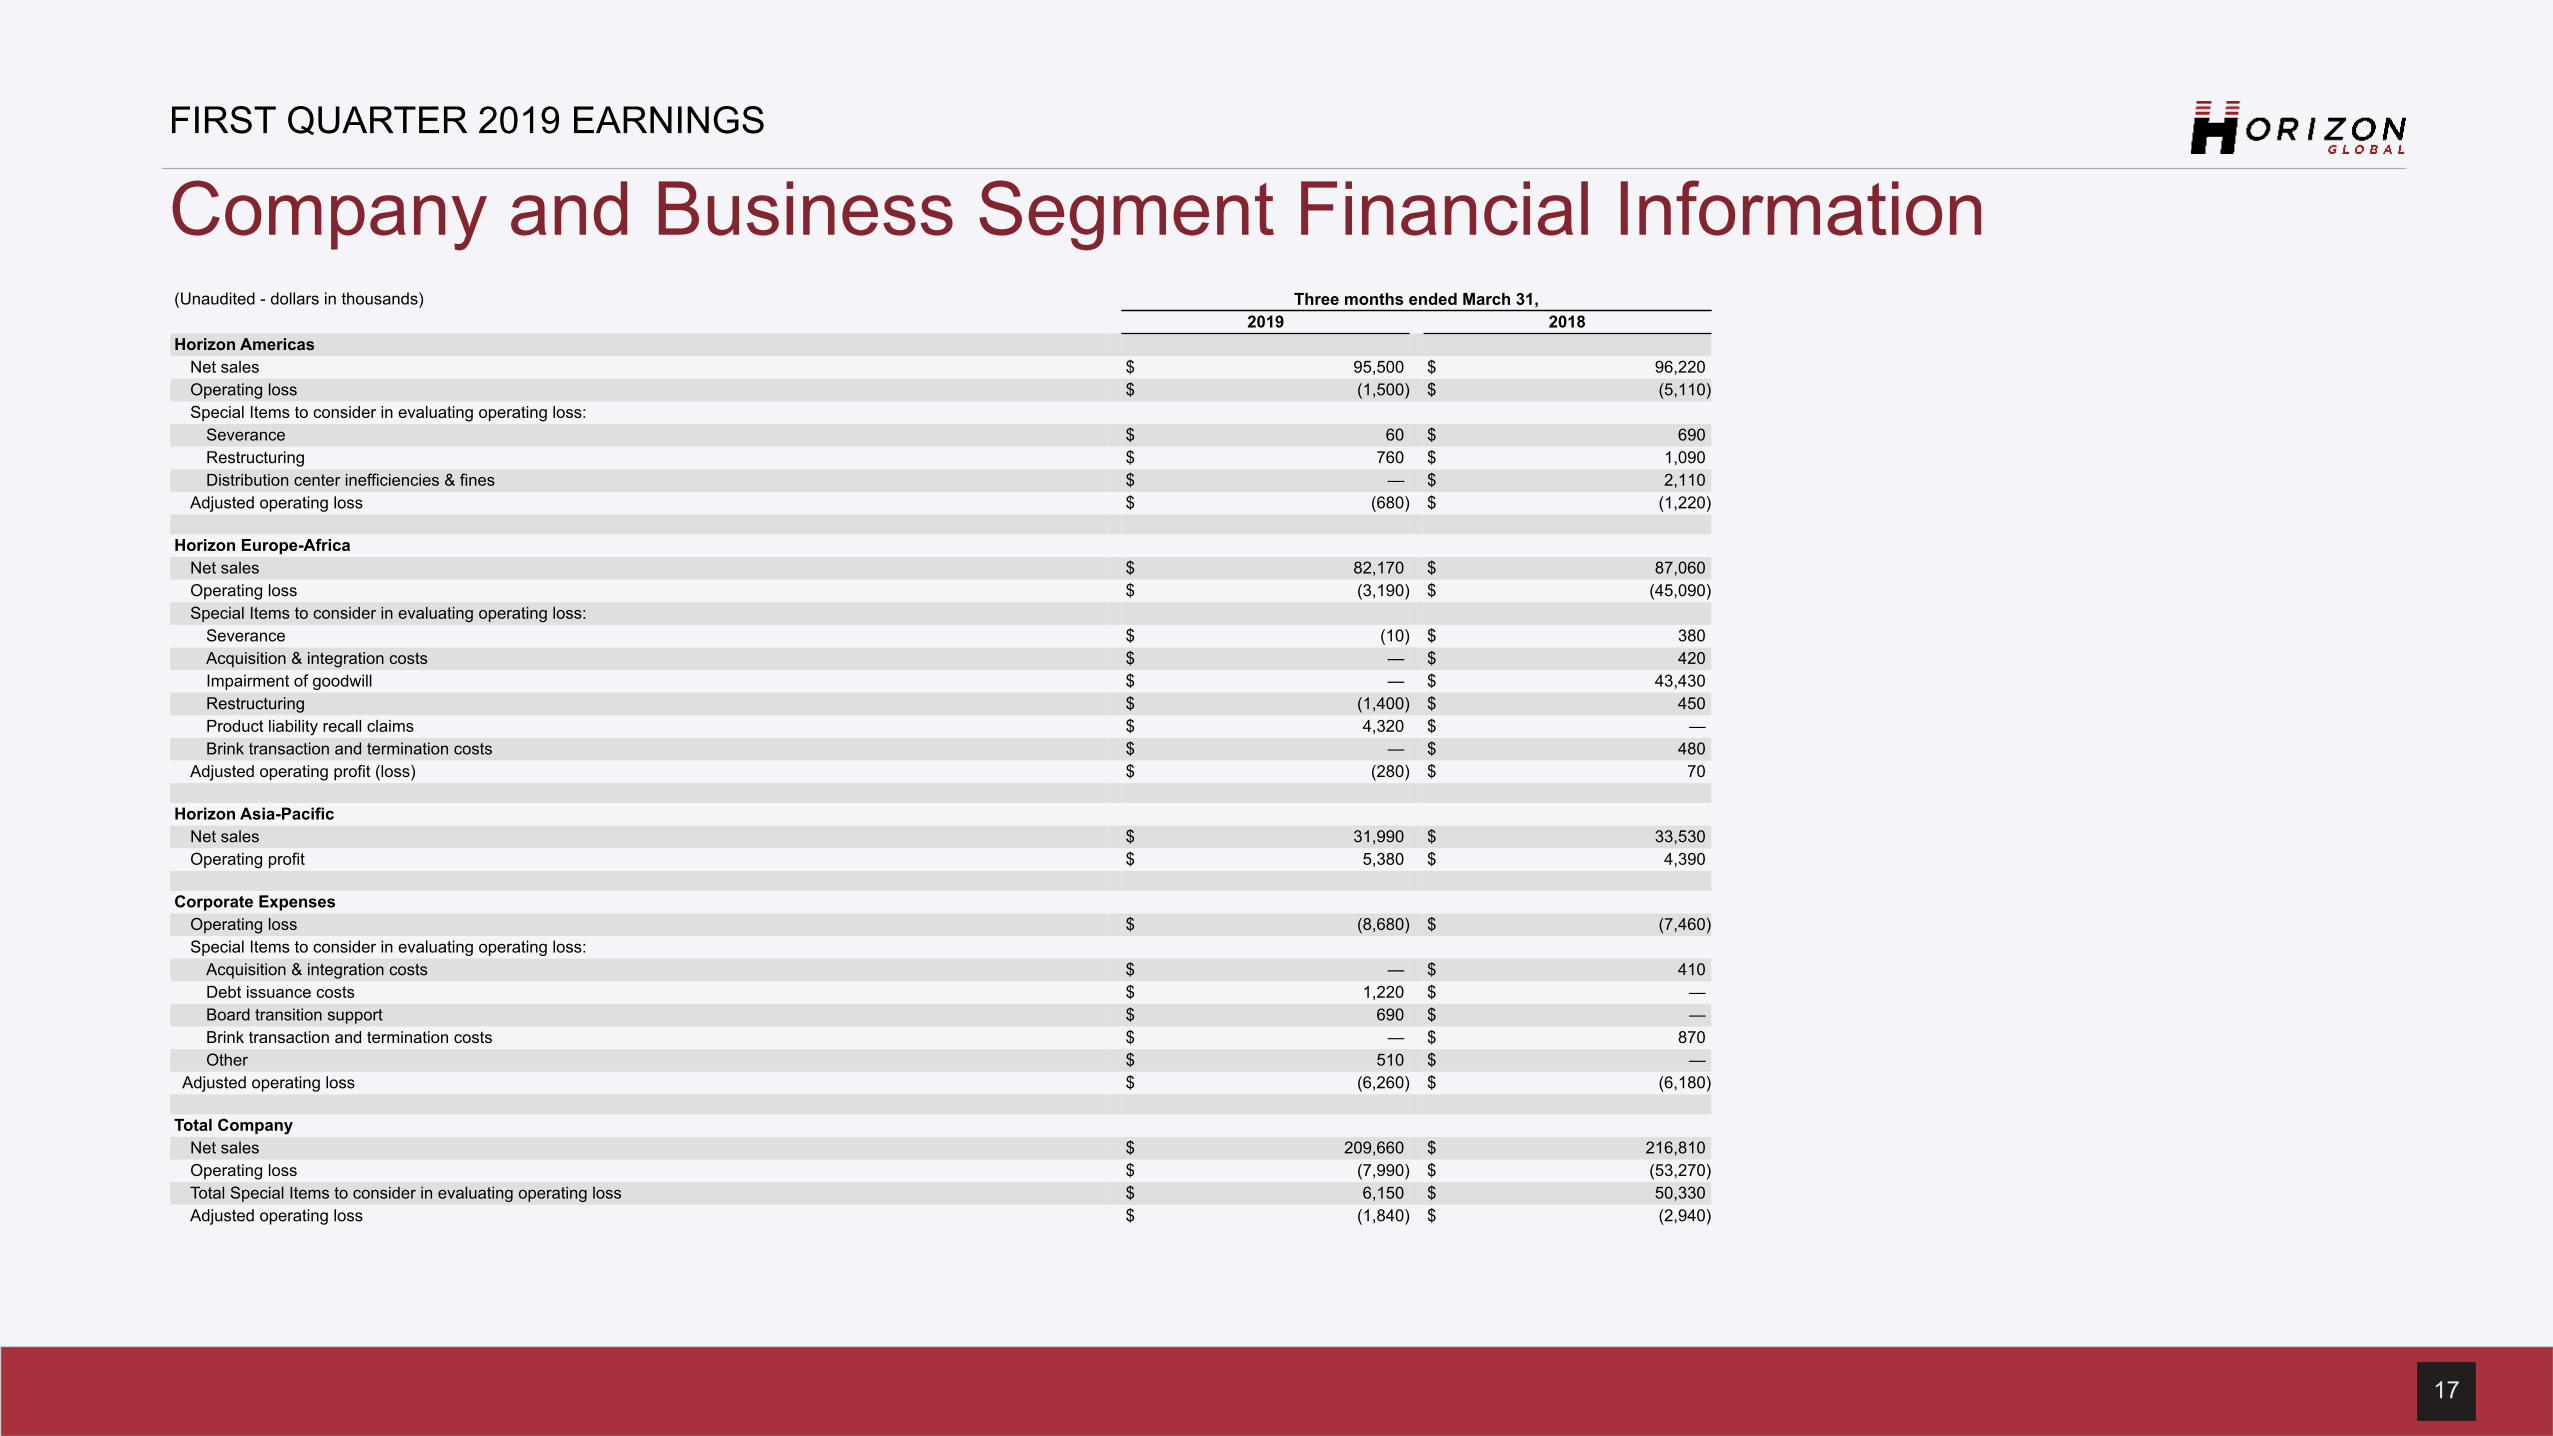
FIRST QUARTER 2019 EARNINGS
Company and Business Segment Financial Information(Unaudited - dollars in thousands) Three months ended March 31,
2019 2018Horizon Americas
Net sales $ 95,500 $ 96,220Operating loss $ (1,500) $ (5,110)Special Items to consider in evaluating operating loss:
Severance $ 60 $ 690Restructuring $ 760 $ 1,090Distribution center inefficiencies & fines $ — $ 2,110
Adjusted operating loss $ (680) $ (1,220)
Horizon Europe-AfricaNet sales $ 82,170 $ 87,060Operating loss $ (3,190) $ (45,090)Special Items to consider in evaluating operating loss:
Severance $ (10) $ 380Acquisition & integration costs $ — $ 420Impairment of goodwill $ — $ 43,430Restructuring $ (1,400) $ 450Product liability recall claims $ 4,320 $ —Brink transaction and termination costs $ — $ 480
Adjusted operating profit (loss) $ (280) $ 70
Horizon Asia-PacificNet sales $ 31,990 $ 33,530Operating profit $ 5,380 $ 4,390
Corporate ExpensesOperating loss $ (8,680) $ (7,460)Special Items to consider in evaluating operating loss:
Acquisition & integration costs $ — $ 410Debt issuance costs $ 1,220 $ —Board transition support $ 690 $ —Brink transaction and termination costs $ — $ 870Other $ 510 $ —
Adjusted operating loss $ (6,260) $ (6,180)
Total CompanyNet sales $ 209,660 $ 216,810Operating loss $ (7,990) $ (53,270)Total Special Items to consider in evaluating operating loss $ 6,150 $ 50,330Adjusted operating loss $ (1,840) $ (2,940)
18
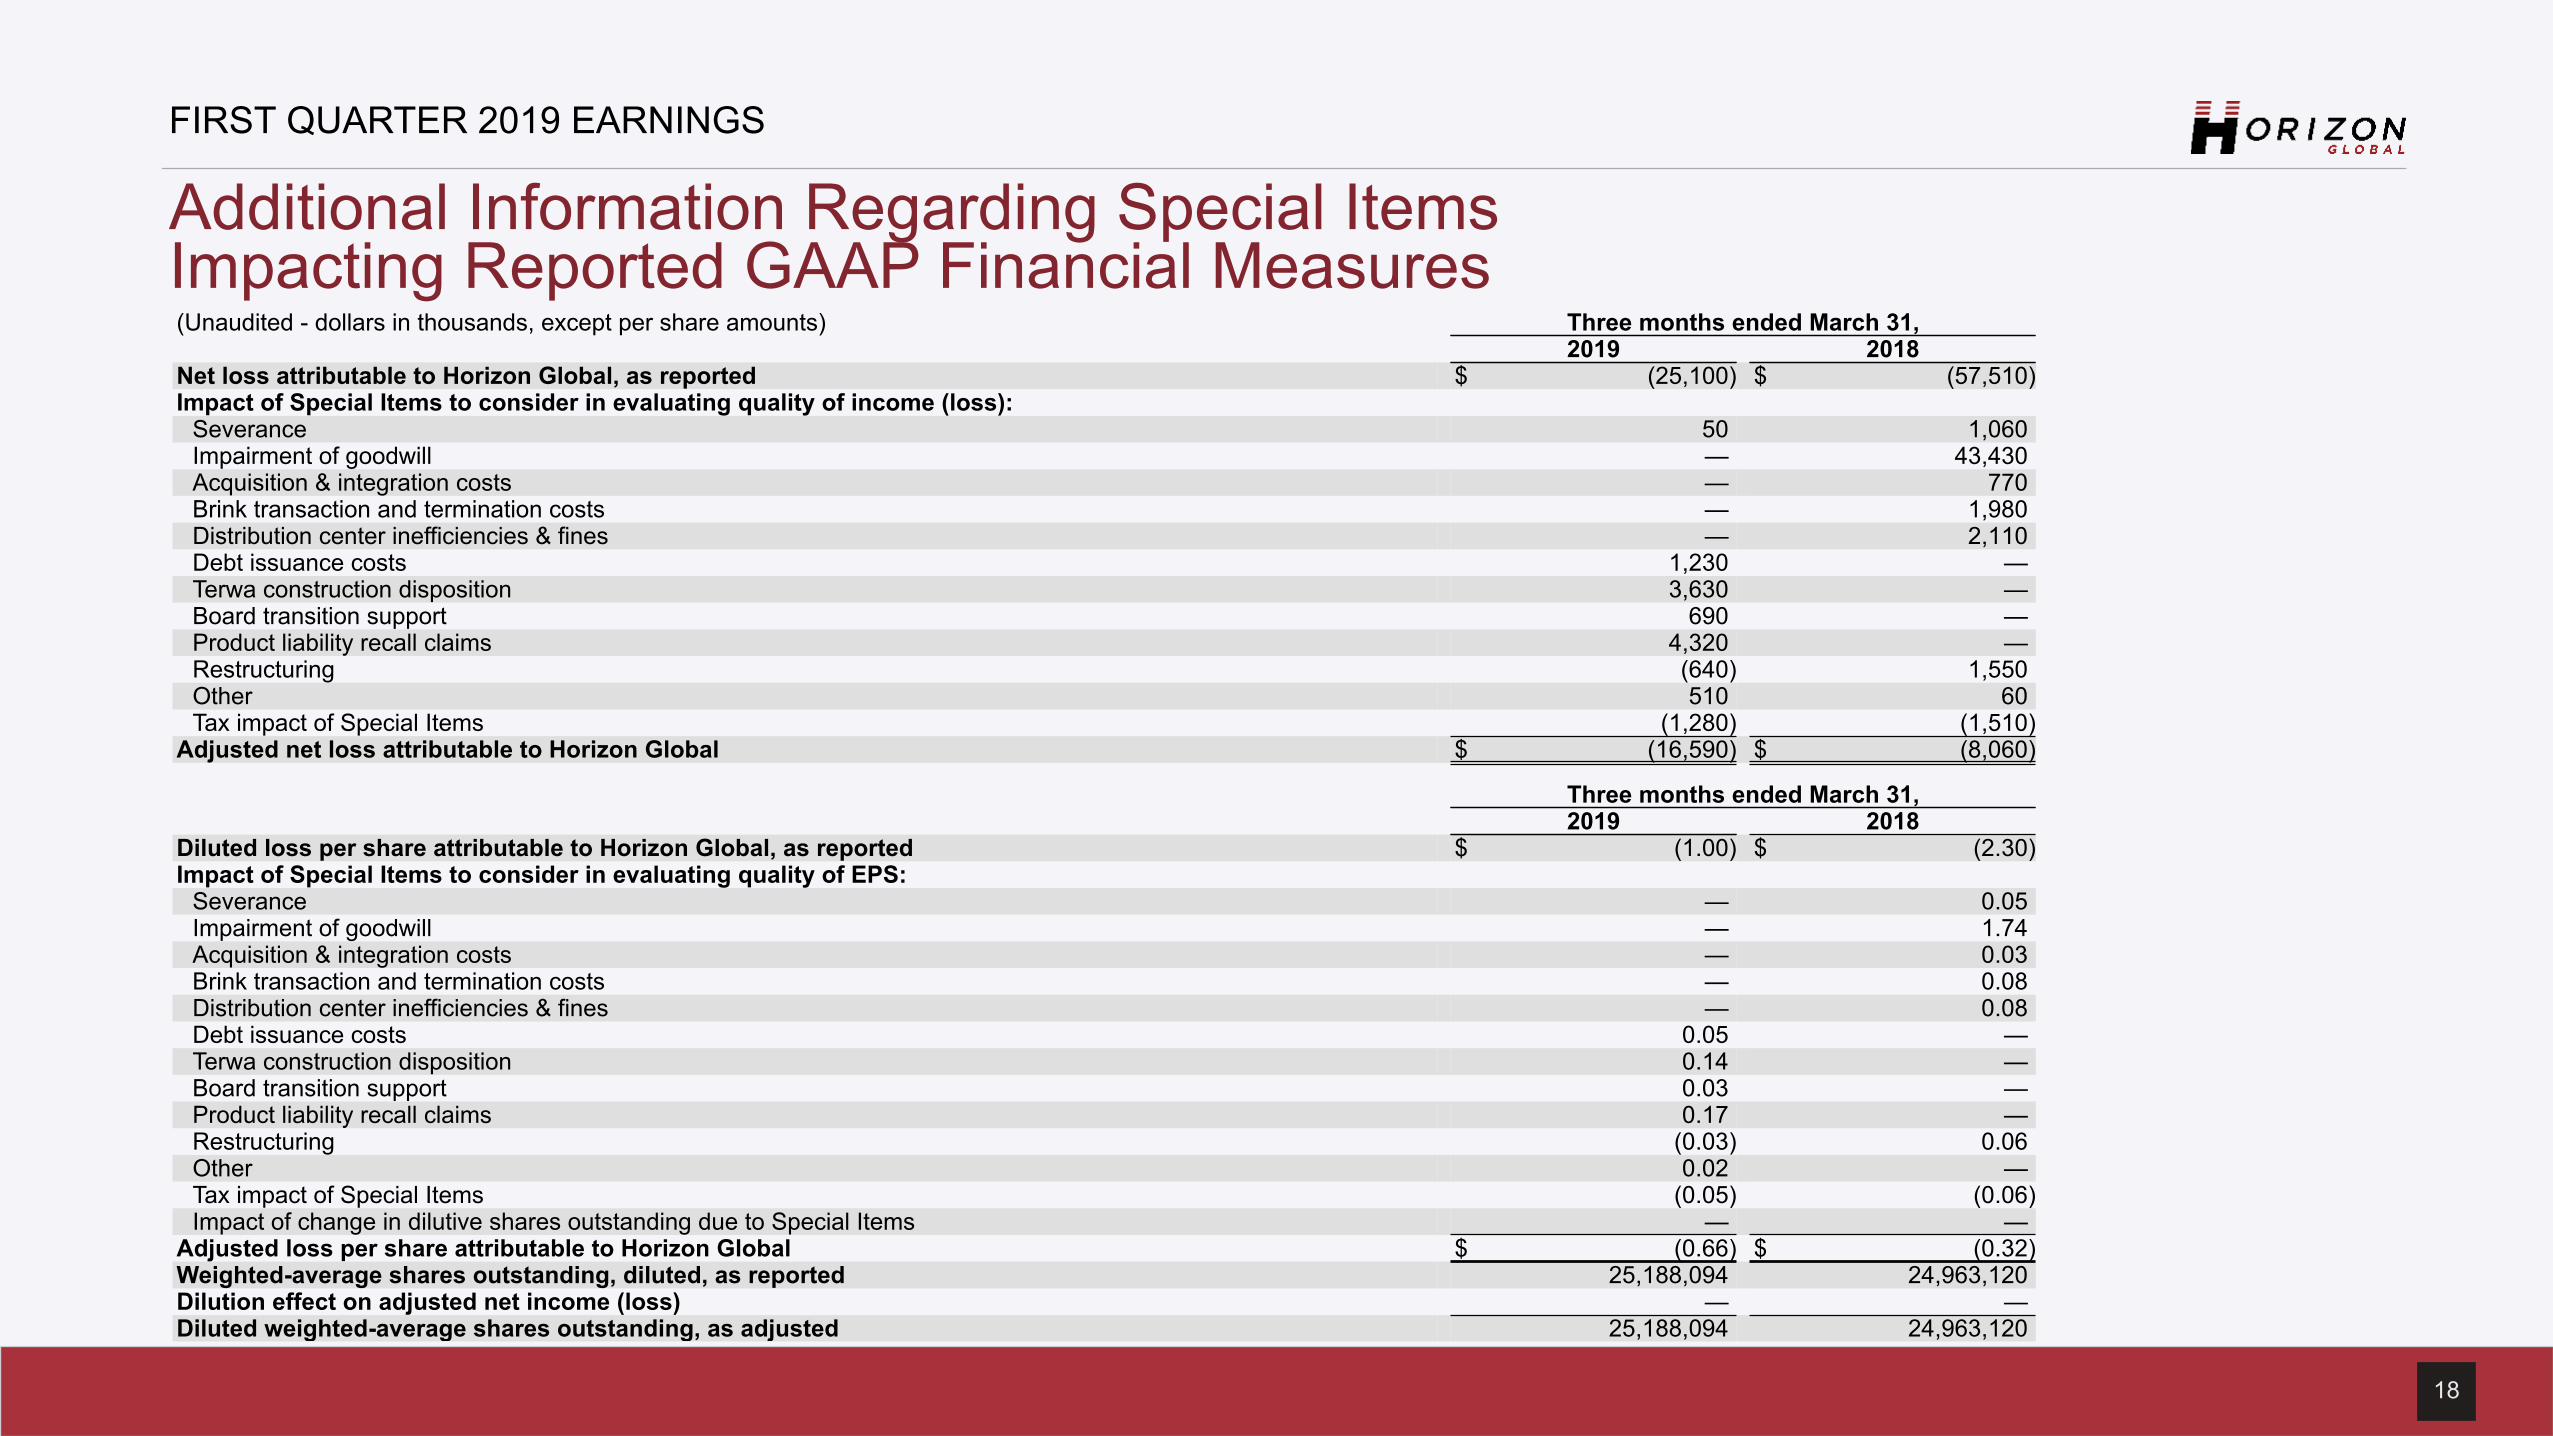
FIRST QUARTER 2019 EARNINGS
Additional Information Regarding Special ItemsImpacting Reported GAAP Financial Measures(Unaudited - dollars in thousands, except per share amounts) Three months ended March 31,
2019 2018Net loss attributable to Horizon Global, as reported $ (25,100) $ (57,510)Impact of Special Items to consider in evaluating quality of income (loss):
Severance 50 1,060Impairment of goodwill — 43,430Acquisition & integration costs — 770Brink transaction and termination costs — 1,980Distribution center inefficiencies & fines — 2,110Debt issuance costs 1,230 —Terwa construction disposition 3,630 —Board transition support 690 —Product liability recall claims 4,320 —Restructuring (640) 1,550Other 510 60Tax impact of Special Items (1,280) (1,510)
Adjusted net loss attributable to Horizon Global $ (16,590) $ (8,060)
Three months ended March 31,2019 2018
Diluted loss per share attributable to Horizon Global, as reported $ (1.00) $ (2.30)Impact of Special Items to consider in evaluating quality of EPS:
Severance — 0.05Impairment of goodwill — 1.74Acquisition & integration costs — 0.03Brink transaction and termination costs — 0.08Distribution center inefficiencies & fines — 0.08Debt issuance costs 0.05 —Terwa construction disposition 0.14 —Board transition support 0.03 —Product liability recall claims 0.17 —Restructuring (0.03) 0.06Other 0.02 —Tax impact of Special Items (0.05) (0.06)Impact of change in dilutive shares outstanding due to Special Items — —
Adjusted loss per share attributable to Horizon Global $ (0.66) $ (0.32)Weighted-average shares outstanding, diluted, as reported 25,188,094 24,963,120Dilution effect on adjusted net income (loss) — —Diluted weighted-average shares outstanding, as adjusted 25,188,094 24,963,120
19
FIRST QUARTER 2019 EARNINGS
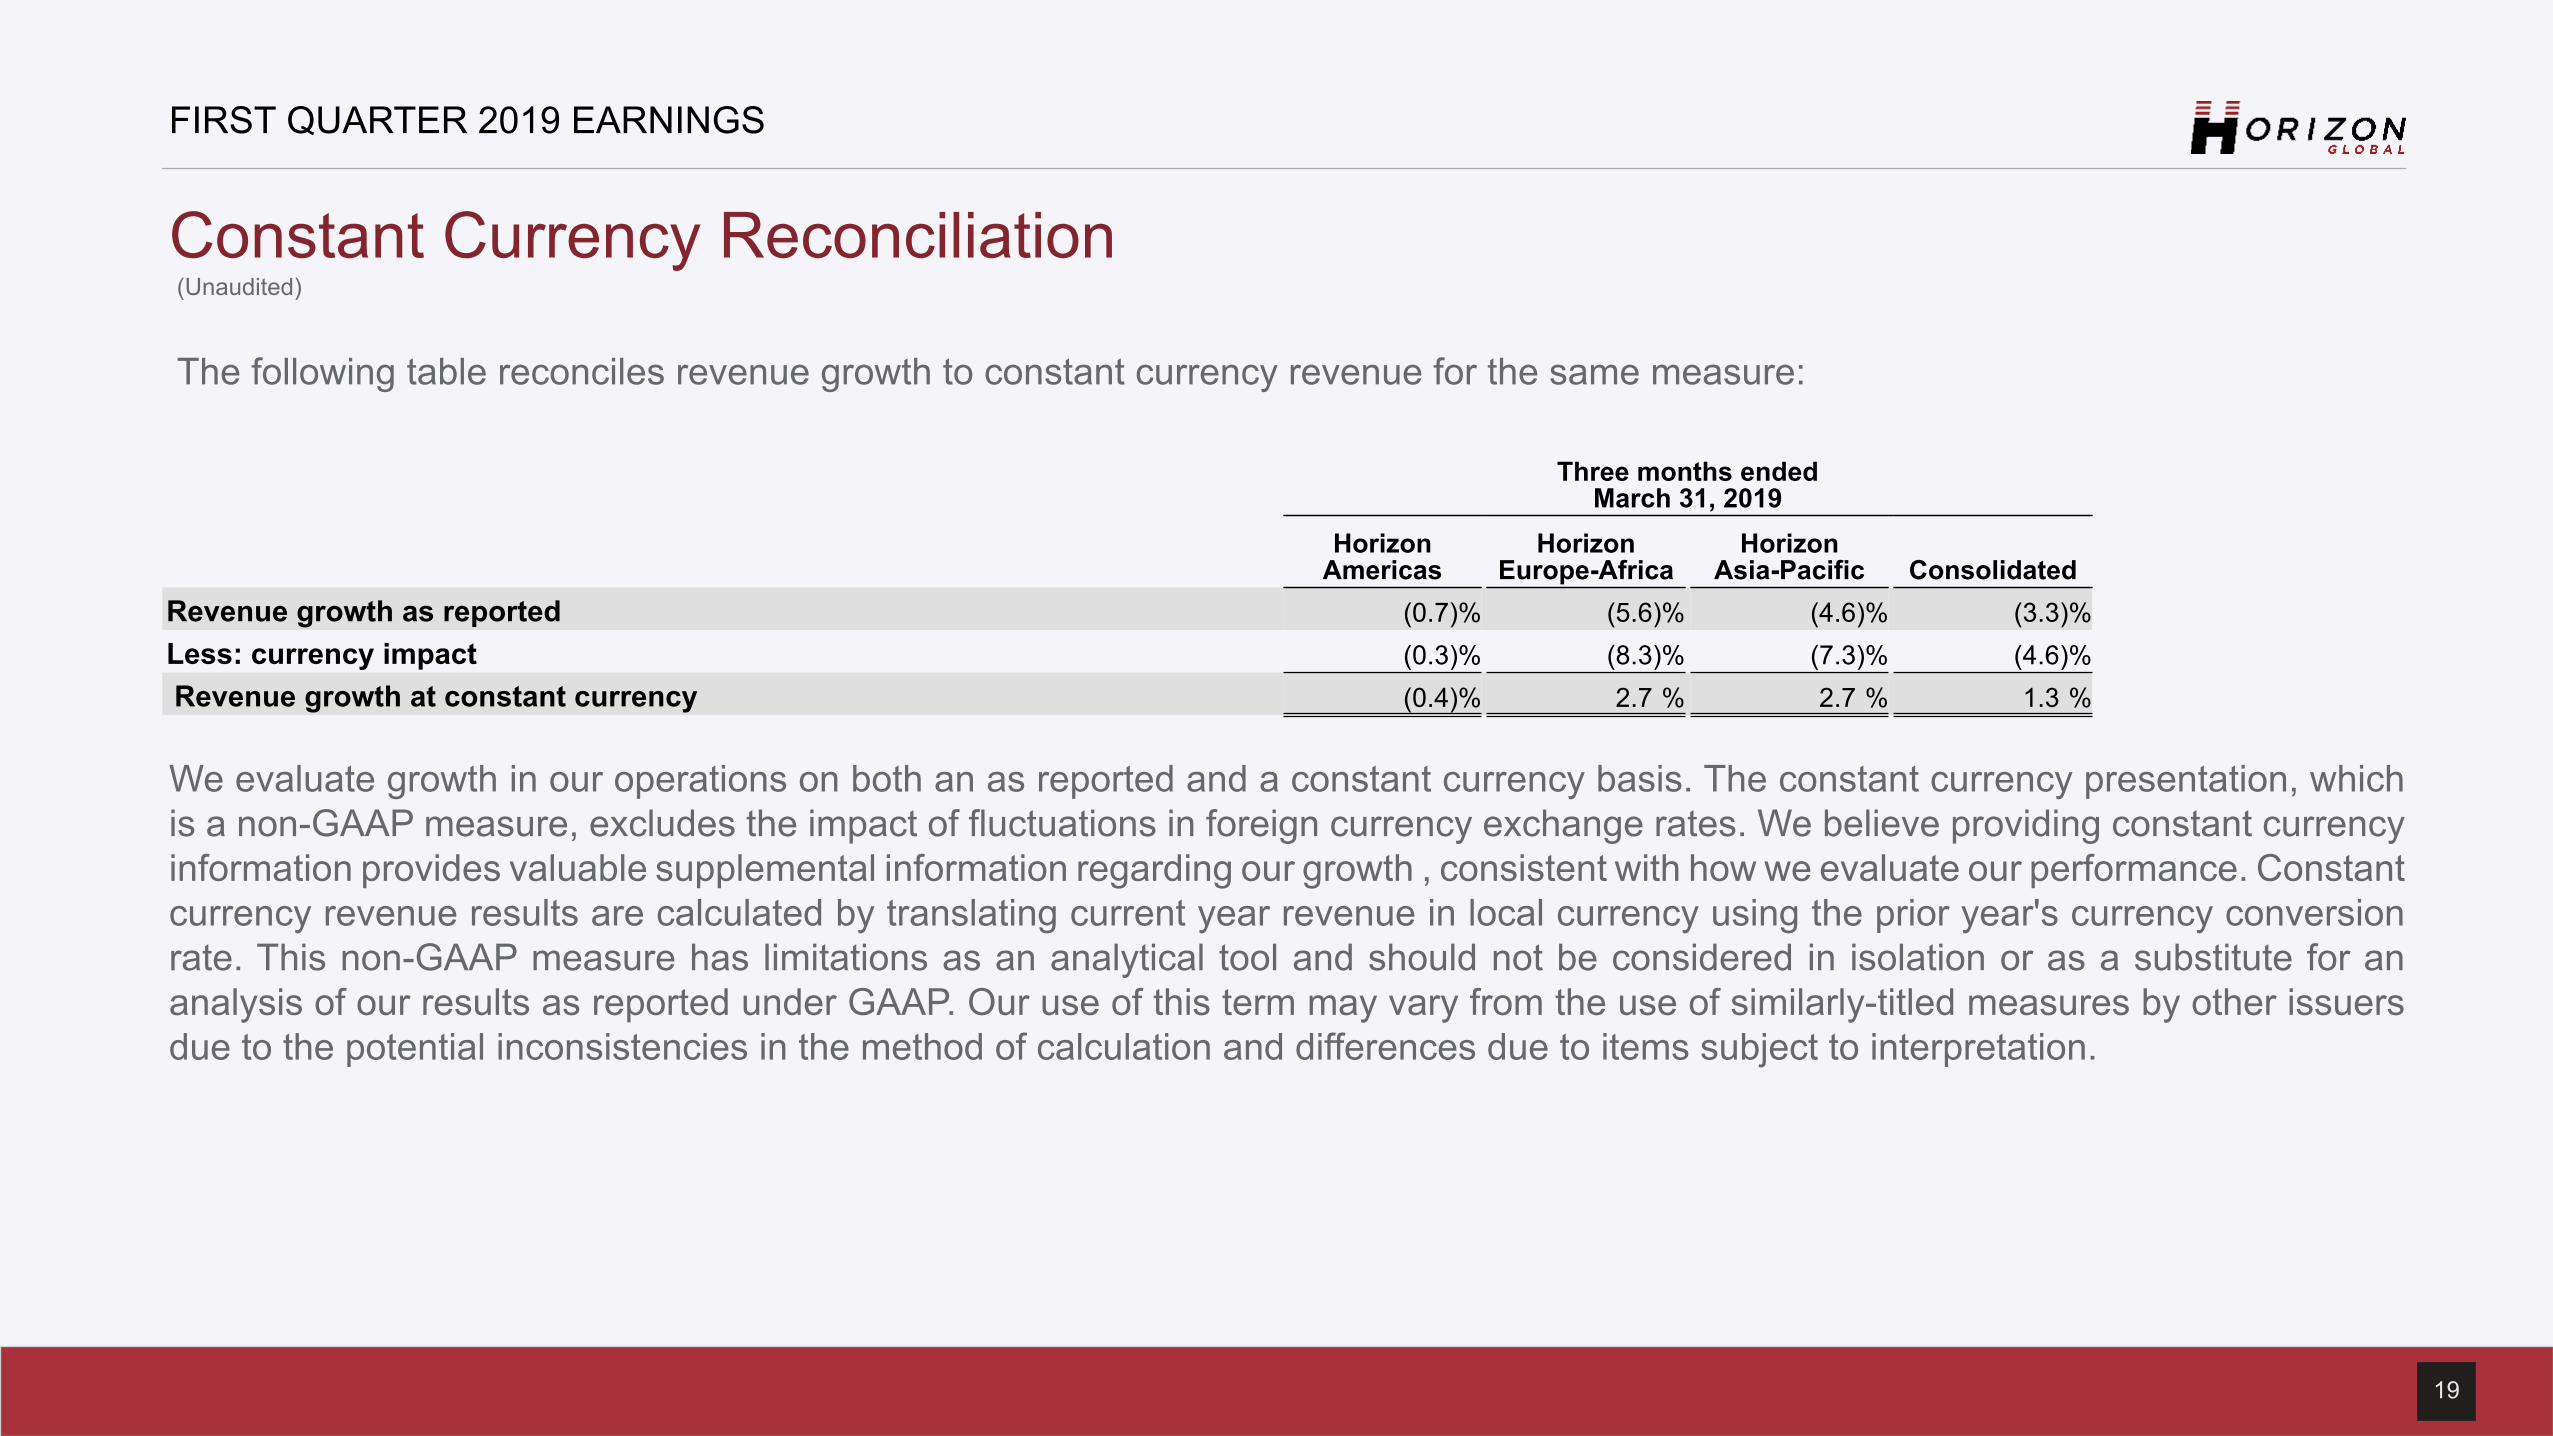
Constant Currency Reconciliation
Three months endedMarch 31, 2019
HorizonAmericas
HorizonEurope-Africa
Horizon Asia-Pacific Consolidated
Revenue growth as reported (0.7)% (5.6)% (4.6)% (3.3)%Less: currency impact (0.3)% (8.3)% (7.3)% (4.6)%Revenue growth at constant currency (0.4)% 2.7 % 2.7 % 1.3 %
(Unaudited)
The following table reconciles revenue growth to constant currency revenue for the same measure:
We evaluate growth in our operations on both an as reported and a constant currency basis. The constant currency presentation, whichis a non-GAAP measure, excludes the impact of fluctuations in foreign currency exchange rates. We believe providing constant currencyinformation provides valuable supplemental information regarding our growth , consistent with how we evaluate our performance. Constantcurrency revenue results are calculated by translating current year revenue in local currency using the prior year's currency conversionrate. This non-GAAP measure has limitations as an analytical tool and should not be considered in isolation or as a substitute for ananalysis of our results as reported under GAAP. Our use of this term may vary from the use of similarly-titled measures by other issuersdue to the potential inconsistencies in the method of calculation and differences due to items subject to interpretation.

20
HORIZON GLOBAL
2600 W. Big Beaver RdSuite 555
Troy, MI 48084
OUR PHONE+1 (248) 593-8820
OUR WEBSITEhttp://horizonglobal.com/