Embed Size (px)
Citation preview
RETAIL INVESTOR PRESENTATIONFIRST QUARTER 2018
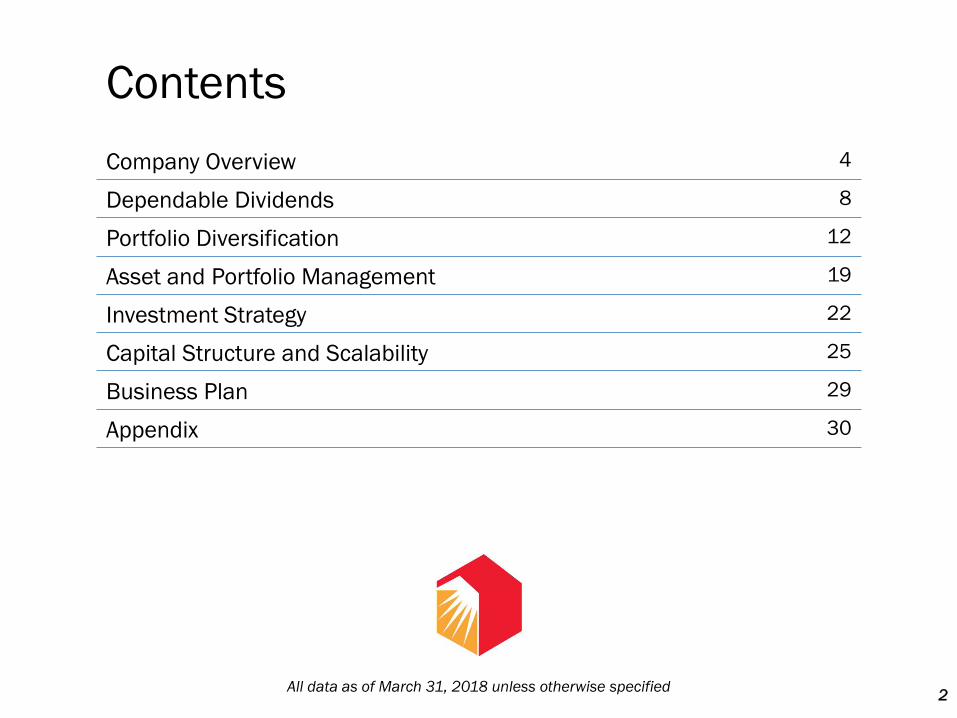
Contents
Company Overview 4
Dependable Dividends 8
Portfolio Diversification 12
Asset and Portfolio Management 19
Investment Strategy 22
Capital Structure and Scalability 25
Business Plan 29
Appendix 30
All data as of March 31, 2018 unless otherwise specified2
Safe Harbor For Forward-Looking Statements
Statements in this investor presentation that are not strictly historical are "forward-looking"statements. Forward-looking statements involve known and unknown risks, which may cause thecompany‘s actual future results to differ materially from expected results. These risks include,among others, general economic conditions, local real estate conditions, tenant financial health,the availability of capital to finance planned growth, continued volatility and uncertainty in thecredit markets and broader financial markets, property acquisitions and the timing of theseacquisitions, charges for property impairments, and the outcome of any legal proceedings to whichthe company is a party, as described in the company's filings with the Securities and ExchangeCommission. Consequently, forward-looking statements should be regarded solely as reflections ofthe company's current operating plans and estimates. Actual operating results may differ materiallyfrom what is expressed or forecast in this investor presentation. The company undertakes noobligation to publicly release the results of any revisions to these forward-looking statements thatmay be made to reflect events or circumstances after the date these statements were made.
3
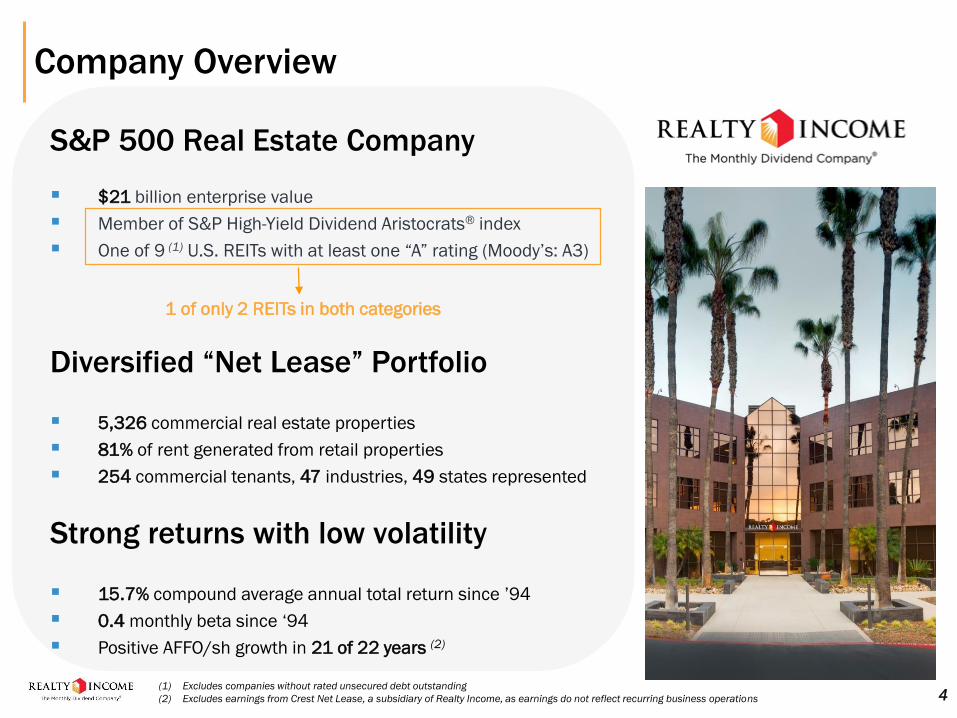
Company Overview
S&P 500 Real Estate Company
▪ $21 billion enterprise value
▪ Member of S&P High-Yield Dividend Aristocrats® index
▪ One of 9 (1) U.S. REITs with at least one “A” rating (Moody’s: A3)
Diversified “Net Lease” Portfolio
▪ 5,326 commercial real estate properties
▪ 81% of rent generated from retail properties
▪ 254 commercial tenants, 47 industries, 49 states represented
Strong returns with low volatility
▪ 15.7% compound average annual total return since ’94
▪ 0.4 monthly beta since ‘94
▪ Positive AFFO/sh growth in 21 of 22 years (2)
1 of only 2 REITs in both categories
4(1) Excludes companies without rated unsecured debt outstanding
(2) Excludes earnings from Crest Net Lease, a subsidiary of Realty Income, as earnings do not reflect recurring business operations
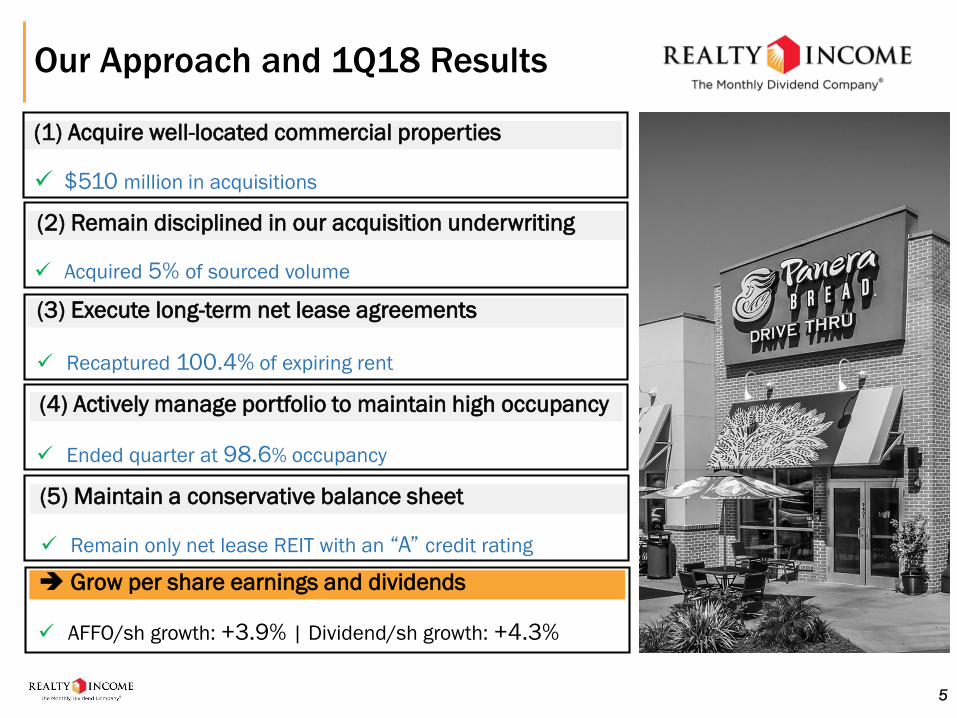
Our Approach and 1Q18 Results
(1) Acquire well-located commercial properties
(2) Remain disciplined in our acquisition underwriting
(3) Execute long-term net lease agreements
(4) Actively manage portfolio to maintain high occupancy
(5) Maintain a conservative balance sheet
✓ $510 million in acquisitions
✓ Acquired 5% of sourced volume
✓ Ended quarter at 98.6% occupancy
✓ Recaptured 100.4% of expiring rent
✓ Remain only net lease REIT with an “A” credit rating
Grow per share earnings and dividends
✓ AFFO/sh growth: +3.9% | Dividend/sh growth: +4.3%
5
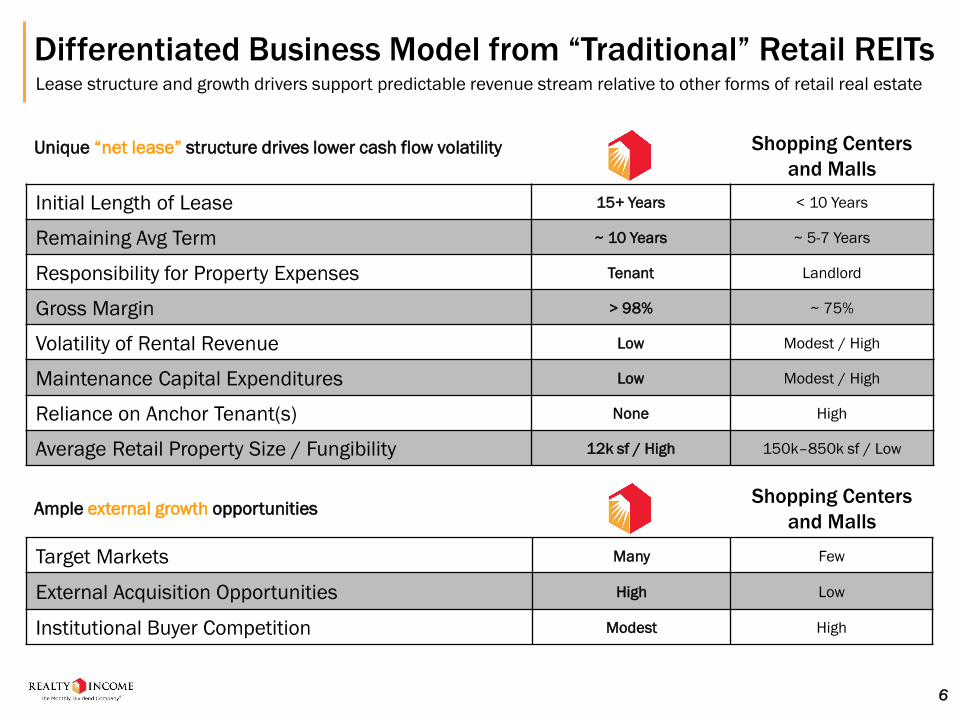
Differentiated Business Model from “Traditional” Retail REITsLease structure and growth drivers support predictable revenue stream relative to other forms of retail real estate
Initial Length of Lease 15+ Years < 10 Years
Remaining Avg Term ~ 10 Years ~ 5-7 Years
Responsibility for Property Expenses Tenant Landlord
Gross Margin > 98% ~ 75%
Volatility of Rental Revenue Low Modest / High
Maintenance Capital Expenditures Low Modest / High
Reliance on Anchor Tenant(s) None High
Average Retail Property Size / Fungibility 12k sf / High 150k–850k sf / Low
Target Markets Many Few
External Acquisition Opportunities High Low
Institutional Buyer Competition Modest High
Ample external growth opportunities
Unique “net lease” structure drives lower cash flow volatility Shopping Centers
and Malls
Shopping Centers
and Malls
6
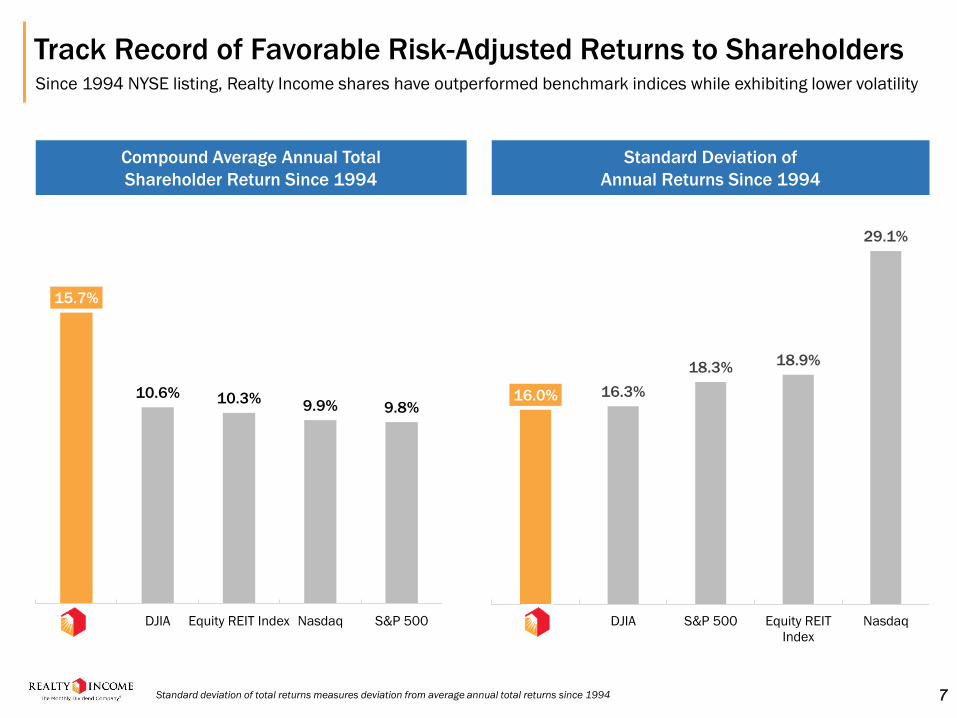
Track Record of Favorable Risk-Adjusted Returns to Shareholders Since 1994 NYSE listing, Realty Income shares have outperformed benchmark indices while exhibiting lower volatility
15.7%
10.6% 10.3%9.9% 9.8%
O DJIA Equity REIT Index Nasdaq S&P 500
16.0% 16.3%
18.3%18.9%
29.1%
O DJIA S&P 500 Equity REIT
Index
Nasdaq
Standard Deviation of
Annual Returns Since 1994
Compound Average Annual Total
Shareholder Return Since 1994
Standard deviation of total returns measures deviation from average annual total returns since 1994 7
DEPENDABLE DIVIDENDS
9
Total Return % Price Change %
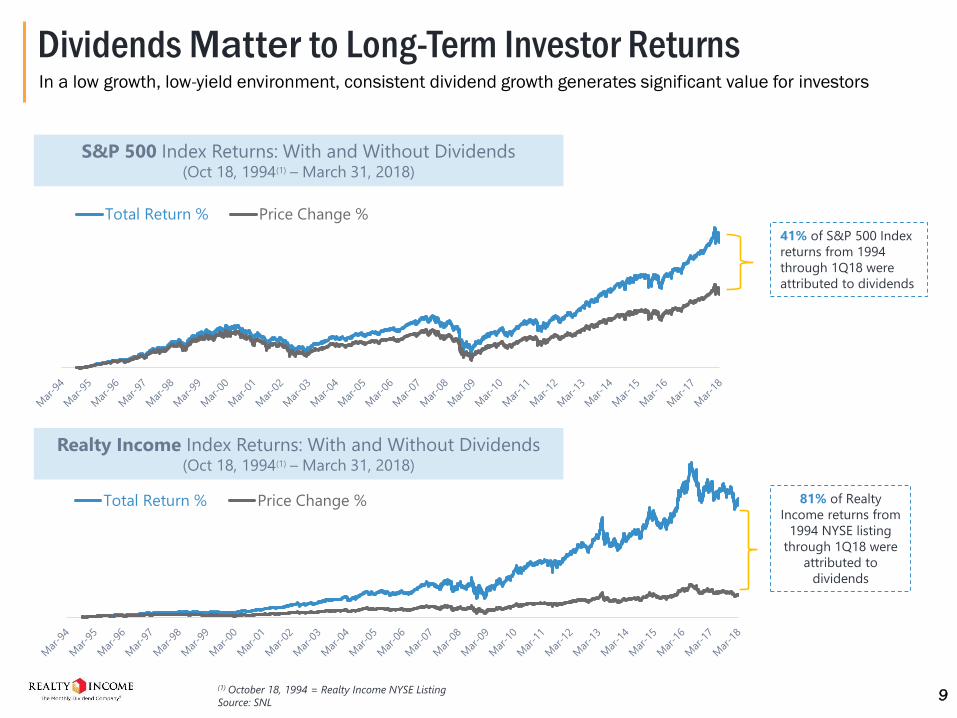
Dividends Matter to Long-Term Investor Returns
41% of S&P 500 Index
returns from 1994
through 1Q18 were
attributed to dividends
Total Return % Price Change % 81% of Realty
Income returns from
1994 NYSE listing
through 1Q18 were
attributed to
dividends
S&P 500 Index Returns: With and Without Dividends (Oct 18, 1994(1) – March 31, 2018)
Realty Income Index Returns: With and Without Dividends (Oct 18, 1994(1) – March 31, 2018)
(1) October 18, 1994 = Realty Income NYSE Listing
Source: SNL
In a low growth, low-yield environment, consistent dividend growth generates significant value for investors
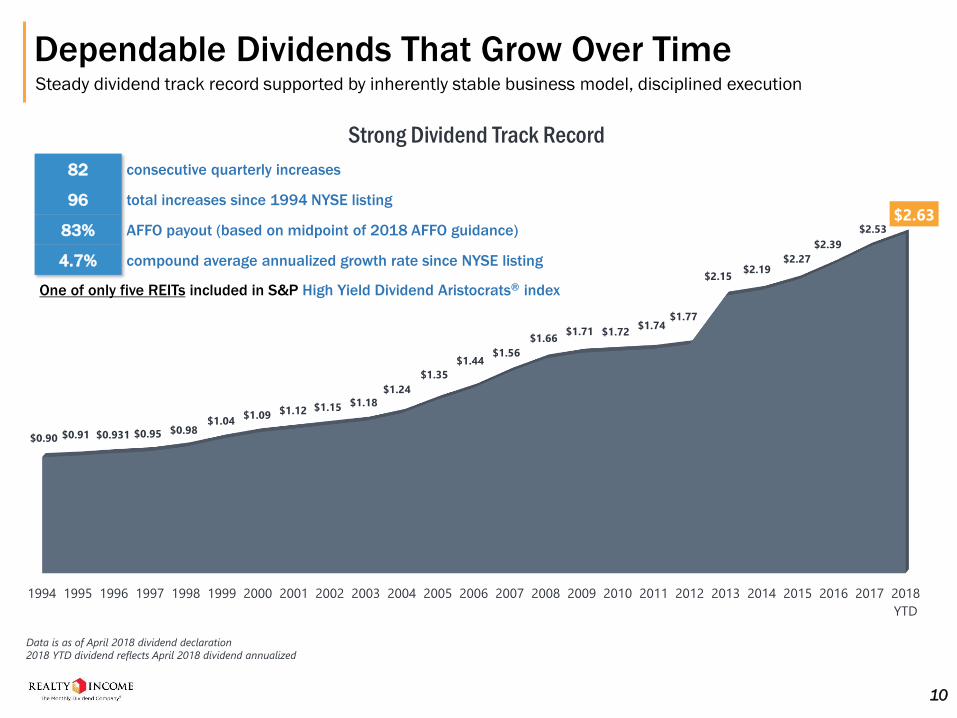
Dependable Dividends That Grow Over TimeSteady dividend track record supported by inherently stable business model, disciplined execution
1994 1995 1996 1997 1998 1999 2000 2001 2002 2003 2004 2005 2006 2007 2008 2009 2010 2011 2012 2013 2014 2015 2016 2017 2018
YTD
$0.90 $0.91 $0.931 $0.95 $0.98 $1.04
$1.09 $1.12 $1.15 $1.18
$1.24
$1.35
$1.44 $1.56
$1.66 $1.71 $1.72
$1.74 $1.77
$2.15 $2.19
$2.27
$2.39
$2.53 $2.63
Strong Dividend Track Record
82 consecutive quarterly increases
96 total increases since 1994 NYSE listing
83% AFFO payout (based on midpoint of 2018 AFFO guidance)
4.7% compound average annualized growth rate since NYSE listing
One of only five REITs included in S&P High Yield Dividend Aristocrats® index
Data is as of April 2018 dividend declaration
2018 YTD dividend reflects April 2018 dividend annualized
10
11
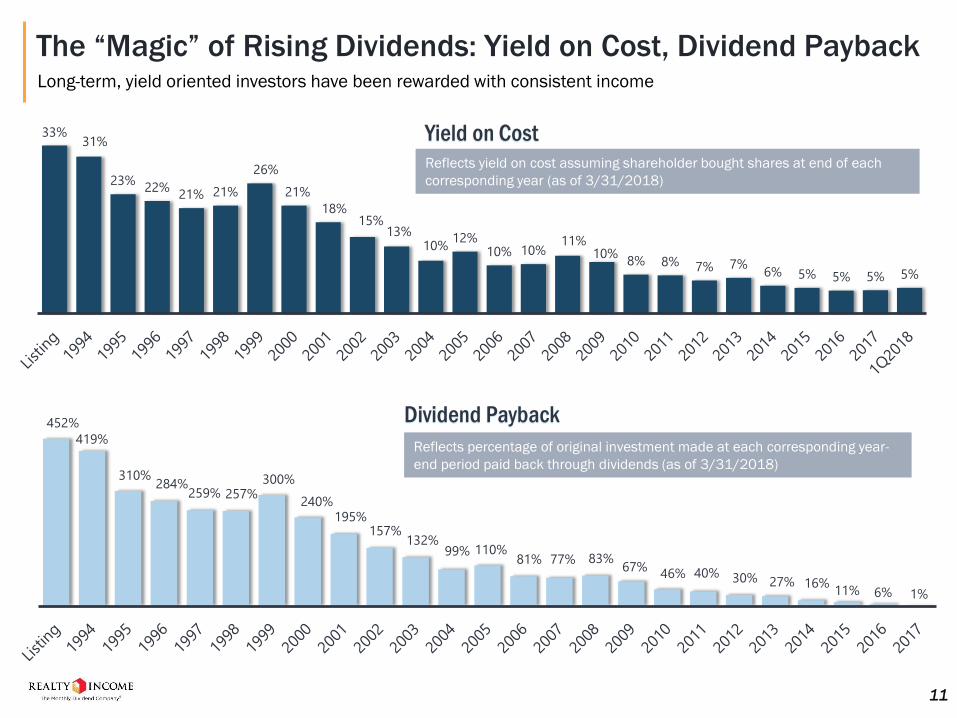
452%
419%
310%284%
259% 257%300%
240%195%
157%132%
99% 110%81% 77% 83%
67%46% 40% 30% 27% 16%
11% 6% 1%
Reflects percentage of original investment made at each corresponding year-
end period paid back through dividends (as of 3/31/2018)
Dividend Payback
33%31%
23%22%
21% 21%
26%
21%
18%15%
13%10%
12%10% 10%
11%10%
8% 8% 7% 7%6% 5% 5% 5% 5%
Reflects yield on cost assuming shareholder bought shares at end of each
corresponding year (as of 3/31/2018)
Yield on Cost
The “Magic” of Rising Dividends: Yield on Cost, Dividend PaybackLong-term, yield oriented investors have been rewarded with consistent income
Earnings Growth Outperformance
ConsistencyPORTFOLIO DIVERSIFICATION
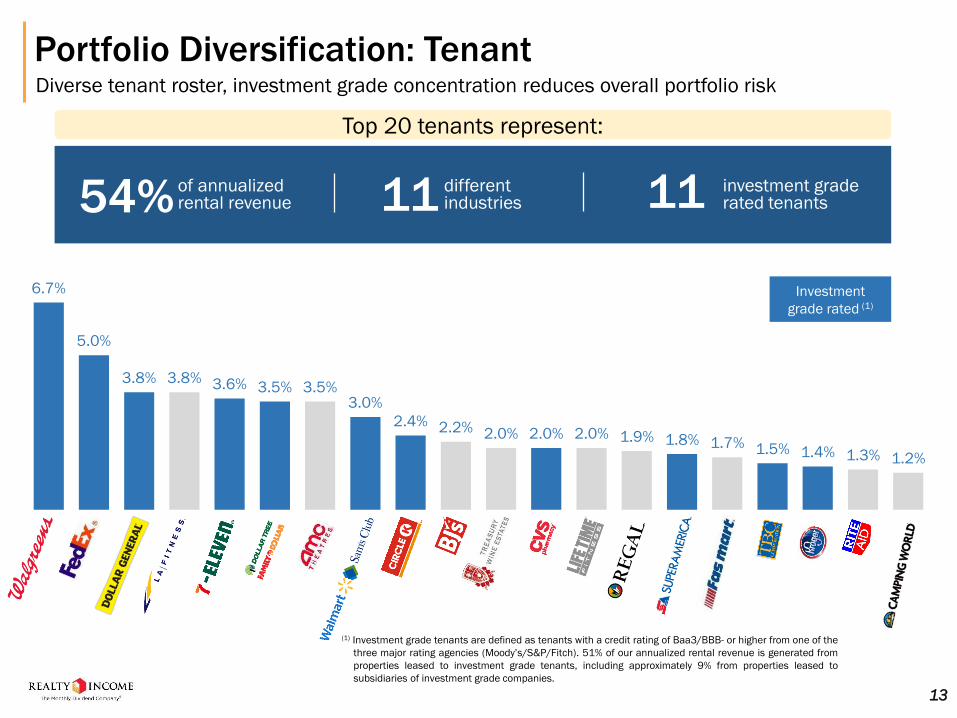
Portfolio Diversification: TenantDiverse tenant roster, investment grade concentration reduces overall portfolio risk
1.2%1.3%1.4%1.5%1.7%1.8%1.9%2.0%2.0%2.0%2.2%2.4%
3.0%3.5%3.5%3.6%3.8%3.8%
5.0%
6.7%
(1) Investment grade tenants are defined as tenants with a credit rating of Baa3/BBB- or higher from one of the
three major rating agencies (Moody’s/S&P/Fitch). 51% of our annualized rental revenue is generated from
properties leased to investment grade tenants, including approximately 9% from properties leased to
subsidiaries of investment grade companies.
54% of annualized rental revenue 11 different
industries 11 investment grade rated tenants
Investment
grade rated (1)
Top 20 tenants represent:
13
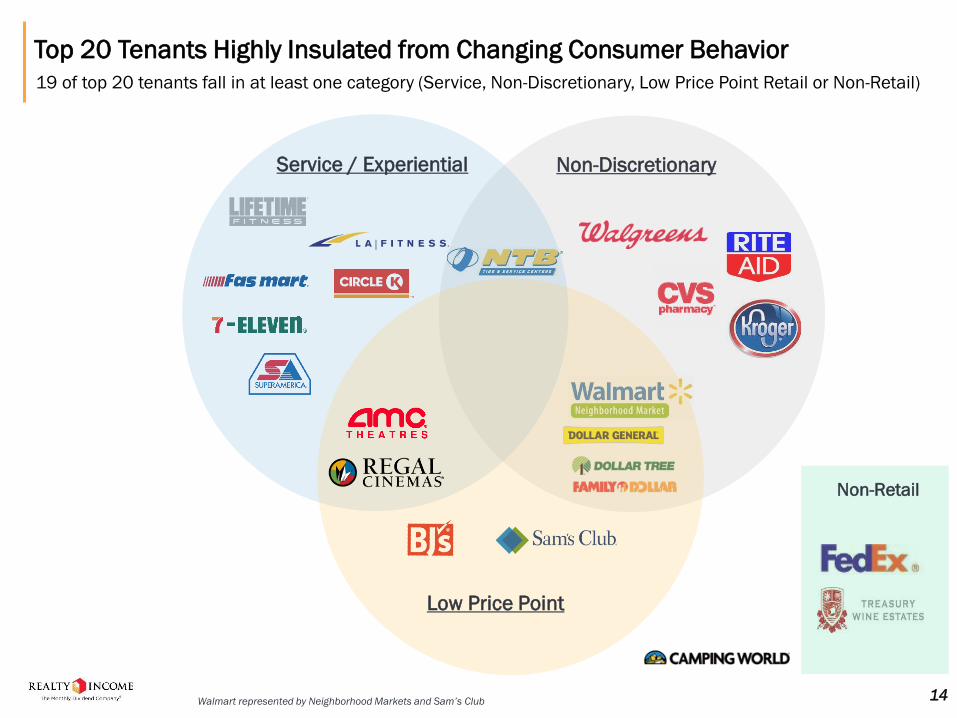
Top 20 Tenants Highly Insulated from Changing Consumer Behavior
19 of top 20 tenants fall in at least one category (Service, Non-Discretionary, Low Price Point Retail or Non-Retail)
Service / Experiential Non-Discretionary
Low Price Point
Non-Retail
Walmart represented by Neighborhood Markets and Sam’s Club 14
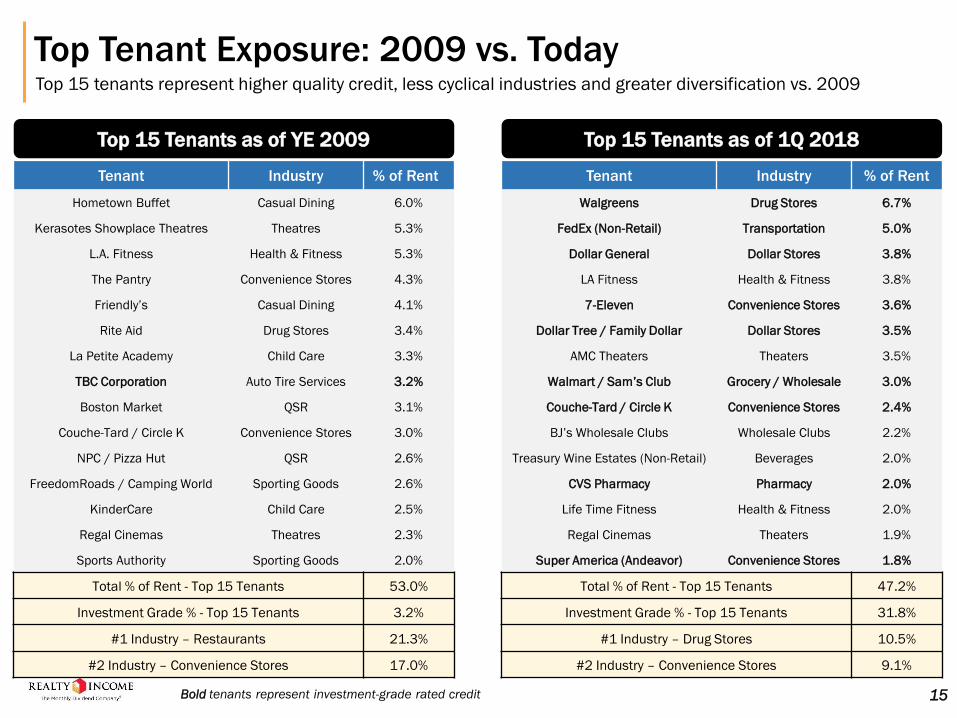
Top Tenant Exposure: 2009 vs. TodayTop 15 tenants represent higher quality credit, less cyclical industries and greater diversification vs. 2009
Tenant Industry % of Rent
Hometown Buffet Casual Dining 6.0%
Kerasotes Showplace Theatres Theatres 5.3%
L.A. Fitness Health & Fitness 5.3%
The Pantry Convenience Stores 4.3%
Friendly’s Casual Dining 4.1%
Rite Aid Drug Stores 3.4%
La Petite Academy Child Care 3.3%
TBC Corporation Auto Tire Services 3.2%
Boston Market QSR 3.1%
Couche-Tard / Circle K Convenience Stores 3.0%
NPC / Pizza Hut QSR 2.6%
FreedomRoads / Camping World Sporting Goods 2.6%
KinderCare Child Care 2.5%
Regal Cinemas Theatres 2.3%
Sports Authority Sporting Goods 2.0%
Total % of Rent - Top 15 Tenants 53.0%
Investment Grade % - Top 15 Tenants 3.2%
#1 Industry – Restaurants 21.3%
#2 Industry – Convenience Stores 17.0%
Tenant Industry % of Rent
Walgreens Drug Stores 6.7%
FedEx (Non-Retail) Transportation 5.0%
Dollar General Dollar Stores 3.8%
LA Fitness Health & Fitness 3.8%
7-Eleven Convenience Stores 3.6%
Dollar Tree / Family Dollar Dollar Stores 3.5%
AMC Theaters Theaters 3.5%
Walmart / Sam’s Club Grocery / Wholesale 3.0%
Couche-Tard / Circle K Convenience Stores 2.4%
BJ’s Wholesale Clubs Wholesale Clubs 2.2%
Treasury Wine Estates (Non-Retail) Beverages 2.0%
CVS Pharmacy Pharmacy 2.0%
Life Time Fitness Health & Fitness 2.0%
Regal Cinemas Theaters 1.9%
Super America (Andeavor) Convenience Stores 1.8%
Total % of Rent - Top 15 Tenants 47.2%
Investment Grade % - Top 15 Tenants 31.8%
#1 Industry – Drug Stores 10.5%
#2 Industry – Convenience Stores 9.1%
Top 15 Tenants as of YE 2009
Bold tenants represent investment-grade rated credit
Top 15 Tenants as of 1Q 2018
15
Service-Oriented
Non-Discretionary
N/A (Non-Retail Exposure
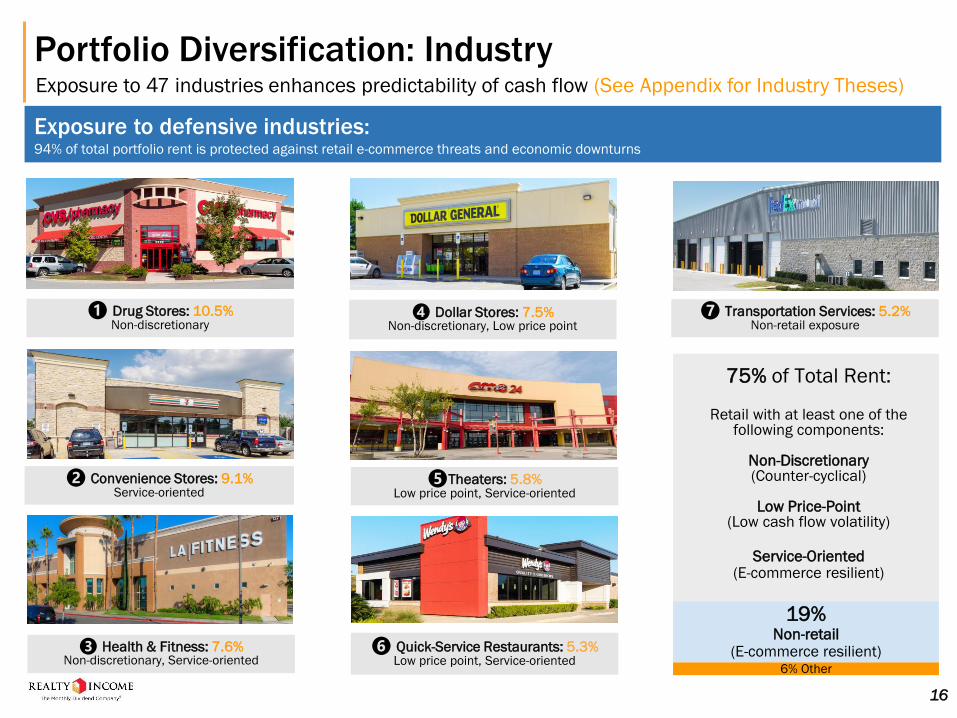
Portfolio Diversification: IndustryExposure to 47 industries enhances predictability of cash flow (See Appendix for Industry Theses)
Exposure to defensive industries:94% of total portfolio rent is protected against retail e-commerce threats and economic downturns
Non-Discretionary
Service-Oriented
Non-Discretionary, Low Price Point
Low Price Point
❶ Drug Stores: 10.5%Non-discretionary
❷ Convenience Stores: 9.1%Service-oriented
❹ Dollar Stores: 7.5%Non-discretionary, Low price point
❸ Health & Fitness: 7.6%Non-discretionary, Service-oriented
❺Theaters: 5.8%Low price point, Service-oriented
❻ Quick-Service Restaurants: 5.3%Low price point, Service-oriented
❼ Transportation Services: 5.2%Non-retail exposure
16
75% of Total Rent:
Retail with at least one of the following components:
Non-Discretionary(Counter-cyclical)
Low Price-Point(Low cash flow volatility)
Service-Oriented(E-commerce resilient)
19%Non-retail
(E-commerce resilient)6% Other
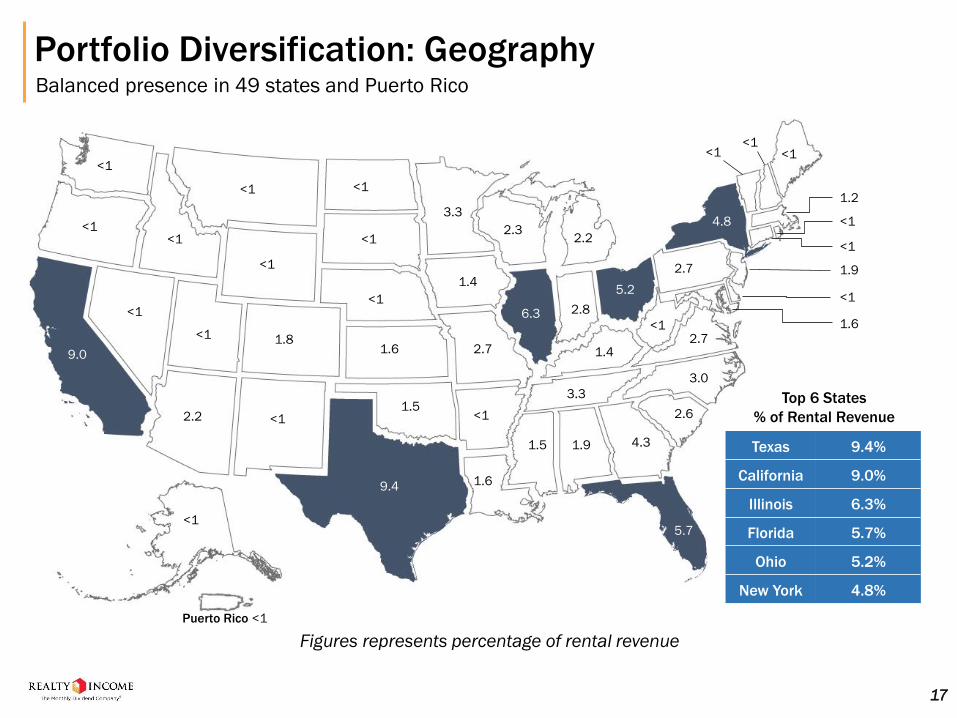
Portfolio Diversification: GeographyBalanced presence in 49 states and Puerto Rico
<1
<1
<1
<1
<1
<1
<1
2.2
<1
1.8
<1
<1
<1
1.6
1.5
3.3
1.4
2.7
<1
1.6
1.5 1.9 4.3
2.6
3.0
3.3
2.32.2
2.8
1.4
2.7
<12.7
<1
Puerto Rico <1
<1<1<1
1.2
<1
<1
1.9
<1
1.6
9.0
9.4
6.3
5.2
4.8
5.7
Texas 9.4%
California 9.0%
Illinois 6.3%
Florida 5.7%
Ohio 5.2%
New York 4.8%
Top 6 States
% of Rental Revenue
Figures represents percentage of rental revenue
17
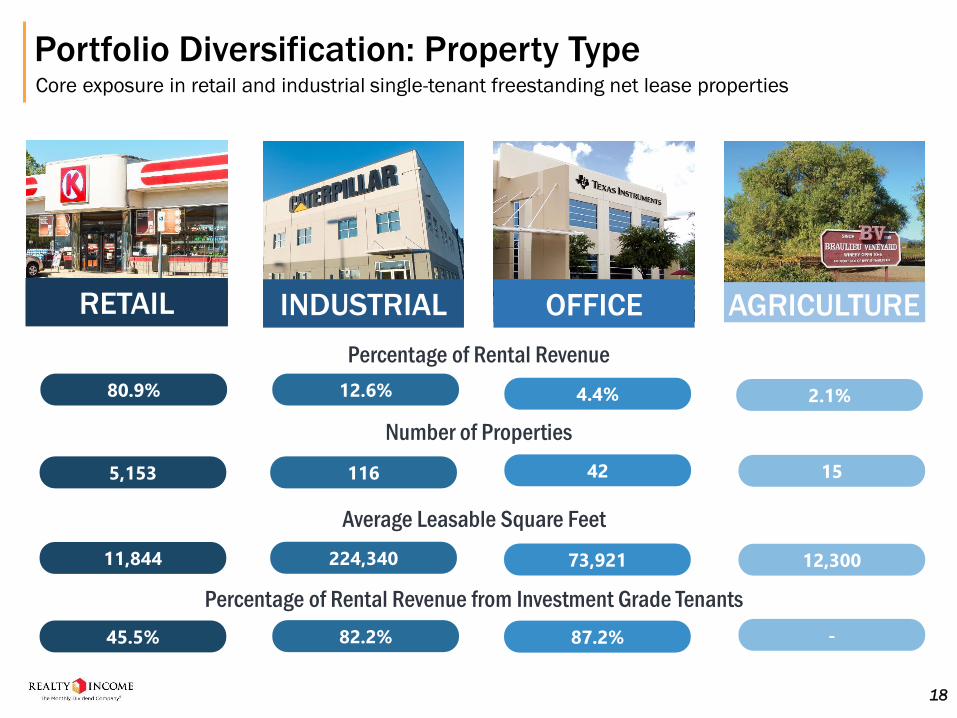
Portfolio Diversification: Property TypeCore exposure in retail and industrial single-tenant freestanding net lease properties
RETAIL INDUSTRIAL AGRICULTURE
80.9% 12.6% 4.4% 2.1%
Number of Properties
Percentage of Rental Revenue
5,153 116 42 15
Average Leasable Square Feet
11,844 224,340 73,921 12,300
Percentage of Rental Revenue from Investment Grade Tenants
45.5% 82.2% 87.2% -
OFFICE
18
ASSET AND PORTFOLIO MANAGEMENT
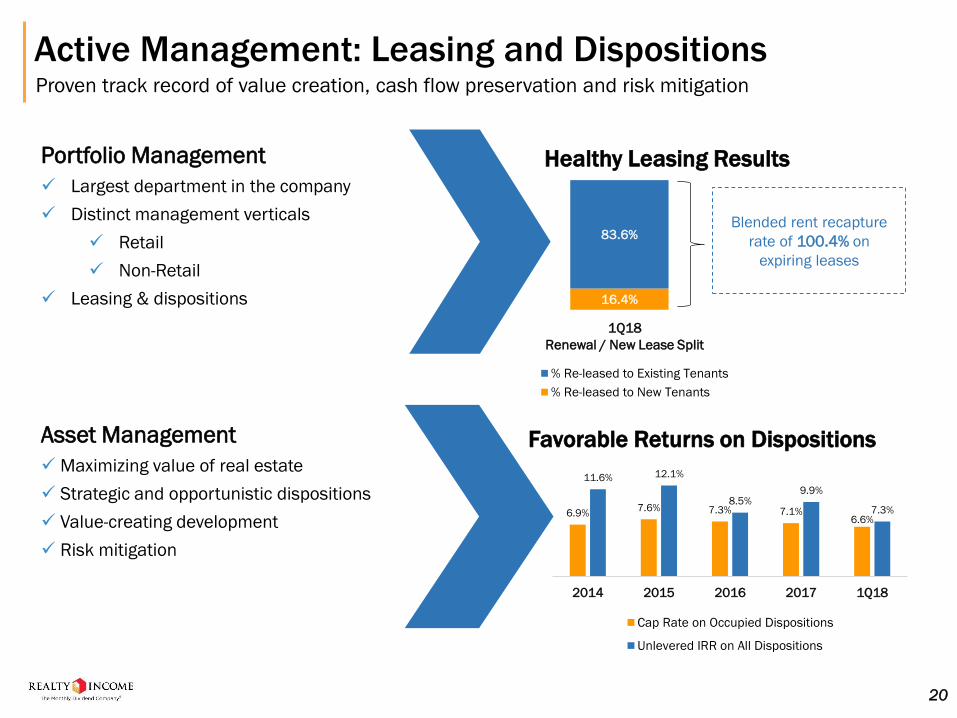
Active Management: Leasing and DispositionsProven track record of value creation, cash flow preservation and risk mitigation
Portfolio Management
✓ Largest department in the company
✓ Distinct management verticals
✓ Retail
✓ Non-Retail
✓ Leasing & dispositions
Asset Management
✓ Maximizing value of real estate
✓ Strategic and opportunistic dispositions
✓ Value-creating development
✓ Risk mitigation
Healthy Leasing Results
Favorable Returns on Dispositions
6.9%7.6% 7.3% 7.1%
6.6%
11.6% 12.1%
8.5%9.9%
7.3%
2014 2015 2016 2017 1Q18
Cap Rate on Occupied Dispositions
Unlevered IRR on All Dispositions
20
16.4%
83.6%
% Re-leased to Existing Tenants
% Re-leased to New Tenants
Blended rent recapture
rate of 100.4% on
expiring leases
1Q18
Renewal / New Lease Split
1.5%
1.1%1.3%
1.8%
1.5% 1.4% 1.4%
1.7%
1.4% 1.5%
1.1%1.3% 1.3% 1.4%
1.1%0.9%
1.6%
0.4%
1.0% 1.0% 1.0%
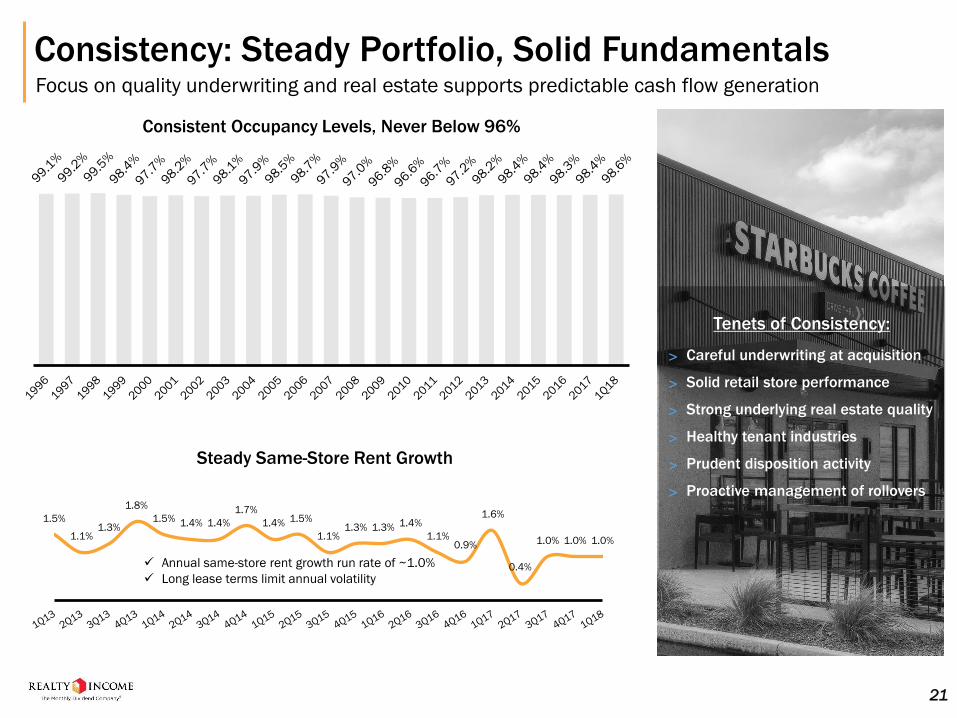
Consistency: Steady Portfolio, Solid FundamentalsFocus on quality underwriting and real estate supports predictable cash flow generation
Consistent Occupancy Levels, Never Below 96%
Steady Same-Store Rent Growth
˃ Careful underwriting at acquisition
˃ Solid retail store performance
˃ Strong underlying real estate quality
˃ Healthy tenant industries
˃ Prudent disposition activity
˃ Proactive management of rollovers
Tenets of Consistency:
✓ Annual same-store rent growth run rate of ~1.0%
✓ Long lease terms limit annual volatility
21
INVESTMENT STRATEGY
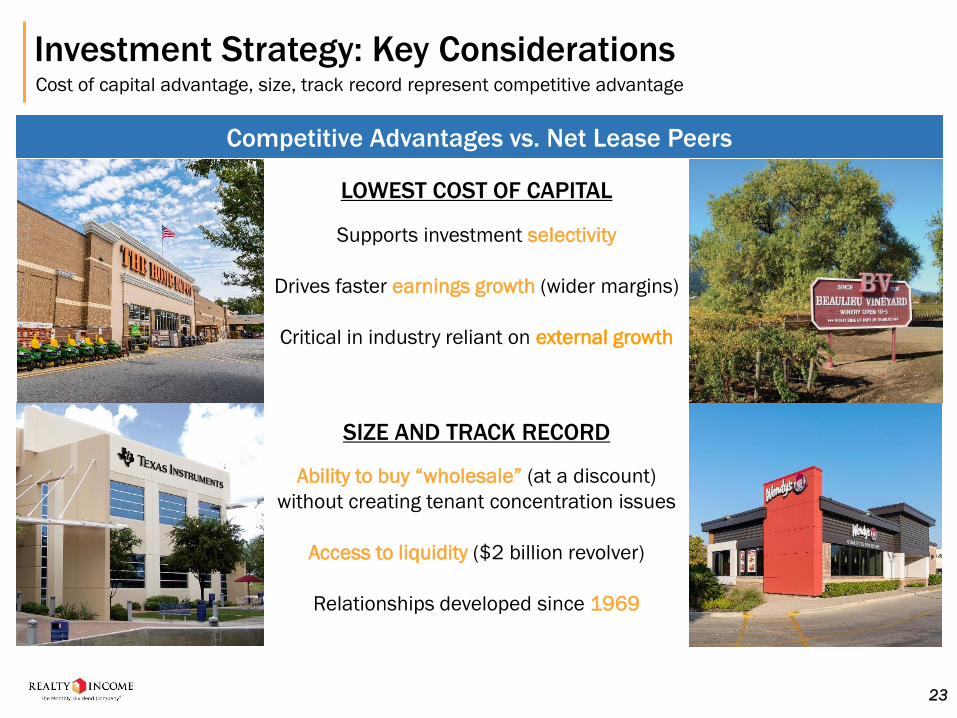
Investment Strategy: Key ConsiderationsCost of capital advantage, size, track record represent competitive advantage
LOWEST COST OF CAPITAL
Supports investment selectivity
Drives faster earnings growth (wider margins)
Critical in industry reliant on external growth
SIZE AND TRACK RECORD
Ability to buy “wholesale” (at a discount)
without creating tenant concentration issues
Access to liquidity ($2 billion revolver)
Relationships developed since 1969
Competitive Advantages vs. Net Lease Peers
23
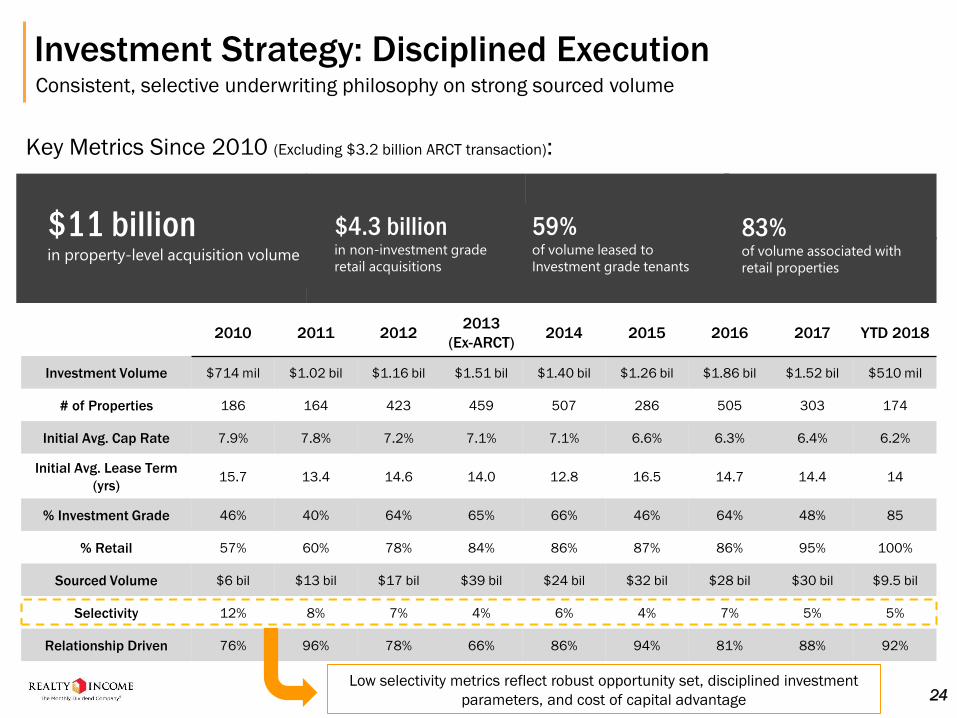
$11 billionin property-level acquisition volume
$4.3 billionin non-investment grade
retail acquisitions
83%of volume associated with
retail properties
59%of volume leased to
Investment grade tenants
Investment Strategy: Disciplined ExecutionConsistent, selective underwriting philosophy on strong sourced volume
2010 2011 20122013
(Ex-ARCT)2014 2015 2016 2017 YTD 2018
Investment Volume $714 mil $1.02 bil $1.16 bil $1.51 bil $1.40 bil $1.26 bil $1.86 bil $1.52 bil $510 mil
# of Properties 186 164 423 459 507 286 505 303 174
Initial Avg. Cap Rate 7.9% 7.8% 7.2% 7.1% 7.1% 6.6% 6.3% 6.4% 6.2%
Initial Avg. Lease Term
(yrs)15.7 13.4 14.6 14.0 12.8 16.5 14.7 14.4 14
% Investment Grade 46% 40% 64% 65% 66% 46% 64% 48% 85
% Retail 57% 60% 78% 84% 86% 87% 86% 95% 100%
Sourced Volume $6 bil $13 bil $17 bil $39 bil $24 bil $32 bil $28 bil $30 bil $9.5 bil
Selectivity 12% 8% 7% 4% 6% 4% 7% 5% 5%
Relationship Driven 76% 96% 78% 66% 86% 94% 81% 88% 92%
Key Metrics Since 2010 (Excluding $3.2 billion ARCT transaction):
24Low selectivity metrics reflect robust opportunity set, disciplined investment
parameters, and cost of capital advantage
CAPITAL STRUCTURE AND SCALABILITY
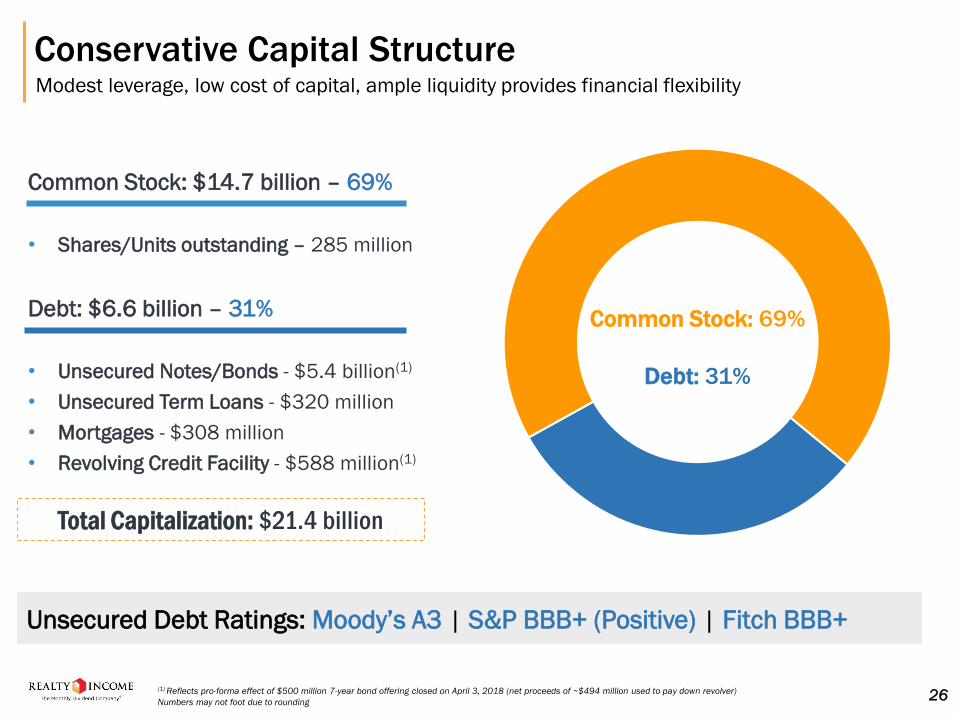
Conservative Capital StructureModest leverage, low cost of capital, ample liquidity provides financial flexibility
Common Stock: 69%
Debt: 31%
Common Stock: $14.7 billion – 69%
• Shares/Units outstanding – 285 million
Debt: $6.6 billion – 31%
• Unsecured Notes/Bonds - $5.4 billion(1)
• Unsecured Term Loans - $320 million
• Mortgages - $308 million
• Revolving Credit Facility - $588 million(1)
Total Capitalization: $21.4 billion
Unsecured Debt Ratings: Moody’s A3 | S&P BBB+ (Positive) | Fitch BBB+
26(1) Reflects pro-forma effect of $500 million 7-year bond offering closed on April 3, 2018 (net proceeds of ~$494 million used to pay down revolver)
Numbers may not foot due to rounding
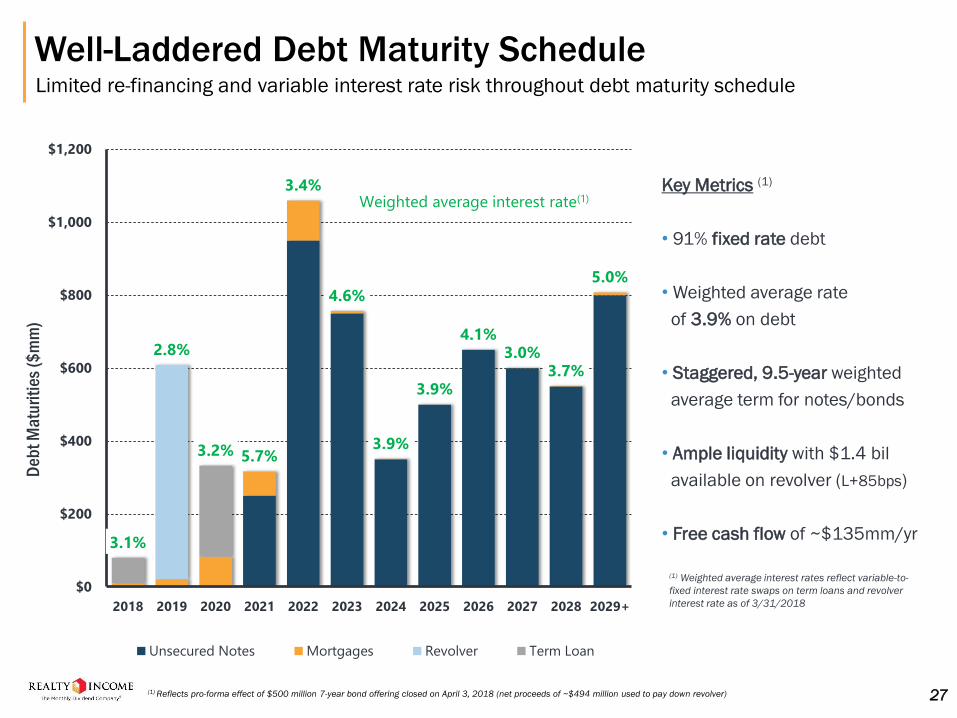
Well-Laddered Debt Maturity ScheduleLimited re-financing and variable interest rate risk throughout debt maturity schedule
Key Metrics (1)
• 91% fixed rate debt
• Weighted average rate
of 3.9% on debt
• Staggered, 9.5-year weighted
average term for notes/bonds
• Ample liquidity with $1.4 bil
available on revolver (L+85bps)
• Free cash flow of ~$135mm/yr3.1%
2.8%
3.2% 5.7%
3.4%
4.6%
3.9%
3.9%
4.1%3.0%
3.7%
5.0%
$0
$200
$400
$600
$800
$1,000
$1,200
2018 2019 2020 2021 2022 2023 2024 2025 2026 2027 2028 2029+
Unsecured Notes Mortgages Revolver Term Loan
Weighted average interest rate(1)
De
bt
Ma
turi
ties
($m
m)
(1) Weighted average interest rates reflect variable-to-
fixed interest rate swaps on term loans and revolver
interest rate as of 3/31/2018
27(1) Reflects pro-forma effect of $500 million 7-year bond offering closed on April 3, 2018 (net proceeds of ~$494 million used to pay down revolver)
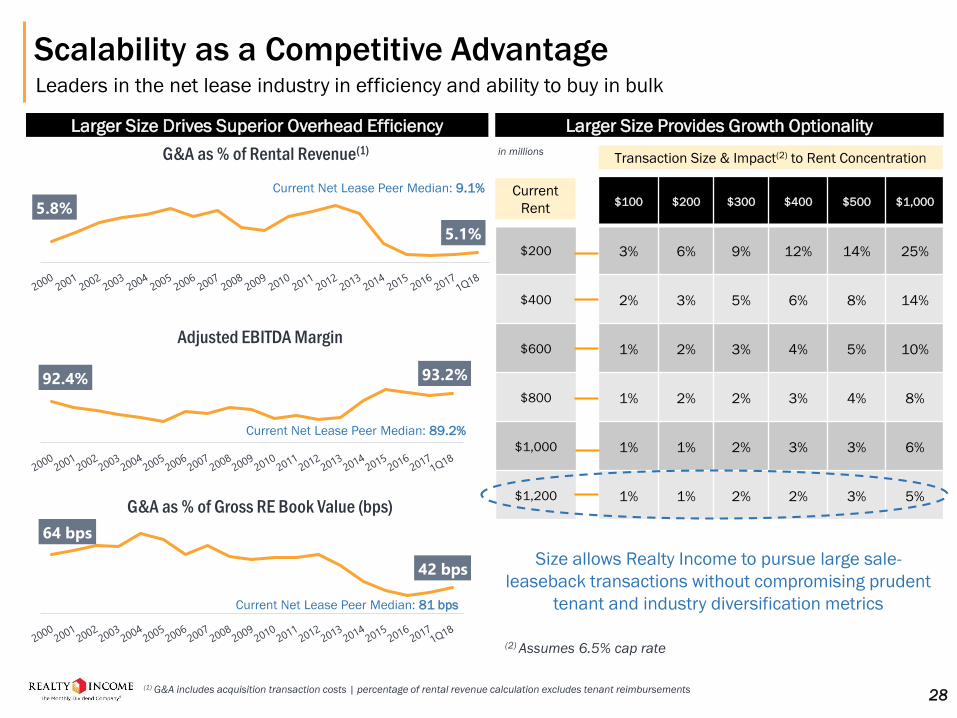
Scalability as a Competitive AdvantageLeaders in the net lease industry in efficiency and ability to buy in bulk
5.8%
5.1%
G&A as % of Rental Revenue(1)
(1) G&A includes acquisition transaction costs | percentage of rental revenue calculation excludes tenant reimbursements
64 bps
42 bps
G&A as % of Gross RE Book Value (bps)
92.4% 93.2%
Adjusted EBITDA Margin
Larger Size Drives Superior Overhead Efficiency
28
Larger Size Provides Growth Optionality
$100 $200 $300 $400 $500 $1,000
$200 3% 6% 9% 12% 14% 25%
$400 2% 3% 5% 6% 8% 14%
$600 1% 2% 3% 4% 5% 10%
$800 1% 2% 2% 3% 4% 8%
$1,000 1% 1% 2% 3% 3% 6%
$1,200 1% 1% 2% 2% 3% 5%
Transaction Size & Impact(2) to Rent Concentration
Current
Rent
Size allows Realty Income to pursue large sale-
leaseback transactions without compromising prudent
tenant and industry diversification metrics
(2) Assumes 6.5% cap rate
in millions
Current Net Lease Peer Median: 9.1%
Current Net Lease Peer Median: 89.2%
Current Net Lease Peer Median: 81 bps
Business Plan
• Pay 12 monthly dividends
• Raise the dividend
• Remain disciplined in our acquisitions underwriting approach
• Acquire additional properties according to our selective investment strategy
• Maintain high occupancy through active portfolio management
• Maintain a conservative balance sheet
• Continue to grow investor interest in The Monthly Dividend Company®
NYSE: “O”
APPENDIX
30
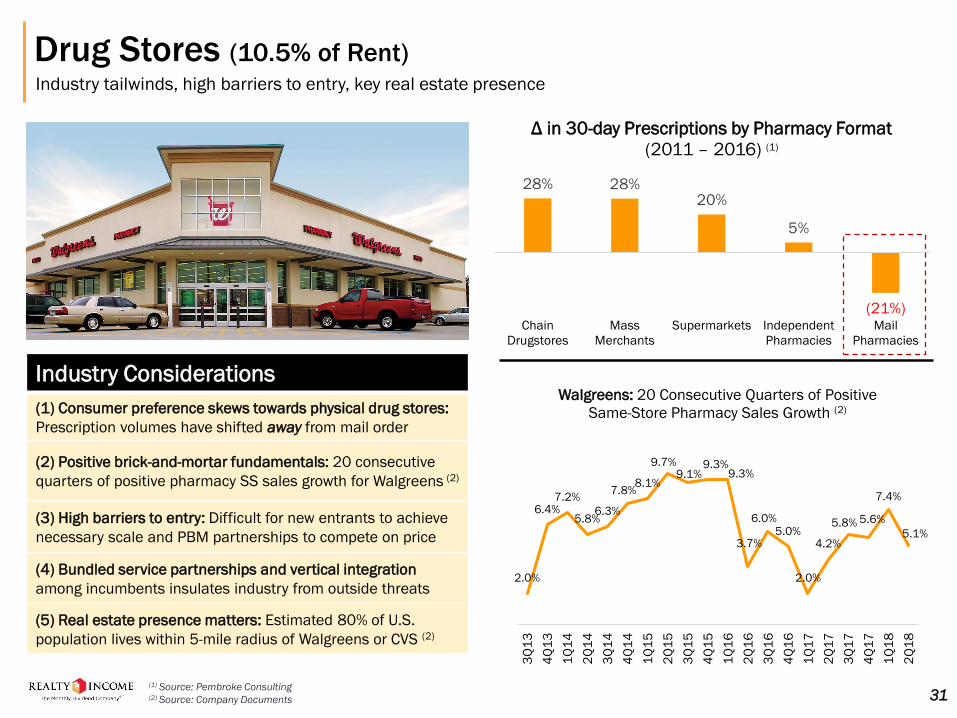
Drug Stores (10.5% of Rent)Industry tailwinds, high barriers to entry, key real estate presence
Industry Considerations
(1) Consumer preference skews towards physical drug stores:
Prescription volumes have shifted away from mail order
(2) Positive brick-and-mortar fundamentals: 20 consecutive
quarters of positive pharmacy SS sales growth for Walgreens (2)
(3) High barriers to entry: Difficult for new entrants to achieve
necessary scale and PBM partnerships to compete on price
(4) Bundled service partnerships and vertical integration
among incumbents insulates industry from outside threats
(5) Real estate presence matters: Estimated 80% of U.S.
population lives within 5-mile radius of Walgreens or CVS (2)
28% 28%20%
5%
(21%)Chain
Drugstores
Mass
Merchants
Supermarkets Independent
Pharmacies
Pharmacies
Δ in 30-day Prescriptions by Pharmacy Format
(2011 – 2016) (1)
(1) Source: Pembroke Consulting(2) Source: Company Documents
2.0%
6.4%7.2%
5.8%6.3%
7.8%8.1%
9.7%9.1%
9.3%9.3%
3.7%
6.0%5.0%
2.0%
4.2%
5.8% 5.6%
7.4%
5.1%3
Q1
3
4Q
13
1Q
14
2Q
14
3Q
14
4Q
14
1Q
15
2Q
15
3Q
15
4Q
15
1Q
16
2Q
16
3Q
16
4Q
16
1Q
17
2Q
17
3Q
17
4Q
17
1Q
18
2Q
18
Walgreens: 20 Consecutive Quarters of Positive
Same-Store Pharmacy Sales Growth (2)
31
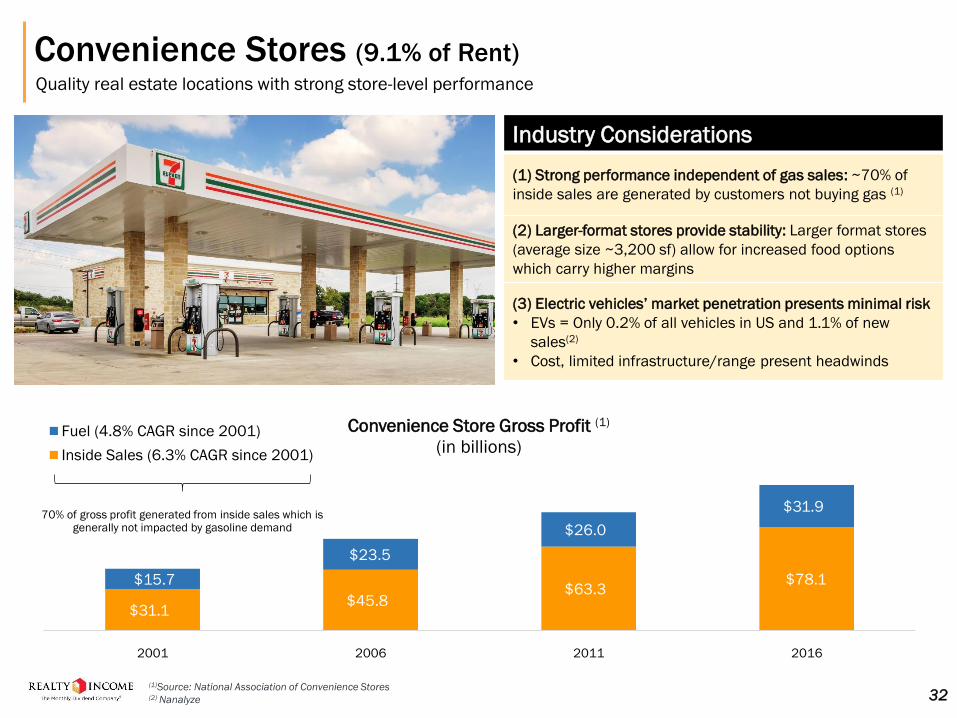
Convenience Stores (9.1% of Rent)Quality real estate locations with strong store-level performance
Industry Considerations
(1) Strong performance independent of gas sales: ~70% of
inside sales are generated by customers not buying gas (1)
(2) Larger-format stores provide stability: Larger format stores
(average size ~3,200 sf) allow for increased food options
which carry higher margins
(3) Electric vehicles’ market penetration presents minimal risk
• EVs = Only 0.2% of all vehicles in US and 1.1% of new
sales(2)
• Cost, limited infrastructure/range present headwinds
$31.1 $45.8
$63.3 $78.1 $15.7
$23.5
$26.0
$31.9
2001 2006 2011 2016
Convenience Store Gross Profit (1)
(in billions)Fuel (4.8% CAGR since 2001)
Inside Sales (6.3% CAGR since 2001)
70% of gross profit generated from inside sales which is generally not impacted by gasoline demand
(1)Source: National Association of Convenience Stores(2) Nanalyze 32
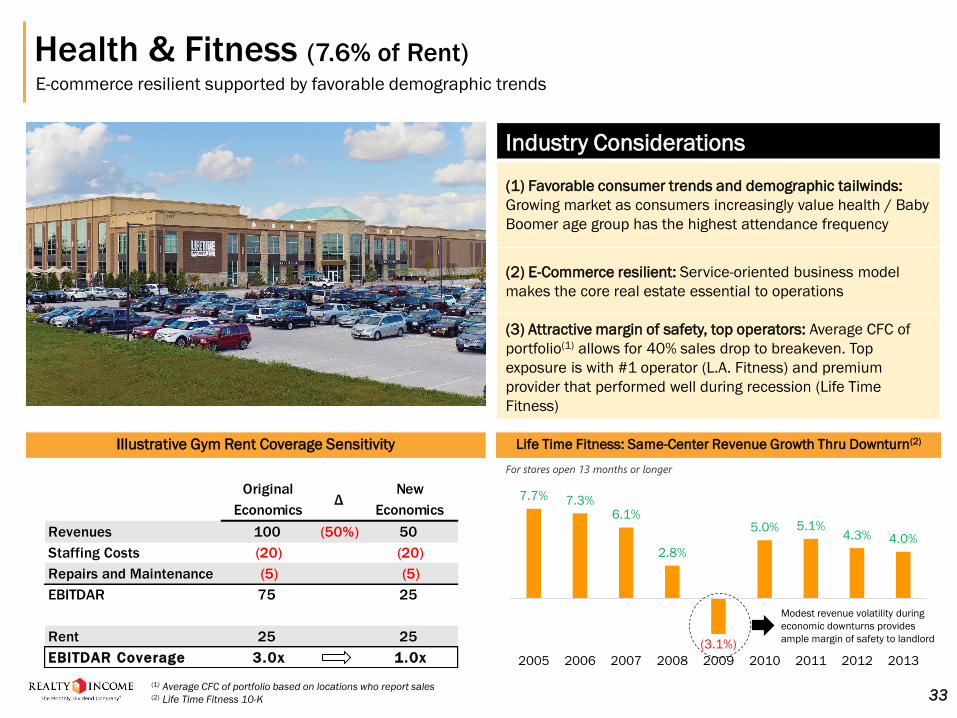
Health & Fitness (7.6% of Rent)E-commerce resilient supported by favorable demographic trends
Industry Considerations
(1) Favorable consumer trends and demographic tailwinds:
Growing market as consumers increasingly value health / Baby
Boomer age group has the highest attendance frequency
(2) E-Commerce resilient: Service-oriented business model
makes the core real estate essential to operations
(3) Attractive margin of safety, top operators: Average CFC of
portfolio(1) allows for 40% sales drop to breakeven. Top
exposure is with #1 operator (L.A. Fitness) and premium
provider that performed well during recession (Life Time
Fitness)
Original
EconomicsΔ
New
Economics
Revenues 100 (50%) 50
Staffing Costs (20) (20)
Repairs and Maintenance (5) (5)
EBITDAR 75 25
Rent 25 25
EBITDAR Coverage 3.0x 1.0x
Illustrative Gym Rent Coverage Sensitivity Life Time Fitness: Same-Center Revenue Growth Thru Downturn(2)
7.7% 7.3%6.1%
2.8%
(3.1%)
5.0% 5.1%4.3% 4.0%
2005 2006 2007 2008 2009 2010 2011 2012 2013
For stores open 13 months or longer
Modest revenue volatility during
economic downturns provides
ample margin of safety to landlord
33(1) Average CFC of portfolio based on locations who report sales(2) Life Time Fitness 10-K
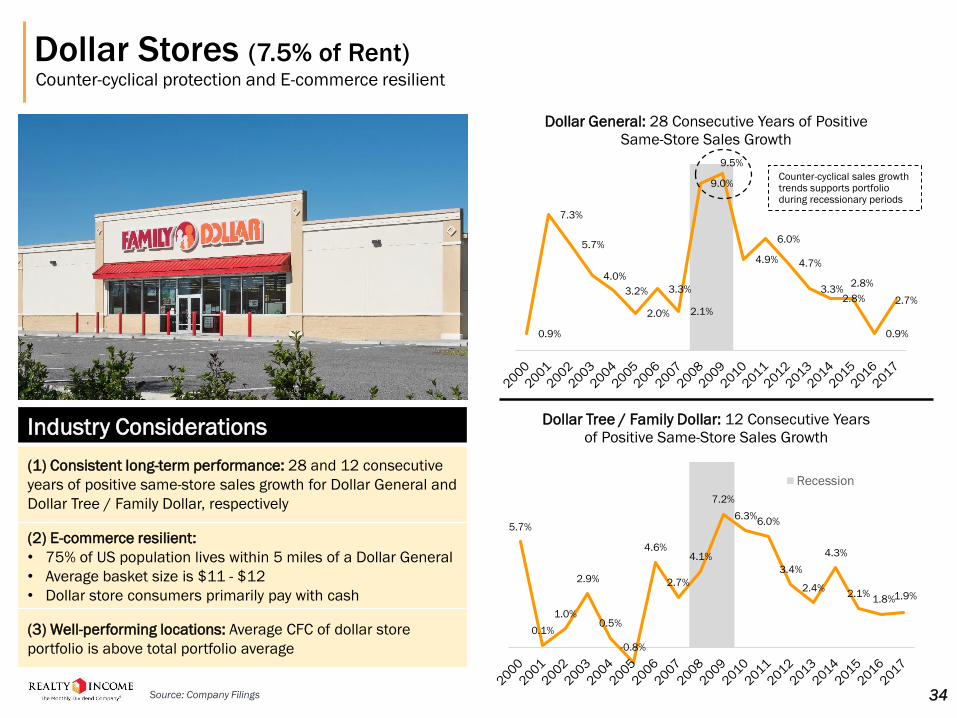
Dollar Stores (7.5% of Rent)Counter-cyclical protection and E-commerce resilient
Industry Considerations
(1) Consistent long-term performance: 28 and 12 consecutive
years of positive same-store sales growth for Dollar General and
Dollar Tree / Family Dollar, respectively
(2) E-commerce resilient:
• 75% of US population lives within 5 miles of a Dollar General
• Average basket size is $11 - $12
• Dollar store consumers primarily pay with cash
(3) Well-performing locations: Average CFC of dollar store
portfolio is above total portfolio average
0.9%
7.3%
5.7%
4.0%
3.2%
2.0%
3.3%
2.1%
9.0%
9.5%
4.9%
6.0%
4.7%
3.3%2.8%
2.8%
0.9%
2.7%
Dollar General: 28 Consecutive Years of Positive
Same-Store Sales Growth
5.7%
0.1%
1.0%
2.9%
0.5%
-0.8%
4.6%
2.7%
4.1%
7.2%
6.3%6.0%
3.4%
2.4%
4.3%
2.1%1.8%1.9%
Dollar Tree / Family Dollar: 12 Consecutive Years
of Positive Same-Store Sales Growth
Recession
Counter-cyclical sales growth trends supports portfolio during recessionary periods
Source: Company Filings 34
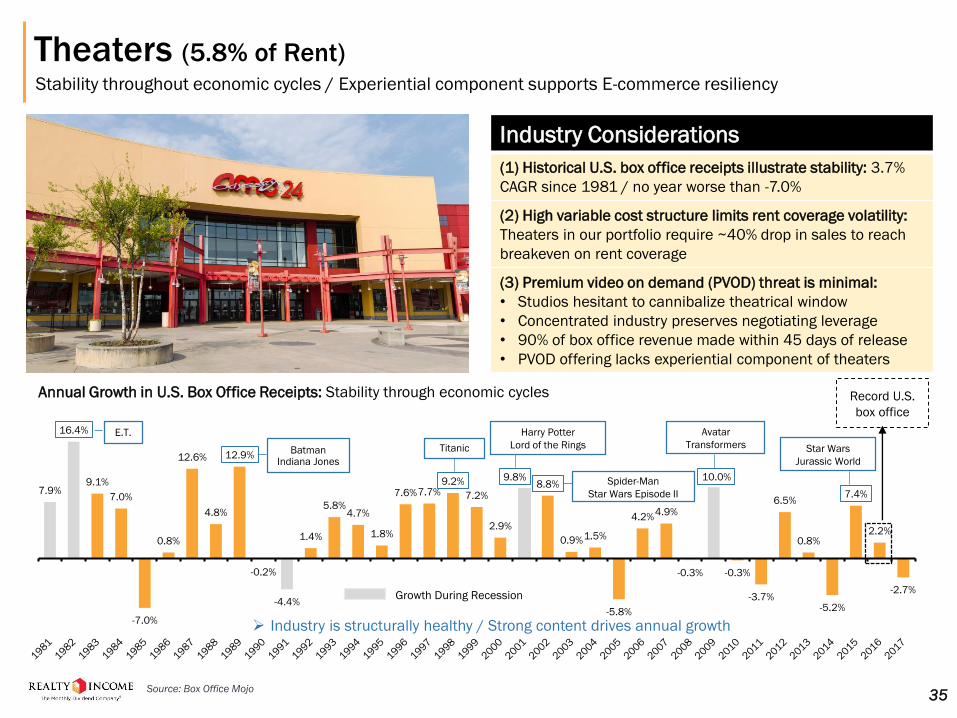
Theaters (5.8% of Rent)Stability throughout economic cycles / Experiential component supports E-commerce resiliency
Industry Considerations
(1) Historical U.S. box office receipts illustrate stability: 3.7%
CAGR since 1981 / no year worse than -7.0%
(2) High variable cost structure limits rent coverage volatility:
Theaters in our portfolio require ~40% drop in sales to reach
breakeven on rent coverage
(3) Premium video on demand (PVOD) threat is minimal:
• Studios hesitant to cannibalize theatrical window
• Concentrated industry preserves negotiating leverage
• 90% of box office revenue made within 45 days of release
• PVOD offering lacks experiential component of theaters
7.9%
16.4%
9.1%
7.0%
-7.0%
0.8%
12.6%
4.8%
12.9%
-0.2%
-4.4%
1.4%
5.8%4.7%
1.8%
7.6%7.7%9.2%
7.2%
2.9%
9.8%8.8%
0.9%1.5%
-5.8%
4.2%4.9%
-0.3%
10.0%
-0.3%
-3.7%
6.5%
0.8%
-5.2%
7.4%
2.2%
-2.7%
Annual Growth in U.S. Box Office Receipts: Stability through economic cycles
Growth During Recession
Record U.S.
box office
Source: Box Office Mojo35
E.T.
BatmanIndiana Jones
Titanic
Harry Potter
Lord of the Rings
Spider-Man
Star Wars Episode II
Avatar
Transformers Star Wars
Jurassic World
➢ Industry is structurally healthy / Strong content drives annual growth
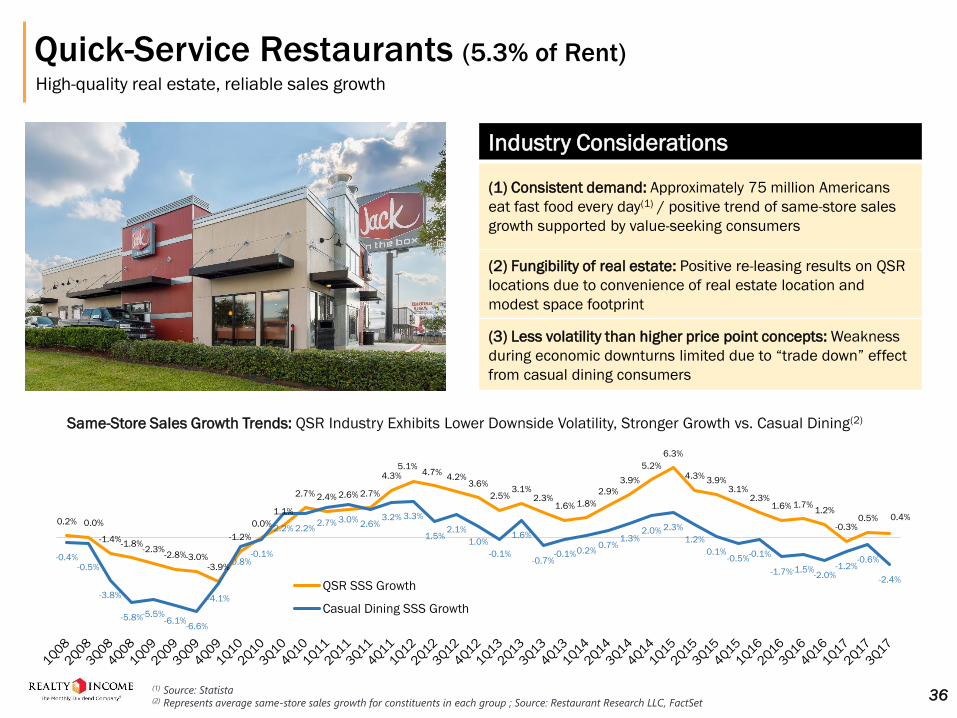
Quick-Service Restaurants (5.3% of Rent)High-quality real estate, reliable sales growth
Industry Considerations
(1) Consistent demand: Approximately 75 million Americans
eat fast food every day(1) / positive trend of same-store sales
growth supported by value-seeking consumers
(2) Fungibility of real estate: Positive re-leasing results on QSR
locations due to convenience of real estate location and
modest space footprint
(3) Less volatility than higher price point concepts: Weakness
during economic downturns limited due to “trade down” effect
from casual dining consumers
0.2% 0.0%
-1.4%-1.8%
-2.3%-2.8%-3.0%
-3.9%
-1.2%
0.0%
1.1%
2.7% 2.4% 2.6% 2.7%
4.3%5.1%
4.7%4.2%
3.6%
2.5%3.1%
2.3%1.6% 1.8%
2.9%
3.9%
5.2%
6.3%
4.3%3.9%
3.1%2.3%
1.6% 1.7%1.2%
-0.3%0.5% 0.4%
-0.4%-0.5%
-3.8%
-5.8%-5.5%-6.1%
-6.6%
-4.1%
-0.8%-0.1%
2.2% 2.2%2.7% 3.0%
2.6%3.2% 3.3%
1.5%2.1%
1.0%
-0.1%
1.6%
-0.7%-0.1%0.2%
0.7%1.3%
2.0% 2.3%
1.2%
0.1%-0.5%
-0.1%
-1.7%-1.5%-2.0%
-1.2%-0.6%
-2.4%QSR SSS Growth
Casual Dining SSS Growth
Same-Store Sales Growth Trends: QSR Industry Exhibits Lower Downside Volatility, Stronger Growth vs. Casual Dining(2)
(1) Source: Statista(2) Represents average same-store sales growth for constituents in each group ; Source: Restaurant Research LLC, FactSet
36
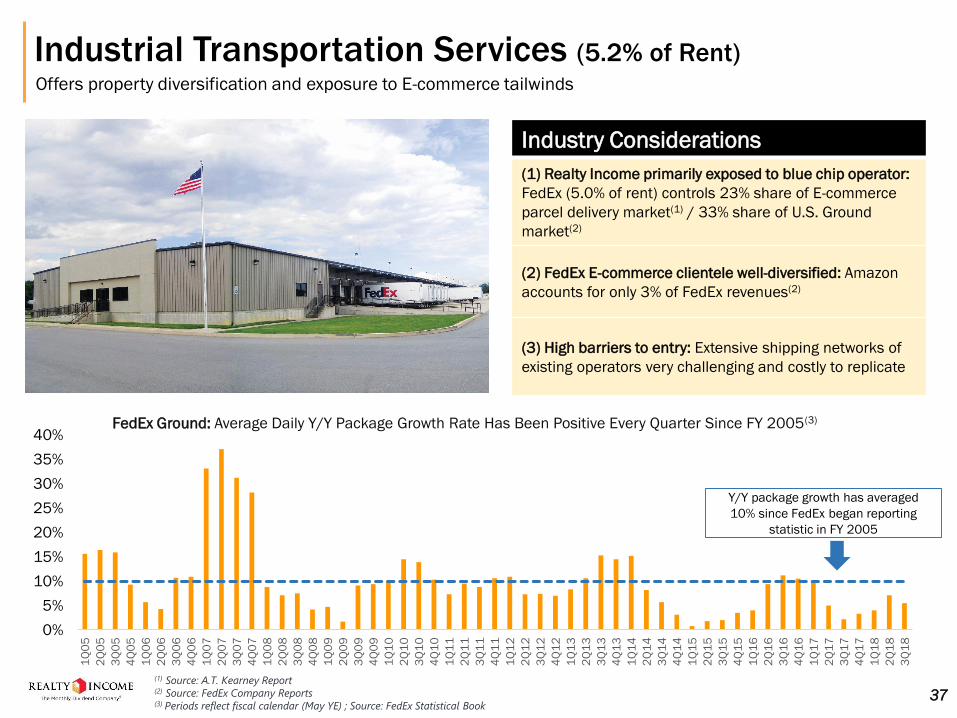
Industrial Transportation Services (5.2% of Rent)Offers property diversification and exposure to E-commerce tailwinds
Industry Considerations
(1) Realty Income primarily exposed to blue chip operator:
FedEx (5.0% of rent) controls 23% share of E-commerce
parcel delivery market(1) / 33% share of U.S. Ground
market(2)
(2) FedEx E-commerce clientele well-diversified: Amazon
accounts for only 3% of FedEx revenues(2)
(3) High barriers to entry: Extensive shipping networks of
existing operators very challenging and costly to replicate
0%
5%
10%
15%
20%
25%
30%
35%
40%
1Q
05
2Q
05
3Q
05
4Q
05
1Q
06
2Q
06
3Q
06
4Q
06
1Q
07
2Q
07
3Q
07
4Q
07
1Q
08
2Q
08
3Q
08
4Q
08
1Q
09
2Q
09
3Q
09
4Q
09
1Q
10
2Q
10
3Q
10
4Q
10
1Q
11
2Q
11
3Q
11
4Q
11
1Q
12
2Q
12
3Q
12
4Q
12
1Q
13
2Q
13
3Q
13
4Q
13
1Q
14
2Q
14
3Q
14
4Q
14
1Q
15
2Q
15
3Q
15
4Q
15
1Q
16
2Q
16
3Q
16
4Q
16
1Q
17
2Q
17
3Q
17
4Q
17
1Q
18
2Q
18
3Q
18
(1) Source: A.T. Kearney Report(2) Source: FedEx Company Reports(3) Periods reflect fiscal calendar (May YE) ; Source: FedEx Statistical Book
FedEx Ground: Average Daily Y/Y Package Growth Rate Has Been Positive Every Quarter Since FY 2005(3)
Y/Y package growth has averaged
10% since FedEx began reporting
statistic in FY 2005
37