Embed Size (px)
Citation preview

1 Genworth MI Canada Inc. Q1 2018 Results
May 1st, 2018
First Quarter 2018 Results

2 Genworth MI Canada Inc. Q1 2018 Results
Forward-looking and non-IFRS statements
DRIVING VALUE THROUGH CUSTOMIZED SERVICE EXPERIENCE
Public communications, including oral or written communications such as this document, relating to Genworth MI Canada Inc. (the “Company”,
“Genworth Canada” or “MIC”) often contain certain forward-looking statements. These forward-looking statements include, but are not limited
to, statements with respect to the impact of guideline changes by OSFI and legislation introduced in connection with the Protection of
Residential Mortgage or Hypothecary Insurance Act (“PRMHIA”); the effect of changes to the mortgage insurance rules, including government
guarantee mortgage eligibility rules and provincial housing initiatives; and the Company’s beliefs as to housing demand and home price
appreciation, key macroeconomic factors, unemployment rates;, as well as the Company’s future operating and financial results, sales
expectations regarding premiums written, capital expenditure plans, dividend policy and the ability to execute on its future operating, investing
and financial strategies, the Canadian housing market, and other statements that are not historical facts. These forward-looking statements
may be identified by their use of words such as “may”, “would”, “could”, “will,” “intend”, “plan”, “anticipate”, “believe”, “seek”, “propose”,
“estimate”, “expect”, and similar expressions. These statements are based on the Company’s current assumptions, including assumptions
regarding economic, global, political, business, competitive, market and regulatory matters. These forward-looking statements are inherently
subject to significant risks, uncertainties and changes in circumstances, many of which are beyond the ability of the Company to control or
predict. The Company’s actual results may differ materially from those expressed or implied by such forward-looking statements, including as
a result of changes in the facts underlying the Company’s assumptions, and the other risks described in the Company’s most recently issued
Annual Information Form, Short Form Base Shelf Prospectus, Management’s Discussion and Analysis and all documents incorporated by
reference in such documents. Management’s current views regarding the Company’s financial outlook are stated as of the date hereof and
may not be appropriate for other purposes. Other than as required by applicable laws, the Company undertakes no obligation to publicly
update or revise any forward-looking statement, whether as a result of new information, future developments or otherwise.
To supplement its financial statements, the Company uses select non-IFRS financial measures. Such non-IFRS financial measures include net
operating income, operating earnings per common share (basic), operating earnings per common share (diluted), operating return on equity,
insurance in-force, new insurance written, loss ratio, expense ratio, combined ratio, investment yield, and Minimum Capital Test (MCT). The
Company believes that these non-IFRS financial measures provide meaningful supplemental information regarding its performance and may
be useful to investors because they allow for greater transparency with respect to key metrics used by management in its financial and
operational decision making. Non-IFRS measures do not have standardized meanings and are unlikely to be comparable to any similar
measures presented by other companies. These measures are defined in the Company’s glossary, which is posted on the Company’s website
at http://investor.genworthmicanada.ca. A reconciliation from non-IFRS financial measures to the most readily comparable measures
calculated in accordance with IFRS, where applicable, can be found in the Company’s most recent Management’s Discussion and Analysis,
which is posted on the Company’s website and is also available at www.sedar.com.

3 Genworth MI Canada Inc. Q1 2018 Results
1Q18 financial results
Operating EPS (diluted) Book Value Per Share ($ diluted, incl. AOCI)
$40.42 $41.34 $42.04 $43.13 $43.77
Q1 2017 Q2 2017 Q3 2017 Q4 2017 Q1 2018
+8%
Y/Y
1. MCT denotes ratio for operating insurance company. Company estimate as at Mar. 31st, 2018.
Note: Amounts may not total due to rounding.
• Total premiums written decreased Y/Y largely due to lower
portfolio insurance premiums; however transactional
premiums written increased by 22% primarily due to an
18% higher avg. premium rate
• Low loss ratio of 13%; reflecting typical winter seasonality
and a stable macroeconomic climate
• Operating income relatively flat Q/Q, primarily due to
higher losses on claims
• Ongoing capital strength with MCT ratio of 170%1
• Executed $50MM share buyback during the quarter
1.17
1.36
1.23
1.33 1.31
Q1 2017 Q2 2017 Q3 2017 Q4 2017 Q1 2018
$MM except ROE,
EPS & MCT
Q1
2018
Q4
2017
Q1
2017 Q / Q Y / Y
Premiums written $115 $164 $127 -30% -9%
Premiums earned $171 $171 $167 Flat +2%
Loss ratio 13% 9% 15% +4 pts -3 pts
Net income $128 $132 $106 -3% +20%
Net operating income $119 $121 $107 -2% +11%
Operating ROE 12% 13% 12% -0.4 pt Flat
Operating EPS (dil.) $1.31 $1.33 $1.17 -2% +12%
MCT ratio1 170% 172% 162% -2 pts +8 pts
Q1 key highlights

4 Genworth MI Canada Inc. Q1 2018 Results
Our environment today
Risk Assessment
Economic
Housing &
mortgage
markets
Insurance
portfolio
Regulatory
Key observations
Sound economic environment; GDP forecast growth of 2.0%1 in 2018 and
2.1%1 in 2019
Unemployment rate at record low; rising wages in most provinces
Modest increase in interest rates expected in 2H’18
Monitoring NAFTA renegotiations
Mortgage rate stress test on conventional mortgages reducing housing
demand, especially in higher priced markets
Ontario market trending towards more normalized state
B.C. market demand expected to soften in response to provincial policy
changes
Portfolio quality remains strong. Average credit score for transactional new
insurance written was 746 in Q1’18
Regulatory environment supporting reduced product risk and strong
underwriting practices
Recent regulatory focus on uninsured mortgage space with mortgage rate
stress test
Expected refinements to OSFI capital rules effective in 2019
Increased provincial focus with ON & B.C. housing policy initiatives
SOUND MACROECONOMIC ENVIRONMENT
1. BoC GDP forecast, Monetary Policy Report, April 2018.
5 Genworth MI Canada Inc. Q1 2018 Results
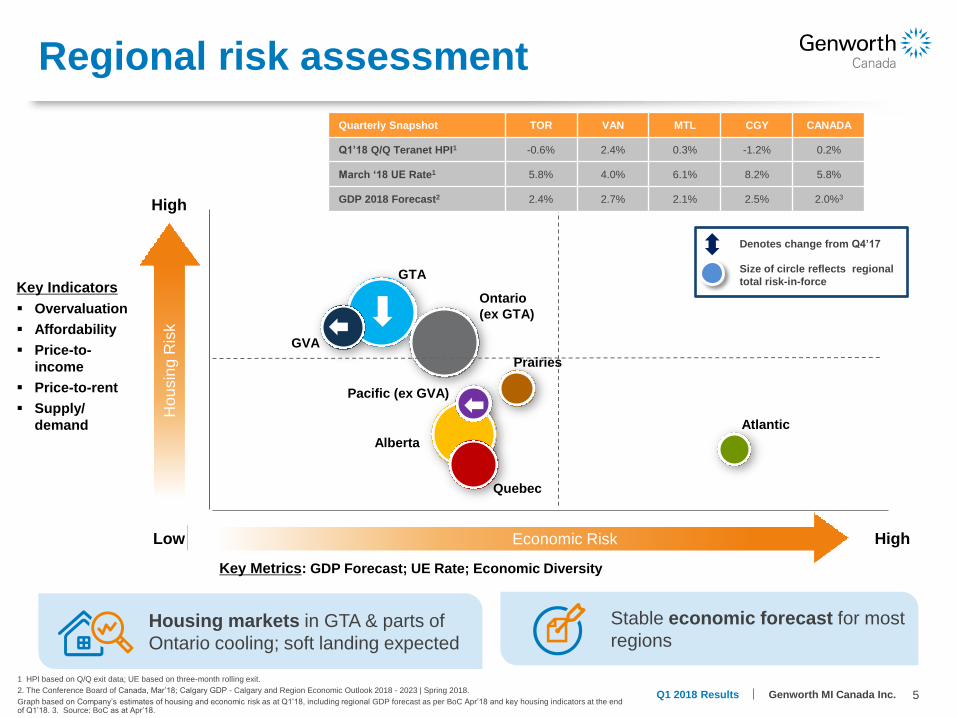
Regional risk assessment
Stable economic forecast for most
regions Housing markets in GTA & parts of
Ontario cooling; soft landing expected
Ho
us
ing
ris
k
Economic risk
Key Indicators
Overvaluation
Affordability
Price-to-
income
Price-to-rent
Supply/
demand
Key Metrics: GDP Forecast; UE Rate; Economic Diversity
Denotes change from Q4’17
Quarterly Snapshot TOR VAN MTL CGY CANADA
Q1’18 Q/Q Teranet HPI1 -0.6% 2.4% 0.3% -1.2% 0.2%
March ‘18 UE Rate1 5.8% 4.0% 6.1% 8.2% 5.8%
GDP 2018 Forecast2 2.4% 2.7% 2.1% 2.5% 2.0%3
Low High
High
GTA
GVA
Quebec
Alberta
Atlantic
Ontario
(ex GTA)
Prairies
Pacific (ex GVA)
Hou
sin
g R
isk
Economic Risk
Size of circle reflects regional
total risk-in-force
1 HPI based on Q/Q exit data; UE based on three-month rolling exit.
2. The Conference Board of Canada, Mar’18; Calgary GDP - Calgary and Region Economic Outlook 2018 - 2023 | Spring 2018.
Graph based on Company’s estimates of housing and economic risk as at Q1’18, including regional GDP forecast as per BoC Apr’18 and key housing indicators at the end of Q1’18. 3. Source: BoC as at Apr’18.

6 Genworth MI Canada Inc. Q1 2018 Results
$1.1 $0.8 $0.9
2017 2018
$3.0 $3.2
$5.0
$5.6
$4.5
2017 2018
$38
$6
$8 $6 $7
2017 2018
Top line
New insurance written ($ billions) Premiums written ($ millions)
Note: Company sources. Note: Amounts may not total due to rounding.
Q1
Q2
Q3
Q4
Transactional insurance highlights
• NIW increased modestly Y/Y, but decreased Q/Q primarily
due to typical seasonality
• Premiums written increased Y/Y by 22% primarily due to
the 18% higher average premium rate, from the March 17,
2017 premium rate increase; premiums written decreased
Q/Q primarily due to typical seasonality
Transactional Portfolio
$89 $109
$161
$195
$157
2017 2018
Q1
Q2
Q3
Q4
Transactional Portfolio
Average premium rate (YTD)
3.31% 3.46%
$13.4 $603
$60
Average premium rate (YTD)
0.45% 0.53%
Portfolio insurance highlights
• NIW decreased significantly Y/Y, compared to 1Q18 which
saw the closing of several large transactions on applications
received in 4Q16, ahead of regulatory capital changes
• Lower use of portfolio insurance by lenders continues in
response to significant premium rate increase following the
introduction of the new capital framework in 2017
$18.2
$1.1
$10.5

7 Genworth MI Canada Inc. Q1 2018 Results
Strong portfolio quality
1.0%
0.4%
'10
'11
'12
'13
'14
'15
Q1'1
6
Q2'1
6
Q3'1
6
Q4'1
6
Q1'1
7
Q2'1
7
Q3'1
7
Q4'1
7
Q1'1
8
$2
84
$2
96
$3
01
$3
04
$3
15
$3
22
$3
27
$3
15
$3
30
$3
26
$3
28
$3
17
$3
32
$3
32
$3
42
'10
'11
'12
'13
'14
'15
Q1'1
6
Q2'1
6
Q3'1
6
Q4'1
6
Q1'1
7
Q2'1
7
Q3'1
7
Q4'1
7
Q1'1
8
CONTINUED PORTFOLIO QUALITY STRENGTH
1 Company sources for transactional new insurance written. Average score for all borrowers. 2 Company sources for transactional new insurance written. Purchase only. 3 Stacked risk factors: Purchase only; 90%+ LTV and <= 660 credit score, and >40 TDSR. 4 FTHB represents First Time Homebuyers.
Highlights
Credit score1 Stacked risk factors3
Credit quality remains
very strong
Relatively stable average
home prices in most
regions for FTHBs4 given
modest growth in
household income
Limited exposure to
loans with stacked risk
factors (low credit
scores and high debt
service ratios)
Average home price2 (In ‘$000s)
10%
2.6%
727
746
'10
'11
'12
'13
'14
'15
Q1'1
6
Q2'1
6
Q3'1
6
Q4'1
6
Q1'1
7
Q2'1
7
Q3'1
7
Q4'1
7
Q1'1
8
% Score <660 Avg score

8 Genworth MI Canada Inc. Q1 2018 Results
Q1 highlights
• Transactional premiums written higher by
22% Y/Y, primarily due to higher average
premium rate
• Premiums earned increased Y/Y by 2%,
reflecting the level of premiums written in
recent years
• Loss ratio of 13%, up 4 pts Q/Q primarily
due to a modest seasonal increase in new
delinquencies, net of cures and lower
favourable development
• Operating investment income relatively
unchanged Q/Q
• Net operating income down $2 million Q/Q
primarily due to higher losses on claims,
partly offset by lower expenses
• Book value per share up 8% Y/Y to $43.77
Company sources. Note: Amounts may not total due to rounding. 1. Includes the realized income from the interest rate hedging program, excl. realized gains / losses.
$MM except EPS & BVPS Q1’18 Q4’17 Q1’17
Transactional premiums written $109 $157 $89
Portfolio premiums written 6 7 38
Total premiums written $115 $164 $127
Premiums earned 171 171 167
Losses on claims (22) (15) (26)
Expenses (32) (34) (34)
Underwriting income $117 $121 $107
Operating investment income1 50 50 44
Net operating income $119 $121 $107
Net income $128 $132 $106
Operating EPS (diluted)
$1.31 $1.33 $1.17
Book value per share (diluted, incl. AOCI)
$43.77 $43.13 $40.42
Strong financial performance

9 Genworth MI Canada Inc. Q1 2018 Results
Delinquency trends
New delinquencies, net of cures, by region Delinquencies outstanding
349 254 263 276 283
151 149 130 122 102
594 551 520 496 492
517 446 427 374 370
259
204 214 226 230
212
205 205 224 246
Q1'17 Q2'17 Q3'17 Q4'17 Q1'18
Ontario
Pacific2
Alberta
Quebec
Atlantic Prairies1
Total
Delinquency rate based on reported outstanding balances3
Q1’17 Q2’17 Q3’17 Q4’17 Q1’18
Transactional 0.34% 0.29% 0.29% 0.28% 0.28%
Portfolio 0.08% 0.07% 0.07% 0.08% 0.08%
Total 0.21% 0.18% 0.18% 0.18% 0.18%
56 -33
43 47 43
34
141
92 107 112 112
109
32
100 51 80
101
26
70 80
78
50
28
25 53 58
Q1'17 Q2'17 Q3'17 Q4'17 Q1'18
Ontario
Pacific2
Alberta
Quebec
Atlantic
Prairies1
Total
Loss ratio 15% 3% 13% 9% 13%
Q/Q
∆
+5
-2
+29
-
-9 -4
• Slightly higher net new delinquencies Q/Q
reflecting an increase in Quebec, partly
offset by decreases in most other regions
• Strong overall loss ratio performance
reflects favourable macroeconomic
environment and high quality portfolio
• Loss ratio range for 2018: 15% - 25%
Company sources. 1 Prairies include MB and SK. 2 Pacific includes B.C. and the Territories. 3 Delinquency rates are based on the Company’s reported outstanding insured
mortgage balances as at the end of the quarter and exclude delinquencies that have been incurred but not reported.
2,082
1,809 1,759 1,718 1,723
491
155
337 346 365
10 Genworth MI Canada Inc. Q1 2018 Results
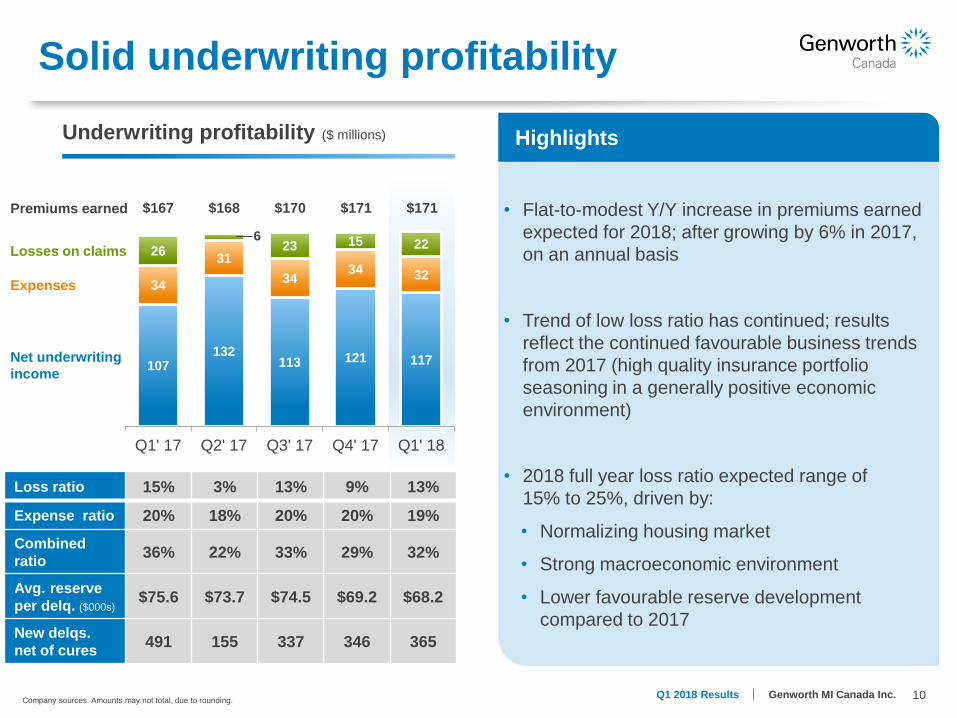
Solid underwriting profitability
107 132
113 121 117
34
31
34 34 32
26 6
23 15 22
Q1' 17 Q2' 17 Q3' 17 Q4' 17 Q1' 18
Underwriting profitability ($ millions)
Net underwriting
income
Expenses
Losses on claims
Loss ratio 15% 3% 13% 9% 13%
Expense ratio 20% 18% 20% 20% 19%
Combined
ratio 36% 22% 33% 29% 32%
Avg. reserve
per delq. ($000s) $75.6 $73.7 $74.5 $69.2 $68.2
New delqs.
net of cures 491 155 337 346 365
Premiums earned $171 $167 $168 $170 $171
Highlights
• Flat-to-modest Y/Y increase in premiums earned
expected for 2018; after growing by 6% in 2017,
on an annual basis
• Trend of low loss ratio has continued; results
reflect the continued favourable business trends
from 2017 (high quality insurance portfolio
seasoning in a generally positive economic
environment)
• 2018 full year loss ratio expected range of
15% to 25%, driven by:
• Normalizing housing market
• Strong macroeconomic environment
• Lower favourable reserve development
compared to 2017
Company sources. Amounts may not total, due to rounding.
11 Genworth MI Canada Inc. Q1 2018 Results
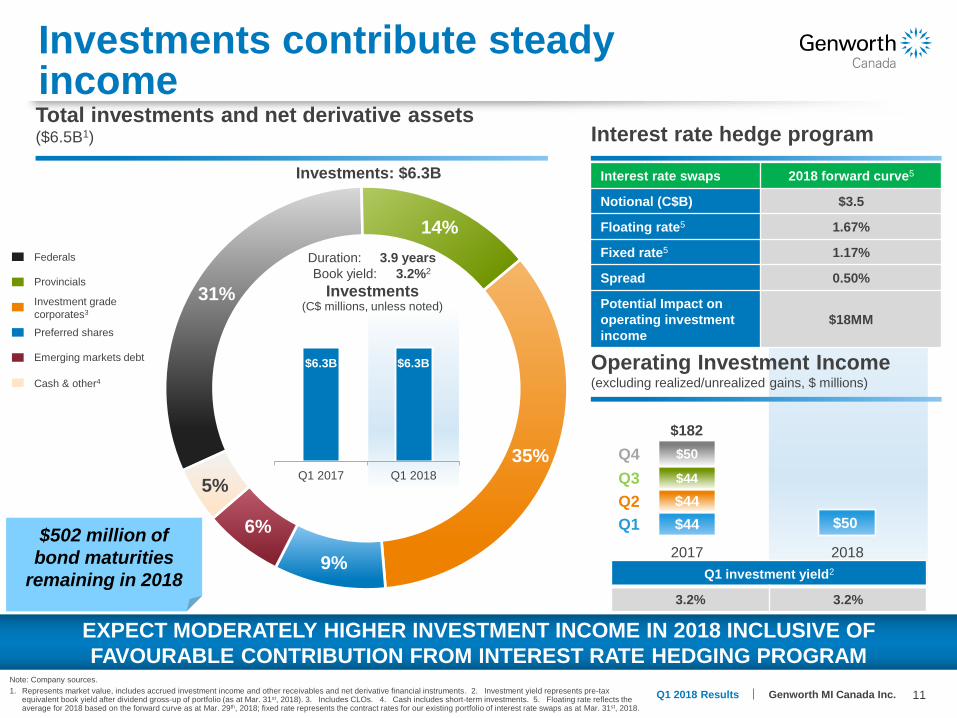
Investments contribute steady income
Note: Company sources.
1. Represents market value, includes accrued investment income and other receivables and net derivative financial instruments. 2. Investment yield represents pre-tax equivalent book yield after dividend gross-up of portfolio (as at Mar. 31st, 2018). 3. Includes CLOs. 4. Cash includes short-term investments. 5. Floating rate reflects the average for 2018 based on the forward curve as at Mar. 29th, 2018; fixed rate represents the contract rates for our existing portfolio of interest rate swaps as at Mar. 31st, 2018.
EXPECT MODERATELY HIGHER INVESTMENT INCOME IN 2018 INCLUSIVE OF
FAVOURABLE CONTRIBUTION FROM INTEREST RATE HEDGING PROGRAM
31%
14%
35%
9%
6%
5%
$44 $50
$44
$44
$50
2017 2018
Federals
Provincials
Preferred shares
Emerging markets debt
Investment grade
corporates3
Cash & other4
Duration: 3.9 years
Book yield: 3.2%2
Investments (C$ millions, unless noted)
Total investments and net derivative assets ($6.5B1) Interest rate hedge program
$502 million of
bond maturities
remaining in 2018 Q1 investment yield2
3.2% 3.2%
$182
Q1 2017 Q1 2018
Operating Investment Income (excluding realized/unrealized gains, $ millions)
Interest rate swaps 2018 forward curve5
Notional (C$B) $3.5
Floating rate5 1.67%
Fixed rate5 1.17%
Spread 0.50%
Potential Impact on
operating investment
income
$18MM
$6.3B $6.3B
Investments: $6.3B
Q1
Q2
Q3
Q4

12 Genworth MI Canada Inc. Q1 2018 Results
Capital management
~3.0
0.2 0.2 0.5 0.5
~0.5 ~0.5
Dec. 31, 2017 MCT Mar. 31, 2018 MCT estimate
Note: Company sources. MCT denotes ratio for operating insurance company. *Totals may not add due to rounding. 1. Market risk includes interest rate, credit, equity risk, and foreign exchange risk.
2. Represents liquid investments and cash held in addition to capital in operating insurance company.
Highlights
Strong capital position with MCT ratio of
~170%
Holding company cash and liquid
investments of $126 million
Continued focus on balancing capital
strength and efficiency
• Executed $50MM share buyback
Transitional capital relief for legacy
portfolio insurance and extended
amortization business expected to run
off in 2019
OSFI working on refinements to capital
framework for implementation in 2019
MCT ratio in 2018 expected to remain
above targeted operating range of
160% to 165%
MCT ratio 172% 170%
Internal MCT
target 157% 157%
Holdco cash2 ~$155 million ~$126 million
Regulatory capital as at Mar. 31st, 2018 (by category, $ billions unless otherwise noted)*
Insurance Risk
Market Risk1
Operational Risk
Capital in excess of 150%
~4.3
~3.1
~4.2

13 Genworth MI Canada Inc. Q1 2018 Results
Strategic priorities for 2018
BUILDING ON SOLID BUSINESS FUNDAMENTALS
1
Invest in
process
innovation and
technology to
drive improved
customer
experience
4
Maintain an
efficient capital
structure to
ensure capital
strength while
maximizing
ROE
3
Leverage our
data and
mortgage
expertise to
influence our
regulatory
environment
2
Continue to
exercise prudent
risk
management
and proactive
loss mitigation

14 Genworth MI Canada Inc. Q1 2018 Results
[email protected] investor.genworthmicanada.ca
Investor Relations
Jonathan A. Pinto, MBA, LL.M
Vice President, Investor Relations
[email protected] 905.287.5482