Embed Size (px)
Citation preview
1
FIRST QUARTER 2017 Report to Shareholders for the period ended March 31, 2017 MEG Energy Corp. reported first quarter 2017 operating and financial results on May 11, 2017. Highlights include:
• Quarterly production volumes of 77,245 barrels per day (bpd);
• Net operating costs of $8.43 per barrel and non-energy operating costs of $5.20 per barrel;
• Total cash capital investment of $78 million, primarily directed towards the eMSAGP growth initiative at Christina Lake Phase 2B;
• Cash and cash equivalents of $549 million as of March 31, 2017; and
• The completion of a comprehensive refinancing which has contributed to a strengthened financial profile, with its equity component primarily funding MEG’s 20,000 bpd growth plans at Christina Lake.
MEG’s first quarter 2017 production was 77,245 bpd, compared to 76,640 bpd for the first quarter of 2016. Production for the first quarter met the forecast provided by the company in its 2016 year end disclosure, and was partially impacted by preparatory work to facilitate the drilling of infill wells and pipeline maintenance at the Christina Lake project. MEG increased production over first quarter 2016 levels primarily due to the continued implementation of eMSAGP, which has improved reservoir efficiency and allowed for redeployment of steam, enabling the company to place additional wells into production. MEG is on track to meet its annual production guidance of 80,000 bpd to 82,000 bpd and targets exit production for 2017 of 86,000 bpd to 89,000 bpd.
“By initiating the expansion of eMSAGP to our Phase 2B assets which represent 75% of our production, we are embarking on a step change for MEG’s business,” said Bill McCaffrey, President and Chief Executive Officer. “We are very excited that our drilling program is proceeding on time and on budget and when we see production ramp up beginning in the third quarter, the benefits of this technology will become evident. Where we have already implemented it, the eMSAGP process has enabled us to increase production, reduce costs and cut the steam-oil ratio by about 50% to an industry-leading range of 1.0 to 1.25.”
MEG anticipates that the company’s next project, known as the Phase 2B brownfield expansion, will proceed in 2018, with actual timing to be determined as the company formulates its 2018 capital budget later this year. This expansion will add a further 13,000 barrels per day and can be done concurrently with the implementation of eMSAGP. The company expects the eMSAGP and brownfield expansions to bring production to approximately 113,000 barrels per day and reduce corporate cash costs by $6 to $7 per barrel.
For the first quarter of 2017, non-energy operating costs averaged $5.20 per barrel compared to $6.45 per barrel for the same period in 2016, mainly due to efficiency gains and a continued focus on cost management. Energy operating costs averaged $4.18 per barrel for the first quarter of 2017 compared to $2.90 per barrel for the first quarter of 2016, primarily due to increased natural gas prices.
MEG realized adjusted funds flow of $43 million for the first quarter of 2017 compared to negative adjusted funds flow of $131 million for the same period in 2016. The increase in adjusted funds flow is directly correlated to increased bitumen realization as a result of an increase in average U.S. crude oil benchmark pricing. Adjusted funds flow was also impacted by MEG’s bitumen production exceeding sales volumes as the company focused on

2
maximizing future revenues, as well as a transitional one-time $9 million interest expense associated with MEG’s debt restructuring incurred to take advantage of a lower early redemption premium on MEG’s 2021 notes.
The company recorded a first quarter 2017 operating loss of $79 million compared to an operating loss of $197 million for the same period in 2016. The decrease in operating loss reflects the same factors impacting adjusted funds flow.
Capital Investment and Financial Liquidity
Total cash capital investment during the first quarter of 2017 was $78 million, compared to $35 million for the same period in 2016. Capital investment in 2017 was primarily directed towards the company’s eMSAGP production growth initiative at Christina Lake Phase 2B. In the first quarter, the company drilled 14 out of a total of 39 infill wells planned for 2017, with as many as 28 additional SAGD well pairs planned for the remainder of the year. MEG expects to fund the remaining 2017 capital program with a combination of internally generated funds flow and $549 million of cash on hand as of March 31, 2017.
MEG has entered into a series of hedges designed to protect its capital program against downward movements in crude oil prices. MEG’s five-year covenant-lite US$1.4 billion credit facility remains undrawn.
Forward-Looking Information and Non-GAAP Financial Measures
This quarterly report contains forward-looking information and financial measures that are not defined by International Financial Reporting Standards ("IFRS") and should be read in conjunction with the "Forward-Looking Information" and "Non-GAAP Financial Measures" contained within the Advisory section of this quarter's Management's Discussion and Analysis.

3
Management's Discussion and Analysis
This Management's Discussion and Analysis ("MD&A") of the financial condition and performance of MEG Energy Corp. ("MEG" or the "Corporation") for the three-month period ended March 31, 2017 was approved by the Corporation’s Audit Committee on May 10, 2017. This MD&A should be read in conjunction with the Corporation's unaudited interim consolidated financial statements and notes thereto for the three-month period ended March 31, 2017, the audited consolidated financial statements and notes thereto for the year ended December 31, 2016, the 2016 annual MD&A and the Corporation’s most recently filed Annual Information Form (“AIF”). This MD&A and the unaudited interim consolidated financial statements and comparative information have been prepared in accordance with International Financial Reporting Standards (“IFRS”) as issued by the International Accounting Standards Board (“IASB”) and are presented in thousands of Canadian dollars, except where otherwise indicated.
MD&A – Table of Contents
1. OVERVIEW............................................................................................................................................................. 4
2. OPERATIONAL AND FINANCIAL HIGHLIGHTS ........................................................................................................ 5
3. RESULTS OF OPERATIONS ..................................................................................................................................... 7
4. OUTLOOK ............................................................................................................................................................ 12
5. BUSINESS ENVIRONMENT ................................................................................................................................... 13
6. OTHER OPERATING RESULTS .............................................................................................................................. 14
7. NET CAPITAL INVESTMENT ................................................................................................................................. 19
8. LIQUIDITY AND CAPITAL RESOURCES .................................................................................................................. 20
9. SHARES OUTSTANDING ....................................................................................................................................... 23
10. CONTRACTUAL OBLIGATIONS AND COMMITMENTS .......................................................................................... 24
11. NON-GAAP MEASURES ....................................................................................................................................... 24
12. CRITICAL ACCOUNTING POLICIES AND ESTIMATES ............................................................................................ 26
13. TRANSACTIONS WITH RELATED PARTIES ............................................................................................................ 26
14. OFF-BALANCE SHEET ARRANGEMENTS .............................................................................................................. 26
15. NEW ACCOUNTING STANDARDS ........................................................................................................................ 27
16. RISK FACTORS...................................................................................................................................................... 28
17. DISCLOSURE CONTROLS AND PROCEDURES ....................................................................................................... 28
18. INTERNAL CONTROLS OVER FINANCIAL REPORTING .......................................................................................... 28
19. ABBREVIATIONS .................................................................................................................................................. 29
20. ADVISORY ............................................................................................................................................................ 29
21. ADDITIONAL INFORMATION ............................................................................................................................... 30
22. QUARTERLY SUMMARIES .................................................................................................................................... 31
4
1. OVERVIEW
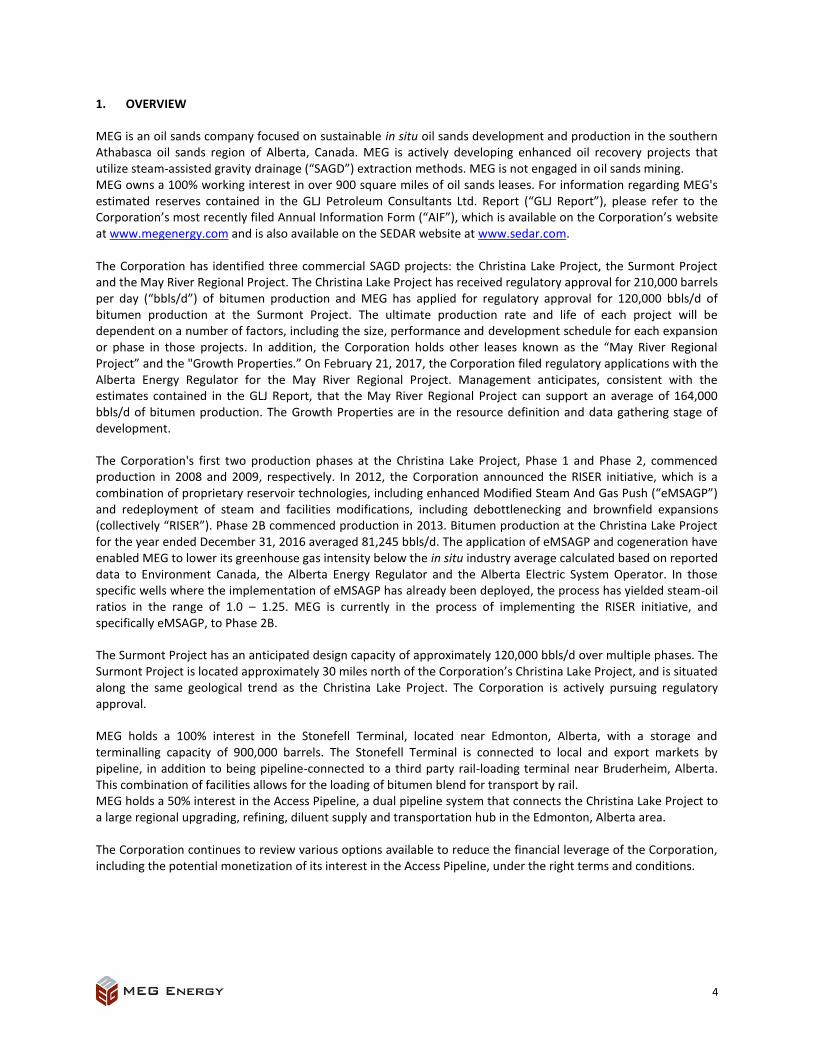
MEG is an oil sands company focused on sustainable in situ oil sands development and production in the southern Athabasca oil sands region of Alberta, Canada. MEG is actively developing enhanced oil recovery projects that utilize steam-assisted gravity drainage (“SAGD”) extraction methods. MEG is not engaged in oil sands mining. MEG owns a 100% working interest in over 900 square miles of oil sands leases. For information regarding MEG's estimated reserves contained in the GLJ Petroleum Consultants Ltd. Report (“GLJ Report”), please refer to the Corporation’s most recently filed Annual Information Form (“AIF”), which is available on the Corporation’s website at www.megenergy.com and is also available on the SEDAR website at www.sedar.com. The Corporation has identified three commercial SAGD projects: the Christina Lake Project, the Surmont Project and the May River Regional Project. The Christina Lake Project has received regulatory approval for 210,000 barrels per day (“bbls/d”) of bitumen production and MEG has applied for regulatory approval for 120,000 bbls/d of bitumen production at the Surmont Project. The ultimate production rate and life of each project will be dependent on a number of factors, including the size, performance and development schedule for each expansion or phase in those projects. In addition, the Corporation holds other leases known as the “May River Regional Project” and the "Growth Properties.” On February 21, 2017, the Corporation filed regulatory applications with the Alberta Energy Regulator for the May River Regional Project. Management anticipates, consistent with the estimates contained in the GLJ Report, that the May River Regional Project can support an average of 164,000 bbls/d of bitumen production. The Growth Properties are in the resource definition and data gathering stage of development.
The Corporation's first two production phases at the Christina Lake Project, Phase 1 and Phase 2, commenced production in 2008 and 2009, respectively. In 2012, the Corporation announced the RISER initiative, which is a combination of proprietary reservoir technologies, including enhanced Modified Steam And Gas Push (“eMSAGP”) and redeployment of steam and facilities modifications, including debottlenecking and brownfield expansions (collectively “RISER”). Phase 2B commenced production in 2013. Bitumen production at the Christina Lake Project for the year ended December 31, 2016 averaged 81,245 bbls/d. The application of eMSAGP and cogeneration have enabled MEG to lower its greenhouse gas intensity below the in situ industry average calculated based on reported data to Environment Canada, the Alberta Energy Regulator and the Alberta Electric System Operator. In those specific wells where the implementation of eMSAGP has already been deployed, the process has yielded steam-oil ratios in the range of 1.0 – 1.25. MEG is currently in the process of implementing the RISER initiative, and specifically eMSAGP, to Phase 2B.
The Surmont Project has an anticipated design capacity of approximately 120,000 bbls/d over multiple phases. The Surmont Project is located approximately 30 miles north of the Corporation’s Christina Lake Project, and is situated along the same geological trend as the Christina Lake Project. The Corporation is actively pursuing regulatory approval.
MEG holds a 100% interest in the Stonefell Terminal, located near Edmonton, Alberta, with a storage and terminalling capacity of 900,000 barrels. The Stonefell Terminal is connected to local and export markets by pipeline, in addition to being pipeline-connected to a third party rail-loading terminal near Bruderheim, Alberta. This combination of facilities allows for the loading of bitumen blend for transport by rail. MEG holds a 50% interest in the Access Pipeline, a dual pipeline system that connects the Christina Lake Project to a large regional upgrading, refining, diluent supply and transportation hub in the Edmonton, Alberta area. The Corporation continues to review various options available to reduce the financial leverage of the Corporation, including the potential monetization of its interest in the Access Pipeline, under the right terms and conditions.

5
2. OPERATIONAL AND FINANCIAL HIGHLIGHTS
During the first three months of 2017, the ongoing global imbalance between supply and demand for crude oil and the volatility of global crude oil prices continued to significantly impact the Corporation’s operating and financial results. The C$/bbl WTI average price for the three months ended March 31, 2017 increased 49% compared to the three months ended March 31, 2016.
On January 27, 2017, the Corporation closed a comprehensive refinancing plan as follows:
Issued 66.8 million common shares, at a price of $7.75 per common share, for gross proceeds of $517.8 million, before underwriting fees and expenses;
Extended the maturity date under the Corporation’s undrawn covenant-lite revolving credit facility from November 2019 to November 2021, and reduced the facility from US$2.5 billion to US$1.4 billion;
Refinanced the Corporation’s outstanding US$1.2 billion term loan and extended its maturity date from March 2020 to December 2023; and
Refinanced the Corporation’s US$750 million aggregate principal amount of 6.5% Senior Unsecured Notes, with a maturity date of March 2021, and replaced these with new 6.5% Senior Secured Second Lien Notes, maturing January 2025. The 2021 Notes were redeemed with the proceeds from the Senior Secured Second Lien Notes on March 15, 2017.
In addition, on February 15, 2017, the Corporation extended the maturity date on the Corporation’s five-year letter of credit facility, guaranteed by Export Development Canada (“EDC”), from November 2019 to November 2021. The guaranteed letter of credit facility has been reduced from US$500 million to US$440 million.
At March 31, 2017, the Corporation had cash and cash equivalents of $549.0 million and US$1.4 billion of undrawn capacity under the revolving credit facility. The first maturity of any of the Corporation’s outstanding long-term debt obligations is in 2023. See “LIQUIDITY AND CAPITAL RESOURCES” section of this MD&A for further details.

6
The following table summarizes selected operational and financial information of the Corporation for the periods noted. All dollar amounts are stated in Canadian dollars ($ or C$) unless otherwise noted:
2017 2016 2015
($ millions, except as indicated) Q1 Q4 Q3 Q2 Q1 Q4 Q3 Q2
Bitumen production - bbls/d 77,245 81,780 83,404 83,127 76,640 83,514 82,768 71,376 Bitumen realization - $/bbl 37.93 36.17 30.98 30.93 11.43 23.17 31.03 44.54 Net operating costs - $/bbl(1) 8.43 8.24 7.76 7.43 8.53 8.52 9.10 9.43 Non-energy operating costs - $/bbl 5.20 4.99 5.32 5.81 6.45 5.66 5.98 7.01 Cash operating netback - $/bbl(2) 22.33 21.73 16.74 16.09 (3.71) 9.05 16.41 29.64 Adjusted funds flow(3) 43 40 23 7 (131) (44) 24 99 Per share, diluted(3) 0.16 0.18 0.10 0.03 (0.58) (0.20) 0.11 0.44
Operating earnings (loss)(3) (79) (72) (88) (98) (197) (140) (87) (23) Per share, diluted(3) (0.29) (0.32) (0.39) (0.43) (0.88) (0.62) (0.39) (0.10)
Revenue(4) 560 566 497 513 290 445 460 555 Net earnings (loss)(5) 2 (305) (109) (146) 131 (297) (428) 63
Per share, basic 0.01 (1.34) (0.48) (0.65) 0.58 (1.32) (1.90) 0.28 Per share, diluted 0.01 (1.34) (0.48) (0.65) 0.58 (1.32) (1.90) 0.28
Total cash capital investment(6) 78 63 19 20 35 54 32 90 Cash and cash equivalents 549 156 103 153 125 408 351 438 Long-term debt(7) 4,945 5,053 4,910 4,871 4,859 5,190 5,024 4,678
(1) Net operating costs include energy and non-energy operating costs, reduced by power revenue. (2) Cash operating netback is calculated by deducting the related diluent expense, transportation, operating expenses, royalties
and realized commodity risk management gains (losses) from proprietary blend revenues and power revenues, on a per barrel of bitumen sales volume basis.
(3) Adjusted funds flow, Operating earnings (loss) and the related per share amounts do not have standardized meanings prescribed by IFRS and therefore may not be comparable to similar measures used by other companies. For the three months ended March 31, 2017 and March 31, 2016, the non-GAAP measure of adjusted funds flow is reconciled to net cash provided by (used in) operating activities and the non-GAAP measure of operating earnings (loss) is reconciled to net earnings (loss) in accordance with IFRS under the heading “NON-GAAP MEASURES” and discussed further in the “ADVISORY” section.
(4) The total of Petroleum revenue, net of royalties and Other revenue as presented on the Interim Consolidated Statement of Earnings and Comprehensive Income.
(5) Includes a net unrealized foreign exchange gain of $36.7 million on the Corporation’s U.S. dollar denominated debt and U.S. dollar denominated cash and cash equivalents for the three months ended March 31, 2017. The net earnings for the three months ended March 31, 2016 includes a net unrealized foreign exchange gain of $320.3 million.
(6) Defined as total capital investment excluding dispositions, capitalized interest, capitalized cash-settled stock-based compensation and non-cash items.
(7) On December 8, 2016, Fitch Ratings (“Fitch”) assigned the Corporation a first-time Long-Term Issuer Default Rating of B, and assigned a rating of BB to the Corporation’s covenant-lite revolving credit facility and term loan and a rating of B to the Corporation’s Senior Unsecured Notes. On January 12, 2017, Fitch assigned a BB rating to the Corporation’s new Senior Secured Second Lien Notes (see the “Capital Resources” section of this MD&A). Fitch’s rating outlook is negative. On January 12, 2017, Standard & Poor's Ratings Services (“S&P”) assigned a BB+ rating to the Corporation’s new Senior Secured Second Lien Notes. On January 12, 2017, Moody’s Investors Service (“Moody’s”) upgraded the Corporation’s Corporate Family Rating to B3 from Caa2, the Probability of Default Rating to B3-PD from Caa2-PD and the Corporation’s Senior Unsecured Notes rating to Caa2 from Caa3. Moody’s Speculative Grade Liquidity Rating was raised to SGL-1 from SGL-2. Moody’s also assigned a rating of Ba3 to the Corporation’s covenant-lite revolving credit facility and refinanced term loan and a rating of Caa1 to the new Senior Secured Second Lien Notes. Moody’s rating outlook was changed to stable from negative.
7
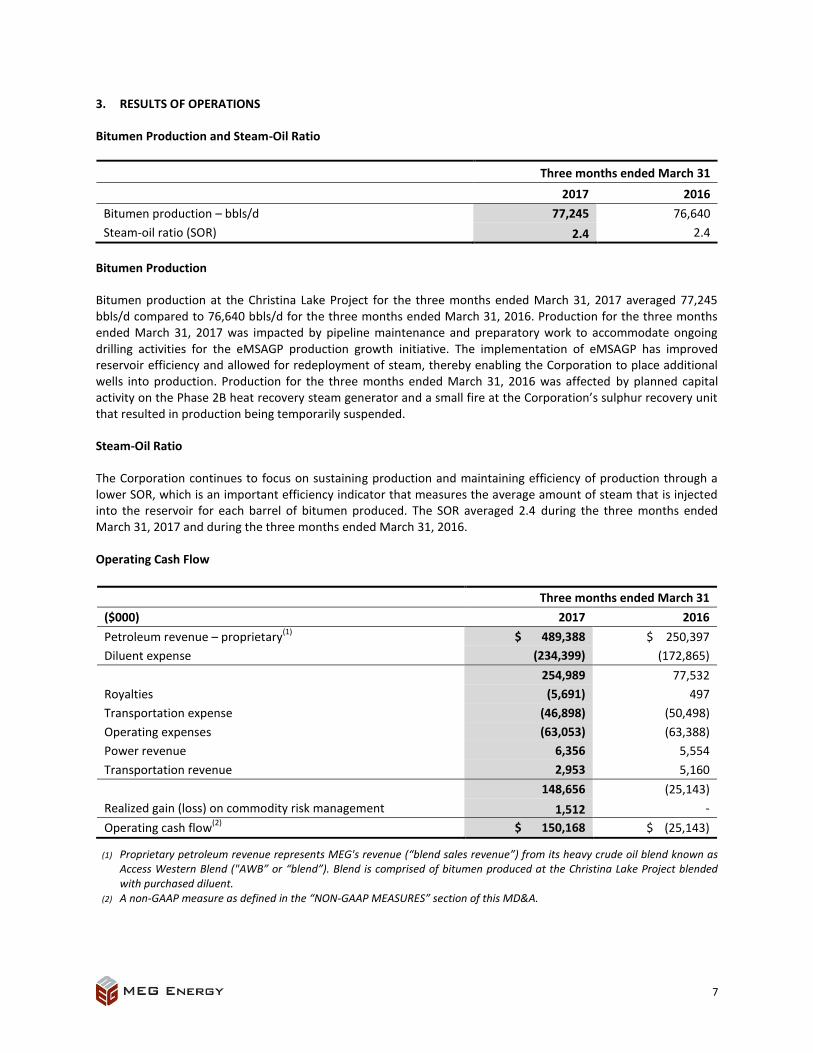
3. RESULTS OF OPERATIONS
Bitumen Production and Steam-Oil Ratio
Three months ended March 31
2017 2016
Bitumen production – bbls/d 77,245 76,640
Steam-oil ratio (SOR) 2.4 2.4
Bitumen Production
Bitumen production at the Christina Lake Project for the three months ended March 31, 2017 averaged 77,245 bbls/d compared to 76,640 bbls/d for the three months ended March 31, 2016. Production for the three months ended March 31, 2017 was impacted by pipeline maintenance and preparatory work to accommodate ongoing drilling activities for the eMSAGP production growth initiative. The implementation of eMSAGP has improved reservoir efficiency and allowed for redeployment of steam, thereby enabling the Corporation to place additional wells into production. Production for the three months ended March 31, 2016 was affected by planned capital activity on the Phase 2B heat recovery steam generator and a small fire at the Corporation’s sulphur recovery unit that resulted in production being temporarily suspended.
Steam-Oil Ratio
The Corporation continues to focus on sustaining production and maintaining efficiency of production through a lower SOR, which is an important efficiency indicator that measures the average amount of steam that is injected into the reservoir for each barrel of bitumen produced. The SOR averaged 2.4 during the three months ended March 31, 2017 and during the three months ended March 31, 2016.
Operating Cash Flow
Three months ended March 31
($000) 2017 2016
Petroleum revenue – proprietary(1)
$ 489,388 $ 250,397
Diluent expense (234,399) (172,865)
254,989 77,532
Royalties (5,691) 497
Transportation expense (46,898) (50,498)
Operating expenses (63,053) (63,388)
Power revenue 6,356 5,554
Transportation revenue 2,953 5,160
148,656 (25,143)
Realized gain (loss) on commodity risk management 1,512 -
Operating cash flow(2)
$ 150,168 $ (25,143)
(1) Proprietary petroleum revenue represents MEG's revenue (“blend sales revenue”) from its heavy crude oil blend known as Access Western Blend ("AWB” or “blend”). Blend is comprised of bitumen produced at the Christina Lake Project blended with purchased diluent.
(2) A non-GAAP measure as defined in the “NON-GAAP MEASURES” section of this MD&A.

8
Operating cash flow was $150.2 million for the three months ended March 31, 2017 compared to negative operating cash flow of $25.1 million for the three months ended March 31, 2016. Operating cash flow increased primarily due to higher blend sales revenue as a result of the quarter-over-quarter increase in average U.S. crude oil benchmark pricing, partially offset by an increase in diluent expense. Blend sales revenue for the three months ended March 31, 2017 was $489.4 million compared to $250.4 million for the three months ended March 31, 2016. The increase in blend sales revenue is primarily due to a 96% increase in the average realized blend price. Diluent expense for the three months ended March 31, 2017 was $234.4 million compared to $172.9 million for the three months ended March 31, 2016, reflecting an increase in condensate prices.
Cash Operating Netback
The following table summarizes the Corporation’s cash operating netback for the periods indicated:
Three months ended March 31
($/bbl) 2017 2016
Bitumen realization(1)
$ 37.93 $ 11.43
Transportation(2)
(6.54) (6.68)
Royalties (0.85) 0.07
30.54 4.82
Operating costs – non-energy (5.20) (6.45)
Operating costs – energy (4.18) (2.90)
Power revenue 0.95 0.82
Net operating costs (8.43) (8.53)
22.11 (3.71)
Realized gain (loss) on commodity risk management 0.22 -
Cash operating netback $ 22.33 $ (3.71)
(1) Blend sales revenue net of diluent expense. (2) Defined as transportation expense less transportation revenue. Transportation expense includes rail, third-party pipelines
and the Stonefell Terminal costs, as well as MEG’s share of the operating costs for the Access Pipeline, net of third-party recoveries on diluent transportation arrangements.
$(3.71)
$22.33 $26.50 $0.14 $1.25 $0.13 $0.22 $(0.92) $(1.28)
(10.0)
(5.0)
-
5.0
10.0
15.0
20.0
25.0
30.0
Q1 2016 Bitumenrealization
Transportation Royalties Operating costs- non-energy
Operating costs- energy
Power revenue Realized riskmanagement
Q1 2017
$/b
bl

9
The cash operating netback for the three months ended March 31, 2017 was $22.33 per barrel compared to a negative cash operating netback of $3.71 per barrel for the three months ended March 31, 2016. The increase in the cash operating netback for the three months ended March 31, 2017 was primarily due to an increase in bitumen realization, as a result of the quarter-over-quarter increase in average U.S. crude oil benchmark pricing. The C$/bbl WTI average price for the three months ended March 31, 2017 increased 49% compared to the three months ended March 31, 2016. In addition, the WTI:WCS differential averaged US$14.58 per barrel, or 28.1%, for the three months ended March 31, 2017 compared to US$14.24 per barrel, or 42.6%, for the three months ended March 31, 2016.
Bitumen Realization
Bitumen realization represents the Corporation's realized proprietary petroleum revenue (“blend sales revenue”), net of diluent expense, expressed on a per barrel basis. Blend sales revenue represents MEG’s revenue from its heavy crude oil blend known as Access Western Blend ("AWB” or “blend”). AWB is comprised of bitumen produced at the Christina Lake Project blended with purchased diluent. The cost of blending is impacted by the amount of diluent required and the Corporation’s cost of purchasing and transporting diluent. A portion of diluent expense is effectively recovered in the sales price of the blended product. Diluent expense is also impacted by Canadian and U.S. benchmark pricing, the timing of diluent inventory purchases and changes in the value of the Canadian dollar relative to the U.S. dollar.
Bitumen realization averaged $37.93 per barrel for the three months ended March 31, 2017 compared to $11.43 per barrel for the three months ended March 31, 2016. The increase in bitumen realization is primarily a result of the quarter-over-quarter increase in average U.S. crude oil benchmark pricing, which resulted in higher blend sales revenue.
For the three months ended March 31, 2017, the Corporation’s cost of diluent was $70.80 per barrel of diluent compared to $52.66 per barrel of diluent for the three months ended March 31, 2016. The increase in the cost of diluent is primarily a result of the quarter-over-quarter increase in average condensate benchmark pricing.
Transportation
The Corporation utilizes multiple facilities to transport and sell its blend to refiners throughout North America. In early 2016, the Corporation increased its transportation capacity on the Flanagan South and Seaway pipeline systems, thereby furthering the Corporation’s strategy of broadening market access to world prices with the intention of improving cash operating netback. Sales volumes destined for U.S. markets require additional transportation costs and generally obtain higher sales prices. Transportation expense averaged $6.54 per barrel for the three months ended March 31, 2017 compared to $6.68 per barrel for the three months ended March 31, 2016. The proportion of blend sales volumes shipped from Edmonton to the U.S. Gulf Coast via the Flanagan South and Seaway pipeline systems during the three months ended March 31, 2017 was consistent with the three months ended March 31, 2016.
Royalties
The Corporation's royalty expense is based on price-sensitive royalty rates set by the Government of Alberta. The applicable royalty rates change depending on whether a project is pre-payout or post-payout, with payout being defined as the point in time when a project has generated enough cumulative net revenues to recover its cumulative costs. The royalty rate applicable to pre-payout oil sands operations starts at 1% of bitumen sales and increases for every dollar that the WTI crude oil price in Canadian dollars is priced above $55 per barrel, to a maximum of 9% when the WTI crude oil price is $120 per barrel or higher. All of the Corporation's projects are currently pre-payout.
The increase in royalties for the three months ended March 31, 2017, compared to the three months ended March 31, 2016 is primarily the result of higher realized WTI crude oil prices.
10
Net Operating Costs
Net operating costs are comprised of the sum of non-energy operating costs and energy operating costs, which are reduced by power revenue. Non-energy operating costs represent production-related operating activities excluding energy operating costs. Energy operating costs represent the cost of natural gas for the production of steam and power at the Corporation’s facilities. Power revenue is the sale of surplus power generated by the Corporation’s cogeneration facilities at the Christina Lake Project.
Net operating costs for the three months ended March 31, 2017 averaged $8.43 per barrel compared to $8.53 per barrel for the three months ended March 31, 2016. The decrease in net operating costs is attributable to a per barrel decrease in non-energy operating costs, offset by an increase in energy operating costs per barrel.
Non-energy operating costs
Non-energy operating costs averaged $5.20 per barrel for the three months ended March 31, 2017 compared to $6.45 per barrel for the three months ended March 31, 2016. The decrease in non-energy operating costs is primarily the result of efficiency gains and a continued focus on cost management resulting in lower operations staffing and associated camp and site services costs.
Energy operating costs
Energy operating costs averaged $4.18 per barrel for the three months ended March 31, 2017 compared to $2.90 per barrel for the three months ended March 31, 2016. The increase in energy operating costs on a per barrel basis is primarily attributable to the increase in natural gas prices. The Corporation’s natural gas purchase price averaged $3.12 per mcf during the three months ended March 31, 2017 compared to $2.27 per mcf for the three months ended March 31, 2016.
Power revenue
Power revenue averaged $0.95 per barrel for the three months ended March 31, 2017 compared to $0.82 per barrel for the three months ended March 31, 2016. The Corporation’s average realized power sales price during the three months ended March 31, 2017 was $22.42 per megawatt hour compared to $19.77 per megawatt hour for the three months ended March 31, 2016.
Realized Gain (Loss) on Commodity Risk Management
The realized gain on commodity risk management averaged $0.22 per barrel for the three months ended March 31, 2017 primarily due to settlement gains on commodity risk management contracts relating to condensate purchases, partially offset by settlement losses on commodity risk management contracts relating to crude oil sales. Refer to the “Risk Management” section of this MD&A for further details.

11
Adjusted Funds Flow
(1) Net of diluent expense. (2) Defined as transportation expense less transportation revenue. (3) Includes non-energy and energy operating costs, reduced by power revenue. (4) Defined as total interest expense plus realized gain/loss on interest rate swaps per Note 16 of the Interim Consolidated
Financial Statements less amortization of debt discount and debt issue costs as presented on the Interim Consolidated Statement of Cash Flow.
Adjusted funds flow is a non-GAAP measure, as defined in the “NON-GAAP MEASURES” section of this MD&A, which is used by the Corporation to analyze operating performance and liquidity. Adjusted funds flow was $43.2 million for the three months ended March 31, 2017 compared to negative adjusted funds flow of $131.2 million for the three months ended March 31, 2016. The increase in adjusted funds flow was primarily due to an increase in bitumen realization. The increase in bitumen realization is directly correlated to the quarter-over-quarter increase in average U.S. crude oil benchmark pricing.
Operating Earnings (Loss)
Operating earnings (loss) is a non-GAAP measure, as defined in the “NON-GAAP MEASURES” section of this MD&A, which the Corporation uses as a performance measure to provide comparability of financial performance between periods by excluding non-operating items. The Corporation recognized an operating loss of $79.4 million for the three months ended March 31, 2017 compared to an operating loss of $197.3 million for the three months ended March 31, 2016. The decrease in the operating loss for the three months ended March 31, 2017 was primarily due to higher bitumen realization as a result of the quarter-over-quarter increase in average U.S. crude oil benchmark pricing.
$(131.2)
$43.2 $177.5 $(6.2) $1.4 $1.1 $(5.8) $4.5 $1.9
(200.0)
(150.0)
(100.0)
(50.0)
-
50.0
100.0
Q1 2016 Bitumenrealization
Royalties Transportation Net operatingcosts
Interest, net General &administrative
Other Q1 2017
$ m
illio
ns
(1)
(2)
(3)
(4)

12
Revenue
Revenue represents the total of petroleum revenue, net of royalties and other revenue. Revenue for the three months ended March 31, 2017 totalled $559.8 million compared to $290.3 million for the three months ended March 31, 2016. Revenue for the three months ended March 31, 2017 increased primarily due to an increase in blend sales revenue as a result of the quarter-over-quarter increase in average U.S. crude oil benchmark pricing.
Net Earnings
The Corporation recognized net earnings of $1.6 million for the three months ended March 31, 2017 compared to net earnings of $130.8 million for the three months ended March 31, 2016.
Net earnings for the three months ended March 31, 2017 declined primarily due to a smaller net unrealized foreign exchange gain of $36.7 million on the Corporation’s U.S. dollar denominated debt and U.S. dollar denominated cash and cash equivalents compared with a net unrealized foreign exchange gain of $320.3 million in the same period in 2016. This decline in net earnings was partially offset by an increase in bitumen realization, primarily as a result of the increase in average U.S. crude oil benchmark pricing.
Total Cash Capital Investment
Total cash capital investment during the three months ended March 31, 2017 totalled $77.8 million compared to $35.0 million for the three months ended March 31, 2016. Capital investment in 2017 was primarily directed towards the Corporation’s eMSAGP production growth initiative at Christina Lake Phase 2B and sustaining capital activities.
4. OUTLOOK
Summary of 2017 Guidance
Capital investment $590 million
Bitumen production – annual average 80,000 – 82,000 bbls/d
Bitumen production – targeted exit volume 86,000 – 89,000 bbls/d
Non-energy operating costs $5.75 – $6.75/bbl
On January 11, 2017, the Corporation announced a 2017 capital budget of $590 million, of which approximately 55% is directed towards the eMSAGP growth initiative at Christina Lake Phase 2B, 35% towards sustaining and turnaround costs, and the remainder towards supporting marketing, corporate and other initiatives. The Corporation expects to fund the remaining 2017 capital program with internally generated funds flow and $549 million of cash on hand as at March 31, 2017. The Corporation’s 2017 annual bitumen production volumes are targeted to average 80,000 to 82,000 bbls/d with targeted exit production of 86,000 to 89,000 bbls/d. Non-energy operating costs are targeted to be in the range of $5.75 to $6.75 per barrel.

13
5. BUSINESS ENVIRONMENT
The following table shows industry commodity pricing information and foreign exchange rates on a quarterly basis to assist in understanding the impact of commodity prices and foreign exchange rates on the Corporation’s financial results:
2017 2016 2015
Q1 Q4 Q3 Q2 Q1 Q4 Q3 Q2
Average Commodity Prices
Crude oil prices
Brent (US$/bbl) 54.66 51.13 46.98 46.67 35.10 44.71 51.17 63.50
WTI (US$/bbl) 51.91 49.29 44.94 45.59 33.45 42.18 46.43 57.94
WTI (C$/bbl) 68.68 65.75 58.65 58.75 45.99 56.32 60.79 71.24
WCS (C$/bbl) 49.39 46.65 41.03 41.61 26.41 36.97 43.29 56.98
Differential – WTI:WCS (US$/bbl) 14.58 14.32 13.50 13.30 14.24 14.49 13.27 11.59
Differential – WTI:WCS (%) 28.1% 29.1% 30.0% 29.2% 42.6% 34.4% 28.8% 20.0%
Condensate prices
Condensate at Edmonton (C$/bbl) 69.17 64.49 56.25 56.83 47.27 55.57 57.89 71.17
Condensate at Edmonton as % of WTI 100.7% 98.1% 95.9% 96.7% 102.8% 98.7% 95.2% 99.9% Condensate at Mont Belvieu, Texas
(US$/bbl) 46.05 45.17 41.17 40.37 32.03 40.76 41.27 52.89
Condensate at Mont Belvieu, Texas as % of WTI 88.7% 91.6% 91.6% 88.6% 95.8% 96.6% 88.9% 91.3%
Natural gas prices
AECO (C$/mcf) 2.91 3.31 2.49 1.37 1.82 2.57 2.89 2.64
Electric power prices
Alberta power pool (C$/MWh) 22.38 21.97 17.93 14.77 18.09 21.19 26.04 57.25
Foreign exchange rates
C$ equivalent of 1 US$ - average 1.3230 1.3339 1.3051 1.2886 1.3748 1.3353 1.3093 1.2294
C$ equivalent of 1 US$ - period end 1.3322 1.3427 1.3117 1.3009 1.2971 1.3840 1.3394 1.2474
Crude Oil Prices
Brent crude is the primary world price benchmark for global light sweet crude oil. The Brent benchmark price averaged US$54.66 per barrel for the three months ended March 31, 2017 compared to US$35.10 per barrel for the three months ended March 31, 2016. The price of WTI is the current benchmark for mid-continent North American crude oil prices, at Cushing Oklahoma, and its Canadian dollar equivalent is the basis for determining royalties on the Corporation's bitumen sales. The WTI price averaged US$51.91 per barrel for the three months ended March 31, 2017 compared to US$33.45 per barrel for the three months ended March 31, 2016.
The WCS benchmark reflects North American prices at Hardisty, Alberta. WCS is a blend of heavy oils, consisting of heavy conventional crude oils and bitumen, blended with sweet synthetic, light crude oil or condensate. WCS typically trades at a differential below the WTI benchmark price. The WTI:WCS differential averaged US$14.58 per barrel, or 28.1%, for the three months ended March 31, 2017 compared to US$14.24 per barrel, or 42.6%, for the three months ended March 31, 2016.
Condensate Prices
In order to facilitate pipeline transportation, MEG uses condensate sourced throughout North America as diluent for blending with the Corporation’s bitumen. Condensate prices, benchmarked at Edmonton, averaged $69.17 per barrel, or 100.7% of WTI, for the three months ended March 31, 2017 compared to $47.27 per barrel, or 102.8% of WTI, for the three months ended March 31, 2016. Condensate prices, benchmarked at Mont Belvieu, Texas, averaged US$46.05 per barrel, or 88.7% of WTI, for the three months ended March 31, 2017 compared to US$32.03 per barrel, or 95.8% of WTI, for the three months ended March 31, 2016.

14
Natural Gas Prices
Natural gas is a primary energy input cost for the Corporation, as it is used as fuel to generate steam for the SAGD process and to create electricity from the Corporation's cogeneration facilities. The AECO natural gas price averaged $2.91 per mcf for the three months ended March 31, 2017 compared to $1.82 per mcf for the three months ended March 31, 2016. Natural gas prices have increased during the three months ended March 31, 2017 compared to the three months ended March 31, 2016 mainly due to lower natural gas production, an increase in exports and increasing natural gas demand in the power sector.
Electric Power Prices
Electric power prices impact the price that the Corporation receives on the sale of surplus power from the Corporation’s cogeneration facilities. The Alberta power pool price averaged $22.38 per megawatt hour for the three months ended March 31, 2017 compared to $18.09 per megawatt hour for the three months ended March 31, 2016. The Alberta power pool price has settled in the $14 per megawatt hour to $24 per megawatt hour range since late 2015, primarily due to an overall surplus of power generation capacity in the province.
Foreign Exchange Rates
Changes in the value of the Canadian dollar relative to the U.S. dollar have an impact on the Corporation's blend sales revenue and diluent expense, as blend sales prices and diluent expense are determined by reference to U.S. benchmarks. Changes in the value of the Canadian dollar relative to the U.S. dollar also have an impact on principal and interest payments on the Corporation's U.S. dollar denominated debt. A decrease in the value of the Canadian dollar compared to the U.S. dollar has a positive impact on blend sales revenue and a negative impact on diluent expense and principal and interest payments. Conversely, an increase in the value of the Canadian dollar has a negative impact on blend sales revenue and a positive impact on diluent expense and principal and interest payments.
The Corporation recognizes net unrealized foreign exchange gains and losses on the translation of U.S. dollar denominated debt and U.S. dollar denominated cash and cash equivalents at each reporting date. As at March 31, 2017, the Canadian dollar, at a rate of 1.3322, had increased in value by approximately 1% against the U.S. dollar compared to its value as at December 31, 2016, when the rate was 1.3427. As at March 31, 2016, the Canadian dollar, at a rate of 1.2971, had increased in value by approximately 6% against the U.S. dollar compared to its value as at December 31, 2015, when the rate was 1.3840.
6. OTHER OPERATING RESULTS
Net Marketing Activity
Three months ended March 31
($000) 2017 2016
Petroleum revenue – third party $ 66,773 $ 28,730
Purchased product and storage (65,542) (28,810)
Net marketing activity(1)
$ 1,231 $ (80)
(1) Net marketing activity is a non-GAAP measure as defined in the “NON-GAAP MEASURES” section.

15
The Corporation has entered into marketing arrangements for rail and pipeline transportation commitments and product storage arrangements to enhance its ability to transport proprietary crude oil products to a wider range of markets in Canada, the United States and on tidewater. In the event that the Corporation is not utilizing these arrangements for proprietary purposes, the Corporation purchases and sells third-party crude oil and related products and enters into transactions to generate revenues to offset the costs of such marketing and storage arrangements which is included in net marketing activity.
Depletion and Depreciation
Three months ended March 31
($000) 2017 2016
Depletion and depreciation expense $ 116,879 $ 116,993
Depletion and depreciation expense per barrel of production $ 16.81 $ 16.78
Depletion and depreciation expense for the three months ended March 31, 2017 totalled $116.9 million compared to $117.0 million for the three months ended March 31, 2016. Depletion and depreciation expense was $16.81 per barrel for the three months ended March 31, 2017 consistent with $16.78 per barrel for the three months ended March 31, 2016.
Commodity Risk Management Gain (Loss)
The Corporation has entered into commodity risk management contracts. The Corporation has not designated any of its commodity risk management contracts as hedges for accounting purposes. All commodity risk management contracts have been recorded at fair value, with all changes in fair value recognized through net earnings (loss). Realized gains or losses on commodity risk management contracts are the result of contract settlements during the period. Unrealized gains or losses on commodity risk management contracts represent the change in the mark-to-market position of the unsettled commodity risk management contracts during the period.
Three months ended March 31
2017 2016
($000) Realized Unrealized Total Realized Unrealized Total
Crude oil contracts(1)
$ (3,894) $ 61,690 $ 57,796 $ - $ (591) $ (591)
Condensate contracts(2)
5,406 (2,091) 3,315 - 17,554 17,554
Commodity risk management gain (loss) $ 1,512 $ 59,599 $ 61,111 $ - $ 16,963 $ 16,963
(1) Includes WTI fixed price, WTI collars and WCS fixed differential contracts. (2) Relates to condensate purchase contracts that effectively fix condensate prices at Mont Belvieu, Texas as a percentage of
WTI (US$/bbl).
The Corporation recognized an unrealized gain on commodity risk management contracts of $59.6 million for the three months ended March 31, 2017 compared to an unrealized gain on commodity risk management contracts of $17.0 million for the three months ended March 31, 2016. The Corporation realized a gain on commodity risk management contracts of $1.5 million for the three months ended March 31, 2017 (March 31, 2016 – $nil). Refer to the “Risk Management” section of this MD&A for further details.

16
General and Administrative
Three months ended March 31
($000) 2017 2016
General and administrative expense $ 23,222 $ 27,716
General and administrative expense per barrel of production $ 3.34 $ 3.97
General and administrative expense for the three months ended March 31, 2017 was $23.2 million compared to $27.7 million for the three months ended March 31, 2016. General and administrative expense was $3.34 per barrel for the three months ended March 31, 2017 compared to $3.97 per barrel for the three months ended March 31, 2016. General and administrative expense decreased primarily due to workforce reductions and the Corporation’s continued focus on cost management.
Stock-based Compensation
Three months ended March 31
($000) 2017 2016
Cash-settled expense (recovery) $ (1,223) $ -
Equity-settled expense 3,510 12,892
Stock-based compensation $ 2,287 $ 12,892
The fair value of compensation associated with the granting of stock options, restricted share units ("RSUs"), performance share units ("PSUs") and deferred share units (“DSUs”) to officers, directors, employees and consultants is recognized by the Corporation as stock-based compensation expense. Fair values for equity-settled plans are determined using the Black-Scholes option pricing model.
In June 2016, the Corporation granted RSUs and PSUs under a new cash-settled Restricted Share Unit Plan. RSUs generally vest over a three year period while PSUs generally vest on the third anniversary of the grant date, provided that the Corporation satisfies certain performance criteria identified by the Corporation’s Board of Directors within a target range. Upon vesting of the RSUs and PSUs, the participants of the cash-settled RSU plan will receive a cash payment based on the fair value of the underlying share units at the vesting date. The cash-settled RSUs and PSUs are accounted for as liability instruments and are measured at fair value based on the market value of the Corporation’s common shares at each period end. Fluctuations in the fair value are recognized within stock-based compensation expense or capitalized to property, plant and equipment during the period in which they occur.
Stock-based compensation expense for the three months ended March 31, 2017 was $2.3 million compared to $12.9 million for the three months ended March 31, 2016. The decrease is primarily due to a decrease in equity-settled share-based compensation costs as a result of fewer equity-settled compensation awards issued in 2016. The cash-settled share-based compensation recovery is primarily the result of a decrease in the Corporation’s common share price during the three months ended March 31, 2017.

17
Research and Development
Three months ended March 31
($000) 2017 2016
Research and development expense $ 940 $ 1,378
Research and development expenditures related to the Corporation's research of crude quality improvement and related technologies have been expensed. Research and development expenditures were $0.9 million for the three months ended March 31, 2017 compared to $1.4 million for the three months ended March 31, 2016.
Foreign Exchange Loss (Gain), Net
Three months ended March 31
($000) 2017 2016
Unrealized foreign exchange loss (gain) on:
Long-term debt $ (39,758) $ (330,093)
Other 3,051 9,812
Unrealized net loss (gain) on foreign exchange (36,707) (320,281)
Realized loss (gain) on foreign exchange (2,313) (5,666)
Foreign exchange loss (gain), net $ (39,020) $ (325,947)
C$ equivalent of 1 US$
Beginning of period 1.3427 1.3840
End of period 1.3322 1.2971
The Corporation recognized a net foreign exchange gain of $39.0 million for the three months ended March 31, 2017 compared to a net foreign exchange gain of $325.9 million for the three months ended March 31, 2016. The net foreign exchange gain is primarily due to the translation of the Corporation’s U.S. dollar denominated debt as a result of strengthening of the Canadian dollar compared to the U.S. dollar by approximately 1% during the three months ended March 31, 2017. During the three months ended March 31, 2016, the Canadian dollar strengthened in value by approximately 6%.
Net Finance Expense
Three months ended March 31
($000) 2017 2016
Total interest expense $ 93,274 $ 83,915
Accretion on provisions 1,856 1,694
Unrealized loss (gain) on derivative financial liabilities(1)
(2,241) 5,489
Realized loss (gain) on interest rate swaps - 1,569
Net finance expense $ 92,889 $ 92,667
Average effective interest rate(2)
6.0% 5.8%
(1) Derivative financial liabilities include the 1% interest rate floor and interest rate swaps. (2) Defined as the weighted average interest rate applied to the U.S. dollar denominated senior secured term loan, Senior
Secured Second Lien Notes, and Senior Unsecured Notes outstanding, including the impact of interest rate swaps.

18
Total interest expense for the three months ended March 31, 2017 was $93.3 million compared to $83.9 million for the three months ended March 31, 2016. Total interest expense for the three months ended March 31, 2017 was higher than the comparative 2016 period primarily due to execution and closing of the refinancing plan on January 27, 2017 and the incremental interest expense associated with carrying both the now repaid US$750 million aggregate principal amount of 6.5% Senior Unsecured Notes and the new 6.5% Senior Secured Second Lien Notes for a period of 49 days. Given the reduction in the early redemption premium threshold between closing and March 15, 2017, the economic cost of carrying interest on these notes for an incremental 49 days was less than the cost of redeeming the notes prior to March 15, 2017. The 6.5% Senior Unsecured Notes were repaid on March 15, 2017 with the proceeds from the Senior Secured Second Lien Notes. This issuance and repayment of notes was part of the Corporation’s comprehensive refinancing plan which is further described in the “LIQUIDITY AND CAPITAL RESOURCES” section of this MD&A.
Unrealized gains and losses on derivative liabilities includes unrealized gains and losses related to the change in fair value of the interest rate floor associated with the Corporation's senior secured term loan, and for the three months ended March 31, 2016, the change in fair value of the Corporation’s interest rate swap contracts. The Corporation recognized an unrealized gain on derivative financial liabilities of $2.2 million for the three months ended March 31, 2017 compared to an unrealized loss of $5.5 million for the three months ended March 31, 2016.
The Corporation’s interest rate swap contracts expired on September 30, 2016. The Corporation realized a loss on the interest rate swaps of $1.6 million for the three months ended March 31, 2016.
Onerous Contracts Expense
Three months ended March 31
($000) 2017 2016
Onerous contracts expense $ 2,375 $ 4,371
During the three months ended March 31, 2017, the Corporation recognized onerous contracts expense of $2.4 million primarily due to changes in estimated future cash flow sublease recoveries related to the onerous office lease provision for the Corporation’s office building lease contracts. During the three months ended March 31, 2016, the Corporation recognized an expense of $4.4 million primarily due to the reduction of the Corporation’s capital program for 2016 and its impact on drilling contracts.
Income Tax Expense (Recovery)
Three months ended March 31
($000) 2017 2016
Current income tax expense (recovery) $ (284) $ 517
Deferred income tax expense (recovery) 10,979 (69,156)
Income tax expense (recovery) $ 10,695 $ (68,639)
The Corporation recognized a current income tax recovery of $0.4 million for the three months ended March 31, 2017 relating to the refundable Alberta tax credit on Scientific Research and Experimental Development expenditures. The Corporation recognized a current income tax expense of $0.1 million for the three months ended March 31, 2017, and $0.5 million for the three months ended March 31, 2016, relating to U.S. income tax associated with its operations in the United States. The Corporation’s Canadian operations are not currently taxable. The Corporation recognized a deferred income tax expense of $11.0 million for the three months ended March 31, 2017 compared to a deferred income tax recovery of $69.2 million for the three months ended March 31, 2016.

19
The Corporation's effective tax rate on earnings is impacted by permanent differences. The significant permanent differences are:
The permanent difference due to the non-taxable portion of realized and unrealized foreign exchange gains and losses arising on the translation of the U.S. dollar denominated debt. For the three months ended March 31, 2017, the non-taxable net gain was $19.9 million compared to a non-taxable gain of $165.0 million for the three months ended March 31, 2016.
Non-taxable stock-based compensation expense for equity-settled plans is a permanent difference. Stock-based compensation expense for equity-settled plans for the three months ended March 31, 2017 was $3.5 million compared to $12.9 million for the three months ended March 31, 2016.
As at March 31, 2017, the Corporation had approximately $8.0 billion of available tax pools and $218.0 million of capital investment in respect of incomplete projects which will increase available tax pools upon completion of the projects.
As at March 31, 2017, the Corporation has recognized a deferred income tax asset of $115.8 million on the Consolidated Balance Sheet, as estimated future taxable income is expected to be sufficient to realize the deferred income tax asset.
As at March 31, 2017, the Corporation had not recognized the tax benefit related to $597.7 million of realized and unrealized taxable capital foreign exchange losses.
7. NET CAPITAL INVESTMENT
Three months ended March 31
($000) 2017 2016
Total cash capital investment $ 77,770 $ 34,975
Capitalized cash-settled stock-based compensation 86 -
Net capital investment $ 77,856 $ 34,975
Total cash capital investment for the three months ended March 31, 2017 was $77.8 million, compared to $35.0 million for the three months ended March 31, 2016. During the three months ended, March 31, 2017, the Corporation invested approximately $32.9 million in the eMSAGP growth project at Christina Lake Phase 2B, $29.7 million in sustaining capital activities, and $15.2 million in marketing, corporate and other capital initiatives. The Corporation drilled 14 infill wells during the three months ended March 31, 2017 compared to two infill wells during the three months ended March 31, 2016. Capital investment in the three months ended March 31, 2016 was primarily directed towards sustaining capital activities.
In June 2016, the Corporation began capitalizing the cost related to a new cash-settled stock-based compensation plan for employees directly involved in capital investing activities.

20
8. LIQUIDITY AND CAPITAL RESOURCES
($000) March 31, 2017 December 31, 2016
Cash and cash equivalents $ 548,981 $ 156,230
Senior secured term loan (March 31, 2017 – US$1.235
billion; due 2023; December 31, 2016 – US$1.236 billion) 1,645,267 1,658,906
US$1.4 billion revolver (due 2021) - -
6.5% senior secured second lien notes (US$750.0 million; due 2025) 999,150 -
6.5% senior unsecured notes (US$750.0 million; due 2021) - 1,007,025
6.375% senior unsecured notes (US$800.0 million; due 2023) 1,065,760 1,074,160
7.0% senior unsecured notes (US$1.0 billion; due 2024) 1,332,200 1,342,700
Total debt(1),(2)
$ 5,042,377 $ 5,082,791
(1) Total debt does not have a standardized meaning prescribed by IFRS and therefore may not be comparable to similar measures used by other companies. The Corporation uses this non-GAAP measure to analyze leverage and liquidity. Total debt plus the debt redemption premium less current portion of the senior secured term loan, unamortized financial derivative liability discount and unamortized deferred debt discount and debt issue costs is equal to long-term debt as reported in the Corporation's interim consolidated financial statements as at March 31, 2017 and the Corporation’s consolidated financial statements as at December 31, 2016. The non-GAAP measure of total debt is reconciled to long-term debt in accordance with IFRS under the heading “NON-GAAP MEASURES” and discussed further in the “ADVISORY” section.
(2) On December 8, 2016, Fitch Ratings (“Fitch”) assigned the Corporation a first-time Long-Term Issuer Default Rating of B, and assigned a rating of BB to the Corporation’s covenant-lite revolving credit facility and term loan and a rating of B to the Corporation’s Senior Unsecured Notes. On January 12, 2017, Fitch assigned a BB rating to the Corporation’s new Senior Secured Second Lien Notes (see the “Capital Resources” section of this MD&A). Fitch’s rating outlook is negative. On January 12, 2017, Standard & Poor's Ratings Services (“S&P”) assigned a BB+ rating to the Corporation’s new Senior Secured Second Lien Notes. On January 12, 2017, Moody’s Investors Service (“Moody’s”) upgraded the Corporation’s Corporate Family Rating to B3 from Caa2, the Probability of Default Rating to B3-PD from Caa2-PD and the Corporation’s Senior Unsecured Notes rating to Caa2 from Caa3. Moody’s Speculative Grade Liquidity Rating was raised to SGL-1 from SGL-2. Moody’s also assigned a rating of Ba3 to the Corporation’s covenant-lite revolving credit facility and refinanced term loan and a rating of Caa1 to the new Senior Secured Second Lien Notes. Moody’s rating outlook was changed to stable from negative.
Capital Resources
The Corporation's cash and cash equivalents balance totalled $549.0 million as at March 31, 2017 compared to $156.2 million as at December 31, 2016. The Corporation's cash and cash equivalents balance increased primarily due to net equity issuance proceeds of $496.3 million received pursuant to the comprehensive refinancing that closed on January 27, 2017.
All of the Corporation’s long-term debt is denominated in U.S. dollars. As a result of the increase in the value of the Canadian dollar relative to the U.S. dollar, long-term debt as presented on the Consolidated Balance Sheet, decreased to C$4.9 billion as at March 31, 2017 from C$5.1 billion as at December 31, 2016. On January 27, 2017, the Corporation closed a comprehensive refinancing plan by way of the Corporation’s Canadian base shelf prospectus dated December 1, 2016. The plan was comprised of the following four transactions:
An extension of the maturity date on substantially all of the commitments under the Corporation’s undrawn covenant-lite revolving credit facility from November 2019 to November 2021. The commitment amount of the five-year facility has been reduced from US$2.5 billion to US$1.4 billion. The revolving credit facility has no financial maintenance covenants and is not subject to any borrowing base redetermination;

21
The US$1.2 billion term loan has been refinanced and its maturity date has been extended from March 2020 to December 2023. The refinanced term loan bears interest at an annual rate of LIBOR plus 3.5% with a LIBOR floor of 1%;
The US$750 million aggregate principal amount of 6.5% Senior Unsecured Notes, with a maturity date of March 2021, have been refinanced and replaced with new 6.5% Senior Secured Second Lien Notes, maturing January 2025. The existing 2021 notes were redeemed with the proceeds from the Senior Secured Second Lien Notes on March 15, 2017; and
The Corporation raised C$518 million of equity, before underwriting fees and expenses, in the form of 66,815,000 common shares at a price $7.75 per common share on a bought deal basis from a syndicate of underwriters.
In addition to the transactions noted above, on February 15, 2017, the Corporation extended the maturity date on its five-year letter of credit facility, guaranteed by EDC, from November 2019 to November 2021. The guaranteed letter of credit facility has been reduced from US$500 million to US$440 million. As at March 31, 2017, US$296 million of letters of credit have been issued. Letters of credit under this facility do not consume capacity of the revolving credit facility.
All of MEG’s long-term debt, the revolving credit facility and the EDC facility are “covenant-lite” in structure, meaning they are free of any financial maintenance covenants and are not dependent on, nor calculated from, the Corporation’s crude oil reserves. The first maturity of any of the Corporation’s outstanding long-term debt obligations is in 2023.
Management believes its current capital resources and its ability to manage cash flow and working capital levels will allow the Corporation to meet its current and future obligations, to make scheduled principal and interest payments, and to fund the other needs of the business for at least the next 12 months. However, no assurance can be given that this will be the case or that future sources of capital will not be necessary. The Corporation's cash flow and the development of projects are dependent on factors discussed in the "RISK FACTORS" section of this MD&A.
The objectives of the Corporation's investment guidelines for surplus cash are to ensure preservation of capital and to maintain adequate liquidity to meet the Corporation’s cash flow requirements. The Corporation only places surplus cash investments with counterparties that have a short term credit rating of R-1 (high) or equivalent. The Corporation has experienced no material loss or lack of access to its cash in operating accounts, invested cash or cash equivalents. However, the Corporation can provide no assurance that access to its invested cash and cash equivalents will not be impacted by adverse conditions in the financial markets. While the Corporation monitors the cash balances in its operating and investment accounts according to its investment practices and adjusts the cash balances as appropriate, these cash balances could be impacted if the underlying financial institutions or corporations fail or are subject to other adverse conditions in the financial markets.
Risk Management
Commodity Price Risk Management
Fluctuations in commodity prices and market conditions can impact the Corporation’s financial performance, operating results, cash flows, expansion and growth opportunities, access to funding and the cost of borrowing. Under the Corporation’s strategic commodity risk management program, derivative financial instruments are employed with the intent of increasing the predictability of the Corporation’s future cash flow. MEG’s commodity risk management program is governed by a Risk Management Committee that follows guidelines and limits approved by the Board of Directors. The Corporation does not use financial derivatives for speculative purposes. To mitigate the Corporation’s exposure to fluctuations in crude oil prices, the Corporation periodically enters into commodity risk management contracts to partially manage its exposure on blend sales and condensate purchases.

22
The Corporation had the following commodity risk management contracts relating to crude oil sales outstanding:
As at March 31, 2017
Volumes (bbls/d)
(1) Term
Average Price (US$/bbl)
(1)
Fixed Price:
WTI Fixed Price 9,500 Apr 1, 2017 – Jun 30, 2017 $53.98
WTI Fixed Price 22,100 Jul 1, 2017 – Dec 31, 2017 $55.15
WCS Fixed Differential 55,365 Apr 1, 2017 – Jun 30, 2017 $(14.88)
WCS Fixed Differential 42,000 Jul 1, 2017 – Sep 30, 2017 $(15.30)
WCS Fixed Differential 40,000 Oct 1, 2017 – Dec 31, 2017 $(15.33)
Collars:
WTI Collars 47,250 Apr 1, 2017 – Jun 30, 2017 $45.71 – $54.61
WTI Collars 30,500 Jul 1, 2017 – Dec 31, 2017 $47.87 – $58.57
The Corporation has entered into the following commodity risk management contracts relating to crude oil sales subsequent to March 31, 2017:
Subsequent to March 31, 2017 Volumes
(bbls/d) (1)
Term Average Price (US$/bbl)
(1)
Fixed Price:
WTI Fixed Price 2,000 Jul 1, 2017 – Dec 31, 2017 $54.20
WCS Fixed Differential 8,000 Jul 1, 2017 – Sep 30, 2017 $(14.43)
WCS Fixed Differential 14,600 Oct 1, 2017 – Dec 31, 2017 $(14.64)
Collars:
WTI Collars 6,000 Jan 1, 2018 – Mar 31, 2018 $50.00 – $56.81
(1) The volumes and prices in the above tables represent averages for various contracts with differing terms and prices. The average price for the portfolio may not have the same payment profile as the individual contracts and are provided for indicative purposes.
The Corporation enters into commodity risk management contracts that effectively fix the average condensate prices at Mont Belvieu, Texas as a percentage of WTI. The Corporation had the following commodity risk management contracts relating to condensate purchases outstanding:
As at March 31, 2017
Volumes
(bbls/d) Term
Average % of WTI
Mont Belvieu fixed % of WTI 15,150 Apr 1, 2017 – Dec 31, 2017 82.9%
Interest Rate Risk Management
The Corporation is exposed to interest rate cash flow risk on its floating rate long‐term debt and periodically enters into interest rate swap contracts to manage its floating to fixed interest rate mix on long‐term debt. During the three months ended March 31, 2016, the Corporation had interest rate swap contracts in place to effectively fix the interest rate at approximately 4.4% on US$748.0 million of the $1.245 billion senior secured term loan. These interest rate swap contracts expired on September 30, 2016. The Corporation does not have any outstanding interest rate swap contracts as at March 31, 2017.

23
Cash Flow Summary
Three months ended March 31
($000) 2017 2016
Net cash provided by (used in):
Operating activities $ 45,806 $ (220,671)
Investing activities (63,936) (47,562)
Financing activities 413,600 (4,213)
Effect of exchange rate changes on cash and cash equivalents held in foreign currency (2,719) (11,207)
Change in cash and cash equivalents $ 392,751 $ (283,653)
Cash Flow – Operating Activities
Net cash provided by operating activities totalled $45.8 million for the three months ended March 31, 2017 compared to net cash used in operating activities of $220.7 million for the three months ended March 31, 2016. This increase in cash flows is primarily due to higher bitumen realization, primarily as a result of the quarter-over-quarter increase in average U.S. crude oil benchmark pricing.
Cash Flow – Investing Activities
Net cash used in investing activities was $63.9 million for the three months ended March 31, 2017 compared to $47.6 million for the three months ended March 31, 2016. The increase in net cash used in investing activities is primarily due to increased capital spending activity directed toward the eMSAGP growth initiative at Christina Lake Phase 2B for the three months ended March 31, 2017.
Cash Flow – Financing Activities
Net cash provided by financing activities was $413.6 million for the three months ended March 31, 2017 compared to net cash used in financing activities of $4.2 million for the three months ended March 31, 2016. Net cash provided by financing activities increased primarily due to $496.3 million of net equity issuance proceeds, partially offset by costs of $82.1 million paid as part of the comprehensive refinancing plan that closed on January 27, 2017.
9. SHARES OUTSTANDING
As at March 31, 2017, the Corporation had the following share capital instruments outstanding or exercisable:
Outstanding
Common shares 293,282,107
Convertible securities
Stock options(1)
8,940,877
Equity-settled RSUs and PSUs 1,557,010
(1) 5,645,600 stock options were exercisable as at March 31, 2017.
On January 27, 2017, the Corporation issued 66,815,000 common shares at a price $7.75 per common share.
As at May 3, 2017, the Corporation had 293,282,107 common shares, 8,910,110 stock options and 1,501,821 equity-settled restricted share units and equity-settled performance share units outstanding, and 5,620,600 stock options exercisable.

24
10. CONTRACTUAL OBLIGATIONS AND COMMITMENTS
The information presented in the table below reflects management’s estimate of the contractual maturities of the Corporation’s obligations. These maturities may differ significantly from the actual maturities of these obligations. In particular, debt under the senior secured credit facilities, the Senior Secured Second Lien Notes, and the Senior Unsecured Notes may be retired earlier due to mandatory repayments or redemptions.
($000) 2017 2018 2019 2020 2021 Thereafter
Long-term debt(1)
$ 12,340 $ 16,453 $ 16,453 $ 16,453 $ 16,453 $ 4,964,225
Interest on long-term debt(1)
212,710 283,126 282,549 281,973 281,398 592,458
Decommissioning obligation(2)
1,040 6,252 7,059 5,916 2,857 798,939
Transportation and storage(3)
136,419 204,056 202,790 254,259 313,930 3,988,980
Office lease rentals(4)
24,972 32,091 32,121 33,037 33,435 230,483
Diluent purchases(5)
190,228 41,146 20,563 20,619 20,563 37,664
Other commitments(6)
30,346 9,536 12,089 12,490 11,688 75,077
Total $ 608,055 $ 592,660 $ 573,624 $ 624,747 $ 680,324 $10,687,826
(1) This represents the scheduled principal repayments of the senior secured term loan, the Senior Secured Second Lien Notes, the Senior Unsecured Notes, and associated interest payments based on interest and foreign exchange rates in effect on March 31, 2017.
(2) This represents the undiscounted future obligations associated with the decommissioning of the Corporation’s crude oil, transportation and storage assets.
(3) This represents transportation and storage commitments from 2017 to 2042, including various pipeline commitments which are awaiting regulatory approval.
(4) This represents the future gross lease commitments for the Corporation’s corporate offices. (5) This represents the future commitments associated with the Corporation’s diluent purchases. (6) This represents the future commitments associated with the Corporation’s capital program and other operating and
maintenance commitments.
11. NON-GAAP MEASURES
Certain financial measures in this MD&A including: net marketing activity, funds flow, adjusted funds flow, operating earnings (loss), operating cash flow and total debt are non-GAAP measures. These terms are not defined by IFRS and, therefore, may not be comparable to similar measures provided by other companies. These non-GAAP financial measures should not be considered in isolation or as an alternative for measures of performance prepared in accordance with IFRS.
Net Marketing Activity
Net marketing activity is a non-GAAP measure which the Corporation uses to analyze the returns on the sale of third-party crude oil and related products through various marketing and storage arrangements. Net Marketing Activity represents the Corporation’s third-party petroleum sales less the cost of purchased product and storage arrangements. Petroleum revenue – third party is disclosed in Note 12 in the Notes to the Interim Consolidated Financial Statements and purchased product and storage is presented as a line item on the Consolidated Statement of Earnings and Comprehensive Income.
Funds Flow and Adjusted Funds Flow
Funds flow and adjusted funds flow are non-GAAP measures utilized by the Corporation to analyze operating performance and liquidity. Funds flow excludes the net change in non-cash operating working capital while the IFRS measurement “net cash provided by (used in) operating activities” includes these items. Adjusted funds flow excludes the net change in non-cash operating working capital, payments on onerous contracts, and

25
decommissioning expenditures while the IFRS measurement "net cash provided by (used in) operating activities" includes these items. Funds flow and adjusted funds flow are not intended to represent net cash provided by (used in) operating activities calculated in accordance with IFRS. Funds flow and adjusted funds flow are reconciled to net cash provided by (used in) operating activities in the table below.
Three months ended March 31
($000) 2017 2016
Net cash provided by (used in) operating activities $ 45,806 $ (220,671)
Net change in non-cash operating working capital items (8,187) 87,840
Funds flow 37,619 (132,831)
Adjustments:
Payments on onerous contracts 4,134 629
Decommissioning expenditures 1,422 962
Adjusted funds flow $ 43,175 $ (131,240)
Operating Earnings (Loss)
Operating earnings (loss) is a non-GAAP measure which the Corporation uses as a performance measure to provide comparability of financial performance between periods by excluding non-operating items. Operating earnings (loss) is defined as net earnings (loss) as reported, excluding unrealized foreign exchange gains and losses, unrealized gains and losses on derivative financial instruments, unrealized gains and losses on commodity risk management, onerous contracts expense, and the respective deferred tax impact on these adjustments. Operating earnings (loss) is reconciled to "Net earnings (loss)", the nearest IFRS measure, in the table below.
Three months ended March 31
($000) 2017 2016
Net earnings (loss) $ 1,588 $ 130,829
Adjustments:
Unrealized net loss (gain) on foreign exchange(1)
(36,707) (320,281)
Unrealized loss (gain) on derivative financial liabilities(2)
(2,241) 5,489
Unrealized loss (gain) on commodity risk management(3)
(59,599) (16,963)
Onerous contracts expense(4)
2,375 4,371
Deferred tax expense (recovery) relating to these adjustments 15,230 (731)
Operating earnings (loss) $ (79,354) $ (197,286)
(1) Unrealized net foreign exchange gains and losses result from the translation of U.S. dollar denominated long-term debt and cash and cash equivalents using period-end exchange rates.
(2) Unrealized gains and losses on derivative financial liabilities result from the interest rate floor on the Corporation's long-term debt and interest rate swaps entered into to effectively fix a portion of its variable rate long-term debt.
(3) Unrealized gains or losses on commodity risk management contracts represent the change in the mark-to-market position of the unsettled commodity risk management contracts during the period.
(4) During the three months ended March 31, 2017, onerous contracts expense was recognized primarily due to changes in estimated future cash flow sublease recoveries related to the onerous office lease provision for certain corporate office building lease contracts. During the three months ended March 31, 2016, onerous contracts expenses were recognized primarily due to the reduction of the Corporation’s capital program for 2016 and its impact on drilling contracts.

26
Operating Cash Flow
Operating cash flow is a non-GAAP measure widely used in the oil and gas industry as a supplemental measure of a company’s efficiency and its ability to fund future capital investments. The Corporation’s operating cash flow is calculated by deducting the related diluent expense, transportation, field operating costs, royalties and realized commodity risk management gains or losses from proprietary blend sales revenue and power revenue. The per-unit calculation of operating cash flow, defined as cash operating netback, is calculated by deducting the related diluent expense, transportation, operating expenses, royalties and realized commodity risk management gains or losses from proprietary blend revenue and power revenue, on a per barrel of bitumen sales volume basis.
Total Debt
Total debt is a non-GAAP measure which is used by the Corporation to analyze leverage and liquidity. The Corporation’s total debt is defined as long-term debt as reported, excluding the debt redemption premium, the current portion of the senior secured term loan, the unamortized financial derivative liability discount, and the unamortized deferred debt discount and debt issue costs. Total debt is reconciled to long-term debt in the table below.
($000) March 31, 2017 December 31, 2016
Long-term debt $ 4,944,741 $ 5,053,239
Adjustments:
Debt redemption premium - (21,812)
Current portion of senior secured term loan 16,453 17,455
Unamortized financial derivative liability discount 20,112 11,143
Unamortized deferred debt discount and debt issue costs 61,071 22,766
Total debt $ 5,042,377 $ 5,082,791
12. CRITICAL ACCOUNTING POLICIES AND ESTIMATES
The Corporation's critical accounting estimates are those estimates having a significant impact on the Corporation's financial position and operations and that require management to make judgments, assumptions and estimates in the application of IFRS. Judgments, assumptions and estimates are based on historical experience and other factors that management believes to be reasonable under current conditions. As events occur and additional information is obtained, these judgments, assumptions and estimates may be subject to change.
For a detailed discussion regarding the Corporation’s critical accounting policies and estimates, please refer to the Corporation’s 2016 annual MD&A.
13. TRANSACTIONS WITH RELATED PARTIES
The Corporation did not enter into any significant related party transactions during the three months ended March 31, 2017 and March 31, 2016, other than compensation of key management personnel. The Corporation considers directors and executive officers of the Corporation as key management personnel.
14. OFF-BALANCE SHEET ARRANGEMENTS
As at March 31, 2017 and December 31, 2016, the Corporation did not have any off-balance sheet arrangements. The Corporation has certain operating or rental lease agreements, as disclosed in the “CONTRACTUAL OBLIGATIONS AND COMMITMENTS” section of this MD&A, which are entered into in the normal course of operations. Payments of these leases are included as an expense as incurred over the lease term. No asset or liability value had been assigned to these leases as at March 31, 2017 and December 31, 2016.

27
15. NEW ACCOUNTING STANDARDS
The Corporation has adopted the following revised accounting standards effective January 1, 2017:
IAS 7 Statement of Cash Flows, has been amended to require additional disclosures for changes in liabilities arising from financing activities. This includes changes arising from cash flows and non-cash changes.
IAS 12 Income Taxes, has been amended to clarify the recognition of deferred tax assets relating to unrealized losses.
Accounting standards issued but not yet applied
The IASB has issued the following standards which are not yet effective:
In January 2016, the IASB issued IFRS 16 Leases, which will replace IAS 17 Leases. Under IFRS 16, a single recognition and measurement model will apply for lessees, which will require recognition of lease assets and lease obligations on the balance sheet. The standard eliminates the classification of leases as either operating leases or finance leases for lessees, essentially treating all leases as finance leases. Short-term leases and leases for low-value assets are exempt from recognition and will continue to be treated as operating leases. The accounting requirements for lessors is substantially unchanged and a lessor will continue to classify leases as either finance leases or operating leases, but disclosure requirements are enhanced. The standard is effective for annual periods beginning on or after January 1, 2019, with early adoption permitted if IFRS 15 has been adopted. The standard may be applied retrospectively or using a modified retrospective approach. IFRS 16 will be adopted by the Corporation on January 1, 2019 and the Corporation is currently assessing and evaluating the impact of the standard on the consolidated financial statements.
In July 2014, the IASB issued IFRS 9 Financial Instruments, which is intended to replace IAS 39 Financial Instruments: Recognition and Measurement. IFRS 9 uses a single approach to determine whether a financial asset is measured at amortized cost or fair value, replacing the multiple rules in IAS 39. The accounting treatment of financial liabilities in IFRS 9 is essentially unchanged from IAS 39, except for financial liabilities designated at fair value through profit or loss, whereby an entity can recognize the portion of the change in fair value related to the change in the entity’s own credit risk through other comprehensive income rather than net earnings. The standard also introduces a new expected credit loss impairment model for financial assets. In addition, IFRS 9 incorporates new hedge accounting requirements that more closely aligns with risk management activities. IFRS 9 is effective for annual periods beginning on or after January 1, 2018 with early adoption permitted. IFRS 9 will be adopted by the Corporation on January 1, 2018 and the Corporation is currently assessing and evaluating the impact of the standard on the consolidated financial statements.
In May 2014, the IASB issued IFRS 15 Revenue from Contracts with Customers, which will replace IAS 11 Construction Contracts and IAS 18 Revenue and the related interpretations on revenue recognition. IFRS 15 provides a comprehensive revenue recognition and measurement framework that applies to all contracts with customers. The new standard is effective for annual periods beginning on or after January 1, 2018 with early adoption permitted. IFRS 15 will be adopted by the Corporation on January 1, 2018 and the Corporation is currently assessing and evaluating the impact of the standard on the consolidated financial statements.
On June 20, 2016, the IASB issued amendments to IFRS 2 Share-based Payment, relating to classification and measurement of particular share-based payment transactions. The amendments are effective for periods beginning on or after January 1, 2018. The Corporation is currently assessing the impact of the adoption of these amendments on the Corporation’s consolidated financial statements.

28
16. RISK FACTORS
The Corporation's primary focus is on the ongoing development and operation of its oil sands assets. In developing and operating these assets, the Corporation is and will be subject to many risks, including construction risks, operations risks, project development risks and political-economic risks. Further information regarding the risk factors which may affect the Corporation is contained in the most recently filed Annual Information Form, which is available on the Corporation’s website at www.megenergy.com and is also available on the SEDAR website at www.sedar.com.
17. DISCLOSURE CONTROLS AND PROCEDURES
The Corporation’s Chief Executive Officer (“CEO”) and Chief Financial Officer (“CFO”) have designed, or caused to be designed under their supervision, disclosure controls and procedures to provide reasonable assurance that: (i) material information relating to the Corporation is made known to the Corporation’s CEO and CFO by others, particularly during the period in which the annual filings are being prepared; and (ii) information required to be disclosed by the Corporation in its annual filings, interim filings or other reports filed or submitted by it under securities legislation is recorded, processed, summarized and reported within the time period specified in securities legislation.
18. INTERNAL CONTROLS OVER FINANCIAL REPORTING
The CEO and CFO have designed, or caused to be designed under their supervision, internal controls over financial reporting to provide reasonable assurance regarding the reliability of the Corporation’s financial reporting and the preparation of financial statements for external purposes in accordance with IFRS.
The CEO and CFO are required to cause the Corporation to disclose any change in the Corporation’s internal controls over financial reporting that occurred during the most recent interim period that has materially affected, or is reasonably likely to materially affect, the Corporation’s internal controls over financial reporting. No changes in internal controls over financial reporting were identified during such period that have materially affected, or are reasonably likely to materially affect, the Corporation’s internal controls over financial reporting.
It should be noted that a control system, including the Corporation’s disclosure and internal controls and procedures, no matter how well conceived, can provide only reasonable, but not absolute, assurance that the objectives of the control system will be met and it should not be expected that the disclosure and internal controls and procedures will prevent all errors or fraud. In reaching a reasonable level of assurance, management necessarily is required to apply its judgment in evaluating the cost/benefit relationship of possible controls and procedures.
29
19. ABBREVIATIONS
The following provides a summary of common abbreviations used in this document:
Financial and Business Environment
Measurement
AECO Alberta natural gas price reference location bbl barrel
AIF Annual Information Form bbls/d barrels per day
AWB Access Western Blend mcf thousand cubic feet
$ or C$ Canadian dollars mcf/d thousand cubic feet per day
DSU Deferred share units MW megawatts
EDC Export Development Canada MW/h megawatts per hour
eMSAGP enhanced Modified Steam And Gas Push
GAAP Generally Accepted Accounting Principles
IFRS International Financial Reporting Standards
LIBOR London Interbank Offered Rate
MD&A Management’s Discussion and Analysis
PSU Performance share units
RSU Restricted share units
SAGD Steam-Assisted Gravity Drainage
SOR Steam-oil ratio
U.S. United States
US$ United States dollars
WCS Western Canadian Select
WTI West Texas Intermediate
20. ADVISORY
Forward-Looking Information
This document may contain forward-looking information including but not limited to: expectations of future production, revenues, expenses, cash flow, operating costs, steam-oil ratios, pricing differentials, reliability, profitability and capital investments; estimates of reserves and resources; anticipated reductions in operating costs as a result of optimization and scalability of certain operations; and anticipated sources of funding for operations and capital investments. Such forward-looking information is based on management's expectations and assumptions regarding future growth, results of operations, production, future capital and other expenditures, plans for and results of drilling activity, environmental matters, and business prospects and opportunities.
By its nature, such forward-looking information involves significant known and unknown risks and uncertainties, which could cause actual results to differ materially from those anticipated. These risks include, but are not limited to: risks associated with the oil and gas industry, for example, results securing access to markets and transportation infrastructure; availability of capacity on the electricity transmission grid; uncertainty of reserve and resource estimates; uncertainty associated with estimates and projections relating to production, costs and revenues; health, safety and environmental risks; risks of legislative and regulatory changes to, amongst other things, tax, land use, royalty and environmental laws; assumptions regarding and the volatility of commodity prices, interest rates and foreign exchange rates, and, risks and uncertainties related to commodity price, interest rate and foreign exchange rate swap contracts and/or derivative financial instruments that MEG may enter into from time to time to manage its risk related to such prices and rates; risks and uncertainties associated with securing and maintaining the necessary regulatory approvals and financing to proceed with MEG’s future phases and the expansion and/or operation of MEG’s projects; risks and uncertainties related to the timing of completion, commissioning, and start-up, of MEG’s future phases, expansions and projects; and the operational risks and

30
delays in the development, exploration, production, and the capacities and performance associated with MEG's projects.
Although MEG believes that the assumptions used in such forward-looking information are reasonable, there can be no assurance that such assumptions will be correct. Accordingly, readers are cautioned that the actual results achieved may vary from the forward-looking information provided herein and that the variations may be material. Readers are also cautioned that the foregoing list of assumptions, risks and factors is not exhaustive. Further information regarding the assumptions and risks inherent in the making of forward-looking statements can be found in MEG’s most recently filed Annual Information Form, along with MEG's other public disclosure documents. Copies of the AIF and MEG's other public disclosure documents are available through the SEDAR website which is available at www.sedar.com.
The forward-looking information included in this document is expressly qualified in its entirety by the foregoing cautionary statements. Unless otherwise stated, the forward-looking information included in this document is made as of the date of this document and MEG assumes no obligation to update or revise any forward-looking information to reflect new events or circumstances, except as required by law.
Estimates of Reserves
For information regarding MEG's estimated reserves, please refer to MEG’s AIF.
Non-GAAP Financial Measures
Certain financial measures in this MD&A do not have a standardized meaning as prescribed by IFRS including: net marketing activity, funds flow, adjusted funds flow, operating earnings (loss), operating cash flow and total debt. As such, these measures are considered non-GAAP financial measures. These terms are not defined by IFRS and, therefore, may not be comparable to similar measures provided by other companies. These non-GAAP financial measures should not be considered in isolation or as an alternative for measures of performance prepared in accordance with IFRS. These measures are presented and described in order to provide shareholders and potential investors with additional measures in understanding MEG’s ability to generate funds and to finance its operations as well as profitability measures specific to the oil sands industry. The definition and reconciliation of each non-GAAP measure is presented in the “NON-GAAP MEASURES” section of this MD&A.
21. ADDITIONAL INFORMATION
Additional information relating to the Corporation, including its AIF, is available on MEG’s website at www.megenergy.com and is also available on SEDAR at www.sedar.com.
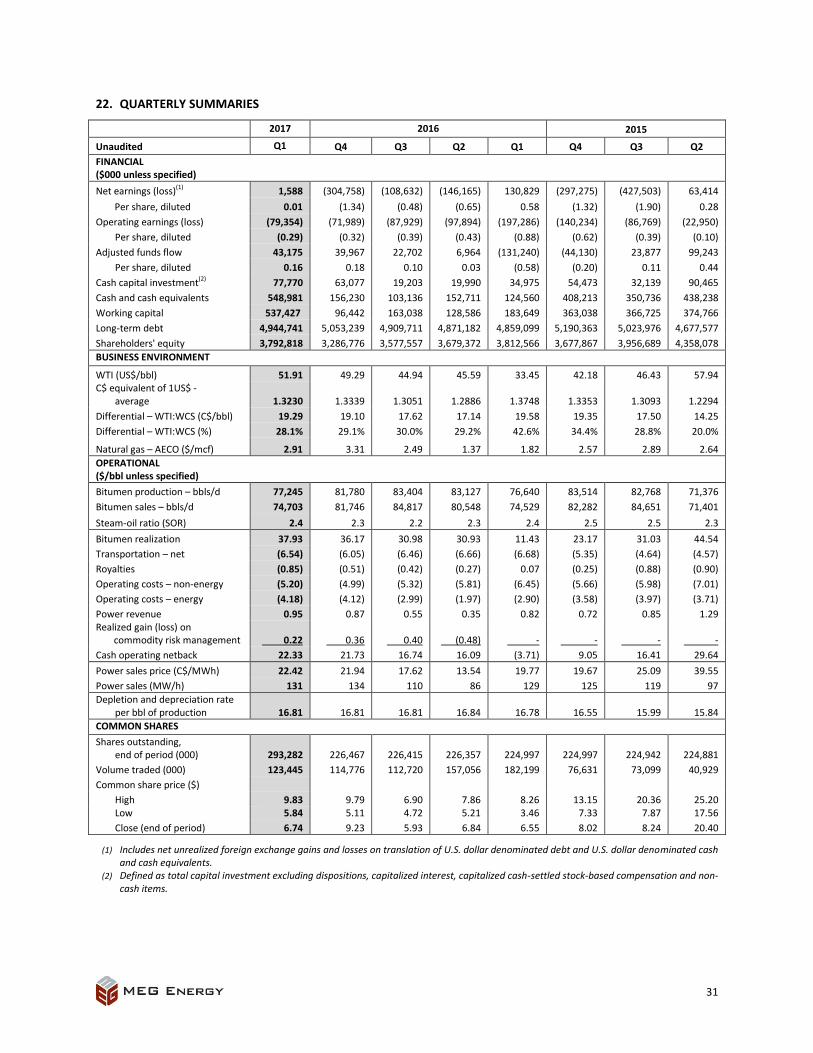
31
22. QUARTERLY SUMMARIES
2017 2016 2015
Unaudited Q1 Q4 Q3 Q2 Q1 Q4 Q3 Q2
FINANCIAL ($000 unless specified)
Net earnings (loss)(1) 1,588 (304,758) (108,632) (146,165) 130,829 (297,275) (427,503) 63,414
Per share, diluted 0.01 (1.34) (0.48) (0.65) 0.58 (1.32) (1.90) 0.28
Operating earnings (loss) (79,354) (71,989) (87,929) (97,894) (197,286) (140,234) (86,769) (22,950)
Per share, diluted (0.29) (0.32) (0.39) (0.43) (0.88) (0.62) (0.39) (0.10)
Adjusted funds flow 43,175 39,967 22,702 6,964 (131,240) (44,130) 23,877 99,243
Per share, diluted 0.16 0.18 0.10 0.03 (0.58) (0.20) 0.11 0.44
Cash capital investment(2) 77,770 63,077 19,203 19,990 34,975 54,473 32,139 90,465
Cash and cash equivalents 548,981 156,230 103,136 152,711 124,560 408,213 350,736 438,238
Working capital 537,427 96,442 163,038 128,586 183,649 363,038 366,725 374,766
Long-term debt 4,944,741 5,053,239 4,909,711 4,871,182 4,859,099 5,190,363 5,023,976 4,677,577
Shareholders' equity 3,792,818 3,286,776 3,577,557 3,679,372 3,812,566 3,677,867 3,956,689 4,358,078
BUSINESS ENVIRONMENT
WTI (US$/bbl) 51.91 49.29 44.94 45.59 33.45 42.18 46.43 57.94 C$ equivalent of 1US$ -
average 1.3230 1.3339 1.3051 1.2886 1.3748 1.3353 1.3093 1.2294
Differential – WTI:WCS (C$/bbl) 19.29 19.10 17.62 17.14 19.58 19.35 17.50 14.25
Differential – WTI:WCS (%) 28.1% 29.1% 30.0% 29.2% 42.6% 34.4% 28.8% 20.0%
Natural gas – AECO ($/mcf) 2.91 3.31 2.49 1.37 1.82 2.57 2.89 2.64
OPERATIONAL ($/bbl unless specified)
Bitumen production – bbls/d 77,245 81,780 83,404 83,127 76,640 83,514 82,768 71,376
Bitumen sales – bbls/d 74,703 81,746 84,817 80,548 74,529 82,282 84,651 71,401
Steam-oil ratio (SOR) 2.4 2.3 2.2 2.3 2.4 2.5 2.5 2.3
Bitumen realization 37.93 36.17 30.98 30.93 11.43 23.17 31.03 44.54
Transportation – net (6.54) (6.05) (6.46) (6.66) (6.68) (5.35) (4.64) (4.57)
Royalties (0.85) (0.51) (0.42) (0.27) 0.07 (0.25) (0.88) (0.90)
Operating costs – non-energy (5.20) (4.99) (5.32) (5.81) (6.45) (5.66) (5.98) (7.01)
Operating costs – energy (4.18) (4.12) (2.99) (1.97) (2.90) (3.58) (3.97) (3.71)
Power revenue 0.95 0.87 0.55 0.35 0.82 0.72 0.85 1.29 Realized gain (loss) on commodity risk management 0.22 0.36 0.40 (0.48) - - - -
Cash operating netback 22.33 21.73 16.74 16.09 (3.71) 9.05 16.41 29.64
Power sales price (C$/MWh) 22.42 21.94 17.62 13.54 19.77 19.67 25.09 39.55
Power sales (MW/h) 131 134 110 86 129 125 119 97
Depletion and depreciation rate per bbl of production 16.81 16.81 16.81
16.84 16.78 16.55 15.99 15.84
COMMON SHARES
Shares outstanding, end of period (000) 293,282 226,467 226,415 226,357 224,997 224,997 224,942 224,881
Volume traded (000) 123,445 114,776 112,720 157,056 182,199 76,631 73,099 40,929
Common share price ($)
High 9.83 9.79 6.90 7.86 8.26 13.15 20.36 25.20 Low 5.84 5.11 4.72 5.21 3.46 7.33 7.87 17.56
Close (end of period) 6.74 9.23 5.93 6.84 6.55 8.02 8.24 20.40
(1) Includes net unrealized foreign exchange gains and losses on translation of U.S. dollar denominated debt and U.S. dollar denominated cash and cash equivalents.
(2) Defined as total capital investment excluding dispositions, capitalized interest, capitalized cash-settled stock-based compensation and non-cash items.

32
Interim Consolidated Financial Statements Consolidated Balance Sheet (Unaudited, expressed in thousands of Canadian dollars)
As at Note March 31, 2017 December 31, 2016
Assets
Current assets
Cash and cash equivalents 18 $ 548,981 $ 156,230
Trade receivables and other 207,213 236,989
Inventories 77,879 66,394
Commodity risk management 20 29,287 -
863,360 459,613
Non-current assets
Property, plant and equipment 4 7,621,515 7,639,434
Exploration and evaluation assets 5 548,529 547,752
Other intangible assets 6 15,127 16,111
Other assets 7 150,786 137,370
Deferred income tax asset 17 115,773 120,944
Total assets $ 9,315,090 $ 8,921,224
Liabilities
Current liabilities
Accounts payable and accrued liabilities $ 282,195 $ 292,340
Current portion of long-term debt 8 16,453 17,455
Current portion of provisions and other liabilities 9 27,285 23,063
Commodity risk management 20 - 30,313
325,933 363,171
Non-current liabilities
Long-term debt 8 4,944,741 5,053,239
Provisions and other liabilities 9 251,598 218,038
Total liabilities 5,522,272 5,634,448
Shareholders’ equity
Share capital 10 5,380,725 4,878,607
Contributed surplus 172,046 168,253
Deficit (1,793,479) (1,795,067)
Accumulated other comprehensive income 33,526 34,983
Total shareholders’ equity 3,792,818 3,286,776
Total liabilities and shareholders’ equity $ 9,315,090 $ 8,921,224
Commitments and contingencies (Note 22)
The accompanying notes are an integral part of these Interim Consolidated Financial Statements.

33
Consolidated Statement of Earnings and Comprehensive Income (Unaudited, expressed in thousands of Canadian dollars, except per share amounts)
Three months ended March 31
Note 2017 2016
Revenues
Petroleum revenue, net of royalties 12 $ 550,470 $ 279,624
Other revenue 13 9,309 10,714
559,779 290,338
Expenses
Diluent and transportation 14 281,297 223,363
Operating expenses 63,053 63,388
Purchased product and storage 65,542 28,810
Depletion and depreciation 4,6 116,879 116,993
General and administrative 23,222 27,716
Stock-based compensation 11 2,287 12,892
Research and development 940 1,378
Interest and other income (857) (520)
Commodity risk management loss (gain) 20 (61,111) (16,963)
Foreign exchange loss (gain), net 15 (39,020) (325,947)
Net finance expense 16 92,889 92,667
Onerous contracts expense 2,375 4,371
Earnings before income taxes 12,283 62,190
Income tax expense (recovery) 17 10,695 (68,639)
Net earnings 1,588 130,829
Other comprehensive income (loss), net of tax
Items that may be reclassified to profit or loss:
Foreign currency translation adjustment (1,457) (10,981)
Comprehensive income for the period $ 131 $ 119,848
Net earnings per common share
Basic 19 $ 0.01 $ 0.58
Diluted 19 $ 0.01 $ 0.58
The accompanying notes are an integral part of these Interim Consolidated Financial Statements.

34
Consolidated Statement of Changes in Shareholders’ Equity (Unaudited, expressed in thousands of Canadian dollars)
The accompanying notes are an integral part of these Interim Consolidated Financial Statements.
Note Share Capital
Contributed
Surplus Deficit
Accumulated
Other
Comprehensive
Income
Total
Shareholders’
Equity
Balance as at December 31, 2016 $ 4,878,607 $ 168,253 $ (1,795,067) $ 34,983 $ 3,286,776
Shares issued 10 517,816 - - - 517,816
Share issue costs, net of tax 10 (15,698) - - - (15,698)
Stock-based compensation - 3,793 - - 3,793
Comprehensive income (loss) - - 1,588 (1,457) 131
Balance as at March 31, 2017 $ 5,380,725 $ 172,046 $ (1,793,479) $ 33,526 $ 3,792,818
Balance as at December 31, 2015 $ 4,836,800 $ 171,835 $ (1,366,341) $ 35,573 $ 3,677,867
Stock-based compensation - 14,851 - - 14,851
Comprehensive income (loss) - - 130,829 (10,981) 119,848
Balance as at March 31, 2016 $ 4,836,800 $ 186,686 $ (1,235,512) $ 24,592 $ 3,812,566

35
Consolidated Statement of Cash Flow (Unaudited, expressed in thousands of Canadian dollars)
Three months ended March 31
Note 2017 2016
Cash provided by (used in):
Operating activities
Net earnings $ 1,588 $ 130,829
Adjustments for:
Depletion and depreciation 4,6 116,879 116,993
Stock-based compensation 11 3,510 12,892
Unrealized loss (gain) on foreign exchange 15 (36,707) (320,281)
Unrealized loss (gain) on derivative financial liabilities 16 (2,241) 5,489
Unrealized loss (gain) on risk management 20 (59,599) (16,963)
Onerous contracts 2,375 4,371
Deferred income tax expense (recovery) 17 10,979 (69,156)
Amortization of debt discount and debt issue costs 7,8 5,026 3,003
Other 1,365 1,583
Decommissioning expenditures 9 (1,422) (962)
Payments on onerous contracts (4,134) (629)
Net change in non-cash working capital items 18 8,187 (87,840)
Net cash provided by (used in) operating activities 45,806 (220,671)
Investing activities
Capital investments:
Property, plant and equipment 4 (77,641) (34,009)
Exploration and evaluation 5 (213) (260)
Other intangible assets 6 (2) (706)
Other 9 10,635 (1,239)
Net change in non-cash working capital items 18 3,285 (11,348)
Net cash provided by (used in) investing activities (63,936) (47,562)
Financing activities
Issue of shares, net of issue costs 10 496,312 -
Redemption of senior unsecured notes 8 (1,008,825) -
Issue of senior secured second lien notes 8 1,008,825 -
Payment on term loan 8 (655) (4,213)
Refinancing costs 7,8 (82,057) -
Net cash provided by (used in) financing activities 413,600 (4,213)
Effect of exchange rate changes on cash and cash equivalents
held in foreign currency (2,719) (11,207)
Change in cash and cash equivalents 392,751 (283,653)
Cash and cash equivalents, beginning of period 156,230 408,213
Cash and cash equivalents, end of period $ 548,981 $ 124,560
The accompanying notes are an integral part of these Interim Consolidated Financial Statements.

NOTES TO INTERIM CONSOLIDATED FINANCIAL STATEMENTS All amounts are expressed in thousands of Canadian dollars unless otherwise noted. (Unaudited)
36
1. CORPORATE INFORMATION
MEG Energy Corp. (the "Corporation") was incorporated under the Alberta Business Corporations Act on March 9, 1999. The Corporation's shares trade on the Toronto Stock Exchange ("TSX") under the symbol "MEG". The Corporation owns a 100% interest in over 900 square miles of oil sands leases in the southern Athabasca oil sands region of northern Alberta and is primarily engaged in a steam assisted gravity drainage oil sands development at its 80 section Christina Lake Project. The Corporation also holds a 50% interest in the Access Pipeline, a dual pipeline to transport diluent north from the Edmonton area to the Athabasca oil sands area and a blend of bitumen and diluent south from the Christina Lake Project into the Edmonton area. In addition to the Access Pipeline, the Corporation owns the Stonefell Terminal, located near Edmonton, Alberta, which offers 900,000 barrels of terminalling and storage capacity. The Stonefell Terminal is connected to the Access Pipeline and is also connected by pipeline to a third-party rail-loading terminal. The address of the Corporation’s registered office is 520 - 3rd Avenue SW, Calgary, Alberta, Canada.
2. BASIS OF PRESENTATION
The unaudited interim consolidated financial statements (“interim consolidated financial statements”) were prepared using the same accounting policies and methods as those used in the Corporation’s audited consolidated financial statements for the year ended December 31, 2016. The interim consolidated financial statements are in compliance with International Accounting Standard 34, Interim Financial Reporting (“IAS 34”). Accordingly, certain information and footnote disclosure normally included in annual financial statements prepared in accordance with International Financial Reporting Standards (“IFRS”), as issued by the International Accounting Standards Board ("IASB"), have been omitted or condensed. The preparation of interim consolidated financial statements in accordance with IAS 34 requires the use of certain critical accounting estimates. It also requires management to exercise judgment in applying the Corporation’s accounting policies. The areas involving a higher degree of judgment or complexity, or areas where assumptions and estimates are significant to the consolidated financial statements, have been set out in Note 4 of the Corporation’s audited consolidated financial statements for the year ended December 31, 2016. These interim consolidated financial statements should be read in conjunction with the Corporation’s audited consolidated financial statements for the year ended December 31, 2016.
These interim consolidated financial statements are presented in Canadian dollars ($ or C$), which is the Corporation’s functional currency. The Corporation’s operations are aggregated into one operating segment for reporting, consistent with the internal reporting provided to the chief operating decision-maker of the Corporation.
These interim consolidated financial statements were approved by the Corporation’s Audit Committee on May 10, 2017.

37
3. CHANGE IN ACCOUNTING POLICIES
New accounting standards
The Corporation has adopted the following revised standards effective January 1, 2017:
IAS 7, Statement of Cash Flows, has been amended by the IASB as part of its disclosure initiative to require additional disclosure for changes in liabilities arising from financing activities. This includes changes arising from cash flows and non-cash changes. Additional disclosures for changes in liabilities arising from financing activities has been included in Note 8. As allowed by IAS 7, comparative information has not been presented.
IAS 12, Income Taxes, has been amended to clarify the recognition of deferred tax assets relating to unrealized losses.
Accounting standards issued but not yet applied
In January 2016, the IASB issued IFRS 16 Leases, which will replace IAS 17 Leases. Under IFRS 16, a single recognition and measurement model will apply for lessees, which will require recognition of lease assets and lease obligations on the balance sheet. The standard eliminates the classification of leases as either operating leases or finance leases for lessees, essentially treating all leases as finance leases. Short-term leases and leases for low-value assets are exempt from recognition and will continue to be treated as operating leases. The accounting requirements for lessors is substantially unchanged and a lessor will continue to classify leases as either finance leases or operating leases, but disclosure requirements are enhanced. The standard is effective for annual periods beginning on or after January 1, 2019, with early adoption permitted if IFRS 15 has been adopted. The standard may be applied retrospectively or using a modified retrospective approach. IFRS 16 will be adopted by the Corporation on January 1, 2019 and the Corporation is currently assessing and evaluating the impact of the standard on the consolidated financial statements. In July 2014, the IASB issued IFRS 9 Financial Instruments, which is intended to replace IAS 39 Financial Instruments: Recognition and Measurement. IFRS 9 uses a single approach to determine whether a financial asset is measured at amortized cost or fair value, replacing the multiple rules in IAS 39. The accounting treatment of financial liabilities in IFRS 9 is essentially unchanged from IAS 39, except for financial liabilities designated at fair value through profit or loss, whereby an entity can recognize the portion of the change in fair value related to the change in the entity’s own credit risk through other comprehensive income rather than net earnings. The standard also introduces a new expected credit loss impairment model for financial assets. In addition, IFRS 9 incorporates new hedge accounting requirements that more closely aligns with risk management activities. IFRS 9 is effective for annual periods beginning on or after January 1, 2018, with early adoption permitted. IFRS 9 will be adopted by the Corporation on January 1, 2018 and the Corporation is currently assessing and evaluating the impact of the standard on the consolidated financial statements. In May 2014, the IASB issued IFRS 15 Revenue from Contracts with Customers, which will replace IAS 11 Construction Contracts and IAS 18 Revenue and the related interpretations on revenue recognition. IFRS 15 provides a comprehensive revenue recognition and measurement framework that applies to all contracts with customers. The new standard is effective for annual periods beginning on or after January 1, 2018, with early adoption permitted. IFRS 15 will be adopted by the Corporation on January 1, 2018 and the Corporation is currently assessing and evaluating the impact of the standard on the consolidated financial statements. On June 20, 2016, the IASB issued amendments to IFRS 2 Share-based Payment, relating to classification and measurement of particular share-based payment transactions. The amendments are effective for periods beginning on or after January 1, 2018. The Corporation is currently assessing the impact of the adoption of these amendments on the Corporation’s consolidated financial statements.

38
4. PROPERTY, PLANT AND EQUIPMENT
Crude oil
Transportation
and storage
Corporate
assets Total
Cost
Balance as at December 31, 2015 $ 7,768,244 $ 1,605,547 $ 51,076 $ 9,424,867
Additions 115,832 4,544 4,907 125,283
Derecognition (3,641) - - (3,641)
Change in decommissioning liabilities (2,426) 27 - (2,399)
Balance as at December 31, 2016 $ 7,878,009 $ 1,610,118 $ 55,983 $ 9,544,110
Additions 68,248 701 8,930 77,879
Change in decommissioning liabilities 19,216 879 - 20,095
Balance as at March 31, 2017 $ 7,965,473 $ 1,611,698 $ 64,913 $ 9,642,084
Accumulated depletion and depreciation
Balance as at December 31, 2015 $ 1,310,669 $ 80,340 $ 22,098 $ 1,413,107
Depletion and depreciation 459,681 30,493 5,036 495,210
Derecognition (3,641) - - (3,641)
Balance as at December 31, 2016 $ 1,766,709 $ 110,833 $ 27,134 $ 1,904,676
Depletion and depreciation 107,272 7,438 1,183 115,893
Balance as at March 31, 2017 $ 1,873,981 $ 118,271 $ 28,317 $ 2,020,569
Carrying amounts
Balance as at December 31, 2016 $ 6,111,300 $ 1,499,285 $ 28,849 $ 7,639,434
Balance as at March 31, 2017 $ 6,091,492 $ 1,493,427 $ 36,596 $ 7,621,515
As at March 31, 2017, $549.1 million of assets under construction were included within property, plant and equipment (December 31, 2016 - $547.9 million). Assets under construction are not subject to depletion and depreciation. As at March 31, 2017, no impairment has been recognized on property, plant and equipment.
5. EXPLORATION AND EVALUATION ASSETS
Cost
Balance as at December 31, 2015 $ 546,421
Additions 2,265
Exploration expense (1,248)
Change in decommissioning liabilities 314
Balance as at December 31, 2016 $ 547,752
Additions 213
Change in decommissioning liabilities 564
Balance as at March 31, 2017 $ 548,529
Exploration and evaluation assets consist of exploration projects which are pending the determination of proved or probable reserves. These assets are not subject to depletion, as they are in the exploration and evaluation stage, but are reviewed on a quarterly basis for any indication of impairment. As at March 31, 2017, no impairment has been recognized on exploration and evaluation assets.

39
6. OTHER INTANGIBLE ASSETS
Cost
Balance as at December 31, 2015 $ 96,278
Additions 16,643
Balance as at December 31, 2016 $ 112,921
Additions 2
Balance as at March 31, 2017 $ 112,923
Accumulated depreciation
Balance as at December 31, 2015 $ 12,136
Impairment 80,072
Depreciation 4,602
Balance as at December 31, 2016 $ 96,810
Depreciation 986
Balance as at March 31, 2017 $ 97,796
Carrying amounts
Balance as at December 31, 2016 $ 16,111
Balance as at March 31, 2017 $ 15,127
At December 31, 2016, the Corporation evaluated its investment in the right to participate in the Northern Gateway pipeline for impairment in relation to the December 2016 directive from the Government of Canada to the National Energy Board to dismiss the project application. As a result, the Corporation fully impaired its investment in the Northern Gateway pipeline in the fourth quarter of 2016 and recognized an impairment charge of $80.1 million.
As at March 31, 2017, other intangible assets consist of $15.1 million invested in software that is not an integral component of the related computer hardware (December 31, 2016 - $16.1 million). As at March 31, 2017, no impairment has been recognized on these assets.
7. OTHER ASSETS
As at March 31, 2017 December 31, 2016
Long-term pipeline linefill(a)
$ 129,008 $ 129,733
Deferred financing costs(b)
30,373 12,001
159,381 141,734
Less current portion of deferred financing costs (8,595) (4,364)
$ 150,786 $ 137,370
(a) The Corporation has entered into agreements to transport diluent and bitumen blend on third-party owned pipelines and is required to supply linefill for these pipelines. As these pipelines are owned by third-parties, the linefill is not considered to be a component of the Corporation's property, plant and equipment. The linefill is classified as a long-term asset as these transportation contracts extend to 2024. As at March 31, 2017, no impairment has been recognized on these assets.
(b) During the first quarter of 2017, the Corporation recognized deferred financing costs on modifications to its revolving credit facility and guaranteed letter of credit facility of $17.3 million and $2.9 million, respectively.

40
8. LONG-TERM DEBT
As at March 31, 2017 December 31, 2016
Senior secured term loan (March 31, 2017 – US$1.235 billion; due 2023; December 31, 2016 – US$1.236 billion) $ 1,645,267 $ 1,658,906
6.5% senior secured second lien notes (US$750.0 million; due 2025) 999,150 -
6.5% senior unsecured notes (US$750.0 million; due 2021) - 1,007,025
6.375% senior unsecured notes (US$800.0 million; due 2023) 1,065,760 1,074,160
7.0% senior unsecured notes (US$1.0 billion; due 2024) 1,332,200 1,342,700
5,042,377 5,082,791
Less unamortized financial derivative liability discount (20,112) (11,143)
Less unamortized deferred debt discount and debt issue costs (61,071) (22,766)
Debt redemption premium - 21,812
4,961,194 5,070,694
Less current portion of senior secured term loan (16,453) (17,455)
$ 4,944,741 $ 5,053,239
The U.S. dollar denominated debt was translated into Canadian dollars at the period end exchange rate of US$1 = C$1.3322 (December 31, 2016 - US$1 = C$1.3427).
Effective January 27, 2017, the Corporation extended the maturity date on substantially all of its commitments under the Corporation’s covenant-lite revolving credit facility from November 2019 to November 2021. The commitment amount of the five-year facility has been reduced from US$2.5 billion to US$1.4 billion. As at March 31, 2017, no amount has been drawn under the revolving credit facility.
Effective January 27, 2017, the Corporation refinanced and extended the maturity date of its US$1.2 billion term loan from March 2020 to December 2023. The term loan bears interest at an annual rate based on either U.S. Prime or LIBOR, at the Corporation’s option, plus a credit spread of 2.5% or 3.5%, respectively. The term loan also has a U.S. Prime Rate floor of 2.0% and a LIBOR floor of 1.0%. The term loan is to be repaid in quarterly installment payments of US$3.1 million, with the balance due on December 31, 2023. The term loan was issued at a price equal to 99.75% of its face value. The Corporation has deferred the debt discount and the associated debt issue costs of $22.0 million and is amortizing these costs over the life of the loan utilizing the effective interest method.
On February 15, 2017, the Corporation extended the maturity date on the Corporation’s five-year letter of credit facility, guaranteed by Export Development Canada, from November 2019 to November 2021. The guaranteed letter of credit facility has been reduced from US$500 million to US$440 million. Letters of credit under this facility do not consume capacity of the revolving credit facility. As at March 31, 2017, letters of credit of US$296 million had been issued under this facility.
The amendments to the revolving credit facility, term loan and guaranteed letter of credit facility were not considered to be new financial liabilities, as no substantial modifications arose between the existing and amended agreements. As a result, no profit or loss was recognized when the terms of the financial liabilities were amended.
Effective January 27, 2017, the Corporation issued US$750 million in aggregate principal amount of 6.5% Senior Secured Second Lien Notes, with a maturity date of January 2025. Interest is paid semi-annually in January and July. No principal payments are required until 2025. The Corporation has deferred the associated

41
debt issue costs of $18.1 million and is amortizing these costs over the life of the notes utilizing the effective interest method.
On March 15, 2017, the Corporation redeemed the previously outstanding US$750 million aggregate principal amount of 6.5% Senior Unsecured Notes due 2021, utilizing the proceeds received from the issuance of the US$750 million, 6.5% Senior Secured Second Lien Notes, which were held in escrow subject to the redemption. The 2.166% debt redemption premium of $21.8 million and associated remaining unamortized deferred debt issue costs of $7.0 million were recognized as debt extinguishment expense in the fourth quarter of 2016.
All of the Corporation’s long-term debt is “covenant-lite” in structure, meaning it is free of any financial maintenance covenants and is not dependent on, nor calculated from, the Corporation’s crude oil reserves.
The following table reconciles liabilities to cash flows arising from financing activities:
Long-term debt
Balance as at December 31, 2016 $ 5,070,694
Cash changes:
Debt refinancing costs(a)
(61,885)
Redemption of senior unsecured notes (1,008,825)
Issue of senior secured second lien notes 1,008,825
Payment on term loan (655)
Non-cash changes:
Unrealized loss (gain) on foreign exchange (39,758)
Change in fair value of financial derivative liability (10,426)
Amortization of financial derivative liability discount 1,457
Amortization of deferred debt discount and debt issue costs 1,767
Balance as at March 31, 2017 $ 4,961,194
(a) During the first quarter of 2017, comprehensive debt refinancing costs of $82.1 million were paid, including $61.9 million for the refinancing and maturity extension of the Corporation’s US$1.2 billion term loan and replacement of the Corporation’s US$750 million Senior Unsecured Notes with US$750 million Senior Secured Second Lien Notes. Refinancing costs related to amendments and extensions to the revolving credit facility and to the guaranteed letter of credit facility of $17.3 million and $2.9 million respectively, have been recognized as a component of other assets (Note 7).
9. PROVISIONS AND OTHER LIABILITIES
As at March 31, 2017 December 31, 2016
Decommissioning provision(a)
$ 154,853 $ 133,924
Onerous contracts provision(b)
98,563 100,159
Derivative financial liabilities(c)
11,899 3,714
Deferred lease inducements(d)
13,568 3,304
Provisions and other liabilities 278,883 241,101
Less current portion (27,285) (23,063)
Non-current portion $ 251,598 $ 218,038

42
(a) Decommissioning provision:
The following table presents the decommissioning provision associated with the reclamation and abandonment of the Corporation’s property, plant and equipment and exploration and evaluation assets:
As at March 31, 2017 December 31, 2016
Balance, beginning of year $ 133,924 $ 130,381
Changes in estimated future cash flows 445 (91)
Changes in discount rates and settlement dates 18,234 (6,117)
Liabilities incurred 1,980 4,123
Liabilities settled (1,422) (1,290)
Accretion 1,692 6,918
Balance, end of period 154,853 133,924
Less current portion (5,499) (3,097)
Non-current portion $ 149,354 $ 130,827
The decommissioning provision represents the present value of the estimated future costs for the reclamation and abandonment of the Corporation's property, plant and equipment and exploration and evaluation assets. The Corporation has estimated the net present value of the decommissioning obligations using a weighted average credit-adjusted risk-free rate of 7.3% (December 31, 2016 – 8.2%). The decommissioning provision is estimated to be settled in periods up to the year 2066 (December 31, 2016 – periods up to the year 2066).
(b) Onerous contracts provision:
As at March 31, 2017 December 31, 2016
Balance, beginning of year $ 100,159 $ 58,178
Changes in estimated future cash flows 1,714 40,499
Changes in discount rates 661 (1,478)
Liabilities incurred - 8,845
Liabilities settled (4,134) (6,116)
Accretion 163 231
Balance, end of period 98,563 100,159
Less current portion (20,469) (18,930)
Non-current portion $ 78,094 $ 81,229
As at March 31, 2017, the Corporation has recognized a provision of $98.6 million related to onerous operating lease contracts (December 31, 2016 – $100.2 million). The provision represents the present value of the difference between the minimum future payments that the Corporation is obligated to make under the non-cancellable onerous operating lease contracts and estimated recoveries. These cash flows have been discounted using a risk-free discount rate of 1.2% (December 31, 2016 – 1.3%). This estimate may vary as a result of changes in estimated recoveries.
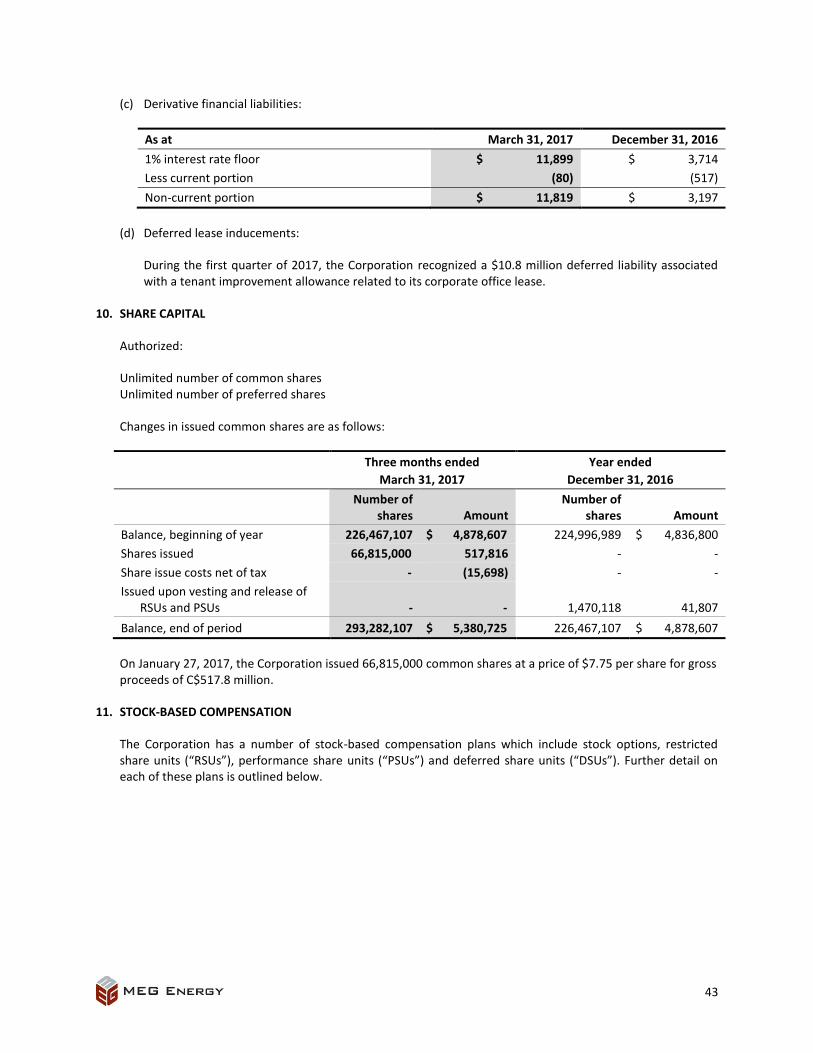
43
(c) Derivative financial liabilities:
As at March 31, 2017 December 31, 2016
1% interest rate floor $ 11,899 $ 3,714
Less current portion (80) (517)
Non-current portion $ 11,819 $ 3,197
(d) Deferred lease inducements:
During the first quarter of 2017, the Corporation recognized a $10.8 million deferred liability associated with a tenant improvement allowance related to its corporate office lease.
10. SHARE CAPITAL
Authorized:
Unlimited number of common shares Unlimited number of preferred shares
Changes in issued common shares are as follows:
Three months ended
March 31, 2017
Year ended
December 31, 2016
Number of shares Amount
Number of shares Amount
Balance, beginning of year 226,467,107 $ 4,878,607 224,996,989 $ 4,836,800
Shares issued 66,815,000 517,816 - -
Share issue costs net of tax - (15,698) - -
Issued upon vesting and release of RSUs and PSUs - - 1,470,118 41,807
Balance, end of period 293,282,107 $ 5,380,725 226,467,107 $ 4,878,607
On January 27, 2017, the Corporation issued 66,815,000 common shares at a price of $7.75 per share for gross proceeds of C$517.8 million.
11. STOCK-BASED COMPENSATION
The Corporation has a number of stock-based compensation plans which include stock options, restricted share units (“RSUs”), performance share units (“PSUs”) and deferred share units (“DSUs”). Further detail on each of these plans is outlined below.

44
(a) Cash-settled plans
i. Restricted share units and performance share units:
In June 2016, the Corporation granted RSUs and PSUs under a new cash-settled Restricted Share Unit Plan. RSUs generally vest over a three-year period while PSUs generally vest on the third anniversary of the grant date, provided that the Corporation satisfies certain performance criteria identified by the Corporation’s Board of Directors within a target range. Upon vesting of the RSUs and PSUs, the participants of the cash-settled RSU plan will receive a cash payment based on the fair value of the underlying share units at the vesting date. The cash-settled RSUs and PSUs are accounted for as liability instruments and are measured at fair value based on the market value of the Corporation’s common shares at each period end. Fluctuations in the fair value are recognized within stock-based compensation expense or capitalized to property, plant and equipment during the period in which they occur.
RSUs and PSUs outstanding:
Three months ended March 31, 2017
Outstanding, beginning of year 6,013,010
Forfeited (337,507)
Outstanding, end of period 5,675,503
ii. Deferred share units outstanding:
The Deferred Share Unit Plan allows for the granting of DSUs to directors of the Corporation. As at March 31, 2017, there were 163,954 DSUs outstanding (December 31, 2016 – 163,954 DSUs outstanding). As at March 31, 2017, the Corporation has recognized a liability of $18.1 million relating to the fair value of RSUs, PSUs and DSUs (December 31, 2016 - $19.2 million).
(b) Equity-settled plans
i. Stock options outstanding:
The Corporation's Stock Option Plan allows for the granting of stock options to directors, officers, employees and consultants of the Corporation. Stock options granted are generally fully exercisable after three years and expire seven years after the grant date.
Three months ended March 31, 2017 Stock options Weighted average
exercise price
Outstanding, beginning of year 9,281,186 $ 27.45
Granted 17,380 7.08
Forfeited (302,689) 24.05
Expired (55,000) 30.11
Outstanding, end of period 8,940,877 $ 27.50

45
ii. Restricted share units and performance share units:
RSUs granted under the equity-settled Restricted Share Unit Plan generally vest annually over a three-year period. PSUs granted under the equity-settled Restricted Share Unit Plan generally vest on the third anniversary of the grant date, provided that the Corporation satisfies certain performance criteria identified by the Corporation’s Board of Directors within a target range.
RSU and PSU grants made prior to June 2016 are captured under the equity-settled plan, whereby upon vesting, the holder receives the right to a cash payment equal to the fair market value of the Corporation's common shares calculated at the date of such payment or, at the election of the Corporation, its equivalent in fully-paid common shares. The Corporation does not intend to make cash payments under the equity-settled RSU plan.
RSUs and PSUs outstanding:
Three months ended March 31, 2017
Outstanding, beginning of year 1,655,606
Forfeited (98,596)
Outstanding, end of period 1,557,010
(c) Stock-based compensation
12. PETROLEUM REVENUE, NET OF ROYALTIES
(a) The Corporation purchases crude oil products from third-parties for marketing-related activities. These purchases and associated storage charges are included in the consolidated statement of earnings and comprehensive income under the caption “Purchased product and storage”.
Three months ended March 31
2017 2016
Cash-settled expense (recovery) $ (1,223) $ -
Equity-settled expense 3,510 12,892
Stock-based compensation $ 2,287 $ 12,892
Three months ended March 31
2017 2016
Petroleum revenue:
Proprietary $ 489,388 $ 250,397
Third-party(a)
66,773 28,730
Petroleum revenue 556,161 279,127
Royalties (5,691) 497
Petroleum revenue, net of royalties $ 550,470 $ 279,624

46
13. OTHER REVENUE
14. DILUENT AND TRANSPORTATION
15. FOREIGN EXCHANGE LOSS (GAIN), NET
16. NET FINANCE EXPENSE
Three months ended March 31
2017 2016
Power revenue $ 6,356 $ 5,554
Transportation revenue 2,953 5,160
Other revenue $ 9,309 $ 10,714
Three months ended March 31
2017 2016
Diluent expense $ 234,399 $ 172,865
Transportation expense 46,898 50,498
Diluent and transportation $ 281,297 $ 223,363
Three months ended March 31
2017 2016
Unrealized foreign exchange loss (gain) on:
Long-term debt $ (39,758) $ (330,093)
Other 3,051 9,812
Unrealized net loss (gain) on foreign exchange (36,707) (320,281)
Realized loss (gain) on foreign exchange (2,313) (5,666)
Foreign exchange loss (gain), net $ (39,020) $ (325,947)
C$ equivalent of 1 US$
Beginning of period 1.3427 1.3840
End of period 1.3322 1.2971
Three months ended March 31
2017 2016
Total interest expense $ 93,274 $ 83,915
Accretion on provisions 1,856 1,694
Unrealized loss (gain) on derivative financial liabilities (2,241) 5,489
Realized loss (gain) on interest rate swaps - 1,569
Net finance expense $ 92,889 $ 92,667

47
17. INCOME TAX EXPENSE (RECOVERY)
Based on the Corporation’s independently evaluated reserve report, the Corporation has recognized a deferred tax asset of $115.8 million on the consolidated balance sheet (December 31, 2016 – $120.9 million). Future taxable income is expected to be sufficient to realize the deferred tax asset. The deferred tax asset is reviewed at each balance sheet date to assess whether it is probable that the related tax benefit will be realized.
18. SUPPLEMENTAL CASH FLOW DISCLOSURES
(a) As at March 31, 2017, C$71.4 million of the Corporation’s total cash and cash equivalents balance was held in U.S. dollars (March 31, 2016 - C$60.1 million). The U.S. dollar cash and cash equivalents balance has been translated into Canadian dollars at the period end exchange rate of US$1 = C$1.3322 (March 31, 2016 - US$1 = C$1.2971).
Three months ended March 31
2017 2016
Current income tax expense (recovery) $ (284) $ 517
Deferred income tax expense (recovery) 10,979 (69,156)
Income tax expense (recovery) $ 10,695 $ (68,639)
Three months ended March 31
2017 2016
Cash provided by (used in):
Trade receivables and other $ 32,734 $ 2,506
Inventories (11,825) (31,391)
Accounts payable and accrued liabilities (9,437) (70,303)
$ 11,472 $ (99,188)
Changes in non-cash working capital relating to:
Operating $ 8,187 $ (87,840)
Investing 3,285 (11,348)
$ 11,472 $ (99,188)
Cash and cash equivalents:(a)
Cash $ 250,410 $ 99,427
Cash equivalents 298,571 25,133
$ 548,981 $ 124,560
Cash interest paid $ 115,983 $ 129,013

48
19. NET EARNINGS PER COMMON SHARE
(a) Weighted average common shares outstanding for the three months ended March 31, 2017 includes 184,425 PSUs not yet released (three months ended March 31, 2016 – 141,930 PSUs).
20. FINANCIAL INSTRUMENTS AND RISK MANAGEMENT
The financial instruments recognized on the consolidated balance sheet are comprised of cash and cash equivalents, trade receivables and other, commodity risk management contracts, accounts payable and accrued liabilities, derivative financial liabilities included within provisions and other liabilities, long-term debt and debt redemption premium liability included within long-term debt. As at March 31, 2017, commodity risk management contracts and derivative financial liabilities were classified as held-for-trading financial instruments; cash and cash equivalents and trade receivables and other were classified as loans and receivables; and accounts payable and accrued liabilities were classified as other financial liabilities. Long-term debt was carried at amortized cost.
The carrying value of cash and cash equivalents, trade receivables and other, and accounts payable and accrued liabilities included on the consolidated balance sheet approximate the fair value of the respective assets and liabilities due to the short-term nature of those instruments.
Three months ended March 31
2017 2016
Net earnings $ 1,588 $ 130,829
Weighted average common shares outstanding(a)
274,164,421 225,138,919
Dilutive effect of stock options, RSUs and PSUs 352,953 241,439
Weighted average common shares outstanding – diluted 274,517,374 225,380,358
Net earnings per share, basic $ 0.01 $ 0.58
Net earnings per share, diluted $ 0.01 $ 0.58

49
(a) Fair value measurement of long-term debt, derivative financial liabilities, commodity risk management contracts and debt redemption premium liability:
Fair value measurements using
As at March 31, 2017 Carrying amount Level 1 Level 2 Level 3
Recurring measurements:
Financial assets
Commodity risk management contracts $ 29,287 $ - $ 29,287 $ -
Financial liabilities
Long-term debt(i)
(Note 8) $ 5,042,377 $ - $ 4,768,744 $ -
Derivative financial liabilities (Note 9) $ 11,899 $ - $ 11,899 $ -
Fair value measurements using
As at December 31, 2016 Carrying amount Level 1 Level 2 Level 3
Recurring measurements:
Financial liabilities
Long-term debt(i)
(Note 8) $ 5,082,791 $ - $ 4,768,344 $ -
Derivative financial liabilities (Note 9) $ 3,714 $ - $ 3,714 $ -
Commodity risk management contracts $ 30,313 $ - $ 30,313 $ -
Debt redemption premium (Note 8) $ 21,812 $ - $ 21,812 $ -
(i) Includes the current and long-term portions.
Level 1 fair value measurements are based on unadjusted quoted market prices.
As at March 31, 2017, the Corporation did not have any financial instruments measured at Level 1 fair value.
Level 2 fair value measurements are based on valuation models and techniques where the significant inputs are derived from quoted prices or indices.
The estimated fair value of long-term debt is derived using quoted prices in an inactive market from a third-party independent broker.
The fair value of commodity risk management contracts and derivative financial liabilities are derived using third-party valuation models which require assumptions concerning the amount and timing of future cash flows and discount rates. Management's assumptions rely on external observable market data including forward prices for commodities, interest rate yield curves and foreign exchange rates. The observable inputs may be adjusted using certain methods, which include extrapolation to the end of the term of the contract.
Level 3 fair value measurements are based on unobservable information.
As at March 31, 2017, the Corporation did not have any financial instruments measured at Level 3 fair value. The Corporation recognizes transfers into and transfers out of fair value hierarchy levels as of the date of the event or change in circumstances that caused the transfer.
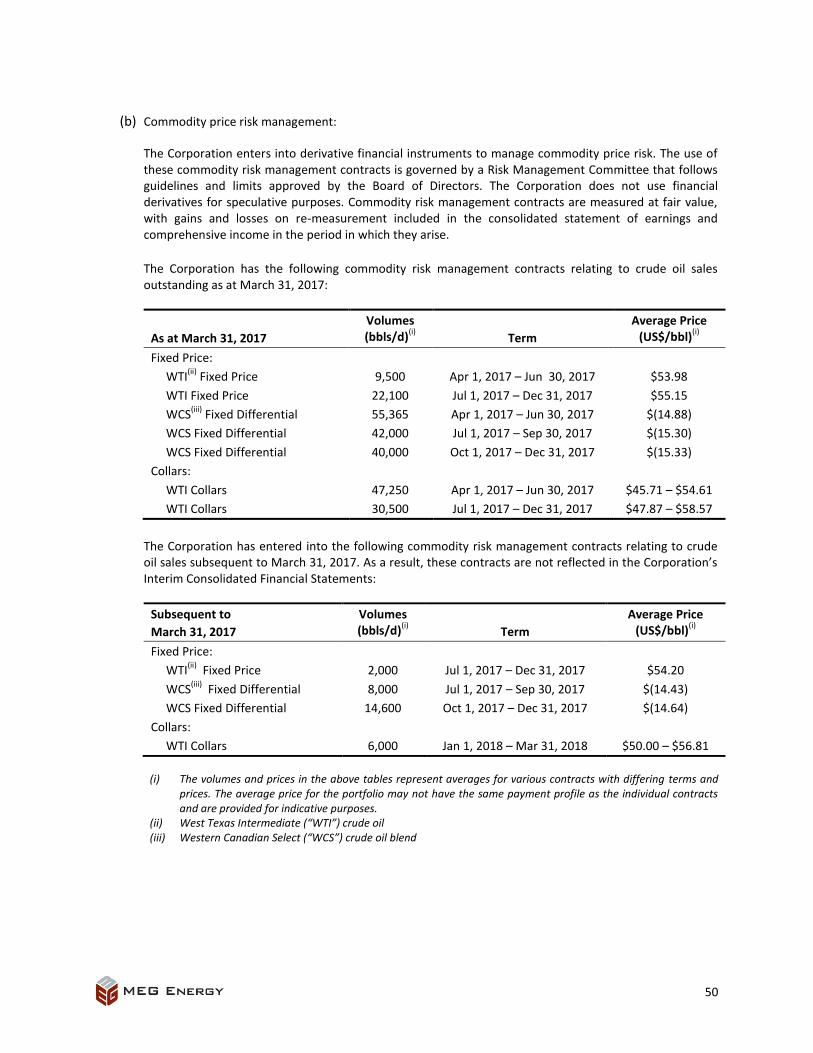
50
(b) Commodity price risk management:
The Corporation enters into derivative financial instruments to manage commodity price risk. The use of these commodity risk management contracts is governed by a Risk Management Committee that follows guidelines and limits approved by the Board of Directors. The Corporation does not use financial derivatives for speculative purposes. Commodity risk management contracts are measured at fair value, with gains and losses on re-measurement included in the consolidated statement of earnings and comprehensive income in the period in which they arise.
The Corporation has the following commodity risk management contracts relating to crude oil sales outstanding as at March 31, 2017:
As at March 31, 2017
Volumes (bbls/d)
(i) Term
Average Price (US$/bbl)
(i)
Fixed Price:
WTI(ii)
Fixed Price 9,500 Apr 1, 2017 – Jun 30, 2017 $53.98
WTI Fixed Price 22,100 Jul 1, 2017 – Dec 31, 2017 $55.15
WCS(iii)
Fixed Differential 55,365 Apr 1, 2017 – Jun 30, 2017 $(14.88)
WCS Fixed Differential 42,000 Jul 1, 2017 – Sep 30, 2017 $(15.30)
WCS Fixed Differential 40,000 Oct 1, 2017 – Dec 31, 2017 $(15.33)
Collars:
WTI Collars 47,250 Apr 1, 2017 – Jun 30, 2017 $45.71 – $54.61
WTI Collars 30,500 Jul 1, 2017 – Dec 31, 2017 $47.87 – $58.57
The Corporation has entered into the following commodity risk management contracts relating to crude oil sales subsequent to March 31, 2017. As a result, these contracts are not reflected in the Corporation’s Interim Consolidated Financial Statements:
Subsequent to
March 31, 2017
Volumes (bbls/d)
(i) Term
Average Price (US$/bbl)
(i)
Fixed Price:
WTI(ii)
Fixed Price 2,000 Jul 1, 2017 – Dec 31, 2017 $54.20
WCS(iii)
Fixed Differential 8,000 Jul 1, 2017 – Sep 30, 2017 $(14.43)
WCS Fixed Differential 14,600 Oct 1, 2017 – Dec 31, 2017 $(14.64)
Collars:
WTI Collars 6,000 Jan 1, 2018 – Mar 31, 2018 $50.00 – $56.81
(i) The volumes and prices in the above tables represent averages for various contracts with differing terms and
prices. The average price for the portfolio may not have the same payment profile as the individual contracts and are provided for indicative purposes.
(ii) West Texas Intermediate (“WTI”) crude oil (iii) Western Canadian Select (“WCS”) crude oil blend
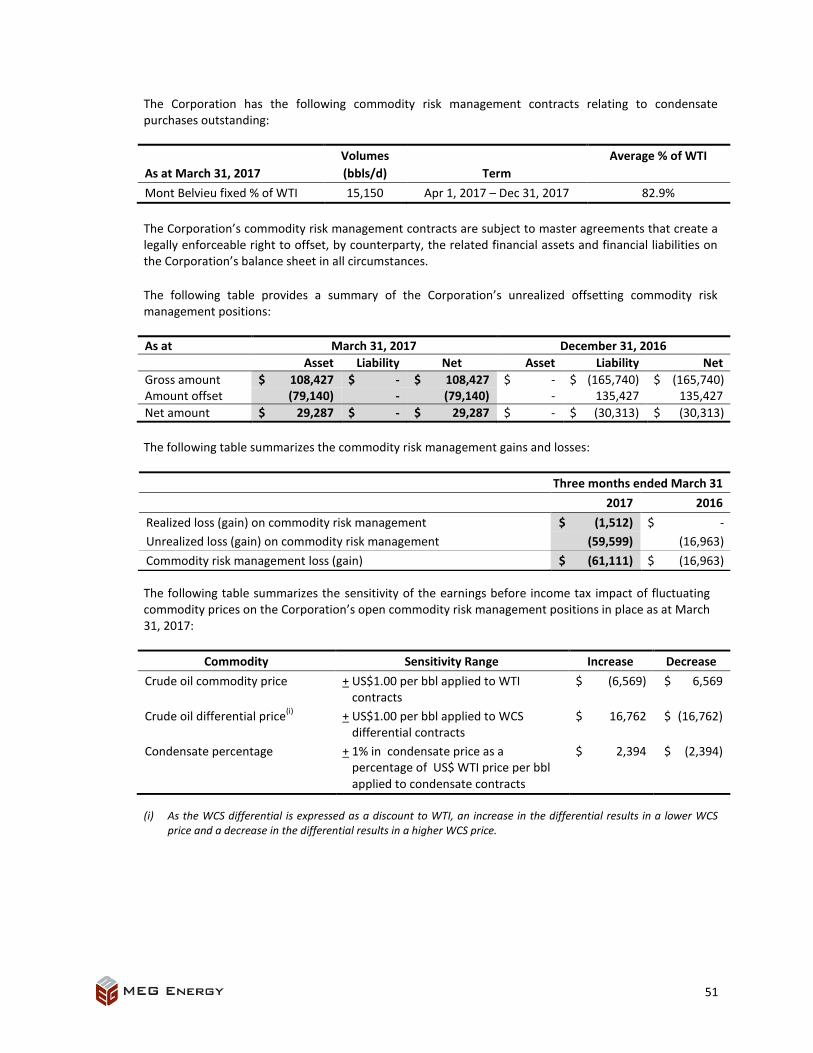
51
The Corporation has the following commodity risk management contracts relating to condensate purchases outstanding:
As at March 31, 2017
Volumes
(bbls/d) Term
Average % of WTI
Mont Belvieu fixed % of WTI 15,150 Apr 1, 2017 – Dec 31, 2017 82.9%
The Corporation’s commodity risk management contracts are subject to master agreements that create a legally enforceable right to offset, by counterparty, the related financial assets and financial liabilities on the Corporation’s balance sheet in all circumstances.
The following table provides a summary of the Corporation’s unrealized offsetting commodity risk management positions:
As at March 31, 2017 December 31, 2016
Asset Liability Net Asset Liability Net
Gross amount $ 108,427 $ - $ 108,427 $ - $ (165,740) $ (165,740) Amount offset (79,140) - (79,140) - 135,427 135,427
Net amount $ 29,287 $ - $ 29,287 $ - $ (30,313) $ (30,313)
The following table summarizes the commodity risk management gains and losses:
The following table summarizes the sensitivity of the earnings before income tax impact of fluctuating commodity prices on the Corporation’s open commodity risk management positions in place as at March 31, 2017:
Commodity Sensitivity Range Increase Decrease
Crude oil commodity price + US$1.00 per bbl applied to WTI contracts
$ (6,569) $ 6,569
Crude oil differential price(i)
+ US$1.00 per bbl applied to WCS differential contracts
$ 16,762 $ (16,762)
Condensate percentage + 1% in condensate price as a percentage of US$ WTI price per bbl applied to condensate contracts
$ 2,394 $ (2,394)
(i) As the WCS differential is expressed as a discount to WTI, an increase in the differential results in a lower WCS price and a decrease in the differential results in a higher WCS price.
Three months ended March 31
2017 2016
Realized loss (gain) on commodity risk management $ (1,512) $ -
Unrealized loss (gain) on commodity risk management (59,599) (16,963)
Commodity risk management loss (gain) $ (61,111) $ (16,963)
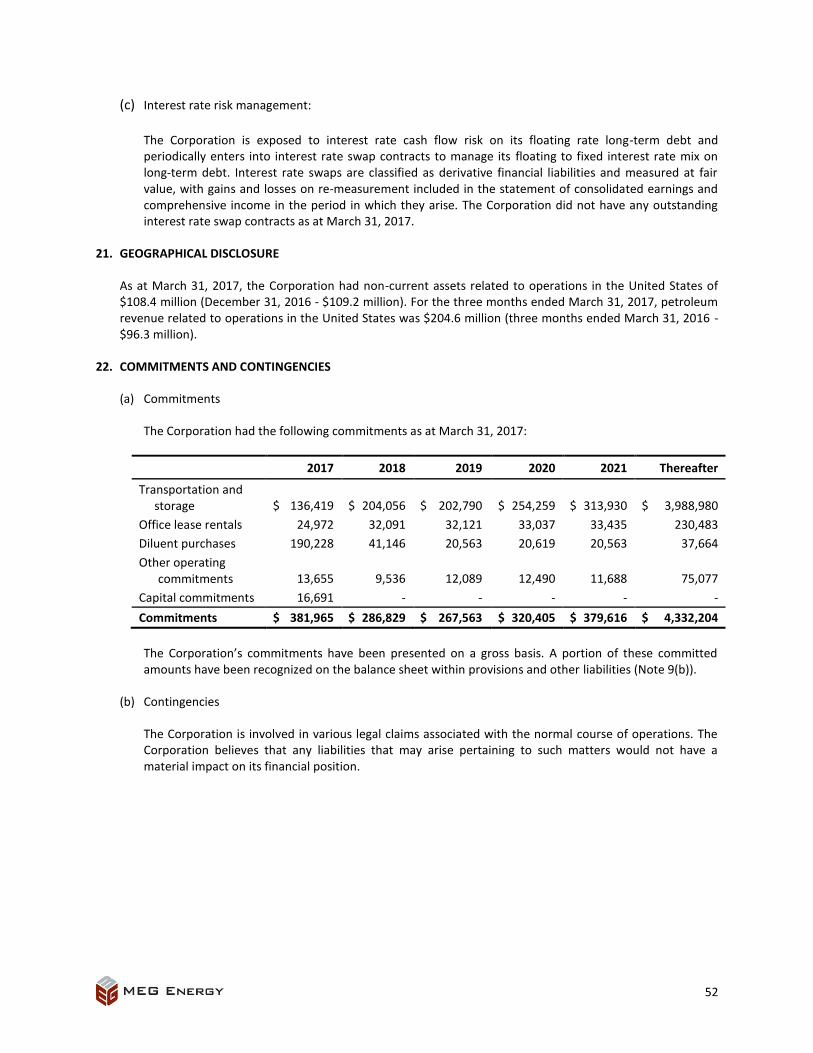
52
(c) Interest rate risk management:
The Corporation is exposed to interest rate cash flow risk on its floating rate long-term debt and periodically enters into interest rate swap contracts to manage its floating to fixed interest rate mix on long-term debt. Interest rate swaps are classified as derivative financial liabilities and measured at fair value, with gains and losses on re-measurement included in the statement of consolidated earnings and comprehensive income in the period in which they arise. The Corporation did not have any outstanding interest rate swap contracts as at March 31, 2017.
21. GEOGRAPHICAL DISCLOSURE
As at March 31, 2017, the Corporation had non-current assets related to operations in the United States of $108.4 million (December 31, 2016 - $109.2 million). For the three months ended March 31, 2017, petroleum revenue related to operations in the United States was $204.6 million (three months ended March 31, 2016 - $96.3 million).
22. COMMITMENTS AND CONTINGENCIES
(a) Commitments
The Corporation had the following commitments as at March 31, 2017:
2017 2018 2019 2020 2021 Thereafter
Transportation and storage $ 136,419 $ 204,056 $ 202,790 $ 254,259 $ 313,930 $ 3,988,980
Office lease rentals 24,972 32,091 32,121 33,037 33,435 230,483
Diluent purchases 190,228 41,146 20,563 20,619 20,563 37,664
Other operating commitments 13,655 9,536 12,089 12,490 11,688 75,077
Capital commitments 16,691 - - - - -
Commitments $ 381,965 $ 286,829 $ 267,563 $ 320,405 $ 379,616 $ 4,332,204
The Corporation’s commitments have been presented on a gross basis. A portion of these committed amounts have been recognized on the balance sheet within provisions and other liabilities (Note 9(b)).
(b) Contingencies
The Corporation is involved in various legal claims associated with the normal course of operations. The Corporation believes that any liabilities that may arise pertaining to such matters would not have a material impact on its financial position.