Embed Size (px)
Citation preview
First Quarter 2017 EarningsJeff Jacobson, CEOBill Osbourn, CFO
April 25, 2017http://www.xerox.com/investor
This presentation contains “forward-looking statements” as defined in the Private Securities Litigation Reform Act of 1995. The words “anticipate”, “believe”, “estimate”, “expect”, “intend”, “will”, “should” and similar expressions, as they relate to us, are intended to identify forward-looking statements. These statements reflect management’s current beliefs, assumptions and expectations and are subject to a number of factors that may cause actual results to differ materially. Such factors include but are not limited to: our ability to address our business challenges in order to reverse revenue declines, reduce costs and increase productivity so that we can invest in and grow our business; changes in economic conditions, political conditions, trade protection measures, licensing requirements and tax laws in the United States and in the foreign countries in which we do business; changes in foreign currency exchange rates; our ability to successfully develop new products, technologies and service offerings and to protect our intellectual property rights; the risk that multi-year contracts with governmental entities could be terminated prior to the end of the contract term and that civil or criminal penalties and administrative sanctions could be imposed on us if we fail to comply with the terms of such contracts and applicable law; the risk that partners, subcontractors and software vendors will not perform in a timely, quality manner; actions of competitors and our ability to promptly and effectively react to changing technologies and customer expectations; our ability to obtain adequate pricing for our products and services and to maintain and improve cost efficiency of operations, including savings from restructuring actions; the risk that individually identifiable information of customers, clients and employees could be inadvertently disclosed or disclosed as a result of a breach of our security systems; reliance on third parties, including subcontractors, for manufacturing of products and provision of services; our ability to manage changes in the printing environment and markets and expand equipment placements; interest rates, cost of borrowing and access to credit markets; funding requirements associated with our employee pension and retiree health benefit plans; the risk that our operations and products may not comply with applicable worldwide regulatory requirements, particularly environmental regulations and directives and anti-corruption laws; the outcome of litigation and regulatory proceedings to which we may be a party; the risk that we do not realize all of the expected strategic and financial benefits from the separation and spin-off of our Business Process Outsourcing business; and other factors that are set forth in the “Risk Factors” section, the “Legal Proceedings” section, the “Management’s Discussion and Analysis of Financial Condition and Results of Operations” section and other sections of our 2016 Annual Report on Form 10-K, as well as in our Quarterly Reports on Form 10-Q and Current Reports on Form 8-K filed with the Securities and Exchange Commission. Xerox assumes no obligation to update any forward-looking statements as a result of new information or future events or developments, except as required by law.
Forward Looking Statements
2
Fuji Xerox Co., Ltd. (“Fuji Xerox”) is a joint venture between Xerox Corporation and Fujifilm Holdings Corporation (“Fujifilm”) in which Xerox holds a 25% equity interest and Fujifilm holds the remaining equity interest. On April 20, 2017, Fujifilm publicly announced it formed an independent investigation committee to conduct a review of the appropriateness of the accounting practices at Fuji Xerox’s New Zealand subsidiary related to the recovery of receivables associated with certain sales leasing transactions that occurred in, or prior to, Fuji Xerox’s fiscal year ending March 31, 2016. In first quarter 2017, we recognized a charge of approximately $30 million, which represents our share of the current Fujifilm estimated adjustments from this review, as publicly disclosed by Fujifilm. Fujifilm has publicly stated that it expects the investigation will be completed in May 2017, and that it intends to disclose the results shortly thereafter. Given our status as a minority investor, we have limited contractual and other rights to information and rely on Fuji Xerox and Fujifilm to provide information to us and are not involved in the investigation, including its scope and timing of completion. Although we have no reason not to rely on Fujifilm’s estimated adjustment and we are not aware of any additional amounts related to this matter that would have a material effect on our financial statements, this investigation is ongoing and our future results may include additional adjustments that are materially different from the amount of the charge that we have already recognized in connection with this matter and the period(s) to which the charge relates, and we can provide no assurances relative to the outcome of any governmental investigations or any consequences thereof.
For other related information, please visit the Company’s investor relations website at https://www.xerox.com/investor.
Forward Looking Statements
3
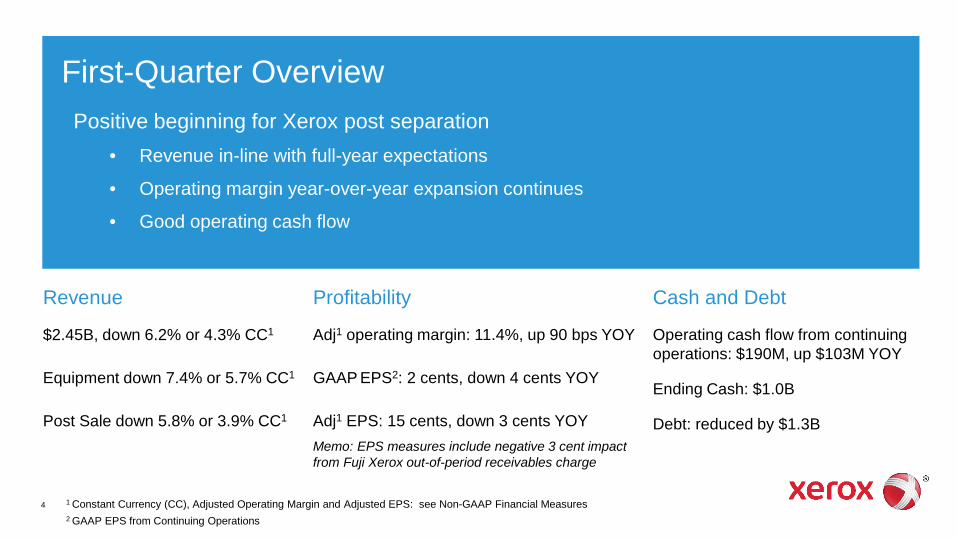
Revenue
$2.45B, down 6.2% or 4.3% CC1
Equipment down 7.4% or 5.7% CC1
Post Sale down 5.8% or 3.9% CC1
Profitability
Adj1 operating margin: 11.4%, up 90 bps YOY
GAAP EPS2: 2 cents, down 4 cents YOY
Adj1 EPS: 15 cents, down 3 cents YOYMemo: EPS measures include negative 3 cent impact from Fuji Xerox out-of-period receivables charge
Cash and Debt
Operating cash flow from continuing operations: $190M, up $103M YOY
Ending Cash: $1.0B
Debt: reduced by $1.3B
First-Quarter OverviewPositive beginning for Xerox post separation
• Revenue in-line with full-year expectations
• Operating margin year-over-year expansion continues
• Good operating cash flow
1 Constant Currency (CC), Adjusted Operating Margin and Adjusted EPS: see Non-GAAP Financial Measures2 GAAP EPS from Continuing Operations
4
5
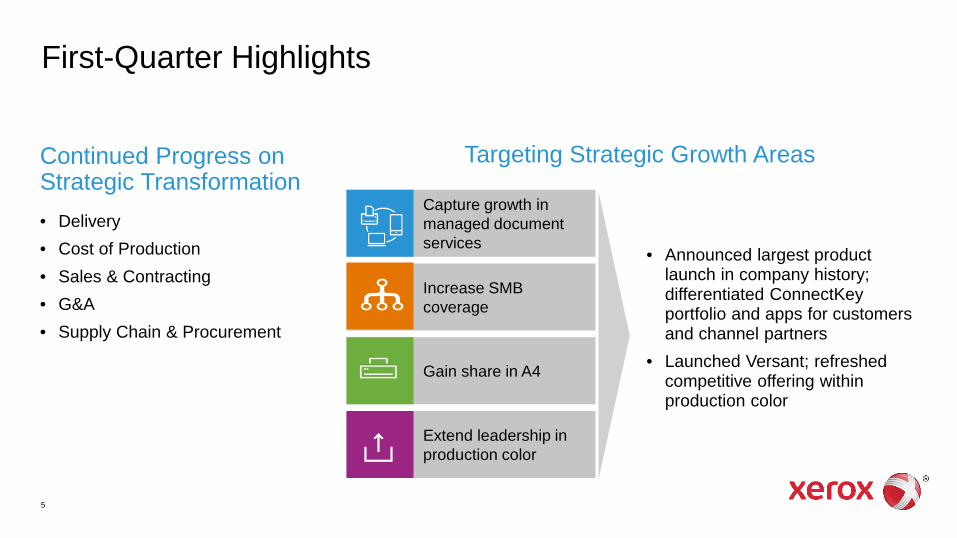
First-Quarter Highlights
Continued Progress on Strategic Transformation• Delivery• Cost of Production• Sales & Contracting• G&A• Supply Chain & Procurement
• Announced largest product launch in company history; differentiated ConnectKey portfolio and apps for customers and channel partners
• Launched Versant; refreshed competitive offering within production color
Gain share in A4
Capture growth in managed document services
Increase SMB coverage
Extend leadership in production color
Targeting Strategic Growth Areas
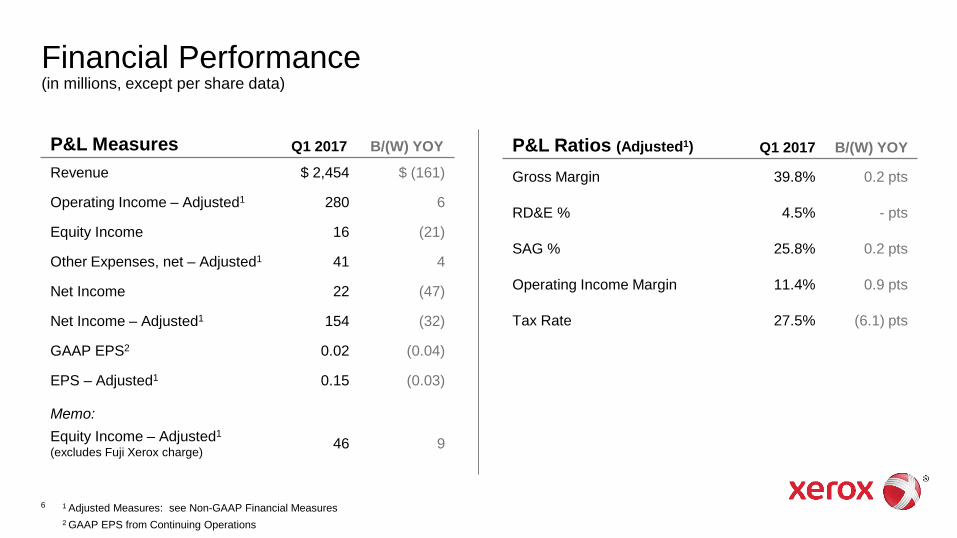
Financial Performance(in millions, except per share data)
P&L Measures Q1 2017 B/(W) YOY
Revenue $ 2,454 $ (161)
Operating Income – Adjusted1 280 6
Equity Income 16 (21)
Other Expenses, net – Adjusted1 41 4
Net Income 22 (47)
Net Income – Adjusted1 154 (32)
GAAP EPS2 0.02 (0.04)
EPS – Adjusted1 0.15 (0.03)
Memo:Equity Income – Adjusted1
(excludes Fuji Xerox charge) 46 9
1 Adjusted Measures: see Non-GAAP Financial Measures2 GAAP EPS from Continuing Operations
P&L Ratios (Adjusted1) Q1 2017 B/(W) YOY
Gross Margin 39.8% 0.2 pts
RD&E % 4.5% - pts
SAG % 25.8% 0.2 pts
Operating Income Margin 11.4% 0.9 pts
Tax Rate 27.5% (6.1) pts
6
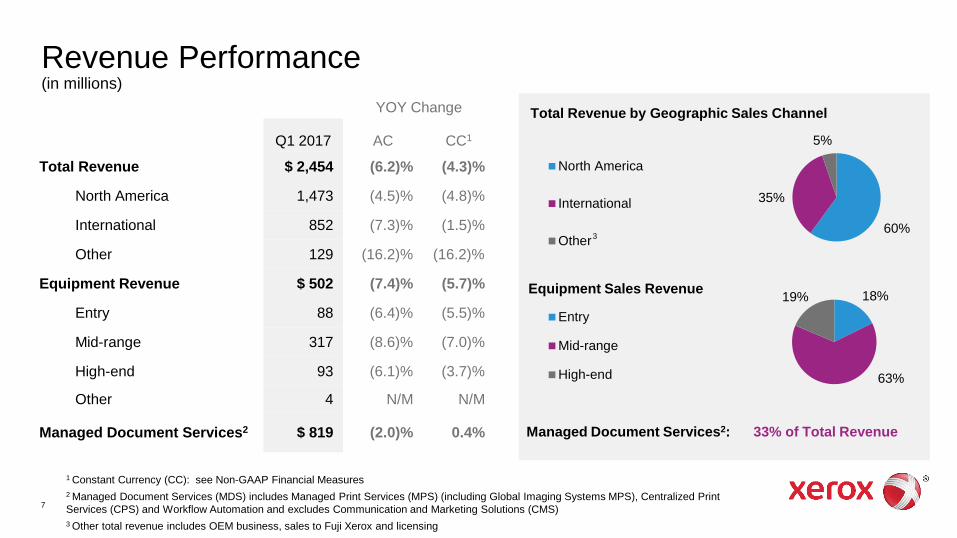
YOY Change
Q1 2017 AC CC1
Total Revenue $ 2,454 (6.2)% (4.3)%
North America 1,473 (4.5)% (4.8)%
International 852 (7.3)% (1.5)%
Other 129 (16.2)% (16.2)%
Equipment Revenue $ 502 (7.4)% (5.7)%
Entry 88 (6.4)% (5.5)%
Mid-range 317 (8.6)% (7.0)%
High-end 93 (6.1)% (3.7)%
Other 4 N/M N/M
Managed Document Services2 $ 819 (2.0)% 0.4%
Revenue Performance(in millions)
60%
35%
5%
Total Revenue by Geographic Sales Channel
North America
International
Other
18%
63%
19%Equipment Sales Revenue
Entry
Mid-range
High-end
Managed Document Services2: 33% of Total Revenue
7
1 Constant Currency (CC): see Non-GAAP Financial Measures2 Managed Document Services (MDS) includes Managed Print Services (MPS) (including Global Imaging Systems MPS), Centralized Print Services (CPS) and Workflow Automation and excludes Communication and Marketing Solutions (CMS)3 Other total revenue includes OEM business, sales to Fuji Xerox and licensing
3

Key Performance MetricsStrategic Growth Areas Installs Strategic Transformation
First Quarter 2017
(% change YOY) Color B&W
Entry A4 MFDs3 15% 1%
Mid-Range3 -% (24)%
High-End3 (15)% (25)%
% Growth CC1
Q1 YOY TTM
Enterprise MDS4 $0.5B (6)% (5)%
A4 MFPs
MPS & Workflow Automation
Production Color
1% 39%
First Quarter 2017 Results
YOY revenue growth at CC1
2016 FY Gross Savings2 $550M
2017 Target $600M
Cumulative thru 2018 Target $1.5B+
Q1 Restructuring $120M
FY Restructuring Target $225M
1 Constant Currency (CC): see Non-GAAP Financial Measures2 Gross savings are the year over year savings, assuming similar operating levels3 Entry installations exclude OEM sales; Mid-range and High-end color installations exclude Fuji Xerox digital front-end sales4 Managed Document Services (MDS) includes Managed Print Services (MPS) (including Global Imaging Systems MPS), Centralized Print Services (CPS) and Workflow Automation and excludes Communication and Marketing Solutions (CMS)
Signings
30%
17%20%
20%
13%Delivery
Cost of Production
Sales & Contracting
G&A
Supply Chain &Procurement
Sources of Productivity
2 pts% of Revenue
in Strategic Growth Areas
Mix shift YOY
8
Note: signings do not include GIS or Xerox Partner Print Services results
Offering Focus Areas
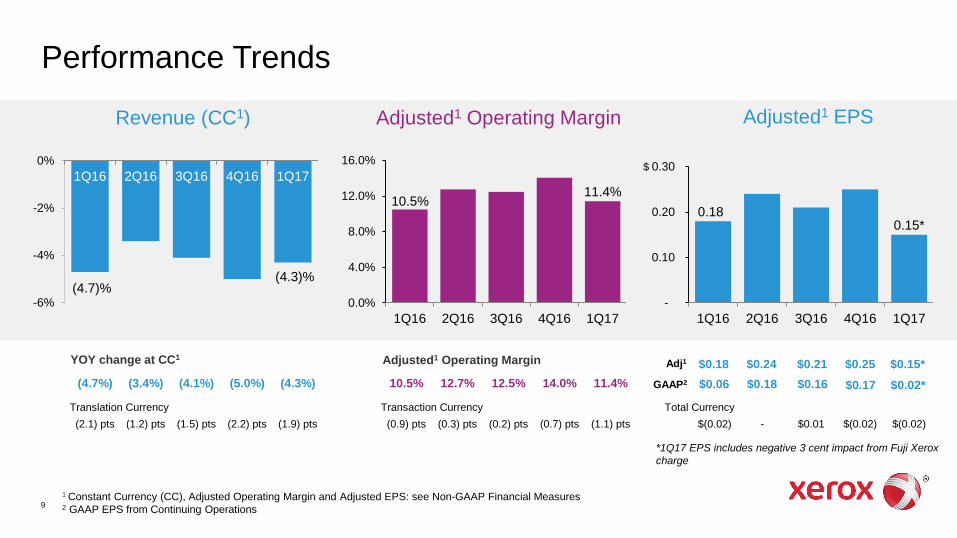
Performance Trends
1 Constant Currency (CC), Adjusted Operating Margin and Adjusted EPS: see Non-GAAP Financial Measures2 GAAP EPS from Continuing Operations
0.0%
4.0%
8.0%
12.0%
16.0%
1Q16 2Q16 3Q16 4Q16 1Q17-6%
-4%
-2%
0%1Q16 2Q16 3Q16 4Q16 1Q17
Revenue (CC1) Adjusted1 Operating Margin
-
0.10
0.20
0.30
1Q16 2Q16 3Q16 4Q16 1Q17
Adjusted1 EPS
$
YOY change at CC1 Adjusted1 Operating Margin
(4.7%) (3.4%) (4.1%) (5.0%) (4.3%)
Translation Currency(2.1) pts (1.2) pts (1.5) pts (2.2) pts (1.9) pts
10.5% 12.7% 12.5% 14.0% 11.4%
Transaction Currency(0.9) pts (0.3) pts (0.2) pts (0.7) pts (1.1) pts
Total Currency$(0.02) - $0.01 $(0.02) $(0.02)
9
$0.06 $0.18 $0.16 $0.17 $0.02*
$0.18 $0.24 $0.21 $0.25 $0.15*Adj1
GAAP2
11.4%10.5%
(4.3)%(4.7)%
0.15*0.18
*1Q17 EPS includes negative 3 cent impact from Fuji Xerox charge
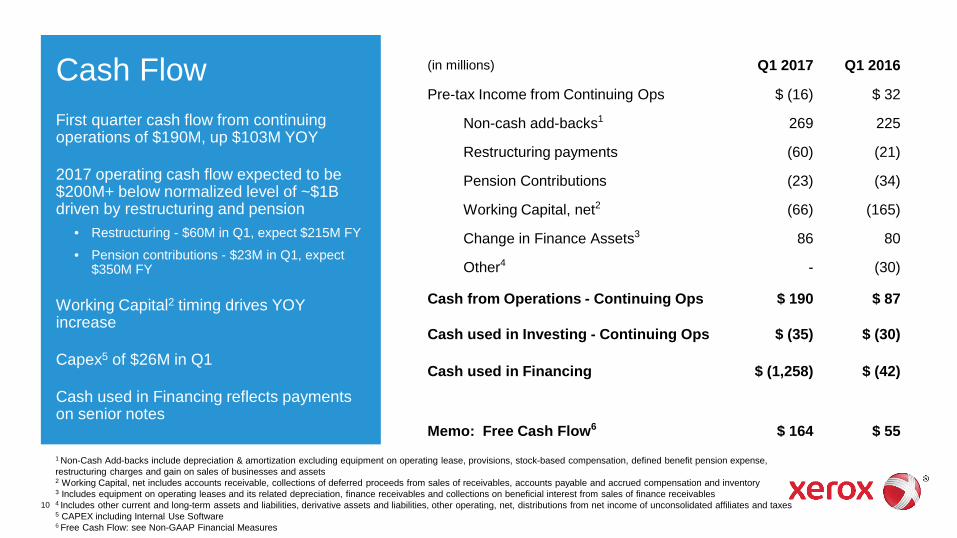
Cash FlowFirst quarter cash flow from continuing operations of $190M, up $103M YOY
2017 operating cash flow expected to be $200M+ below normalized level of ~$1B driven by restructuring and pension
• Restructuring - $60M in Q1, expect $215M FY
• Pension contributions - $23M in Q1, expect $350M FY
Working Capital2 timing drives YOY increase
Capex5 of $26M in Q1
Cash used in Financing reflects payments on senior notes
(in millions) Q1 2017 Q1 2016
Pre-tax Income from Continuing Ops $ (16) $ 32
Non-cash add-backs1 269 225
Restructuring payments (60) (21)
Pension Contributions (23) (34)
Working Capital, net2 (66) (165)
Change in Finance Assets3 86 80
Other4 - (30)
Cash from Operations - Continuing Ops $ 190 $ 87
Cash used in Investing - Continuing Ops $ (35) $ (30)
Cash used in Financing $ (1,258) $ (42)
Memo: Free Cash Flow6 $ 164 $ 551 Non-Cash Add-backs include depreciation & amortization excluding equipment on operating lease, provisions, stock-based compensation, defined benefit pension expense, restructuring charges and gain on sales of businesses and assets2 Working Capital, net includes accounts receivable, collections of deferred proceeds from sales of receivables, accounts payable and accrued compensation and inventory3 Includes equipment on operating leases and its related depreciation, finance receivables and collections on beneficial interest from sales of finance receivables4 Includes other current and long-term assets and liabilities, derivative assets and liabilities, other operating, net, distributions from net income of unconsolidated affiliates and taxes5 CAPEX including Internal Use Software6 Free Cash Flow: see Non-GAAP Financial Measures
10
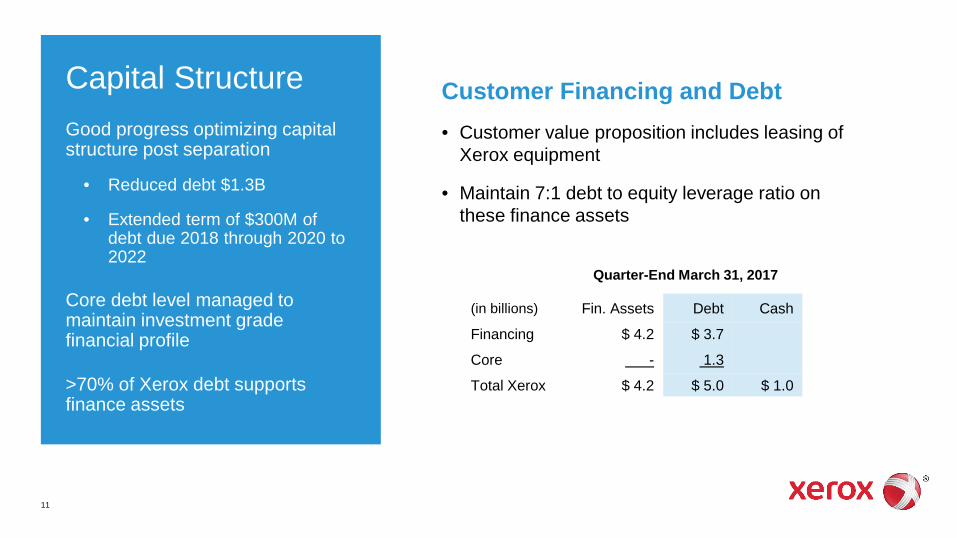
Capital Structure Good progress optimizing capital structure post separation
• Reduced debt $1.3B
• Extended term of $300M of debt due 2018 through 2020 to 2022
Core debt level managed to maintain investment grade financial profile
>70% of Xerox debt supports finance assets
Quarter-End March 31, 2017
(in billions) Fin. Assets Debt Cash
Financing $ 4.2 $ 3.7
Core - 1.3
Total Xerox $ 4.2 $ 5.0 $ 1.0
Customer Financing and Debt• Customer value proposition includes leasing of
Xerox equipment
• Maintain 7:1 debt to equity leverage ratio on these finance assets
11
12
Summary
Focused on delivering 2017 commitments• Reaffirming full-year guidance
• Driving profitability and enabling investment through Strategic Transformation program
• Targeting strategic growth areas to improve revenue trajectory
First quarter operational results in line with expectations
13
Appendix

Revenue Trend
(in millions) Q1 Q2 Q3 Q4 FY Q1
Total Revenue $2,615 $2,793 $2,629 $2,734 $10,771 $2,454% Change (6.8)% (4.6)% (5.6)% (7.2)% (6.1)% (6.2)%CC1 % Change (4.7)% (3.4)% (4.1)% (5.0)% (4.3)% (4.3)%
Post Sale $2,073 $2,143 $2,056 $2,080 $8,352 $1,952% Change (5.7)% (4.2)% (3.9)% (5.5)% (4.8)% (5.8)%CC1 % Change (3.3)% (2.9)% (2.2)% (3.2)% (2.9)% (3.9)%
Post Sale % Revenue 79% 77% 78% 76% 78% 80%
Equipment2 $542 $650 $573 $654 $2,419 $502% Change (11.0)% (5.7)% (11.4)% (12.1)% (10.0)% (7.4)%CC1 % Change (9.7)% (4.9)% (10.4)% (10.1)% (8.7)% (5.7)%
Memo:OEM and CMS impact on Total Revenue (0.3) pts (0.2) pts (0.6) pts (0.7) pts (0.4) pts (0.9) pts
1 Constant currency: see Non-GAAP Financial Measures2 Equipment sales revenue in 2016 has been revised to reclassify certain GIS equipment sales to Other sales, which are included in Post Sale revenue
2016
14
2017
15
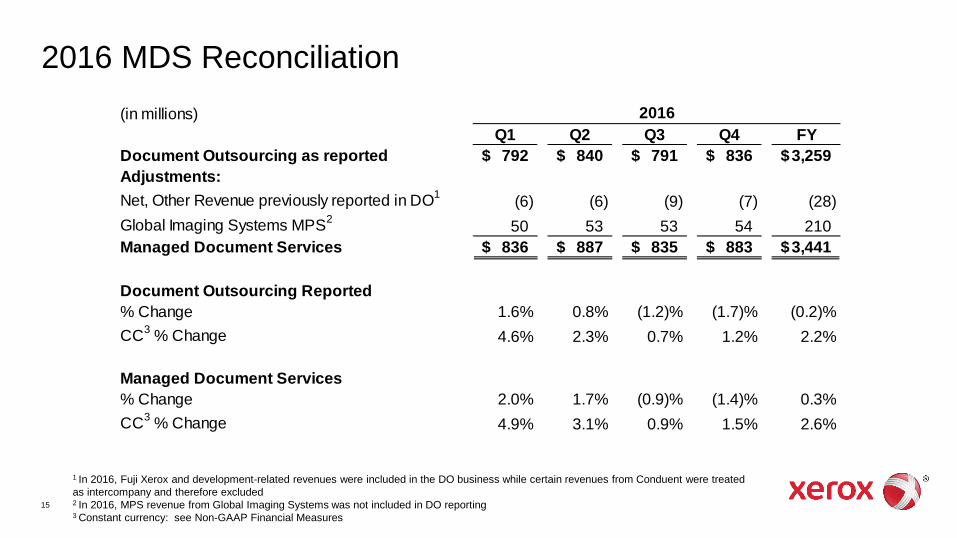
2016 MDS Reconciliation
1 In 2016, Fuji Xerox and development-related revenues were included in the DO business while certain revenues from Conduent were treated as intercompany and therefore excluded2 In 2016, MPS revenue from Global Imaging Systems was not included in DO reporting3 Constant currency: see Non-GAAP Financial Measures
(in millions)Q1 Q2 Q3 Q4 FY
Document Outsourcing as reported 792$ 840$ 791$ 836$ 3,259$ Adjustments:Net, Other Revenue previously reported in DO1 (6) (6) (9) (7) (28) Global Imaging Systems MPS2 50 53 53 54 210 Managed Document Services 836$ 887$ 835$ 883$ 3,441$
Document Outsourcing Reported% Change 1.6% 0.8% (1.2)% (1.7)% (0.2)%CC3 % Change 4.6% 2.3% 0.7% 1.2% 2.2%
Managed Document Services% Change 2.0% 1.7% (0.9)% (1.4)% 0.3%CC3 % Change 4.9% 3.1% 0.9% 1.5% 2.6%
2016
16
Non-GAAP Financial Measures
17
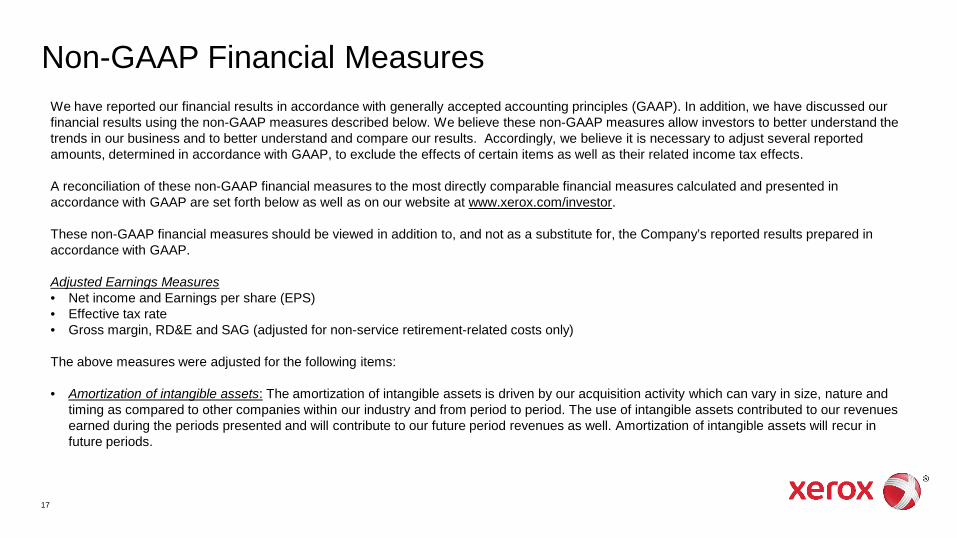
Non-GAAP Financial MeasuresWe have reported our financial results in accordance with generally accepted accounting principles (GAAP). In addition, we have discussed our financial results using the non-GAAP measures described below. We believe these non-GAAP measures allow investors to better understand the trends in our business and to better understand and compare our results. Accordingly, we believe it is necessary to adjust several reported amounts, determined in accordance with GAAP, to exclude the effects of certain items as well as their related income tax effects.
A reconciliation of these non-GAAP financial measures to the most directly comparable financial measures calculated and presented in accordance with GAAP are set forth below as well as on our website at www.xerox.com/investor.
These non-GAAP financial measures should be viewed in addition to, and not as a substitute for, the Company’s reported results prepared in accordance with GAAP.
Adjusted Earnings Measures• Net income and Earnings per share (EPS) • Effective tax rate• Gross margin, RD&E and SAG (adjusted for non-service retirement-related costs only)
The above measures were adjusted for the following items:
• Amortization of intangible assets: The amortization of intangible assets is driven by our acquisition activity which can vary in size, nature and timing as compared to other companies within our industry and from period to period. The use of intangible assets contributed to our revenues earned during the periods presented and will contribute to our future period revenues as well. Amortization of intangible assets will recur in future periods.
18
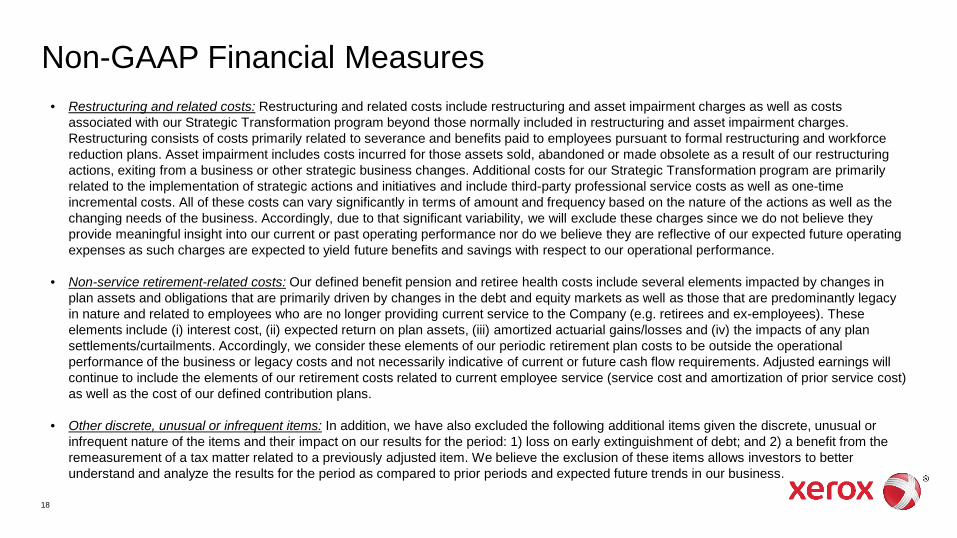
Non-GAAP Financial Measures• Restructuring and related costs: Restructuring and related costs include restructuring and asset impairment charges as well as costs
associated with our Strategic Transformation program beyond those normally included in restructuring and asset impairment charges. Restructuring consists of costs primarily related to severance and benefits paid to employees pursuant to formal restructuring and workforce reduction plans. Asset impairment includes costs incurred for those assets sold, abandoned or made obsolete as a result of our restructuring actions, exiting from a business or other strategic business changes. Additional costs for our Strategic Transformation program are primarily related to the implementation of strategic actions and initiatives and include third-party professional service costs as well as one-time incremental costs. All of these costs can vary significantly in terms of amount and frequency based on the nature of the actions as well as the changing needs of the business. Accordingly, due to that significant variability, we will exclude these charges since we do not believe they provide meaningful insight into our current or past operating performance nor do we believe they are reflective of our expected future operating expenses as such charges are expected to yield future benefits and savings with respect to our operational performance.
• Non-service retirement-related costs: Our defined benefit pension and retiree health costs include several elements impacted by changes in plan assets and obligations that are primarily driven by changes in the debt and equity markets as well as those that are predominantly legacy in nature and related to employees who are no longer providing current service to the Company (e.g. retirees and ex-employees). These elements include (i) interest cost, (ii) expected return on plan assets, (iii) amortized actuarial gains/losses and (iv) the impacts of any plan settlements/curtailments. Accordingly, we consider these elements of our periodic retirement plan costs to be outside the operational performance of the business or legacy costs and not necessarily indicative of current or future cash flow requirements. Adjusted earnings will continue to include the elements of our retirement costs related to current employee service (service cost and amortization of prior service cost) as well as the cost of our defined contribution plans.
• Other discrete, unusual or infrequent items: In addition, we have also excluded the following additional items given the discrete, unusual or infrequent nature of the items and their impact on our results for the period: 1) loss on early extinguishment of debt; and 2) a benefit from the remeasurement of a tax matter related to a previously adjusted item. We believe the exclusion of these items allows investors to better understand and analyze the results for the period as compared to prior periods and expected future trends in our business.
19
Non-GAAP Financial MeasuresAdjusted Operating IncomeWe also calculate and utilize operating income and margin earnings measures by adjusting our pre-tax income and margin amounts. In addition to the costs noted for our Adjusted Earnings measures, operating income and margin also exclude other expenses, net. Other expenses, net is primarily comprised of non-financing interest expense and also includes certain other non-operating costs and expenses. We exclude these amounts in order to evaluate our current and past operating performance and to better understand the expected future trends in our business.Operating income and margin also includes equity in net income of unconsolidated affiliates. Equity in net income of unconsolidated affiliates primarily reflects our 25% share of Fuji Xerox net income. We include this amount in our measure of operating income and margin as Fuji Xerox is our primary intermediary to the Asia/Pacific market for distribution of Xerox branded products and services. First quarter Equity in net income of unconsolidated affiliates included a charge that represents our share of the current Fujifilm estimated adjustments associated with an accounting review at Fuji Xerox’s New Zealand subsidiary related to lease receivables. We have excluded this impact for adjusted operating income and margin in order to provide a more normalized view of our operations for the quarter. See Equity in Net Income of Unconsolidated Affiliates for additional information regarding this charge.
Constant CurrencyTo better understand trends in our business, we believe that it is helpful to adjust revenue to exclude the impact of changes in the translation of foreign currencies into U.S. dollars. We refer to this adjusted revenue as “constant currency.” Management believes the constant currency measure provides investors an additional perspective on revenue trends. Currency impact can be determined as the difference between actual growth rates and constant currency growth rates.
Free Cash FlowTo better understand trends in our business, we believe that it is helpful to subtract amounts for capital expenditures (inclusive of internal use software) from cash flows from continuing operations. Management believes this measure gives investors an additional perspective on cash flow from operating activities in excess of amounts required for reinvestment. It provides a measure of our ability to fund acquisitions, dividends and share repurchase. It is also used to measure our yield on market capitalization.
20
Non-GAAP Financial MeasuresSummary:
Management believes that all of these non-GAAP financial measures provide an additional means of analyzing the current period’s results against the corresponding prior period’s results. However, these non-GAAP financial measures should be viewed in addition to, and not as a substitute for, the Company’s reported results prepared in accordance with GAAP. Our non-GAAP financial measures are not meant to be considered in isolation or as a substitute for comparable GAAP measures and should be read only in conjunction with our consolidated financial statements prepared in accordance with GAAP. Our management regularly uses our supplemental non-GAAP financial measures internally to understand, manage and evaluate our business and make operating decisions. These non-GAAP measures are among the primary factors management uses in planning for and forecasting future periods. Compensation of our executives is based in part on the performance of our business based on these non-GAAP measures.
A reconciliation of these non-GAAP financial measures and the most directly comparable measures calculated and presented in accordance with GAAP are set forth on the following tables:
21
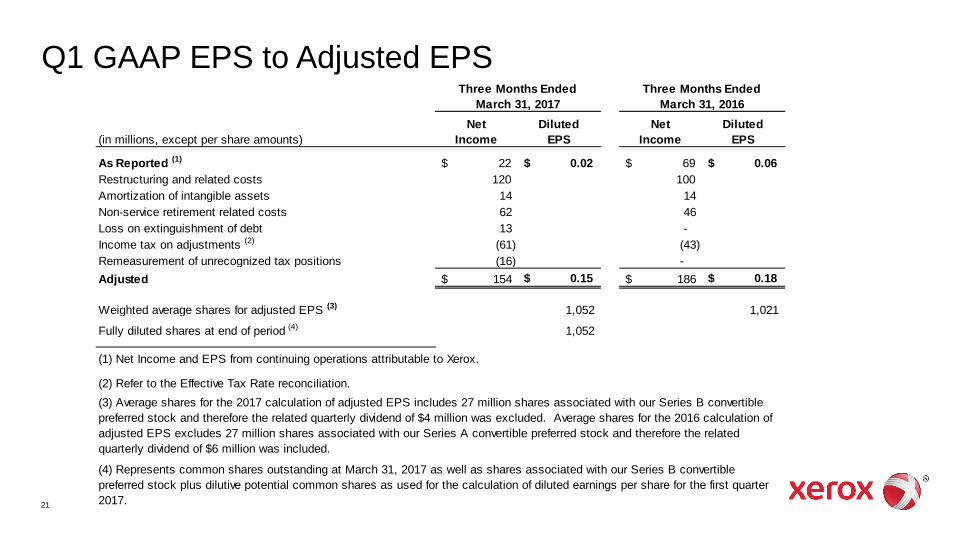
Q1 GAAP EPS to Adjusted EPS
(in millions, except per share amounts)Net
IncomeDiluted
EPSNet
IncomeDiluted
EPS
As Reported (1) $ 22 $ 0.02 $ 69 $ 0.06 Restructuring and related costs 120 100 Amortization of intangible assets 14 14 Non-service retirement related costs 62 46 Loss on extinguishment of debt 13 - Income tax on adjustments (2) (61) (43) Remeasurement of unrecognized tax positions (16) - Adjusted 154$ $ 0.15 186$ $ 0.18
Weighted average shares for adjusted EPS (3) 1,052 1,021
Fully diluted shares at end of period (4) 1,052
(1) Net Income and EPS from continuing operations attributable to Xerox.
(4) Represents common shares outstanding at March 31, 2017 as well as shares associated with our Series B convertible preferred stock plus dilutive potential common shares as used for the calculation of diluted earnings per share for the first quarter 2017.
Three Months EndedMarch 31, 2017
Three Months EndedMarch 31, 2016
(2) Refer to the Effective Tax Rate reconciliation.(3) Average shares for the 2017 calculation of adjusted EPS includes 27 million shares associated with our Series B convertible preferred stock and therefore the related quarterly dividend of $4 million was excluded. Average shares for the 2016 calculation of adjusted EPS excludes 27 million shares associated with our Series A convertible preferred stock and therefore the related quarterly dividend of $6 million was included.
22
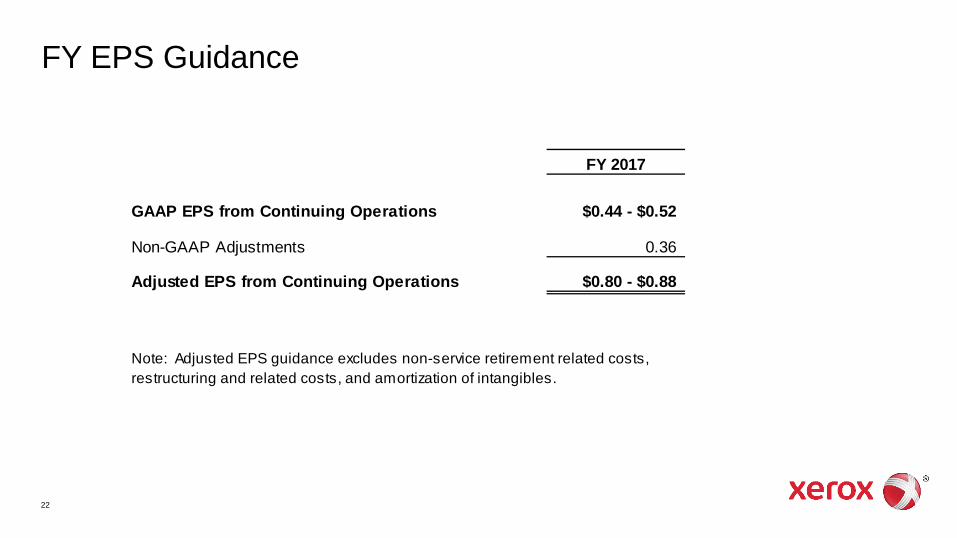
FY EPS Guidance
FY 2017
GAAP EPS from Continuing Operations $0.44 - $0.52
Non-GAAP Adjustments 0.36
Adjusted EPS from Continuing Operations $0.80 - $0.88
Note: Adjusted EPS guidance excludes non-service retirement related costs, restructuring and related costs, and amortization of intangibles.
23
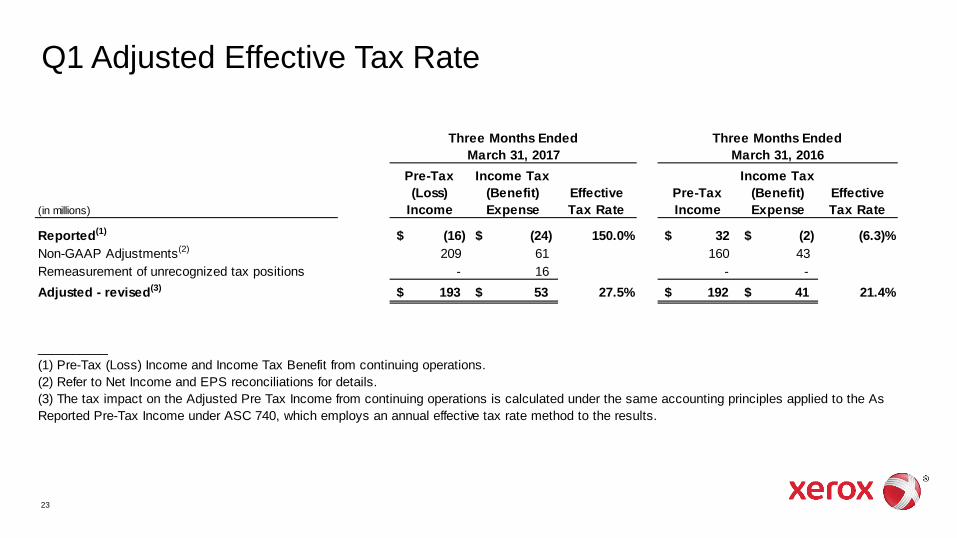
Q1 Adjusted Effective Tax Rate
(in millions)
Pre-Tax (Loss)
Income
Income Tax (Benefit) Expense
Effective Tax Rate
Pre-Tax Income
Income Tax (Benefit) Expense
Effective Tax Rate
Reported(1) $ (16) $ (24) 150.0% $ 32 $ (2) (6.3)%Non-GAAP Adjustments(2) 209 61 160 43 Remeasurement of unrecognized tax positions - 16 - - Adjusted - revised(3) $ 193 $ 53 27.5% $ 192 $ 41 21.4%
__________(1) Pre-Tax (Loss) Income and Income Tax Benefit from continuing operations. (2) Refer to Net Income and EPS reconciliations for details.(3) The tax impact on the Adjusted Pre Tax Income from continuing operations is calculated under the same accounting principles applied to the As Reported Pre-Tax Income under ASC 740, which employs an annual effective tax rate method to the results.
Three Months EndedMarch 31, 2017
Three Months EndedMarch 31, 2016
24
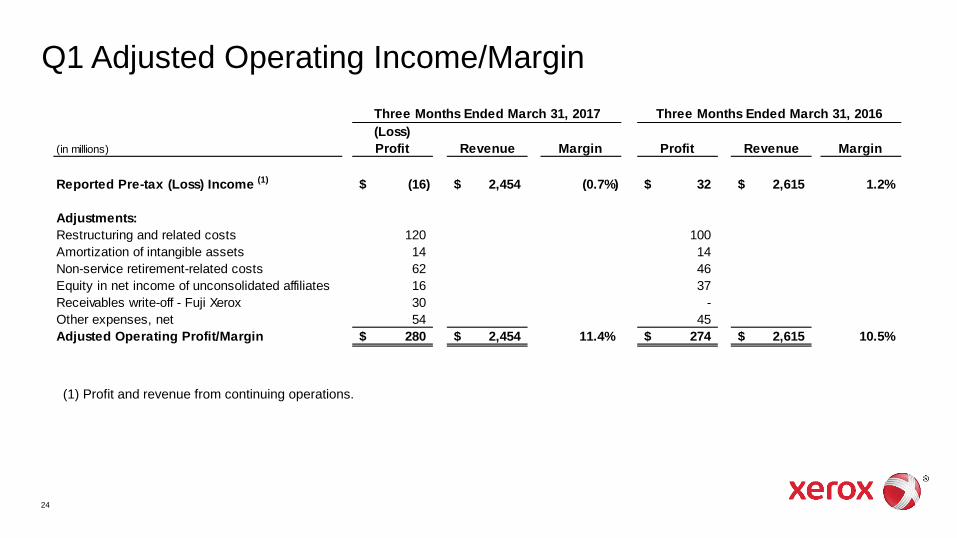
Q1 Adjusted Operating Income/Margin
(1) Profit and revenue from continuing operations.
(in millions)(Loss)Profit Revenue Margin Profit Revenue Margin
Reported Pre-tax (Loss) Income (1) (16)$ 2,454$ (0.7%) 32$ 2,615$ 1.2%
Adjustments:Restructuring and related costs 120 100 Amortization of intangible assets 14 14 Non-service retirement-related costs 62 46 Equity in net income of unconsolidated affiliates 16 37 Receivables write-off - Fuji Xerox 30 - Other expenses, net 54 45 Adjusted Operating Profit/Margin 280$ 2,454$ 11.4% 274$ 2,615$ 10.5%
Three Months Ended March 31, 2017 Three Months Ended March 31, 2016
25
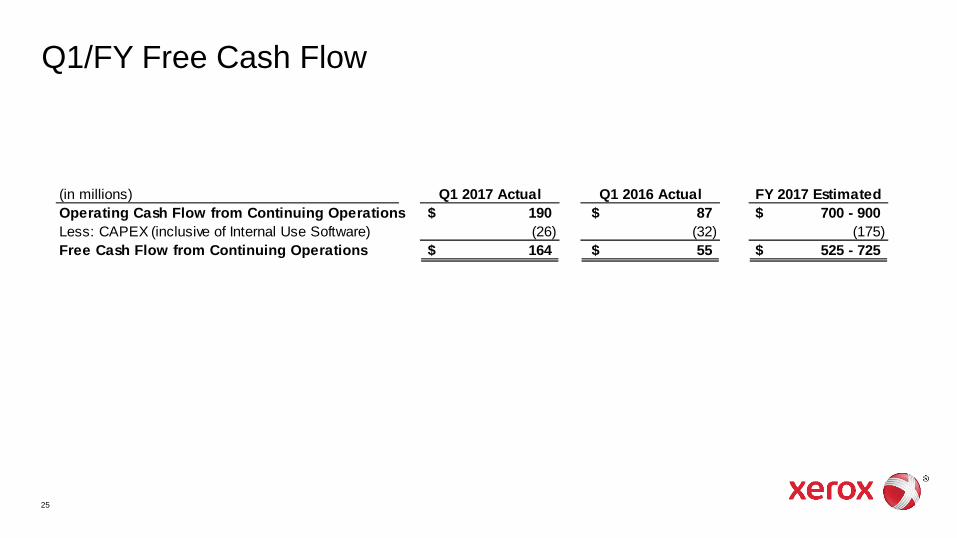
Q1/FY Free Cash Flow
(in millions) Q1 2017 Actual Q1 2016 Actual FY 2017 EstimatedOperating Cash Flow from Continuing Operations 190$ 87$ $ 700 - 900Less: CAPEX (inclusive of Internal Use Software) (26) (32) (175) Free Cash Flow from Continuing Operations 164$ 55$ $ 525 - 725

26
Q1 Adjusted Key Financial Ratios
(in millions)
Total Revenues $ 2,454 $ - $ 2,454 $ 2,615 $ - $ 2,615Total Gross Profit 23 1,018 17 1,035 Post Sale revenue 1,952 - 1,952 2,073 - 2,073Post Sale Gross Profit 23 852 17 869 RD&E (8) 126 (8) 118 SAG (31) 701 (21) 680
Total Gross Margin % % % %Post Sale Gross Margin % % % %RD&E as a % of Revenue % % % %SAG as a % of Revenue % % % %
954 977
664
Non-service retirement-
related costsAdjustedAs Reported(1)
Non-service retirement-
related costsAdjusted As Reported(1)
Three Months EndedMarch 31, 2017
118 110
Three Months EndedMarch 31, 2016
633
38.9 39.8 38.9 39.6
4.8 4.5 4.8 4.527.1 25.8 26.8 26.0
41.9
801 824
41.0 42.2 41.1
(1) Revenue and costs from continuing operations.
27
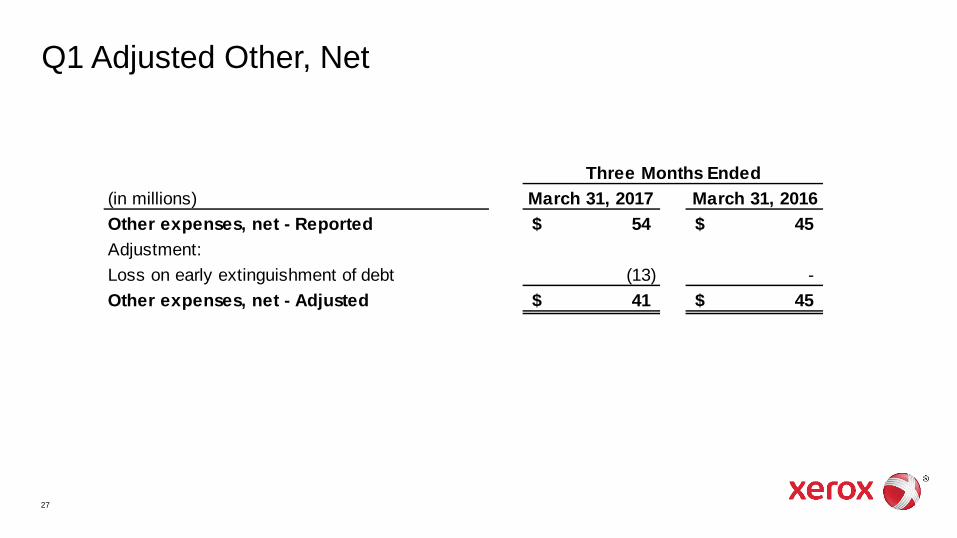
Q1 Adjusted Other, Net
(in millions) March 31, 2017 March 31, 2016Other expenses, net - Reported 54$ 45$ Adjustment:Loss on early extinguishment of debt (13) - Other expenses, net - Adjusted 41$ 45$
Three Months Ended
28
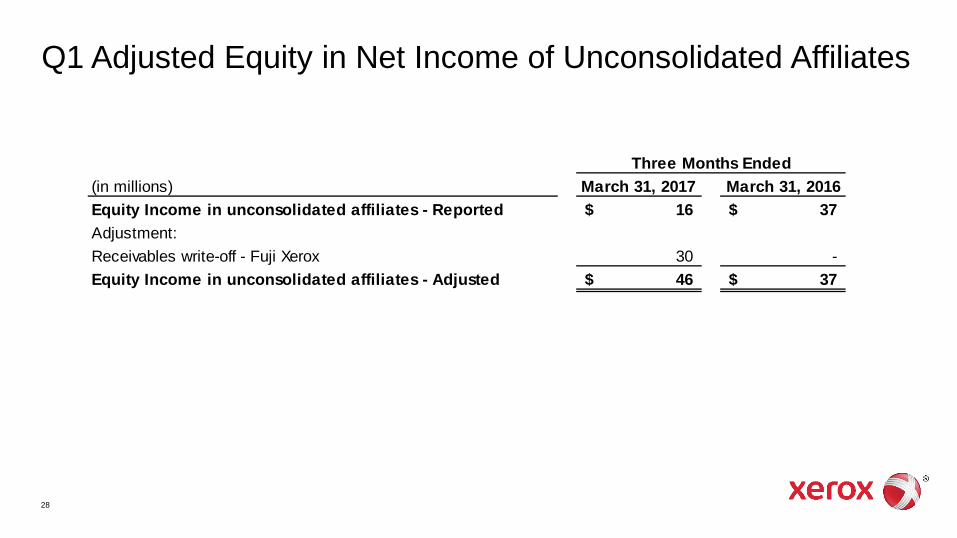
Q1 Adjusted Equity in Net Income of Unconsolidated Affiliates
(in millions) March 31, 2017 March 31, 2016Equity Income in unconsolidated affiliates - Reported 16$ 37$ Adjustment:Receivables write-off - Fuji Xerox 30 - Equity Income in unconsolidated affiliates - Adjusted 46$ 37$
Three Months Ended
© 2017 Xerox Corporation. All rights reserved. Xerox® and Xerox and Design® are trademarks of Xerox Corporation in the United States and/or other countries.