Embed Size (px)
Citation preview
First Quarter 2014 Earnings Review
April 14, 2014
Citi | Investor Relations
Performance impacted by macro environment
– Solid sequential rebound in Markets revenues
– Treasury & Trade Solutions continued to grow volumes and market share
– Revenue growth and positive operating leverage in International Consumer
Progress in key execution priorities
– Grew loans and deposits, while maintaining expense discipline
– Citi Holdings net loss reduced by over 60% year-over-year
– Private-label mortgage settlement – a further significant step in resolving
legacy issues
– Deferred tax assets reduced by approximately $1.1B in the quarter
Building a safer and sounder institution
– Estimated Basel III Tier 1 Common Ratio of 10.4%
– Estimated Basel III Supplementary Leverage Ratio of 5.6%
– Fully committed to improving our CCAR process and submission
Overview
2
Note: Throughout this presentation, all references to Citi’s estimated Basel III ratios and related components are based on Citi’s current interpretation, expectations and
understanding of the final U.S. Basel III rules. These estimates are subject to, among other things, any changes to the final U.S. Basel III rules, ongoing regulatory review,
regulatory approval of Citi’s credit, market and operational risk models, additional refinements, modifications or enhancements (whether required or otherwise) to Citi’s models
and further implementation guidance in the U.S.
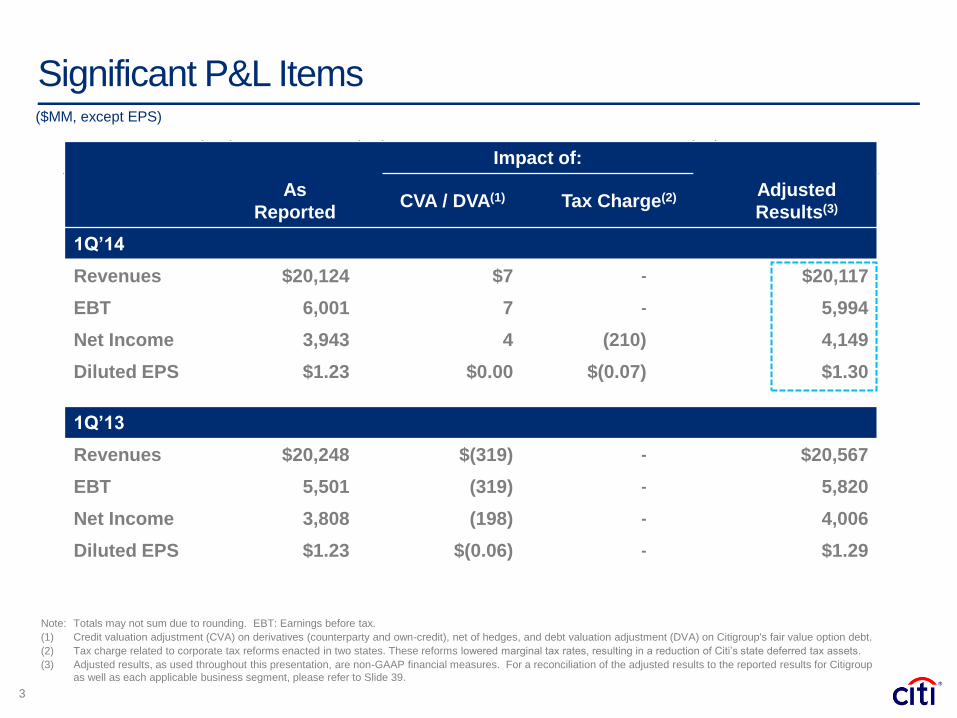
Impact of:
As
Reported CVA / DVA(1) Tax Charge(2) Adjusted
Results(3)
1Q’14
Revenues $20,124 $7 - $20,117
EBT 6,001 7 - 5,994
Net Income 3,943 4 (210) 4,149
Diluted EPS $1.23 $0.00 $(0.07) $1.30
1Q’13
Revenues $20,248 $(319) - $20,567
EBT 5,501 (319) - 5,820
Net Income 3,808 (198) - 4,006
Diluted EPS $1.23 $(0.06) - $1.29
Significant P&L Items
3
($MM, except EPS)
Note: Totals may not sum due to rounding. EBT: Earnings before tax.
(1) Credit valuation adjustment (CVA) on derivatives (counterparty and own-credit), net of hedges, and debt valuation adjustment (DVA) on Citigroup's fair value option debt.
(2) Tax charge related to corporate tax reforms enacted in two states. These reforms lowered marginal tax rates, resulting in a reduction of Citi’s state deferred tax assets.
(3) Adjusted results, as used throughout this presentation, are non-GAAP financial measures. For a reconciliation of the adjusted results to the reported results for Citigroup
as well as each applicable business segment, please refer to Slide 39.
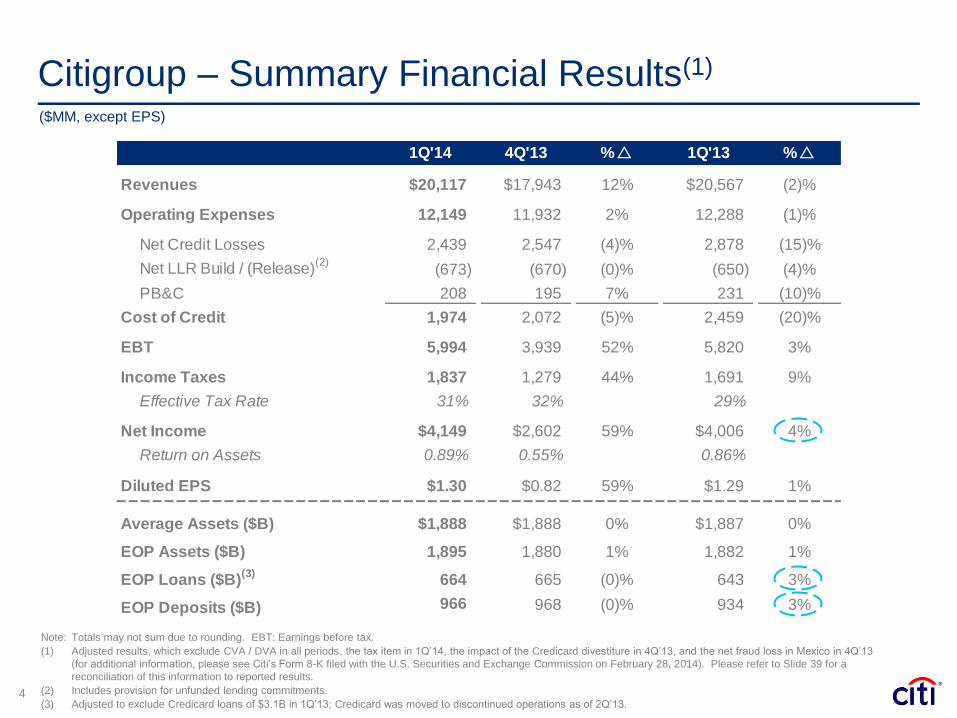
1Q'14 4Q'13 %r 1Q'13 %r
Revenues $20,117 $17,943 12% $20,567 (2)%
Operating Expenses 12,149 11,932 2% 12,288 (1)%
Net Credit Losses 2,439 2,547 (4)% 2,878 (15)%
Net LLR Build / (Release)(2)
(673) (670) (0)% (650) (4)%
PB&C 208 195 7% 231 (10)%
Cost of Credit 1,974 2,072 (5)% 2,459 (20)%
EBT 5,994 3,939 52% 5,820 3%
Income Taxes 1,837 1,279 44% 1,691 9%
Effective Tax Rate 31% 32% 29%
Net Income $4,149 $2,602 59% $4,006 4%
Return on Assets 0.89% 0.55% 0.86%
Diluted EPS $1.30 $0.82 59% $1.29 1%
Average Assets ($B) $1,888 $1,888 0% $1,887 0%
EOP Assets ($B) 1,895 1,880 1% 1,882 1%
EOP Loans ($B)(3)
664 665 (0)% 643 3%
EOP Deposits ($B) 966 968 (0)% 934 3%
Citigroup – Summary Financial Results(1)
4
($MM, except EPS)
Note: Totals may not sum due to rounding. EBT: Earnings before tax.
(1) Adjusted results, which exclude CVA / DVA in all periods, the tax item in 1Q’14, the impact of the Credicard divestiture in 4Q’13, and the net fraud loss in Mexico in 4Q’13
(for additional information, please see Citi’s Form 8-K filed with the U.S. Securities and Exchange Commission on February 28, 2014). Please refer to Slide 39 for a
reconciliation of this information to reported results.
(2) Includes provision for unfunded lending commitments.
(3) Adjusted to exclude Credicard loans of $3.1B in 1Q’13; Credicard was moved to discontinued operations as of 2Q’13.
Citigroup – Expense Comparison
5
1Q’14 4Q’13 1Q’13
Reported Expenses $12,149 $12,292 $12,288
Less:
Legal & Related $945 $809 $710
Repositioning Costs 211 234 148
Net Fraud Loss(1) ‒ 360 ‒
Compensatory Fees ‒ 33 ‒
Core Operating Expenses $10,994 $10,856 $11,430
Variance $138 $(436)
In Constant Dollars:
Core Operating Expenses $10,994 $10,795 $11,258
Variance $199 $(264)
Note: Totals may not sum due to rounding. Constant dollar excludes the impact of foreign exchange translation into U.S. dollars for reporting purposes. Results presented excluding
the impact of foreign exchange translation are non-GAAP financial metrics.
(1) Net fraud loss related to the fraud in Mexico. For additional information, please see Citi’s Form 8-K filed with the U.S. Securities and Exchange Commission on February 28,
2014.
($MM)
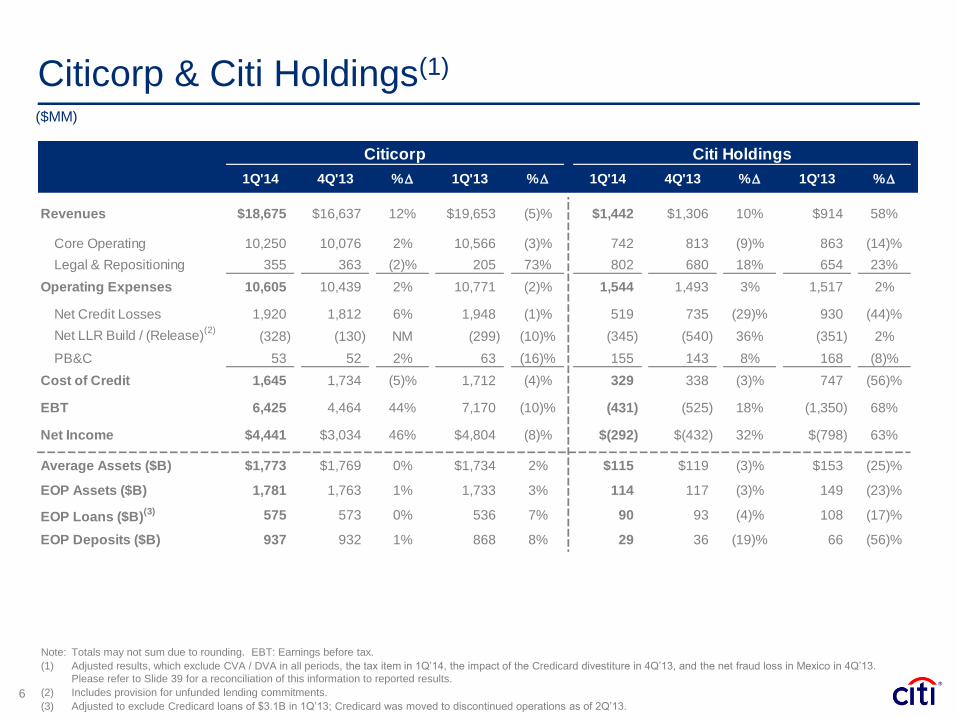
Citicorp & Citi Holdings(1)
6
($MM)
Note: Totals may not sum due to rounding. EBT: Earnings before tax.
(1) Adjusted results, which exclude CVA / DVA in all periods, the tax item in 1Q’14, the impact of the Credicard divestiture in 4Q’13, and the net fraud loss in Mexico in 4Q’13.
Please refer to Slide 39 for a reconciliation of this information to reported results.
(2) Includes provision for unfunded lending commitments.
(3) Adjusted to exclude Credicard loans of $3.1B in 1Q’13; Credicard was moved to discontinued operations as of 2Q’13.
1Q'14 4Q'13 %D 1Q'13 %D 1Q'14 4Q'13 %D 1Q'13 %D
Revenues $18,675 $16,637 12% $19,653 (5)% $1,442 $1,306 10% $914 58%
Core Operating 10,250 10,076 2% 10,566 (3)% 742 813 (9)% 863 (14)%
Legal & Repositioning 355 363 (2)% 205 73% 802 680 18% 654 23%
Operating Expenses 10,605 10,439 2% 10,771 (2)% 1,544 1,493 3% 1,517 2%
Net Credit Losses 1,920 1,812 6% 1,948 (1)% 519 735 (29)% 930 (44)%
Net LLR Build / (Release)(2)
(328) (130) NM (299) (10)% (345) (540) 36% (351) 2%
PB&C 53 52 2% 63 (16)% 155 143 8% 168 (8)%
Cost of Credit 1,645 1,734 (5)% 1,712 (4)% 329 338 (3)% 747 (56)%
EBT 6,425 4,464 44% 7,170 (10)% (431) (525) 18% (1,350) 68%
Net Income $4,441 $3,034 46% $4,804 (8)% $(292) $(432) 32% $(798) 63%
Average Assets ($B) $1,773 $1,769 0% $1,734 2% $115 $119 (3)% $153 (25)%
EOP Assets ($B) 1,781 1,763 1% 1,733 3% 114 117 (3)% 149 (23)%
EOP Loans ($B)(3) 575 573 0% 536 7% 90 93 (4)% 108 (17)%
EOP Deposits ($B) 937 932 1% 868 8% 29 36 (19)% 66 (56)%
Citi HoldingsCiticorp
7
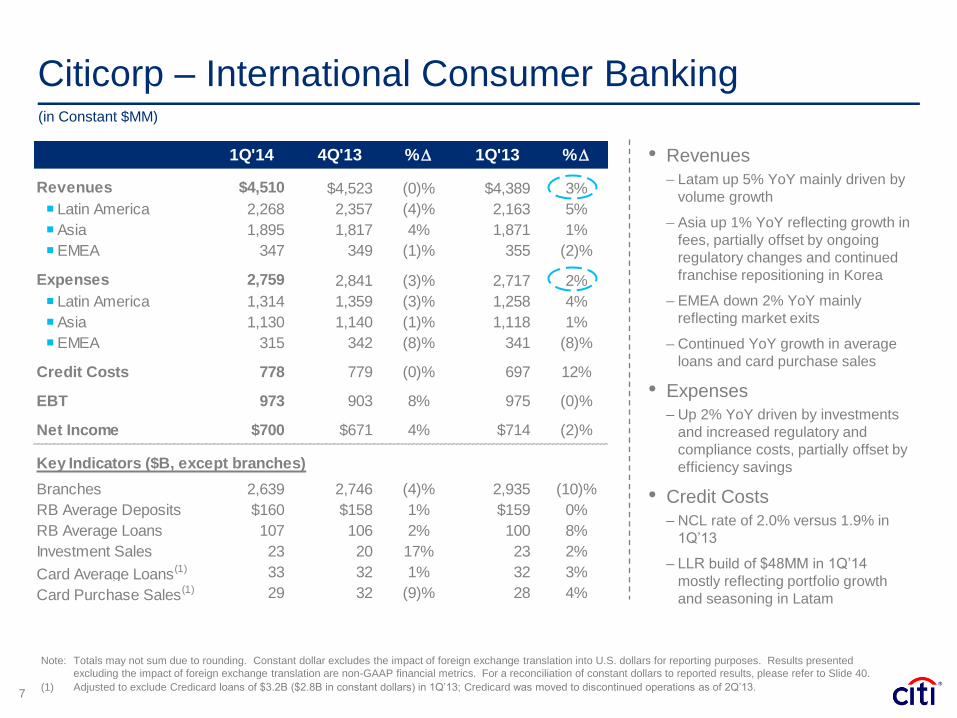
(in Constant $MM)
Citicorp – International Consumer Banking
Note: Totals may not sum due to rounding. Constant dollar excludes the impact of foreign exchange translation into U.S. dollars for reporting purposes. Results presented
excluding the impact of foreign exchange translation are non-GAAP financial metrics. For a reconciliation of constant dollars to reported results, please refer to Slide 40.
(1) Adjusted to exclude Credicard loans of $3.2B ($2.8B in constant dollars) in 1Q’13; Credicard was moved to discontinued operations as of 2Q’13.
• Revenues
– Latam up 5% YoY mainly driven by
volume growth
– Asia up 1% YoY reflecting growth in
fees, partially offset by ongoing
regulatory changes and continued
franchise repositioning in Korea
– EMEA down 2% YoY mainly
reflecting market exits
– Continued YoY growth in average
loans and card purchase sales
• Expenses
– Up 2% YoY driven by investments
and increased regulatory and
compliance costs, partially offset by
efficiency savings
• Credit Costs
– NCL rate of 2.0% versus 1.9% in
1Q’13
– LLR build of $48MM in 1Q’14
mostly reflecting portfolio growth
and seasoning in Latam
1Q'14 4Q'13 %D 1Q'13 %D
Revenues $4,510 $4,523 (0)% $4,389 3%
Latin America 2,268 2,357 (4)% 2,163 5%
Asia 1,895 1,817 4% 1,871 1%
EMEA 347 349 (1)% 355 (2)%
Expenses 2,759 2,841 (3)% 2,717 2%
Latin America 1,314 1,359 (3)% 1,258 4%
Asia 1,130 1,140 (1)% 1,118 1%
EMEA 315 342 (8)% 341 (8)%
Credit Costs 778 779 (0)% 697 12%
EBT 973 903 8% 975 (0)%
Net Income $700 $671 4% $714 (2)%
Key Indicators ($B, except branches)
Branches 2,639 2,746 (4)% 2,935 (10)%
RB Average Deposits $160 $158 1% $159 0%
RB Average Loans 107 106 2% 100 8%
Investment Sales 23 20 17% 23 2%
Card Average Loans(1) 33 32 1% 32 3%
Card Purchase Sales(1) 29 32 (9)% 28 4%
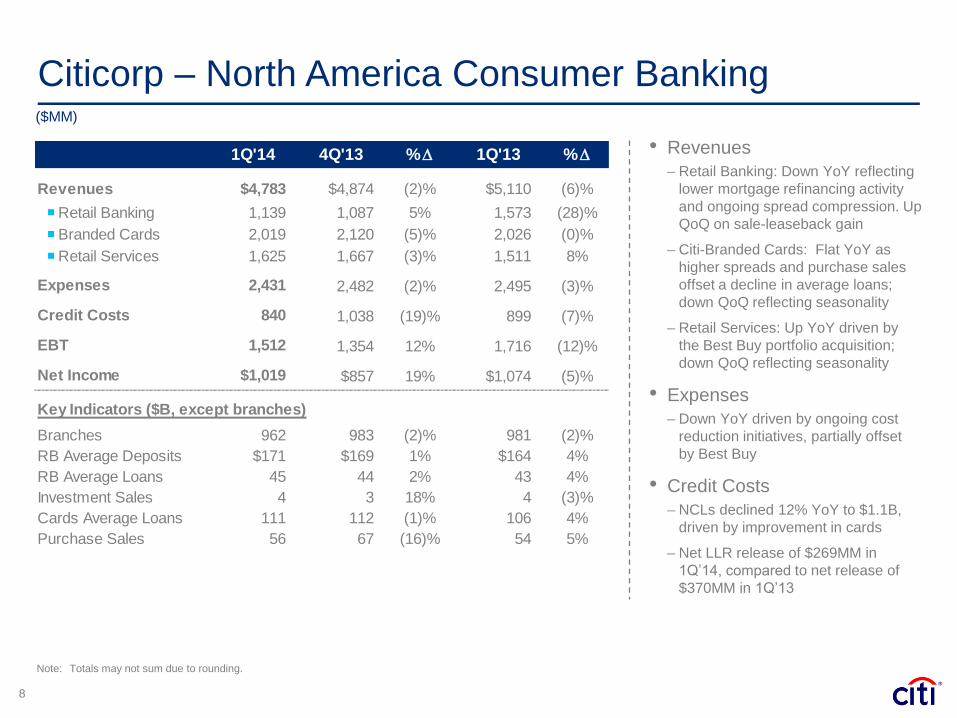
Citicorp – North America Consumer Banking
8
($MM)
Note: Totals may not sum due to rounding.
• Revenues
– Retail Banking: Down YoY reflecting
lower mortgage refinancing activity
and ongoing spread compression. Up
QoQ on sale-leaseback gain
– Citi-Branded Cards: Flat YoY as
higher spreads and purchase sales
offset a decline in average loans;
down QoQ reflecting seasonality
– Retail Services: Up YoY driven by
the Best Buy portfolio acquisition;
down QoQ reflecting seasonality
• Expenses
– Down YoY driven by ongoing cost
reduction initiatives, partially offset
by Best Buy
• Credit Costs
– NCLs declined 12% YoY to $1.1B,
driven by improvement in cards
– Net LLR release of $269MM in
1Q’14, compared to net release of
$370MM in 1Q’13
1Q'14 4Q'13 %D 1Q'13 %D
Revenues $4,783 $4,874 (2)% $5,110 (6)%
Retail Banking 1,139 1,087 5% 1,573 (28)%
Branded Cards 2,019 2,120 (5)% 2,026 (0)%
Retail Services 1,625 1,667 (3)% 1,511 8%
Expenses 2,431 2,482 (2)% 2,495 (3)%
Credit Costs 840 1,038 (19)% 899 (7)%
EBT 1,512 1,354 12% 1,716 (12)%
Net Income $1,019 $857 19% $1,074 (5)%
Key Indicators ($B, except branches)
Branches 962 983 (2)% 981 (2)%
RB Average Deposits $171 $169 1% $164 4%
RB Average Loans 45 44 2% 43 4%
Investment Sales 4 3 18% 4 (3)%
Cards Average Loans 111 112 (1)% 106 4%
Purchase Sales 56 67 (16)% 54 5%
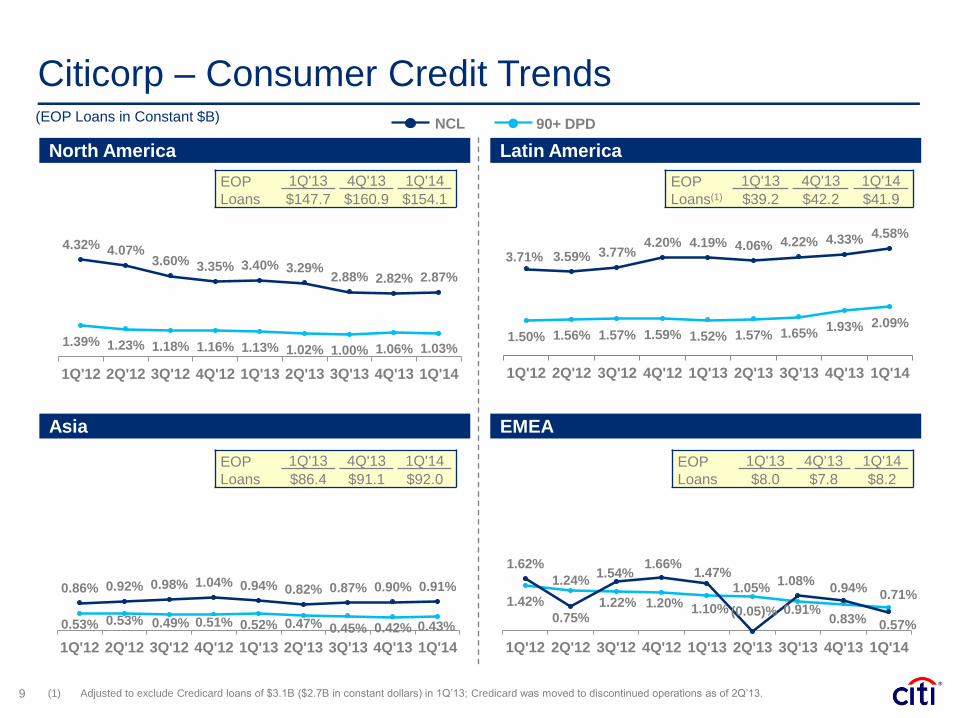
NCL
1.50% 1.56% 1.57% 1.59% 1.52% 1.57% 1.65% 1.93% 2.09%
3.71% 3.59% 3.77% 4.20% 4.19% 4.06% 4.22% 4.33% 4.58%
1Q'12 2Q'12 3Q'12 4Q'12 1Q'13 2Q'13 3Q'13 4Q'13 1Q'14
1.42%
1.24%
1.22% 1.20% 1.10%
1.05%
0.91% 0.83%
0.71%
1.62%
0.75%
1.54% 1.66%
1.47%
(0.05)%
1.08% 0.94%
0.57%
1Q'12 2Q'12 3Q'12 4Q'12 1Q'13 2Q'13 3Q'13 4Q'13 1Q'14
1.39% 1.23% 1.18% 1.16% 1.13% 1.02% 1.00% 1.06% 1.03%
4.32% 4.07% 3.60% 3.35% 3.40% 3.29%
2.88% 2.82% 2.87%
1Q'12 2Q'12 3Q'12 4Q'12 1Q'13 2Q'13 3Q'13 4Q'13 1Q'14
Citicorp – Consumer Credit Trends
9
Latin America North America
Asia EMEA
0.53% 0.53% 0.49% 0.51% 0.52% 0.47% 0.45% 0.42% 0.43%
0.86% 0.92% 0.98% 1.04% 0.94% 0.82% 0.87% 0.90% 0.91%
1Q'12 2Q'12 3Q'12 4Q'12 1Q'13 2Q'13 3Q'13 4Q'13 1Q'14
EOP
Loans
1Q'13 4Q'13 1Q'14
$147.7 $160.9 $154.1
EOP
Loans(1)
1Q'13 4Q'13 1Q'14
$39.2 $42.2 $41.9
EOP
Loans
1Q'13 4Q'13 1Q'14
$8.0 $7.8 $8.2
90+ DPD
(1) Adjusted to exclude Credicard loans of $3.1B ($2.7B in constant dollars) in 1Q’13; Credicard was moved to discontinued operations as of 2Q’13.
(EOP Loans in Constant $B)
EOP
Loans
1Q'13 4Q'13 1Q'14
$86.4 $91.1 $92.0
10
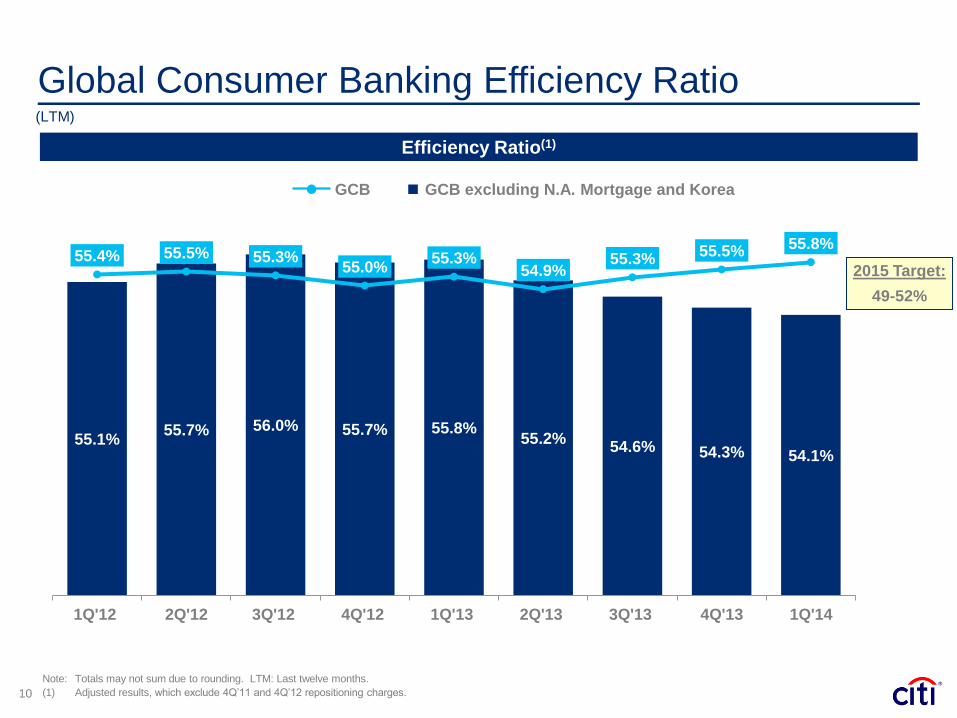
Global Consumer Banking Efficiency Ratio
Efficiency Ratio(1)
Note: Totals may not sum due to rounding. LTM: Last twelve months.
(1) Adjusted results, which exclude 4Q’11 and 4Q’12 repositioning charges.
55.1% 55.7% 56.0% 55.7% 55.8%
55.2% 54.6% 54.3% 54.1%
55.4% 55.5% 55.3% 55.0%
55.3% 54.9%
55.3% 55.5% 55.8%
1Q'12 2Q'12 3Q'12 4Q'12 1Q'13 2Q'13 3Q'13 4Q'13 1Q'14
(LTM)
GCB excluding N.A. Mortgage and Korea GCB
2015 Target:
49-52%

5.13 5.20 5.11 5.15 5.11
0.08 0.04 0.17
0.08
$5.21 $5.20 $5.16 $5.32
$5.19
1Q'13 2Q'13 3Q'13 4Q'13 1Q'14
11
Global Consumer Banking Expenses
(in constant $B)
Expenses
Core Expenses
Note: Totals may not sum due to rounding. Constant dollar excludes the impact of foreign exchange translation into U.S. dollars for reporting purposes. Results presented excluding
the impact of foreign exchange translation are non-GAAP financial metrics. For a reconciliation of constant dollars to reported results, please refer to Slide 40.
2014 Expense Drivers
Legal & Repositioning 4Q’12 1Q’14 4Q’14E
Headcount 158K 149K <145K
Cards Products 800+ 478 <440
Branches 4,008 3,601 <3,525
Support Sites 428 396 <320
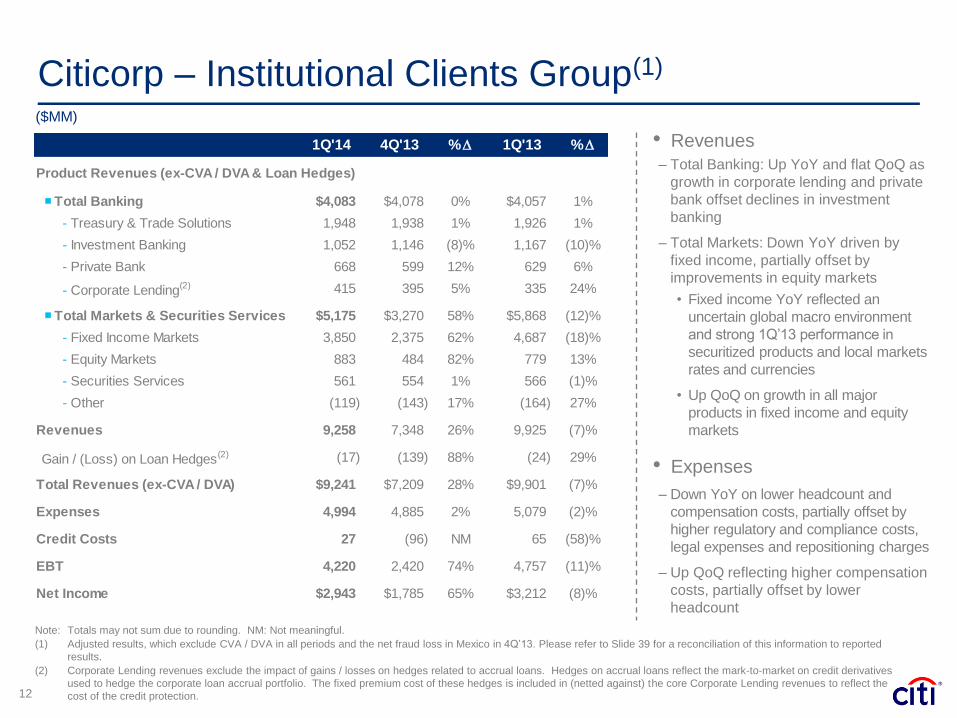
Citicorp – Institutional Clients Group(1)
12
Note: Totals may not sum due to rounding. NM: Not meaningful.
(1) Adjusted results, which exclude CVA / DVA in all periods and the net fraud loss in Mexico in 4Q’13. Please refer to Slide 39 for a reconciliation of this information to reported
results.
(2) Corporate Lending revenues exclude the impact of gains / losses on hedges related to accrual loans. Hedges on accrual loans reflect the mark-to-market on credit derivatives
used to hedge the corporate loan accrual portfolio. The fixed premium cost of these hedges is included in (netted against) the core Corporate Lending revenues to reflect the
cost of the credit protection.
($MM)
• Revenues
– Total Banking: Up YoY and flat QoQ as
growth in corporate lending and private
bank offset declines in investment
banking
– Total Markets: Down YoY driven by
fixed income, partially offset by
improvements in equity markets
• Fixed income YoY reflected an
uncertain global macro environment
and strong 1Q’13 performance in
securitized products and local markets
rates and currencies
• Up QoQ on growth in all major
products in fixed income and equity
markets
• Expenses
– Down YoY on lower headcount and
compensation costs, partially offset by
higher regulatory and compliance costs,
legal expenses and repositioning charges
– Up QoQ reflecting higher compensation
costs, partially offset by lower
headcount
1Q'14 4Q'13 %D 1Q'13 %D
Product Revenues (ex-CVA / DVA & Loan Hedges)
Total Banking $4,083 $4,078 0% $4,057 1%
- Treasury & Trade Solutions 1,948 1,938 1% 1,926 1%
- Investment Banking 1,052 1,146 (8)% 1,167 (10)%
- Private Bank 668 599 12% 629 6%
- Corporate Lending(2) 415 395 5% 335 24%
Total Markets & Securities Services $5,175 $3,270 58% $5,868 (12)%
- Fixed Income Markets 3,850 2,375 62% 4,687 (18)%
- Equity Markets 883 484 82% 779 13%
- Securities Services 561 554 1% 566 (1)%
- Other (119) (143) 17% (164) 27%
Revenues 9,258 7,348 26% 9,925 (7)%
Gain / (Loss) on Loan Hedges(2) (17) (139) 88% (24) 29%
Total Revenues (ex-CVA / DVA) $9,241 $7,209 28% $9,901 (7)%
Expenses 4,994 4,885 2% 5,079 (2)%
Credit Costs 27 (96) NM 65 (58)%
EBT 4,220 2,420 74% 4,757 (11)%
Net Income $2,943 $1,785 65% $3,212 (8)%
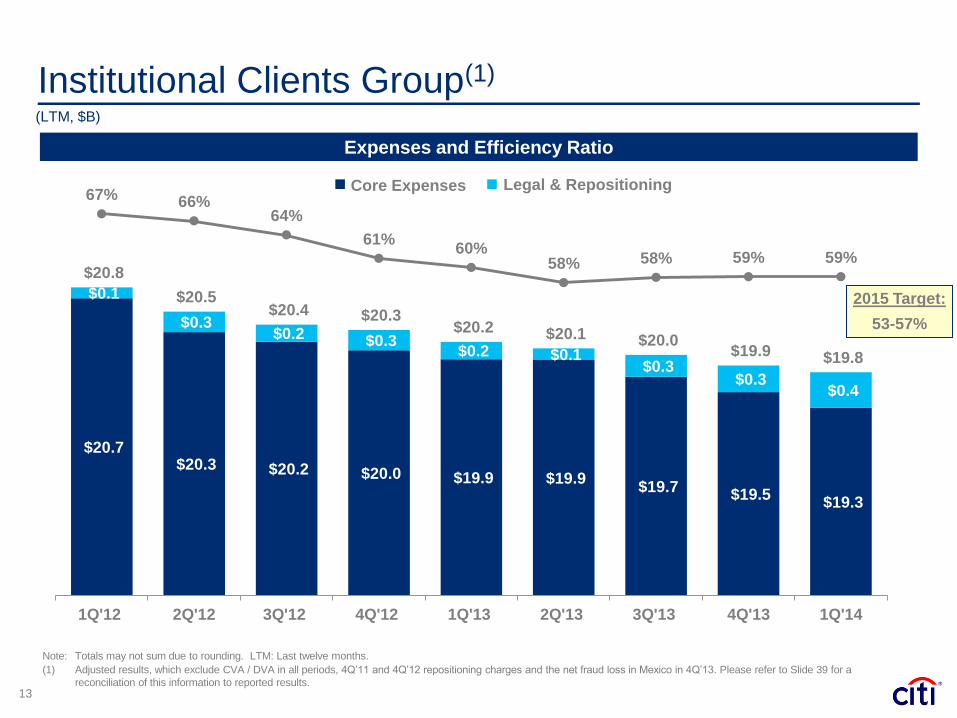
13
Institutional Clients Group(1)
(LTM, $B)
Expenses and Efficiency Ratio
Note: Totals may not sum due to rounding. LTM: Last twelve months.
(1) Adjusted results, which exclude CVA / DVA in all periods, 4Q’11 and 4Q’12 repositioning charges and the net fraud loss in Mexico in 4Q’13. Please refer to Slide 39 for a
reconciliation of this information to reported results.
$20.7 $20.3 $20.2 $20.0 $19.9 $19.9
$19.7 $19.5
$19.3
$0.1
$0.3 $0.2 $0.3
$0.2 $0.1 $0.3
$0.3 $0.4
$20.8
$20.5 $20.4 $20.3
$20.2 $20.1 $20.0 $19.9 $19.8
67% 66% 64%
61% 60%
58% 58% 59% 59%
15%
25%
35%
45%
55%
65%
1Q'12 2Q'12 3Q'12 4Q'12 1Q'13 2Q'13 3Q'13 4Q'13 1Q'14
Core Expenses Legal & Repositioning
2015 Target:
53-57%
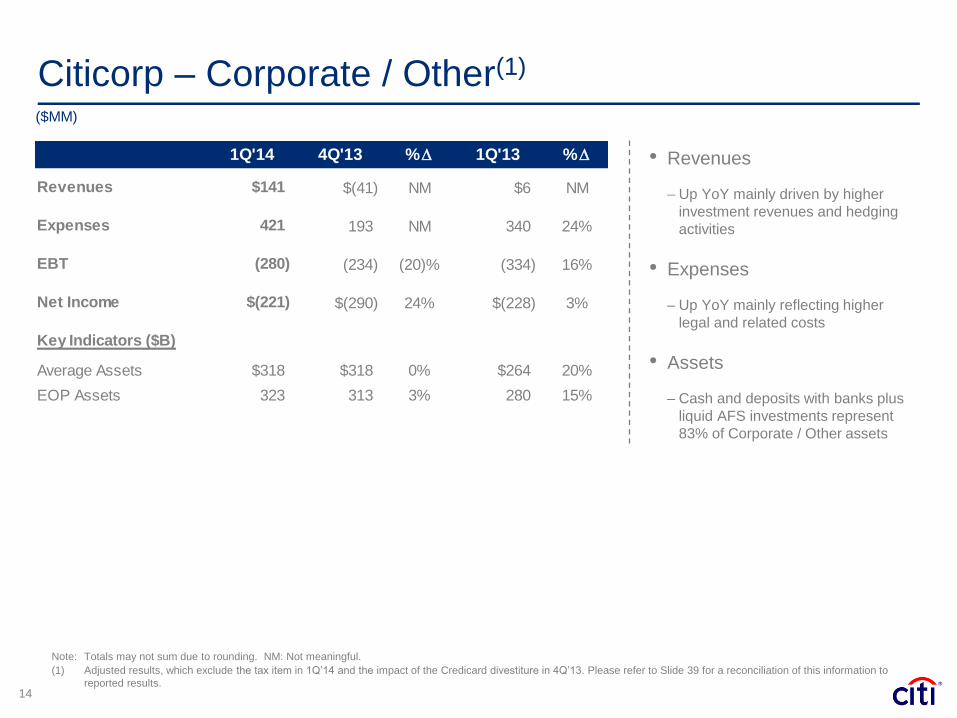
Citicorp – Corporate / Other(1)
14
($MM)
Note: Totals may not sum due to rounding. NM: Not meaningful.
(1) Adjusted results, which exclude the tax item in 1Q’14 and the impact of the Credicard divestiture in 4Q’13. Please refer to Slide 39 for a reconciliation of this information to
reported results.
• Revenues
– Up YoY mainly driven by higher
investment revenues and hedging
activities
• Expenses
– Up YoY mainly reflecting higher
legal and related costs
• Assets
– Cash and deposits with banks plus
liquid AFS investments represent
83% of Corporate / Other assets
1Q'14 4Q'13 %D 1Q'13 %D
Revenues $141 $(41) NM $6 NM
Expenses 421 193 NM 340 24%
EBT (280) (234) (20)% (334) 16%
Net Income $(221) $(290) 24% $(228) 3%
Key Indicators ($B)
Average Assets $318 $318 0% $264 20%
EOP Assets 323 313 3% 280 15%
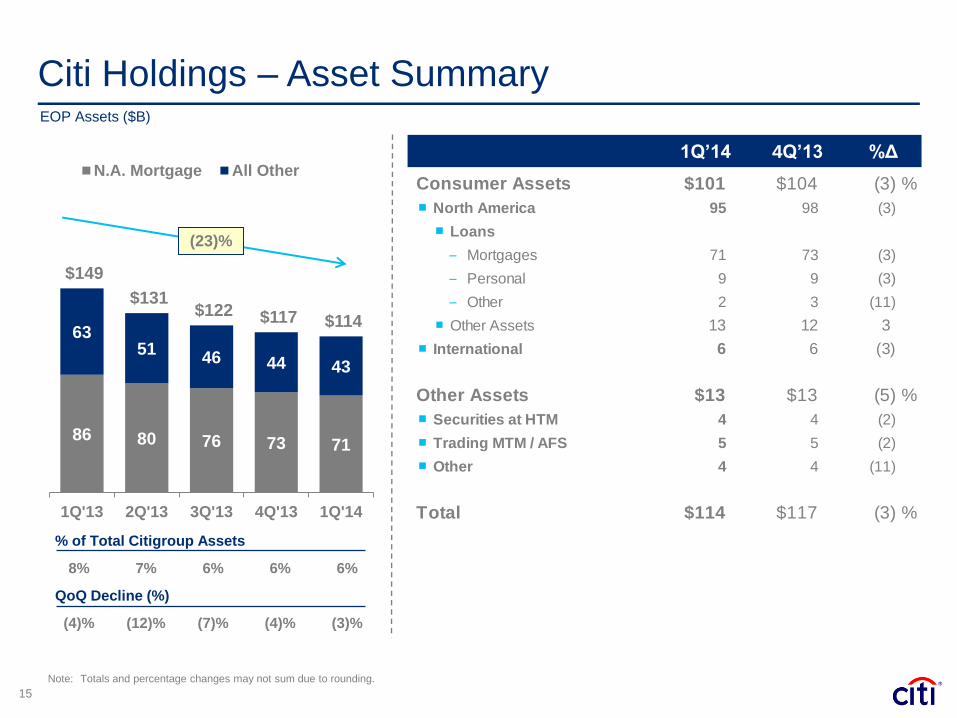
Citi Holdings – Asset Summary
15
1Q’14 4Q’13 %Δ
Note: Totals and percentage changes may not sum due to rounding.
% of Total Citigroup Assets
8% 7% 6% 6% 6%
QoQ Decline (%)
(4)% (12)% (7)% (4)% (3)%
EOP Assets ($B)
86 80 76 73 71
63 51
46 44 43
$149
$131 $122 $117 $114
1Q'13 2Q'13 3Q'13 4Q'13 1Q'14
N.A. Mortgage All Other
(23)%
Consumer Assets $101 $104 (3) %
North America 95 98 (3)
• Loans Loans
– Mortgages‒ Mortgages 71 73 (3)
– Personal‒ Personal 9 9 (3)
– Other‒ Other 2 3 (11)
• Other Assets Other Assets 13 12 3
International 6 6 (3)
Other Assets $13 $13 (5) %
Securities at HTM 4 4 (2)
Trading MTM / AFS 5 5 (2)
Other 4 4 (11)
Total $114 $117 (3) %
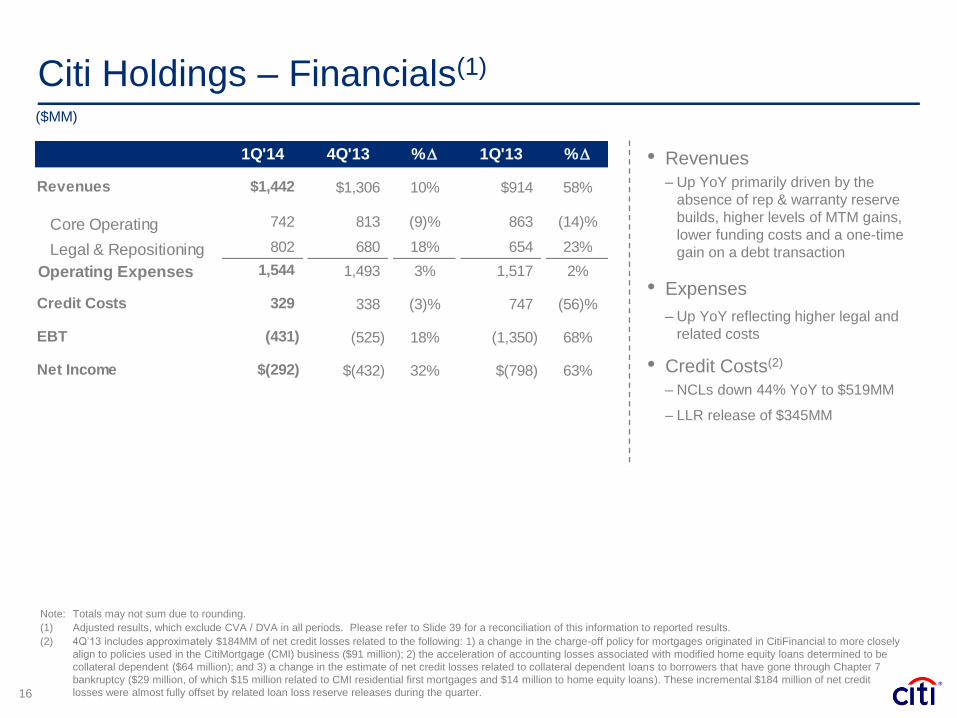
Citi Holdings – Financials(1)
16
($MM)
Note: Totals may not sum due to rounding.
(1) Adjusted results, which exclude CVA / DVA in all periods. Please refer to Slide 39 for a reconciliation of this information to reported results.
(2) 4Q’13 includes approximately $184MM of net credit losses related to the following: 1) a change in the charge-off policy for mortgages originated in CitiFinancial to more closely
align to policies used in the CitiMortgage (CMI) business ($91 million); 2) the acceleration of accounting losses associated with modified home equity loans determined to be
collateral dependent ($64 million); and 3) a change in the estimate of net credit losses related to collateral dependent loans to borrowers that have gone through Chapter 7
bankruptcy ($29 million, of which $15 million related to CMI residential first mortgages and $14 million to home equity loans). These incremental $184 million of net credit
losses were almost fully offset by related loan loss reserve releases during the quarter.
• Revenues
– Up YoY primarily driven by the
absence of rep & warranty reserve
builds, higher levels of MTM gains,
lower funding costs and a one-time
gain on a debt transaction
• Expenses
– Up YoY reflecting higher legal and
related costs
• Credit Costs(2)
– NCLs down 44% YoY to $519MM
– LLR release of $345MM
1Q'14 4Q'13 %D 1Q'13 %D
Revenues $1,442 $1,306 10% $914 58%
Core Operating 742 813 (9)% 863 (14)%
Legal & Repositioning 802 680 18% 654 23%
Operating Expenses 1,544 1,493 3% 1,517 2%
Credit Costs 329 338 (3)% 747 (56)%
EBT (431) (525) 18% (1,350) 68%
Net Income $(292) $(432) 32% $(798) 63%
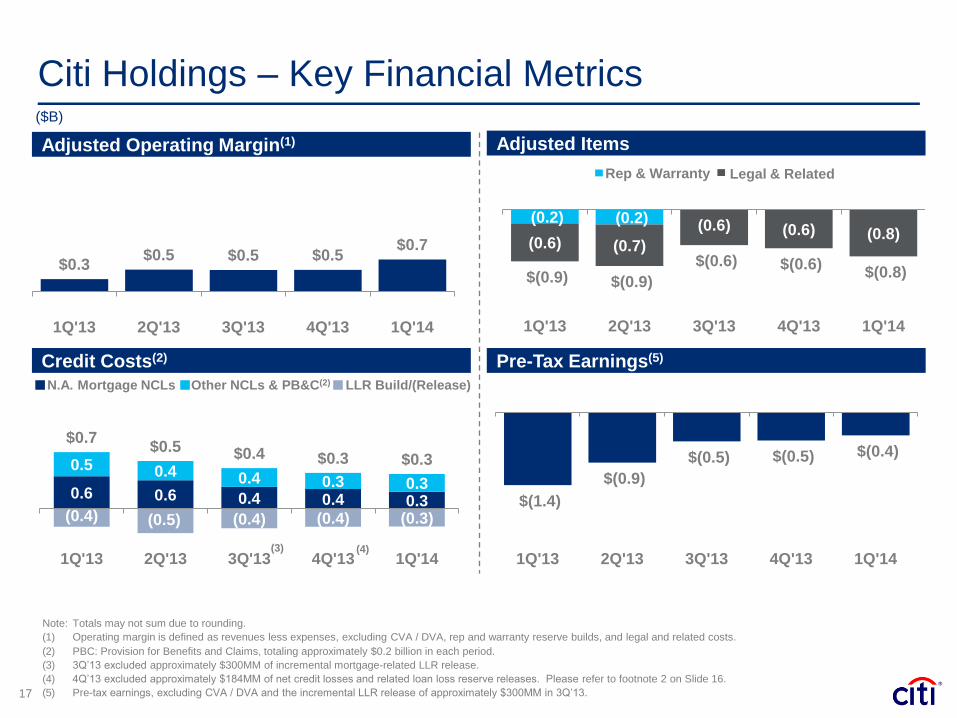
0.6 0.6 0.4 0.4 0.3
0.5 0.4 0.4 0.3 0.3
(0.4) (0.5) (0.4) (0.4) (0.3)
$0.7 $0.5 $0.4 $0.3 $0.3
1Q'13 2Q'13 3Q'13 4Q'13 1Q'14(3)
(0.2) (0.2)
(0.6) (0.7)
(0.6) (0.6) (0.8)
$(0.9) $(0.9)
$(0.6) $(0.6) $(0.8)
1Q'13 2Q'13 3Q'13 4Q'13 1Q'14
Legal & Related Rep & Warranty
$(1.4)
$(0.9)
$(0.5) $(0.5) $(0.4)
1Q'13 2Q'13 3Q'13 4Q'13 1Q'14
17
$0.3 $0.5 $0.5 $0.5
$0.7
1Q'13 2Q'13 3Q'13 4Q'13 1Q'14
Pre-Tax Earnings(5)
Adjusted Items Adjusted Operating Margin(1)
Credit Costs(2)
Note: Totals may not sum due to rounding.
(1) Operating margin is defined as revenues less expenses, excluding CVA / DVA, rep and warranty reserve builds, and legal and related costs.
(2) PBC: Provision for Benefits and Claims, totaling approximately $0.2 billion in each period.
(3) 3Q’13 excluded approximately $300MM of incremental mortgage-related LLR release.
(4) 4Q’13 excluded approximately $184MM of net credit losses and related loan loss reserve releases. Please refer to footnote 2 on Slide 16.
(5) Pre-tax earnings, excluding CVA / DVA and the incremental LLR release of approximately $300MM in 3Q’13.
($B)
Citi Holdings – Key Financial Metrics
N.A. Mortgage NCLs Other NCLs & PB&C(2) LLR Build/(Release)
(4)
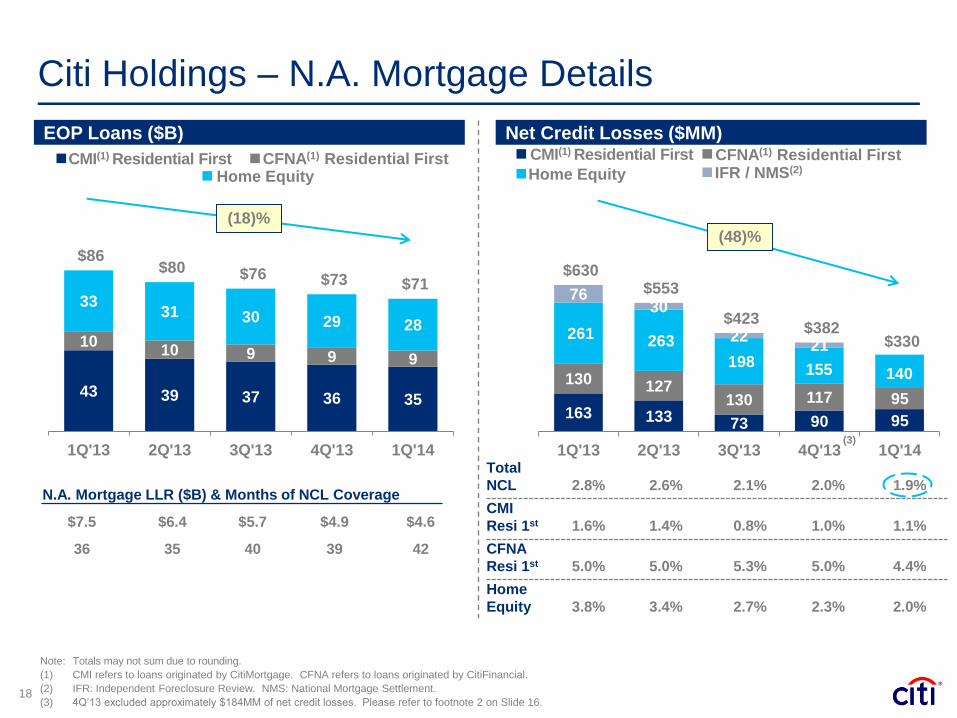
CMI(1) Residential First
N.A. Mortgage LLR ($B) & Months of NCL Coverage
$7.5 $6.4 $5.7 $4.9 $4.6
36 35 40 39 42
163 133 73 90 95
130 127 130 117 95
261 263
198 155 140
76 30
22 21
$630 $553
$423 $382
$330
1Q'13 2Q'13 3Q'13 4Q'13 1Q'14
Citi Holdings – N.A. Mortgage Details
18
43 39 37 36 35
10 10 9 9 9
33 31 30 29 28
$86 $80 $76 $73 $71
1Q'13 2Q'13 3Q'13 4Q'13 1Q'14
EOP Loans ($B) Net Credit Losses ($MM)
Note: Totals may not sum due to rounding.
(1) CMI refers to loans originated by CitiMortgage. CFNA refers to loans originated by CitiFinancial.
(2) IFR: Independent Foreclosure Review. NMS: National Mortgage Settlement.
(3) 4Q’13 excluded approximately $184MM of net credit losses. Please refer to footnote 2 on Slide 16.
(18)% (48)%
CMI(1) Residential First CFNA(1) Residential First Home Equity Home Equity IFR / NMS(2)
Total
NCL
2.8%
2.6%
2.1%
2.0%
1.9%
CMI
Resi 1st
1.6%
1.4%
0.8%
1.0%
1.1%
CFNA
Resi 1st
5.0%
5.0%
5.3%
5.0%
4.4%
Home
Equity
3.8%
3.4%
2.7%
2.3%
2.0%
CFNA(1) Residential First
(3)
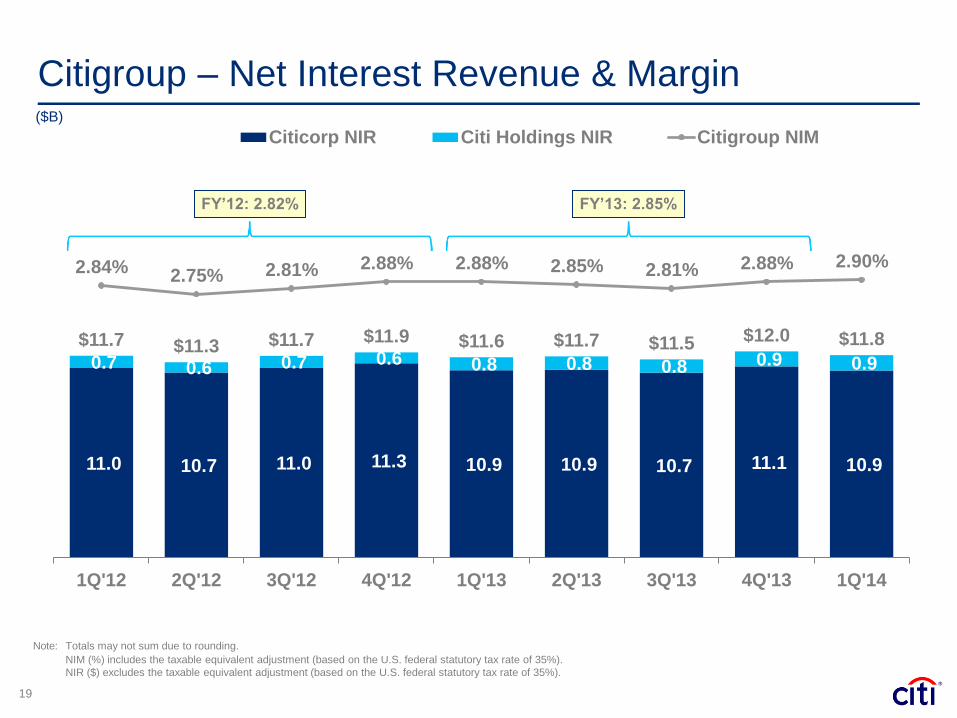
11.0 10.7 11.0 11.3 10.9 10.9 10.7 11.1 10.9
0.7 0.6 0.7 0.6 0.8 0.8 0.8 0.9 0.9
$11.7 $11.3 $11.7 $11.9 $11.6 $11.7 $11.5 $12.0 $11.8
2.84% 2.75% 2.81% 2.88% 2.88% 2.85% 2.81% 2.88% 2.90%
1Q'12 2Q'12 3Q'12 4Q'12 1Q'13 2Q'13 3Q'13 4Q'13 1Q'14
Citicorp NIR Citi Holdings NIR Citigroup NIM
Citigroup – Net Interest Revenue & Margin
19
FY’12: 2.82%
Note: Totals may not sum due to rounding.
NIM (%) includes the taxable equivalent adjustment (based on the U.S. federal statutory tax rate of 35%).
NIR ($) excludes the taxable equivalent adjustment (based on the U.S. federal statutory tax rate of 35%).
($B)
FY’13: 2.85%
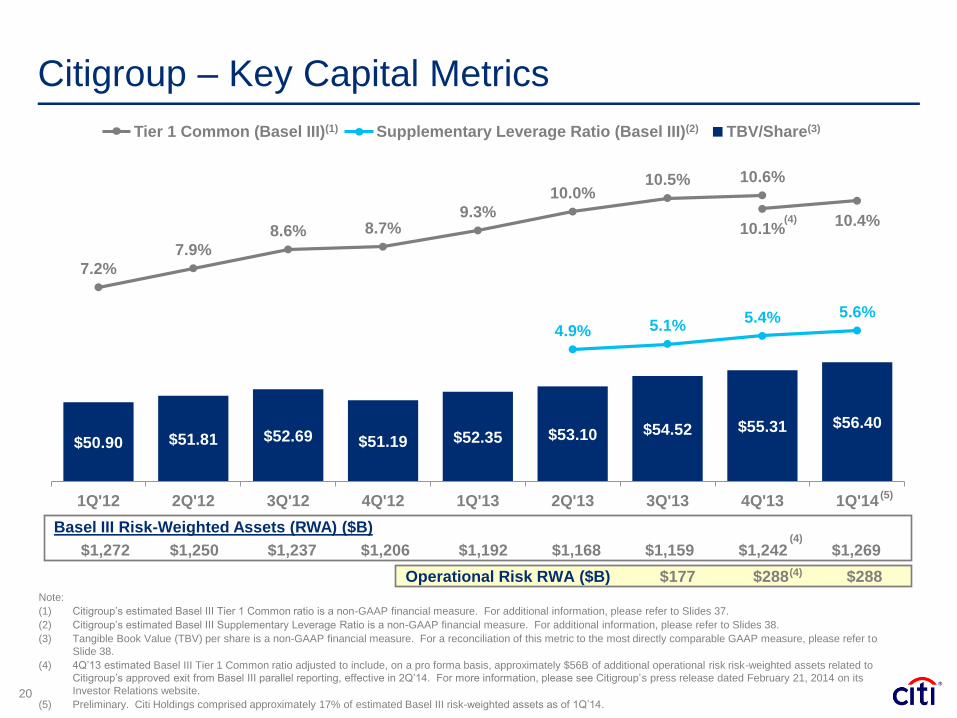
Operational Risk RWA ($B) $177 $288 $288
$50.90 $51.81 $52.69 $51.19 $52.35 $53.10 $54.52 $55.31 $56.40
7.2%
7.9%
8.6% 8.7% 9.3%
10.0% 10.5% 10.6%
10.1% 10.4%
4.9% 5.1% 5.4% 5.6%
0.0%
2.0%
4.0%
6.0%
8.0%
10.0%
12.0%
1Q'12 2Q'12 3Q'12 4Q'12 1Q'13 2Q'13 3Q'13 4Q'13 1Q'14
40.00
45.00
50.00
55.00
60.00
65.00
70.00
75.00
80.00
85.00
90.00
Basel III Risk-Weighted Assets (RWA) ($B)
$1,272 $1,250 $1,237 $1,206 $1,192 $1,168 $1,159 $1,242 $1,269
Citigroup – Key Capital Metrics
20
(5)
(4)
Note:
(1) Citigroup’s estimated Basel III Tier 1 Common ratio is a non-GAAP financial measure. For additional information, please refer to Slides 37.
(2) Citigroup’s estimated Basel III Supplementary Leverage Ratio is a non-GAAP financial measure. For additional information, please refer to Slides 38.
(3) Tangible Book Value (TBV) per share is a non-GAAP financial measure. For a reconciliation of this metric to the most directly comparable GAAP measure, please refer to
Slide 38.
(4) 4Q’13 estimated Basel III Tier 1 Common ratio adjusted to include, on a pro forma basis, approximately $56B of additional operational risk risk-weighted assets related to
Citigroup’s approved exit from Basel III parallel reporting, effective in 2Q’14. For more information, please see Citigroup’s press release dated February 21, 2014 on its
Investor Relations website.
(5) Preliminary. Citi Holdings comprised approximately 17% of estimated Basel III risk-weighted assets as of 1Q’14.
Tier 1 Common (Basel III)(1) Supplementary Leverage Ratio (Basel III)(2) TBV/Share(3)
(4)
(4)
Conclusions
21
Results show progress despite difficult operating environment
– Solid sequential rebound in Markets revenues
– Continued growth in International Consumer, with positive operating leverage
– Significant reduction in Citi Holdings loss year-over-year
Strong capital and liquidity position
– Deferred tax assets reduced by approximately $1.1B in the quarter
– Estimated Basel III Tier 1 Common Ratio of 10.4%
– Estimated Basel III Supplementary Leverage Ratio of 5.6%
Key execution priorities
– Grow Citicorp while improving operating efficiency
– Maintain credit discipline
– Focused on resolving legacy issues in Citi Holdings
– Fully committed to improving our CCAR process and submission
Certain statements in this document are “forward-looking statements”
within the meaning of the U.S. Private Securities Litigation Reform Act of
1995. These statements are based on management’s current
expectations and are subject to uncertainty and changes in circumstances.
These statements are not guarantees of future results or occurrences.
Actual results and capital and other financial condition may differ materially
from those included in these statements due to a variety of factors,
including the precautionary statements included in this document and
those contained in Citigroup’s filings with the U.S. Securities and
Exchange Commission, including without limitation the “Risk Factors”
section of Citigroup’s 2013 Form 10-K. Any forward-looking statements
made by or on behalf of Citigroup speak only as to the date they are made,
and Citi does not undertake to update forward-looking statements to reflect
the impact of circumstances or events that arise after the date the forward-
looking statements were made.
22
Appendix
24
25. Citigroup – LTM Returns Analysis
26. Citicorp – Repositioning Summary
27. Citicorp – Efficiency Ratios & Targets
28. Citigroup – Loan Loss Reserve Build /
(Release)
29. Citigroup – Estimated FX Impact on Key
P&L Metrics
30. Citicorp – Consumer Credit
31. Citicorp – Drivers in Constant Dollars
32. Citicorp – Drivers in Constant Dollars
(cont’d)
33. Citi Holdings – N.A. Mortgage
Delinquencies
34. Citi Holdings – Other Assets
35. Citigroup – Preferred Stock Dividend
Schedule
36. Citigroup – Equity & Capital Drivers (QoQ)
37. Basel III Capital Reconciliation
38. Tangible Common Equity Reconciliation &
Basel III Supplementary Leverage Ratio
Disclosure
39. Adjusted Results Reconciliation
40. FX Impact Reconciliation
Table of Contents
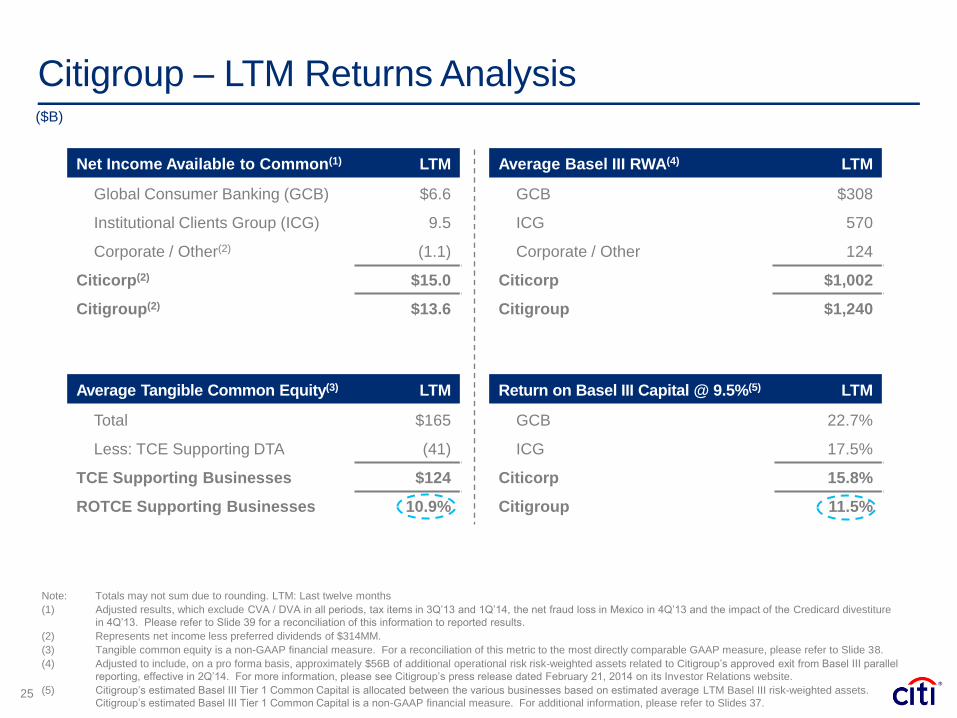
Citigroup – LTM Returns Analysis
25
Note: Totals may not sum due to rounding. LTM: Last twelve months
(1) Adjusted results, which exclude CVA / DVA in all periods, tax items in 3Q’13 and 1Q’14, the net fraud loss in Mexico in 4Q’13 and the impact of the Credicard divestiture
in 4Q’13. Please refer to Slide 39 for a reconciliation of this information to reported results.
(2) Represents net income less preferred dividends of $314MM.
(3) Tangible common equity is a non-GAAP financial measure. For a reconciliation of this metric to the most directly comparable GAAP measure, please refer to Slide 38.
(4) Adjusted to include, on a pro forma basis, approximately $56B of additional operational risk risk-weighted assets related to Citigroup’s approved exit from Basel III parallel
reporting, effective in 2Q’14. For more information, please see Citigroup’s press release dated February 21, 2014 on its Investor Relations website.
(5) Citigroup’s estimated Basel III Tier 1 Common Capital is allocated between the various businesses based on estimated average LTM Basel III risk-weighted assets.
Citigroup’s estimated Basel III Tier 1 Common Capital is a non-GAAP financial measure. For additional information, please refer to Slides 37.
Return on Basel III Capital @ 9.5%(5) LTM
GCB 22.7%
ICG 17.5%
Citicorp 15.8%
Citigroup 11.5%
Average Basel III RWA(4) LTM
GCB $308
ICG 570
Corporate / Other 124
Citicorp $1,002
Citigroup $1,240
Net Income Available to Common(1) LTM
Global Consumer Banking (GCB) $6.6
Institutional Clients Group (ICG) 9.5
Corporate / Other(2) (1.1)
Citicorp(2) $15.0
Citigroup(2) $13.6
Average Tangible Common Equity(3) LTM
Total $165
Less: TCE Supporting DTA (41)
TCE Supporting Businesses $124
ROTCE Supporting Businesses 10.9%
($B)
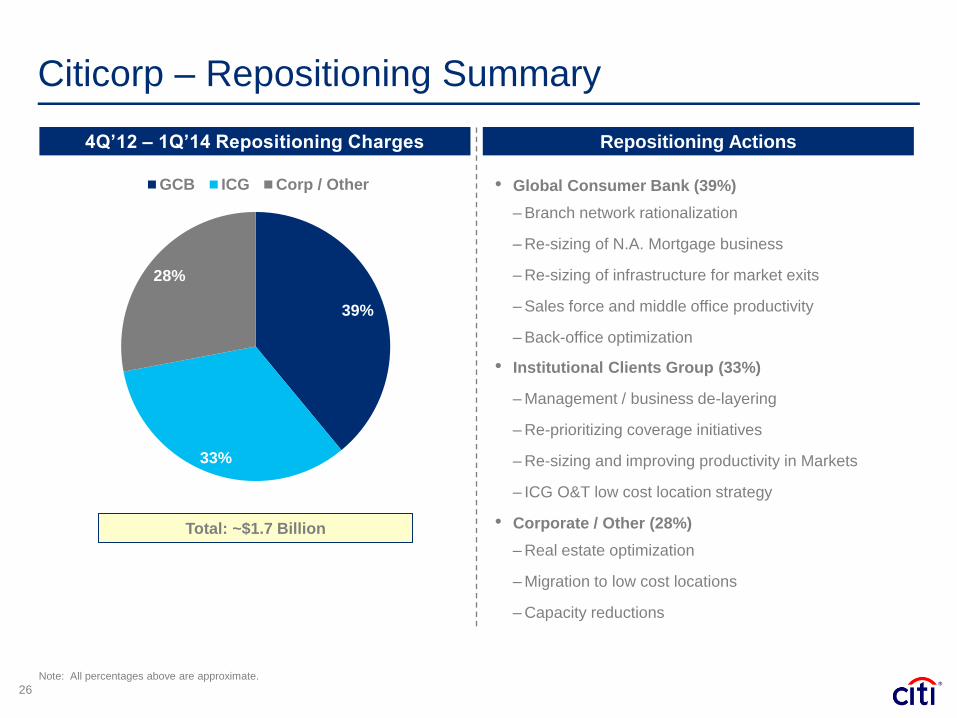
Citicorp – Repositioning Summary
26
39%
33%
28%
GCB ICG Corp / Other
Total: ~$1.7 Billion
4Q’12 – 1Q’14 Repositioning Charges
• Global Consumer Bank (39%)
– Branch network rationalization
– Re-sizing of N.A. Mortgage business
– Re-sizing of infrastructure for market exits
– Sales force and middle office productivity
– Back-office optimization
• Institutional Clients Group (33%)
– Management / business de-layering
– Re-prioritizing coverage initiatives
– Re-sizing and improving productivity in Markets
– ICG O&T low cost location strategy
• Corporate / Other (28%)
– Real estate optimization
– Migration to low cost locations
– Capacity reductions
Repositioning Actions
Note: All percentages above are approximate.
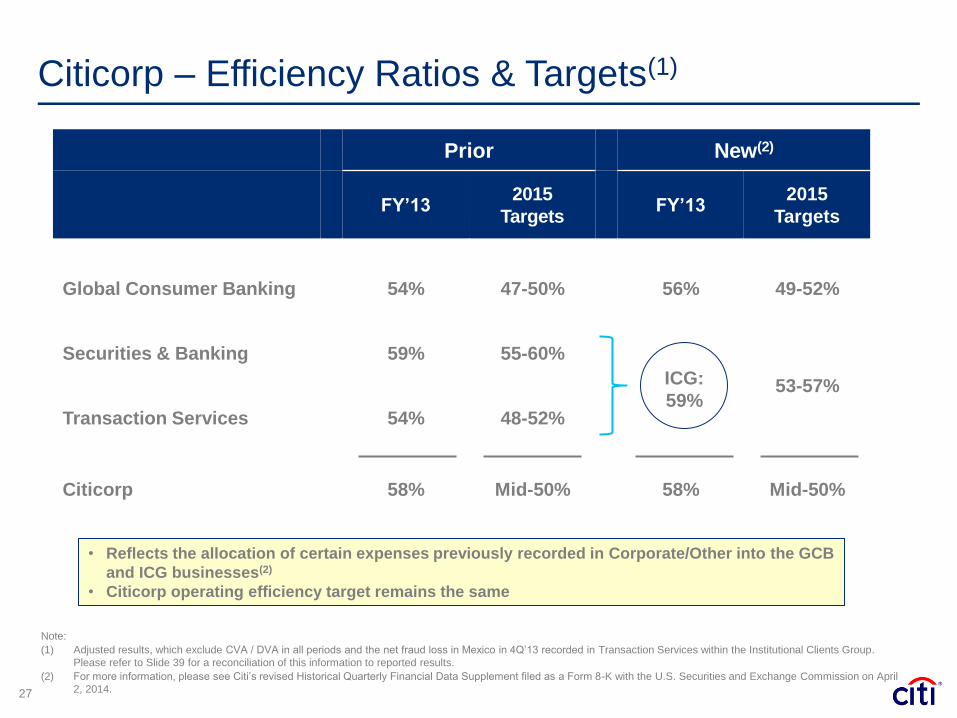
Prior New(2)
FY’13 2015
Targets FY’13 2015
Targets
Global Consumer Banking 54% 47-50% 56% 49-52%
Securities & Banking 59% 55-60%
53-57%
Transaction Services 54% 48-52%
Citicorp 58% Mid-50% 58% Mid-50%
Citicorp – Efficiency Ratios & Targets(1)
27
Note:
(1) Adjusted results, which exclude CVA / DVA in all periods and the net fraud loss in Mexico in 4Q’13 recorded in Transaction Services within the Institutional Clients Group.
Please refer to Slide 39 for a reconciliation of this information to reported results.
(2) For more information, please see Citi’s revised Historical Quarterly Financial Data Supplement filed as a Form 8-K with the U.S. Securities and Exchange Commission on April
2, 2014.
ICG:
59%
• Reflects the allocation of certain expenses previously recorded in Corporate/Other into the GCB
and ICG businesses(2)
• Citicorp operating efficiency target remains the same

Citigroup – Loan Loss Reserve Build / (Release)(1)
28
$ Change
1Q’14 4Q’13 1Q’13 QoQ YoY
NA Consumer $(269) $(84) $(370) $(185) $101
International Consumer 48 75 45 (27) 3
Global Consumer $(221) $(9) $(325) $(212) $104
ICG (107) (121) 26 14 (133)
Citicorp $(328) $(130) $(299) $(198) $(29)
Citi Holdings (345) (540) (351) 195 6
Citigroup $(673) $(670) $(650) $(3) $(23)
Note: Totals may not sum due to rounding.
(1) Includes provision for unfunded lending commitments.
($MM)
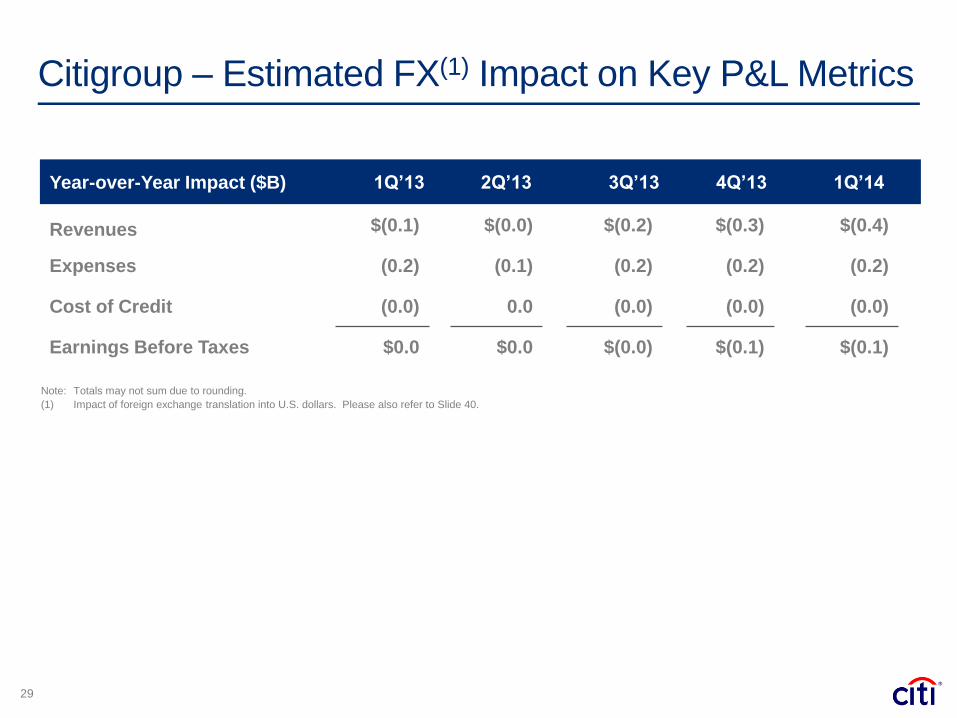
Citigroup – Estimated FX(1) Impact on Key P&L Metrics
29
Note: Totals may not sum due to rounding.
(1) Impact of foreign exchange translation into U.S. dollars. Please also refer to Slide 40.
Year-over-Year Impact ($B) 1Q’13 2Q’13 3Q’13 4Q’13 1Q’14
Revenues $(0.1) $(0.0) $(0.2) $(0.3) $(0.4)
Expenses (0.2) (0.1) (0.2) (0.2) (0.2)
Cost of Credit (0.0) 0.0 (0.0) (0.0) (0.0)
Earnings Before Taxes $0.0 $0.0 $(0.0) $(0.1) $(0.1)
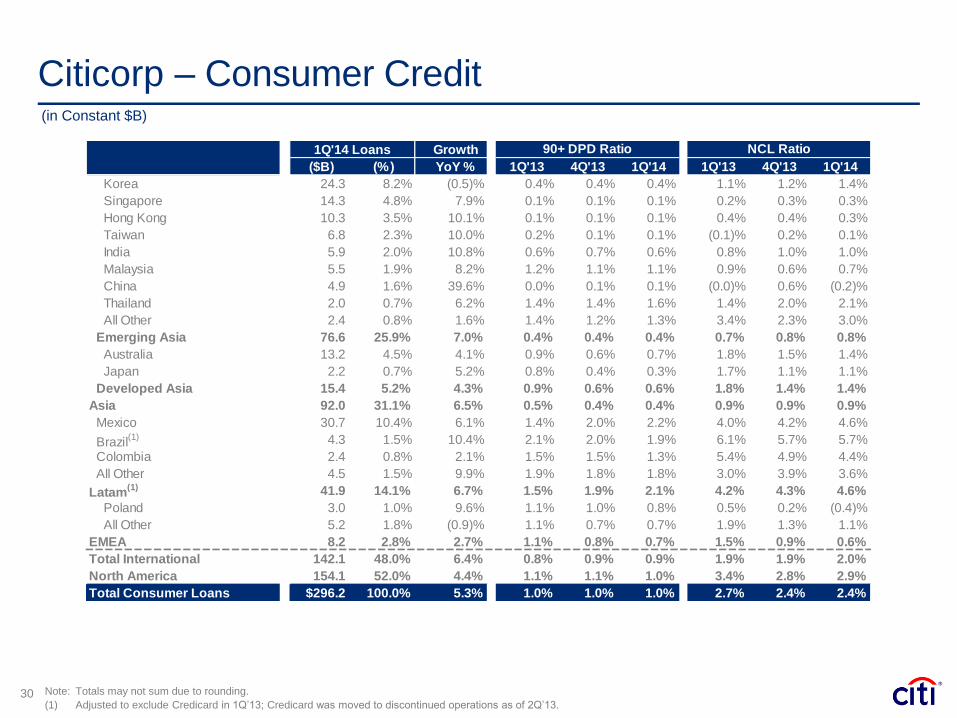
Citicorp – Consumer Credit
30 Note: Totals may not sum due to rounding.
(1) Adjusted to exclude Credicard in 1Q’13; Credicard was moved to discontinued operations as of 2Q’13.
(in Constant $B)
Growth
($B) (%) YoY % 1Q'13 4Q'13 1Q'14 1Q'13 4Q'13 1Q'14
Korea 24.3 8.2% (0.5)% 0.4% 0.4% 0.4% 1.1% 1.2% 1.4%
Singapore 14.3 4.8% 7.9% 0.1% 0.1% 0.1% 0.2% 0.3% 0.3%
Hong Kong 10.3 3.5% 10.1% 0.1% 0.1% 0.1% 0.4% 0.4% 0.3%
Taiwan 6.8 2.3% 10.0% 0.2% 0.1% 0.1% (0.1)% 0.2% 0.1%
India 5.9 2.0% 10.8% 0.6% 0.7% 0.6% 0.8% 1.0% 1.0%
Malaysia 5.5 1.9% 8.2% 1.2% 1.1% 1.1% 0.9% 0.6% 0.7%
China 4.9 1.6% 39.6% 0.0% 0.1% 0.1% (0.0)% 0.6% (0.2)%
Thailand 2.0 0.7% 6.2% 1.4% 1.4% 1.6% 1.4% 2.0% 2.1%
All Other 2.4 0.8% 1.6% 1.4% 1.2% 1.3% 3.4% 2.3% 3.0%
Emerging Asia 76.6 25.9% 7.0% 0.4% 0.4% 0.4% 0.7% 0.8% 0.8%
Australia 13.2 4.5% 4.1% 0.9% 0.6% 0.7% 1.8% 1.5% 1.4%
Japan 2.2 0.7% 5.2% 0.8% 0.4% 0.3% 1.7% 1.1% 1.1%
Developed Asia 15.4 5.2% 4.3% 0.9% 0.6% 0.6% 1.8% 1.4% 1.4%
Asia 92.0 31.1% 6.5% 0.5% 0.4% 0.4% 0.9% 0.9% 0.9%
Mexico 30.7 10.4% 6.1% 1.4% 2.0% 2.2% 4.0% 4.2% 4.6%
Brazil(1) 4.3 1.5% 10.4% 2.1% 2.0% 1.9% 6.1% 5.7% 5.7%
Colombia 2.4 0.8% 2.1% 1.5% 1.5% 1.3% 5.4% 4.9% 4.4%
All Other 4.5 1.5% 9.9% 1.9% 1.8% 1.8% 3.0% 3.9% 3.6%
Latam(1) 41.9 14.1% 6.7% 1.5% 1.9% 2.1% 4.2% 4.3% 4.6%
Poland 3.0 1.0% 9.6% 1.1% 1.0% 0.8% 0.5% 0.2% (0.4)%
All Other 5.2 1.8% (0.9)% 1.1% 0.7% 0.7% 1.9% 1.3% 1.1%
EMEA 8.2 2.8% 2.7% 1.1% 0.8% 0.7% 1.5% 0.9% 0.6%
Total International 142.1 48.0% 6.4% 0.8% 0.9% 0.9% 1.9% 1.9% 2.0%
North America 154.1 52.0% 4.4% 1.1% 1.1% 1.0% 3.4% 2.8% 2.9%
Total Consumer Loans $296.2 100.0% 5.3% 1.0% 1.0% 1.0% 2.7% 2.4% 2.4%
1Q'14 Loans 90+ DPD Ratio NCL Ratio
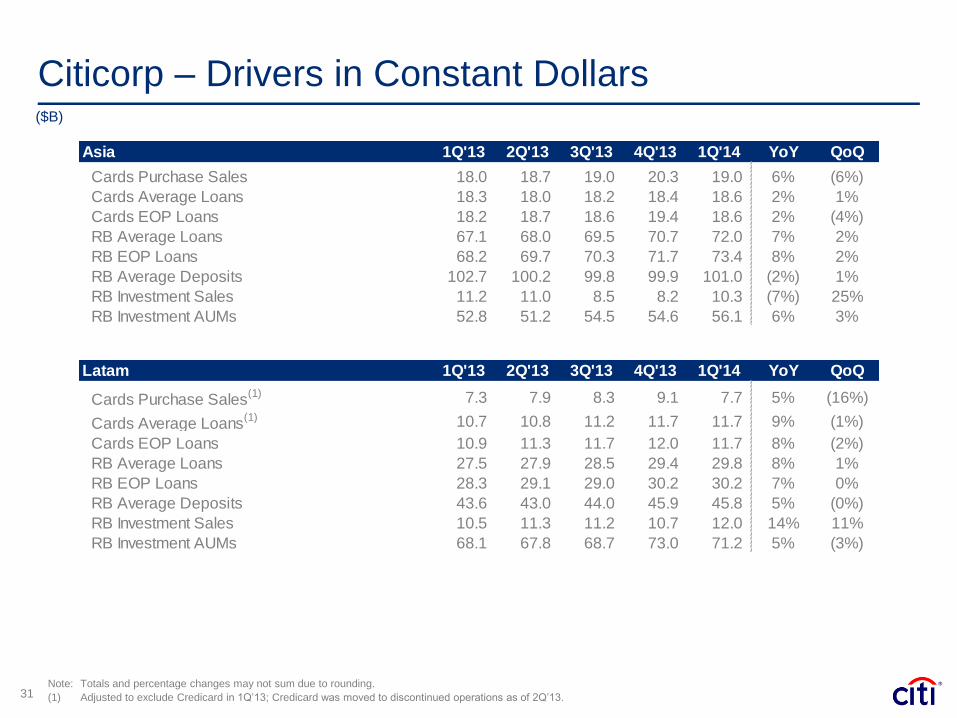
Citicorp – Drivers in Constant Dollars
31 Note: Totals and percentage changes may not sum due to rounding.
(1) Adjusted to exclude Credicard in 1Q’13; Credicard was moved to discontinued operations as of 2Q’13.
($B)
Asia 1Q'13 2Q'13 3Q'13 4Q'13 1Q'14 YoY QoQ
Cards Purchase Sales 18.0 18.7 19.0 20.3 19.0 6% (6%)
Cards Average Loans 18.3 18.0 18.2 18.4 18.6 2% 1%
Cards EOP Loans 18.2 18.7 18.6 19.4 18.6 2% (4%)
RB Average Loans 67.1 68.0 69.5 70.7 72.0 7% 2%
RB EOP Loans 68.2 69.7 70.3 71.7 73.4 8% 2%
RB Average Deposits 102.7 100.2 99.8 99.9 101.0 (2%) 1%
RB Investment Sales 11.2 11.0 8.5 8.2 10.3 (7%) 25%
RB Investment AUMs 52.8 51.2 54.5 54.6 56.1 6% 3%
Latam 1Q'13 2Q'13 3Q'13 4Q'13 1Q'14 YoY QoQ
Cards Purchase Sales(1) 7.3 7.9 8.3 9.1 7.7 5% (16%)
Cards Average Loans(1) 10.7 10.8 11.2 11.7 11.7 9% (1%)
Cards EOP Loans 10.9 11.3 11.7 12.0 11.7 8% (2%)
RB Average Loans 27.5 27.9 28.5 29.4 29.8 8% 1%
RB EOP Loans 28.3 29.1 29.0 30.2 30.2 7% 0%
RB Average Deposits 43.6 43.0 44.0 45.9 45.8 5% (0%)
RB Investment Sales 10.5 11.3 11.2 10.7 12.0 14% 11%
RB Investment AUMs 68.1 67.8 68.7 73.0 71.2 5% (3%)
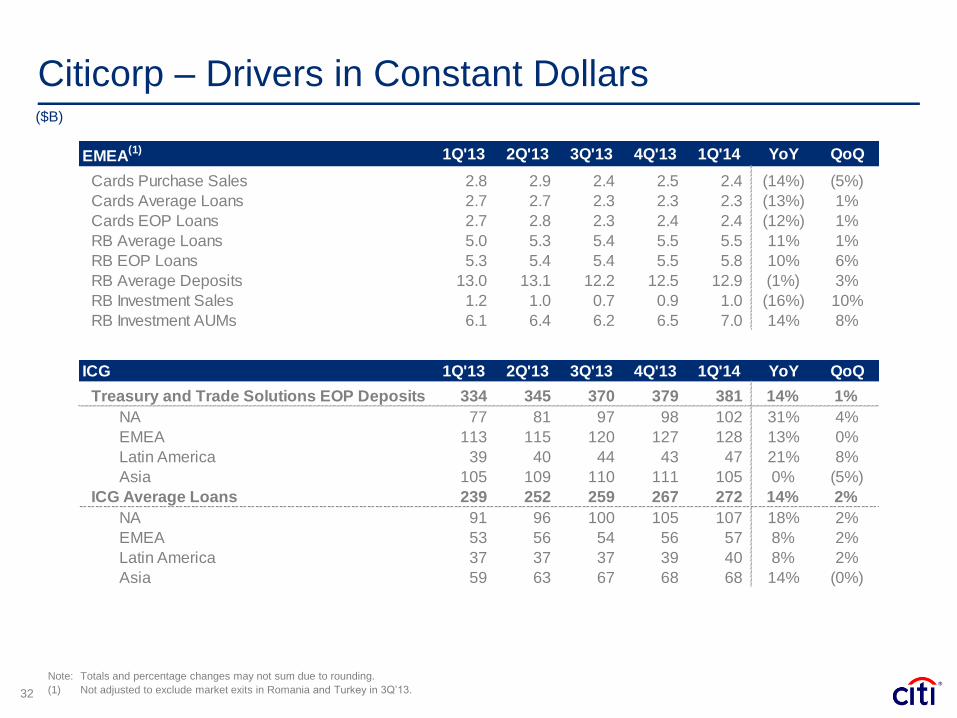
Citicorp – Drivers in Constant Dollars
32
($B)
Note: Totals and percentage changes may not sum due to rounding.
(1) Not adjusted to exclude market exits in Romania and Turkey in 3Q’13.
ICG 1Q'13 2Q'13 3Q'13 4Q'13 1Q'14 YoY QoQ
Treasury and Trade Solutions EOP Deposits 334 345 370 379 381 14% 1%
NA 77 81 97 98 102 31% 4%
EMEA 113 115 120 127 128 13% 0%
Latin America 39 40 44 43 47 21% 8%
Asia 105 109 110 111 105 0% (5%)
ICG Average Loans 239 252 259 267 272 14% 2%
NA 91 96 100 105 107 18% 2%
EMEA 53 56 54 56 57 8% 2%
Latin America 37 37 37 39 40 8% 2%
Asia 59 63 67 68 68 14% (0%)
EMEA(1) 1Q'13 2Q'13 3Q'13 4Q'13 1Q'14 YoY QoQ
Cards Purchase Sales 2.8 2.9 2.4 2.5 2.4 (14%) (5%)
Cards Average Loans 2.7 2.7 2.3 2.3 2.3 (13%) 1%
Cards EOP Loans 2.7 2.8 2.3 2.4 2.4 (12%) 1%
RB Average Loans 5.0 5.3 5.4 5.5 5.5 11% 1%
RB EOP Loans 5.3 5.4 5.4 5.5 5.8 10% 6%
RB Average Deposits 13.0 13.1 12.2 12.5 12.9 (1%) 3%
RB Investment Sales 1.2 1.0 0.7 0.9 1.0 (16%) 10%
RB Investment AUMs 6.1 6.4 6.2 6.5 7.0 14% 8%
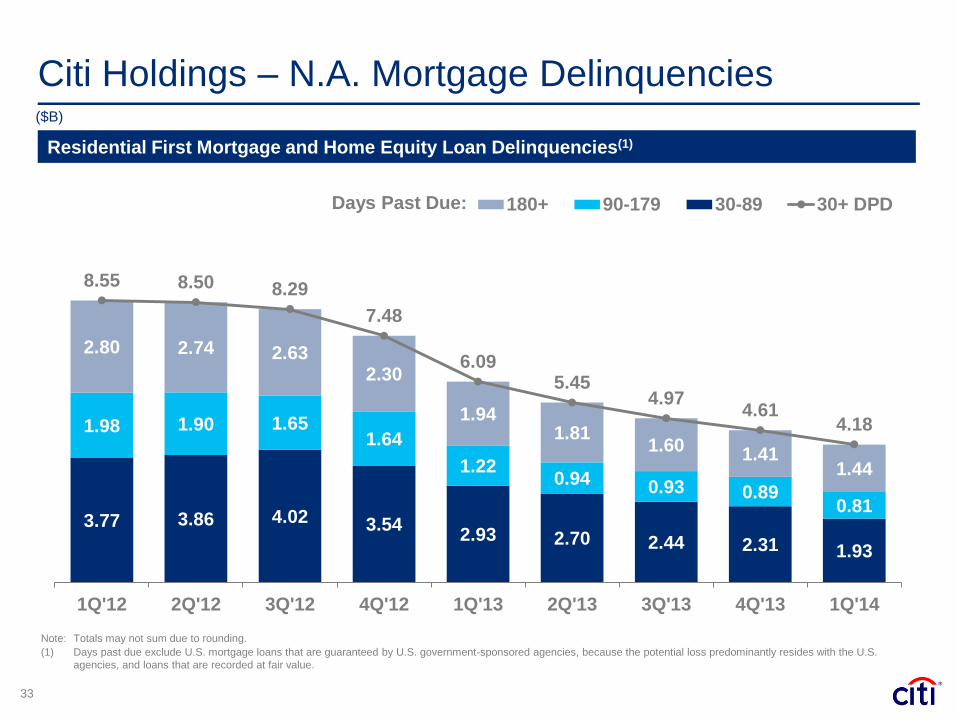
Citi Holdings – N.A. Mortgage Delinquencies
33
3.77 3.86 4.02 3.54 2.93 2.70 2.44 2.31 1.93
1.98 1.90 1.65 1.64
1.22 0.94 0.93 0.89
0.81
2.80 2.74 2.63 2.30
1.94 1.81
1.60 1.41
1.44
8.55 8.50 8.29
7.48
6.09 5.45
4.97 4.61
4.18
1Q'12 2Q'12 3Q'12 4Q'12 1Q'13 2Q'13 3Q'13 4Q'13 1Q'14
180+ 90-179 30-89 30+ DPD Days Past Due:
Note: Totals may not sum due to rounding.
(1) Days past due exclude U.S. mortgage loans that are guaranteed by U.S. government-sponsored agencies, because the potential loss predominantly resides with the U.S.
agencies, and loans that are recorded at fair value.
($B)
Residential First Mortgage and Home Equity Loan Delinquencies(1)
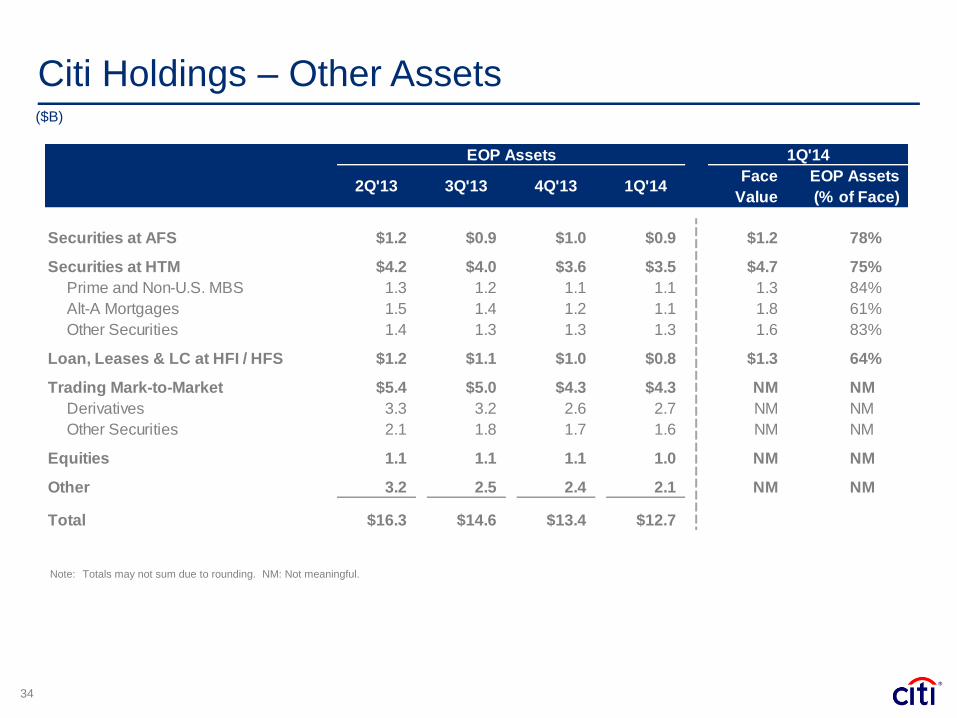
Citi Holdings – Other Assets
34
($B)
Note: Totals may not sum due to rounding. NM: Not meaningful.
Face EOP Assets
Value (% of Face)
Securities at AFS $1.2 $0.9 $1.0 $0.9 $1.2 78%
Securities at HTM $4.2 $4.0 $3.6 $3.5 $4.7 75%
Prime and Non-U.S. MBS 1.3 1.2 1.1 1.1 1.3 84%
Alt-A Mortgages 1.5 1.4 1.2 1.1 1.8 61%
Other Securities 1.4 1.3 1.3 1.3 1.6 83%
Loan, Leases & LC at HFI / HFS $1.2 $1.1 $1.0 $0.8 $1.3 64%
Trading Mark-to-Market $5.4 $5.0 $4.3 $4.3 NM NM
Derivatives 3.3 3.2 2.6 2.7 NM NM
Other Securities 2.1 1.8 1.7 1.6 NM NM
Equities 1.1 1.1 1.1 1.0 NM NM
Other 3.2 2.5 2.4 2.1 NM NM
Total $16.3 $14.6 $13.4 $12.7
1Q'14
1Q'144Q'133Q'132Q'13
EOP Assets
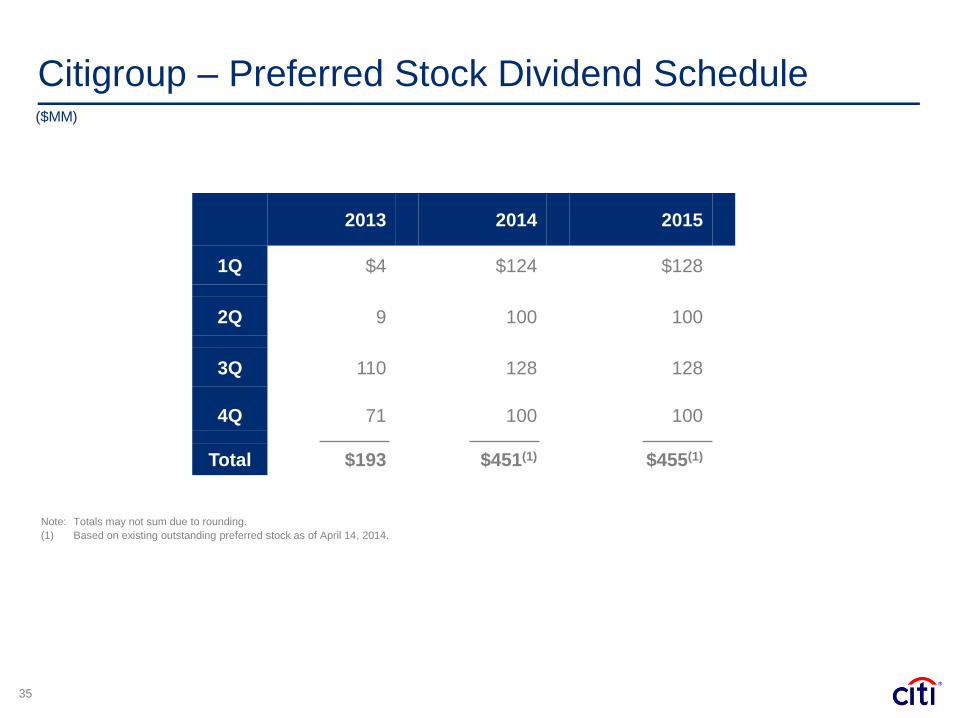
Citigroup – Preferred Stock Dividend Schedule
35
($MM)
Note: Totals may not sum due to rounding.
(1) Based on existing outstanding preferred stock as of April 14, 2014.
2013 2014 2015
1Q $4 $124 $128
2Q 9 100 100
3Q 110 128 128
4Q 71 100 100
Total $193 $451(1) $455(1)
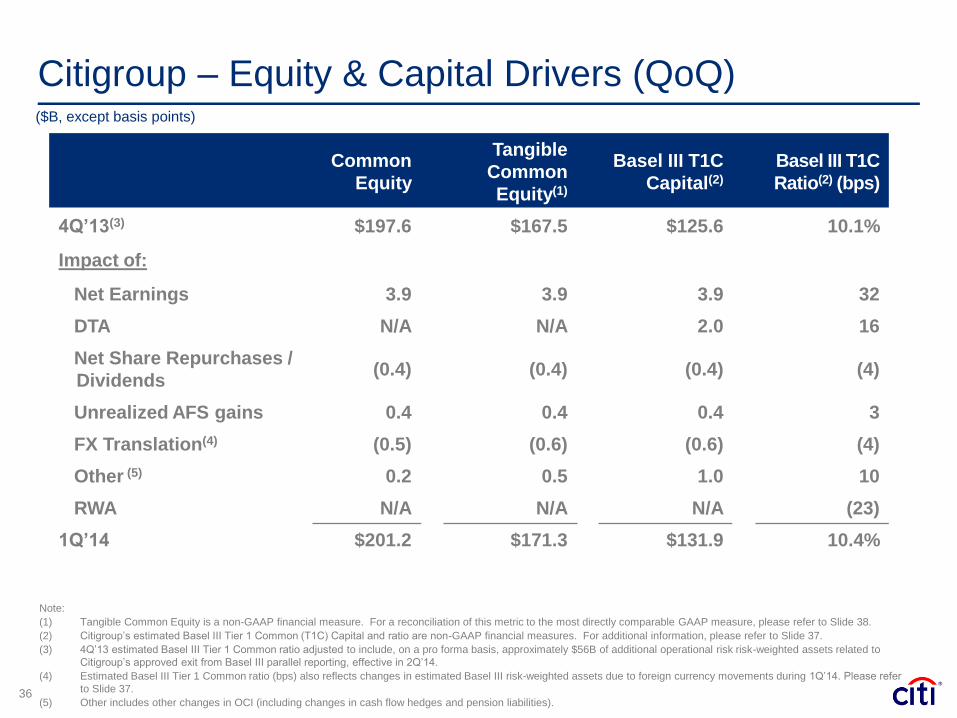
Citigroup – Equity & Capital Drivers (QoQ)
36
($B, except basis points)
Common
Equity
Tangible
Common
Equity(1)
Basel III T1C
Capital(2)
Basel III T1C
Ratio(2) (bps)
4Q’13(3) $197.6 $167.5 $125.6 10.1%
Impact of:
Net Earnings 3.9 3.9 3.9 32
DTA N/A N/A 2.0 16
Net Share Repurchases /
Dividends (0.4) (0.4) (0.4) (4)
Unrealized AFS gains 0.4 0.4 0.4 3
FX Translation(4) (0.5) (0.6) (0.6) (4)
Other (5) 0.2 0.5 1.0 10
RWA N/A N/A N/A (23)
1Q’14 $201.2 $171.3 $131.9 10.4%
Note:
(1) Tangible Common Equity is a non-GAAP financial measure. For a reconciliation of this metric to the most directly comparable GAAP measure, please refer to Slide 38.
(2) Citigroup’s estimated Basel III Tier 1 Common (T1C) Capital and ratio are non-GAAP financial measures. For additional information, please refer to Slide 37.
(3) 4Q’13 estimated Basel III Tier 1 Common ratio adjusted to include, on a pro forma basis, approximately $56B of additional operational risk risk-weighted assets related to
Citigroup’s approved exit from Basel III parallel reporting, effective in 2Q’14.
(4) Estimated Basel III Tier 1 Common ratio (bps) also reflects changes in estimated Basel III risk-weighted assets due to foreign currency movements during 1Q’14. Please refer
to Slide 37.
(5) Other includes other changes in OCI (including changes in cash flow hedges and pension liabilities).
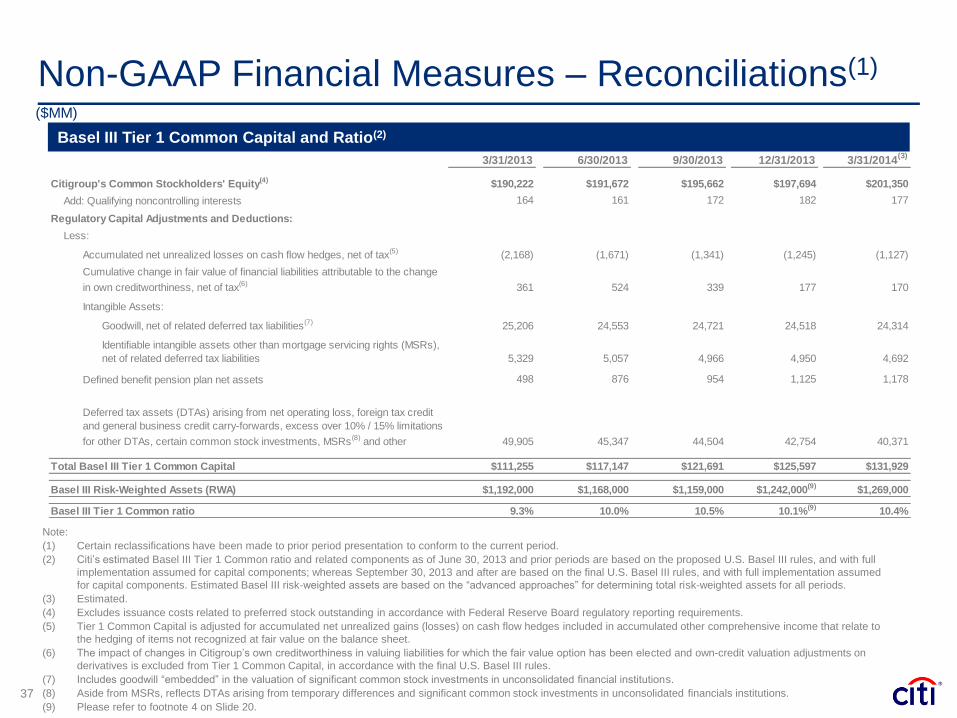
Non-GAAP Financial Measures – Reconciliations(1)
37
Basel III Tier 1 Common Capital and Ratio(2)
($MM)
Note:
(1) Certain reclassifications have been made to prior period presentation to conform to the current period.
(2) Citi’s estimated Basel III Tier 1 Common ratio and related components as of June 30, 2013 and prior periods are based on the proposed U.S. Basel III rules, and with full
implementation assumed for capital components; whereas September 30, 2013 and after are based on the final U.S. Basel III rules, and with full implementation assumed
for capital components. Estimated Basel III risk-weighted assets are based on the “advanced approaches” for determining total risk-weighted assets for all periods.
(3) Estimated.
(4) Excludes issuance costs related to preferred stock outstanding in accordance with Federal Reserve Board regulatory reporting requirements.
(5) Tier 1 Common Capital is adjusted for accumulated net unrealized gains (losses) on cash flow hedges included in accumulated other comprehensive income that relate to
the hedging of items not recognized at fair value on the balance sheet.
(6) The impact of changes in Citigroup’s own creditworthiness in valuing liabilities for which the fair value option has been elected and own-credit valuation adjustments on
derivatives is excluded from Tier 1 Common Capital, in accordance with the final U.S. Basel III rules.
(7) Includes goodwill “embedded” in the valuation of significant common stock investments in unconsolidated financial institutions.
(8) Aside from MSRs, reflects DTAs arising from temporary differences and significant common stock investments in unconsolidated financials institutions.
(9) Please refer to footnote 4 on Slide 20.
3/31/2013 6/30/2013 9/30/2013 12/31/2013 3/31/2014(3)
Citigroup's Common Stockholders' Equity(4) $190,222 $191,672 $195,662 $197,694 $201,350
Add: Qualifying noncontrolling interests 164 161 172 182 177
Regulatory Capital Adjustments and Deductions:
Less:
Accumulated net unrealized losses on cash flow hedges, net of tax(5) (2,168) (1,671) (1,341) (1,245) (1,127)
Cumulative change in fair value of financial liabilities attributable to the change
in own creditworthiness, net of tax(6) 361 524 339 177 170
Intangible Assets:
Goodwill, net of related deferred tax liabilities(7) 25,206 24,553 24,721 24,518 24,314
Identifiable intangible assets other than mortgage servicing rights (MSRs),
net of related deferred tax liabilities 5,329 5,057 4,966 4,950 4,692
Defined benefit pension plan net assets 498 876 954 1,125 1,178
Deferred tax assets (DTAs) arising from net operating loss, foreign tax credit
and general business credit carry-forwards, excess over 10% / 15% limitations
for other DTAs, certain common stock investments, MSRs(8) and other 49,905 45,347 44,504 42,754 40,371
Total Basel III Tier 1 Common Capital $111,255 $117,147 $121,691 $125,597 $131,929
Basel III Risk-Weighted Assets (RWA) $1,192,000 $1,168,000 $1,159,000 $1,242,000(9) $1,269,000
Basel III Tier 1 Common ratio 9.3% 10.0% 10.5% 10.1%(9) 10.4%
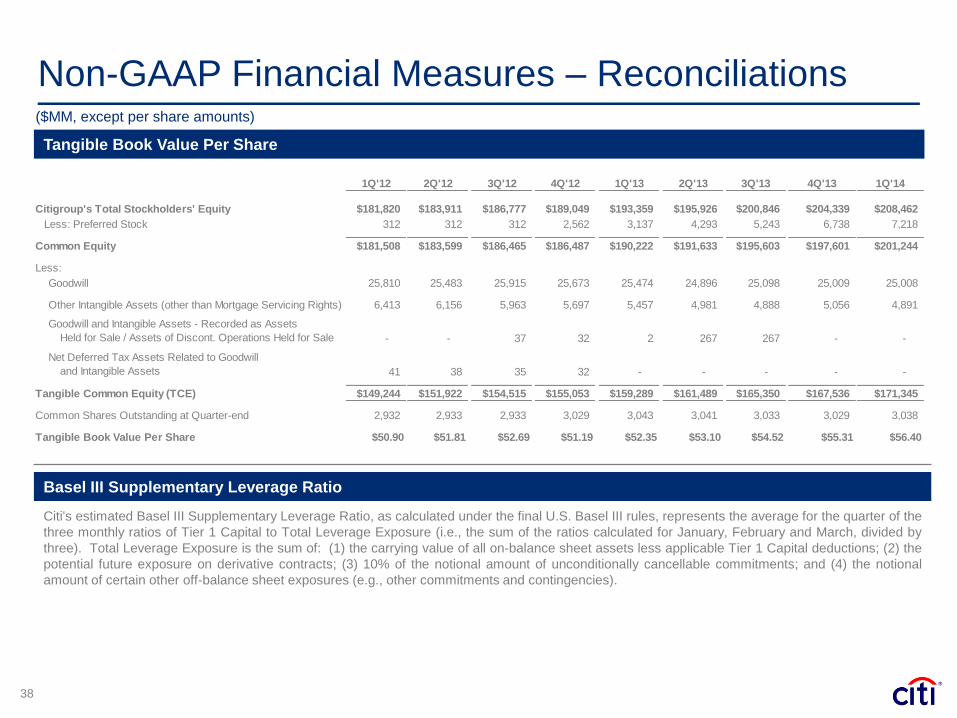
Non-GAAP Financial Measures – Reconciliations
38
Citi's estimated Basel III Supplementary Leverage Ratio, as calculated under the final U.S. Basel III rules, represents the average for the quarter of the
three monthly ratios of Tier 1 Capital to Total Leverage Exposure (i.e., the sum of the ratios calculated for January, February and March, divided by
three). Total Leverage Exposure is the sum of: (1) the carrying value of all on-balance sheet assets less applicable Tier 1 Capital deductions; (2) the
potential future exposure on derivative contracts; (3) 10% of the notional amount of unconditionally cancellable commitments; and (4) the notional
amount of certain other off-balance sheet exposures (e.g., other commitments and contingencies).
Basel III Supplementary Leverage Ratio
Tangible Book Value Per Share
($MM, except per share amounts)
1Q'12 2Q'12 3Q'12 4Q'12 1Q'13 2Q'13 3Q'13 4Q'13 1Q'14
Citigroup's Total Stockholders' Equity $181,820 $183,911 $186,777 $189,049 $193,359 $195,926 $200,846 $204,339 $208,462
Less: Preferred Stock 312 312 312 2,562 3,137 4,293 5,243 6,738 7,218
Common Equity $181,508 $183,599 $186,465 $186,487 $190,222 $191,633 $195,603 $197,601 $201,244
Less:
Goodwill 25,810 25,483 25,915 25,673 25,474 24,896 25,098 25,009 25,008
Other Intangible Assets (other than Mortgage Servicing Rights) 6,413 6,156 5,963 5,697 5,457 4,981 4,888 5,056 4,891
Goodwill and Intangible Assets - Recorded as Assets
Held for Sale / Assets of Discont. Operations Held for Sale - - 37 32 2 267 267 - -
Net Deferred Tax Assets Related to Goodwill
and Intangible Assets 41 38 35 32 - - - - -
Tangible Common Equity (TCE) $149,244 $151,922 $154,515 $155,053 $159,289 $161,489 $165,350 $167,536 $171,345
Common Shares Outstanding at Quarter-end 2,932 2,933 2,933 3,029 3,043 3,041 3,033 3,029 3,038
Tangible Book Value Per Share $50.90 $51.81 $52.69 $51.19 $52.35 $53.10 $54.52 $55.31 $56.40
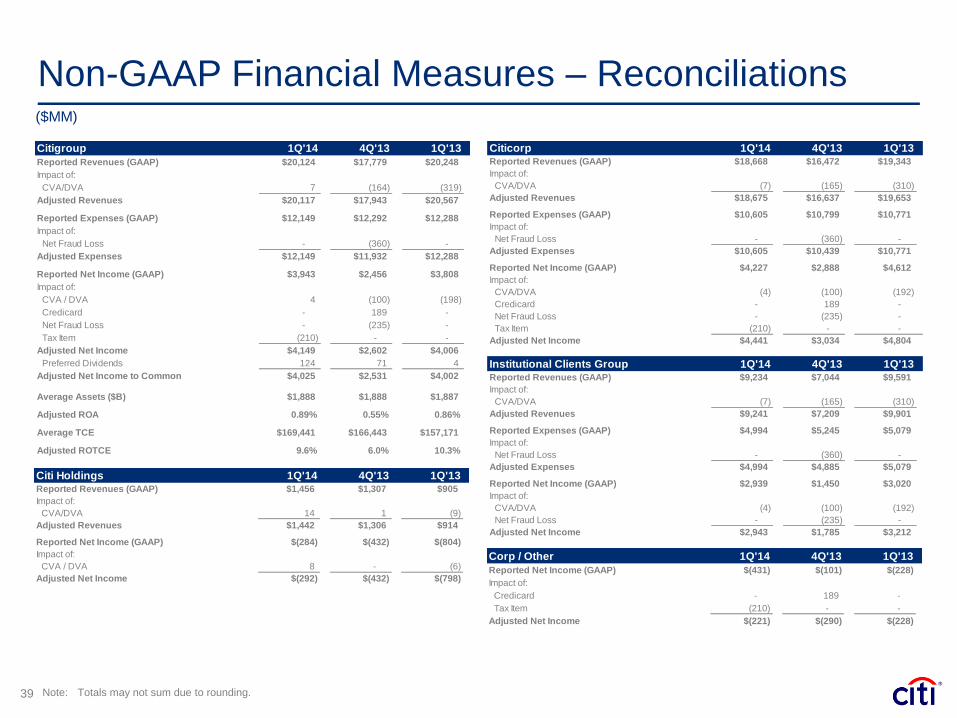
Non-GAAP Financial Measures – Reconciliations ($MM)
39 Note: Totals may not sum due to rounding.
Citigroup 1Q'14 4Q'13 1Q'13
Reported Revenues (GAAP) $20,124 $17,779 $20,248
Impact of:
CVA/DVA 7 (164) (319)
Adjusted Revenues $20,117 $17,943 $20,567
Reported Expenses (GAAP) $12,149 $12,292 $12,288
Impact of:
Net Fraud Loss - (360) -
Adjusted Expenses $12,149 $11,932 $12,288
Reported Net Income (GAAP) $3,943 $2,456 $3,808
Impact of:
CVA / DVA 4 (100) (198)
Credicard - 189 -
Net Fraud Loss - (235) -
Tax Item (210) - -
Adjusted Net Income $4,149 $2,602 $4,006
Preferred Dividends 124 71 4
Adjusted Net Income to Common $4,025 $2,531 $4,002
Average Assets ($B) $1,888 $1,888 $1,887
Adjusted ROA 0.89% 0.55% 0.86%
Average TCE $169,441 $166,443 $157,171
Adjusted ROTCE 9.6% 6.0% 10.3%
Citi Holdings 1Q'14 4Q'13 1Q'13Reported Revenues (GAAP) $1,456 $1,307 $905
Impact of:
CVA/DVA 14 1 (9)
Adjusted Revenues $1,442 $1,306 $914
Reported Net Income (GAAP) $(284) $(432) $(804)
Impact of:
CVA / DVA 8 - (6)
Adjusted Net Income $(292) $(432) $(798)
Citicorp 1Q'14 4Q'13 1Q'13Reported Revenues (GAAP) $18,668 $16,472 $19,343
Impact of:
CVA/DVA (7) (165) (310)
Adjusted Revenues $18,675 $16,637 $19,653
Reported Expenses (GAAP) $10,605 $10,799 $10,771
Impact of:
Net Fraud Loss - (360) -
Adjusted Expenses $10,605 $10,439 $10,771
Reported Net Income (GAAP) $4,227 $2,888 $4,612
Impact of:
CVA/DVA (4) (100) (192)
Credicard - 189 -
Net Fraud Loss - (235) -
Tax Item (210) - -
Adjusted Net Income $4,441 $3,034 $4,804
Institutional Clients Group 1Q'14 4Q'13 1Q'13Reported Revenues (GAAP) $9,234 $7,044 $9,591
Impact of:
CVA/DVA (7) (165) (310)
Adjusted Revenues $9,241 $7,209 $9,901
Reported Expenses (GAAP) $4,994 $5,245 $5,079
Impact of:
Net Fraud Loss - (360) -
Adjusted Expenses $4,994 $4,885 $5,079
Reported Net Income (GAAP) $2,939 $1,450 $3,020
Impact of:
CVA/DVA (4) (100) (192)
Net Fraud Loss - (235) -
Adjusted Net Income $2,943 $1,785 $3,212
Corp / Other 1Q'14 4Q'13 1Q'13
Reported Net Income (GAAP) $(431) $(101) $(228)
Impact of:
Credicard - 189 -
Tax Item (210) - -
Adjusted Net Income $(221) $(290) $(228)
Non-GAAP Financial Measures – Reconciliations
Note: Totals may not sum due to rounding.
($MM)
40
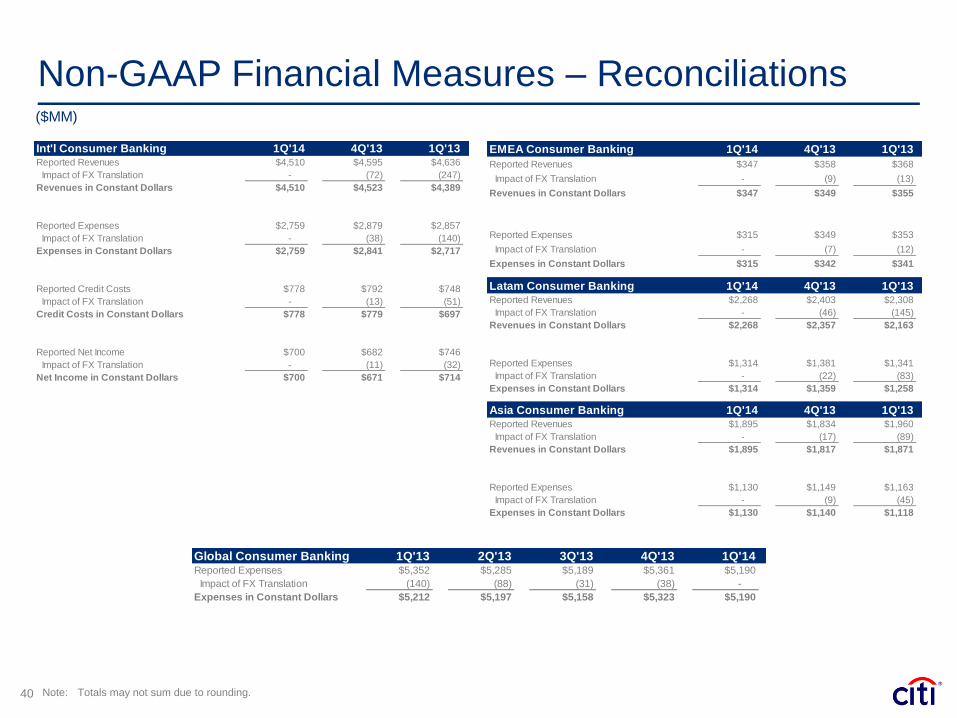
Int'l Consumer Banking 1Q'14 4Q'13 1Q'13Reported Revenues $4,510 $4,595 $4,636
Impact of FX Translation - (72) (247)
Revenues in Constant Dollars $4,510 $4,523 $4,389
Reported Expenses $2,759 $2,879 $2,857
Impact of FX Translation - (38) (140)
Expenses in Constant Dollars $2,759 $2,841 $2,717
Reported Credit Costs $778 $792 $748
Impact of FX Translation - (13) (51)
Credit Costs in Constant Dollars $778 $779 $697
Reported Net Income $700 $682 $746
Impact of FX Translation - (11) (32)
Net Income in Constant Dollars $700 $671 $714
EMEA Consumer Banking 1Q'14 4Q'13 1Q'13
Reported Revenues $347 $358 $368
Impact of FX Translation - (9) (13)
Revenues in Constant Dollars $347 $349 $355
Reported Expenses $315 $349 $353
Impact of FX Translation - (7) (12)
Expenses in Constant Dollars $315 $342 $341
Latam Consumer Banking 1Q'14 4Q'13 1Q'13Reported Revenues $2,268 $2,403 $2,308
Impact of FX Translation - (46) (145)
Revenues in Constant Dollars $2,268 $2,357 $2,163
Reported Expenses $1,314 $1,381 $1,341
Impact of FX Translation - (22) (83)
Expenses in Constant Dollars $1,314 $1,359 $1,258
Asia Consumer Banking 1Q'14 4Q'13 1Q'13Reported Revenues $1,895 $1,834 $1,960
Impact of FX Translation - (17) (89)
Revenues in Constant Dollars $1,895 $1,817 $1,871
Reported Expenses $1,130 $1,149 $1,163
Impact of FX Translation - (9) (45)
Expenses in Constant Dollars $1,130 $1,140 $1,118
Global Consumer Banking 1Q'13 2Q'13 3Q'13 4Q'13 1Q'14Reported Expenses $5,352 $5,285 $5,189 $5,361 $5,190
Impact of FX Translation (140) (88) (31) (38) -
Expenses in Constant Dollars $5,212 $5,197 $5,158 $5,323 $5,190


![First Quarter of Fiscal 2013 Earnings Review › enjapanhp › ... · First Quarter of Fiscal 2013 Earnings Review August 9,2012 en-japan Inc. ... [1Q FY2013 Results] Consolidated](https://img.pdfslide.us/doc/110x75/5f0d89a17e708231d43ada50/first-quarter-of-fiscal-2013-earnings-review-a-enjapanhp-a-first-quarter.jpg)