Embed Size (px)
Citation preview


First published in 2013 by the University of Utah in association with the Utah State Office of Education.
Copyright © 2013, Utah State Office of Education. Some rights reserved.
This work is published under the Creative Commons Attribution License (“CC BY”) which is available online at http://creativecommons.org/licenses/by/3.0/ and provides permissions for the reusing, revising, remixing, and redistributing of this work. This work is an open educational resource (OER).

8WB2 - 1
2014 University of Utah Middle School Math Project in partnership with the
Utah State Office of Education. Licensed under Creative Commons, cc-by.
Table of Contents
CHAPTER 2: EXPLORING LINEAR RELATIONS (4 WEEKS) ................................................................. 2 2.0 ANCHOR PROBLEM: PROPORTIONALITY AND UNIT RATE ............................................................................... 7
SECTION 2.1: ANALYZE PROPORTIONAL RELATIONSHIPS .................................................................................... 9
2.1a Class Activity: Proportional Relationships .......................................................................................... 10
2.1a Homework: Proportional Relationships. .............................................................................................. 15
2.1b Class Activity: Comparing Proportional Relationships ....................................................................... 21
2.1b Homework: Comparing Proportional Relationships ............................................................................ 25
2.1c Class Activity: Proportional Relationships as Linear Relationships .................................................... 28
2.1c Homework: Proportional Relationships as Linear Relationships ........................................................ 31
2.1d Self Assessment: Section 2.1 ................................................................................................................. 34
SECTION 2.2: LINEAR RELATIONS IN PATTERN AND CONTEXT........................................................................... 38
2.2a Class Activity: Connect the Rule to the Pattern.................................................................................... 39
2.2a Homework: Connect the Rule to the Pattern ........................................................................................ 43
2.2b Class Activity: Representations of a Linear Pattern............................................................................. 45
2.2b Homework: Representations of a Linear Pattern ................................................................................. 48
2.2c Class Activity: Representations of a Linear Context ............................................................................ 51
2.2c Homework: Representations of a Linear Context ................................................................................. 54
2.2d Class Activity: Rate of Change in a Linear Relationship ..................................................................... 57
2.2d Homework: Rate of Change in a Linear Relationship .......................................................................... 60
2.2e Class Activity: More Representations of a Linear Context ................................................................... 63
2.2e Homework: More Representations of a Linear Context ....................................................................... 68
2.2f Self-Assessment: Section 2.2 .................................................................................................................. 73
SECTION 2.3: INVESTIGATE THE SLOPE OF A LINE ............................................................................................. 77
2.3a Class Activity: Building Stairs and Ramps. .......................................................................................... 78
2.3a Homework: Measuring the Slope of Stairs and Ramps ........................................................................ 80
2.3b Class work: Dilations and Proportionality........................................................................................... 84
2.3b Homework: Dilations and Proportionality ........................................................................................... 87
2.3c Class Activity: Proportional Triangles and Slope ................................................................................ 90
2.3c Homework: Similar Triangles and Slope .............................................................................................. 93
2.3d Class Activity: Finding Slope from Graphs .......................................................................................... 94
2.3d Homework: Finding Slope from Graphs............................................................................................... 96
2.3e Class Activity: Finding Slope from Two Points .................................................................................... 98
2.3e Homework: Finding Slope from Two Points ....................................................................................... 102
2.3f Class Activity: Practice Finding the Slope of a Line ........................................................................... 103
2.3f Homework: Practice Finding the Slope of a Line ............................................................................... 104
2.3g Class Activity: Finding Slope from a Context.................................................................................... 106
2.3g Homework: Finding Slope from a Context ......................................................................................... 108
2.3h Class Activity: The Equation of a Linear Relationship ...................................................................... 110
2.3h Homework: The Equation of a Linear Relationship ........................................................................... 113
2.3i Class Activity: Use Dilations and Proportionality to Derive the Equation ......................... 116
2.3i Homework: Use Dilations and Proportionality to Derive the Equation .............................. 119
2.3j Class Activity: Use Dilations and Proportionality to Derive the Equation ................... 120
2.3j Homework: Use Similar Triangles to Derive the Equation ........................................... 124
2.3k Self-Assessment: Section 2.3 ............................................................................................................... 125

8WB2 - 2
2014 University of Utah Middle School Math Project in partnership with the
Utah State Office of Education. Licensed under Creative Commons, cc-by.
Chapter 2: Exploring Linear Relations (4 weeks)
Utah Core Standard(s):
Graph proportional relationships, interpreting the unit rate as the slope of the graph. Compare two
different proportional relationships represented in different ways. For example, compare a distance-time
graph to a distance-time equation to determine which of two moving objects has a greater speed.
(8.EE.5)
Use similar triangles to explain why the slope m is the same between any two distinct points on a non-
vertical line in the coordinate plane; derive the equation y mx for a line through the origin and the
equation y mx b for a line intercepting the vertical axis at b. (8.EE.6)
Construct a function to model a linear relationship between two quantities. Determine the rate of change
and initial value of the function from a description of a relationship or from two (x, y) values, including
reading these from a table or from a graph. Interpret the rate of change and initial value of a linear
function in terms of the situation it models, and in terms of its graph or a table of values. (8.F.4)
Academic Vocabulary: proportional relationship, proportional constant, unit rate, rate of change, linear
relationship, slope(m), translation, dilation, y-intercept(b), linear, right triangle, origin, rise, run, graph, table,
context, geometric model, constant difference, difference table, initial value, slope-intercept form.
Chapter Overview: Students begin this chapter by reviewing proportional relationships from 6th and 7th grade, recognizing,
representing, and comparing proportional relationships. In eighth grade, a shift takes place as students move
from proportional linear relationships, a special case of linear relationships, to the study of linear relationships
in general. Students explore the growth rate of a linear relationship using patterns and contexts that exhibit
linear growth. During this work with linear patterns and contexts, students begin to surface ideas about the two
parameters of a linear relationship: constant rate of change (slope) and initial value (y-intercept) and gain a
conceptual understanding of the slope-intercept form of a linear equation. This work requires students to move
fluently between the representations of a linear relationship and make connections between the representations.
After exploring the rate of change of a linear relationship, students are introduced to the concept of slope and
use the properties of dilations to show that the slope is the same between any two distinct points on a non-
vertical line. Finally, students synthesize concepts learned and derive the equation of a line.
8WB2 - 3
2014 University of Utah Middle School Math Project in partnership with the
Utah State Office of Education. Licensed under Creative Commons, cc-by.
Connections to Content:
Prior Knowledge: This chapter relies heavily on a student’s knowledge about ratios and proportional
relationships from 6th
and 7th
grade. Students should come with an understanding of what a unit rate is and how
to compute it. In addition they need to be able to recognize and represent proportional relationships from a
story, graph, table, or equation. In addition they must identify the constant of proportionality or unit rate given
different representations.
Future Knowledge: After this chapter students continue to work with linear relationships and begin work with
functions. They will work more formally with slope-intercept form as they write and graph equations for lines.
This will set the stage for students to be able to graph and write the equation of a line given any set of
conditions. Students use their knowledge of slope and proportionality to represent and construct linear
functions in a variety of ways. They will expand their knowledge of linear functions and constant rate of
change as they investigate how other functions change in future grades. The work done in this chapter is the
foundation of the study of how different types of functions grow and change.

8WB2 - 4
2014 University of Utah Middle School Math Project in partnership with the
Utah State Office of Education. Licensed under Creative Commons, cc-by.
MATHEMATICAL PRACTICE STANDARDS:
Make sense of
problems and
persevere
in solving
them.
Gourmet jellybeans cost $9 for 2 pounds.
a. Complete the table.
Pounds .5 3 4 8 10 20
Total Cost $9 $27
b. Label the axes. Graph the
relationship.
c. What is the unit rate?
d. Write a sentence with correct units
to describe the rate of change.
e. Write an equation to find the cost
for any amount of jellybeans.
f. Why is the data graphed only in
the first quadrant?
As students approach this problem they are given some real world data and asked to
graph and analyze it. They must make conjectures about the unit rate of the line and
understand the correspondences between the table, graph, and equation. The final
question asks students to conceptualize the problem by having them explain why only
the first quadrant was used.
Reason
abstractly and
quantitatively.
Graphing points can be time-consuming. Develop a procedure for calculating the
slope without graphing each point. Explain your procedure below. Show that it
works for problems 1-4 above.
Discuss the methods for calculating slope without using right triangles on a graph.
Write what you think about the methods.
Now discuss this formula:. 2 1
2 1
y ym
x x
What does it mean? How does it work?
By examining how the rise and run is found amongst a variety of points students
begin understand that the rise is the difference of the y values and the run is the
difference of the x values. They must abstract the given information and represent it
symbolically as they develop and analyze the slope formula.
x _______________________
y
_________________________

8WB2 - 5
2014 University of Utah Middle School Math Project in partnership with the
Utah State Office of Education. Licensed under Creative Commons, cc-by.
Construct
viable
arguments
and critique
the reasoning
of others.
On the line to the right choose any two points that
fall on the line. (To make your examination easier
choose two points that fall on an intersection of
the gridlines).
From the two points create a right triangle, the
line itself will be the hypotenuse and the legs will
extend from the two points and meet at a right
angle.
Compare the points that you chose and your
triangle with someone in your class. Discuss the
following:
Did you both choose the same points?
How are your triangles the same?
How are your triangles different?
What relationship exists between your triangles?
Upon comparing their triangle with a class member students begin to discover that
any right triangle constructed on the line is related through a dilation. By talking
with one another they can analyze different triangles and discuss the proportionality
that exists between them. This also gives students the opportunity to help one
another learn how to accurately construct the right triangle on the graph used to
find slope. In addition, they begin to make conjectures about how slope can be found
from any two points on the line.
Model with
mathematics.
a. Create your own story that shows a proportional relationship.
b. Complete a table and graph to represent this relationship. Be sure to label the axes
of your graph.
c. Write an equation that represents your proportional relationship.
This question asks students to not only create their own proportional relationship but
to model it with a table, graph, and equation. Students show their understanding of
how a proportional relationship is shown in several representations.
Attend to
precision.
The graph below shows the distance a cat is from his bowl of milk over time. Which
sentence is a good match for the graph?
Upon examining the graph students must attend to precision as they discuss the
ordered pair (4,12) and analyze exactly what it is telling us about the cat. Students
often confuse the given information with rate of change and fail to recognize what
quantity each number in the ordered pair represents. Also they must communicate
what the direction of the line is telling us. Later on they are asked to make their own
graphs and must use the correct units and labels to communicate their thinking.
A. The cat was 12 feet away from the
milk and ran toward it reaching it after 4
seconds.
B. The cat was 4 feet away from the milk
and ran toward it reaching it after 12
seconds.
C. The cat ran away from the milk at a
rate of 3 feet per second.
D. The cat ran away from the milk at a
rate of 4 feet per second.
E. The cat was 12 feet away from the
milk and ran away from it at a rate of 4
feet per second.
(4, 12)

8WB2 - 6
2014 University of Utah Middle School Math Project in partnership with the
Utah State Office of Education. Licensed under Creative Commons, cc-by.
Use
appropriate
tools
strategically.
Your group task is to build a set of stairs and a handicap ramp at the side. Both the
stairs and the ramp will begin at the same place (at ground level) and end at the
height of three feet. Answer the following questions as you develop your design.
How many steps do you want or need?
How deep should each step be (we will call this the run)? Why do you want
this run depth?
How tall will each step be (we will call this the rise)? Why do you want this
rise height?
What is the total distance (total depth for all steps) you will need (at the
base) for all of the stairs? This would be a measurement at ground level from
stair/ramp start point to stair/ramp end point.
Sketch the ramp as viewed from the side on graph paper below. Label and sketch the
base and height, for example: stair-base (in inches or feet) and height (in inches or
feet).
As students design a set of stairs and ramps they must use decide how they can use
the tools (graph paper, ruler, pencil) provided them most efficiently. They will need
to generate a graph that displays their designs and use the graph as a tool to analyze
the slope of the stairs and ramp.
Look for and
make use of
structure.
Examine the graphs and equations given above. Describe the general form of
a linear equation. In other words, in general, how is a linear equation written?
What are its different parts? As students examine many equations in slope-intercept form and interpret the slope
and y-intercept they see the structure of the general form for a linear equation begin
to emerge. Even if they write the initial value or y-intercept first they can step back
and look at an overview of the general form of the equation and shift their
perspective to see that the order in which you write your slope and initial value does
not matter.
Look for and
express
regularity in
repeated
reasoning.
In each graph below, how many right triangles do you see?
Trace the triangles by color.
For each triangle write a ratio comparing the
lengths of its legs or height
base. Then simplify
the ratioheight
base .
In this series of problems students repeatedly find the height/base ratio of triangles
that are dilations of one another and infer that slope can be calculated with the
rise/run ratio by choosing any two points. A general method for finding slope as
rise/run is discovered.

8WB2 - 7
2014 University of Utah Middle School Math Project in partnership with the
Utah State Office of Education. Licensed under Creative Commons, cc-by.
2.0 Anchor Problem: Proportionality and Unit Rate
Toby the snail is crossing a four foot wide sidewalk at a constant rate. It takes him 1 minute and 36 seconds to
scoot across half the width of the sidewalk, as pictured below.
1. Find the unit rate for this proportional relationship. Be sure to explain what this unit rate means.
2. Write an equation that describes this proportional relationship if x is the amount of time it takes Toby to
cross the sidewalk and y is the distance he has traveled. Use this equation to make a table of values to
graph the first 5 seconds of Toby’s journey.
3. How long will it take Toby to cross the sidewalk?

8WB2 - 8
2014 University of Utah Middle School Math Project in partnership with the
Utah State Office of Education. Licensed under Creative Commons, cc-by.
A large group of cyclists are on the sidewalk heading in Toby’s direction. The graph below shows the rate at
which they travel.
4. Find and describe the unit rate
for the group of cyclists.
Highlight this unit rate on the
graph.
5. Describe how you can find the
unit rate at a different location
on the graph.
6. The cyclists are 4300 feet
away from Toby on the
sidewalk. Will Toby cross the
side walk before the cyclists
reach him? Justify your
answer.

8WB2 - 9
2014 University of Utah Middle School Math Project in partnership with the
Utah State Office of Education. Licensed under Creative Commons, cc-by.
Section 2.1: Analyze Proportional Relationships
Section Overview:
The section begins by reviewing proportional relationships that were studied in 6th
and 7th
grade. By
investigating several contexts, students study the proportional constant or unit rate in tables, graphs, and
equations. They recognize that a proportional relationship can be represented with a straight line that goes
through the origin and compare proportional relationships represented in many ways. In the last lesson of the
section a bridge from proportional relationships to linear relationships is achieved as students translate the graph
of a proportional relation away from the origin and analyze that there is no effect on steepness of the line or rate
at which it changes but that the relation is no longer proportional. They begin to see a proportional relationship
as a special subset of a linear relationship where the rate of change is a proportional constant or unit rate and the
graph of the relationship is a line that goes through the origin. Students also investigate the transition of the
proportional constant or unit rate to rate of change, that is, if the input or x-coordinate changes by an amount A,
the output or y-coordinate changes by the amount m times A.
Concepts and Skills to Master:
By the end of this section, students should be able to:
1. Graph and write equations for a proportional relationship and identify the proportional constant or unit
rate given a table, graph, equation, or context.
2. Compare proportional relationships represented in different ways.
3. Know that the graph of a proportional relationship goes through the origin.

8WB2 - 10
2014 University of Utah Middle School Math Project in partnership with the
Utah State Office of Education. Licensed under Creative Commons, cc-by.
2.1a Class Activity: Proportional Relationships
In the previous chapter, you wrote equations with one variable to describe many situations mathematically. In
this chapter you will learn how to write an equation that has two variables to represent a situation. In addition to
writing equations you can represent real-life relationships in others ways. In 6th
and 7th
grade you studied
proportional relationships and represented these relationships in various ways. The problems given below will
help you to review how ratio and proportion can help relate and represent mathematical quantities from a given
situation.
1. Julie is picking teammates for her flag football team. She picks three girls for every boy.
a. Complete the table below to show the
relationship of boys to girls on Julie’s
team.
Boys Girls
1
2
9
4
b. Graph the girl to boy relationship for Julie’s team with boys on the x-axis and girls on the y-
axis.
c. Find the ratio of girls to boys for several different ordered pairs in the table. nu ber of girls
nu ber of boys
d. Fill in the boxes to show the relationship between girls and boys on Julie’s tea .
=
e. Use the equation and graph to determine how many girls would be on the team if Julie chose 10 boys
to be on the team.
f. Use the equation and graph to determine how many boys are on the team if Julie chose 18 girls.
3 times

8WB2 - 11
2014 University of Utah Middle School Math Project in partnership with the
Utah State Office of Education. Licensed under Creative Commons, cc-by.
In the previous example the two quantities of interest are in a proportional relation.
The ratio that related the number of boys to girls was 3. This is the proportional constant for this relationship.
2. Carmen is making homemade root beer for an upcoming charity fundraiser. The number of pounds of
dry ice to the ounces of root beer extract (flavoring) is proportionally related. If Carmen uses 12 pounds
of dry ice she will need to use 8 ounces of root beer extract.
a. Write a ratio/proportional constant that relates the number of pounds of dry ice to the number of
ounces of root beer extract.
b. Write a ratio/proportional constant that relates the number of ounces of root beer extract to the
number pounds of dry ice.
Notice that the proportional constant depends on how you define your items.
c. Complete the table below to show the
relationship between number ounces of
root beer extract x and number of pounds
of dry ice y needed to make homemade
root beer.
Ounces of
Root Beer
Extract
(x)
Pounds of
Dry Ice
(y)
0
2
3
6
8
d. Graph and label this relationship below.
Recall that when two quantities are proportionally related, the ratio of each y value to its corresponding
x value is constant. This constant is called the constant of proportionality or proportional constant.

8WB2 - 12
2014 University of Utah Middle School Math Project in partnership with the
Utah State Office of Education. Licensed under Creative Commons, cc-by.
d. What is the proportional constant for this relationship?
e. Write an equation that shows the relationship between the number of ounces of root beer extract (x)
and the number of pounds of dry ice (y) needed to make homemade root beer.
Every ratio has an associated rate. Unit rate is another way of interpreting the ratio’s proportional constant. The
statement below describes how unit rate defines y and x in a proportional relationship.
5. In the previous problem Carmen was making homemade root beer. Express the proportional constant as
a unit rate.
6. What would the unit rate be if we interchanged the roles of x and y?
In the problem below use the properties of a proportional relationship to help you answer the question.
7. Doug is pouring cement for his backyard patio that is 100 square feet. The cement comes out of the
truck at a constant rate. It is very important that he gets all the cement poured before 12:00 noon when it
gets too hot for the cement to be mixed properly. It is currently 11:00 AM and he has poured 75 square
feet of concrete in the last 3 hours. At this rate will he finish before noon?
a. Fill in the missing items in the table if x
represents the number of hours that have
passed since Doug began pouring concrete
and y represents the amount of concrete
poured
Time elapsed
(hours)
x
Amount of
concrete poured
(square feet)
y
0
1
2
3 (11:00AM) 75
4
b. Graph the relationship below.
If quantities y and x are in proportion then the unit rate of y with respect to x is the amount of y that
corresponds to one unit of x. If we interchange the roles of y and x, we would speak of the unit rate of x
with respect to y.

8WB2 - 13
2014 University of Utah Middle School Math Project in partnership with the
Utah State Office of Education. Licensed under Creative Commons, cc-by.
c. What is the unit rate for this relationship? In other words, how many square feet of concrete can
Doug pour in 1 hour.
d. Which equation given below best describes this relationship?
a) y=25x b) y=75x
c) x=25y d) y=11x
e. Will Doug finish the job in time? Justify your answer.
10. Vanessa is mixing formula for her baby. The graph given to the right describes the relationship between
the ounces of water to the scoops of formula to make a properly mixed bottle.
a. Does the graph describe a
proportional relationship?
Justify your answer.
b. What is the unit rate for this
relationship? Show on the
graph how you can see the
unit rate.
c. At a different location on the
graph show and explain how
you can find the unit rate.
d. Write an equation to relate the ounces of water to the scoops of formula.
e. How many scoops of formula must Vanessa use to make 9 ounce bottle for her baby?

8WB2 - 14
2014 University of Utah Middle School Math Project in partnership with the
Utah State Office of Education. Licensed under Creative Commons, cc-by.
11. Ben, Boston, and Bryton have each designed a remote control monster truck. They lined them up to
crush some mini cars in the driveway. The lines on the graph below show the distance in inches that
each monster truck travels over time in seconds.
a. Bryton states that each truck is traveling at a constant rate. Is his statement correct? Why or why not.
b. What do the values in the ordered pairs given on the graph represent?
c. Find the unit rate for each boy’s truck.
Ben:
Bryton
Boston:
d. Which boy’s truck is oving the fastest?
12. Explain why the graph of a proportional relationship makes a straight line.
13. Summarize what you know about proportional relationships using bulleted list in the space below.
(1,4)
(6,8)
(4,2)
Ben Bryton
Boston
8WB2 - 15
2014 University of Utah Middle School Math Project in partnership with the
Utah State Office of Education. Licensed under Creative Commons, cc-by.
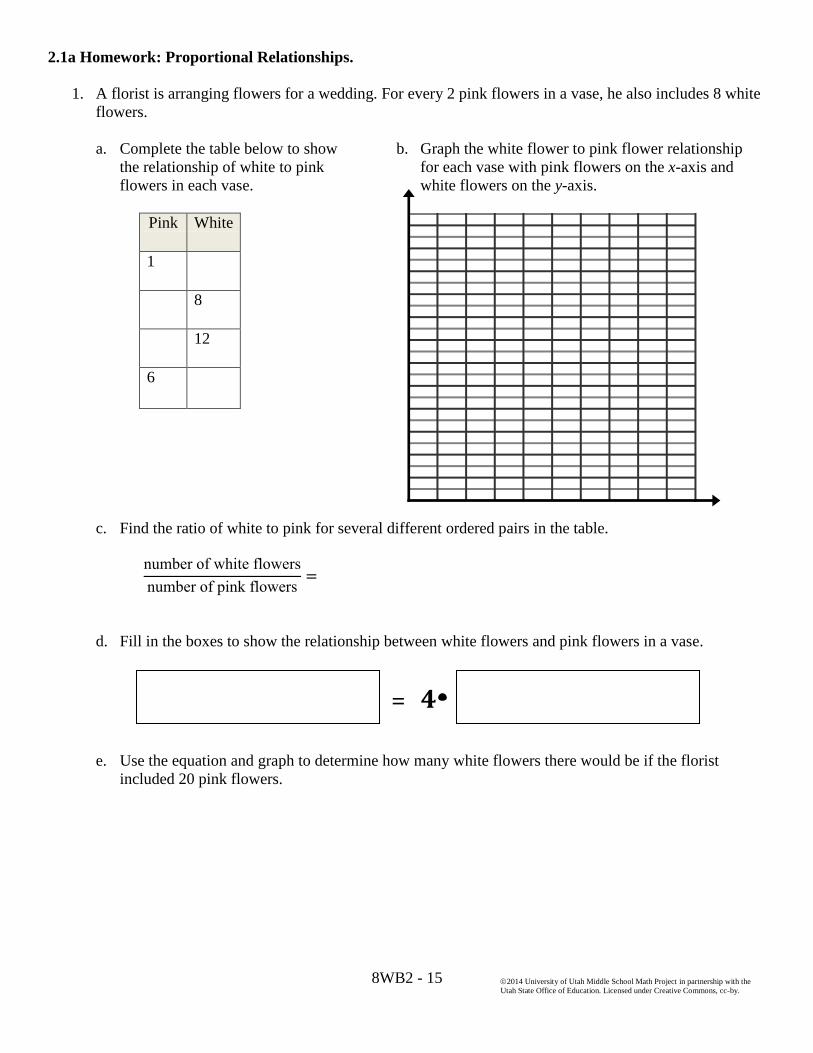
2.1a Homework: Proportional Relationships.
1. A florist is arranging flowers for a wedding. For every 2 pink flowers in a vase, he also includes 8 white
flowers.
a. Complete the table below to show
the relationship of white to pink
flowers in each vase.
Pink White
1
8
12
6
b. Graph the white flower to pink flower relationship
for each vase with pink flowers on the x-axis and
white flowers on the y-axis.
c. Find the ratio of white to pink for several different ordered pairs in the table.
nu ber of white flowers
nu ber of pink flowers
d. Fill in the boxes to show the relationship between white flowers and pink flowers in a vase.
=
e. Use the equation and graph to determine how many white flowers there would be if the florist
included 20 pink flowers.
4 times

8WB2 - 16
2014 University of Utah Middle School Math Project in partnership with the
Utah State Office of Education. Licensed under Creative Commons, cc-by.
2. You are going to Europe for vacation and must exchange your money. The exchange rate of Euros to
Dollars is a proportional relationship. The table below shows the exchange rate for Euros y to Dollars x.
a. Complete the table.
c. What is the unit rate for this
relationship?
Dollars(x) Euros(y)
2
4 3
6
6
b. Graph the Euro to Dollar relationship.
d. Write an equation that represents this relationship.
e. If you exchanged $20, how many Euro would you get?
f. If you received 36 Euro, how many dollars did you exchange?
3. In the problem given above we found that the unit rate described the number of Euros in a Dollar. Now
interchange the roles of y and x for this relationship. Find the exchange rate for Dollars (y) to Euros (x).
Use the questions below to help you do this.
a. Make a table of values to represent the Dollar to Euro relationship.
Euros(x) Dollars(y)

8WB2 - 17
2014 University of Utah Middle School Math Project in partnership with the
Utah State Office of Education. Licensed under Creative Commons, cc-by.
b. What is the unit rate for this Dollar to Euro relationship?
c. Write an equation that represents this relationship.
Use the equation to answer the following questions.
d. While in Europe you find a shirt that you want to buy that is marked at 25 Euros. You only have
$32 to exchange for the Euros. Do you have enough money? Explain.
e. Upon returning home from Europe you have 100 Euros left. How many Dollars can you get for 100
Euros?
4. The graph given below shows the gas mileage that Penny gets in her car. The ratio 192:6 describes the
miles to gallons fuel rate for her car.
a. What is the unit rate for this
relationship?
b. Use the graph to approximate
how many miles Penny can go
if she has a 15 gallon tank in
her car.
5. A proportional constant of
relates
the number of inches a flower
grows to the number of weeks since being planted.
a. Fill in the missing items in the table if x represents the number of weeks that have past and y
represents the height of the flower.
x
(weeks)
1 3 9 30
y
(height)
2
8WB2 - 18
2014 University of Utah Middle School Math Project in partnership with the
Utah State Office of Education. Licensed under Creative Commons, cc-by.
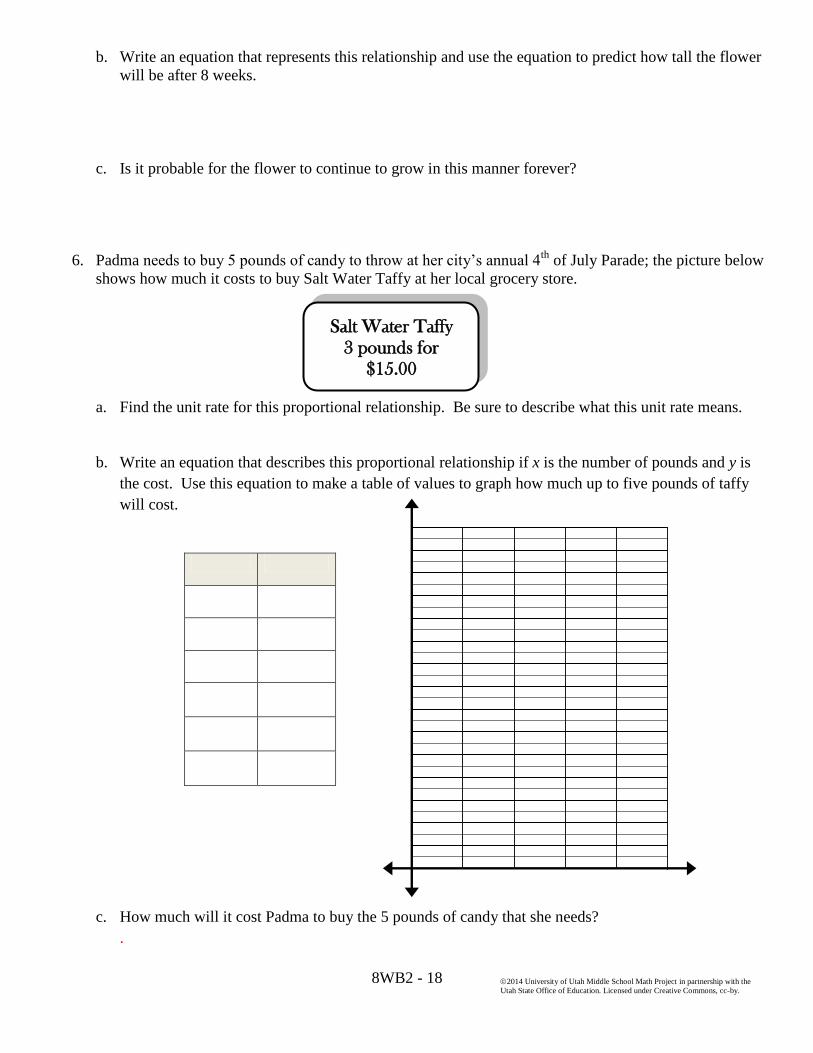
b. Write an equation that represents this relationship and use the equation to predict how tall the flower
will be after 8 weeks.
c. Is it probable for the flower to continue to grow in this manner forever?
6. Padma needs to buy 5 pounds of candy to throw at her city’s annual 4th
of July Parade; the picture below
shows how much it costs to buy Salt Water Taffy at her local grocery store.
a. Find the unit rate for this proportional relationship. Be sure to describe what this unit rate means.
b. Write an equation that describes this proportional relationship if x is the number of pounds and y is
the cost. Use this equation to make a table of values to graph how much up to five pounds of taffy
will cost.
c. How much will it cost Padma to buy the 5 pounds of candy that she needs?
.
Salt Water Taffy
3 pounds for
$15.00

8WB2 - 19
2014 University of Utah Middle School Math Project in partnership with the
Utah State Office of Education. Licensed under Creative Commons, cc-by.
7. Padma also sees that she can buy Tootsie Rolls at the grocery store. The graph below shows cost of
tootsies rolls per pound purchased. (Note: When cost is involved unit rate is often referred to as unit
price.)
d. What is the better deal for Padma, should she buy the Salt Water Taffy or the Tootsie Rolls? Justify
your answer.
a. Find and describe the unit rate for
the Tootsie Rolls. Highlight this
unit rate on the graph.
b. Describe how you can find the unit
rate at a different location on the
graph.
c. Graph the line for the Salt Water
Taffy on the grid with the Tootsie
Roll. Label each line with the candy
it represents.

8WB2 - 20
2014 University of Utah Middle School Math Project in partnership with the
Utah State Office of Education. Licensed under Creative Commons, cc-by.
8. Create your own relationship.
a. Create your own story that shows a proportional relationship.
b. Complete a table and graph to represent this situation. Be sure to label your graph and table.
c. Write an equation that represents your proportional relationship.

8WB2 - 21
2014 University of Utah Middle School Math Project in partnership with the
Utah State Office of Education. Licensed under Creative Commons, cc-by.
2.1b Class Activity: Comparing Proportional Relationships
Proportional relationships can help us to compare and analyze quantities and to make useful decisions.
Complete the tasks given below that compare proportional relationships.
Emma is putting together an order for sugar, flour, and salt for her restaurant pantry. The graph below shows the
cost y to buy x pounds of sugar and flour. One line shows the cost of buying x pounds of flour and the other line
shows the cost of buying x pounds of sugar.
1. From the graph which ingredient costs more to buy per pound? Justify your answer.
2. The cost to buy salt by the pound is less than sugar and flour. Draw a possible line that could represent
the cost to buy x pounds of salt.
Don and Betsy are making super smoothies to re-energize them after a long workout. Betsy follows the recipe
which calls for 2 cups of strawberries for every 3 bananas. Don wants twice as much as Betsy so he makes a
smoothie with 4 cups of strawberries and 5 bananas.
Don tastes his s oothie and says, “This tastes too tart, there are too any strawberries!”
3. Explain why Don’s s oothie is too tart.
4. Find and describe the unit rate for Besty’s s oothie.
Sugar
Flour

8WB2 - 22
2014 University of Utah Middle School Math Project in partnership with the
Utah State Office of Education. Licensed under Creative Commons, cc-by.
5. Find and describe the unit rate for Don’s s oothie.
6. Write an equation that relates the number of strawberries(x) to the number of bananas(y) for Besty’s
smoothie.
7. Write an equation that relates the number of strawberries(x) to the number of bananas(y) for Don’s
smoothie.
8. Use your equations to make tables to graph both of these lines on the same grid. Be sure to label which
line belongs to which person.
9. Explain how the steepness of the lines relates to the unit rate.

8WB2 - 23
2014 University of Utah Middle School Math Project in partnership with the
Utah State Office of Education. Licensed under Creative Commons, cc-by.
10. For the recreational activities below, compare the cost y per hour x by looking at graphs and equations.
Fill in the missing representations. If the information is given in a table, fill in the story and equation. If
the information is given in an equation, fill in the story and table, etc.
Find the unit rate or slope for each situation.
Graph all situations on the given graph on the next page. Remember to Label the axes. Label the lines with the situation names.
a. Long Distance Phone Call: It costs $10 per hour to talk on the phone long distance.
Equation: y = 10x Unit Rate:
Hours(x) Cost(y)
b. Roller skating
Hours(x) Cost(y)
2 5
Equation: Unit Rate:
c. Music Lessons The bill for private guitar lessons was $75. The lesson lasted 3 hours.
Hours(x) Cost(y)
Equation: Unit Rate:
d. Parks
Hours(x) Cost(y)
24 6
Equation: Unit Rate:
e. Bungee Jumping It costs $20 to bungee jump for 15 minutes.
Hours(x) Cost(y)
Equation: Unit Rate:
f.
Hours(x) Cost(y)
Equation: Unit Rate:

8WB2 - 24
2014 University of Utah Middle School Math Project in partnership with the
Utah State Office of Education. Licensed under Creative Commons, cc-by.
Graph
y _______________________________________
x ________________________________________________________
8WB2 - 25
2014 University of Utah Middle School Math Project in partnership with the
Utah State Office of Education. Licensed under Creative Commons, cc-by.
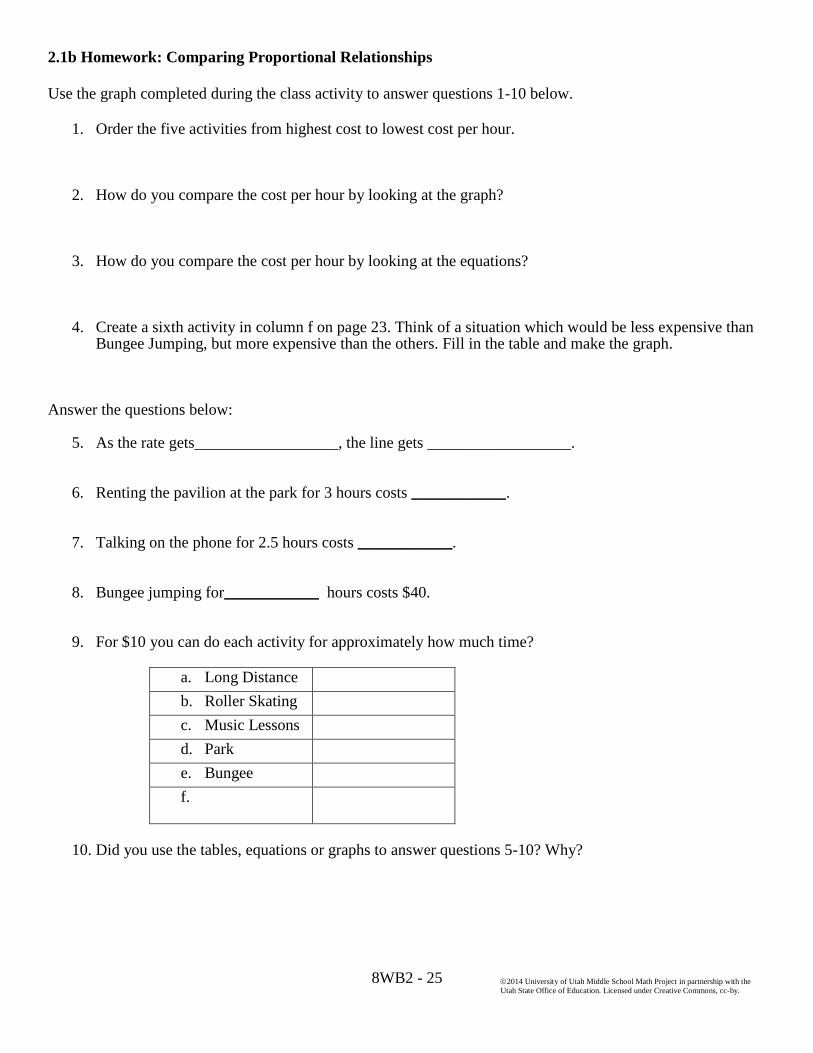
2.1b Homework: Comparing Proportional Relationships
Use the graph completed during the class activity to answer questions 1-10 below.
1. Order the five activities from highest cost to lowest cost per hour.
2. How do you compare the cost per hour by looking at the graph?
3. How do you compare the cost per hour by looking at the equations?
4. Create a sixth activity in column f on page 23. Think of a situation which would be less expensive than Bungee Jumping, but more expensive than the others. Fill in the table and make the graph.
Answer the questions below:
5. As the rate gets__________________, the line gets __________________.
6. Renting the pavilion at the park for 3 hours costs ________________.
7. Talking on the phone for 2.5 hours costs ________________.
8. Bungee jumping for________________ hours costs $40.
9. For $10 you can do each activity for approximately how much time?
a. Long Distance
b. Roller Skating
c. Music Lessons
d. Park
e. Bungee
Jumping
f.
10. Did you use the tables, equations or graphs to answer questions 5-10? Why?

8WB2 - 26
2014 University of Utah Middle School Math Project in partnership with the
Utah State Office of Education. Licensed under Creative Commons, cc-by.
11. The graph below shows the distance two snowboarders have traveled down a hill for several seconds.
Hannah is traveling 18 meters per second.
a. Which equation below is the best choice to describe the distance Torah travels after x seconds.
a) 29y x
b) 17y x
c) 10y x d) 18y x
b. Explain your reasoning for your choice above.
c. The unit rate of 10 meters per seconds describes Christina’s speed going down the sa e hill. Draw a
line that could possibly represent her speed.
12. At Sweet Chicks Bakery the equation 3.25y x represents the total cost to purchases cupcakes; where x
represents the number of cupcakes and y represents the total cost. The graph given below shows the cost
for buying cupcakes at Butter Cream Fairy Bakery.
a. Which bakery offers the better deal? Use the equation and graph to justify your answer.
b. Use the information given above to determine how much it will cost to buy 10 cupcakes at the
bakery with the better deal.
Hannah
Torah

8WB2 - 27
2014 University of Utah Middle School Math Project in partnership with the
Utah State Office of Education. Licensed under Creative Commons, cc-by.
13. The table given below shows how much money Charlie earned every day that he worked last week. He
gets paid the same rate every hour.
Tuesday Wednesday Friday
Hours Worked 4 5 3.5
Money Earned $38.00 $47.50 $33.25
Sophia earns $10.50 per hour at her job.
a. Using the same coordinate plane, draw a line that represents Charlie’s earnings if x represents the
number of hours worked and y represents the amount of money earned. Also draw a line that
represents how much Sophia earns. Label each line with the person’s na e.
b. How can you use this graph to determine who makes more money?

8WB2 - 28
2014 University of Utah Middle School Math Project in partnership with the
Utah State Office of Education. Licensed under Creative Commons, cc-by.
2.1c Class Activity: Proportional Relationships as Linear Relationships
1. Two cousins, Grace and Kelly, are both headed to the same summer camp. They both leave from their
own house for camp at the same time. The graph below represents the girls’ trips to ca p.
a. Analyze the graph to determine which girl is traveling faster.
b. Complete the table below for Grace and Kelly.
c. What do you notice about the ratio
for Grace? What do you notice about the ratio
for Kelly?
What is this ratio describing?
Kelly
Time(x) Distance(y)
0
120
2
200
4
Grace
Time(x) Distance(y)
0
1 60
120
3
240
Dista
nce fro
m G
race’s h
ou
se (miles)
Kelly
Grace
Time (hours)

8WB2 - 29
2014 University of Utah Middle School Math Project in partnership with the
Utah State Office of Education. Licensed under Creative Commons, cc-by.
d. Describe why Kelly’s driving relationship is not proportional?
e. Is it possible to still describe the rate at which Kelly drives? If so, what is it?
Both of the relationships described above have a constant rate of change of 60 mph. This constancy defines
them as linear relationships. (Their graphs produce straight lines).
f. Use what you learned above to see if you can write an equation that represents each girl’s distance y
fro Grace’s house after x hours.
Grace: ____________________________
Kelly: _____________________________
2. Agatha makes $26 for selling 13 bags of popcorn at the Juab County Fair.
a. Find and describe the rate of change for this relationship.
b. Complete the table that shows the
amount of money Agatha makes for
selling up to three bags of popcorn.
c. Graph the dollars to bags of popcorn relationship.
x y
Often the rate at which a relationship changes is shown by seeing that the changes from one
measurement to another are proportional; that is, the quotient of the change in y values with
respect to the x values is constant. This is called the Rate of Change.

8WB2 - 30
2014 University of Utah Middle School Math Project in partnership with the
Utah State Office of Education. Licensed under Creative Commons, cc-by.
d. Highlight on the graph where you can see the rate of change.
e. Write an equation that represents the relationship between the number of bags of popcorn that
Agatha sells(x) and the amount of money she makes (y).
Equation:______________
3. At the Sanpete County Fair Fitz gets paid $8 a day plus $2 for every bag of popcorn that he sells.
a. Find and describe the rate of change for this relationship.
b. Complete the table that shows the amount of money that Fitz makes for selling up to three bags of
popcorn.
c. Graph this relationship on the same coordinate plane as Agatha’s line on the previous page.
d. Highlight on the graph where you can see the rate of change.
e. Write an equation that represents the relationship between the number of bags of popcorn that Fitz
sells(x) and the amount of money he makes(y).
Equation:_________________
f. Write at least two sentences that explain the si ilarities and differences between Agatha’s and Fitz’s
relationship.
x y

8WB2 - 31
2014 University of Utah Middle School Math Project in partnership with the
Utah State Office of Education. Licensed under Creative Commons, cc-by.
2.1c Homework: Proportional Relationships as Linear Relationships
1. Nate and Landon are competing in a 5 minute long Hot Dog eating contest. Nate has a special strategy to
eat 4 hot dogs before the competition even begins to stretch out his stomach. The graph below represents
what happened during the competition.
a. Compete the tables where t = time in minutes and h= number of total hotdogs consumed.
b. Determine the rate of change (the number of hot dogs consumed per minute for each boy).
c. Write an equation that represents the number of hotdogs h for each boy after t minutes.
Landon: ___________________________
Nate: ___________________________
d. For which person, Landon or Nate, is the relationship between time and number of hot dogs eaten
proportional?? Justify your answer.
Landon
t h
0 0
1 2.5
3 7.5
12.5
Nate
t h
0
1 5.5
2
8.5
5
Landon
Nate
Hot Dog Eating Contest
Time (minutes)
Num
ber o
f Hotd
ogs

8WB2 - 32
2014 University of Utah Middle School Math Project in partnership with the
Utah State Office of Education. Licensed under Creative Commons, cc-by.
2. During her Tuesday shift at Sweater Barn, Fiona sells the same amount of sweaters per hour. Two hours
into her shift Fiona has sold 8 sweaters.
a. Find and describe the rate of change for this relationship.
b. Complete the table given below where x is the number of hours worked and y is the total number of
sweaters sold.
c. Graph the relationship on the grid below.
d. Write an equation that represents the relationship between the number of hours Fiona works(x) and
the amount of sweaters she sells(y).
Equation:_________________
e. Does this represent a proportional relationship? Explain how you know.
x y

8WB2 - 33
2014 University of Utah Middle School Math Project in partnership with the
Utah State Office of Education. Licensed under Creative Commons, cc-by.
3. On Saturday Fiona gets to work 15 minutes early and sells three sweaters before her shift even begins.
She then sells 4 sweaters every hour for the rest of her shift.
a. Find and describe the rate of change for this relationship.
.
b. Complete the table that represents this relationship.
c. Graph this relationship on the same coordinate plane as Tuesday’s
information on the previous page.
d. Write an equation that represents the relationship between the number of
hours Fiona works(x) and the amount of sweaters she sells(y).
Equation:____________________
e. Does this represent a proportional relationship? Explain how you know.
f. Compare the rate of change of both of the lines on the previous page by highlighting the change on
the graph. What do you notice?
4. Nayala bought 5 pounds of mangos for $6.25.
a. What is the price per pound for the mangos that she bought?
b. Which line below, A, B, or C, represents the cost in dollars(y) to weight in pounds(x) relationship?
x
(hours)
y
(sweaters
sold)
0 3
1
11
3
(3, 3.75)
(4, 2)
(1, 6.25)
A B
C

8WB2 - 34
2014 University of Utah Middle School Math Project in partnership with the
Utah State Office of Education. Licensed under Creative Commons, cc-by.
2.1d Self Assessment: Section 2.1
Consider the following skills/concepts. Rate your comfort level with each skill/concept by checking the box that
best describes your progress in mastering each skill/concept. Sample criteria are provided along with sample
problems for each skill/concept on the following page.
Skill/Concept
Minimal
Understanding
1
Partial
Understanding
2
Sufficient
Understanding
3
Substantial
Understanding
4
1. Graph and write
equations for a
proportional relationship
and identify the
proportional constant or
unit rate given a table,
equation, or contextual
situation.
See sample problem #1
I can correctly
answer only 1 of
the three parts of
the question.
I can correctly
answer 2 of the
three parts of the
question.
I can correctly
answer all three
parts of the
question but
cannot explain
my answers.
I know how to
find the unit rate
for both Callie
and Jeff and state
what the unit rate
is describing. I
can accurately
label the graphs
and
write an equation
that represents
the amount of
money earned in
relationship to
the number of
papers each
person delivered.
2. Compare proportional
relationships represented
in different ways.
See sample problem #2
I do not know
how to compare
these proportional
relationships.
I can find the unit
rate for only one
relationship.
I can find the
unit rate for each
relationship
represented and
then compare the
unit rates to
determine who
makes more
money.
I do not know
how to make a
third
representation
for someone who
makes more
money than
Addy and
Rachel.
I can find the
unit rate for each
relationship
represented and
then compare the
unit rates to
determine who
makes more
money.
I can also create
a third
representation
for someone who
makes more
money than
Addy and
Rachel.

8WB2 - 35
2014 University of Utah Middle School Math Project in partnership with the
Utah State Office of Education. Licensed under Creative Commons, cc-by.
Sample Problem #1
Callie and Jeff each have a job delivering newspapers. Jeff gets paid $140 dollars for delivering 350 papers.
Callie gets paid $100 for delivering 200 papers.
a. Find the unit rate for each person. Be sure to state what the unit rate is describing.
Callie:
Jeff:
b. The graph given below shows the money earned to papers delivered relationship. Label which line
represents each person.
c. Write an equation that represents how much each person earns if x is the number of papers they deliver
and y represents how much money they make.
Callie: Jeff:
Skill/Concept
Minimal
Understanding
1
Partial
Understanding
2
Sufficient
Understanding
3
Substantial
Understanding
4
3. Know that the graph of a
proportional relationship
goes through the origin.
See sample problem #3
I might be able to
make a graph of
Jeff’s savings but
I do not know
how it relates to
the other graph.
I can make a
graph that show’s
Jeff’s savings but
I don’t know how
it relates to the
other graph.
I can make a
graph that shows
Jeff’s savings. I
can discuss some
of the
similarities and
differences
between the two
graphs.
I can make (and
clearly label) a
graph that shows
Jeff’s savings. I
can discuss the
similarities and
differences
between the two
graphs including
a discussion
about
proportionality
and slope.
Number of Papers Delivered
Dollars E
arned

8WB2 - 36
2014 University of Utah Middle School Math Project in partnership with the
Utah State Office of Education. Licensed under Creative Commons, cc-by.
Sample Problem #2
Below is a table of how much money Rachel earns on her paper route. She gets paid the same amount of money
per paper delivered.
The equation below represents how much money Addy makes delivering papers. In the equation p represents
the number of papers delivered and d represents the money earned.
a. Who makes more money? How do you know?
b. Create a representation for someone who delivers papers and makes more than both Addy and Rachel.
Sample Problem #3
The graph provided below shows the amount of money that Jeff earns delivering papers. Suppose that Jeff had
$75 dollars in savings before he started his job of delivering newspapers. Jeff saves all of his money earned
from delivering newspapers. Graph this relationship below where x is the number of papers he delivers and y is
the amount of money he has in savings. Correctly label each line has Total Savings and Money Earned.
How does the savings line compare to his money earned line? Be sure to discuss the proportionality of each
graph.
Number of Papers
Delivered
Money
Earned
75 $36
150 $72
225 $108

8WB2 - 37
2014 University of Utah Middle School Math Project in partnership with the
Utah State Office of Education. Licensed under Creative Commons, cc-by.

8WB2 - 38
2014 University of Utah Middle School Math Project in partnership with the
Utah State Office of Education. Licensed under Creative Commons, cc-by.
Section 2.2: Linear Relations in Pattern and Context
Section Overview:
In this section, students start by writing rules for linear patterns. They use the skills and tools learned in Chapter
1 to write these equations. Students connect their rules to the geometric model and begin to surface ideas about
the rate of change and initial value (starting point) in a linear relationship. Students continue to use linear
patterns and identify the rate of change and initial value in the different representations of a linear pattern (table,
graph, equation, and geometric model). They also begin to understand how linear functions change. Rate of
change is investigated as students continue to interpret the parameters m and b in context and advance their
understanding of a linear relationship. Students move fluently between the representations of a linear
relationship and make connections between the representations. This conceptual foundation will set the stage
for students to be able to derive the equation of a line using dilations in section 2.3.
Concepts and Skills to Master:
By the end of this section, students should be able to:
1. Write rules for linear patterns and connect the rule to the pattern (geometric model).
2. Understand how a linear relationship grows as related to rate of change and show how that growth can
be seen in each of the representations.
3. Create the additional representations (table, graph, equation, context, geometric model) of a linear
relationship when given one representation and make connections between them.
4. Identify the rate of change and initial value of a linear relationship in the table, graph, equation, context,
and geometric model of a linear pattern.
8WB2 - 39
2014 University of Utah Middle School Math Project in partnership with the
Utah State Office of Education. Licensed under Creative Commons, cc-by.
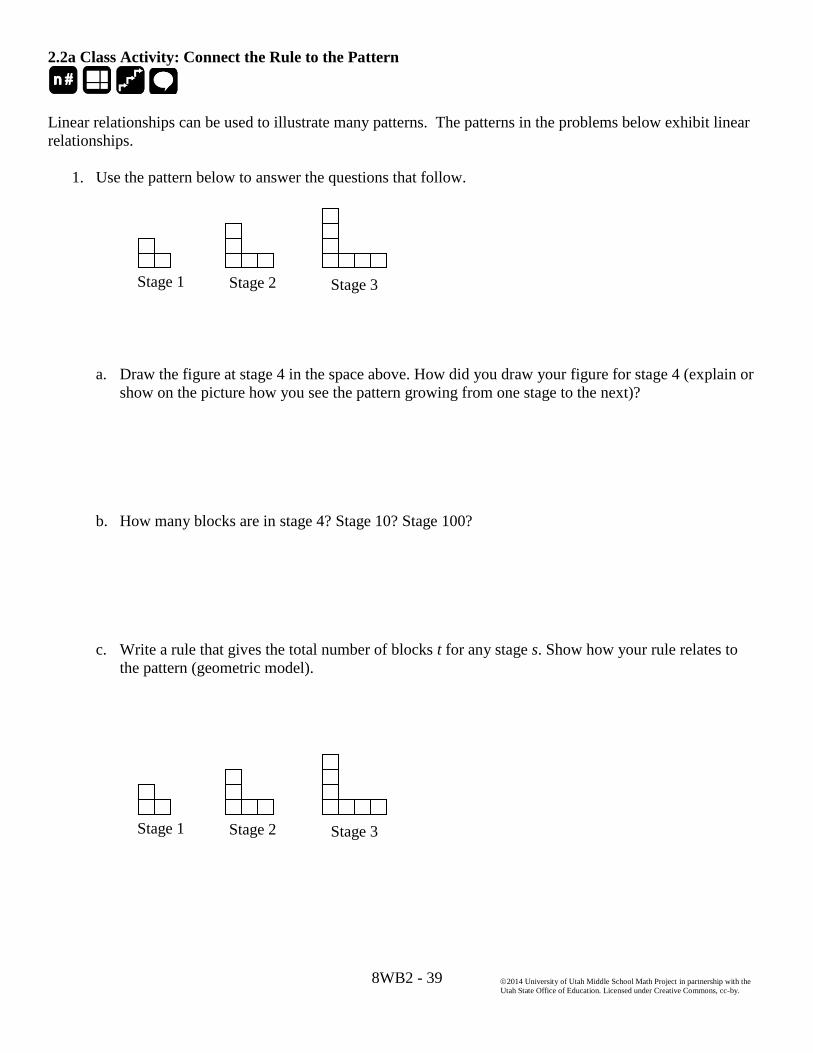
2.2a Class Activity: Connect the Rule to the Pattern
Linear relationships can be used to illustrate many patterns. The patterns in the problems below exhibit linear
relationships.
1. Use the pattern below to answer the questions that follow.
a. Draw the figure at stage 4 in the space above. How did you draw your figure for stage 4 (explain or
show on the picture how you see the pattern growing from one stage to the next)?
b. How many blocks are in stage 4? Stage 10? Stage 100?
c. Write a rule that gives the total number of blocks t for any stage s. Show how your rule relates to
the pattern (geometric model).
Stage 1 Stage 2 Stage 3
Stage 1 Stage 2 Stage 3

8WB2 - 40
2014 University of Utah Middle School Math Project in partnership with the
Utah State Office of Education. Licensed under Creative Commons, cc-by.
d. Try to think of a different rule that gives the total number of blocks t for any stage, s. Show how
your rule relates to the pattern (geometric model).
e. Use your rule to determine the number of blocks in stage 100.
f. Use your rule to determine which stage has 25 blocks.
g. Draw or describe stage 0 of the pattern. How does the number of blocks n in stage 0 relate to the
simplified form of your rule?
Stage 1 Stage 2 Stage 3

8WB2 - 41
2014 University of Utah Middle School Math Project in partnership with the
Utah State Office of Education. Licensed under Creative Commons, cc-by.
2. Use the pattern below to answer the questions that follow.
a. Draw the figure at stage 5 in the space above. How did you draw your figure in stage 5 (explain or
show on the picture how you see the pattern growing from one stage to the next)?
b. How many blocks are in stage 5? Stage 10? Stage 100?
c. Write a rule that gives the total number of blocks t for any stage, s. Show how your rule relates to
the pattern (geometric model).
Stage 2 Stage 1 Stage 3 Stage 4
Stage 2 Stage 1 Stage 3 Stage 4

8WB2 - 42
2014 University of Utah Middle School Math Project in partnership with the
Utah State Office of Education. Licensed under Creative Commons, cc-by.
d. Try to think of a different rule that gives the total number of blocks t for any stage, s. Show how
your rule relates to the pattern (geometric model).
e. Use your rule to determine the number of blocks in Stage 100.
f. Use your rule to determine which stage has 58 blocks.
g. Draw or describe stage 0 of the pattern. How does the number of blocks in stage 0 relate to the
simplified form of your rule?
Stage 2 Stage 1 Stage 3 Stage 4
8WB2 - 43
2014 University of Utah Middle School Math Project in partnership with the
Utah State Office of Education. Licensed under Creative Commons, cc-by.
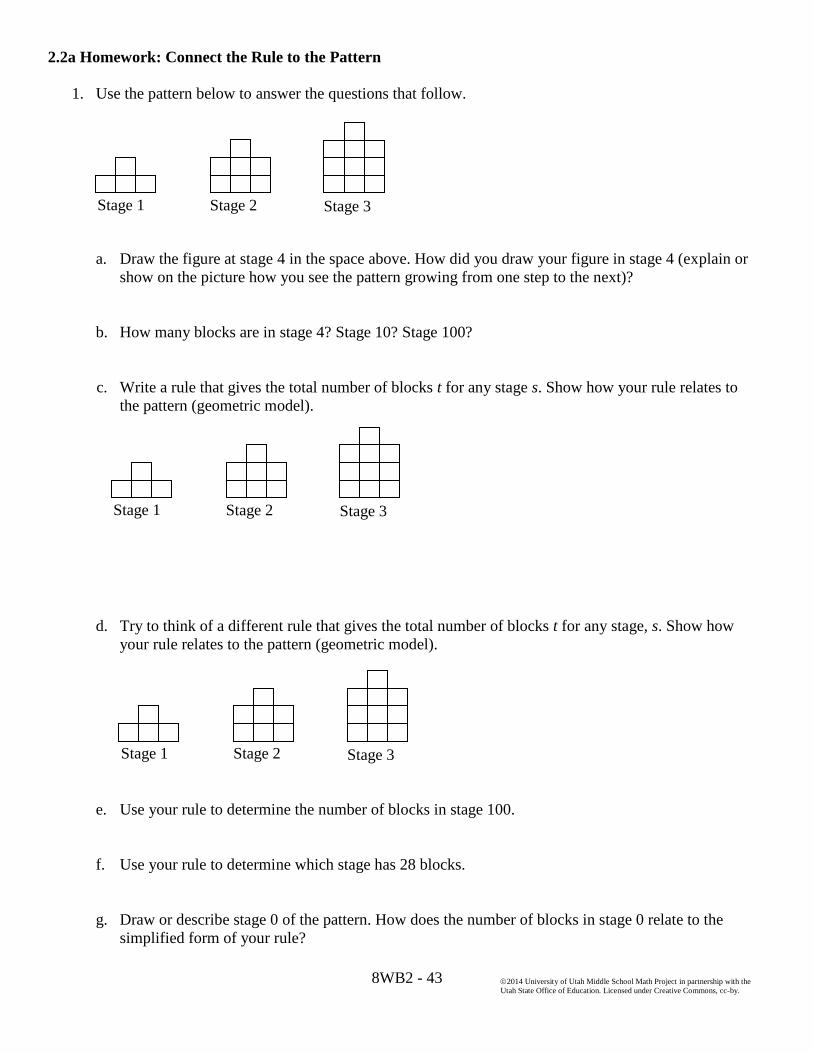
2.2a Homework: Connect the Rule to the Pattern
1. Use the pattern below to answer the questions that follow.
a. Draw the figure at stage 4 in the space above. How did you draw your figure in stage 4 (explain or
show on the picture how you see the pattern growing from one step to the next)?
b. How many blocks are in stage 4? Stage 10? Stage 100?
c. Write a rule that gives the total number of blocks t for any stage s. Show how your rule relates to
the pattern (geometric model).
d. Try to think of a different rule that gives the total number of blocks t for any stage, s. Show how
your rule relates to the pattern (geometric model).
e. Use your rule to determine the number of blocks in stage 100.
f. Use your rule to determine which stage has 28 blocks.
g. Draw or describe stage 0 of the pattern. How does the number of blocks in stage 0 relate to the
simplified form of your rule?
Stage 1 Stage 2 Stage 3
Stage 1 Stage 2 Stage 3
Stage 1 Stage 2 Stage 3

8WB2 - 44
2014 University of Utah Middle School Math Project in partnership with the
Utah State Office of Education. Licensed under Creative Commons, cc-by.
2. Use the pattern below to answer the questions that follow.
a. Draw the figure at stage 4 in the space above. How did you draw your figure in stage 4 (explain or
show on the picture how you see the pattern growing from one stage to the next)?
b. How many blocks are in stage 4? Stage 10? Stage 100?
c. Write a rule that gives the total number of blocks t for any stage, s. Show how your rule relates to
the pattern (geometric model).
d. Try to think of a different rule that gives the total number of blocks t for any stage, s. Show how
your rule relates to the pattern (geometric model).
e. Use your rule to determine the number of blocks in stage 100.
f. Use your rule to determine which stage has 37 blocks.
g. Draw or describe Stage 0 of the pattern. How does the number of blocks in stage 0 relate to the
simplified form of your rule?
Stage 1 Stage 2 Stage 3
Stage 1 Stage 2 Stage 3
Stage 1 Stage 2 Stage 3

8WB2 - 45
2014 University of Utah Middle School Math Project in partnership with the
Utah State Office of Education. Licensed under Creative Commons, cc-by.
2.2b Class Activity: Representations of a Linear Pattern
1. You studied this pattern in the previous lesson. Use your work from the previous lessons to answer the
questions that follow.
a. How many new blocks are added to the pattern from one stage to the next?
b. Complete the table.
c. Show where you see the rate of change in your table.
d. Create a graph of this data. Where do you see the rate of change on your graph?
e. What is the simplified form of the equation that gives the number of blocks t for any stage s (see
previous lesson)? Where do you see the different pieces of the equation in the geometric model,
table, and graph?
f. The pattern above is a linear pattern. Describe how a linear pattern grows. Describe what the graph
of a linear pattern looks like.
Stage
(s)
# of
Blocks
(t)
1
2
3
4
5
Stage 1 Stage 2 Stage 3

8WB2 - 46
2014 University of Utah Middle School Math Project in partnership with the
Utah State Office of Education. Licensed under Creative Commons, cc-by.
2. You studied this pattern in the previous lesson. Use your work from the previous lesson to answer the
questions that follow.
a. How many new blocks are added to the pattern from one stage to the next?
b. Complete the table.
c. Show where you see the rate of change in your table.
d. Create a graph of these data. Where do you see the rate of change on your graph?
e. What is the equation that gives the number of blocks t for any stage s (see previous lesson)? Where
do you see the different pieces of the equation in the geometric model, table, and graph?
f. Is this pattern a linear pattern? Use supporting evidence from each of the representations to justify
your answer.
Stage
(s)
# of
Blocks
(t)
1
2
3
4
5
Stage 1 Stage 2 Stage 3 Stage 4
8WB2 - 47
2014 University of Utah Middle School Math Project in partnership with the
Utah State Office of Education. Licensed under Creative Commons, cc-by.
3. Describe what you see in each of the representations (geometric model, table, graph, and equation) of a
linear pattern. Make connections between the different representations.
Geometric Model:
Table:
Graph:
Equation:
8WB2 - 48
2014 University of Utah Middle School Math Project in partnership with the
Utah State Office of Education. Licensed under Creative Commons, cc-by.
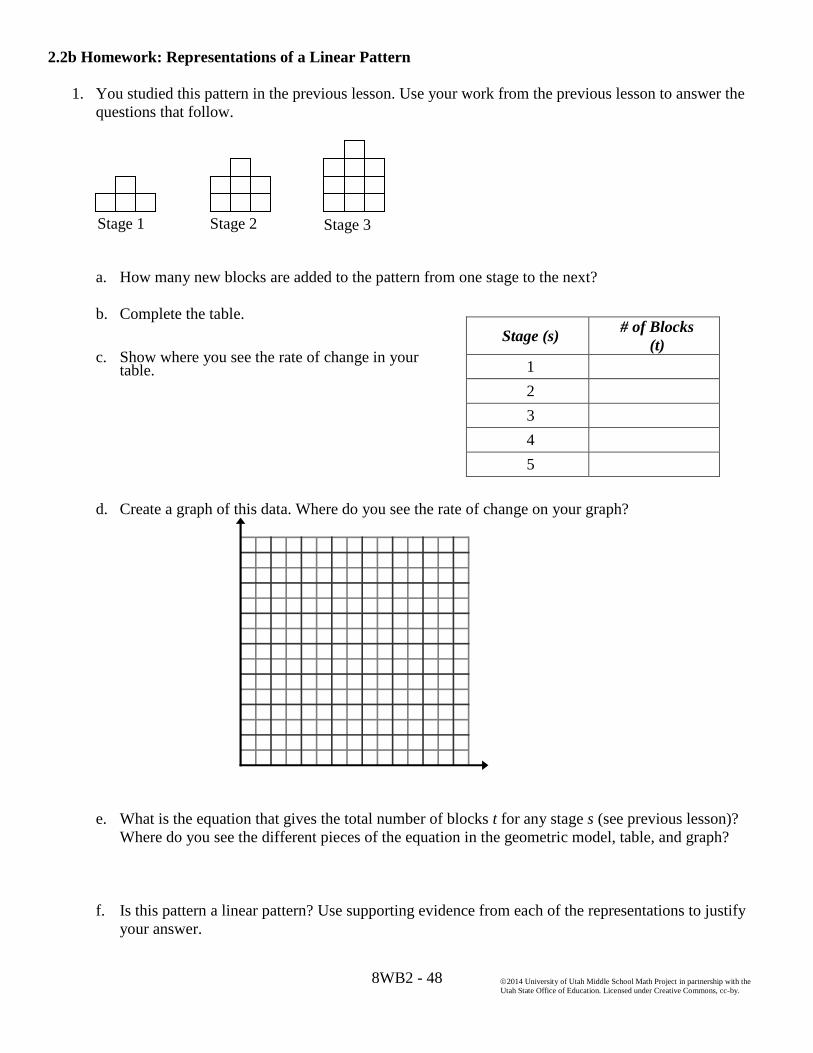
2.2b Homework: Representations of a Linear Pattern
1. You studied this pattern in the previous lesson. Use your work from the previous lesson to answer the
questions that follow.
a. How many new blocks are added to the pattern from one stage to the next?
b. Complete the table.
c. Show where you see the rate of change in your table.
d. Create a graph of this data. Where do you see the rate of change on your graph?
e. What is the equation that gives the total number of blocks t for any stage s (see previous lesson)?
Where do you see the different pieces of the equation in the geometric model, table, and graph?
f. Is this pattern a linear pattern? Use supporting evidence from each of the representations to justify
your answer.
Stage (s) # of Blocks
(t)
1
2
3
4
5
Stage 1 Stage 2 Stage 3

8WB2 - 49
2014 University of Utah Middle School Math Project in partnership with the
Utah State Office of Education. Licensed under Creative Commons, cc-by.
2. You studied this pattern in the previous lesson. Use your work from the previous lesson to answer the
questions that follow.
a. How many new blocks are added to the pattern from one stage to the next?
b. Complete the table.
c. Show where you see the rate of change in your table.
d. Create a graph of this data. Where do you see the rate of change on your graph?
e. What is the equation that gives the total number of blocks t for any stage s (see previous lesson)?
Where do you see the different pieces of the equation in the geometric model, table, and graph?
f. What do you notice about this pattern? Use supporting evidence from each of the representations to
justify your answer.
Stage
(s)
# of
Blocks
(t)
1
2
3
4
5
Stage 1 Stage 2 Stage 3

8WB2 - 50
2014 University of Utah Middle School Math Project in partnership with the
Utah State Office of Education. Licensed under Creative Commons, cc-by.
3. Create your own geometric model of a linear pattern in the space below. Then complete the table,
graph, and equation for your pattern. Use these representations to prove that your pattern is linear.
.
Equation: _____________________________
Prove that your pattern is linear using the representations (geometric model, table, graph, and equation)
as evidence.
4. Draw or describe a pattern that can be represented by the equation where t is the total
number of blocks and s is the stage.
Stage
(s)
# of
Blocks
(t)
1
2
3
4
5
Stage
Num
ber o
f Blo
cks

8WB2 - 51
2014 University of Utah Middle School Math Project in partnership with the
Utah State Office of Education. Licensed under Creative Commons, cc-by.
2.2c Class Activity: Representations of a Linear Context
1. Courtney is collecting coins. She has 2 coins in her collection to start with and plans to add 4 coins
each week.
a. Complete the table and graph to show how many coins Courtney will have after 6 weeks.
b. Write an equation for the number of coins c Courtney will have after w weeks.
c. Is this context linear? Use evidence from the context, graph, table, and equation to support your
answer.
Time
(weeks)
# of
Coins
0
1
2
3
4
5
6

8WB2 - 52
2014 University of Utah Middle School Math Project in partnership with the
Utah State Office of Education. Licensed under Creative Commons, cc-by.
2. Jack is filling his empty swimming pool with water. The pool is being filled at a constant rate of four
gallons per minute.
a. Complete the table and graph below to show how much water will be in the pool after 6 minutes.
b. Write an equation for the number of gallons g that will be in the pool after m minutes.
c. Is this context linear? Use evidence from the context, graph, table, and equation to support your
answer.
d. Compare this swimming pool problem to the previous problem about coins. How are the problems
similar? How are they different?
e. How would you change the coin context so that it could be modeled by the same equation as the
swimming pool context?
f. How would you change the swimming pool context so that it could be modeled by the same
equation as the coin context?
Time
(minutes)
Amount
of Water
(gallons)
0
1
2
3
4
5
6

8WB2 - 53
2014 University of Utah Middle School Math Project in partnership with the
Utah State Office of Education. Licensed under Creative Commons, cc-by.
3. An airplane is at an elevation of 3000 ft. The table below shows its elevation(y) for every 2 miles(x) it
travels.
a. Complete the graph to show how many miles it will take for the airplane to reach the ground.
b. Use the table and the graph to find the rate of change.
c. Write an equation that represents this relationship
d. Explain the how equation can be used to determine how many miles it will take for the plane to
reach the ground.
Miles Elevation
0 3000
2 2000
4 1000

8WB2 - 54
2014 University of Utah Middle School Math Project in partnership with the
Utah State Office of Education. Licensed under Creative Commons, cc-by.
2.2c Homework: Representations of a Linear Context
1. Hillary is saving money for college expenses. She is saving $200 per week from her summer job.
Currently, she does not have any money saved.
a. Complete the table and graph to show how much money Hillary will have 6 weeks from now.
b. Write an equation for the amount of money m Hillary will have saved after w weeks if she
continues saving at the same rate.
c. Is this context linear? Use evidence from the context, graph, table, and equation to support your
answer.
Time
(weeks)
Amount
Saved
(dollars)
0
1
2
3
4
5
6

8WB2 - 55
2014 University of Utah Middle School Math Project in partnership with the
Utah State Office of Education. Licensed under Creative Commons, cc-by.
2. The cost for a crew to come and landscape your yard is $200 per hour. The crew charges an initial fee
of $100 for equipment.
a. Complete the table and graph below to show how much it will cost for the crew to work on your
yard for 6 hours.
b. Write an equation for the cost c of landscaping for h hours.
c. Is this context linear? Use evidence from the context, graph, table, and equation to support your
answer.
d. Co pare this landscaping proble to the proble with Hillary’s savings. How are the proble s similar? How are they different?
e. How would you change the savings context so that it could be modeled by the same equation as
the landscaping context?
f. How would you change the landscaping context so that it could be modeled by the same equation
as the savings context?
Time
(hours)
Cost
(dollars)
0
2
4
6

8WB2 - 56
2014 University of Utah Middle School Math Project in partnership with the
Utah State Office of Education. Licensed under Creative Commons, cc-by.
3. Linda is always losing her tennis balls. At the beginning of tennis season she has 20 tennis balls. The
table below represents how many balls she has as the season progresses; where x represents the
number of weeks and y represents the number of tennis balls.
a. Complete the graph to show how many weeks will pass until Linda runs out of balls.
b. Use the table and the graph to find the rate of change.
c. Write an equation that represents this relationship.
d. Explain how to use the equation to determine how many weeks will pass until Linda runs out of
balls.
Weeks
Number
of tennis
balls
0 20
2 16
4 12
6 8

8WB2 - 57
2014 University of Utah Middle School Math Project in partnership with the
Utah State Office of Education. Licensed under Creative Commons, cc-by.
2.2d Class Activity: Rate of Change in a Linear Relationship
Explore and investigate the rate of change in linear relationships below.
1. The graph below shows the distance a cat is from his bowl of milk over time. Which sentence is a good
match for the graph?
A. The cat was 12 feet away from the milk and ran toward
it reaching it after 4 seconds.
B. The cat was 4 feet away from the milk and ran toward
it reaching it after 12 seconds.
C. The cat ran away from the milk at a rate of 3 feet per
second.
D. The cat ran away from the milk at a rate of 4 feet per
second.
E. The cat was 12 feet away from the milk and ran away
from it at a rate of 4 feet per second.
2. Write everything you can say about the cat and the distance he is from the milk during this time.
3. Create a table at the right which also tells the story of the graph.
4. Is this a proportional relationship? Justify your answer.
5. Find the unit rate in this story.
(4, 12)

8WB2 - 58
2014 University of Utah Middle School Math Project in partnership with the
Utah State Office of Education. Licensed under Creative Commons, cc-by.
6. Sketch a graph for each of the four stories fro nu ber 1 on the previous page which you didn’t choose.
Label the graphs by letter to match the story. Find the rate of change for each story as well.
Rate of change:
Rate of change:
Rate of change:
Rate of change:
7. A baby was 9 feet from the edge of the porch. He crawled toward the edge for 6 seconds. Then his
mother picked him up a few feet before he reached the edge. Circle the graph below that matches this
story.
(6,9) (0,9)
(6,2) (0,2) (8,2)
(0,9)
(9,0)
8WB2 - 59
2014 University of Utah Middle School Math Project in partnership with the
Utah State Office of Education. Licensed under Creative Commons, cc-by.
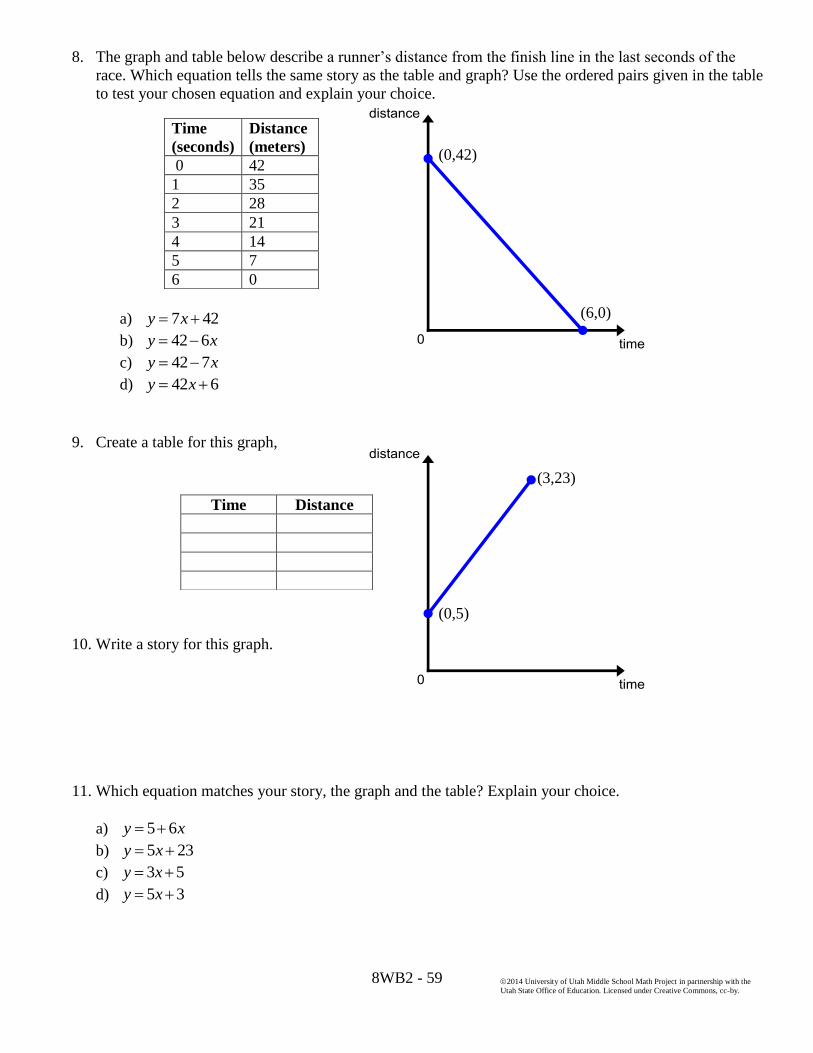
8. The graph and table below describe a runner’s distance fro the finish line in the last seconds of the
race. Which equation tells the same story as the table and graph? Use the ordered pairs given in the table
to test your chosen equation and explain your choice.
a) 7 42y x
b) 42 6y x
c) 42 7y x
d) 42 6y x
9. Create a table for this graph,
10. Write a story for this graph.
11. Which equation matches your story, the graph and the table? Explain your choice.
a) 5 6y x
b) 5 23y x
c) 3 5y x
d) 5 3y x
Time
(seconds)
Distance
(meters)
0 42
1 35
2 28
3 21
4 14
5 7
6 0
Time Distance
(0,42)
(6,0)
(0,5)
(3,23)

8WB2 - 60
2014 University of Utah Middle School Math Project in partnership with the
Utah State Office of Education. Licensed under Creative Commons, cc-by.
2.2d Homework: Rate of Change in a Linear Relationship
Explore and investigate the linear relationships below.
1. The graph below shows the distance a mouse is from her cheese over time. Which sentence is a good
match for the graph?
A. The mouse is 8 inches away from the cheese, she sits
there and does not move.
B. The mouse is 8 inches away from the cheese, she
scurries towards it and reaches it after 4 seconds.
C. The mouse scurries away from the piece of cheese at a
rate of 2 inches per second.
D. The mouse scurries away from the piece of cheese at a
rate of 4 inches per second.
E. The mouse is 8 inches away from the piece of cheese
and scurries away from it a rate of 2 inches per second.
2. Write everything you can say about the mouse and the distance she is from the cheese during this time.
3. Create a table at the right which also tells the story of the graph.
4. Is this a proportional relationship? If so what is the proportional
constant?
(0, 8)
(4, 0)
Distance in inches
Time in seconds

8WB2 - 61
2014 University of Utah Middle School Math Project in partnership with the
Utah State Office of Education. Licensed under Creative Commons, cc-by.
5. Sketch a graph for the four stories fro nu ber 1 above which you didn’t choose in the space provided. Label the graphs by letter to match the story. Find the rate of change for each story as well.
Rate of change:
Rate of change:
Rate of change:
Rate of change
6. Compare the rate of change with the steepness of each line above, how does the rate of change relate to
the steepness of the line?

8WB2 - 62
2014 University of Utah Middle School Math Project in partnership with the
Utah State Office of Education. Licensed under Creative Commons, cc-by.
7. Triss opens a bank account and adds $25 to the account every week. Circle the graph below that matches
this story.
8. Write a story for each of the remaining graphs above.
Use the graph at the right to complete the following.
9. Create a table for this graph,
10. Write a story for this graph.
11. Which equation matches your story, the graph and the table?
a) 5 6y x
b) 4 26y x
c) 5 6y x
d) 6 4y x
Time Distance
0
1
2
3
4
(0, 6)
(4, 26) Distance
Time
(5,125)
(0,50)
(5,50)
(2,125) (0,125)
(5,0)

8WB2 - 63
2014 University of Utah Middle School Math Project in partnership with the
Utah State Office of Education. Licensed under Creative Commons, cc-by.
2.2e Class Activity: More Representations of a Linear Context
Directions: In each of the following problems, you are given one of the representations of a linear relationship.
Complete the remaining 3 representations. Be sure to label the columns in your table and the axes on your
graph. 1. The State Fair
Context
You and your friends go to the state fair. It costs $6 to
get into the fair and $2 each time you go on a ride.
Consider the relationship between number of rides and
total cost.
Table
Graph
Equation
a. What is the rate of change in this problem? What does the rate of change represent in the context?
b. What is the y-intercept of your graph? Where do you see the y-intercept in the table and in the
equation? What does the y-intercept represent in the context?
c. How would you change the context so that the relationship between total cost and number of rides
can be modeled by the equation ?
d. How would you change the context so that the relationship between total cost and number of rides
can be modeled by the equation ?

8WB2 - 64
2014 University of Utah Middle School Math Project in partnership with the
Utah State Office of Education. Licensed under Creative Commons, cc-by.
2. Road Trip
Context
You are taking a road trip. You start the day with a
full tank of gas. Your tank holds 16 gallons of gas.
On your trip, you use 2 gallons per hour. Consider
the relationship between time in hours and amount
of gas remaining in the tank.
Table
Graph
Equation
a. What is the rate of change in this problem? What does the rate of change represent in the context?
b. What is the y-intercept of your graph? Where do you see the y-intercept in the table and in the
equation? What does the y-intercept represent in the context?
c. How would your equation change if your gas tank held 18 gallons of gas and used 2.5 gallons per
hour of driving? What would these changes do to your graph?
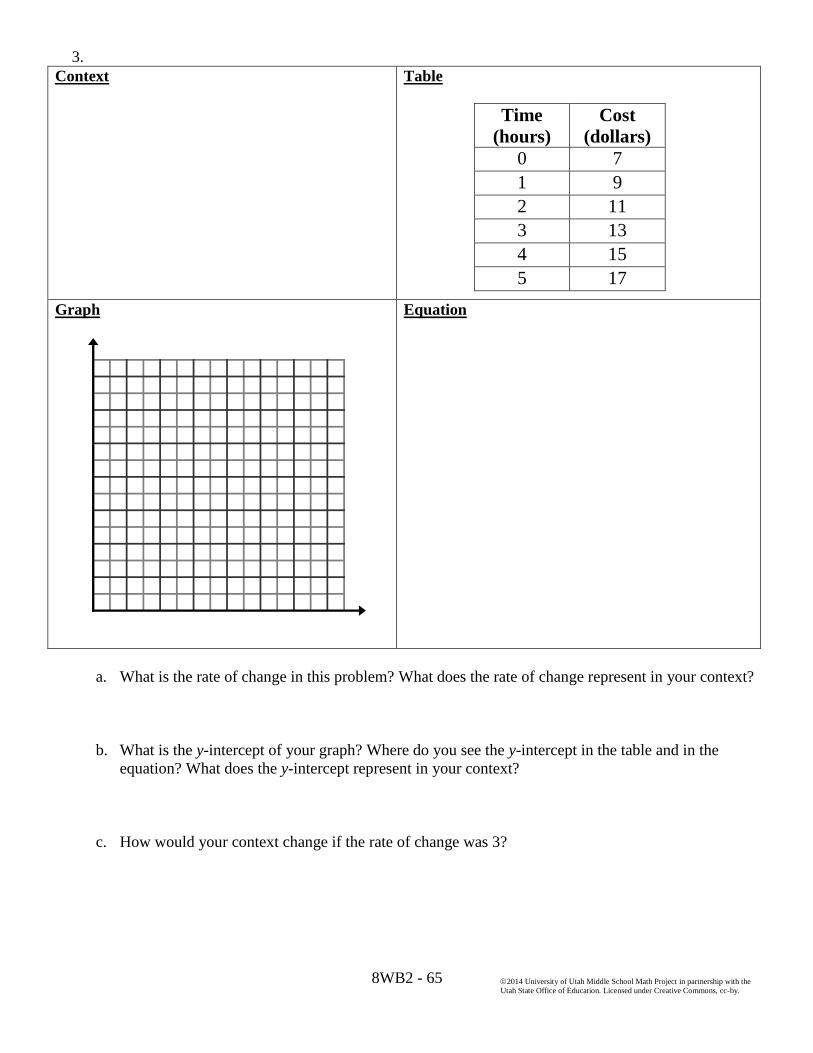
8WB2 - 65
2014 University of Utah Middle School Math Project in partnership with the
Utah State Office of Education. Licensed under Creative Commons, cc-by.
3.
Context
Table
Time
(hours)
Cost
(dollars)
0 7
1 9
2 11
3 13
4 15
5 17
Graph
Equation
a. What is the rate of change in this problem? What does the rate of change represent in your context?
b. What is the y-intercept of your graph? Where do you see the y-intercept in the table and in the
equation? What does the y-intercept represent in your context?
c. How would your context change if the rate of change was 3?

8WB2 - 66
2014 University of Utah Middle School Math Project in partnership with the
Utah State Office of Education. Licensed under Creative Commons, cc-by.
4.
Context
Table
Graph
Equation
a. What is the rate of change in this problem? What does the rate of change represent in your context?
b. What is the y-intercept of the graph? Where do you see the y-intercept in the table and in the
equation? What does the y-intercept represent in your context?
c. How would your context and equation change if the y-intercept of the graph was changed to 75?
How would this change affect the graph?
d. How would your context and equation change if the rate of change in this problem was changed to
? Would the graph of the new line be steeper or less steep than the original?

8WB2 - 67
2014 University of Utah Middle School Math Project in partnership with the
Utah State Office of Education. Licensed under Creative Commons, cc-by.
5.
Context
Table
Graph
Equation
a. How would your context change if the equation above was changed to ? How would
this change affect the graph?
b. How would your context change if the equation above was changed to ? How would this
change affect the graph?
6. Describe in your own words what a linear relationship is composed of. Think about all of the equations
that you have written to represent a linear relationship, what do they have in common, what do the
different parts of the equations represent?

8WB2 - 68
2014 University of Utah Middle School Math Project in partnership with the
Utah State Office of Education. Licensed under Creative Commons, cc-by.
2.2e Homework: More Representations of a Linear Context
Directions: In each of the following problems, you are given one of the representations of a linear relationship.
Complete the remaining 3 representations. Be sure to label the columns in your table and the axes on your
graph.
1. A Community Garden
Context
Gavin is buying tomato plants to plant in his local
community garden. Tomato plants are $9 per flat (a flat
contains 36 plants). Consider the relationship between
total cost and number of flats purchased.
Table
Graph
Equation
a. What is the rate of change in this problem? What does the rate of change represent in the context?
b. What is the y-intercept of your graph? What does the y-intercept represent in the context?
c. How would you change the context so that the relationship between total cost c and number of flats f
purchased was ?

8WB2 - 69
2014 University of Utah Middle School Math Project in partnership with the
Utah State Office of Education. Licensed under Creative Commons, cc-by.
2. Enrollment
Context
The number of students currently enrolled at Discovery
Place Preschool is 24. Enrollment is going up by 6 students
each year. Consider the relationship between the number of
years from now and the number of students enrolled.
Table
Graph
Equation
a. What is the rate of change in this problem? What does the rate of change represent in the context?
b. What is the y-intercept of your graph? What does the y-intercept represent in the context?
c. How would you change the context so that the relationship between number of years and number of
students enrolled was ?

8WB2 - 70
2014 University of Utah Middle School Math Project in partnership with the
Utah State Office of Education. Licensed under Creative Commons, cc-by.
3. Write your own context
Context
Table
Time
(hours)
# of Fish
0 300
2 270
4 240
6 210
8 180
10 150
Graph
Equation
a. What is the rate of change in this problem? What does the rate of change represent in the context?
b. What is the y-intercept of your graph? What does the y-intercept represent in the context?
c. How would you change your context so that the amount of fish remaining y after x hours could be
represented by the equation

8WB2 - 71
2014 University of Utah Middle School Math Project in partnership with the
Utah State Office of Education. Licensed under Creative Commons, cc-by.
4. Write your own context
Context
Table
Graph
Equation
a. What is the rate of change in this problem? What does the rate of change represent in the context?
b. What is the y-intercept of your graph? What does the y-intercept represent in the context?

8WB2 - 72
2014 University of Utah Middle School Math Project in partnership with the
Utah State Office of Education. Licensed under Creative Commons, cc-by.
5. Write your own context
Context
Table
Graph
Equation
a. What is the rate of change in this problem? What does the rate of change represent in the context?
b. What is the y-intercept of your graph? What does the y-intercept represent in your context?
c. How would your context and equation change if the rate of change in this problem was changed to ?
Would the graph of the new line be steeper or less steep?

8WB2 - 73
2014 University of Utah Middle School Math Project in partnership with the
Utah State Office of Education. Licensed under Creative Commons, cc-by.
2.2f Self-Assessment: Section 2.2
Consider the following skills/concepts. Rate your comfort level with each skill/concept by checking the box that
best describes your progress in mastering each skill/concept. Some sample criteria are provided as well as
sample problems on the following page.
Skill/Concept
Minimal
Understanding
1
Partial
Understanding
2
Sufficient
Understanding
3
Substantial
Understanding
4
1. Write rules for linear
patterns and connect the
rule to the pattern
(geometric model).
See sample problem #1
I don’t know how
to write a rule for
the pattern and I
don’t know how
to find the
number of blocks
in the 50th
stage.
I don’t know how
to write a rule for
the pattern. The
only way I know
how to find the
number of blocks
in the 50th
stage is
by adding the rate
of change 50
times.
I can write a rule
that describes the
pattern but don’t
know how my
rule connects to
the pattern.
I can write a rule
that describes the
pattern and
explain how my
rule connects to
the pattern. I can
also use the rule
to predict the
number of
blocks in stage
50.
2. Understand how a linear
relationship grows as
related to rate of change
and show how that
growth can be seen in
each of the
representations.
See sample problem #2
I can find the rate
of change in only
one of the
representations.
I can find the rate
of change in some
of the
representations.
I know how to
find the rate of
change in all the
representations
but have a hard
time explaining
how you can see
the growth.
I know how to
find the rate of
change in all the
representations.
I can also show
how the rate of
change can be
seen.
3. Create the additional
representations (table,
graph, equation, context,
geometric model) of a
linear relationship when
given one representation
and make connections
between them.
See sample problem #3
I can only make
one linear
representation.
I can make some
of the linear
representations.
I can make all
the different
representations
of a linear
pattern but I
don’t know how
they are
connected.
I can fluently
move between
the different
representations
of a linear
relationship and
make
connections
between them.
4. Identify the rate of
change and initial value
of a linear relationship in
the table, graph,
equation, context, and
geometric model of a
linear pattern.
See sample problem #4
I can identify the
rate of change and
initial value in 2 or
less of the
representations of a
linear model.
I can identify the
rate of change and
initial value in 3 of
the representations
of a linear model.
I can identify the
rate of change and
initial value in 4
of the
representations of
a linear model.
I can identify the
rate of change and
initial value in all
of the
representations of
a linear model.

8WB2 - 74
2014 University of Utah Middle School Math Project in partnership with the
Utah State Office of Education. Licensed under Creative Commons, cc-by.
Sample Problem #1
Write a rule that describes the pattern given below where s is the stage number and t is the total number of
blocks. Be sure to explain how your rule connects to the pattern. Then use the rule to predict the number of
blocks in the 50th
stage.
Sample Problem #2
For the pattern given below find the number of blocks in the next stage by determining the rate of change. Fill
in the table and graph and explain how you can see the pattern grow in each of these representations.
Stage
(s)
# of
Blocks
(b)
1
2
3
4
5
Stage 1 Stage 2 Stage 3
Stage 1 Stage 2 Stage 3

8WB2 - 75
2014 University of Utah Middle School Math Project in partnership with the
Utah State Office of Education. Licensed under Creative Commons, cc-by.
Sample Problem #3 Given the following equation create a table, graph, and a context or geometrical model that the equation could
possibly describe. Write a sentence that describes how the different representations are related.
Table:
x y
Graph:
Context/Model:

8WB2 - 76
2014 University of Utah Middle School Math Project in partnership with the
Utah State Office of Education. Licensed under Creative Commons, cc-by.
Sample Problem #4 For each of the representations given below identify the rate of change and initial value.
5.
Rate of Change:
Initial Value:
1.
Rate of change:
Initial value:
2. The local community center charges a monthly
fee of $15 to use their facilities plus $2 per visit.
Rate of change:
Initial Value:
3.
Rate of change:
Initial Value:
4.
x y
Rate of Change:
Initial Value:
Stage 1 Stage 2 Stage 3

8WB2 - 77
2014 University of Utah Middle School Math Project in partnership with the
Utah State Office of Education. Licensed under Creative Commons, cc-by.
Section 2.3: Investigate The Slope of a Line
Section Overview:
This section uses proportionality to launch an investigation of slope. Transformations are integrated into the
study of slope by looking at the proportionality exhibited by dilations. Students dilate a triangle on lines to
show that a dilation produces triangles that have proportional parts and thus the slope is the same between any
two distinct points on a non-vertical line. They further their investigation of slope and proportional relationships
and derive the slope formula. Adequate time and practice is given for students to solidify their understanding of
this crucial aspect of linear relationships. The last few lessons provide an opportunity for students to use all of
the knowledge and tools acquired throughout the chapter to formally derive the equations y=mx and y=mx+b.
They will use proportionality produced by a dilation to do this derivation.
Concepts and Skills to Master:
By the end of this section, students should be able to:
1. Show that the slope of a line can be calculated as rise/run. Also explain why the slope is the same
between any two distinct points on the line.
2. Find the slope of a line from a graph, set of points, and table. Recognize when there is a slope of zero or
when the line is undefined.
3. Given a context, find slope from various starting points (2 points, table, line, equation).
4. Recognize that m in y=mx and y=mx+b represents the rate of change or slope of a line. Understand that
b is where the line crosses the y-axis or is the y-intercept.
5. Derive the equation y=mx and y=mx+b using dilations and proportionality.

8WB2 - 78
2014 University of Utah Middle School Math Project in partnership with the
Utah State Office of Education. Licensed under Creative Commons, cc-by.
2.3a Class Activity: Building Stairs and Ramps.
In the previous section you saw that a constant rate of change is an attribute of a linear relationship. When a
linear relationship is graphed on a line you call the constant rate of change of the line the slope of the line.
The following investigation will examine how slope is measured.
On properly built staircases all of the stairs have the same measurements. The important measurements on a
stair are what we call the rise and the run. When building a staircase these measurements are chosen carefully
to prevent the stairs from being too steep, and to get you to where you need to go.
One step from three different staircases has been given below.
Staircase #1 Staircase #2 Staircase #3
The vertical easure ent is the “rise”. The horizontal easure ent is the “run”.
1. State the rise and run for each staircase.
a. Staircase #1
rise = ____run = _____
b. Staircase #2
rise = ______run = ____
c. Staircase #3
rise = _____run = ____
2. Using the run and rise for each step, graph the height a person will be at after each step for the first 5
steps. Do this for each staircase.
The slope of a line describes how steep it is. It describes the change in y values compared to the
change in the x values.

8WB2 - 79
2014 University of Utah Middle School Math Project in partnership with the
Utah State Office of Education. Licensed under Creative Commons, cc-by.
3. Which staircase is the steepest? __________
Just like staircases, the measurement of the steepness of a line is also very important information. On the graph
on the previous page draw a connecting line from the origin(0,0) through the tip of each stair step.
Find the slope of each line representing a staircase using the ratio:
, and by simplifying this fraction.
4. Calculate the slope ratio for each staircase.
a. Staircase #1: ______ b. Staircase #2: ______ c. Staircase #3: ______
5. If you didn’t have the graph to look at, only the ratios you just calculated, how would you know which
staircase would be the steepest?
6. Calculate the slope for climbing 1, 2, & 3 steps on each of the staircases.
Staircase #1 Staircase #2 Staircase #3
Total
Rise
Total Run Slope
(rise/run)
Total
Rise
Total Run Slope
(rise/run)
Total
Rise
Total Run Slope
(rise/run)
1 step
2 steps
3 steps
7. Does the slope of the staircase change as you climb each step?
8. Using your knowledge of how slope is calculated, see if you can figure out the slope of the ramp found
at your school. Take measurements at two locations on the ramp. Use the table below to help you.
Rise Run Slope
1st
measurement
2nd
measurement

8WB2 - 80
2014 University of Utah Middle School Math Project in partnership with the
Utah State Office of Education. Licensed under Creative Commons, cc-by.
2.3a Homework: Measuring the Slope of Stairs and Ramps
1. Your task is to design a set of stairs and a wheelchair ramp at the side. Both the stairs and the ramp will
begin at the same place (at ground level) and end at the height of 3 feet. Answer the following questions
as you develop your design.
How many steps do you want or need?
How deep should each step be? Why do you want this run depth?
How tall will each step be? Why do you want this rise height?
What is the total distance (total depth for all steps) you will need (at the base) for all of the stairs—this
would be a measurement at ground level from stair/ramp start point to stair/ramp end point?
2. Sketch the ramp (as viewed from the side) on graph paper below. Label and sketch the base and height,
for example: Ramp-base (in inches or feet) and Height (in inches or feet).

8WB2 - 81
2014 University of Utah Middle School Math Project in partnership with the
Utah State Office of Education. Licensed under Creative Commons, cc-by.
3. From the sketch of the ramp, find and record the following measurements.
Rise height (total height
you’ve cli bed on the
ramp at this point)
Run depth (total distance – at
ground level – covered from
stair-base beginning)
Ratio rise
run
12 inches in from
the start of the ramp
24 inches in from
the start of the ramp
Where the ramp
meets the top
4. Sketch the stairs (as viewed from the side) on graph paper below. Label the sketch base and height, for
example: Stair-base (in inches) and Height (in inches).
From the sketch above, find and record the following measurements.
Rise height (total height
you’ve cli bed at this
point)
Run depth (total distance
covered from stair-base
beginning)
Ratio rise
run
Reduced
ratio
At the first
step
At the third
step
At the last
step

8WB2 - 82
2014 University of Utah Middle School Math Project in partnership with the
Utah State Office of Education. Licensed under Creative Commons, cc-by.
3
2
5. What do you notice about the Ratio column for both the ramp and the stairs?
6. On your stair drawing, draw a line from the origin (0,0) through the very tip of each stair. Now look at
your ramp drawing. What do you observe?
7. Explain what would happen to the slope of the line for your stairs if the rise of your stairs was higher or
lower?
8. Fill in the blanks
a. Slope =
b. In the picture below the rise is_________ units, and the run is________ units. Thus, the slope of
this line is_____.
9. Suppose you want to make a skateboard ramp that is not as steep as the one show below. Write down
two different slopes that you could use.
10. Find the slope of the waterslide. Calculate it in two different ways.
5 ft
3 ft

8WB2 - 83
2014 University of Utah Middle School Math Project in partnership with the
Utah State Office of Education. Licensed under Creative Commons, cc-by.
Extra Practice: Measure the Slope of a Hill
Instructions for measuring the grade of a hill or a road:
Rest the level (or clear bottle filled with water) on the ground. Lift up the lower end of the level/bottle (i.e, the
end nearest the bottom of the hill) until the level measures level. (If using a bottle, the water level in the bottle
should be parallel to the side of the bottle.)
While holding the level/bottle still in this position, measure the distance between the end of the level and the
ground using the ruler, as shown in the image below.
1. Calculate the grade by dividing the distance measured with the ruler (the "rise") by the length of the
level or straight edge (the "run") and multiplying by 100:
2. Roadway signs such as the one to the right are used to warn drivers of an upcoming steep down grade
that could lead to a dangerous situation. What is the grade, or slope, of the hill described on the sign?
(Hint: Change the percent to a decimal and then change the decimal to a fraction)

8WB2 - 84
2014 University of Utah Middle School Math Project in partnership with the
Utah State Office of Education. Licensed under Creative Commons, cc-by.
2.3b Class work: Dilations and Proportionality
When an object, such as a line, is moved in space it is called a transformation. A special type of transformation
is called a dilation. A dilation transforms an object in space from the center of dilation, usually the origin, by a
scale factor called r. The dilation moves every point on the object so that the point is r times away from the
center of dilation as it was originally. This means that the object is enlarged or reduced in size.
For example, if you dilate the set of points (0,0), (0,4),(3, 0), and (3,4) with a scale factor of 2 and the center of
dilation is at the origin (0,0) the distance of each point from the center will be 2 times as long as it was
originally. Algebraically this means that you multiply each point by 2.
( , ) (2 ,2 )x y x y
To confirm this, investigate this transformation below.
1.
a. Graph and connect the ordered pairs (0,0), (0,4),
(3, 0), and (3,4).
b. Find the length of each segment and dilate it by a
scale factor of two. Draw and label the new
lengths from the center of dilation (the origin) in a
different color on the coordinate plane above.
The original object is called the pre-image and the
transformed object is called the image.
c. Compare the size of the pre-image with the
image.
d. Dilate by a scale factor of 2 algebraically using
the ordered pairs. Algebraically this is written as
( , ) (2 ,2 )x y x y . Write the ordered pairs
below.
e. Graph and connect your new ordered pairs for the
image on the coordinate plane in part a.
f. What do you observe about the transformation
when you do it graphically and algebraically?
g. How do the lines that correspond to one another
in the image and pre-image compare?

8WB2 - 85
2014 University of Utah Middle School Math Project in partnership with the
Utah State Office of Education. Licensed under Creative Commons, cc-by.
A special notation is used to differentiate between the pre-image and the image. If the pre-image is called A
then the image is called A’, pronounced “A pri e”.
2. Try another shape to see what kind of relationship exists between the pre-image and the image.
a. Graph and connect the ordered pairs (0,0), (3,0),
and (3, 4).
b. Find the length of each segment and dilate it by a
scale factor of
. (The length of the hypotenuse is
5) Draw the new lengths from the center of
dilation (the origin) in a different color.
c. Labe the pre-i age A and the i age A’. Compare
the size of the pre-image with the image.
d. Dilate by a scale factor of
algebraically using
the ordered pairs. That it is1 1
( , ) ( , )2 2
x y x y .
Write the ordered pairs below.
e. Graph your new ordered pairs for the image.
f. What do you observe about the transformation
when you do it graphically and algebraically?
g. How do the lines that correspond to one another
in the image and pre-image compare?

8WB2 - 86
2014 University of Utah Middle School Math Project in partnership with the
Utah State Office of Education. Licensed under Creative Commons, cc-by.
Now that you know how a dilation works you will investigate what kind of relationship is formed between the
pre-image and the image after the dilation.
4. What do you notice about ' 'B C in relationship to BC ?
5. What do you notice about the size of the two triangles?
6. Write a ratio that compares the corresponding parts of the pre-image with the image.
7. What kind of relationship exists between the pre-image and image?
3. Using the figure below.
a. Connect point B to C
b. Double the length of AB on the line
AE . Label the new segment 'AB
c. Double the length of AC on the line
AD . Label the new segment 'AC .
d. Connect B’ to C’.
‘

8WB2 - 87
2014 University of Utah Middle School Math Project in partnership with the
Utah State Office of Education. Licensed under Creative Commons, cc-by.
2.3b Homework: Dilations and Proportionality
Continue your investigation of dilations and the relationships between the pre-image and image below.
1. Using the figure below:
a. Connect point B to C
b. Double the length of ABon the
line AE . Label the new segment
AB '
c. Double the length of ACon the
line AD . Label the new segment
AC ' .
d. Connect B’ to C’.
2. What do you notice about ' 'B C in
relationship to BC ?
3. What kind of relationship exists
between the pre-image and image?

8WB2 - 88
2014 University of Utah Middle School Math Project in partnership with the
Utah State Office of Education. Licensed under Creative Commons, cc-by.
4. Using the figure below:
a. Connect point B to C.
b. HALF the length of AB on the
line AE . Label the new segment
AB '.
c. HALF the length of AC on the
line AD . Label the new segment
'AC .
d. Connect B’ to C’.
5. What do you notice about ' 'B C in
relationship to BC ?
6. What kind of relationship exists
between the pre-image and image?

8WB2 - 89
2014 University of Utah Middle School Math Project in partnership with the
Utah State Office of Education. Licensed under Creative Commons, cc-by.
7. Using the figure below:
a. Connect point B to C.
b. HALF the length of AB on the
line AE . Label the new segment
AB '.
c. HALF the length of AC on the
line AD . Label the new segment
AC ' .
d. Connect B’ to C’.
8. What do you notice about ' 'B C in
relationship to BC ?
9. What kind of relationship exists
between the pre-image and image?

8WB2 - 90
2014 University of Utah Middle School Math Project in partnership with the
Utah State Office of Education. Licensed under Creative Commons, cc-by.
2.3c Class Activity: Proportional Triangles and Slope
1. On the line to the right choose any two points
that lie on the line. (To make your examination
easier choose two points that lie on an
intersection of the gridlines).
From the two points create a right triangle, the line
itself will be the hypotenuse and the legs will extend
from the two points and meet at a right angle. An
example is shown below.
Example:
2. Compare the points that you choose and your triangle with someone in your class. Discuss the
following;
Did you both chose the same points?
How are your triangles the same?
How are your triangles different?
What relationship exists between your triangles?
Given any two triangles with hypotenuse on the given line and legs horizontal and vertical, then there is a
dilation that takes one on the other. In particular, the lengths of corresponding sides are all multiplied by
the factor of the dilation, and so the ratio of the length of the vertical leg to the horizontal leg is the same
for both triangles.

8WB2 - 91
2014 University of Utah Middle School Math Project in partnership with the
Utah State Office of Education. Licensed under Creative Commons, cc-by.
The graphs given below have several different triangles formed from two points that lie on the line. These
triangles are dilations of one another and their corresponding parts are proportional. Answer the questions
below about these lines to observe what this tells us about slope.
In each graph below, how many right triangles do you see?
Trace each triangle you see with a different color.
For each triangle write a ratio comparing the lengths of its legs or height
base. Then simplify the ratio
height
base .
In the future we will refer to the ratio asrise
run, instead of
height
base.
3.
4.
5.
6.
7. Do the ratios (rise to run) always simplify to the same fraction (even quadrants with negative ordered
pairs)? Why or why not?
8. How does the “rise over run ratio” describe the steepness of the line?
_Ratios_
_Ratios_
_Ratios_
_Ratios_

8WB2 - 92
2014 University of Utah Middle School Math Project in partnership with the
Utah State Office of Education. Licensed under Creative Commons, cc-by.
9.
10.
11. Why do graphs 9 and 10 have the same ratio but they are different lines?
12. How could you differentiate between the slopes of these lines?
13. How does the rise related to the run of a negative slope affect the steepness of the line?
14.
15.
16. Are the ratios for graphs 14 and 15 positive or negative? How do you know?
17. Why are the slopes for graphs 14 and 15 the same if they are different lines?
_Ratios_
_Ratios_
_Ratios_
_Ratios_
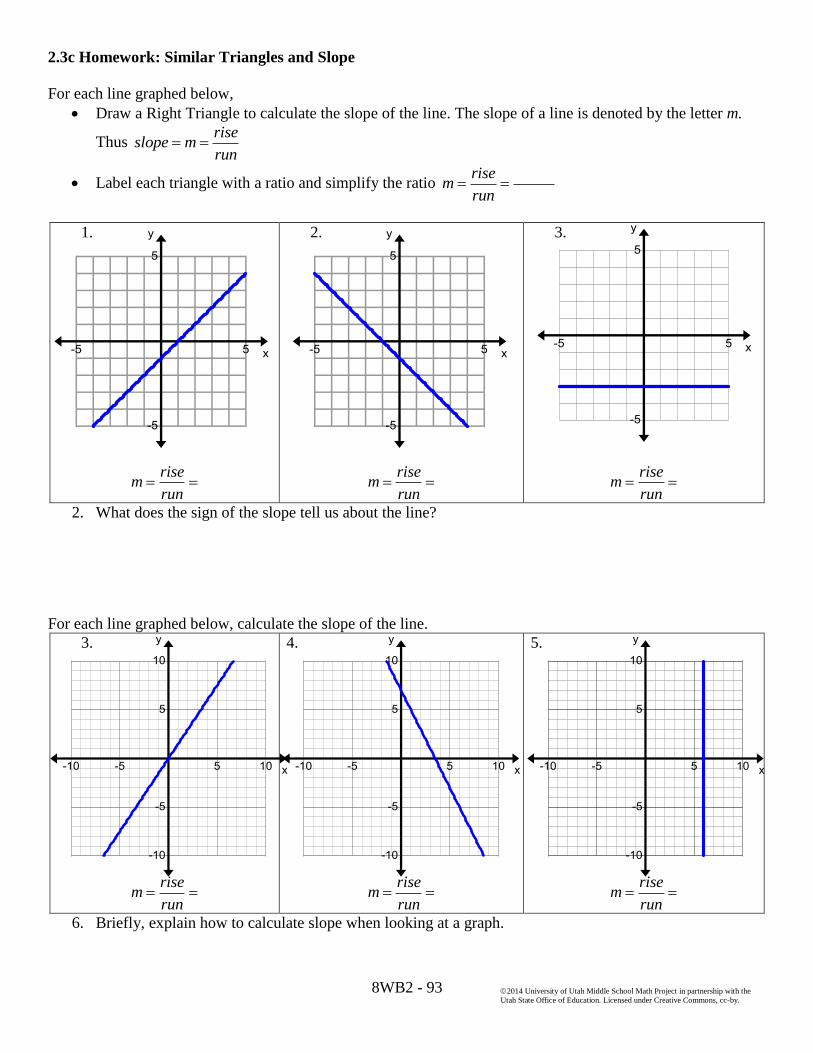
8WB2 - 93
2014 University of Utah Middle School Math Project in partnership with the
Utah State Office of Education. Licensed under Creative Commons, cc-by.
2.3c Homework: Similar Triangles and Slope
For each line graphed below,
Draw a Right Triangle to calculate the slope of the line. The slope of a line is denoted by the letter m.
Thus rise
slope mrun
Label each triangle with a ratio and simplify the ratio rise
mrun
1.
risem
run
2.
risem
run
3.
risem
run
2. What does the sign of the slope tell us about the line?
For each line graphed below, calculate the slope of the line.
3.
risem
run
4.
risem
run
5.
risem
run
6. Briefly, explain how to calculate slope when looking at a graph.

8WB2 - 94
2014 University of Utah Middle School Math Project in partnership with the
Utah State Office of Education. Licensed under Creative Commons, cc-by.
2.3d Class Activity: Finding Slope from Graphs
1. Do the graphs below have positive or negative slopes? How do you know?
a.
b. c. d.
Positive or negative?
e. Explain how you know whether a line of a graph has a positive or negative slope.
For each line graphed below,
Draw a right triangle to calculate the slope of the line.
Label each triangle with a ratio and simplify the ratio rise
mrun
2.
rise
run
3.
rise
run
For each line graphed below, calculate the slope of the line.
3.
rise
run
4.
rise
run

8WB2 - 95
2014 University of Utah Middle School Math Project in partnership with the
Utah State Office of Education. Licensed under Creative Commons, cc-by.
5.
m
6.
m
7.
m
8.
m
9.
m
10.
m

8WB2 - 96
2014 University of Utah Middle School Math Project in partnership with the
Utah State Office of Education. Licensed under Creative Commons, cc-by.
2.3d Homework: Finding Slope from Graphs
1. Do the graphs below have positive or negative slopes? How do you know?
1.
2. 3. 4.
Positive or negative?
5. Explain how you know whether a line of a graph has a positive or negative slope.
For each line graphed below,
Draw a right triangle to calculate the slope of the line.
Label each triangle with a ratio and simplify the ratio rise
mrun
2.
rise
run
3.
rise
run
For each line graphed below, calculate the slope of the line.
3.
rise
run
4.
rise
run

8WB2 - 97
2014 University of Utah Middle School Math Project in partnership with the
Utah State Office of Education. Licensed under Creative Commons, cc-by.
5.
m
6.
m
7.
m
8.
m
9.
m
10.
m

8WB2 - 98
2014 University of Utah Middle School Math Project in partnership with the
Utah State Office of Education. Licensed under Creative Commons, cc-by.
2.3e Class Activity: Finding Slope from Two Points
Calculate the slope of the following graphs:
1.
m
2.
m
Graph the following pairs of points. Use the graph to determine the slope.
3. points: (4, 3) and (0, 1)
m
4. points: (1, 4) and (-2, 6)
m
Find the rise and run and slope of each line shown below. You will have to think of a way to use the coordinate
points to find the rise and run.
5.
6.
7.
A(1,1)
B(3,3) C(1,2)
D(4,8)
E(1,-1)
F(2,2)
Rise_____ Run_____ m______
Rise_____ Run_____ m___
Rise______ Run_____ m________

8WB2 - 99
2014 University of Utah Middle School Math Project in partnership with the
Utah State Office of Education. Licensed under Creative Commons, cc-by.
14. Graphing points can be time-consuming. Develop a procedure for calculating the slope without graphing
each point. Explain your procedure below. Show that it works for problems 1-4 above.
Discuss and compare your method for calculating slope without using right triangles on a graph with someone
else.
15. Now discuss this formula: 2 1
2 1
y yslope m
x x
What does it mean? How does it work?
8.
9. 10.
11.
12. 13.
G(-3,2)
H(1,6) I(0,3)
J(4,-2) K(-3,-1)
L(-3,-4)
M(1,3)
N(-6,3)
P(2,2)
O(-4,0)
R(10,-2)
Q(-10,-8)
Rise_____ Run______ m________
Rise_____ Run_____ m________
Rise______ Run______ m_______
Rise______ Run______ m________
Rise______ Run______ m______
Rise______ Run______ m___
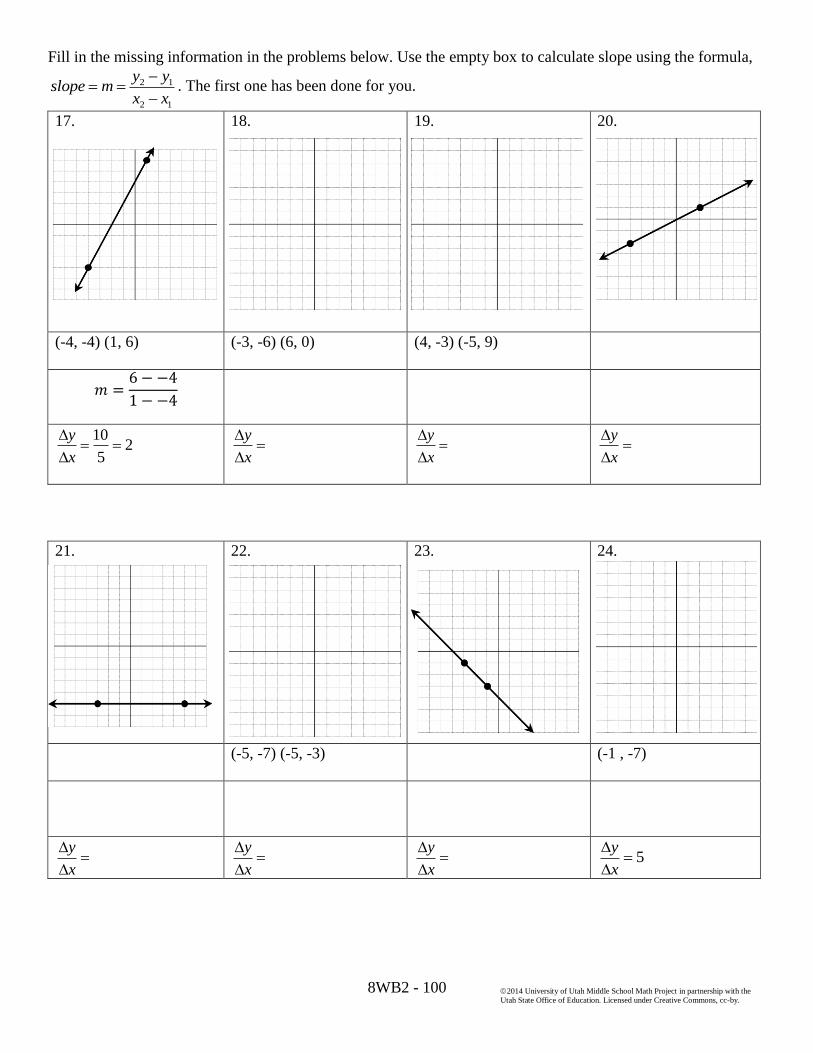
8WB2 - 100
2014 University of Utah Middle School Math Project in partnership with the
Utah State Office of Education. Licensed under Creative Commons, cc-by.
Fill in the missing information in the problems below. Use the empty box to calculate slope using the formula,
2 1
2 1
y yslope m
x x
. The first one has been done for you.
17.
18. 19. 20.
(-4, -4) (1, 6)
(-3, -6) (6, 0) (4, -3) (-5, 9)
102
5
y
x
y
x
y
x
y
x
21.
22. 23. 24.
(-5, -7) (-5, -3) (-1 , -7)
y
x
y
x
y
x
5
y
x

8WB2 - 101
2014 University of Utah Middle School Math Project in partnership with the
Utah State Office of Education. Licensed under Creative Commons, cc-by.
25.
26.
27.
28.
( -2, -7) (-1, -3) ( -7, 6) (6, -7)
y
x
y
x
y
x
y
x
29.
30. 31. 32.
(-6, 1)
(-1, 6) (-4, 6) ( 0, -2 )
y
x
y
x
3
2
y
x
3
4
y
x
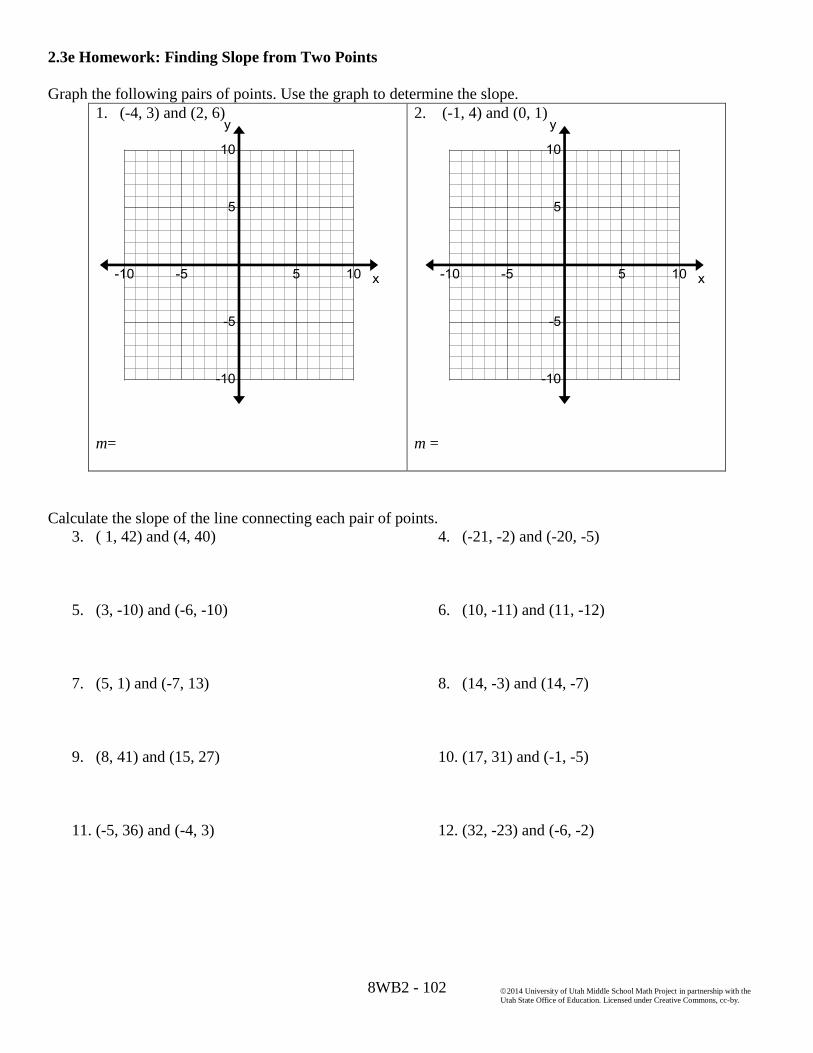
8WB2 - 102
2014 University of Utah Middle School Math Project in partnership with the
Utah State Office of Education. Licensed under Creative Commons, cc-by.
2.3e Homework: Finding Slope from Two Points
Graph the following pairs of points. Use the graph to determine the slope.
1. (-4, 3) and (2, 6)
m=
2. (-1, 4) and (0, 1)
m =
Calculate the slope of the line connecting each pair of points.
3. ( 1, 42) and (4, 40)
4. (-21, -2) and (-20, -5)
5. (3, -10) and (-6, -10)
6. (10, -11) and (11, -12)
7. (5, 1) and (-7, 13)
8. (14, -3) and (14, -7)
9. (8, 41) and (15, 27)
10. (17, 31) and (-1, -5)
11. (-5, 36) and (-4, 3)
12. (32, -23) and (-6, -2)

8WB2 - 103
2014 University of Utah Middle School Math Project in partnership with the
Utah State Office of Education. Licensed under Creative Commons, cc-by.
2.3f Class Activity: Practice Finding the Slope of a Line
Calculate the slope of the line on each graph.
a.
m =
b.
m=
For each pair of points,
Calculate the slope of the line passing through each pair.
Find one other point that lies on the line containing the given points.
3. (10, -6) and (-5, 4)
4. (7, 3) and (-3, 0)
5. (0, 4) and (1, 0)
6. (-5, 1) and (-5, -2)
Calculate the slope of the line that contains the points given in each table. Calculate the slope twice, one time by
using the Slope Formula with two points and the other time by finding the rate of change or unit rate in the
table.
7.
m=__________
m=__________
x y
3 4
4 5
5 6
6 7
8.
m=________
m=________
x y
0 4
1 9
2 14
3 19
9.
m=________
m=________
x y
0 9
3 12
6 15
9 18
10. m=_______
m=_______
x y
2 4
4 12
6 20
8 28
11. Why are the slopes the same no matter what two points you use to find the slope?

8WB2 - 104
2014 University of Utah Middle School Math Project in partnership with the
Utah State Office of Education. Licensed under Creative Commons, cc-by.
2.3f Homework: Practice Finding the Slope of a Line
Calculate the slope of the line on each graph.
1. m=
2. m=
3. m=
4. m=
5. m=
6. m=

8WB2 - 105
2014 University of Utah Middle School Math Project in partnership with the
Utah State Office of Education. Licensed under Creative Commons, cc-by.
Calculate the slope of the line passing through each pair of points.
7. (3, 9) and (4, 12)
8. (5, 15) and (6, 5)
9. (6, 9) and (18, 7)
10. (-8, -8) and (-1, -3)
For numbers 11 and 12;
Calculate the slope of the line passing through each pair
Find one other point that lies on the line containing the given points
11. (-6,-5) and (4,0)
12. (4,1) and (0,7)
Calculate the slope of the line that contains the points given in each table.
13.
x y
3 -9
5 -15
9 -27
14.
x y
8 1
6 3
2 7
-4 13
15.
x y
0 4
1 -5
2 -14
3 -23
16.
x y
10 1
8 1
-12 1
-14 1
17.
x y
-5 2
5 6
10 8
18. x y
-3 5
-3 10
-3 15
-3 20
19. Why doesn’t it atter which two points you use to find the slope?

8WB2 - 106
2014 University of Utah Middle School Math Project in partnership with the
Utah State Office of Education. Licensed under Creative Commons, cc-by.
2.3g Class Activity: Finding Slope from a Context
1. Gourmet jellybeans cost $9 for 2 pounds.
a. Complete the table.
Pounds .5 3 4 8 10 20
Total Cost $9 $27
b. Graph and label the relationship.
c. What is the slope of the line?
d. Write the slope of the line as a rate of change
that describes what the slope means in this
context.
e. Write an equation to find the cost for any
amount of jellybeans.
f. Why is the data graphed only in the first
quadrant?
2. Kaelynn takes the same amount of time to solve each of the equations on her math homework. She can
solve 10 equations in 8 minutes.
a. Complete the table.
Minutes 2 8 20
Equations Solved 5 15 30
b. Graph and label the relationship.
c. What is the slope of the line?
d. Write the slope of the line as a rate of change
that describes what the slope means in this
context.
e. Write an equation to find the number of
equations solved for any number of minutes.

8WB2 - 107
2014 University of Utah Middle School Math Project in partnership with the
Utah State Office of Education. Licensed under Creative Commons, cc-by.
3. Mr. Irving and Mrs. Hendrickson pay babysitters differently.
a. Examine the table. Describe the difference.
Hours Irving Hendrickson
0 $0 $4
1 $9 $12
3 $27 $28
5 $45 $44
b. Are both relationships proportional?
c. Graph and label the two pay rates (two
different lines).
d. What is the slope of each line?
Irving: Hendrickson:
e. Write each slope as a rate of change to
interpret its meaning?
Irving:
Hendrickson:
f. Explain the different y -intercepts.
g. Is one babysitting job better than the other?
Why or why not?
h. Write an equation for each situation.
Irving:
Hendrickson:

8WB2 - 108
2014 University of Utah Middle School Math Project in partnership with the
Utah State Office of Education. Licensed under Creative Commons, cc-by.
2.3g Homework: Finding Slope from a Context
1. The soccer tea is going out for hot dogs. Greg’s Grill is having a special on hot dogs: four hot dogs for
three dollars. Each hot dot costs the same amount of money.
a. Complete the table.
Hot Dogs 1 16 28 40
Total Cost $3 $9 $18
b. Label the graph axes and then graph the relationship.
c. What is the slope of the line?
d. Write a sentence with correct units that
describes what the slope means.
e. Write an equation to find the cost for any
amount of hot dogs.
2. The state fair costs $2 to get in plus $.50 per ticket to go on rides. Complete the following table,
showing the cost for getting into the fair with additional tickets for rides.
a. Complete the table.
Tickets 0 1 10 30
Total Expense 2 $4.50 $12 $20
b. Label the graph axes and then graph the
relationship.
c. What is the slope of the line?
d. Write a sentence that describes what the slope
of the line means.
e. Why does the line not pass through 0?
f. Write an equation to find the total expense at
the fair with any amount of tickets purchased.

8WB2 - 109
2014 University of Utah Middle School Math Project in partnership with the
Utah State Office of Education. Licensed under Creative Commons, cc-by.
3. Excellent Bakers and Delicious Delights bakeries charge differently for sandwiches for business
lunches.
a. Examine the table. Describe the difference.
b. Are both relationships proportional?
c. Find the rate of change for each
relationship.
Excellent:
Delicious :
Sandwich
Meals
Excellent
Bakers
Delicious
Delights
0 $0 $15
1 $20 $30
3 $60 $60
5 $100 $90
d. Graph the two pay rates (two different lines).
Label.
e. What is the slope of each line?
Excellent: Delicious:
f. What does the slope tell you about these two
situations?
g. Explain the different y intercepts.
h. Is one situation better than the other? Why or why not?
i. Write an equation for each situation.
Excellent Bakery _________________
Delicious Delights ________________

8WB2 - 110
2014 University of Utah Middle School Math Project in partnership with the
Utah State Office of Education. Licensed under Creative Commons, cc-by.
2.3h Class Activity: The Equation of a Linear Relationship
Throughout this chapter the components of a linear relationship have be investigated. A linear relationship is
defined by the constant rate of change that it possesses and it can be represented in many ways. In this lesson
the focus will be more on the equation that represents a linear equation.
The equation given below represents a linear relationship.
2 5y x
1. Graph this equation of this line by making a table of values that represent solutions to this equation.
(This if often called a T-chart).
2. Find the slope of this line?
3. Where do you see the slope in the equation?
Often the letter b is used to denote the y-intercept.
4. What is the y-intercept of this line?
b=
5. Where do you see the y-intercept in the equation?
x y
-1
0
1
2

8WB2 - 111
2014 University of Utah Middle School Math Project in partnership with the
Utah State Office of Education. Licensed under Creative Commons, cc-by.
For each of the equations given below, make a table of values to help you graph the line. Then identify the slope
and y-intercept. Circle the slope in your equation and put a star next to the y-intercept.
6. 5 2y x
x y
Slope(m): y-intercept(b):
7. 3 1y x
x y
Slope(m): y-intercept(b):
8. 4y x
x y
Slope(m): y-intercept(b):
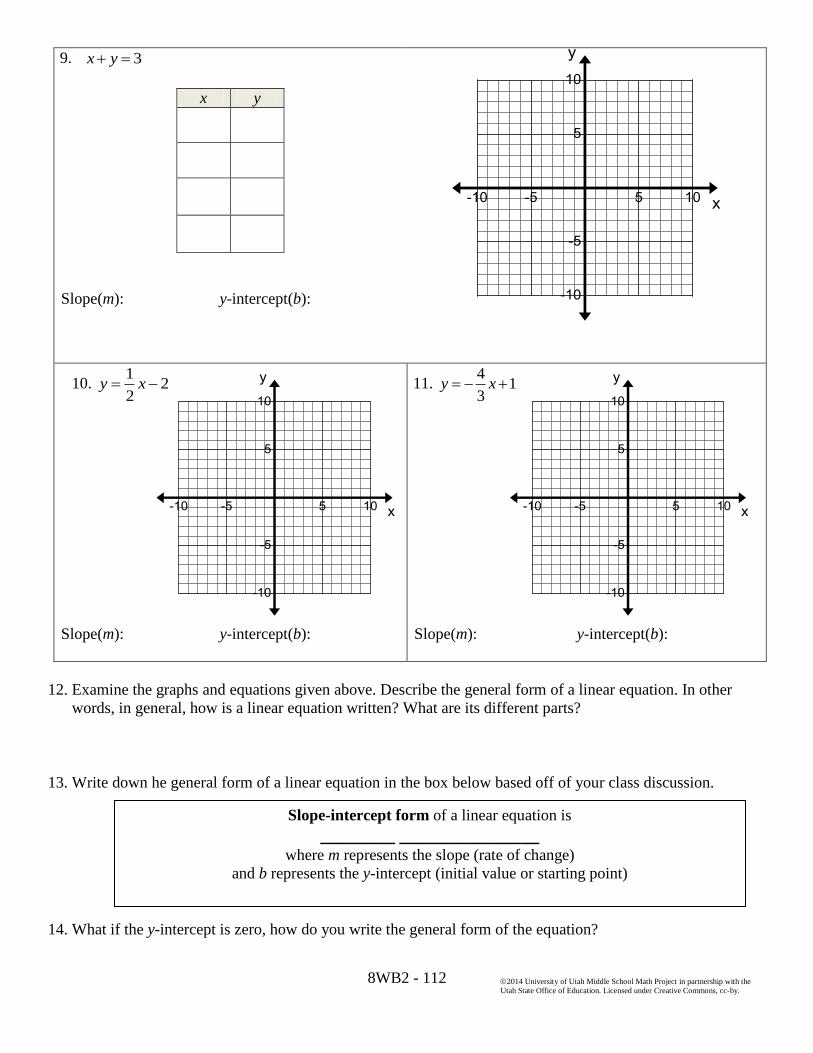
8WB2 - 112
2014 University of Utah Middle School Math Project in partnership with the
Utah State Office of Education. Licensed under Creative Commons, cc-by.
9. 3x y
x y
Slope(m): y-intercept(b):
10. 1
22
y x
Slope(m): y-intercept(b):
11. 4
13
y x
Slope(m): y-intercept(b):
12. Examine the graphs and equations given above. Describe the general form of a linear equation. In other
words, in general, how is a linear equation written? What are its different parts?
13. Write down he general form of a linear equation in the box below based off of your class discussion.
14. What if the y-intercept is zero, how do you write the general form of the equation?
Slope-intercept form of a linear equation is
________ _______________ where m represents the slope (rate of change)
and b represents the y-intercept (initial value or starting point)

8WB2 - 113
2014 University of Utah Middle School Math Project in partnership with the
Utah State Office of Education. Licensed under Creative Commons, cc-by.
2.3h Homework: The Equation of a Linear Relationship
For each of the equations given below, make a table of values to help you graph the line. Then identify the slope
and y-intercept. Circle the slope in your equation and put a star next to the y-intercept.
1. 3 3y x
x y
Slope(m): y-intercept(b):
2. 4y x
x y
Slope(m): y-intercept(b):
3. 5y x
x y
Slope(m): y-intercept(b):
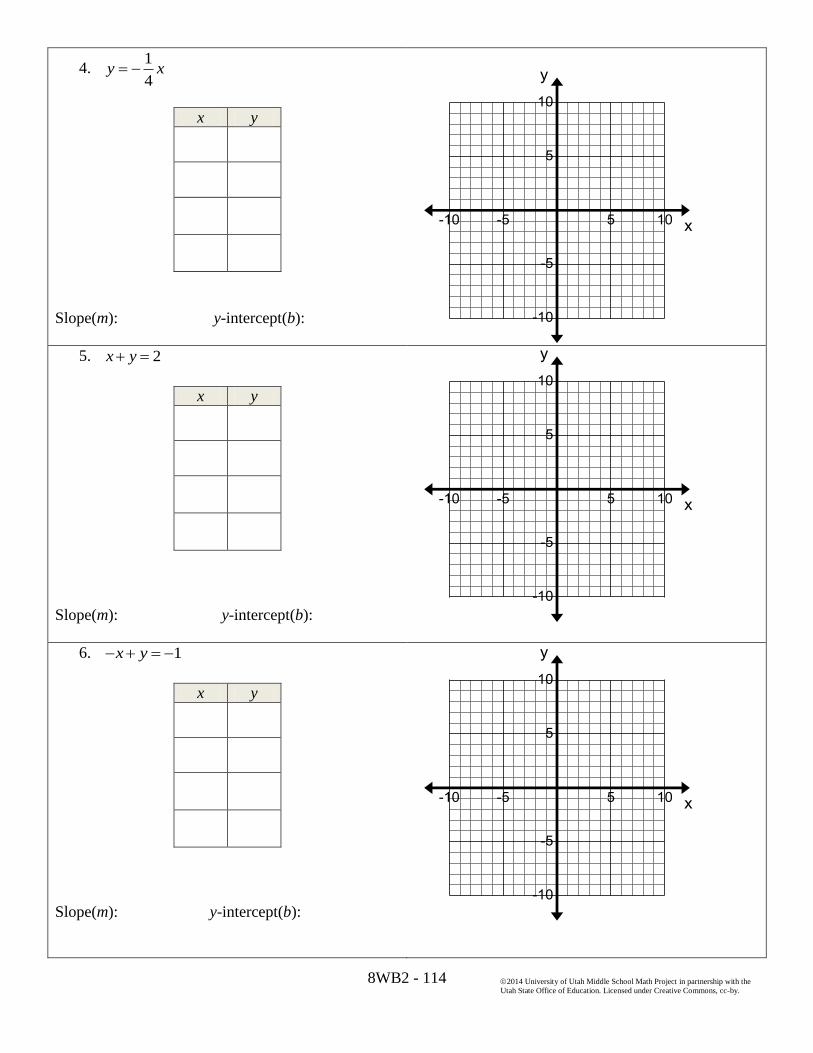
8WB2 - 114
2014 University of Utah Middle School Math Project in partnership with the
Utah State Office of Education. Licensed under Creative Commons, cc-by.
4. 1
4y x
x y
Slope(m): y-intercept(b):
5. 2x y
x y
Slope(m): y-intercept(b):
6. 1x y
x y
Slope(m): y-intercept(b):

8WB2 - 115
2014 University of Utah Middle School Math Project in partnership with the
Utah State Office of Education. Licensed under Creative Commons, cc-by.
7. 2 6y x
x y
Slope(m): y-intercept(b):
8. 4
23
y x
x y
Slope(m): y-intercept(b):
9. y x
x y
Slope(m): y-intercept(b):

8WB2 - 116
2014 University of Utah Middle School Math Project in partnership with the
Utah State Office of Education. Licensed under Creative Commons, cc-by.
2.3i Class Activity: Use Dilations and Proportionality to Derive the Equation
Up to this point you have been investigating how to describe many patterns and stories with a linear
relationship. You have begun to get a sense of how linear relationships are formed and described.
Write down what you know about linear relationships below.
Now write down what you know about linear proportional relationships below.
You are going to use the facts listed above to derive the equation y=mx using dilations. Begin by looking at the
example below.
1. Graph a line on the coordinate plane to the
right that goes through the origin and has a
slope of
. Label the rise and run on your
graph with a right triangle. Redraw and label
this triangle in the space provided below the
graph.
2. Does this line describe a proportional
relationship?
3. Choose any point (x,y) on your line and draw a
slope triangle that describes the rise and run.
Redraw and label this triangle in the space
provided below the graph.

8WB2 - 117
2014 University of Utah Middle School Math Project in partnership with the
Utah State Office of Education. Licensed under Creative Commons, cc-by.
4. Write a proportional statement with your ratios.
5. Solve the equation that you wrote above for y.
Now look at the general case for the form y=mx.
6. Graph a line on the coordinate plane to the
right that goes through the origin and has a
slope of m; remember that slope is the same
as a unit rate which compares your y-value
to an x value of 1. Label the rise and run on
your graph with a right triangle. Redraw and
label this triangle in the space provided below
the graph.
7. Does this line describe a proportional
relationship?
8. Choose any point (x,y) on your graph and draw
a slope triangle the describes that rise and run.
Redraw and label this triangle in the space
provided below the graph.
9. Write a proportional statement with your
ratios.
10. Solve the equation that you wrote above for y.
Notice that this is the equation y=mx that describes a proportional relationship.

8WB2 - 118
2014 University of Utah Middle School Math Project in partnership with the
Utah State Office of Education. Licensed under Creative Commons, cc-by.
11. Show that the equation for a line that goes through the origin and has a slope of
is
using
dilations and proportionality.

8WB2 - 119
2014 University of Utah Middle School Math Project in partnership with the
Utah State Office of Education. Licensed under Creative Commons, cc-by.
2.3i Homework: Use Dilations and Proportionality to Derive the Equation
1. Show that the equation for a line that goes through the origin and has a slope of
is
using
dilations and proportionality.
2. Show that the equation for a line that goes through the origin and has a slope of
is
using
dilations and proportionality.

8WB2 - 120
2014 University of Utah Middle School Math Project in partnership with the
Utah State Office of Education. Licensed under Creative Commons, cc-by.
2.3j Class Activity: Use Dilations and Proportionality to Derive the Equation
What about linear relationships that are not proportional? You are going to further investigate the general form
of a linear equation with a transformation. A geometric transformation can relate a linear proportional
relationship to a linear non-proportional relationship.
In previous sections we used the geometric transformation called a dilation. Another type of transformation is
called a translation. Shifting a line or moving all the points on the line the same distance and direction is a
transformation is a translation.
For example, if you transform the line 1
2y x upwards by 3 units, every ordered pair that lies on that line gets
moved up 3 units. Algebraically that means that you add 3 to every y value since this is a vertical shift.
( , ) ( , 3)x y x y
To confirm this, investigate this transformation below.
Consider the relation 1
2y x
1. Make a table of values for
this relation.
2. Graph the relation on the coordinate plane to
the right.
3. On the same coordinate plane translate every
point 3 units up and draw the new graph or the
image in a different color.
4. Using your table of values add 3 to every y
value. ( , ) ( , 3)x y x y
x y y+3
5. Graph your new ordered pairs.
x y
6. Write an equation for your image and compare it with your equation for the pre-image.

8WB2 - 121
2014 University of Utah Middle School Math Project in partnership with the
Utah State Office of Education. Licensed under Creative Commons, cc-by.
In section 2.3h you investigated the general form for a linear equation given below.
It is also seen in the example above. The equation
represents the linear relationship where the slope
is
and 3 is the y-intercept or initial value.
Use the information on the previous page to compare and contrast the two relations using the Venn Diagram
below. Be sure to list similarities and differences about their graphs and equations.
So how is this general form, y=mx+b, for a linear equation derived? Start with an example.
17. Graph a line on the coordinate plane to the
right that goes through the point (0,4) and has a
slope of
. Label the rise and run on your
graph with a right triangle. Redraw and label
this triangle in the space provided below the
graph.
18. Does this line describe a proportional
relationship? Explain.
19. Choose any point (x,y) on your graph and draw
a slope triangle the describes the rise and run.
Redraw and label this triangle in the space
provided below the graph.
13
2y x
1
2y x
The general form of a linear equation is y=mx+b where m is the slope or rate of change
and b is the initial value or y-intercept.

8WB2 - 122
2014 University of Utah Middle School Math Project in partnership with the
Utah State Office of Education. Licensed under Creative Commons, cc-by.
20. Write a proportional statement with your ratios.
21. Solve the equation that you wrote above for y.
Now look at the general case for the form
22. Graph a line on the coordinate plane to the
right that goes through any point on the y-
axis(call the y-intercept b) and has a slope of
m. Label the rise and run on your graph with a
right triangle. Redraw and label this triangle in
the space provided below the graph.
23. Does this line describe a proportional
relationship? Explain.
24. Choose any point on your graph and
draw a slope triangle that describes the rise and
run. Redraw and label this triangle in the space
provided below the graph.
25. Write a proportional statement with your slope ratios.
26. Solve the equation that you wrote above for y.
Notice that this is the general form of a linear equation. This form is called Slope-Intercept form.
Slope-Intercept form of a linear equation is
where m represents the slope (rate of change)
and b represents the y-intercept (initial value or starting point)
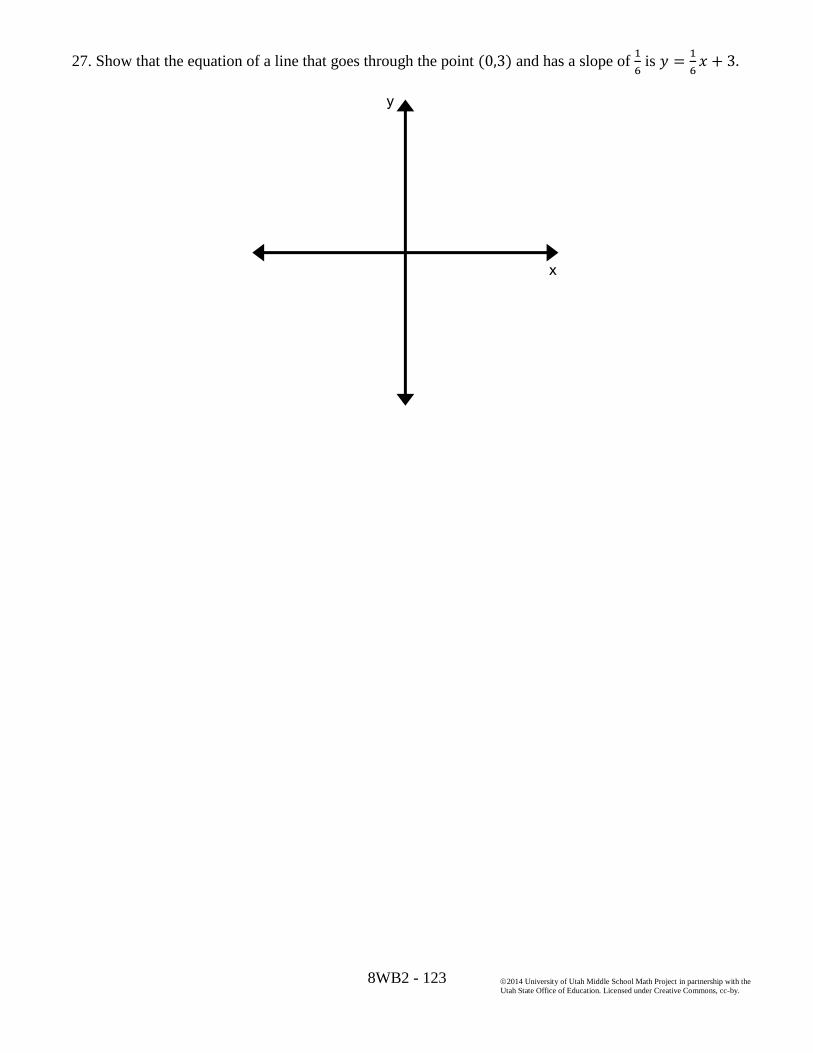
8WB2 - 123
2014 University of Utah Middle School Math Project in partnership with the
Utah State Office of Education. Licensed under Creative Commons, cc-by.
27. Show that the equation of a line that goes through the point and has a slope of
is

8WB2 - 124
2014 University of Utah Middle School Math Project in partnership with the
Utah State Office of Education. Licensed under Creative Commons, cc-by.
2.3j Homework: Use Similar Triangles to Derive the Equation
1. Show that the equation of a line that goes through the point (0, -2) and has a slope of
is
2. Show that the equation of a line that goes through the point (0,4) and has a slope of -2 is

8WB2 - 125
2014 University of Utah Middle School Math Project in partnership with the
Utah State Office of Education. Licensed under Creative Commons, cc-by.
2.3k Self-Assessment: Section 2.3
Consider the following skills/concepts. Rate your comfort level with each skill/concept by checking the box that
best describes your progress in mastering each skill/concept. Sample problems are provided on the next page
that match each skill/concept
Skill/Concept
Minimal
Understanding
1
Partial
Understanding
2
Sufficient
Understanding
3
Substantial
Understanding
4
1. Show that the slope of a
line can be calculated as
rise/run. Also explain
why the slope is the same
between any two distinct
points on the line.
See sample problem #1
I can find the
slope of the line
but do not know
how I did it.
I can find the
slope of the line
by finding the rise
and run but do not
know how to
show how you
can find the slope
between any two
points on the line.
I can find the
slope of the line
by finding the
rise and run. I
can explain how
to find the slope
using any two
points that lie on
gridlines.
I can find the
slope of the line
by finding the
rise and run and
show or explain
why the slope
can be found
from any two
points that fall
on the line.
2. Find the slope of a line
from a graph, set of
points, and table.
Recognize when there is
a slope of zero or when
the slope of the line is
undefined.
See sample problem #2
I can find the slope
of the line from one
of the three
representations.
I can find slope of
the line from two of
the three
representations.
I can find the
slope of the line
from the graph,
points, and table
but I did not
simplify all of
my answers.
I can accurately
find the slope of
the line from the
graph, points,
and table. I can
also express my
answers in
simplest form.
3. Given a context, find
slope from various
starting points (2 points,
table, line, equation).
See sample problem #3
I can only find the
slope of the line
from one of the
starting points. I
don’t know what
the slope means
given then
context.
I can find the
slope of the line
from some of the
starting points but
I don’t know
what the slope
means given the
context.
I can find the
slope of a line
from any starting
point but I don’t
know what the
slope means in
the given
context.
I can find the
slope of the
linear
relationship from
any starting
point and
interpret what it
means given the
context.
4. Recognize that m in
and
represents
the rate of change or
slope of a line.
Understand that b is
where the line crosses the
y-axis or is the y-
intercept.
See sample problem #4
I do not know
how to find the
slope and y-
intercept given in
the equation.
I can identify the
y-intercept but not
the slope in this
equation.
I can identify the
slope but not the
y-intercept in the
equation.
I can identify the
slope and y-
intercept in the
equation.

8WB2 - 126
2014 University of Utah Middle School Math Project in partnership with the
Utah State Office of Education. Licensed under Creative Commons, cc-by.
Sample Problem #1
Find the slope of the line given below by finding the rise and run. Also show or explain why the slope can be
found from any two points that fall on the line.
Skill/Concept
Minimal
Understanding
1
Partial
Understanding
2
Sufficient
Understanding
3
Substantial
Understanding
4
5. Derive the equation
and
using dilations and
proportionality.
See sample problem #5
I can show the y-
intercept and
slope for both
equations but I
don’t know how
they relate to
dilations of
triangles or
proportions.
I can derive only
one of the
equations using
similar triangles.
I can accurately
go through the
steps of deriving
both of the
equations of the
line using similar
triangles and
proportionality.
I can accurately
go through the
steps of deriving
both of the
equations of the
line using
dilations of
triangles and
proportionality.
I can explain the
reasoning at each
step in my own
words.

8WB2 - 127
2014 University of Utah Middle School Math Project in partnership with the
Utah State Office of Education. Licensed under Creative Commons, cc-by.
Sample Problem #2 Find the slope of each line given in the graph, set of points and table below.
a.
b. Find the slope of the line that goes through
the points (-2,2), (6,-10).
c. Find the slope of the line that goes through
the points in the table given below.
x y
4 -8
6 -8
8 -8

8WB2 - 128
2014 University of Utah Middle School Math Project in partnership with the
Utah State Office of Education. Licensed under Creative Commons, cc-by.
Sample Problem #3 Find the slope of the line from each context given below.
a. The cost to fix a car at Bubba’s Body Shop is shown in the table below. What is the slope of
this linear relationship, be sure to explain what is
means given the context.
Total Cost
t (time in
hours)
C (cost in
dollars)
0 0
1 25
2 50
3 75
b. The graph given below describes the height over
time of a Norfolk Pine that is planted in Rudy’s
backyard. Find and describe the slope of this
relationship as related to the context.
c. The equation y=2x+10 describes the monthly
cost to rent a movie at the local video kiosk,
where x represents the number of movies rented
and y represents the total cost. Find and describe
the slope of this relationship.
d. The points (1, 16) (4, 15) describe the height of a
lit candle that is burning at two different times of
day. Here x represents the number of hours it has
been burning and y-represents the candle’s
height in inches. Find the slope of this
relationship and describe what it means given the
context.
Sample Problem #4
Slope(m): y-intercept(b):
For the equation given below identify and the rate of change or slope and the y-intercept.
15
3y x
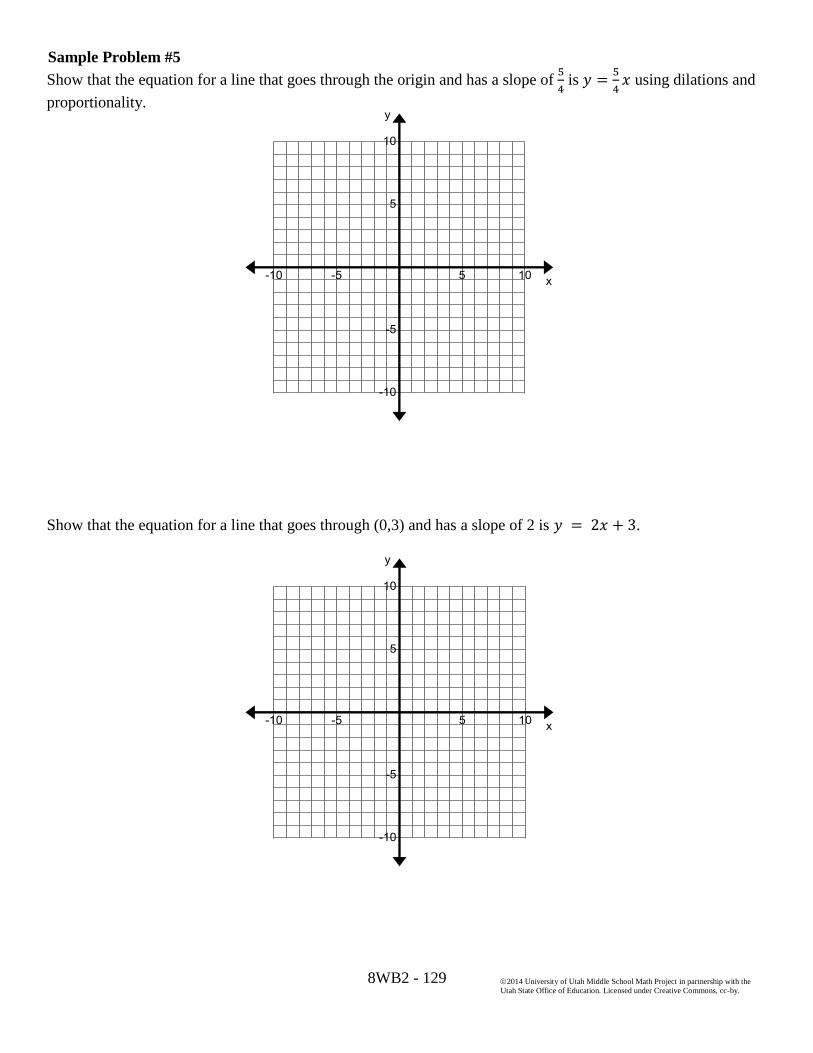
8WB2 - 129
2014 University of Utah Middle School Math Project in partnership with the
Utah State Office of Education. Licensed under Creative Commons, cc-by.
Sample Problem #5
Show that the equation for a line that goes through the origin and has a slope of
is
using dilations and
proportionality.
Show that the equation for a line that goes through (0,3) and has a slope of 2 is .