Embed Size (px)
Citation preview
First principles phase diagram calculations for the wurtzite-structurequasibinary systems SiC-AlN, SiC-GaN and SiC-InN
B. P. Burton,1,a) Steve Demers,2,b) and A. van de Walle2,c)
1Materials Measurement Laboratory, Metallurgy Division, National Institute of Standards and Technology(NIST), Gaithersburg, Maryland 20899, USA2Engineering and Applied Science Division, California Institute of Technology, 1200 E. California Blvd., MC309-81 Pasadena, California 91125, USA
(Received 2 November 2010; accepted 17 May 2011; published online 20 July 2011)
The cluster-expansion method was used to perform first principles phase diagram calculations for the
wurtzite-structure quasibinary systems (SiC)1�X(AlN)X, (SiC)1�X (GaN)X and (SiC)1�X(InN)X; and to
model variations of band gaps as functions of bulk compositions and temperature. In SiC-AlN, plane
wave pseudopotential formation-energy calculations predict low-energy metastable states with
formation energies, DEf . 0.004 eV/mole (mol¼ one cationþ one anion). The crystal structures of
these states are all of the form (SiC)m(AlN)n(SiC)o(AlN)p … (m,n,o,p integers), where (SiC)m
indicates m SiC-diatomic-layers ? to the hexagonal c-axis (cHex) and similarly for (AlN)n, (SiC)o and
(AlN)p. The presence of low-energy layer-structure metastable states helps to explain why one can
synthesize (SiC)1�X(AlN)X films, or single crystals with any value of X, in spite of the apparently
strong tendency toward immiscibility. In SiC-GaN, ordered structures are predicted at X¼ 1/4, 1/2,
and 3/4 (Pm, Pmn21 and Pm, respectively). In SiC-InN, one Cmc21 ordered phase is predicted at
X¼ 1/2. VC 2011 American Institute of Physics. [doi:10.1063/1.3602149]
I. INTRODUCTION
As discussed by Gu et al. and others,1–4 the wurtzite-
structure (2H, B4-Strukturbericht, space group P63mc)
(SiC)1�X(AlN)X quasibinary5 system is particularly interest-
ing for bandgap engineering because gaps vary from a 2.9
eV indirect gap in SiC to a 6.2 eV direct gap in AlN (Ref. 6);
and similarly for (SiC)1�X(GaN)X (3.5 eV direct)7 and
(SiC)1�X(lnN)X(1.89 eV direct).8 There is a dearth of litera-
ture on the SiC-GaN and SiC-lnN solid solutions, but all
three systems were studied to investigate the chemical sys-
tematics of ordering, and because SiC-AlN may be used as a
substrate for GaN (Ref. 9).
The “tentative” SiC-AlN experimental phase diagram of
Zangvil and Ruh10 is dominated by a wurtzite-structure solid
solution above T � 2300 K and a miscibility gap below.10,11
In spite of an apparently strong tendency for immiscibility it
is possible to synthesize wurtzite-structure solid solutions
(SiC)1�X(AlN)X as thin films or single crystals of arbitrary
bulk composition, X (Refs. 1, 2 and 9).
The first principles (FP) supercell total energy calcula-
tions and first principles phase diagram (FPPD) calculations
presented here suggest a plausible explanation for the relative
ease with which homogeneous solid solutions and single crys-
tals are synthesized. Specifically, all the (SiC)m(AlN)n …
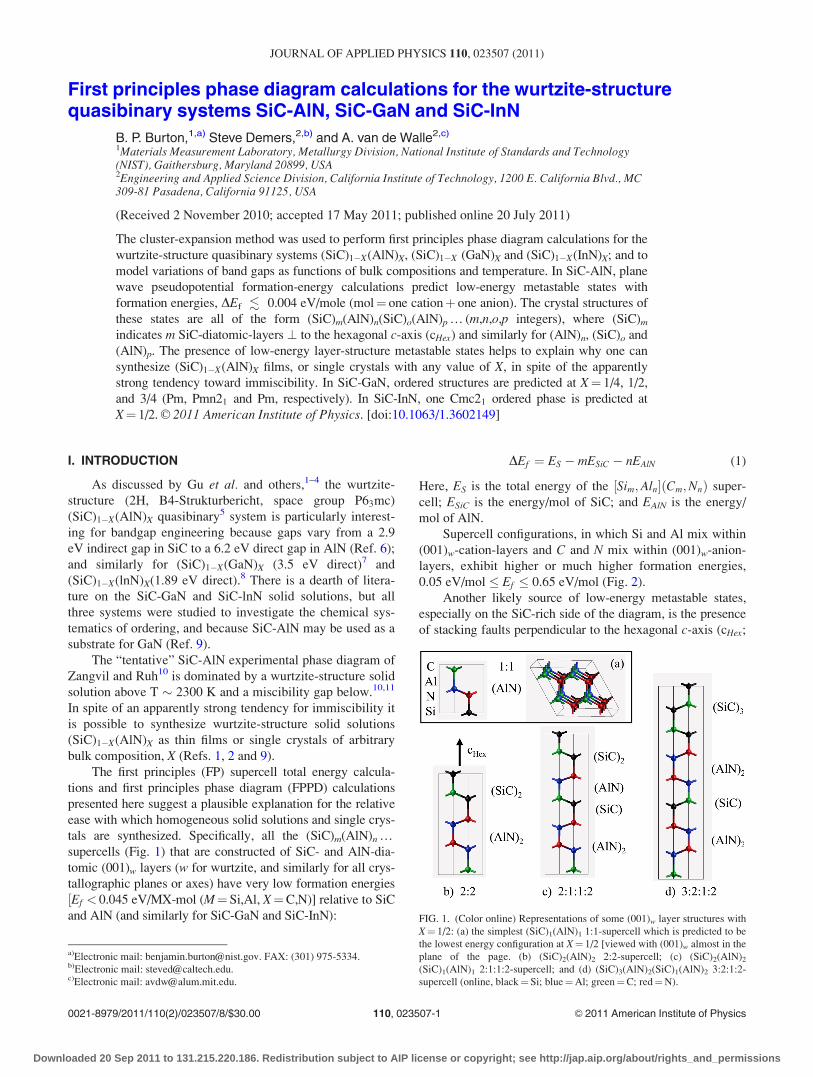
supercells (Fig. 1) that are constructed of SiC- and AlN-dia-
tomic (001)w layers (w for wurtzite, and similarly for all crys-
tallographic planes or axes) have very low formation energies
½Ef < 0.045 eV/MX-mol (M¼ Si,Al, X¼C,N)] relative to SiC
and AlN (and similarly for SiC-GaN and SiC-InN):
DEf ¼ ES � mESiC � nEAlN (1)
Here, ES is the total energy of the ½Sim;Aln�ðCm;NnÞ super-
cell; ESiC is the energy/mol of SiC; and EAlN is the energy/
mol of AlN.
Supercell configurations, in which Si and Al mix within
(001)w-cation-layers and C and N mix within (001)w-anion-
layers, exhibit higher or much higher formation energies,
0.05 eV/mol � Ef � 0.65 eV/mol (Fig. 2).
Another likely source of low-energy metastable states,
especially on the SiC-rich side of the diagram, is the presence
of stacking faults perpendicular to the hexagonal c-axis (cHex;
FIG. 1. (Color online) Representations of some (001)w layer structures with
X¼ 1/2: (a) the simplest (SiC)1(AlN)1 1:1-supercell which is predicted to be
the lowest energy configuration at X¼ 1/2 [viewed with (001)w almost in the
plane of the page. (b) (SiC)2(AlN)2 2:2-supercell; (c) (SiC)2(AlN)2
(SiC)1(AlN)1 2:1:1:2-supercell; and (d) (SiC)3(AlN)2(SiC)1(AlN)2 3:2:1:2-
supercell (online, black¼Si; blue¼Al; green¼C; red¼N).
a)Electronic mail: [email protected]. FAX: (301) 975-5334.b)Electronic mail: [email protected])Electronic mail: [email protected].
0021-8979/2011/110(2)/023507/8/$30.00 VC 2011 American Institute of Physics110, 023507-1
JOURNAL OF APPLIED PHYSICS 110, 023507 (2011)
Downloaded 20 Sep 2011 to 131.215.220.186. Redistribution subject to AIP license or copyright; see http://jap.aip.org/about/rights_and_permissions
h001ix) that create sphalerite-type ABC … stacking rather
than wurtzite type ABAB. stacking (sphalerite¼ zincblend,
3C, B3-Strukturbericht, space group F43m).12 However, a
treatment that compares sphalerite- and wurtzite-structure sol-
utions is beyond the scope of this study.
Results for the S-C-GaN and SiC-InN systems evince no
obvious chemically-systematic trends. Three ground-state
phases are predicted in SiC-GaN (at X¼ 1/4, 1/2 and 3/4),
and only one in SiC-InN (at X¼ 1/2).
II. COMPUTATIONAL METHODOLOGY
A. Formation energy calculations
Formation energies, DEf (Fig. 2) were calculated for fully
relaxed wurtzite-structure SiC, AlN and 175 ordered
½Sim;Aln�ðCm;NnÞ supercells; where square brackets and
parentheses, respectively, indicate that Si and Al (Ga, In) mix
on one set of [cation] sites, while C and N mix on a mutually
exclusive set of (anion) sites; and similarly for GaN plus 117
½Sim;Gan�ðCm;NnÞ supercells; and InN plus 85 ½Sim; Inn�ðCm;NnÞ supercells.
All total energy calculations were performed with the
Vienna ab initio simulation program [VASP, version 445
(Refs. 13–15)] using all electron projector augmented wave
(PAW) pseudopotentials, with the generalized gradient
approximation (GGA) for exchange and correlation energies;
specifically, the Si, Al, Gad, Ind , Cs and Nh PAW potentials.
Electronic degrees of freedom were optimized with a conju-
gate gradient algorithm. Both cell constants and ionic posi-
tions were fully relaxed for each structure.
Total energy calculations were converged with respect
to k-point meshes by using the equivalent of 6 6 4, or greater,
for a four-atom (two mol) wurtzite-structure cell. A 900 eV
energy cutoff was used, in the “high precision” option which
guarantees that absolute energies are converged to within a
few meV/mol: a few tenths of a kJ/mol of exchangeable
atoms [Si exchangeable with Al] and (C with N); one
mol¼MX (M¼Si, Al, Ga or In; X¼C, N). Residual forces
were typically of the order of 0.02 eV or less.
B. SiC-AlN
Calculated formation energies, DEf , for SiC, AlN
and 175 ½Sim;Aln�ðCm;NnÞ supercells are plotted in Fig. 2
ð�Þ, where values for DEf are normalized per MX-mol of
exchangeable ions.
C. The cluster expansion hamiltonian
The cluster expansion (CE),16 is a compact representa-
tion of the configurational total energy. In a two-component
A-B alloy, the solid solution configuration is described by
pseudospin occupation variables ri, which take values
ri ¼ �1 when site-i is occupied by atom-A and ri ¼ þ1
when site-i is occupied by atom-B. Extensions to higher-
order systems such as the four component (SiC)1�X(AlN)X
system, are described by Sanchez et al.;16 as well as some
examples of applications described in Refs. 17–20.
The CE parameterizes the configurational energy, per
exchangeable cation, as a polynomial in pseudospin occupa-
tion variables:
EðrÞ ¼X‘
m‘J‘Yi2‘0
ri
* +(2)
Cluster ‘ is defined as a set of lattice sites. The sum is taken
overall clusters ‘ that are not symmetrically equivalent in the
high-T structure space group, and the average is taken over-
all clusters ‘0 that are symmetrically equivalent to ‘. Coeffi-
cients J‘ are called effective cluster interactions, ECI, and
the multiplicity of a cluster, m‘, is the number of symmetri-
cally equivalent clusters, divided by the number of cation
sites. The ECI are obtained by fitting a set of VASP FP
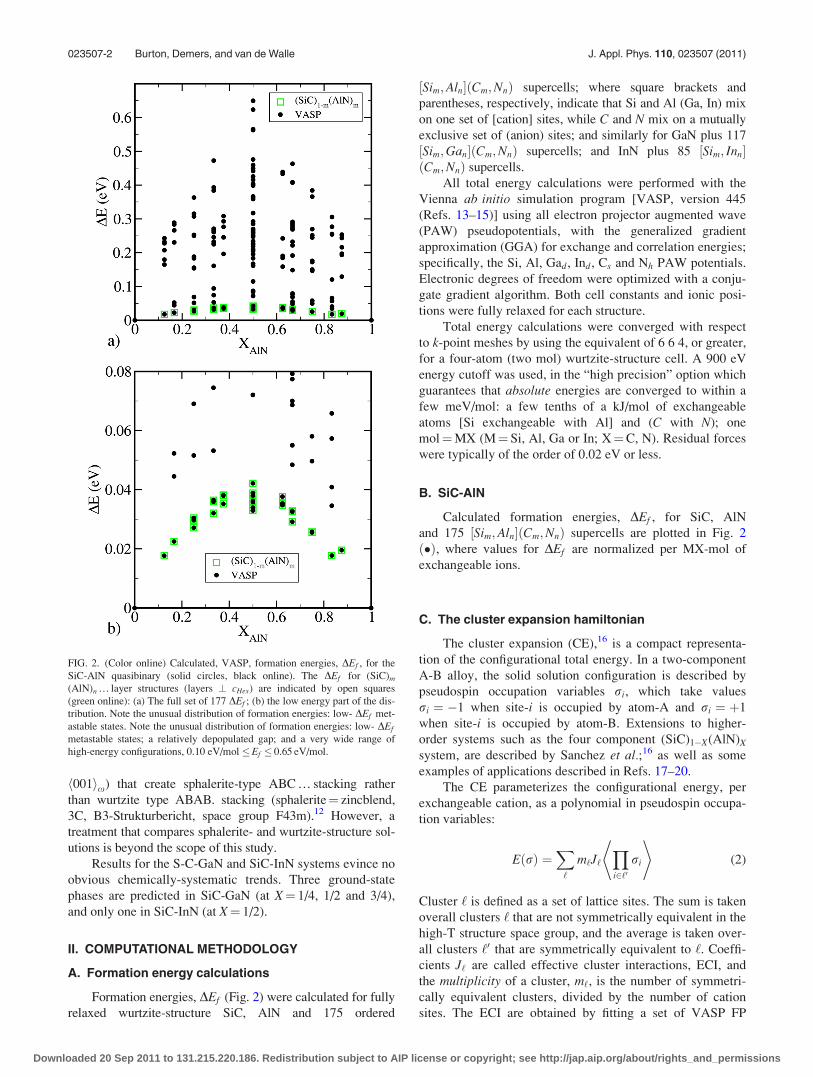
FIG. 2. (Color online) Calculated, VASP, formation energies, DEf , for the
SiC-AlN quasibinary (solid circles, black online). The DEf for (SiC)m
(AlN)n … layer structures (layers ? cHex) are indicated by open squares
(green online): (a) The full set of 177 DEf ; (b) the low energy part of the dis-
tribution. Note the unusual distribution of formation energies: low- DEf met-
astable states. Note the unusual distribution of formation energies: low- DEf
metastable states; a relatively depopulated gap; and a very wide range of
high-energy configurations, 0.10 eV/mol �Ef � 0.65 eV/mol.
023507-2 Burton, Demers, and van de Walle J. Appl. Phys. 110, 023507 (2011)
Downloaded 20 Sep 2011 to 131.215.220.186. Redistribution subject to AIP license or copyright; see http://jap.aip.org/about/rights_and_permissions
calculated structure energies, fEStrg. The resulting CE can
be improved as necessary by increasing the number of clus-
ters ‘ and/or the number of EStr used in the fit.
Fitting was performed with the Alloy Theoretic Auto-
mated Toolkit (ATAT)15,21–23 which automates most of the
tasks associated with the construction of a CE Hamiltonian.
A complete description of the algorithms underlying the
code can be found in Ref. 22. The most important steps are:
(1) Selecting which first principles (FP) structure energies to
calculate, which is done in a way that minimizes the statisti-
cal variance of the estimated ECI; (2) Automatically select-
ing which clusters to include in the expansion by minimizing
the cross-validation score, CV:
ðCVÞ2 ¼ 1
N
XN
Str¼1
ðEStr � EStrÞ2 (3)
where E1;… EN denote the structural energies calculated
from FP and EStr is the energy of structure Str predictedfrom a CE that was fit to the remaining N – 1 energies. This
criterion ensures that the chosen set of clusters maximizes
the predictive power of the CE for any structure, whether or
not it is included in the fit. This is an improvement relative
to the standard mean square error criterion which only mini-
mizes the error for structures that are included in the fit.
Although as noted in point (1) above, the maps code auto-
matically selects structures for which the EStr are calculated,
but it also has a bias in favor of smaller supercells to minimize
computation time. Thus, the largest supercells it generated had
eight atoms. The lowest energy states among maps-generated
cells were all (SiC)m(AlN)n … layer structures in which the
SiC- and AlN-double-layers are ? cHex. Formation energies
for these structures were typically DEf <0.04 eV/mol (7 kJ/
mol) [Figs. 2(a) and 2(b)]. To test the generality of this obser-
vation, 27 additional (SiC)m(AlN)n … -calculations were per-
formed. These are structures in which Si-C and Al-N bonds
are maximized, and DEf < 0.04 eV/mol holds for the whole
set [(open squares, green online, Fig. 2(b)]. For this set, {DEf }
describe an approximate parabola which strongly suggests that
no intermediate ordered phases are stable. Also, 11 (AlC)max
(SiN)max structure energies were calculated; i.e., 12-atom/cell
layer structures in which Al-C and Si-N nearest neighbor
bonds are maximized. For this subset, 0.15 eV/mol <DEf
<0.6 eV/mol (30 kJ/mol <DEf <125 kJ/mol).
D. Cluster expansion of band gaps
To model band-gaps in disordered solid solutions, band-
gap-cluster-expansions, CEGap, were fit to hybrid func-
tional24 band-gap calculations for all the same structures
(virtual compounds) that were used to calculate phase dia-
grams. Typically, GGA greatly underpredicts semiconductor
band gaps. Therefore, band gaps were calculated with hybrid
density functionals, in which a specific amount of exact,
non-local hartree fock (HF) exchange energy is mixed into
the semi-local GGA portion.24 This reduces the “self-interac-
tion error” by more realistically modeling electron localiza-
tion, and yields a more accurate bandgap. The Heyd et al.(HSE)24 functional, was used because it is highly efficient,
owing to its separation of the exact HF-exchange into short-
and long-range parts (via a ‘screening length’ parameter);
where the slowly decaying long-range exchange interactions
are replaced with their GGA counterparts.24 Specifically, the
HSE06 functional, which uses 25% HF-exchange mixing
and a screening length of 0.2 A�1,25 was used because this
approximation yields good agreement with experiment for a
wide range of semiconductors.25
The HSE06 functional was used to calculate band gaps
for all the structures that were used to fit the CE Hamilto-
nians for phase diagram calculations; the CEGap were then
used to calculate band gaps for disordered solid solutions as
functions of bulk composition and temperature.
In the systems studied here, the electronic structures of
virtual compounds exhibit wide variability (including many
near-zero bandgaps), which makes it difficult to fit a CEGap
that works well for all configurational states. Most of this
variability, however, is concentrated in the high-energy
structures which are rarely sampled at thermal equilibrium.
Therefore, high-energy structures were excluded (i.e., DEstr
> 0.11 eV, for SiC-AlN and SiC-GaN; and DEstr > 0.14 eV
for SiC-InN). In addition, a few of the remaining structures
with band gaps less than 0.1 eV were also excluded. For
SiC-InN, SiC-rich structures are also excluded, because the
system exhibits a wide miscibility gap in that region.
To ensure that end member band gaps (i.e., gaps for
SiC, AlN, GaN and InN) are accurately reproduced, they are
assigned increased weight in the fit (five instead of one). The
CEGap are optimized with a CV criterion and contain six
pairs (for SiC-AlN), 13 pairs (for SiC-GaN) and seven pairs
(for SiC-InN). Multibody terms did not yield improved pre-
dictive power. The resulting optimal CEGap expansions ex-
hibit CV-scores of 0.21 eV (for SiC-AlN), 0.32 eV (for SiC-
GaN) and 0.37 eV (for SiC-InN). These CEGap are used, with
the correlations obtained from Monte Carlo simulations, to
predict band gaps of solid solutions that fully account for the
effects of potential short-range order. Figures 4(a)–4(c) show
the predicted band gaps for the solid solutions as functions
of temperature, plus the band gaps of some perfectly ordered
phases (circles) and random solid solutions (T ¼ 1), for
comparison. Note, that the inclusion of short-range-order
effects (i.e., T<1) has little effect in the system SiC-AlN,
but dramatically changes results in SiC-GaN and SiC-InN.
Also, in SiC-GaN, the bandgap of the solid solution
approaches the gaps of ordered GS phases when short-range-
order effects are included.
III. RESULTS
A. Ground-state analyses
1. SiC-AlN
In Figs. 2 and 3(a) and 3(b), all DEf > 0, indicates a mis-
cibility gap, but the range of DEf values, 0.02 eV/
mol . DEf . 0:6 eV/mol (3 kJ/mol . DEf . 125 kJ/mol)
is unusually large; e.g., the comparable range in wurtzite
based miscibility-gap system, GaN-InN, is 0.03 eV/mol
. DEf . 0:18 eV/mol and the calculated consolute tempera-
ture is TC � 1840 K.
023507-3 Burton, Demers, and van de Walle J. Appl. Phys. 110, 023507 (2011)
Downloaded 20 Sep 2011 to 131.215.220.186. Redistribution subject to AIP license or copyright; see http://jap.aip.org/about/rights_and_permissions
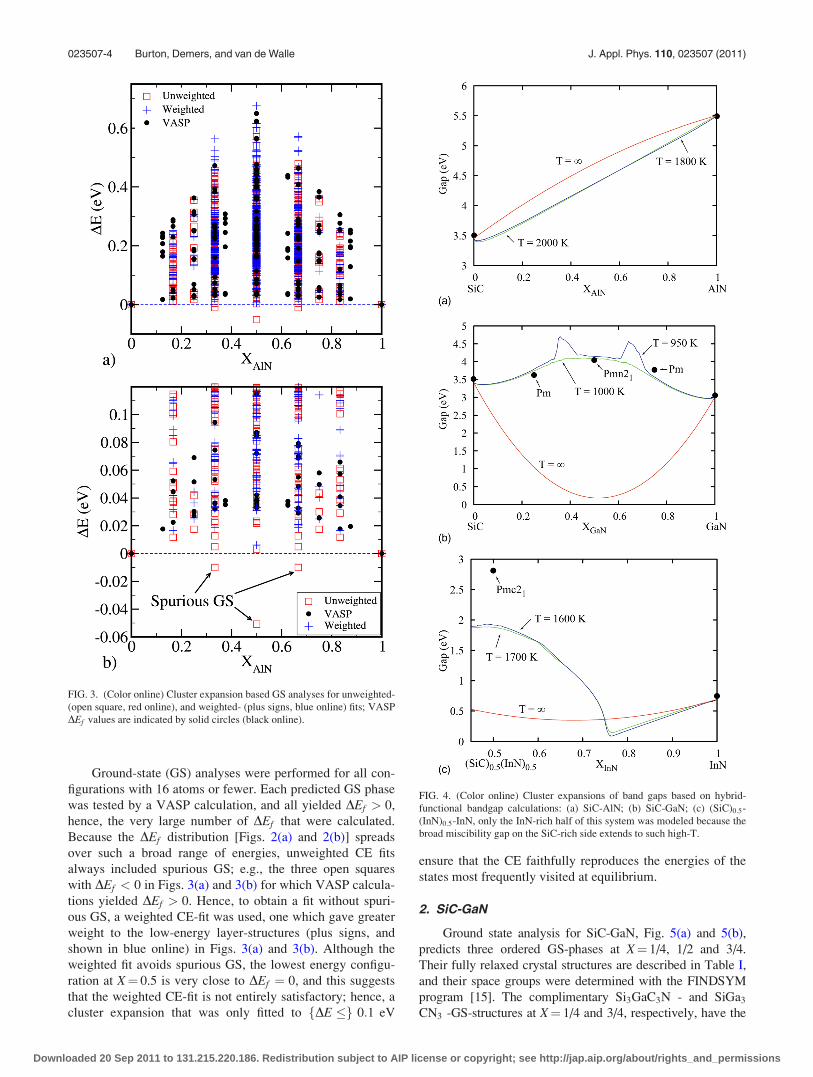
Ground-state (GS) analyses were performed for all con-
figurations with 16 atoms or fewer. Each predicted GS phase
was tested by a VASP calculation, and all yielded DEf > 0,
hence, the very large number of DEf that were calculated.
Because the DEf distribution [Figs. 2(a) and 2(b)] spreads
over such a broad range of energies, unweighted CE fits
always included spurious GS; e.g., the three open squares
with DEf < 0 in Figs. 3(a) and 3(b) for which VASP calcula-
tions yielded DEf > 0. Hence, to obtain a fit without spuri-
ous GS, a weighted CE-fit was used, one which gave greater
weight to the low-energy layer-structures (plus signs, and
shown in blue online) in Figs. 3(a) and 3(b). Although the
weighted fit avoids spurious GS, the lowest energy configu-
ration at X¼ 0.5 is very close to DEf ¼ 0, and this suggests
that the weighted CE-fit is not entirely satisfactory; hence, a
cluster expansion that was only fitted to fDE �g 0:1 eV
ensure that the CE faithfully reproduces the energies of the
states most frequently visited at equilibrium.
2. SiC-GaN
Ground state analysis for SiC-GaN, Fig. 5(a) and 5(b),
predicts three ordered GS-phases at X¼ 1/4, 1/2 and 3/4.
Their fully relaxed crystal structures are described in Table I,
and their space groups were determined with the FINDSYM
program [15]. The complimentary Si3GaC3N - and SiGa3
CN3 -GS-structures at X¼ 1/4 and 3/4, respectively, have the
FIG. 4. (Color online) Cluster expansions of band gaps based on hybrid-
functional bandgap calculations: (a) SiC-AlN; (b) SiC-GaN; (c) (SiC)0:5-
(InN)0:5-InN, only the InN-rich half of this system was modeled because the
broad miscibility gap on the SiC-rich side extends to such high-T.
FIG. 3. (Color online) Cluster expansion based GS analyses for unweighted-
(open square, red online), and weighted- (plus signs, blue online) fits; VASP
DEf values are indicated by solid circles (black online).
023507-4 Burton, Demers, and van de Walle J. Appl. Phys. 110, 023507 (2011)
Downloaded 20 Sep 2011 to 131.215.220.186. Redistribution subject to AIP license or copyright; see http://jap.aip.org/about/rights_and_permissions
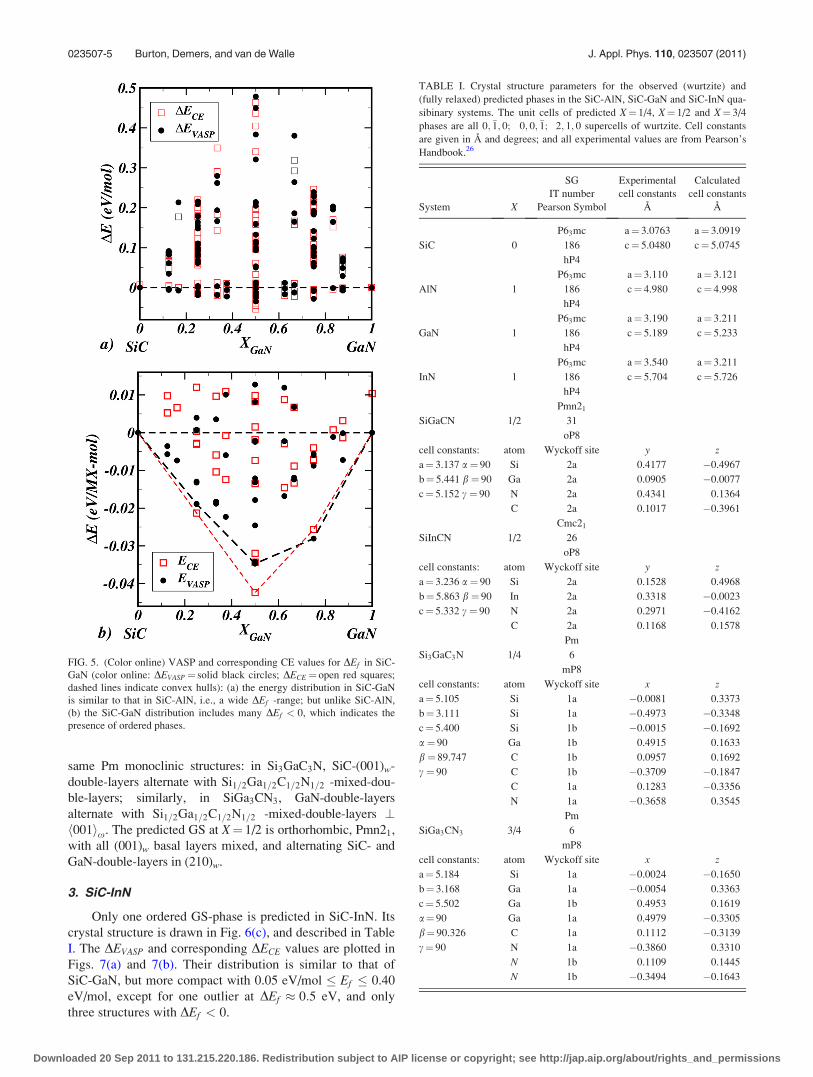
same Pm monoclinic structures: in Si3GaC3N, SiC-(001)w-
double-layers alternate with Si1=2Ga1=2C1=2N1=2 -mixed-dou-
ble-layers; similarly, in SiGa3CN3, GaN-double-layers
alternate with Si1=2Ga1=2C1=2N1=2 -mixed-double-layers ?h001ix. The predicted GS at X¼ 1/2 is orthorhombic, Pmn21,
with all (001)w basal layers mixed, and alternating SiC- and
GaN-double-layers in (210)w.
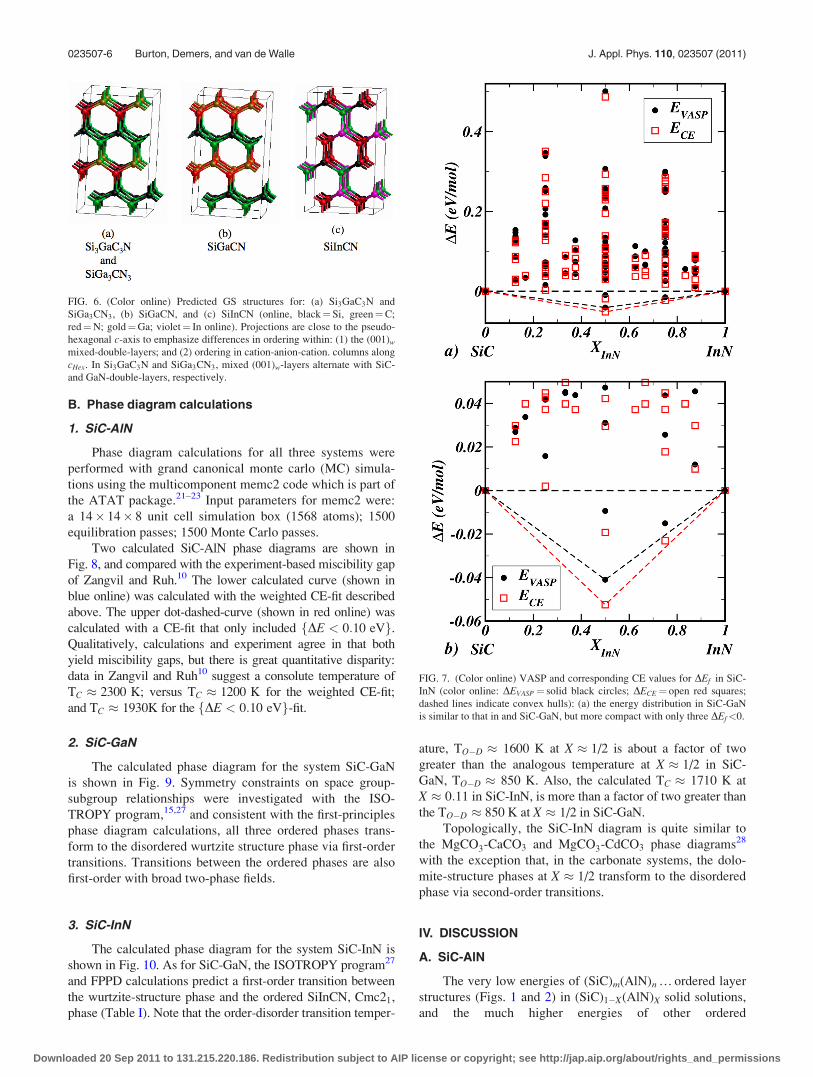
3. SiC-InN
Only one ordered GS-phase is predicted in SiC-InN. Its
crystal structure is drawn in Fig. 6(c), and described in Table
I. The DEVASP and corresponding DECE values are plotted in
Figs. 7(a) and 7(b). Their distribution is similar to that of
SiC-GaN, but more compact with 0.05 eV/mol � Ef � 0.40
eV/mol, except for one outlier at DEf � 0:5 eV, and only
three structures with DEf < 0.
FIG. 5. (Color online) VASP and corresponding CE values for DEf in SiC-
GaN (color online: DEVASP¼ solid black circles; DECE¼ open red squares;
dashed lines indicate convex hulls): (a) the energy distribution in SiC-GaN
is similar to that in SiC-AlN, i.e., a wide DEf -range; but unlike SiC-AlN,
(b) the SiC-GaN distribution includes many DEf < 0, which indicates the
presence of ordered phases.
TABLE I. Crystal structure parameters for the observed (wurtzite) and
(fully relaxed) predicted phases in the SiC-AlN, SiC-GaN and SiC-InN qua-
sibinary systems. The unit cells of predicted X¼ 1/4, X¼ 1/2 and X¼ 3/4
phases are all 0; �1; 0; 0; 0; �1; 2; 1; 0 supercells of wurtzite. Cell constants
are given in A and degrees; and all experimental values are from Pearson’s
Handbook.26
System X
SG
IT number
Pearson Symbol
Experimental
cell constants
A
Calculated
cell constants
A
P63mc a¼ 3.0763 a¼ 3.0919
SiC 0 186 c¼ 5.0480 c¼ 5.0745
hP4
P63mc a¼ 3.110 a¼ 3.121
AlN 1 186 c¼ 4.980 c¼ 4.998
hP4
P63mc a¼ 3.190 a¼ 3.211
GaN 1 186 c¼ 5.189 c¼ 5.233
hP4
P63mc a¼ 3.540 a¼ 3.211
InN 1 186 c¼ 5.704 c¼ 5.726
hP4
Pmn21
SiGaCN 1/2 31
oP8
cell constants: atom Wyckoff site y z
a¼ 3.137 a ¼ 90 Si 2a 0.4177 �0.4967
b¼ 5.441 b ¼ 90 Ga 2a 0.0905 �0.0077
c¼ 5.152 c ¼ 90 N 2a 0.4341 0.1364
C 2a 0.1017 �0.3961
Cmc21
SiInCN 1/2 26
oP8
cell constants: atom Wyckoff site y z
a¼ 3.236 a ¼ 90 Si 2a 0.1528 0.4968
b¼ 5.863 b ¼ 90 In 2a 0.3318 �0.0023
c¼ 5.332 c ¼ 90 N 2a 0.2971 �0.4162
C 2a 0.1168 0.1578
Pm
Si3GaC3N 1/4 6
mP8
cell constants: atom Wyckoff site x z
a¼ 5.105 Si 1a �0.0081 0.3373
b¼ 3.111 Si 1a �0.4973 �0.3348
c¼ 5.400 Si 1b �0.0015 �0.1692
a ¼ 90 Ga 1b 0.4915 0.1633
b ¼ 89.747 C 1b 0.0957 0.1692
c ¼ 90 C 1b �0.3709 �0.1847
C 1a 0.1283 �0.3356
N 1a �0.3658 0.3545
Pm
SiGa3CN3 3/4 6
mP8
cell constants: atom Wyckoff site x z
a¼ 5.184 Si 1a �0.0024 �0.1650
b¼ 3.168 Ga 1a �0.0054 0.3363
c¼ 5.502 Ga 1b 0.4953 0.1619
a¼ 90 Ga 1a 0.4979 �0.3305
b¼ 90.326 C 1a 0.1112 �0.3139
c¼ 90 N 1a �0.3860 0.3310
N 1b 0.1109 0.1445
N 1b �0.3494 �0.1643
023507-5 Burton, Demers, and van de Walle J. Appl. Phys. 110, 023507 (2011)
Downloaded 20 Sep 2011 to 131.215.220.186. Redistribution subject to AIP license or copyright; see http://jap.aip.org/about/rights_and_permissions
B. Phase diagram calculations
1. SiC-AlN
Phase diagram calculations for all three systems were
performed with grand canonical monte carlo (MC) simula-
tions using the multicomponent memc2 code which is part of
the ATAT package.21–23 Input parameters for memc2 were:
a 14� 14� 8 unit cell simulation box (1568 atoms); 1500
equilibration passes; 1500 Monte Carlo passes.
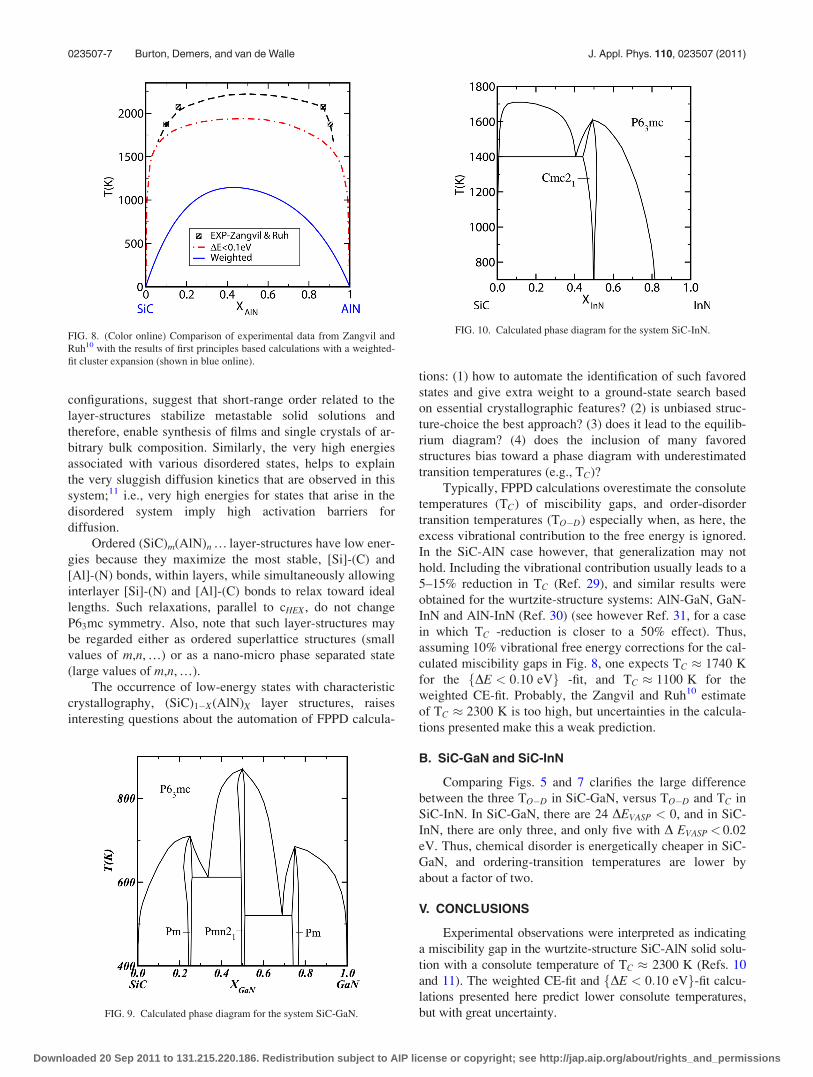
Two calculated SiC-AlN phase diagrams are shown in
Fig. 8, and compared with the experiment-based miscibility gap
of Zangvil and Ruh.10 The lower calculated curve (shown in
blue online) was calculated with the weighted CE-fit described
above. The upper dot-dashed-curve (shown in red online) was
calculated with a CE-fit that only included fDE < 0:10 eVg.Qualitatively, calculations and experiment agree in that both
yield miscibility gaps, but there is great quantitative disparity:
data in Zangvil and Ruh10 suggest a consolute temperature of
TC � 2300 K; versus TC � 1200 K for the weighted CE-fit;
and TC � 1930K for the fDE < 0:10 eVg-fit.
2. SiC-GaN
The calculated phase diagram for the system SiC-GaN
is shown in Fig. 9. Symmetry constraints on space group-
subgroup relationships were investigated with the ISO-
TROPY program,15,27 and consistent with the first-principles
phase diagram calculations, all three ordered phases trans-
form to the disordered wurtzite structure phase via first-order
transitions. Transitions between the ordered phases are also
first-order with broad two-phase fields.
3. SiC-InN
The calculated phase diagram for the system SiC-InN is
shown in Fig. 10. As for SiC-GaN, the ISOTROPY program27
and FPPD calculations predict a first-order transition between
the wurtzite-structure phase and the ordered SiInCN, Cmc21,
phase (Table I). Note that the order-disorder transition temper-
ature, TO�D � 1600 K at X � 1/2 is about a factor of two
greater than the analogous temperature at X � 1/2 in SiC-
GaN, TO�D � 850 K. Also, the calculated TC � 1710 K at
X � 0:11 in SiC-InN, is more than a factor of two greater than
the TO�D � 850 K at X � 1/2 in SiC-GaN.
Topologically, the SiC-InN diagram is quite similar to
the MgCO3-CaCO3 and MgCO3-CdCO3 phase diagrams28
with the exception that, in the carbonate systems, the dolo-
mite-structure phases at X � 1/2 transform to the disordered
phase via second-order transitions.
IV. DISCUSSION
A. SiC-AlN
The very low energies of (SiC)m(AlN)n … ordered layer
structures (Figs. 1 and 2) in (SiC)1�X(AlN)X solid solutions,
and the much higher energies of other ordered
FIG. 6. (Color online) Predicted GS structures for: (a) Si3GaC3N and
SiGa3CN3, (b) SiGaCN, and (c) SiInCN (online, black¼Si, green¼C;
red¼N; gold¼Ga; violet¼ In online). Projections are close to the pseudo-
hexagonal c-axis to emphasize differences in ordering within: (1) the (001)w
mixed-double-layers; and (2) ordering in cation-anion-cation. columns along
cHex. In Si3GaC3N and SiGa3CN3, mixed (001)w-layers alternate with SiC-
and GaN-double-layers, respectively.
FIG. 7. (Color online) VASP and corresponding CE values for DEf in SiC-
InN (color online: DEVASP¼ solid black circles; DECE¼ open red squares;
dashed lines indicate convex hulls): (a) the energy distribution in SiC-GaN
is similar to that in and SiC-GaN, but more compact with only three DEf<0.
023507-6 Burton, Demers, and van de Walle J. Appl. Phys. 110, 023507 (2011)
Downloaded 20 Sep 2011 to 131.215.220.186. Redistribution subject to AIP license or copyright; see http://jap.aip.org/about/rights_and_permissions
configurations, suggest that short-range order related to the
layer-structures stabilize metastable solid solutions and
therefore, enable synthesis of films and single crystals of ar-
bitrary bulk composition. Similarly, the very high energies
associated with various disordered states, helps to explain
the very sluggish diffusion kinetics that are observed in this
system;11 i.e., very high energies for states that arise in the
disordered system imply high activation barriers for
diffusion.
Ordered (SiC)m(AlN)n … layer-structures have low ener-
gies because they maximize the most stable, [Si]-(C) and
[Al]-(N) bonds, within layers, while simultaneously allowing
interlayer [Si]-(N) and [Al]-(C) bonds to relax toward ideal
lengths. Such relaxations, parallel to cHEX, do not change
P63mc symmetry. Also, note that such layer-structures may
be regarded either as ordered superlattice structures (small
values of m,n, …) or as a nano-micro phase separated state
(large values of m,n, …).
The occurrence of low-energy states with characteristic
crystallography, (SiC)1�X(AlN)X layer structures, raises
interesting questions about the automation of FPPD calcula-
tions: (1) how to automate the identification of such favored
states and give extra weight to a ground-state search based
on essential crystallographic features? (2) is unbiased struc-
ture-choice the best approach? (3) does it lead to the equilib-
rium diagram? (4) does the inclusion of many favored
structures bias toward a phase diagram with underestimated
transition temperatures (e.g., TC)?
Typically, FPPD calculations overestimate the consolute
temperatures (TC) of miscibility gaps, and order-disorder
transition temperatures (TO�D) especially when, as here, the
excess vibrational contribution to the free energy is ignored.
In the SiC-AlN case however, that generalization may not
hold. Including the vibrational contribution usually leads to a
5–15% reduction in TC (Ref. 29), and similar results were
obtained for the wurtzite-structure systems: AlN-GaN, GaN-
InN and AlN-InN (Ref. 30) (see however Ref. 31, for a case
in which TC -reduction is closer to a 50% effect). Thus,
assuming 10% vibrational free energy corrections for the cal-
culated miscibility gaps in Fig. 8, one expects TC � 1740 K
for the fDE < 0:10 eVg -fit, and TC � 1100 K for the
weighted CE-fit. Probably, the Zangvil and Ruh10 estimate
of TC � 2300 K is too high, but uncertainties in the calcula-
tions presented make this a weak prediction.
B. SiC-GaN and SiC-InN
Comparing Figs. 5 and 7 clarifies the large difference
between the three TO�D in SiC-GaN, versus TO�D and TC in
SiC-InN. In SiC-GaN, there are 24 DEVASP < 0, and in SiC-
InN, there are only three, and only five with D EVASP < 0.02
eV. Thus, chemical disorder is energetically cheaper in SiC-
GaN, and ordering-transition temperatures are lower by
about a factor of two.
V. CONCLUSIONS
Experimental observations were interpreted as indicating
a miscibility gap in the wurtzite-structure SiC-AlN solid solu-
tion with a consolute temperature of TC � 2300 K (Refs. 10
and 11). The weighted CE-fit and fDE < 0:10 eVg-fit calcu-
lations presented here predict lower consolute temperatures,
but with great uncertainty.
FIG. 8. (Color online) Comparison of experimental data from Zangvil and
Ruh10 with the results of first principles based calculations with a weighted-
fit cluster expansion (shown in blue online).
FIG. 9. Calculated phase diagram for the system SiC-GaN.
FIG. 10. Calculated phase diagram for the system SiC-InN.
023507-7 Burton, Demers, and van de Walle J. Appl. Phys. 110, 023507 (2011)
Downloaded 20 Sep 2011 to 131.215.220.186. Redistribution subject to AIP license or copyright; see http://jap.aip.org/about/rights_and_permissions
Total energy calculations predict the presence of low-
energy metastable layer-structures of the form (SiC)m(AlN)n
(SiC)o(AlN)p … , in which m-, o-, … layers of SiC, ? to cHex
alternate with n-, p-, … layers of AlN, ? to cHex. Formation
energies for layer structures in which (SiN) and (AlC) nn-
layers are maximized (i.e., Si-N and Al-C bonds are maxi-
mized) have much higher energies, 50 kJ/mol to 75 kJ/mol
higher, than the (SiC)m(AlN)n layer-structures. It seems
likely that the relative ease with which one can synthesize
apparently homogeneous films and single crystals of
(SiC)1�X(AlN)X at arbitrary X, reflects a reduction in total
energy that derives from short-range order based on (SiC)m
(AlN)n (SiC)o(AlN)p … layer structures. This characteristic
local structure helps to explain the very sluggish kinetics in
this system: diffusion barriers through highly stable SiC- or
AlN-double layers are very high.
Three stable ordered phases are predicted in SiC-GaN, and
one in SiC-InN. Disordering of the SiC-GaN ordered phases
occurs at temperatures that are about a factor of two lower than
the disordering temperatures, TO�D and TC in SiC-InN.
Cluster expansions of hybrid-functional-based band gaps
indicate only a small short-range-order in (clustering) effect
on band gaps in SiC-AlN solid solutions, but very significant
effects in SiC-GaN, and to a lesser extent in SiC-InN.
The topology of the SiC-InN phase diagram is similar to
those for carbonate systems such as MgCO3-CaCO3 and
MgCO3-CdCO3 (Ref. 28), with the exception that in SiC-InN,
the order-disorder transition at X � 1/2 and T � 1600 K, is a
first-order transition rather than a second-order transition as in
the carbonates.
ACKNOWLEDGMENTS
This work is supported by NIST, the Department of
Energy National Nuclear Security Administration under
Award No. DE-FC52-08NA28613, the National Science Foun-
dation under Grant No. DMR-0907669, and through TeraGrid
resources at TACC under Grant No. TG-DMR050013N.
1Z. Gu, L. Du, J. H. Edgar, E. A. Payzant, L. Walker, R. Liu and M. H.
Engelhard, MRS Internet J. Nitride Semicond. Res. 10(5), 1 (2005).2J. H. Edgar, Z. Gu, L. Gu, and D. Smith, Phys. Status Solidi A 203(15),
3720 (2006).
3R. Roucka, J. Tolle, A. V. G. Chizmeshya, P. A. Crozier, D. J. Smith, I. S.
T. Tsong, and J. Kouvetakis, Phys. Rev. Lett. 88, 206102 (2002).4J. Tolle, R. Roucka, A. V. G. Chizmeshya, P. A. Crozier, D. J. Smith, I. S.
T. Tsong, and J. Kouvetakis, Solid State Sci. 4 1509 (2002).5The term quasibinary is used rather than pseudobinary because the calcu-
lated phasediagrams obey a binary phase rule, although the real system
may deviate slightly from this ideal.6P. B. Perry and R. F. Rutz, Appl. Phys. Lett. 33, 319 (1978).7B. Monemar, Phys. Rev. B 10, 676 (1974).8T. L. Tanesley and C. P. Foley, J. Appl. Phys. 59, 3241 (1986).9N. B. Singh, B. Wagner, A. Berghmans, D. J. Knuteson, S. McLaughlin,
D. Kahler, D. Thomson, and M. King, Cryst. Growth Des. 10, 3508
(2010).10A. Zangvil and R. Ruh, J. Am. Ceram. Soc. 71(10), 884 (1988).11W. Rafaniello, M. R. Plichta, and A. V. Virkar, J. Am. Ceram. Soc. 66(4),
272 (1983); B. Paulus, F-J Shi, and H. Stoll, J. Phys. Condens. Mater. 9,
2745 (1997).12Z. Q. Liu and J. Ni, Eur. Phys. J. B 59, 29 (2007).13G. Kresse, and J. Hafner, Phys. Rev. B 47, 558 (1993); G. Kresse, Ph. D
thesis, Technische Universitat Wien, 1993; G. Kresse, Phys. Rev. B
49(14) 251 (1994); G. Kresse and J. Furthmuller, Comput. Mater. Sci. 6,
15 (1996); G. Kresse and J. Furthmuller, Phys. Rev. B 54, 11169 (1996);
See http://tph.tuwien.ac.at/vasp/guide/vasp.html. The Al, Nh, Si and Cs
PAW potentials were used in this work.14D. Vanderbilt, Phys. Rev. B 41, 7892 (1990).15Reference to specific software packages does not imply a NIST
endorsement.16J. M. Sanchez, F. Ducastelle, and D. Gratias, Physica A 128, 334 (1984).17B. P. Burton, Am. Mineral. 70, 1027 (1985).18G. Ceder, G. D. Garbulsky, D. Avis, and A. Fukuda, Phys. Rev. B 49, 1
(1994).19D. de Fontaine, Solid State Physics 47 33 (1994).20R. McCormack and D. deFontaine, Phys. Rev B, 54, 9746 (1996).21A. van de Walle, M. Asta, and G. Ceder, CALPHAD: Comput. Coupling
Phase DiagramsThermochem. 26 539 (2002).22A. van de Walle and G. Ceder, J. Phase Equilib. 23 348 (2002).23A. van de Walle and M. Asta, Modell. Simul. Mater. Sci. Eng. 10 521
(2002).24J. Heyd, G. E. Scuseria, and M. Ernzerhof, J. Chem. Phys. 118, 8207
(2003); J. Heyd, G. E. Scuseria, and M. Ernzerhof, ibid. 124, 219906
(2006).25A. V. Krukau, O. A. Vydrov, A. F. Izmaylov, and G. E. Scuseria, J. Chem.
Phys. 125, 224106 (2006); H. T. Stokes and D. M. Hatch, J. Appl. Crystal-
logr. 38, 237 (2005); See http://stokes.byu.edu/cgi-bin/iso/findsym.cgi.26P. Villars and L. D. Calvert, Pearson’s Handbook of Crystallographic
Data for Intermetallic Phases (American Society for Metals, Metals Park,
OH 1985), Vol. 1.27H. T. Stokes, D. M. Hatch, and B. J. Campbell, (2007). ISOTROPY, see
http://stokes.byu.edu/isotropy.html.28B. P. Burton and A. Van de Walle, Phys. Chem. Miner. 30, 88 (2003).29A. van de Walle and G. Ceder, Rev. Mod. Phys. 74, 11 (2002).30B. P. Burton, A. van de Walle, and U. Kattner, J. Appl. Phys. 100, 113528
(2006).31B. P. Burton and A. van de Walle, Chem. Geol. 225, 222 (2006).
023507-8 Burton, Demers, and van de Walle J. Appl. Phys. 110, 023507 (2011)
Downloaded 20 Sep 2011 to 131.215.220.186. Redistribution subject to AIP license or copyright; see http://jap.aip.org/about/rights_and_permissions


![Compositions by · Compositions by Derek Bell and Beinsa Douno [1] BELL: Variations & Musical Quotations [14.04] "Come on, Northern Ireland, come on" Vratza Philharmonic Orchestra](https://img.pdfslide.us/doc/110x75/60068709c824ef6e46780f49/compositions-by-compositions-by-derek-bell-and-beinsa-douno-1-bell-variations.jpg)