Embed Size (px)
Citation preview

This journal is c the Owner Societies 2013 Phys. Chem. Chem. Phys.
Cite this: DOI: 10.1039/c3cp50275a
First principles intensity calculations of the methanerovibrational spectra in the infrared up to 9300 cm�1†
Michael Rey,*a Andrei V. Nikitinab and Vladimir G. Tyutereva
We report global calculations of rovibrational spectra and dipole transition intensities of methane using
our recent ab initio dipole moment and potential surfaces [Nikitin et al., Chem. Phys. Lett., 2011, 501,
179; 2013, 565, 5]. For the full symmetry account, a recently published variational tensor formalism in
normal modes [Rey et al., J. Chem. Phys., 2012, 136, 244106] is applied, the convergence of high-J
calculations being improved by the use of vibrational eigenfunctions to make a compressed basis set
for solving the rovibrational problem. Comparisons of theoretical predictions up to J = 25 for various
complex polyads of methane involving strongly coupled vibration–rotation bands support the validity of
this new approach. For the first time, positions and line intensities at 80 K and 296 K are shown to be
in excellent agreement with raw experimental data, even for high energy ranges. The theoretical
predictions also correctly describe the isotopic effects in line positions and intensities due to the CH4 -
CD4 substitution which is considered as the test for the method. This work is a first step toward
the theoretical interpretation of numerous methane bands which remain still unassigned and detailed
line-by-line absorption/emission spectra analyses for atmospheric and planetological applications.
1 Introduction
Knowledge of intensities of rovibrational transitions of methaneis essential for the modeling of various planetary atmospheres(giant planets or Titan’s atmosphere), brown dwarfs1 and forother astrophysical2–7 applications. Empirical effective spectro-scopic models proved to be efficient in line-by-line analyses8–11
but fail to provide reliable predictions for high polyads due tonumerous resonances and thousands of unknown parameters tobe adjusted. As a complementary theoretical tool, ab initiopredictions of molecular spectra would help resolving manyissues and much progress has been achieved in the last fewyears in this way (see for example ref. 12–26 and referencestherein, the list being not exhaustive). For medium-sized poly-atomics, this remains a formidable challenge.
Various issues concerning the theoretical methane spectrapredictions from molecular potential energy surfaces (PES) andfrom dipole moment surfaces (DMS) have been discussed byMarquardt and Quack,16,17 Schwenke and Partridge,13,18 Carringtonand Wang,14,27,28 Wang and Sibert29,30 and some other studies.31–34
Recently, Cassam-Chenaı and Lievin20 have computed a rotationalmethane spectrum within the ground vibrational state using theperturbation theory, whereas Warmbier et al.35 generated themethane spectra at T = 1000 K using MULTIMODE program.36
But an extended modeling of line intensities in wide spectralregions is still suffering from the lack of accuracy of globalcalculations. Recently we have reported a variation rovibrationalcalculation33 (J = 0 and 1) using rectilinear normal coordinatesfrom our accurate potential energy surface,34 hereafter referred toas NRT PES. The previous work was not focused on high-J andintensity calculations but essentially devoted to the validation ofour new theoretical approach based on the systematic formula-tion of the nuclear Hamiltonian in terms of irreducible tensoroperators (ITO) for the full account of molecular symmetryproperties. The present work aims at providing, for the very firsttime, a quantitative description of rovibrational line positions andintensities of methane in the range 0–9300 cm�1, up to quite highrotational quantum numbers J = 25. For a better convergence ofrovibrational energies and line positions, we have used accurateJ = 0 eigenfunctions variationally obtained from the vibrationalequation in order to build in the next step a compact rovibrationalmatrix that provides an efficient compression for the computa-tions. The intensity calculations were achieved through thenormal mode development of our recent ab initio dipolemoment surfaces,37 hereafter referred to as NRT DMS. Thegreat complexity of the methane spectra (due to numerous
a Groupe de Spectrometrie Moleculaire et Atmospherique, UMR CNRS 7331,
BP 1039, F-51687, Reims Cedex 2, France. E-mail: [email protected] Laboratory of Theoretical Spectroscopy, Institute of Atmospheric Optics, SB RAS,
634055 Tomsk, Russia
† Paper for the themed PCCP issue: ‘‘Spectroscopy and dynamics of medium-sized molecules and clusters’’.
Received 21st January 2013,Accepted 11th April 2013
DOI: 10.1039/c3cp50275a
www.rsc.org/pccp
PCCP
PAPER
Dow
nloa
ded
by U
nive
rsity
of
Ari
zona
on
05/0
5/20
13 1
5:37
:51.
Pu
blis
hed
on 1
2 A
pril
2013
on
http
://pu
bs.r
sc.o
rg |
doi:1
0.10
39/C
3CP5
0275
A
View Article OnlineView Journal

Phys. Chem. Chem. Phys. This journal is c the Owner Societies 2013
quasi-degenerate sublevels coupled by anharmonic and Coriolisresonances) and the high (Td) symmetry required the use ofsophisticated group theory tools.38,39 Concerning the computa-tional and numerical challenges, we have developed a codeTENSOR which provides all necessary ingredients to build ina systematic way the complete normal-mode DMS andHamiltonian for first-principles calculations. The vibration–rotation Hamiltonian for a polyatomic molecule in normalcoordinates was formulated in its most compact form byWatson40 and referred to as Eckart–Watson Hamiltonian(EWH) in the following. For methane the EWH is given by
Hðp; q; JÞ ¼ 1
2
X4k¼1
Xs
okp2ðGÞks þUðqÞ þUW ðqÞ
þ 1
2
Xab
Ja � pað Þmab Jb � pb� �
;
(1)
where a, b = x, y, z. All the terms in H are well explained else-where.33,40 The quantum nuclear motion in the nine-dimensionalspace is described by four dimensionless normal coordinates q.They transform according to irreducible representations (irreps)G = A1, E and F2 of the Td point group, associated componentsbeing q(G)
ks with k = 1, 2, 3 and 4. The NRT potentials U(R) andDMS m(R) were originally built as a combination of symmetrizedpowers of curvilinear coordinates S(R) where R collects allfunctions of internal displacements (r1, r2, . . .; y1, y2, . . .) whichwere converted for this study to the normal mode representationin terms of q with the TENSOR code.
2 Symmetry considerations
To reduce the cost of computation of the nuclear motionproblem, it is highly advantageous to exploit molecular symmetry(MS). The key point of the present approach is that MS can be fullyexploited within the framework of the ITO initially implemented foreffective empirical models. To this end the ITO formalismproposed by Nikitin et al.41,42 turns out very convenient for asystematic development of the Hamiltonian at arbitrary orders.This formalism was implemented in the MIRS computer codeinitially designed for effective Hamiltonian normal mode models42
but recently extended to ab initio Hamiltonians and dipolemoments.43 As the codes TENSOR and MIRS allow a full accountfor the Td symmetry of methane, all degeneracies are obtainedautomatically and exactly while for most of the codes available inthe literature dealing with G C Td subgroups, it was necessary tonumerically converge sub-levels (G) to the true degenerate ones(Td). Following the method described in ref. 33, the TENSORpackage systematically transforms the EWH (1) to its tensorialcounterpart in an exact way at every order of the development.No adjusted parameters are needed at this step. We thus write
EWH! Hðaþ; a; JÞ ¼Xfig
tfigeVðGÞ � ROðK ;GÞ� �ðA1Þ
; (2)
where the t parameters can be determined either numerically oranalytically from the PES and the kinetic energy operator normal
mode expansions via the spectroscopic constants o, zaks;ls0 , Be, Babks,
Babksls0 , . . .. Here e denotes the parity of the operator, O is the degree
in Ja and K is the rank in O(3). An expansion of the reciprocal inertiatensor m(q) in terms of normal coordinates is straightforward andconverges quite well for the case of methane, as discussed inref. 33, because the amplitudes of vibrations remain moderate inthe considered energy range much below the dissociation limit andpotential barriers. The same applies for the expansion of theWatson’s UW(q) term. In this work, we truncated the reciprocalinertia tensor at m8 terms. The corresponding error was evaluated asthe difference between energies calculated with m6 and m8. Thiserror remains small B10�3–10�4 cm�1 for J = 20 in the range up tothe tetradecad. Note that an account of higher orders could beaffordable for high-temperature applications. The Hamiltonian ishermitian and invariant under the time-reversal. The operators Vand R have thus necessarily the same parity in elementary operatorsthat is e = (�1)O. The form (2) is particularly well-adapted to the Td
point group and systematically accounts for all resonance couplingsymmetry allowed terms. The vibrational operators V are built as asymmetrized tensor product of normal mode creation–annihilationoperators
VðGÞ ¼NY4s¼1
ansþ �
Y4s¼1
ams
!ðGÞ� e h:c:
8<:
9=;; (3)
with
ansþ ¼ as
þðCÞ � � � � � asþðCÞ|fflfflfflfflfflfflfflfflfflfflfflfflfflfflfflffl{zfflfflfflfflfflfflfflfflfflfflfflfflfflfflfflffl}
ns
; ams ¼ aðCÞs � � � � � aðCÞs|fflfflfflfflfflfflfflfflfflfflfflffl{zfflfflfflfflfflfflfflfflfflfflfflffl}ms
: (4)
The N’s are coefficients which can be computed from formulas ofref. 41. Some examples can be found in Table 2 of ref. 33. Therotational part R involves symmetry-adapted tensor operators builtin the group chain O(3) * Td and are defined as ref. 38
R2ð0;A1Þ ¼ � 4ffiffiffi3p Jx
2 þ Jy2 þ Jz
2� �
;
Ra1ð1;F1Þ ¼ 2Jaða ¼ x; y; zÞ;
Ra2ð2;EÞ ¼ 2
ffiffiffi2pffiffiffi3p 2Jz
2 � Jx2 � Jy
2� �
;
Rb2ð2;EÞ ¼ 2
ffiffiffi2p
Jx2 � Jy
2� �
;
Ra2ð2;F2Þ ¼ 2
ffiffiffi2p
JbJg þ JgJb� �
;
(5)
where (a, b, g) are circular permutations.
3 Energy level calculations and basiscompression
The first step in the computation of complete spectra is anaccurate determination of vibration–rotation energy levels forhigh J rotational quantum numbers. This is done by means ofefficient variational quantum mechanical calculations fornuclear motion stationary states from the PES. In this work,we have adopted the truncation–reduction technique described
Paper PCCP
Dow
nloa
ded
by U
nive
rsity
of
Ari
zona
on
05/0
5/20
13 1
5:37
:51.
Pu
blis
hed
on 1
2 A
pril
2013
on
http
://pu
bs.r
sc.o
rg |
doi:1
0.10
39/C
3CP5
0275
AView Article Online

This journal is c the Owner Societies 2013 Phys. Chem. Chem. Phys.
in ref. 33. This new strategy aims at minimizing the cost of thecomputations. It also allows reducing the impacts of drawbacksof high-order Taylor series expansion at large distance. Forcomputing high-J rovibrational states, we have implemented inthe ITO formalism the vibrational sub-space (VSS) procedure.This consists of using accurate eigenfunctions of the vibra-tional Hamiltonian to make a basis set for vibration–rotationcalculations. A similar approach has been previously used fortriatomic molecules (see for example the works reviewed inref. 44) and was also discussed in ref. 45 and 46. To summarize,in our case the nuclear problem is solved in a four-stepprocedure implemented in the TENSOR code:
(i) First, the reduction technique was applied to the vibra-tional part of H. Starting with a nth order Taylor EWH expan-sion H(n)(p,q,J), we transform this to a mth order (m o n)reduced Hamiltonian H(n-m)
red (p,q,J) as described in ref. 33. Inthe present work, we use the 14 - 6 reduction scheme whichallows converging to the root-mean-square (rms) errors forband centers B0.2 cm�1 up to the octad range (o4700 cm�1)and B0.6 cm�1 for the tetradecad range (o6300 cm�1) ascompared to the original exact kinetic Hamiltonian calcula-tions in internal coordinates.34
(ii) The EWH expansion H(14-6)red (p,q,J) that contains about
14 000 operators is converted to the full second quantizedtensor form (2) which reduces to 6252 rovibrational operatorsat the order 6. This procedure makes it feasible to treatdegeneracies as exact ones. Developments of the ITO formalismhave been initiated during the last three decades in spectroscopicdata reductions using effective Hamiltonians9,38,39,41–43,47–49
and extended in our work for the complete nuclearHamiltonian.33,43,50
(iii) The vibrational basis set ffðCvÞsv g is built as a tensor
product of four harmonic oscillator normal mode functionswhere the inner coupling scheme is defined as
fðCvÞsv ¼ CðA1Þ
v1�CðC2Þ
v2
� �ðC2Þ� CðC3Þ
v3�CðC4Þ
v4
� �ðC34Þ� ðCvÞ
sv
: (6)
Only a relevant set of basis functions is selected by imposingthe cutoff criterium33
F vmaxð Þ ¼Xi
vi � vmax (7)
with vi = 0,. . ., vmax. For the results reported hereby, thevibrational basis functions were chosen as F(6), F(7), F(8), F(9)and F(12) according to the ranges of rotational quantumnumber J (see text below).
(iv) In the last step, the Hamiltonian is partitioned as H =Hv + Hrv and the vibrational equation HvCv = EvCv is first solvedfor a given basis set F(k) and the Hamiltonian model. InTable 1, vibrational energy levels Ev for three bases – F(7), F(9)and F(12) – are presented and compared to the observed data.The basis sizes are also given in this table. As expected thelargest basis F(12) gives better results which will be used in partas benchmarks to compute the infrared spectrum of methane.Although the F(9) basis has five times less vibrational functions(see Table 1), it also gives acceptable results.
Defining a vibrational cutoff Emax, we then select an appro-priate VSS such that Ev o Emax and store the correspondingeigensolutions {Ev,C(k)
v }. This compact set of vibrational eigen-functions is used to solve the full rovibrational eigen-problemfor each (J,C) block using a F(r) basis, where r o k. Here J andsymmetry labels C = Cv � Cr are used to assign levels andtransitions. Since F(r) is contained into F(k), we select alleigenvectors of C(k)
v spanning the subspace FðrÞ associatedwith F(r) and thus defined the so-called reduced eigenvectorsC(k-r)
v which have to be properly re-normalized. By forming thedirect product T = C(k-r)
v # IJ,Cr, where IJ,Cr
is the identitymatrix in the rotational subspace, the resulting Hamiltonianmatrix expressed in the vibrational eigenbasis is simplygiven by
%H = TtHT = Ev # IJ,Crdvv0 + Hrv. (8)
Hrv is the rovibrational Hamiltonian matrix in the compressedbasis set. The latter compact matrix is related to the largermatrix hrv
Hrv = TthrvT (9)
which was analytically constructed in the initial primitivebasis set
fðJ;CÞM;s ¼ fðCvÞ � fðJ;nCrÞM
� �ðCÞs
(10)
using the technique described in ref. 33 and 50. Schematicallythis transformation can be presented as follows:
(11)
where Ztot is the total size of the Hamiltonian matrix built in theinitial basis set (10) and Z0 (rZ) is the resulting size whenapplying the VSS procedure. Note that Z0 - Ztot if all functionsare taken into account in VSS that is Emax - N. An illustrationfor matrix dimensions is given at the end of Section 3. In thisexample, we thus see that Ztot/Z0 B 3 which means that thememory required to store eigenfunctions is reduced by a factor10 and the CPU time necessary for the diagonalization isreduced by a factor of 30. This truncation–compression schemeallows one handling much smaller matrices for the vibration–rotation eigen-solutions and thus better converging variationalspectra calculations both for line positions and for line inten-sities. The rovibrational energy levels are obtained by diagona-lizing %H and the assignments are made in the eigenbasisC ¼ T �C of H. In conclusion, the advantage of using the VSScompression is twofold. This allows one reducing drasticallythe number of rovibrational basis states and extending calcula-tions to high-J transitions, direct eigensolvers as an MKL librarybeing thus sufficient. On the other hand, the J = 0 vibrationalband centres Ev may be replaced by observed data (see Table 1)if known or by the variationally-computed levels obtainedfrom F(12) otherwise, with improving the quality of the
PCCP Paper
Dow
nloa
ded
by U
nive
rsity
of
Ari
zona
on
05/0
5/20
13 1
5:37
:51.
Pu
blis
hed
on 1
2 A
pril
2013
on
http
://pu
bs.r
sc.o
rg |
doi:1
0.10
39/C
3CP5
0275
AView Article Online

Phys. Chem. Chem. Phys. This journal is c the Owner Societies 2013
vibrational wavefunctions. In this way, all rotational calculationsare done with ab initio Hamiltonian and DMS, but vibration–rotation resonances are better described. For this work, thereduced eigenvectors C(12-r)
v were used to compute line posi-tions and line intensities. Typically the vibrational shifts to beapplied are given in the last column of Table 1. Note that thecalculated wavefunctions which are used to compute intensitiesremain strictly variational by definition. Computationally, thismethod is implemented via matrix–matrix multiplications whichare very efficient and numerically convenient. Now let us focuson the choice of better adapted basis for computing the rovibra-tional energy levels. Solving the nuclear problem for J > 0
requires the use of good assumptions and compromises. Sincethe sizes of matrices become larger as J increases, we haveadopted a strategy which consists of partitioning the rovibra-tional problem as follows: calculations were performed forJ = 0 with F(12), 1 r J r 3 with F(9), 4 r J r 7 with F(8),8 r J r 14 with F(7) and 15 r J r 25 with F(6). For each basis,we have fixed the vibrational cutoff Emax to 13 700, 13 500,13 200 and 13 000 cm�1, respectively. For example, the five(J = 7,C) blocks obtained with the F(8) basis are of size(�Ztot) NJ=7,C=A1
= 14 984, NJ=7,C=A2= 15 358, NJ=7,C=E = 30 342,
NJ=7,C=F1= 45 788 and NJ=7,C=F2
= 45 420; they reduce to (�Z0)5114, 5258, 10 370, 15 681 and 15 535, respectively, when
Table 1 Convergence of the vibrational energy levels (in cm�1) using the Hamiltonian (H(14-6)red ) and the F(7), F(9) and F(12) basis sets. The sizes of the corresponding
basis sets as well as the zero point energy (in cm�1) are given in the upper panel
Basis size F(7) F(9) F(12)
NA1606 2358 13 327
NA2382 1770 11 369
NE 987 4108 24 661NF1
1304 5752 35 678NF2
1528 6340 37 626ZPE 9703.184 9703.174 9703.172
v1v2v3v4 Sym Ev Ev Ev %a Obs O-F(7)b O-F(9)b O-F(12)b
P1 0001 F2 1310.84 1310.75 1310.74 97 1310.76 �0.08 0.01 0.020100 E 1533.40 1533.32 1533.29 96 1533.33 �0.07 0.01 0.04
P2 0002 A1 2588.02 2587.30 2587.27 90 2587.04 �0.98 �0.26 �0.230002 F2 2615.02 2614.26 2614.24 95 2614.26 �0.76 0.00 0.020002 E 2625.47 2624.75 2624.73 97 2624.62 �0.85 �0.13 �0.110101 F2 2831.29 2830.64 2830.59 91 2830.32 �0.97 �0.32 �0.270101 F1 2846.78 2846.09 2846.05 97 2846.07 �0.71 �0.02 0.021000 A1 2917.03 2916.52 2916.47 78 2916.48 �0.55 �0.04 0.010010 F2 3020.01 3019.51 3019.47 83 3019.49 �0.52 �0.02 0.020200 A1 3064.50 3063.83 3063.81 95 3063.65 �0.85 �0.18 �0.160200 E 3065.83 3065.18 3065.17 96 3065.14 �0.69 �0.04 �0.03
P3 0003 F2(1) 3872.83 3871.17 3870.93 48 3870.49 �2.34 �0.68 �0.440003 A1 3911.06 3909.43 3909.21 89 3909.20 �1.86 �0.23 �0.010003 F1 3922.14 3920.82 3920.65 93 3920.51 �1.63 �0.31 �0.140003 F2(2) 3932.61 3931.39 3931.22 54 3930.92 �1.69 �0.47 �0.300102 E(1) 4103.57 4102.13 4101.95 74 4101.39 �2.18 �0.74 �0.560102 F1 4130.68 4129.32 4129.15 86 4128.76 �1.92 �0.56 �0.390102 A1 4134.99 4133.78 4133.62 86 4132.86 �2.13 �0.92 �0.760102 F2 4144.49 4143.24 4143.07 91 4142.86 �1.63 �0.38 �0.210102 E(2) 4152.76 4151.65 4151.50 82 4151.21 �1.55 �0.44 �0.290102 A2 4163.25 4162.19 4162.04 97 4161.84 �1.41 �0.35 �0.211001 F2 4225.36 4223.36 4223.21 77 4223.46 �1.90 0.10 0.200011 F2 4321.24 4319.20 4319.06 83 4319.21 �2.03 0.01 0.150011 F1 4323.80 4321.92 4321.79 81 4322.18 �1.62 0.26 0.390011 E 4324.03 4322.16 4322.03 80 4322.59 �1.44 0.43 0.560011 A1 4325.07 4323.08 4322.92 75 4322.70 �2.37 �0.38 �0.220201 F2(1) 4350.81 4349.57 4349.41 43 4348.72 �2.09 �0.85 �0.690201 F1 4365.26 4364.14 4363.99 90 4363.61 �1.65 �0.53 �0.380201 F2(2) 4380.37 4379.30 4379.15 49 4378.95 �1.42 �0.35 �0.201100 E 4437.04 4435.11 4434.96 78 4435.12 �1.92 0.01 0.160110 F1 4539.34 4537.45 4537.30 82 4537.55 �1.79 0.10 0.250110 F2 4545.63 4543.76 4543.61 78 4543.76 �1.87 0.00 0.150300 E 4593.79 4592.67 4592.51 94 4592.03 �1.76 �0.64 �0.480300 A2 4596.53 4595.55 4595.41 96 4595.27 �1.26 �0.28 �0.140300 A1 4596.84 4595.84 4595.70 96 4595.51 �1.33 �0.33 �0.19
rmsc 1.5 0.4 0.3rmsc 5.4 1.2 0.8
a The major normal-mode contribution (in %) for the F(12) basis. b O-F(i): observed minus calculated from NRT PES, no VSS shifts being appliedhere. c Root-mean-squares for Obs-Ev [F(i)] for energy levels up to the third (P3: octad) and fourth (P4: tetradecad) polyads. The total number ofvibrational sublevels is 35 up to P3 and 95 up to P4.
Paper PCCP
Dow
nloa
ded
by U
nive
rsity
of
Ari
zona
on
05/0
5/20
13 1
5:37
:51.
Pu
blis
hed
on 1
2 A
pril
2013
on
http
://pu
bs.r
sc.o
rg |
doi:1
0.10
39/C
3CP5
0275
AView Article Online

This journal is c the Owner Societies 2013 Phys. Chem. Chem. Phys.
applying the VSS compression. An example of the convergenceof ro-vibrational levels versus the VSS cutoff Emax for theF(7) ’ F(12) reduction is given in Table 2 for J = 10 levelsand two-, three- and four-quanta bands.
4 Line strength calculations
Infrared line intensities Sif of rovibrational transitions nif for agiven temperature T are given, in HITRAN units, by
Sif
1036¼ 8p3
3hcQðTÞI0gCinif e�c2Ei=T 1� e�c2nif =T
� ��Rif (12)
where c2 = hc/k, gCiand Ei are the nuclear spin statistical weight
and the energy of the lower state. In the case of 12CH4, I0 =0.988247 is the terrestrial isotopic abundance and gA1
= gA2= 5,
gE = 2, gF1= gF2
= 3. Q(T) is the partition function taken fromHITRAN2008 (ref. 51) and Rif is the square transition-moment matrix
Rif � RJi ;JsCi ;Cs
¼XMi ;Ms
CðJi ;CiÞMi ;si msY
CðJs;CsÞMs;ss
D E 2 (13)
where the summation is over all magnetic sublevels of bothinitial and final states. The rovibrational eigenfunction matrixC = U/ is obtained in the step (iv) of Section 3. In eqn (13), ms
Y
(Y = X, Y, Z) are the space-fixed electric dipole momentcomponents computed from the molecule-fixed Eckart framecomponents mm
y (y = x, y, z). Due to the isotropy of the 3D space,we only need to consider the ms
Z component so that we haveRif = 3RZ
if. The dipole moment components mmy have to be
properly computed in the Eckart frame. For this work, we useour recent NRT DMS37 which has been constructed usingextended ab initio CCSD(T) calculations with the CVQZ electro-nic basis set at 19 882 nuclear configurations. Originally, theDMS analytical representation was determined through anexpansion in symmetry-adapted products of internal nonlinearcoordinates involving 967 parameters up to the 6th order. Forintensity calculations, we have expressed mm
z in normal coordi-nates from the same set q than that used for the NRTpotential.34 The x and y components were deduced by symme-try. To be consistent with our Hamiltonian formulation, we alsoexploit the full Td symmetry for the dipole moment operatorswhich transform as F2 for mm and A2 for ms. Similarly to eqn (2),
the TENSOR code was used to convert the molecule-fixedmmy components to
mmy ðqÞ ! mmy ðaþ; aÞ � mðF2Þy ¼Xfig
mfigþVðF2Þy : (14)
The dipole moments mm being a polar vector, it transformsaccording to the irreducible representation D(1u) of the O(3)rotation group. As for the rotational functions, the parity of thedirection cosine is chosen to be g.38 Thus, molecule-fixed andspace-fixed components are related with ITOs as
msZ ¼Xk
Dð1gÞ0k mð1uÞk ¼
ffiffiffi3p
Cð1g;F1Þ � mðF2Þ� �ðA2Þ
; (15)
here Dð1gÞ0k ¼ ð�1ÞkCð1gÞ�k and C is the direction cosine tensor.38
The matrix elements (13) can be then computed using theWigner–Eckart theorem adapted to Td and are expressedfrom (10)
fi msZ
fs
� �¼
ffiffiffi3p
Ci½ 1=2F1 Cr C0r
F2 Cv C0v
A2 C C0
8>>><>>>:
9>>>=>>>;
� ð�1ÞJiK1 Js Ji
F1 nCr n0C0r
!
� C0v k V ðF2Þ k Cv
� �Ji;Mi k Cð1Þ k Js;Ms
� �:
(16)
Here {� � �} is a 9C recoupling symbol and K are isoscalar factorsfor the group chain O(3) * Td. The vibrational reduced matrixelements (� � �J� � �J� � �) are given in ref. 41. Since the summationin (13) only involves the direction cosines C, it can be furthersimplified using orthogonality relations for 3J symbols asP
Mi ;MsJi;MijjCð1ÞjjJs;Ms
� � 2 ¼ ð2Ji þ 1Þð2Js þ 1Þ.3. In order
to check the convergence of intensity calculations, we havecompared the intensities computed from F(6), F(7), F(8) andF(9) vibrational bases. As an illustration, we give in Table 3 therms errors for line positions and intensities for all Js = 3 ’ Ji = 3transitions up to the tetradecad region by taking theresults obtained from F(9) as reference values. Large discrepan-cies may appear with F(6), especially for weakest lines B10�27–10�24 cm mol�1 which are very sensible to resonances.
5 Comparison with empirical databases andwith experimental spectra
Due to their importance for atmospheric, planetology andastrophysical applications,4–7 methane high-resolution spectrahave been intensively studied both in terms of experimentalmeasurements10,53,54,57,58 and line-by-line analyses8–11 for severaldecades. There are several sources of methane data essentially basedon measurements and their extrapolations. TDS59 and STDS56
databases provided calculated data based on accurate fits of experi-mental lines resulted from very thorough line-by-line analyses.
Table 2 Convergence of the rovibrational energy levels for the block (J,C) =(10,F1) and error in the VSS procedure for different vibrational cutoff Emax (seetext). The F(7) ’ F(12) reduction was used for the basis
Cutoff Emax Basis size
Level: v1v2v3v4(J, nCr)
0002(10,2F2) 1002(10,0F1) 0004(10,1F1)
11 300 7246 3113.071 6054.439 5692.48712 000 9868 3113.070 6054.409 5692.37313 200 17 469 3113.054 6054.115 5692.053N 29 904 3113.052 6054.060 5691.928
PCCP Paper
Dow
nloa
ded
by U
nive
rsity
of
Ari
zona
on
05/0
5/20
13 1
5:37
:51.
Pu
blis
hed
on 1
2 A
pril
2013
on
http
://pu
bs.r
sc.o
rg |
doi:1
0.10
39/C
3CP5
0275
AView Article Online

Phys. Chem. Chem. Phys. This journal is c the Owner Societies 2013
In this sense, these are empirical linelists, which are by con-struction as close as possible to the true experimental data inthe well-studied ranges. They also contain some extrapolationsusing effective spectroscopic models and empirically fittedparameters. The advantage of this kind of data is that theyare assigned in terms of vibrational polyads, rotational Jquantum number and symmetry types of the states involved;normal mode quantum numbers being also given. Howeverthey are only available up to the tetradecad range whose currentfit is not yet fully satisfactory. Some of these data are currentlyaccessible via the Virtual Atomic and Molecular Data Center(VAMDC) interface,60 most of contributions for assignmentsand spectroscopic modeling coming from Dijon, Tomsk andReims groups.8,10,11,41–43,56,58,59 The largest sample of methanedata is included in the HITRAN2008 and GEISA databases51,61
which contain a mixture of empirical linelists (in the sensedefined above) and of raw experimental lines. By now, themajority of HITRAN2008 data above 6000 cm�1 correspond toraw unassigned experimental lines.
To validate our results, all our calculations were comparedfirst to HITRAN2008 at T = 296 K. Fig. 1 – which gives the bird’seye overview comparison in the large range from 0 to 9300 cm�1 –shows an excellent qualitative agreement of our ab initiospectrum with available empirical data. All our lines in thisfigure are direct variational calculations from NRT PES andDMS without any VSS corrections. Anyway, these band centercorrections which are of the order of one wavenumber or belowwould not be visible at the scale of Fig. 1. Our calculationscontain four times more lines as for example many weaktransitions which are actually missing in HITRAN2008 at highwavenumber ranges.
The integrated band intensityP
Sij for the rotation spectrum(0–150 cm�1 range, J r 14) within the vibration ground state(GS) has 2.5% of difference with HITRAN2008 and 7% withrecent perturbative calculations of Cassam-Chenaı and Levin.20
For the polyad P1 (dyad: n2/n4 bands in the 1000–2000 cm�1
range) the HITRAN2008 is known to be very accurate thanks tothe precise fit of Champion et al.8 and we have a good agree-ment of 3% for the integrated intensity which is close to the
experimental accuracy. For a more detailed intensity comparison inhigher wavenumber ranges, we have applied the band center shiftsusing the VSS technique via eqn (8). This does not change thequalitative spectra patterns in the scale of the polyads, but allowbetter matching of lines when the bands are blown up as in Fig. 2.This figure corresponds mainly to the polyad P2 (pentad: n1/n3/2n2/n2 + n4/2n4 bands in the 2000–3400 cm�1 range) where the rmsdeviation for the VSS band center corrections defined by the lastcolumn of Table 1 is 0.1 cm�1 only. The integrated polyad intensitydeviation from HITRAN2008 is of 1% in this range.
The following polyad P3 (octad: 8 bands in the 3400–4900 cm�1
range, see Table 1) has been studied experimentally by Albert et al.9
and recently further improved by Daumont et al.58 An example ofcomparison of calculated strong lines with HITRAN2008 is givenin Table 4. The integrated polyad intensity deviation fromHITRAN2008 is of 3.5% in this range.
The line-by-line analyses of the following polyad P4 (tetradecad:14 bands in the 4900–6300 cm�1 range, see Table 6 of ref. 33) aremuch less advanced and numerous sub-band positions are not yet
Table 3 Convergencea of line positions and intensities using F(6), F(7), F(8) andF(9) basis sets for 3 ’ 3-type transitions o6200 cm�1 and Einf o 3000 cm�1
nij range(Sij Z 10�25 cm mol�1) cm�1
F(9)–F(8)cm�1
F(9)–F(7)cm�1
F(9)–F(6)cm�1
r3000 3.5 � 10�4 3.5 � 10�3 2.4 � 10�2
r4600 2.6 � 10�3 1.4 � 10�2 6.0 � 10�2
r6200 3.3 � 10�3 1.9 � 10�2 7.8 � 10�2
Sij range(nij r6200 cm�1)cm mol�1
100ðFð9Þ � Fð8ÞÞFð9Þ %
100ðFð9Þ � Fð7ÞÞFð9Þ %
100ðFð9Þ � Fð6ÞÞFð9Þ %
Z10�22 0.03 0.1 0.5Z10�23 0.06 0.2 1.0Z10�24 0.2 0.6 2.8Z10�25 0.3 1.0 4.2
a RMS errors are given from F(9) calculations taken as benchmarks.
Fig. 1 Overview comparison for the stick spectrum of methane from 0 to9300 cm�1, between first principles calculation (841 000 lines with Icutoff =10�27 cm mol�1, Jmax = 25, Elow o 3000 cm�1) using ab initio DMS37 andHITRAN2008 empirical database (212 000 lines) on a log scale. Intensities are inHITRAN units and given at T = 296 K.
Paper PCCP
Dow
nloa
ded
by U
nive
rsity
of
Ari
zona
on
05/0
5/20
13 1
5:37
:51.
Pu
blis
hed
on 1
2 A
pril
2013
on
http
://pu
bs.r
sc.o
rg |
doi:1
0.10
39/C
3CP5
0275
AView Article Online

This journal is c the Owner Societies 2013 Phys. Chem. Chem. Phys.
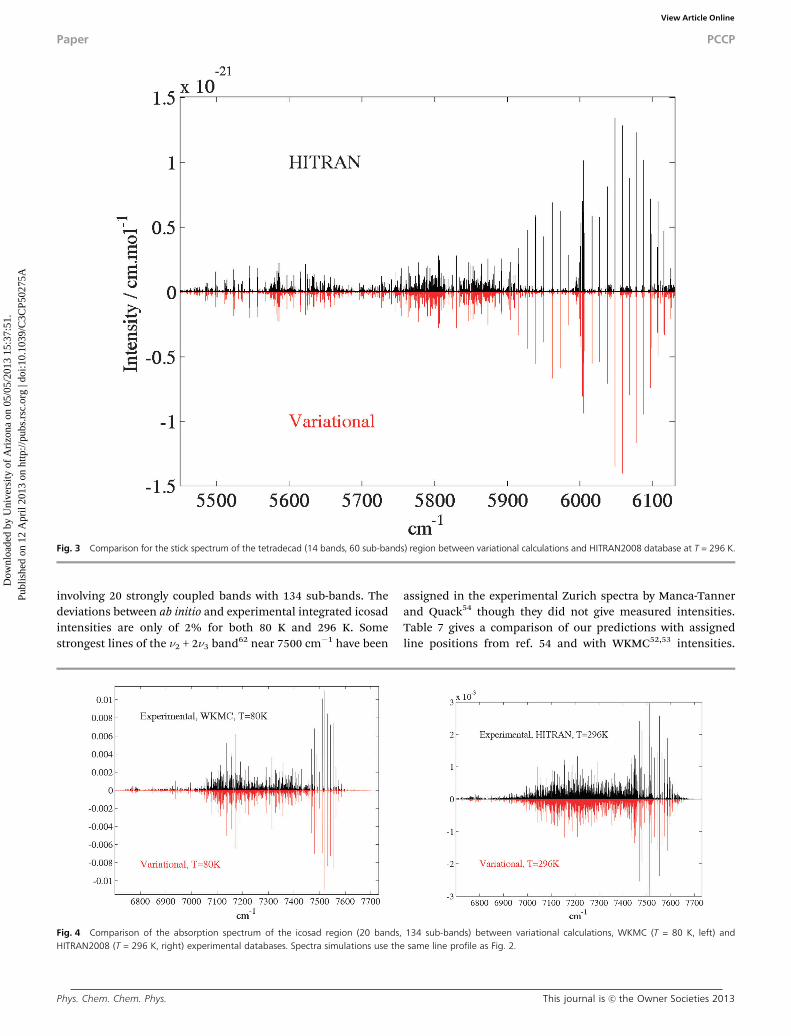
experimentally determined. However our predictions are very con-sistent with HITRAN2008 data both qualitatively (Fig. 3) and evenquantitatively, at least for strong bands (see Table 4).
In the range of P5 (icosad: 20 bands, 6300–7900 cm�1) veryfew assignments are available. Recently, very accurate andcomplete WKMC linelists have been obtained from two-temperature
laser measurements at 296 K and at 80 K in the Grenoble group ofCampargue and co-workers.52,53 Most of lines of these lists remainunassigned except for 5n4 sub-bands at the lower edge of theisocad.11 The comparison of our predictions in Fig. 4 gives excellentglobal agreement with observations both for cold and roomtemperature spectra in this extremely complicated range
Fig. 2 Comparison of the spectrum in the pentad region between variational calculations and HITRAN2008 database at T = 296 K. Two portions computed with a line profileat a resolution of 0.001 cm�1 correspond to the band center shifts in the VSS procedure by 0.02 cm�1 (top) and �0.03 cm�1 (bottom) as given in the last column of Table 1.
Table 4 Comparisona of 12CH4 line positions (nij, cm�1) and line intensities (Sij, cm mol�1) with HITRAN2008 (ref. 51) (denoted HT here) for strong lines in the pentadregion at T = 296 K
nij NRT PES(this work) nij HT
Sij NRT DMS(this work) Sij HT Upper JiCi JsCs
EvJ upp(this work) EvJ upp HT
Dn calc.errors SHT/SDMS
2712.116 2712.136 1.57 � 10�21 1.66 � 10�21 0101F2 8A1 7A2 3088.885 3088.866 �0.021 1.0552726.629 2726.608 1.78 � 10�21 1.88 � 10�21 0101F2 7A2 6A1 3019.778 3019.762 �0.022 1.0562726.665 2726.645 1.26 � 10�21 1.33 � 10�21 0101F2 7F1 6F2 3019.784 3019.768 �0.020 1.0562726.936 2726.910 1.04 � 10�21 1.10 � 10�21 0101F2 7F1 6F2 3020.111 3020.089 �0.026 1.0562741.469 2741.449 1.05 � 10�21 1.11 � 10�21 0101F2 6E 5E 2961.380 2961.362 �0.020 1.0533118.553 3118.545 1.36 � 10�21 1.34 � 10�21 0010F2 9F2 10F1 3589.266 3589.265 �0.008 0.9873118.647 3118.639 1.22 � 10�21 1.21 � 10�21 0010F2 9F1 10F2 3589.357 3589.356 �0.008 0.9863122.248 3122.258 2.89 � 10�20 2.86 � 10�20 0010F2 10F2 11F1 3697.525 3697.543 �0.010 0.9883122.275 3122.285 1.93 � 10�20 1.91 � 10�20 0010F2 10E 11E 3697.538 3697.557 �0.010 0.9883122.286 3122.296 2.42 � 10�20 2.38 � 10�20 0010F2 10F1 11F2 3697.537 3697.556 �0.010 0.983
a Variational calculations are carried out from our recent NRT PES34 and DMS.37 In the VSS procedure, the n2 + n4(F2) sub-band center was shiftedby �0.27 cm�1 and the n3(F2) sub-band center by 0.02 cm�1.
PCCP Paper
Dow
nloa
ded
by U
nive
rsity
of
Ari
zona
on
05/0
5/20
13 1
5:37
:51.
Pu
blis
hed
on 1
2 A
pril
2013
on
http
://pu
bs.r
sc.o
rg |
doi:1
0.10
39/C
3CP5
0275
AView Article Online
Phys. Chem. Chem. Phys. This journal is c the Owner Societies 2013
involving 20 strongly coupled bands with 134 sub-bands. Thedeviations between ab initio and experimental integrated icosadintensities are only of 2% for both 80 K and 296 K. Somestrongest lines of the n2 + 2n3 band62 near 7500 cm�1 have been
assigned in the experimental Zurich spectra by Manca-Tannerand Quack54 though they did not give measured intensities.Table 7 gives a comparison of our predictions with assignedline positions from ref. 54 and with WKMC52,53 intensities.
Fig. 3 Comparison for the stick spectrum of the tetradecad (14 bands, 60 sub-bands) region between variational calculations and HITRAN2008 database at T = 296 K.
Fig. 4 Comparison of the absorption spectrum of the icosad region (20 bands, 134 sub-bands) between variational calculations, WKMC (T = 80 K, left) andHITRAN2008 (T = 296 K, right) experimental databases. Spectra simulations use the same line profile as Fig. 2.
Paper PCCP
Dow
nloa
ded
by U
nive
rsity
of
Ari
zona
on
05/0
5/20
13 1
5:37
:51.
Pu
blis
hed
on 1
2 A
pril
2013
on
http
://pu
bs.r
sc.o
rg |
doi:1
0.10
39/C
3CP5
0275
AView Article Online

This journal is c the Owner Societies 2013 Phys. Chem. Chem. Phys.
Table 8, which summarizes the integrated intensities for indi-vidual bands of lower polyads, shows a good agreement notonly for strong bands but also for weak bands. This suggeststhat the intensity transfer due to resonance interactions withinthe polyads is correctly described at least in these ranges.More detailed work is necessary for the band-by-band analysesat higher ranges as this requires a full assignment ofmany weak transitions. The accuracy of rovibrational levelsdirectly calculated from the NRT PES can be assessed byadding the band center shifts to the ‘‘calc. Errors’’ column ofTables 4–6.
6 Isotopic effects due to CH4 - CD4
substitution
To validate the method, it is instructive to consider an isotopiceffect in a spectrum of a methane isotopologue. We focus hereon 12CD4 where the same tetrahedral symmetry is kept but theisotopic effects are very pronounced due to the strong H - Dsubstitution. For this work we have transformed the NRT PES34
U(R) to a 14th order mass-dependent normal mode potentialwhere a set of q for 12CD4 was derived. All the step describedabove was applied to finally obtain the Hamiltonian (2). To be
consistent the isotopic shifts D which are directly deduced fromvariationally computed energy levels are obtained using thesame F(12) basis and the same 14 - 6 reduction scheme forboth 12CH4 and 12CD4. In Table 9 we give the J = 0 energy levelsfor 12CD4 (second column) so that we can deduce the shift D(third column) for each vibrational sub-band from levels inTable 1 (fifth column). Finally, we can apply the shift D to theobserved band centers of the main isotopologue 12CH4 andthus deduce the variationally computed band centers predictedfor 12CD4 (see 4th column of Table 9), obtained as Obs(12CH4) +D(12CH4 -
12CD4). Since there exists only a few number of datafor this molecule,55,63 we give in Table 9 only the computedband centers for selected levels up to the octad. We havedirectly compared our predicted values for the J = 0 bandcenters to the STDS56 database taken as a benchmark for levelsup to the pentad (Ev o 3100 cm�1). The agreement is quite goodup to the pentad (5th column of Table 9) and one may thusexpect results in the same order of accuracy for the octad rangeand higher. Concerning the intensity calculations, we havetransformed the CVQZ 6th order DMS for 12CH4 in the normalmode coordinate representation q(12CD4). For this, the key pointconsists in starting from the expression m1/2x = lq relating themass-weighted Cartesian displacement d to a set normal coordi-nates through the l matrix. After some matrix multiplication the
Table 5 Comparisona of 12CH4 line positions (nij, cm�1) and line intensities (Sij, cm mol�1) with HITRAN2008 (ref. 51) (denoted HT here) for strong lines in the octadregion at T = 296 K
nij NRT PES(this work) nij HT
Sij NRT DMS(this work) Sij HT Upper JiCi JsCs
EvJ upp(this work) EvJ upp HT
Dn calc.errors SHT/SDMS
4152.750 4152.613 1.62 � 10�21 1.62 � 10�21 1001F2 10A1 9A2 4727.964 4727.836 �0.138 0.9954156.991 4156.886 1.51 � 10�21 1.50 � 10�21 1001F2 10A2 9A1 4732.038 4731.942 �0.105 0.9924162.749 4162.689 1.03 � 10�21 1.04 � 10�21 1001F2 9F1 8F2 4633.547 4633.494 �0.060 1.0104206.659 4206.647 1.43 � 10�21 1.39 � 10�21 0011F2 7F1 6F2 4499.833 4499.826 �0.012 0.9714207.207 4207.195 1.19 � 10�21 1.21 � 10�21 0011F2 7F2 6F1 4500.367 4500.360 �0.012 1.0164207.203 4207.205 1.23 � 10�21 1.25 � 10�21 1001F2 2F2 1F1 4238.645 4238.647 0.001 1.0164421.373 4421.400 3.83 � 10�21 3.83 � 10�21 0011F2 6A2 7A1 4641.290 4641.320 0.027 0.9974443.328 4443.328 1.16 � 10�21 1.14 � 10�21 0011F2 8F1 9F2 4820.004 4820.133 0.122 0.9874449.674 4449.853 1.05 � 10�21 1.12 � 10�21 0011F1 9A2 10A1 4920.540 4920.726 0.179 1.0664456.228 4456.318 1.03 � 10�21 1.08 � 10�21 0011F2 9A2 10A1 4927.095 4927.191 �0.090 1.042
a Variational calculations are carried out from our recent NRT PES34 and DMS.37 In the VSS procedure, the n1 + n4(F2) sub-band center was shiftedby 0.2 cm�1 and the n3 + n4(F2) sub-band center by 0.15 cm�1.
Table 6 Comparisona of 12CH4 line positions (nij, cm�1) and line intensities (Sij, cm mol�1) with HITRAN200851 (denoted HT here) for strong lines in the tetradecadregion at T = 296 K
nij NRT PES(this work) nij HT
Sij NRT DMS(this work) Sij HT Upper JiCi JsCs
EvJ upp(this work) EvJ upp HT
Dn calc.errors SHT/SDMS
5914.844 5914.752 3.38 � 10�22 3.32 � 10�22 0020F2 8A1 7A2 6291.569 6291.482 �0.092 0.9825914.870 5915.046 1.36 � 10�22 1.47 � 10�22 0020F2 8E 7E 6291.600 6291.782 0.176 1.0805972.112 5972.096 3.62 � 10�22 4.02 � 10�22 0020F2 3F1 2F2 6034.987 6034.972 �0.016 1.1126001.747 6001.675 6.21 � 10�22 6.39 � 10�22 0020F2 7A2 7A1 6295.019 6294.829 �0.072 1.0296004.866 6004.863 3.06 � 10�22 3.14 � 10�22 0020F2 1F1 1F2 6015.348 6015.345 �0.003 1.0266015.666 6015.664 5.53 � 10�22 5.81 � 10�22 0020F2 0A1 1A2 6015.666 6015.664 �0.002 1.0506026.233 6026.227 5.43 � 10�22 5.72 � 10�22 0020F2 1F1 2F2 6036.715 6036.709 �0.006 1.0506046.972 6046.942 8.10 � 10�22 8.29 � 10�22 0020F2 3F2 4F1 6109.849 6109.819 �0.031 1.0236086.697 6086.799 5.76 � 10�22 6.03 � 10�22 0020F2 7E 8E 6379.819 6379.969 �0.082 1.0476096.256 6096.424 4.43 � 10�22 4.62 � 10�22 0020F2 8F1 9F2 6472.984 6473.158 �0.168 1.043
a Variational calculations are carried out from our recent NRT PES34 and DMS.37 In the VSS procedure, the 2n3(F2) sub-band center was shifted by0.06 cm�1.
PCCP Paper
Dow
nloa
ded
by U
nive
rsity
of
Ari
zona
on
05/0
5/20
13 1
5:37
:51.
Pu
blis
hed
on 1
2 A
pril
2013
on
http
://pu
bs.r
sc.o
rg |
doi:1
0.10
39/C
3CP5
0275
AView Article Online

Phys. Chem. Chem. Phys. This journal is c the Owner Societies 2013
transformation from q(12CH4) to q(12CD4) relating the ninecoordinates associated with A1, E and F2 is given by
qH ¼
a 0 0 0 0 0 0 0 00 a 0 0 0 0 0 0 00 0 a 0 0 0 0 0 00 0 0 b 0 0 c 0 00 0 0 0 b 0 0 c 00 0 0 0 0 b 0 0 c0 0 0 d 0 0 e 0 00 0 0 0 d 0 0 e 00 0 0 0 0 d 0 0 e
0BBBBBBBBBBBB@
1CCCCCCCCCCCCAqD (17)
where the coefficients are a = 0.84106, b = 0.85893, c = 0.03290,d = �0.07654 and e = 0.86806. From this, we can derive thedipole moment tensor operators (14) and compute the dipoletransition intensities. As an illustration, we have compared inFig. 5 the spectrum of the dyad obtained from variationalcalculations with the TDS database.59 The band centers wereshifted to our predicted values (4th column of Table 9). Ourvariationally computed spectrum is in good agreement with theobserved data. We could slightly improve the calculations byshifting the band centers to the observed ones (5th column ofTable 9). In this figure, we also give the theoretical prediction ofthe spectrum in the octad range at room temperature for J r 15.This method was recently applied to characterize the effect of the12C - 13C isotopic substitution for line positions and lineintensities in 13CH4 spectra up to the octad range.64 Theisotopic shifts of 13CH4 band centers were predicted64 up tothe tetradecad range.
7 Discussion and conclusion
The primary purpose of this work was to obtain a qualitativelycorrect description of complex structures of methane rovibrational
Table 7 Comparisona of 12CH4 line positions (nij, cm�1) and line intensities(Sij, cm mol�1) with WKMC52,53 (W) and recent work of Manca-Tanner andQuack54 for the n2 + 2n3 band of the icosad at T = 80 K
JiCi JsCs
nij
(this work)Sij (� 10�22)(this work)
nij ref. 53and 54
Sij (� 10�22)ref. 52 and 53 SW/SDMS
1F1 1F2 7510.26 2.89 7510.29 3.04 1.052F2 2F1 7510.18 2.88 7510.19 3.03 1.053F1 3F2 7509.97 2.09 7509.97 2.15 1.033F2 3F1 7510.06 2.04 7510.06 2.08 1.020A1 1A2 7520.84 5.70 7520.86 6.03 1.061F1 2F2 7531.42 4.32 7531.42 4.57 1.062E 3E 7542.10 2.52 7542.08 2.66 1.042F2 3F1 7542.08 3.71 7542.06 3.84 1.033F1 4F2 7552.92 2.30 7552.88 2.23 0.973F2 4F2 7552.85 2.56 7552.81 2.51 0.983A2 4A1 7552.78 4.44 7552.74 4.03 0.914A1 5A2 7564.02 1.51 7563.94 1.37 0.914E 5E 7563.76 0.92 7563.68 0.89 0.974F1 5F2 7563.84 1.23 7563.76 1.16 0.944F2 5F1 7563.65 1.43 7563.56 1.36 0.95
a Variational calculations are carried out from our recent NRT PES34
and DMS.37 In the VSS procedure, the n2 + 2n3(F2) sub-band center wasshifted by 0.37 cm�1.
Table 8 Integrated intensities (cm mol�1) for some selected bands ofmethane from HITRAN2008 and from first-principles predictions (this work) forintensities Z10�28 cm mol�1
BandP
Sij HITRAN #LinesP
Sij this work #Lines
)GS–GS 2.23 � 10�23 400 2.16 � 10�23 400n2 5.36 � 10�20 2733 5.45 � 10�20 2525n4 5.10 � 10�18 4077 5.27 � 10�18 3818)Dyad–GS 5.15 � 10�18 6810 5.32 � 10�18 63432n2 3.15 � 10�20 3784 3.28 � 10�20 35942n4 5.51 � 10�20 7077 6.01 � 10�20 6747n2 + n4 3.73 � 10�19 8069 3.61 � 10�19 7142n1 1.91 � 10�21 1378 2.32 � 10�21 1617n3 1.08 � 10�17 4304 1.09 � 10�17 3984)Pentad–GS 1.13 � 10�17 24 612 1.14 � 10�17 23 084n2 � n2 1.12 � 10�26 60 0.98 � 10�26 55n4 � n4 2.15 � 10�23 1832 2.50 � 10�23 1506n2 � n4 8.23 � 10�24 1742 3.71 � 10�24 1327)Dyad–dyad 2.97 � 10�23 3634 2.88 � 10�23 28882n2 � n2 1.07 � 10�22 2232 0.99 � 10�22 19282n2 � n4 1.96 � 10�23 1135 2.05 � 10�23 22602n4 � n2 2.38 � 10�24 679 3.49 � 10�24 20882n4 � n4 3.76 � 10�20 8869 3.79 � 10�20 8441n2 + n4 � n2 5.83 � 10�21 6443 5.86 � 10�21 4510n2 + n4 � n4 3.49 � 10�22 6381 3.43 � 10�22 7680n1 � n2 3.64 � 10�23 919 2.94 � 10�23 735n1 � n4 2.81 � 10�23 767 2.89 � 10�23 1249n3 � n2 3.51 � 10�22 2542 3.35 � 10�22 2136n3 � n4 1.94 � 10�21 5805 1.94 � 10�21 4867)Pentad–dyad 4.62 � 10�20 35 772 4.65 � 10�20 35 894
Table 9 Vibrational shifts D for 12CD4 and variationally-computed predictions(all in cm�1) of the band centers compared to empirical values fitted to observed data
StateEv (PES)12CD4 D
Pred (12CD4)12CH4 Obsa + D
Emp. ref. 55and 56
0001F2 997.69 �313.05 997.71 997.870100E 1091.63 �441.67 1091.67 1091.650002A1 1965.19 �622.08 1964.96 1965.200002F2 1990.11 �624.13 1990.13 1990.47b
0002E 1996.55 �628.19 1996.43 1996.830101F2 2083.34 �747.27 2083.04 2083.40b
0101F1 2090.67 �755.42 2090.67 2090.881000A1 2101.33 �815.15 2101.33 2101.38b
0010F2 2260.10 �759.38 2260.11 2260.08b
0200A1 2182.20 �881.62 2182.04 2182.160200E 2182.54 �882.63 2182.52 2182.580003F2(1) 2942.61 �928.33 2942.150003A1 2976.24 �932.99 2976.210003F1 2983.42 �937.24 2983.270003F2(2) 2989.56 �941.67 2989.240102E(1) 3049.05 �1052.92 3048.490102F1 3073.87 �1055.29 3073.470102A1 3077.45 �1056.18 3076.680102F2 3079.99 �1063.09 3079.770102E(2) 3084.55 �1066.97 3084.250102A2 3090.82 �1071.23 3090.611001F2 3103.47 �1119.76 3103.700011F2 3252.63 �1066.45 3252.770011F1 3250.82 �1070.98 3251.200011E 3253.07 �1068.98 3253.610011A1 3254.09 �1068.85 3253.850201F2(1) 3168.35 �1181.07 3167.640201F1 3175.47 �1188.53 3175.070201F2(2) 3182.68 �1196.49 3182.471100E 3186.03 �1248.95 3186.160110F1 3343.14 �1194.19 3343.370110F2 3346.16 �1197.48 3346.280300E 3271.93 �1320.59 3271.450300A2 3272.70 �1322.74 3272.550300A1 3272.82 �1322.89 3272.62
a See Table 2 for the observed data of 12CH4. b Values fixed to observeddata of ref. 55.
Paper PCCP
Dow
nloa
ded
by U
nive
rsity
of
Ari
zona
on
05/0
5/20
13 1
5:37
:51.
Pu
blis
hed
on 1
2 A
pril
2013
on
http
://pu
bs.r
sc.o
rg |
doi:1
0.10
39/C
3CP5
0275
AView Article Online

This journal is c the Owner Societies 2013 Phys. Chem. Chem. Phys.
bands in a large infrared range from first principles intensitypredictions. This study also aims at validating a very recentab initio NRT dipole moment surface.37 For triatomics, it is a quitecommon practice to generate ab initio intensities with empiricalcorrections for line positions calculated as a difference betweenupper and lower levels.26 Here we apply corrections to the bandshifts only, using the VSS technique outlined in Section 3. As theresults for line strength calculations depend both on the quality ofthe vibration–rotation eigenfunctions and of the DMS, the first stepwas focused on the accurate determination of C. The vibrationalwavefunctions were directly computed from our PES together withthe vibrational levels Ev using the variational technique describedin the previous paper33 and the largest accessible basis set. Theresults are checked via basis convergence tests and via the compar-ison with an independent method34 that uses an exact kineticenergy operator in internal coordinates without Taylor expansions.Then the shifts were applied to Ev in eqn (8) for the bands whose
centers had been experimentally determined. These correctionsvary in average from 0.05 to 0.3 cm�1 up to the octad range (see thelast column in Table 1) and increase to about one wavenumber forhigher ranges (see Table 6 of ref. 33). They do not changesignificantly the qualitative patterns of spectra on the polyad scale(Fig. 1–4) but help a better matching of experimental and calculatedrovibrational transitions. Both the vibration wavefunctions and thero-vibrational Hrv matrix in the last part of eqn (8) are computedfrom PES and are not affected by these shifts. However ro-vibrationeigenfunctions could be slightly improved as this allowsminimizing possible errors due to localized accidental resonances.No empirical corrections were applied to the DMS. Fig. 1–4 andTables 4–8 show a very good global agreement between ourvariational calculations using the techniques described above andavailable empirical data in a large spectral range, at least for strongand medium lines as well as for integrated polyad intensities. Toour knowledge, this quality of agreement is achieved for the firsttime for five-atomic molecules. The correct predictions for isotopiceffects in the spectra under the CH4 - CD4 substitution(see Section 6) confirm the validity of the present approach. Thehigher polyads of methane have very dense and complicatedpatterns due to numerous interacting vibrational sublevels. Duringmore than 30 years, line-by-line analyses provided quite completemodeling up to the octad range9,58 (o4900 cm�1) and with lessextent for the tetradecad range. A full assignment and matchingwith experimental lines of hundreds of thousands of weak pre-dicted transitions on the entire scale of Fig. 1 and above could thustake some time. Only about 30% of lines have been assigned up tonow in the tetradecad range, only the very low edge (5n4 bandsystem11 in the 6400–6500 cm�1 region) of the icosad has beenassigned to few lines54,62 around 7500 cm�1 while no assignmentsare available in between and above. The overall labeling of the veryhighly excited rovibrational states becomes almost intractableusing effective pure empirical models. The first step towardsubstantial improvements would be to consider our variationalpredictions as a good starting point. Effective models could thusserve to refine analyses. Poorly assigned weak transitions are notnegligible as they are very important on long optical paths, inparticular in so called transparency windows of planetary atmo-spheres.6 Note that a good agreement for integrated intensity of thehot bands in the second panel of Table 8 suggests that thisapproach should be applicable for high temperature predictions.The latter ones are expected to be important for understandingmethane signatures in brown dwarfs and exoplanets.1–4 Furtherprogress for the description of methane absorption/emission andfor applications under various conditions could benefit from alarge collaboration of spectroscopists, theoretical chemists, specia-lists in the atmospheric modeling and of astrophysicists.
Acknowledgements
We acknowledge the support from ANR CH4@Titan grant(Ref: BLAN08-2-321467), from LEFE-CHAT CNRS, from IDRIS com-puter centre of CNRS, and CINES computer centre of France aswell as the Clovis computer centre Reims-Champagne-Ardenne.
Fig. 5 Comparison for the stick spectrum (top) of the dyad region (2 bands, 2sub-bands) between variational calculations and experiment59 for 12CD4 at roomtemperature. Prediction (bottom) of the spectrum for the octad region (8 bands,24 sub-bands) for J r 15 is also given.
PCCP Paper
Dow
nloa
ded
by U
nive
rsity
of
Ari
zona
on
05/0
5/20
13 1
5:37
:51.
Pu
blis
hed
on 1
2 A
pril
2013
on
http
://pu
bs.r
sc.o
rg |
doi:1
0.10
39/C
3CP5
0275
AView Article Online

Phys. Chem. Chem. Phys. This journal is c the Owner Societies 2013
AVN thanks the University of Reims for the invitation to work onthis project.
References
1 B. R. Oppenheimer, S. R. Kulkarni, K. Matthews andT. Nakajima, Science, 1995, 270, 1478–1479.
2 G. Tinetti, A. V. Madjar, D. Liang and J. P. Beaulieu, et al.,Nature, 2007, 448, 169–171.
3 M. R. Swain, P. Deroo, C. A. Griffith and G. Tinetti, et al.,Nature, 2010, 463, 637–639.
4 R. J. Hargreaves, C. A. Beale, L. Michaux, M. Irfan andP. F. Bernath, Astrophys. J., 2012, 757, 46–56.
5 P. G. J. Irwin, C. de Bergh, R. Courtin, B. Bezard,N. A. Teanby and G. R. Davis, et al., Icarus, 2012, 220,369–382.
6 C. D. Bergh, R. Courtin, B. Bezard, A. Coustenis, E. Lellouchand M. Hirtzig, et al., Planet. Space Sci., 2012, 61, 85–95.
7 L. A. Sromovsky, P. M. Fry, V. Boudon, A. Campargue andA. Nikitin, Icarus, 2012, 218, 1–23.
8 J. P. Champion, J. C. Hilico, C. Wenger and L. R. Brown,J. Mol. Spectrosc., 1989, 133, 256–272.
9 S. Albert, S. Bauerecker, V. Boudon, L. R. Brown,J.-P. Champion, M. Loete, A. V. Nikitin and M. Quack, Chem.Phys., 2009, 356, 131–146.
10 V. Boudon, O. Pirali, P. Roy, J. B. Brubach, L. Manceron andJ. V. Auwera, J. Quant. Spectrosc. Radiat. Transfer, 2010, 111,1117–11129.
11 A. V. Nikitin, X. Thomas, L. Regalia, L. Daumont, P. Von derHeyden and V. G. Tyuterev, et al., J. Quant. Spectrosc. Radiat.Transfer, 2011, 112, 28–40.
12 H. Partridge and D. W. Schwenke, J. Chem. Phys., 1997, 106,4618–4639.
13 D. W. Schwenke, Spectrochim. Acta, Part A, 2002, 58,849–861.
14 X. G. Wang and T. Carrington Jr, J. Chem. Phys., 2004, 121,2937–2954.
15 T. J. Lee, J. L. Martin and P. R. Taylor, J. Chem. Phys., 1995,102, 254–261.
16 R. Marquardt and M. Quack, J. Chem. Phys., 1998, 109,10628–10643.
17 R. Marquardt and M. Quack, J. Chem. Phys., 2004, 108,3166–3181.
18 D. W. Schwenke and H. Partridge, Spectrochim. Acta, Part A,2001, 57, 887–895.
19 S. Carter, A. R. Sharma, J. Bowman, P. Rosmus andR. Tarroni, J. Chem. Phys., 2009, 131, 224106.
20 P. Cassam-Chenaı and J. Lievin, J. Chem. Phys., 2012,136, 174309.
21 S. N. Yurchenko, R. J. Barber, A. Yachmenev, W. Thiel,P. Jensen and J. Tennyson, J. Phys. Chem. A, 2009, 113,11845–11855.
22 F. Holka, P. Szalay, J. Fremont, M. Rey, K. Peterson andV. G. Tyuterev, J. Chem. Phys., 2011, 134, 094306–094314.
23 T. Cours, P. Rosmus and V. G. Tyuterev, J. Chem. Phys., 2002,117, 5192–5208.
24 A. Nikitin, F. Holka, V. G. Tyuterev and J. Fremont, J. Chem.Phys., 2009, 130, 244312–244313.
25 M. Pavanello, L. Adamowicz, A. Alijah, N. F. Zobov,I. I. Mizus and O. L. Polyansky, et al., J. Chem. Phys., 2012,136, 184303–184314.
26 L. Lodi and J. Tennyson, J. Quant. Spectrosc. Radiat. Transfer,2012, 113, 850–858.
27 T. Carrington Jr, Can. J. Chem., 2003, 82, 900–914.28 X. G. Wang and T. Carrington Jr, J. Chem. Phys., 2003, 119,
101–117.29 X. G. Wang and E. L. Sibert III, J. Chem. Phys., 1999, 111,
4510–4522.30 X. G. Wang and E. L. Sibert III, Spectrochim. Acta, Part A,
2002, 58, 863–872.31 P. Cassam-Chenaı, Y. Bouret, M. Rey, S. A. Tashkun,
A. V. Nikitin and V. G. Tyuterev, Int. J. Quantum Chem.,2012, 112, 2201–2220.
32 D. A. Sadovskii, D. N. Kozlov and P. P. Radi, Phys. Rev. A: At.,Mol., Opt. Phys., 2010, 82, 012503–012519.
33 M. Rey, A. V. Nikitin and V. G. Tyuterev, J. Chem. Phys., 2012,136, 244106.
34 A. V. Nikitin, M. Rey and V. G. Tyuterev, Chem. Phys. Lett.,2011, 501, 179–186.
35 R. Warmbier, R. Schneider, A. R. Sharma, B. J. Braams,J. Bowman and P. H. Hauschildt, Astron. Astrophys., 2009,495, 655–661.
36 S. Carter, A. R. Sharma and J. M. Bowman, J. Chem. Phys.,2012, 137, 154301.
37 A. V. Nikitin, M. Rey and V. G. Tyuterev, Chem. Phys. Lett.,2013, 565, 5–11.
38 J. P. Champion, M. Loete and G. Pierre, Spherical TopSpectra, Academic Press, San Diego, 1992.
39 B. I. Zhilinskii, V. I. Perevalov and V. G. Tyuterev, Method ofIrreducible Tensorial Operators in the Theory of MolecularSpectra, Nauka (in Russian), Novosibirsk, 1987.
40 J. G. Watson, Mol. Phys., 1968, 15, 479–490.41 A. V. Nikitin, J.-P. Champion and V. G. Tyuterev, J. Mol.
Spectrosc., 1997, 182, 72–84.42 A. V. Nikitin, J.-P. Champion and V. G. Tyuterev, J. Quant.
Spectrosc. Radiat. Transfer, 2003, 82, 239–249.43 A. V. Nikitin, M. Rey, J. Champion and V. G. Tyuterev,
J. Quant. Spectrosc. Radiat. Transfer, 2012, 113, 1034–1042.44 V. G. Tyuterev, L. R. Jarlot, D. W. Schwenke, S. A. Tashkun
and Y. G. Borkov, C. R. Phys., 2004, 5, 189–199.45 C. Fabri, E. Matyus, T. Furtenbacher, L. Nemes, B. Mihaly,
T. Zoltani and A. Csaszar, J. Chem. Phys., 2011, 135, 094307.46 A. Csaszar, C. Fabri, T. Szidarovszky, E. Matyus, T. Furtenbache
and G. Czako, Phys. Chem. Chem. Phys., 2012, 14, 1085–1106.47 V. Boudon, J. Domnech, A. Ramos, D. Bermejo and
H. Willner, Mol. Phys., 2006, 104, 2653–2661.48 V. Boudon, D. Radhouani, M. Loete, R. Z. Martinez and
D. Bermejo, J. Raman Spectrosc., 2007, 38, 559–562.49 H. M. Niederer, S. Albert, S. Bauerecker, V. Boudon,
J. P. Champion and M. Quack, Chimia, 2008, 62, 273–276.50 M. Rey, A. V. Nikitin and V. G. Tyuterev, Mol. Phys., 2010,
108, 2121–2135.
Paper PCCP
Dow
nloa
ded
by U
nive
rsity
of
Ari
zona
on
05/0
5/20
13 1
5:37
:51.
Pu
blis
hed
on 1
2 A
pril
2013
on
http
://pu
bs.r
sc.o
rg |
doi:1
0.10
39/C
3CP5
0275
AView Article Online

This journal is c the Owner Societies 2013 Phys. Chem. Chem. Phys.
51 L. S. Rothman, I. E. Gordon, A. Barbe, D. C. Benner,P. F. Bernath and M. Birk, et al., J. Quant. Spectrosc. Radiat.Transfer, 2009, 110, 533–572.
52 L. Wang, D. Mondelain, S. Kassi and A. Campargue,J. Quant. Spectrosc. Radiat. Transfer, 2011, 113, 47–57.
53 A. Campargue, O. Leshchishina, L. Wang, D. Mondelain,S. Kassi and A. V. Nikitin, J. Quant. Spectrosc. Radiat.Transfer, 2012, 113, 1855–1873.
54 C. Manca-Tanner and M. Quack, Mol. Phys., 2012, 110,2111–2135.
55 J. Lolck, G. Poussigue, E. Pascaud and G. Guelachvili, J. Mol.Spectrosc., 1985, 111, 235–274.
56 C. Wenger and J. Champion, J. Quant. Spectrosc. Radiat.Transfer, 1998, 53, 471–480.
57 L. R. Brown, D. C. Benner, J. P. Champion, V. M. Devi,L. Fejard and R. R. Gamache, et al., J. Quant. Spectrosc.Radiat. Transfer, 2003, 82, 219–238.
58 L. Daumont, A. V. Nikitin, X. Thomas, L. Regalia, P. Von derHeyden and V. G. Tyuterev, et al., J. Quant. Spectrosc. Radiat.Transfer, 2013, 116, 101–109.
59 V. G. Tyuterev, Y. L. Babikov, S. A. Tashkun, V. I. Perevalov,A. V. Nikitin and J. P. Champion, et al., J. Quant. Spectrosc.Radiat. Transfer, 1994, 52, 459–480.
60 M. L. Dubernet, V. Boudon, J. L. Culhane, M. S. Dimitrijevic,A. Z. Fazliez and C. Joblin, et al., J. Quant. Spectrosc. Radiat.Transfer, 2010, 111, 2151–2159.
61 N. J. Husson, L. Crepeau, R. Armante, C. Boutammine andA. Chedin, et al., J. Quant. Spectrosc. Radiat. Transfer, 2011,112, 2395–2445.
62 M. Hippler and M. Quack, J. Chem. Phys., 2001, 116, 6045–6055.63 E. Pascaud, G. Poussigue, G. Guelachvili and J. Lolck, J. Mol.
Spectrosc., 1987, 121, 20–49.64 M. Rey, A. V. Nikitin and V. G. Tyuterev, J. Mol. Spectrosc.,
DOI: 10.1016/j.jms.2013.04.003.
PCCP Paper
Dow
nloa
ded
by U
nive
rsity
of
Ari
zona
on
05/0
5/20
13 1
5:37
:51.
Pu
blis
hed
on 1
2 A
pril
2013
on
http
://pu
bs.r
sc.o
rg |
doi:1
0.10
39/C
3CP5
0275
AView Article Online