Embed Size (px)
Citation preview

H. Lundbeck A/S
Ottiliavej 9 Tel +45 36 30 13 11 E-mail [email protected]
DK-2500 Valby, Copenhagen Fax +45 36 43 82 62 www.lundbeck.com
CVR number: 56759913
First half report 2013 New Products up 48%, Lundbeck raises expectations for 2013 Valby, Denmark, 7 August 2013 - H. Lundbeck A/S (Lundbeck) reports first half revenue of DKK 8,112
million corresponding to an increase of 11% compared to the same period last year. Revenue grew by
12%, after adjustment for Lexapro and gains from divestiture. Profit from operations (EBIT) for the first
half was DKK 1,191 million excluding one-offs, corresponding to an EBIT margin of 16%. Reported EBIT
grew 33% to DKK 1,020 million.
New Products is further strengthened by the launches of Abilify Maintena and Selincro and continues to deliver strong growth of 48% in the period and is now constituting 17% of revenue
Several of Lundbeck’s legacy products exceeded expectations. Cipralex grew 4% in the first half of the year driven by Canada and Japan. Azilect continued the excellent growth trend from the previous quarters and grew 22%
International Markets and the US excl. Lexapro showed strong growth and revenue increased with 14% and 23% respectively
Abilify Maintena was launched in April in the US and Selincro has now been launched in 12 European countries. The initial feedback is encouraging for both products
New data on Brintellix has recently been presented at medical conferences like EPA, APA and NCDEU which supports and strengthens the clinical profile of the product
One-offs impacted the quarter negatively with approximately DKK 900 million due to the decision from the European Commission to fine Lundbeck approximately DKK 700 million and the impairment of the Sycrest
® product rights of DKK 210 million
The operating performance is exceeding expectations. For the full year 2013 Lundbeck now expects
reported revenue to be DKK 14.6-15.0 billion and reported EBIT to be DKK 1.3-1.7 billion. The
previous guidance was a reported revenue of DKK 14.4-15.0 billion and a reported EBIT of DKK 1.2-
1.7 billion
Distribution of revenue
DKK million H1 2013 H1 2012 Growth
Growth in local
currency
New Products* 1,402 947 48% 50%
Cipralex® 3,048 2,927 4% 4%
Azilect® 697 570 22% 21%
Xenazine® 687 558 23% 23%
Sabril® 265 175 51% 51%
Onfi®
210 104 103% 103%
Europe 3,813 3,883 (2%) (2%)
USA (excl. Lexapro) 1,165 950 23% 23%
International Markets 2,165 1,900 14% 15%
Total revenue 8,112 7,340 11% 10%
*New Products include Xenazine, Sabril, Sycrest, Lexapro (Japan), Onfi, Treanda, Selincro and Abilify Maintena
In connection with the first half report, Lundbeck´s President and CEO Ulf Wiinberg said:
“I am very pleased with Lundbeck’s overall results in the first half and especially that our performance
from new products continues to show a solid growth which raises our expectations for the full year result
and confirms our strategy for Lundbeck in the long term is well on track”.

7 August 2013 Corporate Release No 506 page 2 of 27
CONTENTS
FINANCIAL HIGHLIGHTS AND KEY FIGURES ...................................................... 3
MANAGEMENT REVIEW ......................................................................................... 4
Financial forecast 2013 .................................................................. 4
Revenue ....................................................................................... 5
Expenses and income ................................................................... 10
Cash flow ................................................................................... 12
Balance sheet ............................................................................. 13
Lundbeck's development portfolio .................................................. 13
General corporate matters ............................................................ 15
MANAGEMENT STATEMENT................................................................................ 17
FINANCIAL STATEMENTS .................................................................................... 18
FINANCIAL CALENDAR 2013 ............................................................................... 26
7 August 2013 Corporate Release No 506 page 3 of 27
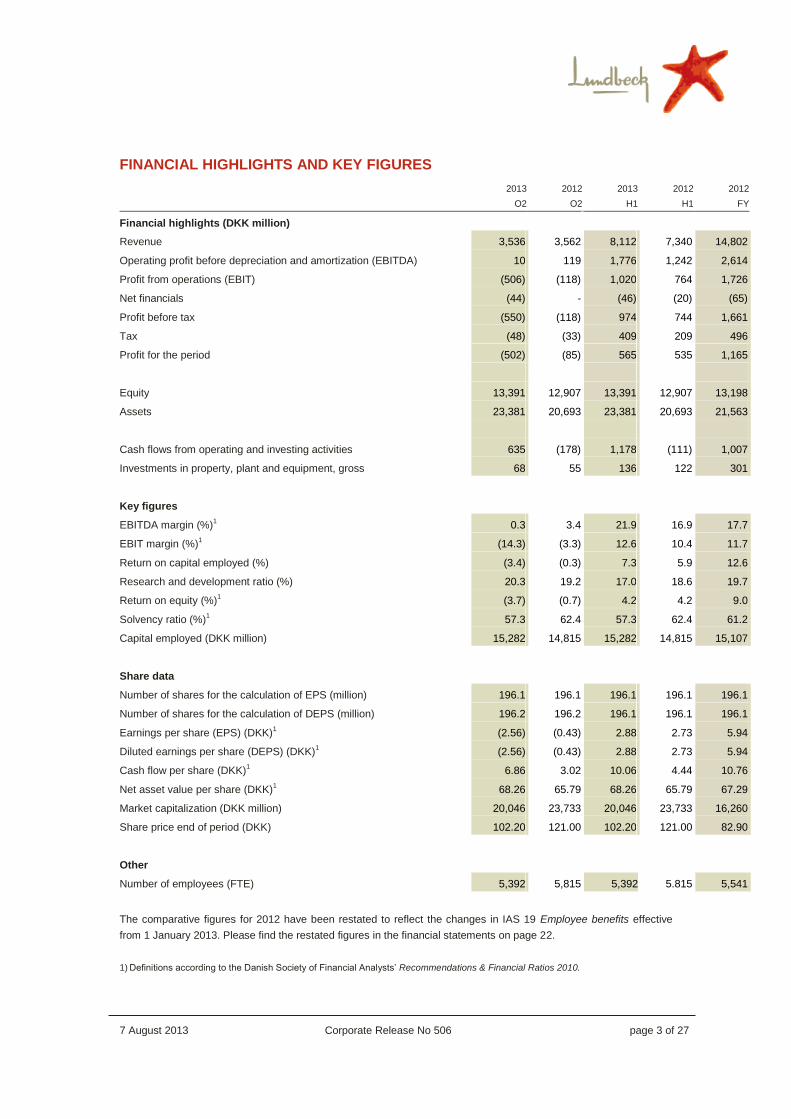
FINANCIAL HIGHLIGHTS AND KEY FIGURES
2013 2012 2013 2012 2012
Q2 Q2 H1 H1 FY
Financial highlights (DKK million)
Revenue 3,536 3,562 8,112 7,340 14,802
Operating profit before depreciation and amortization (EBITDA) 10 119 1,776 1,242 2,614
Profit from operations (EBIT) (506) (118) 1,020 764 1,726
Net financials (44) - (46) (20) (65)
Profit before tax (550) (118) 974 744 1,661
Tax (48) (33) 409 209 496
Profit for the period (502) (85) 565 535 1,165
Equity 13,391 12,907 13,391 12,907 13,198
Assets 23,381 20,693 23,381 20,693 21,563
Cash flows from operating and investing activities 635 (178) 1,178 (111) 1,007
Investments in property, plant and equipment, gross 68 55 136 122 301
Key figures
EBITDA margin (%)1 0.3 3.4 21.9 16.9 17.7
EBIT margin (%)1 (14.3) (3.3) 12.6 10.4 11.7
Return on capital employed (%) (3.4) (0.3) 7.3 5.9 12.6
Research and development ratio (%) 20.3 19.2 17.0 18.6 19.7
Return on equity (%)1 (3.7) (0.7) 4.2 4.2 9.0
Solvency ratio (%)1 57.3 62.4 57.3 62.4 61.2
Capital employed (DKK million) 15,282 14,815 15,282 14,815 15,107
Share data
Number of shares for the calculation of EPS (million) 196.1 196.1 196.1 196.1 196.1
Number of shares for the calculation of DEPS (million) 196.2 196.2 196.1 196.1 196.1
Earnings per share (EPS) (DKK)1 (2.56) (0.43) 2.88 2.73 5.94
Diluted earnings per share (DEPS) (DKK)1 (2.56) (0.43) 2.88 2.73 5.94
Cash flow per share (DKK)1 6.86 3.02 10.06 4.44 10.76
Net asset value per share (DKK)1 68.26 65.79 68.26 65.79 67.29
Market capitalization (DKK million) 20,046 23,733 20,046 23,733 16,260
Share price end of period (DKK) 102.20 121.00 102.20 121.00 82.90
Other
Number of employees (FTE) 5,392 5,815 5,392 5.815 5,541
The comparative figures for 2012 have been restated to reflect the changes in IAS 19 Employee benefits effective
from 1 January 2013. Please find the restated figures in the financial statements on page 22.
1) Definitions according to the Danish Society of Financial Analysts’ Recommendations & Financial Ratios 2010.

7 August 2013 Corporate Release No 506 page 4 of 27
MANAGEMENT REVIEW
Financial forecast 2013
Financial guidance for the full year 2013 is revised. For the full year 2013, Lundbeck now expects
revenue to be DKK 14.6-15.0 billion and profit from operations (EBIT) to be DKK 1.3-1.7 billion.
The outlook for 2013 includes,
I. Obligation and payment of the fine from the European Commission of approximately DKK 700
million
II. Impairment of the Sycrest product rights of DKK 210 million
III. Payment of DKK 852 million from Otsuka connected to Lu AE58054 which has been split -
DKK 284 million has been recognized under Other revenue in the first quarter of 2013 and the
additional non-refundable cash payment of DKK 568 million will be recognized in the P&L in
the period 2013-2015
IV. The gain from the divestiture of non-core products in the US of USD 100 million, which was
recognized in Q1 2013 by USD 80 million (DKK 454 million) and the remaining USD 20 million
which will be recognized in Q3 2013
V. The milestone from Takeda Pharmaceuticals Company Limited (Takeda) of USD 30 million
(approximately DKK 170 million) related to the expected launch of Brintellix in the US in the
fourth quarter of the year
Lundbeck is expecting intensified generic competition on Ebixa in 2013 and Lundbeck is currently
investing significantly in several new product launches and increased late-stage pipeline activity.
Financial forecast 2013
DKK billion
2012
actual
2013
previous
2013
new forecast
Revenue 14.8 14.4-15.0 14.6-15.0
EBIT 1.7 1.2-1.7 1.3-1.7
EBIT (excluding EU fine) 1.7 1.9-2.4 2.0-2.4
Forward-looking statements
Forward-looking statements provide current expectations or forecasts for events, such as product
launches, product approvals and financial performance. Forward-looking statements are subject to risks,
uncertainties and inaccurate assumptions. Actual results may differ from expected results. Factors that
may affect future results include fluctuations in interest rates and exchange rates, delay in or failure of
development projects, production problems, unexpected contract breaches or terminations, government-
mandated or market-driven price decreases for Lundbeck’s products, introduction of a competing
product, Lundbeck’s ability to successfully market both new and existing products, exposure to product
liability and other lawsuits, changes in reimbursement rules and governmental laws and their
interpretation and unexpected growth in costs and expenses.

7 August 2013 Corporate Release No 506 page 5 of 27
Revenue
Total revenue for the second quarter was DKK 3,521 million corresponding to an increase of 4%
compared to the second quarter last year excluding Lexapro in the US.
Total revenue
DKK million Q2 2013 Q2 2012 Growth
Growth in local
currency Q1 2013
Cipralex 1,511 1,456 4% 5% 1,537
Ebixa® 559 696 (20%) (19%) 789
Azilect 339 294 15% 16% 358
Xenazine 372 277 34% 34% 315
Sabril 147 90 62% 62% 118
Onfi
114 55 111% 110% 96
Other pharmaceuticals 387 461 (16%) (16%) 501
Other revenue 92 58 61% 61% 851
Revenue excl. Lexapro (US) 3,521 3,387 4% 4% 4,565
Lexapro (US) 15 175 (92%) (93%) 11
Total revenue 3,536 3,562 (1%) 0% 4,576
Cipralex (escitalopram) for the treatment of mood disorders grew 4% or 5% in local currency and
reached DKK 1,511 million for the quarter. Growth in Cipralex is mainly driven by International Markets,
mostly Canada and Japan.
Ebixa (memantine) for the symptomatic treatment of Alzheimer’s disease, generated second quarter
revenue of DKK 559 million, a decrease of 20% compared to the same period last year. The decrease is
due to generic competition in several markets in Europe. For the full year Ebixa is expected to decline
by 30-40%, as a consequence of a further expected intensified generic competition across the European
markets.
Azilect (rasagiline) for the treatment of Parkinson’s disease realized revenue of DKK 339 million, an
increase of 15%. The continuation of the previous quarters’ solid growth is due to the strong sales in
European markets such as France, Italy and Spain. Additionally, Lundbeck has the commercial rights to
Azilect in most of Europe (in co-promotion with Teva in France and UK) and some markets outside
Europe, including six Asian countries. Outside of Europe, Lundbeck has successfully launched Azilect in
Australia, Thailand and Hong Kong.
Xenazine1 (tetrabenazine) for the treatment of chorea associated with Huntington’s disease, generated
revenue of DKK 372 million in the second quarter, an increase of 34% compared to the same period last
year. Lundbeck has the marketing rights for Xenazine in the US.
1 Xenazine is a registered trademark of Biovail Laboratories International (Barbados) S.R.L.
7 August 2013 Corporate Release No 506 page 6 of 27
Sabril (vigabatrin) for the treatment of refractory complex partial seizures (rCPS) and infantile spasms
(IS) generated second quarter revenue of DKK 147 million, increasing 62% compared to the second
quarter 2012. Lundbeck has the marketing rights for Sabril in the US.
Onfi (clobazam) for the treatment of Lennox-Gastaut syndrome was launched in the US in early 2012.
Onfi has shown significant growth and generated second quarter revenue of DKK 114 million, an
increase of 111% compared to same period last year.
Sycrest/Saphris® (asenapine) is indicated for the treatment of moderate to severe manic episodes
associated with bipolar I disorder in the EU (Sycrest), and for the treatment of schizophrenia and/or
moderate to severe manic episodes associated with bipolar I disorder outside the EU (Saphris).
Lundbeck started launching asenapine in various countries in April 2011 and the uptake has so far been
disappointing. Following reduced expectations for the product, Lundbeck has impaired the product rights
by DKK 210 million.
Revenue from Other pharmaceuticals, which comprise the remainder of Lundbeck’s products, was DKK
387 million, a decrease of 16% compared to the same quarter last year mainly due to the divestment of
the US portfolio of non-core products.
Other revenue was DKK 92 million, compared to DKK 58 million for the same period last year.
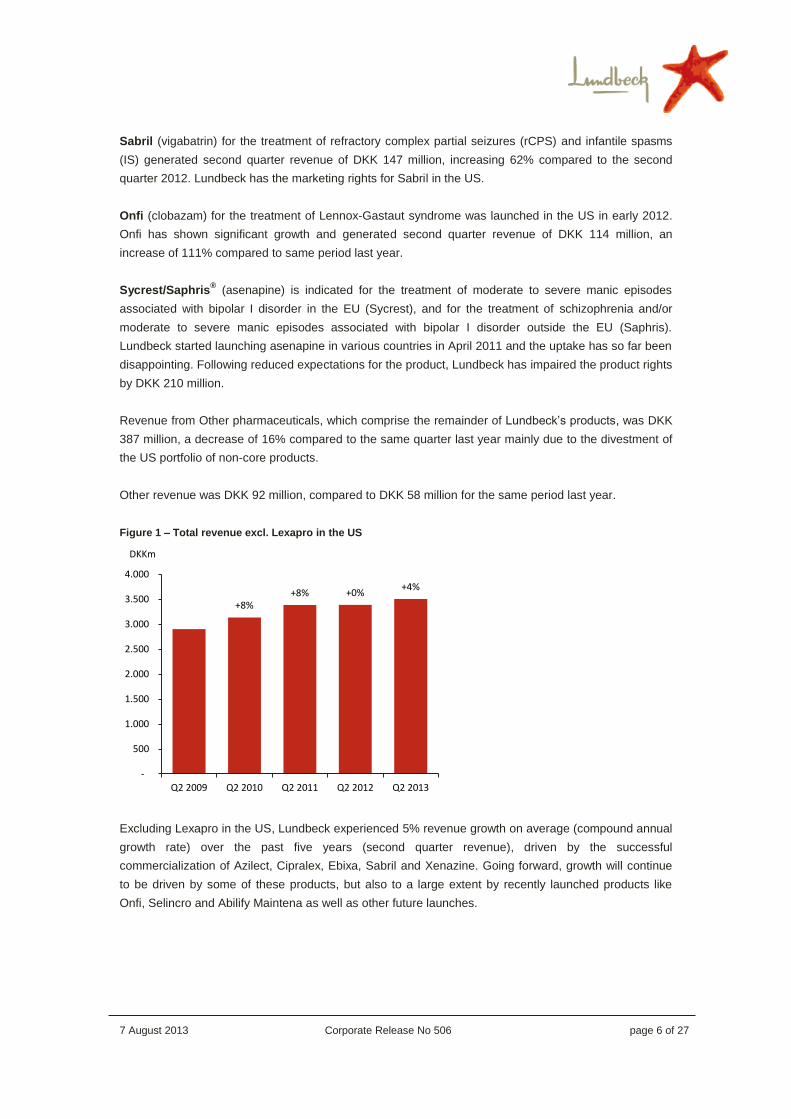
Figure 1 – Total revenue excl. Lexapro in the US
Excluding Lexapro in the US, Lundbeck experienced 5% revenue growth on average (compound annual
growth rate) over the past five years (second quarter revenue), driven by the successful
commercialization of Azilect, Cipralex, Ebixa, Sabril and Xenazine. Going forward, growth will continue
to be driven by some of these products, but also to a large extent by recently launched products like
Onfi, Selincro and Abilify Maintena as well as other future launches.
+8% +8% +0%
+4%
-
500
1.000
1.500
2.000
2.500
3.000
3.500
4.000
Q2 2009 Q2 2010 Q2 2011 Q2 2012 Q2 2013
DKKm

7 August 2013 Corporate Release No 506 page 7 of 27
Figure 2 - Revenue per region Q2 2013 (growth in brackets) – DKKm
Europe
Second quarter revenue in Europe was DKK 1,817 million, a decrease of 7% compared to the same
quarter last year. The decrease was primarily due to intensified generic competition for Ebixa and
generic entry for Cipralex in Portugal. This is partly off-set by significant growth of Azilect in France, Italy
and Spain.
Revenue – Europe
DKK million Q2 2013 Q2 2012 Growth
Growth in local
currency Q1 2013
Cipralex 847 864 (2%) (3%) 856
Ebixa 446 606 (26%) (27%) 617
Azilect 314 269 17% 16% 320
Other pharmaceuticals 210 207 1% 1% 203
Total revenue 1,817 1,946 (7%) (7%) 1,996
Cipralex generated second quarter revenue of DKK 847 million in Europe. Cipralex sales in Germany
are recovering following the annulment of the fixed price for Cipralex in December 2011, and sales are
back on the same sales level as before the introduction of the fixed price. The decline in growth is
primarily due to generic entry in Portugal. At the end of May 2013, Cipralex held a market share in value
of 16.7% of the European antidepressant market, compared to a market share of 16.8% at the same
time in 2012.
Revenue from Ebixa decreased with 26% to DKK 446 million for the quarter. The decrease is due to the
intensified generic competition in markets such as France, Germany and UK. At the end of May 2013
the product held 24.1% of the European Alzheimer’s market measured in value, compared to a market
share of 23.2% at the same time in 2012.
Second quarter revenue from Azilect amounted to DKK 314 million, an increase of 17% compared to the
second quarter of 2012. Azilect continues to gain market share as it is increasingly recognized as an
effective and easy-to-administer medication. At the end of May 2013, Azilect held a market share in
1,817 (-7%)
630 (28%)
15 (-92%)
982 (10%)
92 (61%)
Europe
USA (excl. Lexapro)
Lexapro (US)
International Markets
Other revenue
7 August 2013 Corporate Release No 506 page 8 of 27
value of 15.0% of the total European Parkinson's market. This compares to a market share of 13.4% at
the same time in 20122.
Revenue from Other pharmaceuticals was DKK 210 million, an increase of 1% compared to last year.
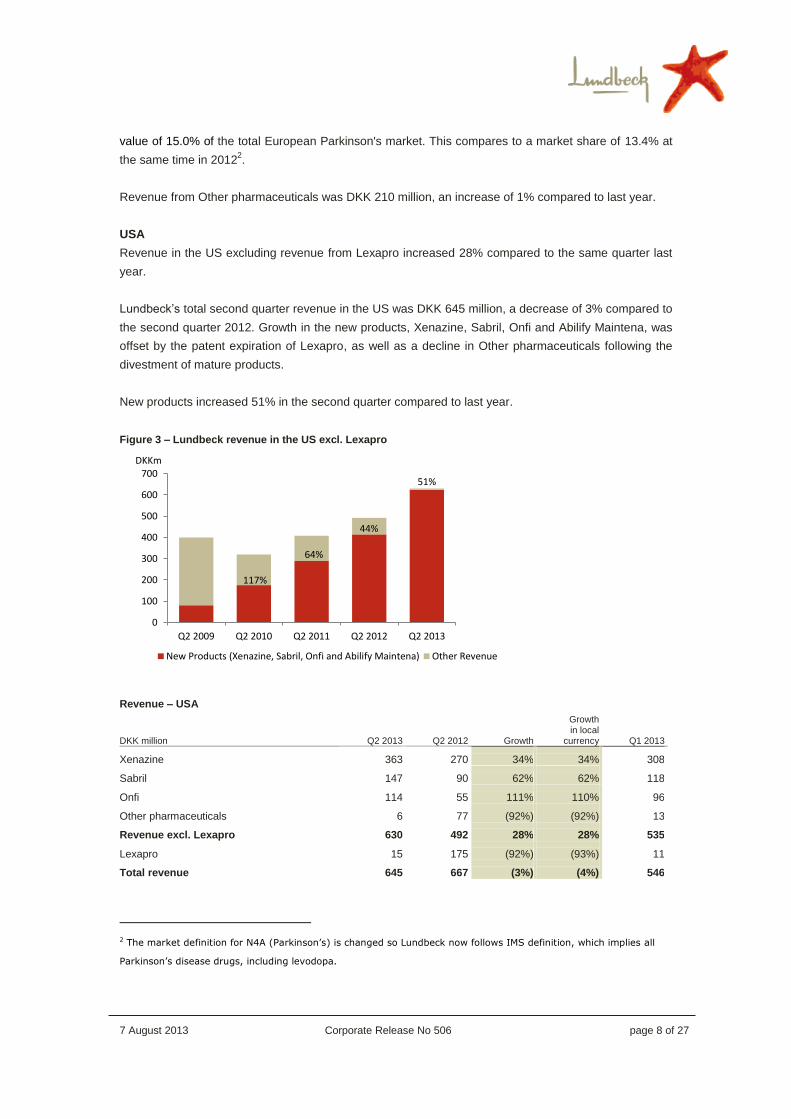
USA
Revenue in the US excluding revenue from Lexapro increased 28% compared to the same quarter last
year.
Lundbeck’s total second quarter revenue in the US was DKK 645 million, a decrease of 3% compared to
the second quarter 2012. Growth in the new products, Xenazine, Sabril, Onfi and Abilify Maintena, was
offset by the patent expiration of Lexapro, as well as a decline in Other pharmaceuticals following the
divestment of mature products.
New products increased 51% in the second quarter compared to last year.
Figure 3 – Lundbeck revenue in the US excl. Lexapro
Revenue – USA
DKK million Q2 2013 Q2 2012 Growth
Growth in local
currency Q1 2013
Xenazine 363 270 34% 34% 308
Sabril 147 90 62% 62% 118
Onfi 114 55 111% 110% 96
Other pharmaceuticals 6 77 (92%) (92%) 13
Revenue excl. Lexapro 630 492 28% 28% 535
Lexapro 15 175 (92%) (93%) 11
Total revenue 645 667 (3%) (4%) 546
2 The market definition for N4A (Parkinson’s) is changed so Lundbeck now follows IMS definition, which implies all
Parkinson’s disease drugs, including levodopa.
117%
64%
44%
51%
0
100
200
300
400
500
600
700
Q2 2009 Q2 2010 Q2 2011 Q2 2012 Q2 2013
DKKm
New Products (Xenazine, Sabril, Onfi and Abilify Maintena) Other Revenue
7 August 2013 Corporate Release No 506 page 9 of 27
Revenue from Xenazine was DKK 363 million for the quarter, an increase of 34% compared to the
second quarter last year. The positive trend from the previous quarters continues as Xenazine revenue
is progressing well and is on track to meeting our expectations.
Sabril revenue for the quarter was DKK 147 million, growing 62% compared to the same quarter last
year. The performance of Sabril continues to be driven by higher active patient base.
In January 2012, Onfi was made available for prescription in the US as adjunctive therapy for seizures
associated with Lennox-Gastaut syndrome. Onfi exceeds expectations and revenue reached DKK 114
million in the second quarter of 2013, growing significantly by 111% compared to the same quarter last
year.
Second quarter revenue from Other pharmaceuticals in the US was DKK 6 million, a decrease of 92%
compared to the same quarter last year. The decrease in revenue is due to divestment of Lundbeck US’
non-core product portfolio which has been purchased by Recordati in December 2012. The transaction
was the final part of Lundbeck's long-term strategy to focus on newer, strategic products in its portfolio in
the US. Lundbeck US can now focus on Xenazine, Sabril, Onfi and recently launched Abilify Maintena,
as well as preparation for the launch of Brintellix late in 2013.
International Markets
Revenue in International Markets, which comprise all of Lundbeck’s markets outside Europe and the
US, was DKK 982 million for the quarter, corresponding to an increase of 10%, or 14% in local currency
compared to the second quarter of 2012. The growth was primarily driven by Cipralex and Ebixa.
Revenue – International Markets
DKK million Q2 2013 Q2 2012 Growth
Growth in local
currency Q1 2013
Cipralex 664 592 12% 16% 681
Ebixa 113 90 26% 32% 172
Azilect 25 25 (2%) 10% 38
Other pharmaceuticals 180 184 (2%) 0% 292
Total revenue 982 891 10% 14% 1,183
Cipralex generated second quarter revenue of DKK 664 million an increase of 12%, or 16% in local
currency compared to the second quarter last year. The increase in revenue was primarily driven by the
continued strong growth in Japan, Canada and China. Canada increased its market share to 25.5%
compared to a market share of 21.3% at the same time in 2012. At the end of May 2013, Cipralex held a
market share in value of 11.7% of the International antidepressant market, compared to a market share
of 9.8% at the same time in 2012.
Two years after launch sales of Lexapro in Japan by Lundbeck’s partners Mochida and Mitsubishi
continue to show solid growth. Lexapro is being marketed with a very competitive share of voice and at
the end of June 2013 Lexapro in Japan held a market share of 11.9% and showed revenue of DKK 55
million compared to DKK 35 million in second quarter last year, an increase of 56%, or 79% in local
currency.

7 August 2013 Corporate Release No 506 page 10 of 27
Ebixa generated second quarter revenue of DKK 113 million, an increase of 26%, or 32% in local
currency. The increase is due to strong growth on the Chinese market and seasonality.
Azilect revenue is decreasing driven by Turkey and a negative currency impact, which is partly offset by
growth in newly launched countries such as Australia, Thailand and Hong Kong.
Other pharmaceuticals generated revenue of DKK 180 million during the quarter, a decrease of 2%, or
0% in local currency, compared to the same quarter last year.
Expenses and income
Total costs for the second quarter are DKK 4,042 million, an increase of 10% compared to second
quarter last year.
Distribution of costs
DKK million Q2 2013 Q2 2012 Growth Q1 2013
Cost of sales 1,170 930 26% 1,057
Sales and distribution 1,011 1,628 (38%) 914
Administration 1,143 438 161% 419
Research and development 718 684 5% 660
Total costs 4,042 3,680 10% 3,050
Total cost of sales is DKK 1,170 million and DKK 960 million excl. the impairment of the Sycrest product
rights of DKK 210 million. This corresponds to 27% of Lundbeck's total revenue, compared to 26% in the
same quarter last year.
Sales and distribution costs are DKK 1,011 million, corresponding to 29% of revenue and a decrease of
38% compared to second quarter last year. The decrease is mainly due to the cost of DKK 500 million
relating to the restructure of the commercial organization in Europe in the second quarter last year.
Adjusting for this, sales and distribution costs are 10% lower as a consequence of the restructure.
Administrative expenses are DKK 1,143 million compared to DKK 438 million in the same quarter last
year. Excluding the fine from the European Commission of approximately DKK 700 million,
administrative expenses corresponded to 13% of revenue for the period
SG&A costs are DKK 2,154 million compared to DKK 2,066 million in the same period last year. The
SG&A margin for the period is 61% compared to 58% last year. Excluding the restructuring costs in
2012 and the European Commission fine in 2013, the SG&A margin for the period is 41% compared
with 44% in the same period last year.
R&D costs for the quarter are DKK 718 million compared to DKK 684 million in the same period last
year. Primarily due to write down of patents on two research projects
7 August 2013 Corporate Release No 506 page 11 of 27
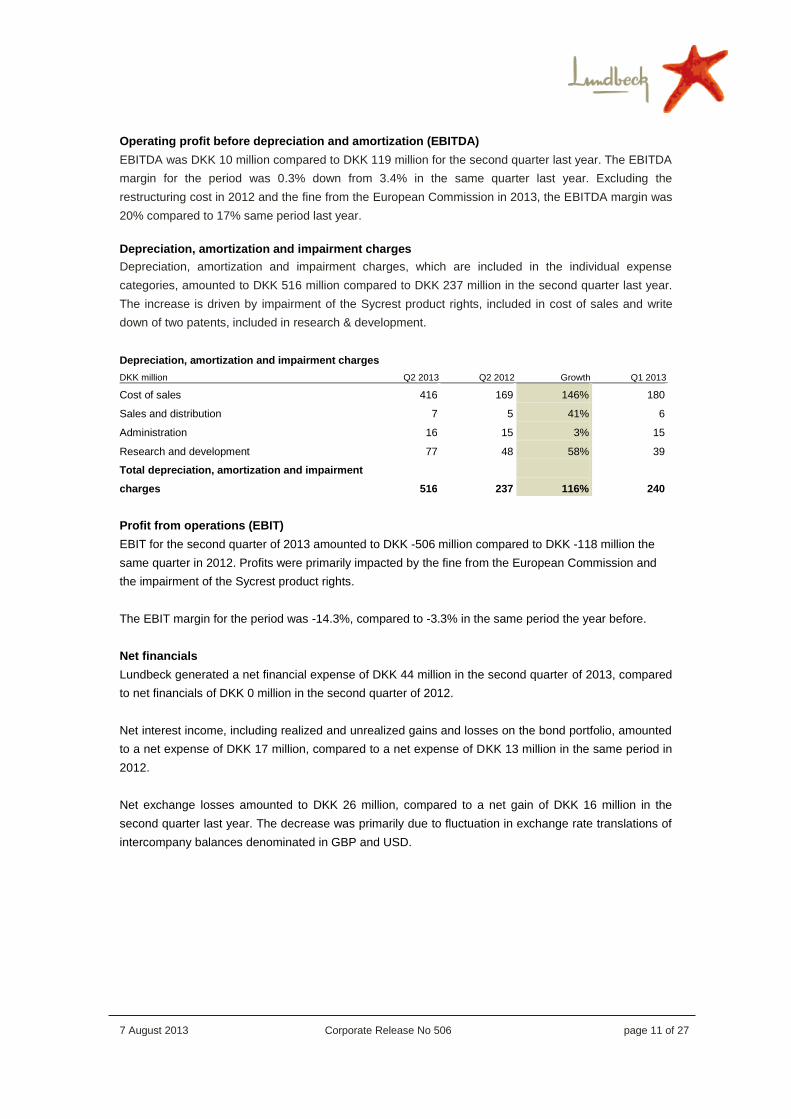
Operating profit before depreciation and amortization (EBITDA)
EBITDA was DKK 10 million compared to DKK 119 million for the second quarter last year. The EBITDA
margin for the period was 0.3% down from 3.4% in the same quarter last year. Excluding the
restructuring cost in 2012 and the fine from the European Commission in 2013, the EBITDA margin was
20% compared to 17% same period last year.
Depreciation, amortization and impairment charges
Depreciation, amortization and impairment charges, which are included in the individual expense
categories, amounted to DKK 516 million compared to DKK 237 million in the second quarter last year.
The increase is driven by impairment of the Sycrest product rights, included in cost of sales and write
down of two patents, included in research & development.
Depreciation, amortization and impairment charges
DKK million Q2 2013 Q2 2012 Growth Q1 2013
Cost of sales 416 169 146% 180
Sales and distribution 7 5 41% 6
Administration 16 15 3% 15
Research and development 77 48 58% 39
Total depreciation, amortization and impairment
charges 516 237 116% 240
Profit from operations (EBIT)
EBIT for the second quarter of 2013 amounted to DKK -506 million compared to DKK -118 million the
same quarter in 2012. Profits were primarily impacted by the fine from the European Commission and
the impairment of the Sycrest product rights.
The EBIT margin for the period was -14.3%, compared to -3.3% in the same period the year before.
Net financials
Lundbeck generated a net financial expense of DKK 44 million in the second quarter of 2013, compared
to net financials of DKK 0 million in the second quarter of 2012.
Net interest income, including realized and unrealized gains and losses on the bond portfolio, amounted
to a net expense of DKK 17 million, compared to a net expense of DKK 13 million in the same period in
2012.
Net exchange losses amounted to DKK 26 million, compared to a net gain of DKK 16 million in the
second quarter last year. The decrease was primarily due to fluctuation in exchange rate translations of
intercompany balances denominated in GBP and USD.
7 August 2013 Corporate Release No 506 page 12 of 27
Tax
The effective tax rate for the full year 2013 is expected to increase from approximately 30% to slightly
over 40%. The change is mainly due to the following circumstances:
I. The fine from the European Commission is non-deductible for tax purposes and increases the
expected effective tax rate.
II. The Danish parliament has passed a bill reducing the corporate tax rate from 25% to 22% from
2014 until 2016. Lundbeck has recognized the full expected effect on deferred tax assets in Q2
in accordance with IFRS.
III. The effective tax rate is also highly depended on the mix of revenue and changes to the mix in
revenue can thus also change the effective tax rate.
Profit for the period
Profit for the period was DKK -502 million, compared to DKK -85 million in the same period last year.
This corresponds to an EPS of DKK -2.56 per share for the second quarter 2013.
Hedging
Lundbeck hedges expected income from its products through currency hedging on a rolling basis, up to
12 months in advance. As a result of Lundbeck's currency hedging policy, foreign exchange gains and
losses on hedging transactions are allocated directly to the hedged transaction. Hedging had a positive
impact on profit of DKK 22 million in the second quarter of 2013, compared with a situation where the
income is not hedged and included at the current exchange rates during the period. The effect was a
DKK 40 million loss in the second quarter of 2012.
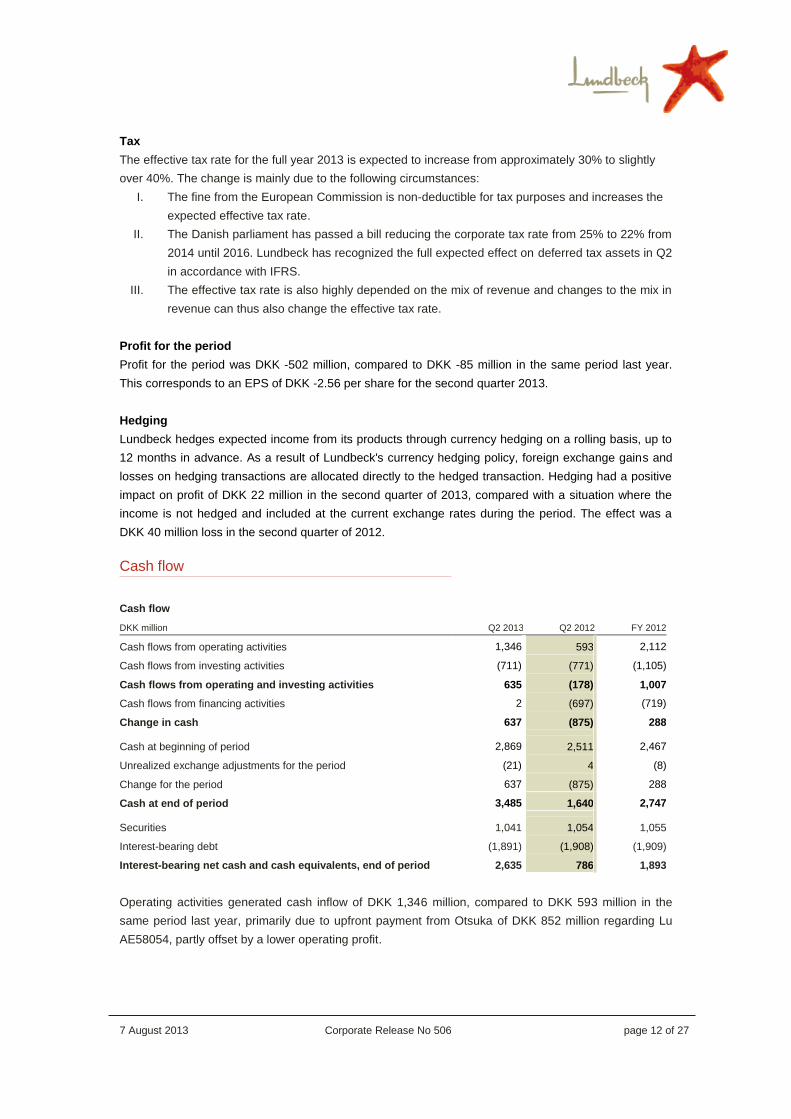
Cash flow
Cash flow
DKK million Q2 2013 Q2 2012 FY 2012
Cash flows from operating activities 1,346 593 2,112
Cash flows from investing activities (711) (771) (1,105)
Cash flows from operating and investing activities 635 (178) 1,007
Cash flows from financing activities 2 (697) (719)
Change in cash 637 (875) 288
Cash at beginning of period 2,869 2,511 2,467
Unrealized exchange adjustments for the period (21) 4 (8)
Change for the period 637 (875) 288
Cash at end of period 3,485 1,640 2,747
1,941 Securities 1,041 1,054 1,055
Interest-bearing debt (1,891) (1,908) (1,909)
Interest-bearing net cash and cash equivalents, end of period 2,635 786 1,893
Operating activities generated cash inflow of DKK 1,346 million, compared to DKK 593 million in the
same period last year, primarily due to upfront payment from Otsuka of DKK 852 million regarding Lu
AE58054, partly offset by a lower operating profit.

7 August 2013 Corporate Release No 506 page 13 of 27
Cash flows from investing activities generated outflow of DKK 711 million mostly related to milestone
payment to Otsuka for the launch of Abilify Maintena in the US.
Cash at 30 June 2013 was DKK 3,485 million compared to DKK 1,640 million at 30 June 2012.
Lundbeck’s net cash position at 30 June 2013 was DKK 2,635 million, compared to DKK 786 million at
30 June 2012.
Balance sheet
As of 30 June 2013, Lundbeck had total assets of DKK 23,381 million, compared to DKK 20,693 million
at the end of the second quarter of 2012.
As of 30 June 2013, Lundbeck's equity amounted to DKK 13,391 million, corresponding to a solvency
ratio of 57.3% compared to 62.4% at the end of the second quarter 2012.
Other payables include the obligation regarding the fine received from the European Commission of
approximately DKK 700 million. The fine will be paid in Q3 2013. Lundbeck strongly disagrees with the
Commission’s decision and intends to appeal. Consequently Lundbeck has a contingent asset
corresponding to a maximum of the amount of the fine. Lundbeck does not expect that the fine will
increase as a result of the appeal.
As a consequence of the exercise of employee warrants, the share capital was increased during the
quarter by DKK 48,860 (or 9,772 shares of nominally DKK 5). The increase was affected without any
pre-emption rights for the existing shareholders of the company or others. 8,803 shares were subscribed
in cash at DKK 97 per share and 969 shares were subscribed in cash at DKK 102 per share. Proceeds
to the company were DKK 952,729. The increase corresponds to approximately 0.005% of the
company’s share capital. After the increase Lundbeck’s share capital amounts to DKK 980,731,415.
At the Annual General Meeting in March, the proposed dividend for 2012 of DKK 392 million (DKK 685
million for 2011) or DKK 2.00 per share for 2012 (DKK 3.49 per share for 2011) was approved. The
dividend was paid out in Q1 2013.
Lundbeck's development portfolio
Lundbeck is developing a number of new and promising pharmaceuticals for the treatment of brain
disorders. The pipeline projects are targeting areas where Lundbeck currently has a market presence,
such as depression, anxiety and other psychiatric disorders, as well as new areas such as stroke.
Pipeline development is summarised as follows:
Regulatory review
Abilify Maintena (EU) is a once-monthly injection undergoing regulatory review in Europe for the
treatment of schizophrenia. In January 2013, the U.S. Food and Drug Administration (FDA) approved
Abilify Maintena (aripiprazole) for extended-release injectable suspension for the treatment of
schizophrenia and the product was subsequently launched in April. Abilify Maintena is a part of
7 August 2013 Corporate Release No 506 page 14 of 27
Lundbeck’s collaboration with Otsuka Pharmaceutical Co., Ltd. (Otsuka), and Lundbeck has co-
development and co-promotional rights to the product.
Brintellix (vortioxetine) is an investigational multimodal antidepressant. In the second half of 2012,
Lundbeck and its partner, Takeda, submitted a New Drug Application (NDA) for Brintellix to the FDA,
and separately Lundbeck submitted a marketing authorization application (MAA) to the European
Medicines Agency (EMA) and other western health authorizes. The data package supporting the files is
substantial, consisting of short and long term studies in major depression using dosages from 5-20 mg
of Brintellix. The data package also includes studies in relapse prevention and in elderly patients with
major depression. More than 7,500 individuals have been treated with Brintellix worldwide, including the
US, across the entire clinical trial programme. According to the timelines established by the Prescription
Drug User Fee Act (PDUFA), the review of the NDA is targeted for completion by 2 October 2013.
Clinical phase III
Intravenous carbamazepine (IV CBZ) is in development in the US for short-term replacement of oral
carbamazepine in adult patients with epilepsy. In June, Lundbeck received FDA Orphan drug status for
this product which is expected to be submitted to the FDA towards the end of 2013
Desmoteplase is being developed for the treatment of ischaemic strokes. The clinical phase III studies
with desmoteplase, DIAS-3 and DIAS-4, show improved patient recruitment following several initiatives
to speed up the recruitment process. A regulatory filing of desmoteplase is expected in 2014.
Brexpiprazole is a novel investigational psychotherapeutic compound. As part of the collaboration with
Otsuka, Lundbeck has gained co-development and co-promotional rights to brexpiprazole. The clinical
phase III programme for brexpiprazole has been initiated in schizophrenia and in the adjunctive
treatment of MDD and is progressing according to plan. Brexpiprazole is in development to provide
improved efficacy and tolerability, such as less akathisia, restlessness and/or insomnia.
Clinical phase II
Lu AE58054 is a potent and selective so-called 5-HT6 receptor antagonist. In November 2009,
Lundbeck initiated a multi-centre, placebo-controlled, fixed-dose study of Lu AE58054 as an add-on to
donepezil in patients with moderate Alzheimer's disease. In March 2013 Lundbeck and Otsuka further
expanded their alliance and entered into collaboration for the development and commercialization of Lu
AE58054. In July Lundbeck and Otsuka presented the first clinical data on Lu AE58054 in Alzheimer's
disease at the Alzheimer's Association International Conference 2013 (AAIC 2013) in Boston. The data
demonstrated that addition of Lu AE58054 (90 mg/day) to stable donepezil treatment resulted in
improved cognitive performance as measured by ADAS-Cog at Week 24. The effect was apparent after
12 weeks. Secondary efficacy assessments showed a trend in favour of Lu AE58054 treatment at week
24 compared with patients who only received donepezil, but the differences were not statistically
different. The study was not designed to show statistically significant differences for these secondary
endpoints. Treatment with Lu AE58054 was generally well tolerated. The pivotal programme is expected
to commence in the fourth quarter of 2013.
7 August 2013 Corporate Release No 506 page 15 of 27
General corporate matters
Accounting policies
The interim report is presented in accordance with IAS 34 Interim financial reporting as adopted by the
EU and additional Danish disclosure requirements for the interim report of listed companies.
As of January 2013, Lundbeck has reallocated amortization on product rights, which were previously
recognized as sales and distribution costs, to cost of sales. The reallocation is to align cost of sales on
all products regardless of whether these are produced by Lundbeck or Lundbeck has purchased the
rights to the products and subsequently amortizes these.
In addition, comparative figures have been restated as a result of the changes to IAS 19 Employee
benefits effective from 1 January 2013. The consequence for Lundbeck is that actuarial gains and
losses must be recognized in the statement of comprehensive income instead of in the income
statement, and those gains and losses will not subsequently be recycled through profit or loss.
Comparative figures have been restated. The total effect of recognizing actuarial gains and losses in the
statement of comprehensive income are recognized in Q4. Please find the restated figures in the
financial statements on page 22.
Apart from the above-mentioned changes, accounting policies are unchanged compared to the annual
report for 2012, which contains a more detailed description of the Group’s accounting policies.
Protection of patents and other intellectual property rights
Intellectual property rights are a prerequisite for Lundbeck’s continued investments in innovative
pharmaceuticals. It is Lundbeck’s policy to enforce its granted intellectual property rights wherever they
may be violated. Lundbeck is involved in a number of trials around the world related to defending its
intellectual property rights. With regards to escitalopram, Lundbeck is presently involved in pending
court trials in Australia, Austria, Belgium, Brazil, Canada, Denmark, Finland, France, Germany,
Hungary, Lebanon, the Netherlands, Norway, Portugal, Saudi Arabia, Singapore and Turkey.
Fine from the European Commission
On 19 June Lundbeck received the European Commission's decision that the company's settlement
agreements concluded with four generic competitors concerning citalopram violated competition law.
Lundbeck strongly disagrees with the Commission's decision. It asserts that any settlement agreements
involving a transfer of value from an originator to a generic company is a restriction of competition and
the value transfer reflects an understanding that the patent is invalid or weak. This approach is
erroneous. There is no question about the validity of Lundbeck's process patents at issue. Patent
settlement agreements are efficiency enhancing and legitimate when there are bona fide grounds for
dispute.
The decision, that Lundbeck intends to appeal, included fining Lundbeck approximately DKK 700 million.

7 August 2013 Corporate Release No 506 page 16 of 27
Incentive plans in the Lundbeck Group
Lundbeck operates with Long-Term Incentive schemes (LTI) for the Executive Management and key
employees in Denmark and abroad. To fund the programmes granted in 2010, Lundbeck has during the
first quarter purchased treasury shares with a value of DKK 7 million, corresponding to 72,702 shares.
In June Executive Management and key employees were granted 463,481 restricted shares in H.
Lundbeck A/S. All of the restricted shares will vest in 2016, 3 years after grant, subject to Lundbeck
achieving its financial targets for vesting and subject to continuing employment with the Lundbeck Group
for the period from the grant in 2013 until the restricted shares have vested in 2016. Key employees in
the US subsidiaries were granted Restricted Cash Units on terms and conditions similar to those that
apply for the Restricted Share Unit program. The market value of the Restricted Share Units and the
Restricted Cash Units are calculated using the Black-Scholes method and is based on a volatility of
25.61%, a dividend yield of 2.00% a risk free interest rate of 0.21%, a vesting period of 3 years and a
share price of DKK 110.70. The total value of the programmes at the time of grant is DKK 48 million.
Conference call
Today at 2.00 pm (CET), Lundbeck will be hosting a conference call for the financial community. You
can listen to the call online at www.lundbeck.com under the investor section.

7 August 2013 Corporate Release No 506 page 17 of 27
MANAGEMENT STATEMENT
The Board of Directors and the Executive Management have discussed and adopted the interim report
of H. Lundbeck A/S for the period 1 January – 30 June 2013. The interim report is presented in
accordance with IAS 34 Interim financial reporting, as adopted by the EU and additional Danish
disclosure requirements for the interim reports of listed companies.
We consider the accounting policies applied to be appropriate. Accordingly, the interim report gives a
true and fair view of the Group’s assets, liabilities and financial position as of 30 June 2013, and of the
results of the Group’s operations and cash flows for the first half of 2013, which ended on 30 June 2013.
In our opinion, the Management’s report gives a true and fair view of activity developments, the Group’s
general financial position and the results for the period. It also gives a fair account of the significant risks
and uncertainty factors that may affect the Group.
The interim report has not been subject to audit or review.
Valby, 7 August 2013
Executive Management
Ulf Wiinberg
President and CEO
Anders Götzsche Anders Gersel Pedersen
Executive Vice President, CFO Executive Vice President, R&D
Board of Directors
Håkan Björklund Christian Dyvig Kim Rosenville Christensen
Chairman Deputy Chairman
Mona Elisabeth Elster Thorleif Krarup Melanie G. Lee
Jørn Mayntzhusen Lars Rasmussen Jes Østergaard
7 August 2013 Corporate Release No 506 page 18 of 27
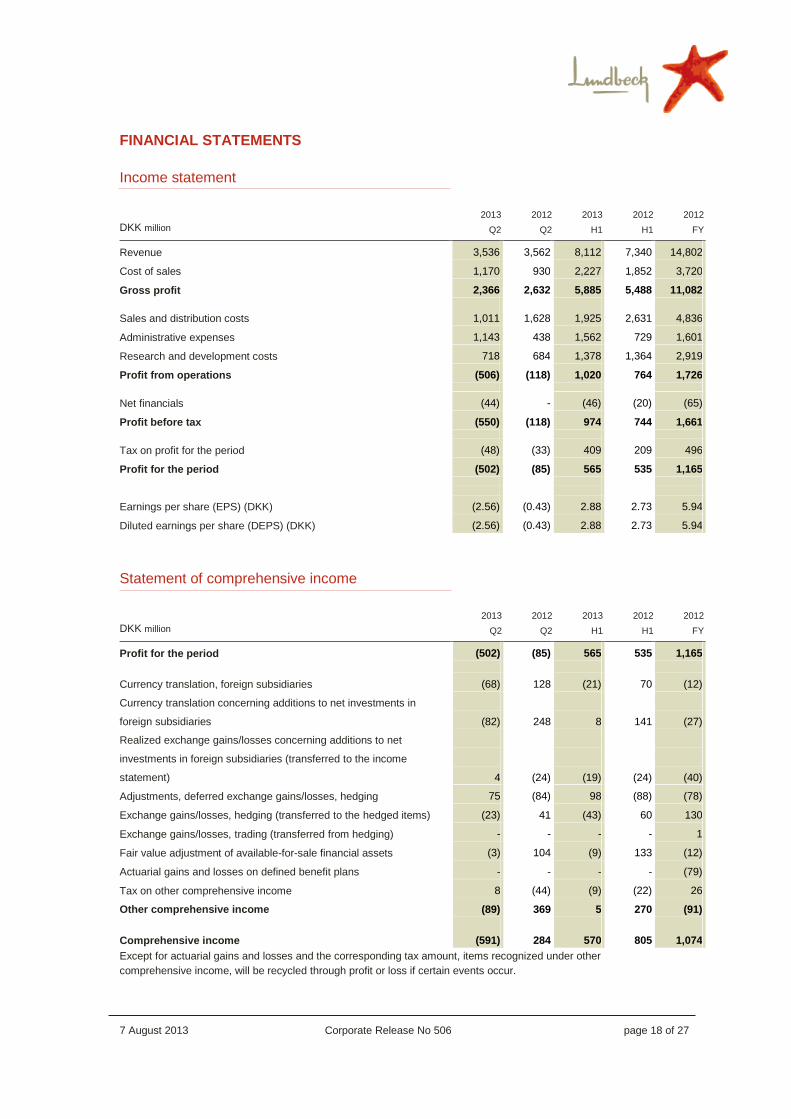
FINANCIAL STATEMENTS
Income statement
2013 2012 2013 2012 2012
DKK million Q2 Q2 H1 H1 FY
Revenue 3,536 3,562 8,112 7,340 14,802
Cost of sales 1,170 930 2,227 1,852 3,720
Gross profit 2,366 2,632 5,885 5,488 11,082
Sales and distribution costs 1,011 1,628 1,925 2,631 4,836
Administrative expenses 1,143 438 1,562 729 1,601
Research and development costs 718 684 1,378 1,364 2,919
Profit from operations (506) (118) 1,020 764 1,726
Net financials (44) - (46) (20) (65)
Profit before tax (550) (118) 974 744 1,661
Tax on profit for the period (48) (33) 409 209 496
Profit for the period (502) (85) 565 535 1,165
Earnings per share (EPS) (DKK) (2.56) (0.43) 2.88 2.73 5.94
Diluted earnings per share (DEPS) (DKK) (2.56) (0.43) 2.88 2.73 5.94
Statement of comprehensive income
2013 2012 2013 2012 2012
DKK million Q2 Q2 H1 H1 FY
Profit for the period (502) (85) 565 535 1,165
Currency translation, foreign subsidiaries (68) 128 (21) 70 (12)
Currency translation concerning additions to net investments in
foreign subsidiaries
(82)
248
8
141
(27)
Realized exchange gains/losses concerning additions to net
investments in foreign subsidiaries (transferred to the income
statement)
4
(24)
(19)
(24)
(40)
Adjustments, deferred exchange gains/losses, hedging 75 (84) 98 (88) (78)
Exchange gains/losses, hedging (transferred to the hedged items) (23) 41 (43) 60 130
Exchange gains/losses, trading (transferred from hedging) - - - - 1
Fair value adjustment of available-for-sale financial assets (3) 104 (9) 133 (12)
Actuarial gains and losses on defined benefit plans - - - - (79)
Tax on other comprehensive income 8 (44) (9) (22) 26
Other comprehensive income (89) 369 5 270 (91)
Comprehensive income (591) 284 570 805 1,074
Except for actuarial gains and losses and the corresponding tax amount, items recognized under other
comprehensive income, will be recycled through profit or loss if certain events occur.

7 August 2013 Corporate Release No 506 page 19 of 27
Balance sheet
DKK million
Assets 30.06.2013 30.06.2012 31.12.2012
Intangible assets 9,117 9,556 9,028
Property, plant and equipment 2,773 2,788 2,793
Financial assets 981 624 561
Non-current assets 12,871 12,968 12,382
Inventories 1,611 1,539 1,730
Receivables 4,373 3,492 3,649
Securities 1,041 1,054 1,055
Cash 3,485 1,640 2,747
Current assets 10,510 7,725 9,181
Assets 23,381 20,693 21,563
Equity and liabilities
Share capital 980 980 980
Share premium 227 226 226
Currency translation reserve (240) 9 (211)
Currency hedging reserve 44 (57) 3
Retained earnings 12,380 11,749 12,200
Equity 13,391 12,907 13,198
Provisions 1,469 1,322 1,494
Debt 1,873 1,889 1,890
Non-current liabilities 3,342 3,211 3,384
Provisions 269 632 375
Debt 18 19 19
Trade payables 1,528 1,252 1,599
Other payables 4,833 2,672 2,988
Current liabilities 6,648 4,575 4,981
Liabilities 9,990 7,786 8,365
Equity and liabilities 23,381 20,693 21,563

7 August 2013 Corporate Release No 506 page 20 of 27
Statement of changes in equity at 30 June 2013
Share premium
Currency translation
reserve
Currency hedging reserve
DKK million Share capital
Retained earnings
2013 Equity
Equity at 01.01.2013 980 226 (211) 3 12,200 13,198
Profit for the period - - - - 565 565
Other comprehensive income - - (29) 41 (7) 5
Comprehensive income - - (29) 41 558 570
Distributed dividends - - - - (392) (392)
Capital increase through the exercise of
warrants
-
1
-
-
-
1
Buyback of treasury shares - - - - (7) (7)
Incentive programmes - - - - 21 21
Other transactions - 1 - - (378) (377)
Equity at 30.06.2013 980 227 (240) 44 12,380 13,391
2012
Equity at 01.01.2012 980 226 (149) (36) 11,755 12,776
Profit for the period - - - - 535 535
Other comprehensive income - - 158 (21) 133 270
Comprehensive income - - 158 (21) 668 805
Distributed dividends - - - - (685) (685)
Buyback of treasury shares - - - - (21) (21)
Incentive programmes - - - - 32 32
Other transactions - - - - (674) (674)
Equity at 30.06.2012 980 226 9 (57) 11,749 12,907
7 August 2013 Corporate Release No 506 page 21 of 27
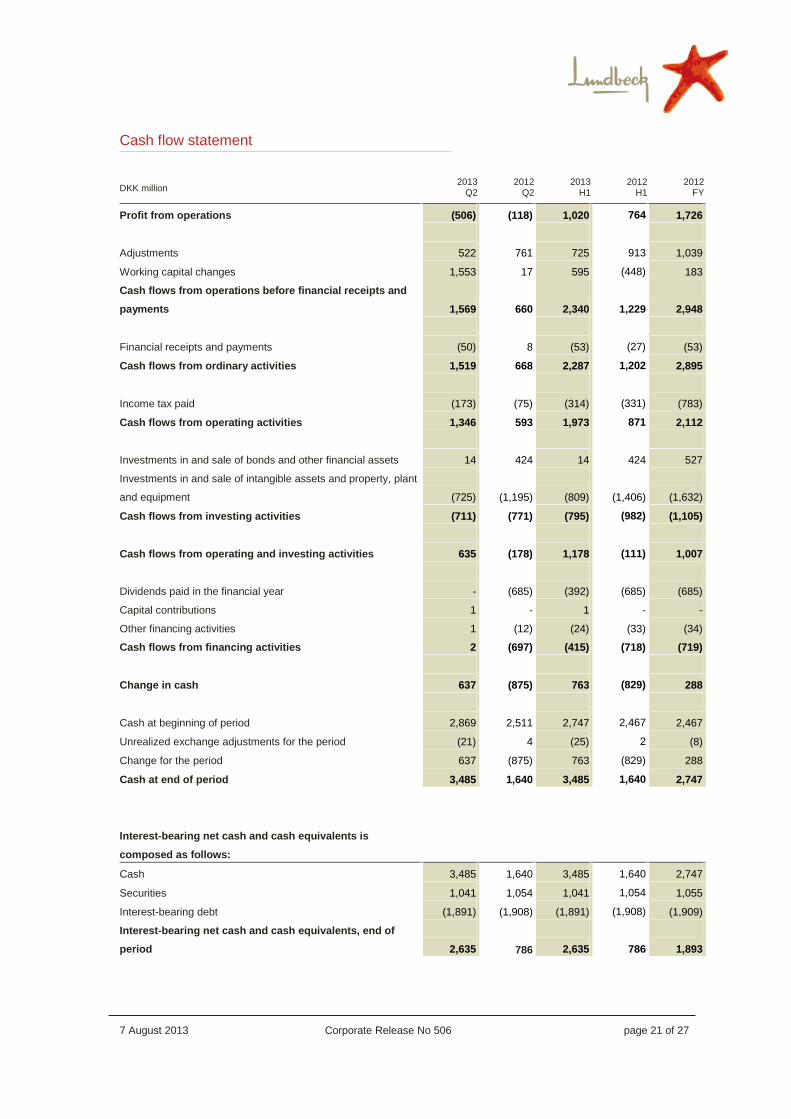
Cash flow statement
2013 Q2
2012 Q2
2013 H1
2012 H1
2012 FY
DKK million
Profit from operations (506) (118) 1,020 764 1,726
Adjustments 522 761 725 913 1,039
Working capital changes 1,553 17 595 (448) 183
Cash flows from operations before financial receipts and
payments 1,569 660 2,340
1,229 2,948
Financial receipts and payments (50) 8 (53) (27) (53)
Cash flows from ordinary activities 1,519 668 2,287 1,202 2,895
Income tax paid (173) (75) (314) (331) (783)
Cash flows from operating activities 1,346 593 1,973 871 2,112
Investments in and sale of bonds and other financial assets 14 424 14 424 527
Investments in and sale of intangible assets and property, plant
and equipment (725) (1,195) (809)
(1,406) (1,632)
Cash flows from investing activities (711) (771) (795) (982) (1,105)
Cash flows from operating and investing activities 635 (178) 1,178 (111) 1,007
Dividends paid in the financial year - (685) (392) (685) (685)
Capital contributions 1 - 1 - -
Other financing activities 1 (12) (24) (33) (34)
Cash flows from financing activities 2 (697) (415) (718) (719)
Change in cash 637 (875) 763 (829) 288
Cash at beginning of period 2,869 2,511 2,747 2,467 2,467
Unrealized exchange adjustments for the period (21) 4 (25) 2 (8)
Change for the period 637 (875) 763 (829) 288
Cash at end of period 3,485 1,640 3,485 1,640 2,747
Interest-bearing net cash and cash equivalents is
composed as follows:
Cash 3,485 1,640 3,485 1,640 2,747
Securities 1,041 1,054 1,041 1,054 1,055
Interest-bearing debt (1,891) (1,908) (1,891) (1,908) (1,909)
Interest-bearing net cash and cash equivalents, end of
period 2,635 786 2,635
786 1,893
7 August 2013 Corporate Release No 506 page 22 of 27
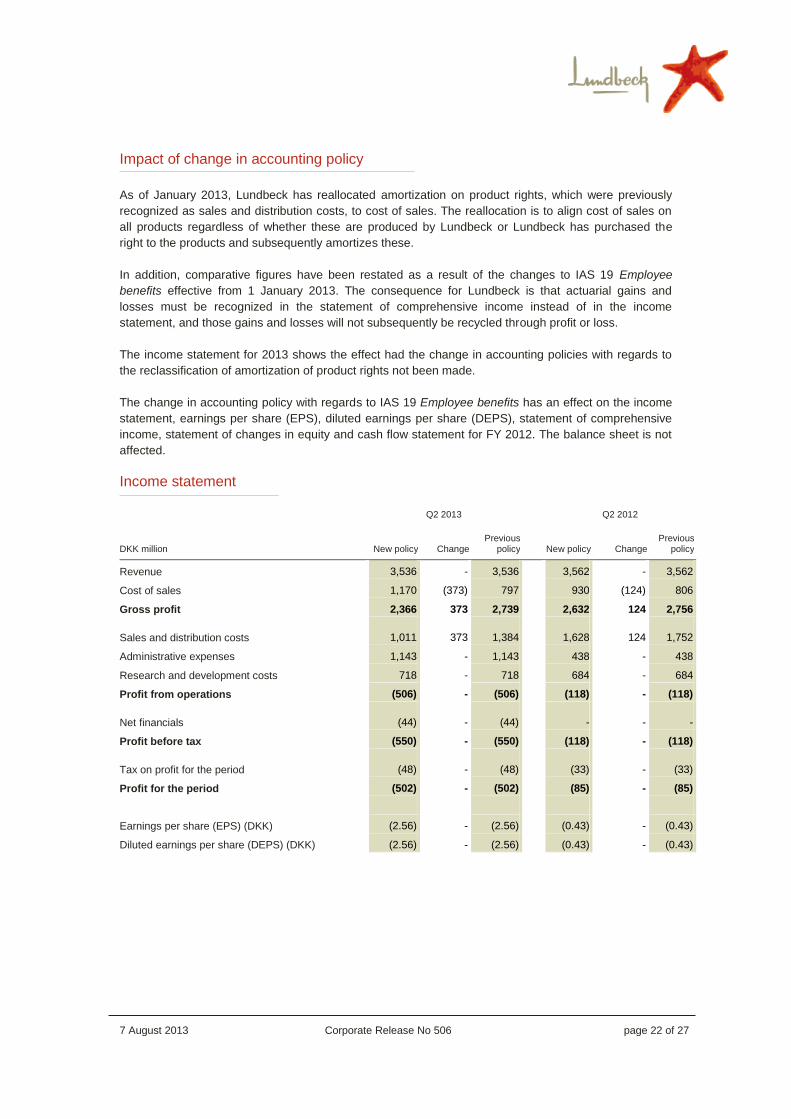
Impact of change in accounting policy
As of January 2013, Lundbeck has reallocated amortization on product rights, which were previously
recognized as sales and distribution costs, to cost of sales. The reallocation is to align cost of sales on
all products regardless of whether these are produced by Lundbeck or Lundbeck has purchased the
right to the products and subsequently amortizes these.
In addition, comparative figures have been restated as a result of the changes to IAS 19 Employee
benefits effective from 1 January 2013. The consequence for Lundbeck is that actuarial gains and
losses must be recognized in the statement of comprehensive income instead of in the income
statement, and those gains and losses will not subsequently be recycled through profit or loss.
The income statement for 2013 shows the effect had the change in accounting policies with regards to
the reclassification of amortization of product rights not been made.
The change in accounting policy with regards to IAS 19 Employee benefits has an effect on the income
statement, earnings per share (EPS), diluted earnings per share (DEPS), statement of comprehensive
income, statement of changes in equity and cash flow statement for FY 2012. The balance sheet is not
affected.
Income statement
Q2 2013 Q2 2012
DKK million New policy Change Previous
policy
New policy Change Previous
policy
Revenue 3,536 - 3,536 3,562 - 3,562
Cost of sales 1,170 (373) 797 930 (124) 806
Gross profit 2,366 373 2,739 2,632 124 2,756
Sales and distribution costs 1,011 373 1,384 1,628 124 1,752
Administrative expenses 1,143 - 1,143 438 - 438
Research and development costs 718 - 718 684 - 684
Profit from operations (506) - (506) (118) - (118)
Net financials (44) - (44) - - -
Profit before tax (550) - (550) (118) - (118)
Tax on profit for the period (48) - (48) (33) - (33)
Profit for the period (502) - (502) (85) - (85)
Earnings per share (EPS) (DKK) (2.56) - (2.56) (0.43) - (0.43)
Diluted earnings per share (DEPS) (DKK) (2.56) - (2.56) (0.43) - (0.43)
7 August 2013 Corporate Release No 506 page 23 of 27
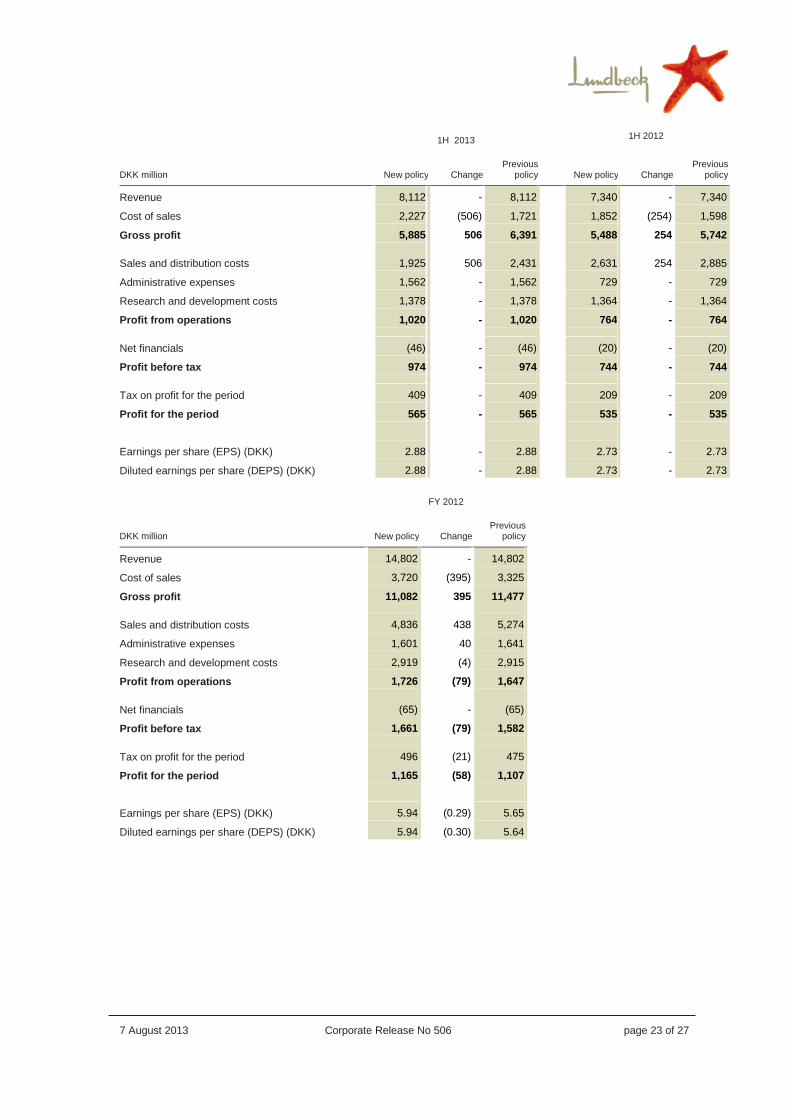
1H 2013 1H 2012
FY 2012
DKK million New policy Change Previous
policy
New policy Change Previous
policy
Revenue 8,112 - 8,112 7,340 - 7,340
Cost of sales 2,227 (506) 1,721 1,852 (254) 1,598
Gross profit 5,885 506 6,391 5,488 254 5,742
Sales and distribution costs 1,925 506 2,431 2,631 254 2,885
Administrative expenses 1,562 - 1,562 729 - 729
Research and development costs 1,378 - 1,378 1,364 - 1,364
Profit from operations 1,020 - 1,020 764 - 764
Net financials (46) - (46) (20) - (20)
Profit before tax 974 - 974 744 - 744
Tax on profit for the period 409 - 409 209 - 209
Profit for the period 565 - 565 535 - 535
Earnings per share (EPS) (DKK) 2.88 - 2.88 2.73 - 2.73
Diluted earnings per share (DEPS) (DKK) 2.88 - 2.88 2.73 - 2.73
FY 2012
DKK million New policy Change Previous
policy
Revenue 14,802 - 14,802
Cost of sales 3,720 (395) 3,325
Gross profit 11,082 395 11,477
Sales and distribution costs 4,836 438 5,274
Administrative expenses 1,601 40 1,641
Research and development costs 2,919 (4) 2,915
Profit from operations 1,726 (79) 1,647
Net financials (65) - (65)
Profit before tax 1,661 (79) 1,582
Tax on profit for the period 496 (21) 475
Profit for the period 1,165 (58) 1,107
Earnings per share (EPS) (DKK) 5.94 (0.29) 5.65
Diluted earnings per share (DEPS) (DKK) 5.94 (0.30) 5.64
7 August 2013 Corporate Release No 506 page 24 of 27
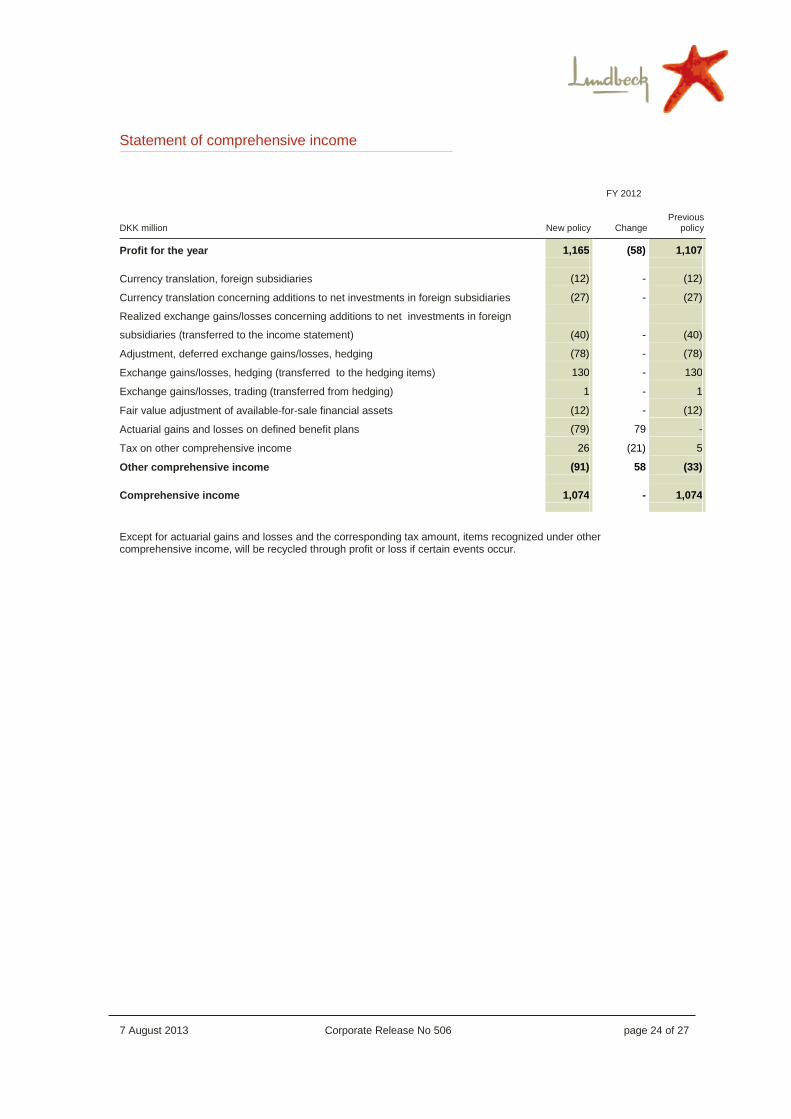
Statement of comprehensive income
FY 2012
DKK million New policy Change Previous
policy
Profit for the year 1,165 (58) 1,107
Currency translation, foreign subsidiaries (12) - (12)
Currency translation concerning additions to net investments in foreign subsidiaries (27) - (27)
Realized exchange gains/losses concerning additions to net investments in foreign
subsidiaries (transferred to the income statement)
(40)
-
(40)
Adjustment, deferred exchange gains/losses, hedging (78) - (78)
Exchange gains/losses, hedging (transferred to the hedging items) 130 - 130
Exchange gains/losses, trading (transferred from hedging) 1 - 1
Fair value adjustment of available-for-sale financial assets (12) - (12)
Actuarial gains and losses on defined benefit plans (79) 79 -
Tax on other comprehensive income 26 (21) 5
Other comprehensive income (91) 58 (33)
Comprehensive income 1,074 - 1,074
Except for actuarial gains and losses and the corresponding tax amount, items recognized under other comprehensive income, will be recycled through profit or loss if certain events occur.
7 August 2013 Corporate Release No 506 page 25 of 27
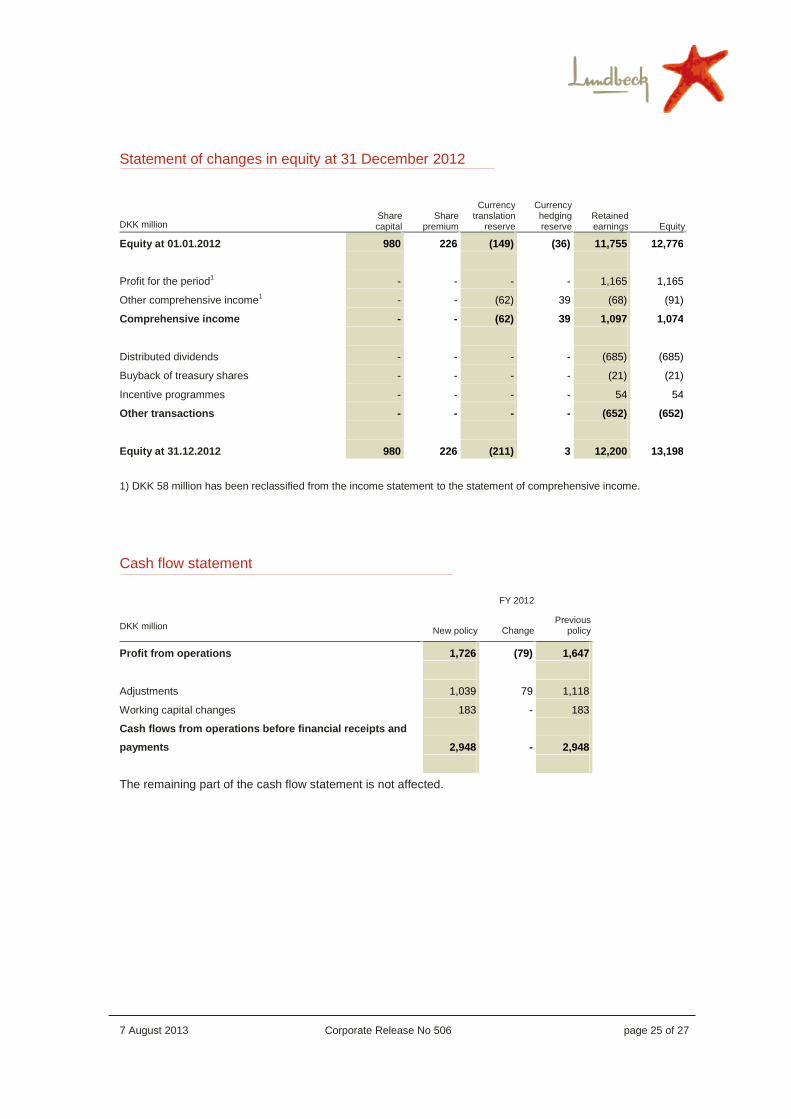
Statement of changes in equity at 31 December 2012
Share premium
Currency translation
reserve
Currency hedging reserve
Share capital
Retained earnings
DKK million Equity
Equity at 01.01.2012 980 226 (149) (36) 11,755 12,776
Profit for the period1 - - - - 1,165 1,165
Other comprehensive income1 - - (62) 39 (68) (91)
Comprehensive income - - (62) 39 1,097 1,074
Distributed dividends - - - - (685) (685)
Buyback of treasury shares - - - - (21) (21)
Incentive programmes - - - - 54 54
Other transactions - - - - (652) (652)
Equity at 31.12.2012 980 226 (211) 3 12,200 13,198
1) DKK 58 million has been reclassified from the income statement to the statement of comprehensive income.
Cash flow statement
FY 2012
New policy Change Previous
policy DKK million
Profit from operations 1,726 (79) 1,647
Adjustments 1,039 79 1,118
Working capital changes 183 - 183
Cash flows from operations before financial receipts and
payments 2,948 - 2,948
The remaining part of the cash flow statement is not affected.

7 August 2013 Corporate Release No 506 page 26 of 27
FINANCIAL CALENDAR 2013
6 November 2013 Third quarter report 2013
Corporate releases since the annual report
16 July 2013 Phase II clinical data show statistically significant improvement for Lu AE58054 as add-on to donepezil, versus donepezil alone, on cognitive symptoms of Alzheimer’s disease
19 June 2013 Lundbeck intends to appeal the decision from the European Commission
7 June 2013 Following the announcement 1 May 2013, Lundbeck today announces the total value of the 2013 long-term incentive programme for Executive Management and key employees
22 May 2013 Vortioxetine, a new multimodal agent in development for the treatment of major depression, shows effects on cognitive function in several preclinical animal models
18 May 2013 Vortioxetine clinical phase III data show significant improvement in symptoms of major depression
16 May 2013 Lundbeck increases its share capital by 9,772 shares (0.005% of outstanding shares) as a result of employee warrant exercise
1 May 2013 Lundbeck is well on track to deliver on guidance for 2013 (Q1 release)
8 April 2013 Lundbeck announces positive results for Brintellix™ (vortioxetine) in adult
patients with major depression and inadequate response to SSRI or SNRI
therapy
26 March 2013 Lundbeck and Otsuka further expand their alliance and enter into
collaboration for the development and commercialization of Lu AE58054 in
development for Alzheimer's disease
21 March 2013 Lundbeck held its Annual General Meeting on 21 March 2013 at the
company's registered office
28 February 2013 FDA approves once-monthly Abilify Maintena (aripiprazole) for extended-
release injectable suspension for the treatment of schizophrenia
28 February 2013 Lundbeck receives European marketing authorization for Selincro as the first
therapy approved for the reduction of alcohol consumption
22 February 2013 Announcement of transactions with shares and linked securities in H.
Lundbeck A/S made by executives and their closely associated persons and
legal entities
20 February 2013 Notice of Annual General Meeting
20 February 2013 Lundbeck elects new chairman
For more information, please visit www.lundbeck.com.

7 August 2013 Corporate Release No 506 page 27 of 27
Lundbeck contacts
Investors: Media:
Palle Holm Olesen Mads Kronborg
Chief Specialist, Investor Relations Media Relations Manager
[email protected] [email protected]
+45 36 43 24 26 +45 36 43 28 51
Jens Høyer
Investor Relations Officer
+45 36 43 33 86
About Lundbeck
Lundbeck is a global pharmaceutical company highly committed to improving the quality of life of people
living with brain diseases. For this purpose, Lundbeck is engaged in the entire value chain throughout
research, development, production, marketing and sales of pharmaceuticals across the world. The
company’s products are targeted at disorders such as depression and anxiety, psychotic disorders,
epilepsy, Huntington’s, Alzheimer’s and Parkinson’s diseases. Lundbeck’s pipeline consists of several
mid- to late- stage development programs.
Lundbeck employs more than 5,800 people worldwide, 2,000 of whom are based in Denmark. We have
employees in 57 countries, and our products are registered in more than 100 countries. We have
research centers in Denmark, China and the United States and production facilities in Italy, France,
Mexico, China and Denmark. Lundbeck generated revenue of approximately DKK 15 billion in 2012.
Lundbeck’s shares are listed on the stock exchange in Copenhagen under the symbol ”LUN”. Lundbeck
has a sponsored Level 1 ADR programme listed in the US (OTC) under the symbol ”HLUYY”. For
additional information, we encourage you to visit our corporate site www.lundbeck.com


![[Product Monograph Template - Standard] - Lundbeck](https://img.pdfslide.us/doc/110x75/6204ee4b4c89d3190e0ca945/product-monograph-template-standard-lundbeck.jpg)


