Embed Size (px)
Citation preview

Novo mesto, July 2016
Unaudited Interim Report for the
Krka Group and the Krka Company
for the First Half of 2016

2 Unaudited Interim Report for the Krka Group and the Krka Company for the First Half of 2016
CONTENTS Introduction .............................................................................................................................................................. 3
Highlights of the first half of 2016 ........................................................................................................................ 3
Krka Group and Krka Company financial highlights ............................................................................................ 4
Events after the reporting period ......................................................................................................................... 5
Krka Group ID card ............................................................................................................................................. 6
Krka Group business model ................................................................................................................................ 6
Krka Group companies ....................................................................................................................................... 7
Krka Group development strategy....................................................................................................................... 8
Business report ...................................................................................................................................................... 10
Financial risk ..................................................................................................................................................... 10
Investor and share information .......................................................................................................................... 12
Business operations analysis ............................................................................................................................ 14
Marketing and sales .......................................................................................................................................... 16
Research and development .............................................................................................................................. 26
Investments ....................................................................................................................................................... 27
Employees ........................................................................................................................................................ 28
Condensed consolidated financial statements of the Krka Group, with notes ....................................................... 30
Consolidated statement of financial position of the Krka Group ........................................................................ 30
Consolidated income statement of the Krka Group ........................................................................................... 31
Consolidated statement of other comprehensive income of the Krka Group .................................................... 32
Consolidated statement of changes in equity of the Krka Group ...................................................................... 33
Consolidated statement of cash flows of the Krka Group.................................................................................. 35
Segment reporting of the Krka Group ............................................................................................................... 36
Notes to the consolidated financial statements of the Krka Group .................................................................... 37
Condensed financial statements of Krka, d. d., Novo mesto, with notes ............................................................... 43
Statement of financial position of Krka, d. d., Novo mesto ................................................................................ 43
Income statement of Krka, d. d., Novo mesto ................................................................................................... 44
Statement of other comprehensive income of Krka, d. d., Novo mesto ............................................................ 44
Statement of changes in equity of Krka, d. d., Novo mesto .............................................................................. 45
Statement of cash flows of Krka, d. d., Novo mesto .......................................................................................... 47
Segment reporting of Krka, d. d., Novo mesto .................................................................................................. 48
Notes to the financial statements of Krka, d. d., Novo mesto ............................................................................ 49
Management Board statement of responsibilities .................................................................................................. 55

Unaudited Interim Report for the Krka Group and the Krka Company for the First Half of 2016 3
INTRODUCTION
The condensed financial statements of the Krka Group and the condensed financial statements of Krka, d. d., Novo mesto (Krka Company), for the first half of 2016 and for the first half of 2015 are unaudited, while the statements for the full business year 2015 present audited figures. The Krka Company has no authorised capital and has not made a conditional share capital increase. The Krka Company promptly announces all significant changes of the data in its listing prospectus in the Ljubljana Stock Exchange
electronic information dissemination system SEOnet, in the Polish Financial Supervision Authority electronic information dissemination system (ESPI), and/or in the Delo daily newspaper. This interim report for the Krka Group and the Krka Company is available on the Krka website www.krka.si. The Supervisory Board discussed the 2016 half-year report for the Krka Group and the Krka Company at its regular meeting on 27 July 2016.
Highlights of the first half of 2016 • The Krka Group sold €603.8 million worth of
products and services, and Krka Company sales amounted to €539.7 million.
• The Krka Group sales were up 1% compared to the same period last year, with the Krka Company sales down 5%. The volume of products sold was up 12%.
• The highest absolute as well as relative year-on-year sales growth (up €16.3 million, or 27%) was recorded in Region South-East Europe.
• Contributing 29.1% of total sales, Krka’s largest
sales region is East Europe. • The Group generated 93%, and the Company
95% of its sales revenues in markets outside Slovenia.
• The Krka Group generated €94.3 million of
operating profit, a 10% year-on-year decrease. The Krka Company reported €75.1 million of operating profit, down 24% from the same period last year. The decrease was due to declining prices of pharmaceuticals in individual markets, and due to less favourable average
exchange rates of some currencies compared to the same period last year.
• The Krka Group reported a net profit of €70.1
million, down 38% compared to the same period last year, while the Krka Company generated €56.2 million of net profit, down 48%. Both were attributable to lower operating profit and, in addition, to the negative net financial result due to financial expenses from forward contracts. In the six months to June last year the Krka Company and the Krka Group reported a positive net financial result.
• As at 30 June 2016 Krka's share traded at
€57.15 on the Ljubljana Stock Exchange, down 12% from the year-end of 2015. Krka Company's market capitalisation amounted to €1.9 billion.
• The Krka Group allocated €61.8 million to
investments in the reported period, of which the Krka Company invested €30.0 million and subsidiaries €31.8 million.
• At the end of the first half of 2016 the Krka Group had 10,821 employees, which is 257 or 2.4% more than at the beginning of the year.

4 Unaudited Interim Report for the Krka Group and the Krka Company for the First Half of 2016
Krka Group and Krka Company financial highlights
In € thousand
Krka Group Krka Company
1–6/2016 1–6/2015 1–6/2016 1–6/2015
Revenues 603,803 599,850 539,658 569,878
EBIT1 94,300 104,332 75,135 98,521
EBITDA 147,098 157,255 116,380 139,222
Net profit 70,116 112,289 56,226 108,473
R&D expenses 58,735 56,446 61,533 58,634
Investments 61,755 45,397 30,022 37,832
30 Jun 2016 31 Dec 2015 30 Jun 2016 31 Dec 2015
Non-current assets 1,007,181 986,598 1,019,162 999,975
Current assets 921,442 822,606 841,371 761,737
Equity 1,485,829 1,405,984 1,487,256 1,433,211
Non-current liabilities 109,962 110,982 76,147 76,753
Current liabilities 332,832 292,238 297,130 251,748
RATIOS 1–6/2016 1–6/2015 1–6/2016 1–6/2015
EBIT margin 15.6% 17.4% 13.9% 17.3%
EBITDA margin 24.4% 26.2% 21.6% 24.4%
Profit margin (ROS) 11.6% 18.7% 10.4% 19.0%
ROE2 9.7% 15.9% 7.7% 15.1%
ROA3 7.5% 12.2% 6.2% 12.0%
Liabilities/Equity 0.298 0.280 0.251 0.251
R&D costs/Revenues 9.7% 9.4% 11.4% 10.3%
NUMBER OF EMPLOYEES (as at) 30 Jun 2016 31 Dec 2015 30 Jun 2016 31 Dec 2015
10,821 10,564 4,849 4,798
SHARE INFORMATION 1–6/2016 1–6/2015
Total number of shares issued 32,793,448 32,793,448
Earnings per share in €4 4.32 6.89
Closing price at end of period in €5 57.15 65.00
Price/Earnings ratio (P/E) 13.22 9.43
Book value in €6 45.31 45.02
Price/Book ratio (P/B) 1.26 1.44
Market capitalisation in € thousand (end of period) 1,874,146 2,131,574
1 Difference between operating income and expenses
2 Net profit, annualised/Average shareholders' equity in the period 3 Net profit, annualised/Average total assets in the period 4 Net profit attributable to equity holders of the Group, annualised/Average number of shares issued in the period exclusive of treasury shares
5 Share price on the Ljubljana Stock Exchange
6 Equity at the end of the period/Total shares issued
Unaudited Interim Report for the Krka Group and the Krka Company for the First Half of 2016 5
Events after the reporting period
On 7 July 2016 Krka, tovarna zdravil, d. d., Novo mesto, held its 22nd Annual General Meeting in Hotel Šport in Otočec, Slovenia. At the AGM, shareholders passed the resolution proposed by the Management Board and Supervisory Board to allocate €186,908,421.49 of the 2015 accumulated profit as follows:
• €85.932.525,20 for dividends (€2.65 gross per share),
• €50,487,948.14 for other revenue reserves, and • €50,487,948.15 for retained earnings. Dividend pay-outs are to commence within 30 days of the AGM, to shareholders recorded in the share register of the Central Securities Clearing Corporation (KDD – Centralna klirinško depotna družba, d. d., Ljubljana) as at 12 July 2016.
Shareholders approved and gave their consent to the work of the Management Board and Supervisory
Board for the financial year 2015, and discharged them from liability for the performance of their duties.
The AGM took note of the termination of Matej Pirc's status of member and President of the Supervisory Board of Krka, d. d., Novo mesto, effective as at the day of the AGM, due to his resignation. Shareholders elected Dr Boris Žnidarič the new member of the Supervisory Board and shareholder representative, his term-in-office effective from the day of election until 19 August 2020 inclusive.
Shareholders also approved the proposed amendments of the Articles of Association, which will take effect as at the day they are entered into the court register.
Shareholders appointed Ernst & Young Revizija, poslovno svetovanje, d. o. o., Ljubljana, as the auditor for the business year 2016.
6 Unaudited Interim Report for the Krka Group and the Krka Company for the First Half of 2016
Krka Group ID card The controlling company in the Krka Group is Krka, tovarna zdravil, d. d., Novo mesto (Krka d. d. or the Krka Company). Registered office Šmarješka cesta 6, 8501 Novo mesto, Slovenia Telephone ++386 7 331 21 11 Fax ++386 7 332 15 37 E-mail [email protected] Website www.krka.si Core business Production of pharmaceutical preparations Business clarification code 21.200
Year established 1954 Registration entry 1/00097/00, District Court of Novo mesto, Slovenia Tax number 82646716 VAT number SI82646716 Company ID number 5043611 Share capital €54,732,264.71 Number of issued shares 32,793,448 ordinary registered no-par value shares with the symbol KRKG. Krka’s shares have been listed on the Ljubljana Stock Exchange under symbol KRKG since 1997, and since April 2012 additionally on the Warsaw Stock Exchange under symbol KRK.
Krka Group business model Krka is one of the world’s leading generic pharmaceutical companies. Its registered office is in Slovenia and it has over 60 years of experience in the industry. Krka is the leader in the Slovenian market, and it has a significant presence in the generic pharmaceutical markets of Eastern, Central and South-Eastern Europe, having been increasingly gaining visibility in Western European markets in recent years as well. We have been strengthening our presence in overseas markets, aiming to further exploit the sales potential of the Middle East, Far East, Africa, and the Americas. Our production and distribution facilities are in Slovenia, the Russian Federation, Poland, Croatia and Germany. Our modern pharmaceutical production and vertically integrated business model allow us to provide patients in over 70 countries with a wide range of safe, high quality and effective prescription pharmaceuticals, non-prescription products and animal health products. Krka's product assortment primarily consists of solid dosage pharmaceutical forms. The product assortment is supplemented by the health resort and tourist services of Terme Krka.
We focus on generic prescription pharmaceuticals marketed under Krka's own brands. We offer numerous medicinal products for the treatment of conditions from key therapeutic areas, including pharmaceuticals for cardiovascular diseases, for alimentary and metabolic diseases, and for diseases of the central nervous system, having also been entering new therapeutic areas (oncology and antiviral medicines), and selected areas also with non-prescription products. By establishing subsidiaries in selected markets we have been expanding our marketing and sales network, thereby gaining market shares. Our objective is to strengthen the Krka Group's market position in European and Central Asian markets, and to enter new high-potential markets. Wishing to increase the competitive advantage of our product assortment we have been allocating a substantial proportion of our sales revenues to research and development, with more than 170 new products currently in the pipeline. A substantial proportion of our revenues are generated by the sales of new products launched on different markets in the past five years.

Unaudited Interim Report for the Krka Group and the Krka Company for the First Half of 2016 7
Krka Group companies
The controlling company, Krka, d. d., Novo mesto, holds 100% ownership stakes in all of the above subsidiaries apart from Farma GRS (99.7%) and
Krka Belgium (95%); the remaining 5% in the latter is held by the subsidiary Krka France Eurl a capital variable.
Russian Federation OOO KRKA-RUS
Russian Federation OOO KRKA FARMA
East Europe
Poland KRKA - POLSKA, Sp. z o.o.
Hungary
KRKA Magyarország Kft.
Central Europe
KRKA, d. d., Novo mesto
TERME KRKA, d. o. o., Novo mesto
Slovenia
West Europe
Spain
KRKA FARMACÉUTICA, S.L.
Sweden Krka Sverige AB
Ireland KRKA PHARMA DUBLIN LIMITED
Portugal KRKA Farmacêutica, Unipessoal Lda.
Germany
TAD Pharma GmbH
Austria KRKA Pharma GmbH, Wien
Slovakia
KRKA Slovensko, s. r. o.
Czech Republic KRKA ČR, s. r. o.
Croatia KRKA-FARMA, d. o. o.
Serbia
KRKA-FARMA DOO BEOGRAD
Macedonia
KRKA-FARMA DOOEL Skopje
South-East Europe
Romania
KRKA ROMANIA S.R.L.
Bosnia and Herzegovina
KRKA FARMA d. o. o., Sarajevo
Lithuania UAB KRKA Lietuva
Ukraine
TOV KRKA UKRAINA
Latvia SIA KRKA Latvia
Italy KRKA FARMACEUTICI MILANO S.R.L.
France KRKA France Eurl a capital variable
Belgium KRKA Belgium, SA
Farma GRS, d. o. o., Novo mesto
Kazakhstan
TOO KRKA Kazahstan
Other subsidiaries outside Slovenia Production and distribution companies
EU project: research and development company Health resort and tourist services company
USA
KRKA USA LLC Bulgaria
KRKA Bulgaria EOOD
Overseas Markets
UK KRKA UK Ltd
Finland KRKA Finland Oy
8 Unaudited Interim Report for the Krka Group and the Krka Company for the First Half of 2016
Krka Group development strategy The Krka Group updates its development strategy on a bi-annual basis. In November 2015 the Krka Company Management Board adopted the Group's Development Strategy for the period 2016–2020, and presented it to the Supervisory Board. The success of implementing strategic objectives is measured against performance criteria set at the level of the Group, at the level of product groups and at the level of business functions. Performance
at the level of the Group is monitored by the Management Board, while performance at the level of product and service groups as well as business functions is monitored by the relevant committees. The key principle in managing performance criteria is increasing competitiveness of the entire Group and of each company individually. The key Krka Group objectives and strategies to 2020 are set out below.
Key strategic objectives to 2020 • To attain at least 5% average annual growth in
sales in terms of volume.
• To ensure, in addition to organic growth, growth with acquisitions and long-term partnerships (including joint ventures).
• To allocate a few hundred million euros for take-overs of interesting and available companies in the five-year strategic period.
• To ensure that new products account for at least one third of total sales.
• To launch the selected product portfolio in our target markets as the first generic pharmaceutical company.
• To strengthen the competitive advantage of our product portfolio.
• To maintain the largest possible share of vertically integrated products.
• To improve the cost-effective use of all assets.
• To increase product cost-effectiveness.
• To improve all business functions in innovative ways.
• To maintain independence.
Key strategies to 2020 • To focus primarily on European and central
Asian markets.
• To maximise the sales potential in all sales regions (Slovenia, South-East Europe, East Europe, Central Europe, West Europe, Overseas Markets).
• To strengthen our presence in key markets (Slovenia, Croatia, Romania, Ukraine, Russian Federation, Poland, Hungary, Czech Republic, Slovakia, West Europe), focus on key customers and key products.
• To establish and strengthen our presence in Western European markets by operating through our own marketing-and-sales companies and by marketing products under our own brands.
• To strengthen the pharmaceutical and chemical industries and increase the range of prescription products in three key therapeutic areas (medicines for the treatment of
cardiovascular diseases, the alimentary tract and metabolism, and the central nervous system) while entering new therapeutic areas (oncology, anti-virus medicines, similar biological medicines) and expanding the range of non-prescription products in the selected therapeutic areas.
• To enhance vertical integration from development through to product manufacture.
• To ensure a permanent supply of incoming materials, and optimise purchasing by continually reducing purchase prices.
• To develop generic medicines and prepare marketing authorisation documents before the expiry of the patent on the original medicine.
• To strengthen all kinds of connections with external institutions and companies in the field of development.

Unaudited Interim Report for the Krka Group and the Krka Company for the First Half of 2016 9
• To increase investments in production and development capacities and infrastructure.
• To seek possibilities of acquiring local pharmaceutical companies, plan take-overs and mergers and various kinds of long-term business arrangements (joint ventures) in selected markets in order to comply with the primary objective of attaining market shares and entering new therapeutic fields.
• To reduce the impact of financial and economic risks on the Krka Group’s operations.
• To pursue a dividend-increase policy, whereby up to 50% of the consolidated profit of major shareholders generated in the year before is allocated to dividends in consideration of the Group’s financial requirements for investments and mergers in each year.
• To be open to new business connections (networking) with high potential in relevant projects.
• To strengthen the professional and cost synergy of the Krka Group, and maximise the utilisation of competitive advantages in the business environments in which Krka companies operate abroad.
• To enhance the internationalisation of all business functions by maintaining English and Russian as the key languages of communication throughout the Group.
• To engage enterprise- and goal-oriented internal human resources.
• To meet our economic, social and environmental responsibilities to the environments in which we operate.
• To operate in accordance with the principles of business excellence and thereby strengthen the identity and positive public image of the Krka Group.
Krka Group business objectives for 2016
• Product and service sales are expected to total €1,210 million.
• Sales in markets outside Slovenia are expected to account for 93% of total sales.
• Prescription pharmaceuticals will remain the most important product group, accounting for 83% of total sales.
• Profit is planned to amount to €160 million.
• We plan for the number of employees to increase both in Slovenia and abroad, together by more than 4%.
• €162 million has been allocated to investments, primarily for expanding and modernising production capacities, research and development capacities, and infrastructure.
10 Unaudited Interim Report for the Krka Group and the Krka Company for the First Half of 2016
Financial risk
Foreign exchange risk
Due to its widespread international operations, the Krka Group is exposed to foreign exchange risk in certain sales markets. Foreign exchange markets and commodity markets experienced major volatility in the first six months this year. In January and the first half of February currencies important for Krka depreciated amidst uncertainties related to China's economic growth and price drops in global stock markets. The depreciation of the Russian rouble in this period was underlined by the parallel decline in oil prices. Oil prices began to increase gradually, yet unsteadily, in the second half of February. Oil prices rose despite failed talks by the key producers to limit output, and despite the fact that data on global production and supplies of oil did not imply a reduction in the surplus of supply over demand. Expectations about the world's main central banks' measures and the measures actually taken in the first half-year additionally fuelled volatility in foreign exchange markets. Expectations of the FED's dynamics in lifting the benchmark interest rate changed several times in the six months, which affected the USD rate, oil prices and consequently
also the currencies of the countries where Krka sells its products. Uncertainty in foreign exchange markets grew even stronger in May and June due to the EU membership referendum in the UK. To account for uncertain foreign exchange movements and its major rouble exposure, the Krka Group hedged the risk of the rouble rate in the majority of the first half of the year with forward contracts. Favourable exchange rate movements resulted in €19.9 million of positive net foreign exchange rate differences in the first six months of 2016. Due to the appreciation of the rouble, our forward contracts resulted in €33.9 million of net financial expenses. With positive foreign exchange rate differences from the rouble amounting to €25.2 million, our rouble exposure decreased the Group's net financial result by €8.7 million. The Group's overall net financial result, taking account of foreign exchange rate differences of all currencies as well as other financial income and expenses, is minus €13.3 million. Foreign exchange risks associated with other currencies were not hedged in the reported period.
Interest rate risk
The Krka Group was not exposed to reference interest rate risk in the six months to June because all non-current borrowings had been paid back in
previous years and no new non-current loans were taken out this year.
Credit risk
Krka’s credit control process involves obtaining credit ratings for customers to which the controlling company and subsidiaries make product sales worth an annual €100,000 or more, and regular, dynamic monitoring of customer payment discipline. More than 400 customers and more than 90% of the Group’s trade receivables were included in the
credit control process at the end of the first half of 2016. Total trade receivables at the end of June were up compared to the beginning of the year, chiefly due to the appreciation of certain currencies and the consequent positive restatement of trade receivables.
BUSINESS REPORT
Unaudited Interim Report for the Krka Group and the Krka Company for the First Half of 2016 11
Approximately one half of Krka Group's total trade receivables have credit insurance coverage or are hedged with financial instruments. Our policy of hedging receivables did not change in the reported period.
The amount of past due and outstanding receivables at the end of June was at a level that Krka considers normal and acceptable. Customer payment discipline is estimated to have remained unchanged. We did not write off any major trade receivables in the first half of the year.
Liquidity risk
Risks related to the Krka Group’s liquidity in the six months to June were managed by effective short-term cash flow planning. Short-term liquidity was ensured through a stable cash flow, pre-agreed current revolving loans, and the daily, rolling weekly, monthly and longer-term planning and monitoring of cash inflows and outflows. While optimising the amounts of cash on their bank accounts,
subsidiaries were regularly provided with the required cash. With the volume of cash inflows exceeding our cash outflows practically every month, liquidity risk is estimated to be low. Only occasionally did we make current borrowings. All our liabilities were settled regularly and in the agreed time frames.
Property, business interruption and liability insurance
In the first half of the year Krka entered into insurance contracts for the 2016 insurance year. These contracts are the result of insurance optimisation and examination of offers in the international insurance market. All Krka companies take out local insurance policies, which comply with the Group insurance policy.
Despite the value of insured assets increasing, the total insurance premium is decreasing. This comes as a result of not only commercial efforts but the high level of technical protection of property from various perils. Property risks additionally decreased in the first six months of 2016 due to different measures recommended by domestic and foreign reinsurers.
12 Unaudited Interim Report for the Krka Group and the Krka Company for the First Half of 2016
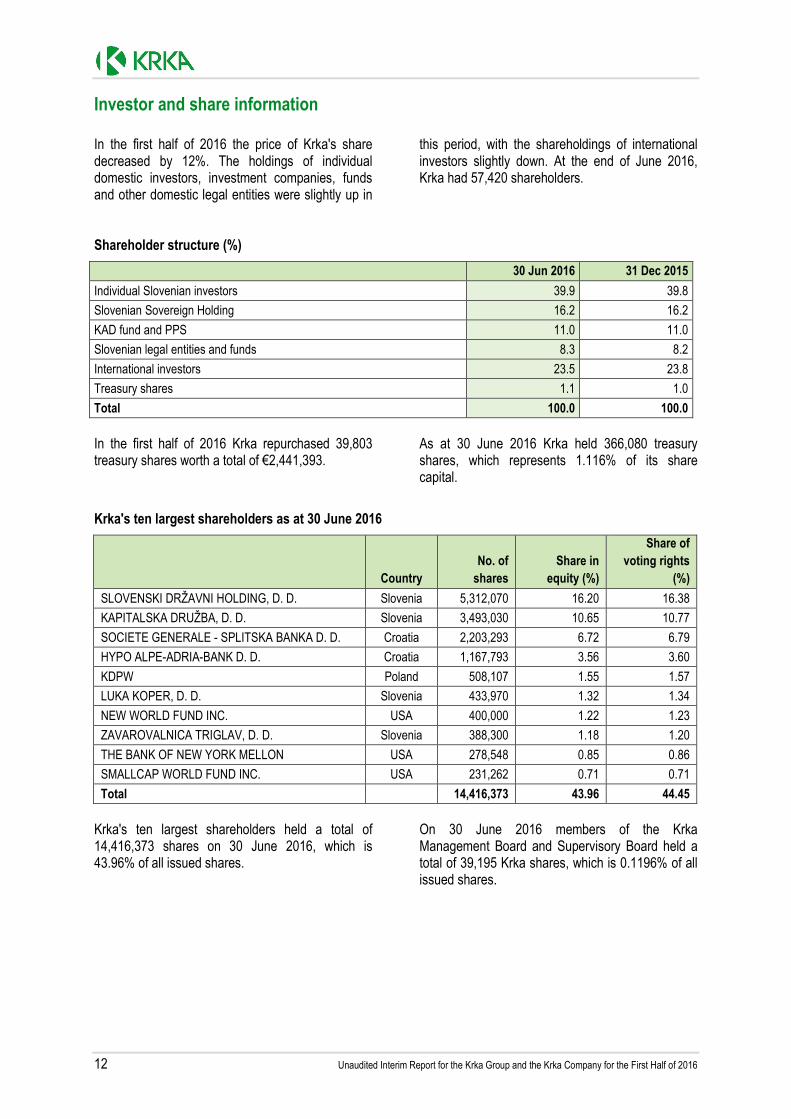
Investor and share information In the first half of 2016 the price of Krka's share decreased by 12%. The holdings of individual domestic investors, investment companies, funds and other domestic legal entities were slightly up in
this period, with the shareholdings of international investors slightly down. At the end of June 2016, Krka had 57,420 shareholders.
Shareholder structure (%)
30 Jun 2016 31 Dec 2015
Individual Slovenian investors 39.9 39.8
Slovenian Sovereign Holding 16.2 16.2
KAD fund and PPS 11.0 11.0
Slovenian legal entities and funds 8.3 8.2
International investors 23.5 23.8
Treasury shares 1.1 1.0
Total 100.0 100.0
In the first half of 2016 Krka repurchased 39,803 treasury shares worth a total of €2,441,393.
As at 30 June 2016 Krka held 366,080 treasury shares, which represents 1.116% of its share capital.
Krka's ten largest shareholders as at 30 June 2016
Country
No. of
shares
Share in
equity (%)
Share of
voting rights
(%)
SLOVENSKI DRŽAVNI HOLDING, D. D. Slovenia 5,312,070 16.20 16.38
KAPITALSKA DRUŽBA, D. D. Slovenia 3,493,030 10.65 10.77
SOCIETE GENERALE - SPLITSKA BANKA D. D. Croatia 2,203,293 6.72 6.79
HYPO ALPE-ADRIA-BANK D. D. Croatia 1,167,793 3.56 3.60
KDPW Poland 508,107 1.55 1.57
LUKA KOPER, D. D. Slovenia 433,970 1.32 1.34
NEW WORLD FUND INC. USA 400,000 1.22 1.23
ZAVAROVALNICA TRIGLAV, D. D. Slovenia 388,300 1.18 1.20
THE BANK OF NEW YORK MELLON USA 278,548 0.85 0.86
SMALLCAP WORLD FUND INC. USA 231,262 0.71 0.71
Total 14,416,373 43.96 44.45
Krka's ten largest shareholders held a total of 14,416,373 shares on 30 June 2016, which is 43.96% of all issued shares.
On 30 June 2016 members of the Krka Management Board and Supervisory Board held a total of 39,195 Krka shares, which is 0.1196% of all issued shares.

Unaudited Interim Report for the Krka Group and the Krka Company for the First Half of 2016 13
Shares in equity and shares of voting rights held by members of the Krka Management Board and Supervisory Board on 30 June 2016
No. of shares
Share
in equity (%)
Share of voting
rights (%)
Management Board members
Jože Colarič 22,500 0.0686 0.0694
Aleš Rotar 13,788 0.0420 0.0425
Vinko Zupančič 120 0.0004 0.0004
David Bratož 0 0.0000 0.0000
Milena Kastelic 505 0.0015 0.0016
Total Management Board 36,913 0.1126 0.1138
Supervisory Board members
Julijana Kristl 230 0.0007 0.0007
Jože Mermal 0 0.0000 0.0000
Matej Pirc 152 0.0005 0.0005
Simona Razvornik Škofič 0 0.0000 0.0000
Andrej Slapar 0 0.0000 0.0000
Anja Strojin Štampar 0 0.0000 0.0000
Tomaž Sever 500 0.0015 0.0015
Franc Šašek 1,400 0.0043 0.0043
Mateja Vrečer 0 0.0000 0.0000
Total Supervisory Board 2,282 0.0070 0.0070
Share trading in the first half of 2016
In the first six months of 2016 Krka's share price on the Ljubljana Stock Exchange peaked at the beginning of the year, when it stood at €65.20, and reached its low as at 30 June, when it traded at €57.15. Krka's market capitalisation as at 30 June 2016
totalled €1.9 billion. Deals in Krka's share generated an average daily trading volume of €0.4 million in the first half of 2016. Krka was the most traded security on the Ljubljana Stock Exchange in the reported period. Since April 2012 Krka's shares have also been listed on the Warsaw Stock Exchange.

14 Unaudited Interim Report for the Krka Group and the Krka Company for the First Half of 2016
Business operations analysis The business operations analysis includes data for the Krka Group and the Krka Company, whereas
the comments relate primarily to the Group.
Revenues
Year-on-year revenues were up 1% at the level of the Krka Group and down 5% at the level of the Krka Company. The Krka Company sold €539.7 million worth of prescription pharmaceuticals, non-
prescription products and animal health products, while the Krka Group generated €603.8 million of sales revenues from these products plus the health resort and tourist services. The Krka Group generated 93% of its revenues in markets outside Slovenia. Taking into account other operating and financial income, the Krka Group generated a total of €650.3 million of revenues and the Krka Company generated €584.5 million of revenues. A more detailed analysis of sales results by individual markets, and groups of products and services is given in the chapter Marketing and Sales below.
Expenses
Total Krka Group expenses incurred in the first half of 2016 amounted to €569.3 million, up 14% from the same period last year. This is mainly due to higher financial expenses due to derivatives expenses and the change in the fair value of derivatives in the total amount of €55.2 million. The Group incurred €513.4 million of operating expenses, a 3% year-on-year increase, among which the costs of goods sold were €261.1 million, selling and distribution expenses €154.8 million, R&D expenses €58.7 million, and general and
administrative expenses €38.9 million. The Group costs of goods sold increased by 5%, on a costs to sales ratio of 43.2%. Selling and distribution expenses decreased by 1%, on a costs to sales ratio of 25.6%. R&D expenses increased by 4%, on a costs to sales ratio of 9.7%. The Group does not capitalise R&D expenses, therefore they are recognised as expenses for the period in full. General and administrative expenses increased by 5%, on a costs to sales ratio of 6.4%.

Unaudited Interim Report for the Krka Group and the Krka Company for the First Half of 2016 15
Operating result
The Krka Group recorded €94.3 million of operating profit, down 10% compared to the same period last year. Profit before tax amounted to €81.0 million, a 37% year-on-year decrease. Income tax totalled €10.9 million, and the effective tax rate was 13.5%. The Krka Group recorded €70.1 million of net profit, down 38% compared to the same period last year, with the Krka Company net profit totalling €56.2 million, down 48%.
Assets
The Krka Group assets were worth €1,928.6 million at the end of June 2016, an increase by 7% compared to the end of 2015. Non-current assets represent 52.2% of total assets, the proportion down 2.3 of a percentage point from the beginning of the year. The largest item under non-current assets, which totalled €1,007.2 million, was property, plant and equipment on €847.5 million (a 3% increase from the end of 2015), which
represents 43.9% of the Krka Group's total assets. Intangible assets amounted to €114.7 million, down 2% from the end of 2015. Current assets increased by 12% in the first half of 2016, to €921.4 million, with inventories decreasing by 1% to €271.4 million, and receivables increasing by 13% to €524.1 million (of which trade receivables amounted to €487.9 million, up 13% from the beginning of the year).
Equity and liabilities
From the end of 2015 the Krka Group‘s equity increased by 6% to €1,485.8 million, and represents 77.0% of total equity and liabilities. Amounting to €110.0 million, non-current liabilities represent 5.7% of the Krka Group's total assets. Provisions, which amounted to €84.7 million at the end of the period, were at the same level as at the end of 2015.
Current liabilities increased by 14% from the end of 2015 and totalled €332.8 million, which is 17.3% of the Krka Group's total assets. Among current liabilities, trade payables amounted to €109.8 million, up 6% compared to the year-end of 2015, with other current liabilities up 22% to €219.2 million.

16 Unaudited Interim Report for the Krka Group and the Krka Company for the First Half of 2016
Performance ratios
The Krka Group profit margin for the six months to June 2016 was 11.6% (Krka Company 10.4%), its EBIT margin 15.6% (Krka Company 13.9%) and its EBITDA margin 24.4% (Krka Company 21.6%). ROE at the level of the Group was 9.7% (Krka Company 7.7%), with ROA at 7.5% (Krka Company 6.2%).
Marketing and sales Krka Group sales in the six months to June were €603.8 million, a 1% year-on-year increase. Sales volume was up 12% compared to the same period last year.
The Krka Company sold €539.7 million worth of products, down 5% compared to the same period last year.
Sales by Region
Sales were the highest in Region East Europe, where they amounted to €175.5 million, which is 29.1% of total Group sales. Region West Europe reported the second best result with €150.4 million of sales, which represents 24.9% of total sales. The third largest area in terms of sales in the reported period was Region Central Europe, where Krka sold €141.4 million worth of products, which is 23.4% of
overall sales. In Region South-East Europe sales amounted to €76.8 million, which represents 12.7% of Group sales. Sales in Krka’s domestic market totalled €41.2 million, which is 6.8% of total Krka Group sales. Product sales in Region Overseas Markets amounted to €18.5 million, which represents 3.1% of Group sales.
Krka Group Krka Company
In € thousand 1–6/2016 1–6/2015 Index 1–6/2016 1–6/2015 Index
Slovenia 41,161 38,734 106 26,471 25,680 103
South-East Europe 76,799 60,513 127 78,890 65,621 120
East Europe 175,542 185,942 94 151,215 175,594 86
Central Europe 141,428 137,226 103 143,764 140,879 102
West Europe 150,412 162,690 92 122,679 148,625 83
Overseas Markets 18,461 14,745 125 16,639 13,479 123
Total 603,803 599,850 101 539,658 569,878 95

Unaudited Interim Report for the Krka Group and the Krka Company for the First Half of 2016 17
Krka Group sales by Region, January–June 2016
Krka Group sales by Region, January–June 2015 and 2016
Slovenia
We sold €41.2 million worth of products and services in Krka’s domestic market. The main contributors to product sales were prescription pharmaceuticals, which contributed €19.2 million in the reported period, representing 79% of Krka Group product sales. Non-prescription product sales amounted to €4.2 million, and animal health product sales €1.0 million. Health resort and tourist service sales were up one tenth from the same period last year, to €15.4 million. Six-month sales value was up 3% compared to the same period last year, with sales volume up 6%. Holding a 9.3% market share, Krka remains the leading pharmaceutical company in Slovenia. We are renowned for our wide range of pharmaceuticals for the treatment of cardiovascular diseases, the central nervous system and the alimentary tract. As to our brands of products controlling blood pressure, we are singling out Prenessa (perindopril) and the fixed-dose combinations Prenewel (perindopril and indapamide), Amlessa (perindopril and amlodipine) and Amlewel (perindopril and indapamide and amlodipine). As to products controlling cholesterol levels, we strengthened the brand Sorvasta (rosuvastatin) and the newly launched Rosmela (amlodipine and rosuvastatin), a combination product controlling blood-pressure and cholesterol levels. In the area of antidepressants our focus is on the brand Dulsevia (duloxetine), and in the area of antipsychotics on Aryzalera (aripiprazole). As to
analgesics, a new pharmaceutical form was added to our assortment of Doreta (tramadol and paracetamol) products, the sustained-release Doreta SR. Our stomach acid pharmaceuticals include proton pump inhibitors, among them Nolpaza (pantoprazole) and Emozul (esomeprazole). As to other therapeutic areas, Krka's antimicrobial pharmaceuticals also have a strong presence, with two new products launched in this group in the reported period, the parenteral form of Moloxin (moxifloxacin) and the new brand Linezolid Krka (linezolid). As to non-prescription products, brand identity was strengthened for established products and for the Septabene product assortment, and as to animal health products, most attention was devoted to the recently launched ectoparasiticide Ataxxa (imidacloprid and permethrin). Our main sales drivers among prescription pharmaceuticals in the first six months were Prenessa (perindopril), including the combination with indapamide, Nolpaza (pantoprazole), Sorvasta (rosuvastatin), Doreta (tramadol and paracetamol) and Atoris (atorvastatin). The leading non-prescription products were Nalgesin S (naproxen), B-complex, the Daleron (paracetamol) group of products, Bilobil (ginkgo biloba), and the Septolete and Septabene groups of products. The best sales results in the group of animal health products were recorded for Fypryst (fipronil), Grovit and Enroxil (enrofloxacin).

18 Unaudited Interim Report for the Krka Group and the Krka Company for the First Half of 2016
South-East Europe
Product sales in the markets of South-Eastern Europe amounted to €76.8 million in the six months to June. After prices decreased considerably in the Region's most important markets in 2015, sales in the first half of 2016 witnessed a 27% year-on-year increase both in terms of volume and value. Sales growth was recorded in all markets, apart from Montenegro, with the largest market contributors in absolute terms being Romania, Serbia and Croatia. Sales there totalling €26.5 million, which is a 68% year-on-year increase, Romania remains one of Krka's key markets. The main sales drivers were prescription pharmaceuticals, especially Atoris (atorvastatin), Dulsevia (duloxetine), Karbis (candesartan), including its combination with hydrochlorothiazide, Oprymea (pramipexole), Prenessa/Co-Prenessa (perindopril and its combination with indapamide), and Roswera (rosuvastatin). Uncertainty has continued in the Romanian market into 2016, with the disclosure of prices and the formation of the reimbursement list continually delayed, which has also affected sales. As to non-prescription products, we devoted special attention to accelerating sales for cold and flu products, especially Septolete Omni (benzydamine and cetylpyridinium), and for analgesics. As to animal health products, we continue working intensely to accelerate sales of products for the treatment of companion animals. The sales result in Croatia, another one of Krka's key markets, was the second best in the Region. Product sales there totalled €14.0 million, up 9%. This has preserved our position as the fourth-ranked generic pharmaceutical company in the country and the second-ranked provider of animal health pharmaceuticals. The main sales drivers were prescription pharmaceuticals, especially Atoris (atorvastatin), Co-Perineva (perindopril and indapamide), Dalneva (perindopril and amlodipine), Doreta (tramadol and paracetamol), Emanera (esomeprazole), Nolpaza (pantoprazole), Perineva (perindopril), Roswera (rosuvastatin), and Valsacor (valsartan), including its combination with hydrochlorothiazide. Our leading non-prescription product in terms of sales was Nalgesin (naproxen). A major acquisition in the group of non-prescription products is the new form of the oral antiseptic Septolete Duo (benzydamine
and cetylpyridinium). The main sales driver among animal health products was Fypryst (fipronil), and the new addition in this group is Attaxa (imidacloprid and permethrin), a product for the treatment of external parasites in companion animals. Sales in Bosnia and Herzegovina totalled €9.8 million, up 6% compared to the first half of last year. The main sales drivers were prescription pharmaceuticals, among which the most important products were Enap (enalapril), including the combination with hydrochlorothiazide, Lorista (losartan), including the combination with hydrochlorothiazide, Roswera (rosuvastatin), Atoris (atorvastatin), Lexaurin (bromazepam) and Ampril (ramipril), including the combination with hydrochlorothiazide. Sales growth was also recorded for non-prescription products, among which the sales leaders were Septolete, B-complex, Bilobil (ginkgo biloba) and Nalgesin (naproxen). In Macedonia Krka remains the leading foreign manufacturer of pharmaceuticals. The value of six-month sales totalled €8.5 million, an 11% year-on-year increase. Despite decreasing reference prices the main sales drivers were the prescription pharmaceuticals Enap (enalapril), including the combination with hydrochlorothiazide, Roswera (rosuvastatin), Tanyz (tamsulosin), Atoris (atorvastatin), and Lorista (losartan), including the combination with hydrochlorothiazide. The positive sales trend continued for animal health products as well, their sales up 23% from the same period last year. Sales in Serbia amounted to €6.1 million, a year-on-year increase by 76%. The most important prescription pharmaceuticals were Nolpaza (pantoprazole), Roxera (rosuvastatin), Valsacor (valsartan), including the combination with hydrochlorothiazide, Atoris (atorvastatin) and Ampril (ramipril), including the combination with hydrochlorothiazide. The leading non-prescription products were Bilobil and Septolete. As to animal health products, the sales results were the best for Fypryst (fipronil). Product sales in Bulgaria totalled €6.3 million, which is on the level of the same period last year. The major contributors to overall sales were prescription pharmaceuticals, especially Nolpaza (pantoprazole), Co-Amlessa (perindopril,

Unaudited Interim Report for the Krka Group and the Krka Company for the First Half of 2016 19
indapamide and amlodipine) and Emanera (esomeprazole), and animal health products. There are changes regarding prescribing practices pending in the Bulgarian market. They will take effect in the second half of the year and will introduce generic prescribing for certain groups of products. Krka remains one of the leading providers of pharmaceuticals in Kosovo. Sales there totalled €3.2 million, up 9% compared to the first half of last year. In Albania sales amounted to €1.9 million, a 9% year-on-year increase. The leading prescription
pharmaceuticals in terms of sales were Enap (enalapril), including the combination with hydrochlorothiazide, Lorista (losartan), including the combination with hydrochlorothiazide, and Atoris (atorvastatin). Good results were also recorded for the newly launched products Helex (alprazolam), Fromilid granules (clarithromycin) and Tolura (telmisartan). Product sales in Montenegro totalled €0.5 million, down 8% compared to the same period last year. Sales via government tenders contributed the most to overall sales value. We are planning to open a representative office there to facilitate more efficient operations.
East Europe
Region East Europe comprises several Eastern European and Asian markets, the most important of which remains Krka's key and largest individual market, the Russian Federation. Another key market is Ukraine, where we managed to increase sales. In the majority of other markets in the Region, as in the Russian Federation, however, difficult economic conditions prevented euro-denominated sales value in the reported period from matching those from a year ago. Nevertheless, with our sales volumes up almost 6% in most markets, we preserved or even improved our market shares. Product sales in the Russian Federation totalled €123.1 million, an 8% year-on-year decrease in euros. Lower euro-denominated sales value was the result of the local currency's less favourable average exchange rate as compared to the same period last year. Rouble-denominated sales increased by 11%, and sales volume was up 4%. Our best-selling product was Lorista (losartan), including the combination with hydrochlorothiazide, followed by Atoris (atorvastatin), Enap (enalapril), including the combination with hydrochlorothiazide, Perineva (perindopril), including the combination with indapamide, Nolpaza (pantoprazole), Zyllt (clopidogrel), Roxera (rosuvastatin), Valsacor (valsartan), including the combination with hydrochlorothiazide, Orsoten (orlistat) and Herbion cough syrup. The highest absolute growth was recorded for Valsacor (valsartan). Good sales results are increasingly being recorded also for the following products, introduced to the market in the last two years: Septolete Total (benzydamin and cetylpyridinium), SeptaNazal (xylometazoline and dexpanthenol), Bravadin (ivabradine), Vamloset (valsartan and amlodipine), Dalneva (perindopril and amlodipine), Lortenza (losartan and amlodipine)
and Vizarsin (sildenafil), and for products launched in the last nine months: Co Dalneva (perindopril, indapamide and amlodipine), Dilaxa (celecoxib) and Ulkavis (bismuth). Six-month sales of animal health products increased by 4% compared to the same period last year, amounting to €6.6 million, the best-selling product being Floron (florfenicol). According to the independent source IMS, Krka's sales dynamics is exceeding the dynamics of the market in the Russian Federation, therefore we are increasing our market share. More than a half of all our products sold there are produced in the Krka-Rus 2 factory. This is strengthening our increasingly important status of a domestic producer in the Russian Federation. In the six months to June 2016 the trend of the pharmaceuticals market shrinking in Ukraine continued. Even though it was primarily foreign producers that witnessed lower sales, the value of sales placed with our immediate customers increased by 48%. Almost four fifths of the €18.4 million of sales came from prescription pharmaceuticals. Our best-selling prescription pharmaceuticals in the reported period were Enap (enalapril), including the combination with hydrochlorothiazide, Dexamethason (dexamethasone), Nolpaza (pantoprazole), Atoris (atorvastatin) and Prenessa (perindopril), including the combination with indapamide. In the group of non-prescription products, the most important products were Herbion, Bilobil (ginkgo biloba) and Panzynorm, and as to animal health products the leader was Fypryst (fipronil), followed by Salinomycin and Enroxil (enrofloxacin). Product sales in Uzbekistan totalled €7.6 million, down 23% compared to the first half of 2015. The

20 Unaudited Interim Report for the Krka Group and the Krka Company for the First Half of 2016
decline in the value of the pharmaceuticals market was chiefly driven by the depreciation of the local currency and the population's lower purchasing power. Krka nevertheless remains the leading EU generic pharmaceutical company in the Uzbek market. Overall sales were mainly driven by prescription pharmaceuticals, especially Lorista (losartan), including the combination with hydrochlorothiazide, Enap (enalapril), including the combination with hydrochlorothiazide, and Amlessa (perindopril and amlodipine). Sales results were also good for Lortenza (losartan and amlodipine), launched this year. The leading non-prescription products in terms of sales were Pikovit and Duovit, this group of products recently supplemented with Septolete Total (benzydamine and cetylpyridinium). In Kazakhstan sales totalled €6.8 million, down 20% compared to the first half of 2015. A major depreciation of the local currency, low oil prices – the country's main exports item – and the state banks' restricted lending with interest rates rising, have degraded the business environment and pushed down the population's purchasing power. Our leading group of products in terms of sales were prescription pharmaceuticals, especially Enap (enalapril), including the combination with hydrochlorothiazide, Prenessa (perindopril), including the combination with indapamide, and Candecor (candesartan). As to non-prescription products, the best sales results were recorded for Herbion and Duovit. A new product launched in this group in the first half of the year was Pikovit Unique. Amid a substantial shrinking of the pharmaceuticals market in Belarus, Krka's product sales there totalled €5.2 million, down 17% compared to the same period last year. We rank as the third foreign provider of generic pharmaceuticals in the country. The largest proportion of sales came from prescription pharmaceuticals, especially Lorista (losartan), including the combination with hydrochlorothiazide, Nolpaza (pantoprazole) and Amlessa (perindopril and amlodipine). The leading non-prescription products were Septolete and Pikovit. Severe pressure to reduce prices shrank the value of the pharmaceuticals market in Moldova. The value of our sales there totalled €3.0 million, which is an 11% year-on-year decrease; nevertheless, sales volume and our market share were up and Krka remains among the leading producers of pharmaceuticals there. Sales were driven mainly by prescription pharmaceuticals, especially Ampril
(ramipril) and Rawel (indapamide). The leading non-prescription products in terms of sales were Septolete, Panzynorm and Septanazal (xylometazoline and dexpanthenol). Krka has preserved the status of the leading foreign provider of pharmaceuticals in Mongolia. Amidst deteriorated economic conditions our sales there amounted to €2.5 million, down 6% compared to the same period last year. The sales of non-prescription products were down, while sales results for prescription pharmaceuticals remained on the level of the first half of last year. A new reimbursement list took effect in the country in May. Several Krka's products have successfully been included on the list, therefore demand for our prescription pharmaceuticals was up as soon as in June, and we expect a further major positive sales impact in the second half of the year. Good results were also recorded for the newly launched Herbion Iceland moss syrup, a non-prescription product. Sales results in Turkmenistan were affected by the lack of foreign convertible currencies and the ban on imports of products already produced by local providers. Krka's six-month sales there totalled €2.4 million, up 4% from the same period last year. The highest sales growth, of 11%, was recorded for non-prescription products, the leading ones being Herbion and Pikovit. In Azerbaijan the first half-year was marked by a substantial drop in the pharmaceuticals market, a result of last year's passing of the act regulating pharmaceuticals prices. Our sales there totalled €1.9 million, up 2%, and were chiefly driven by the 44% increase in the sales of non-prescription products. We increased our market share to 3%, climbing to the position of the third-ranked pharmaceuticals provider in the market. Sales in Kyrgyzstan amounted to €1.7 million, up 59%, a result of our promotion activities and the stabilisation of the local currency's rate. With the volume of sales up in Georgia, sales value there totalled €1.5 million, down 7% compared to the same period last year. Krka remains the second-ranked foreign generic pharmaceutical company in this market. The leading products in terms of sales were Lorista (losartan), including the combination with hydrochlorothiazide, Sorvasta (rosuvastatin) and Tenox (amlodipine). In Armenia sales totalled €1.0 million, up 9% mainly due to the 26% increase in the sales of non-prescription products. In Tajikistan we are facing the population's

Unaudited Interim Report for the Krka Group and the Krka Company for the First Half of 2016 21
deteriorating purchasing power and major reductions in the prices of pharmaceuticals. Our
sales there amounted to €0.3 million.
Central Europe
Sales in the markets of Region Central Europe amounted to €141.4 million in the reported period, up 3% from the same period in 2015 in terms of value and 6% in terms of volume. Poland remains the leading market in the Region and Krka's key market. Sales there amounted to €72.2 million, up 4%, mainly driven by prescription pharmaceuticals, including Atoris (atorvastatin), Roswera (rosuvastatin), Valsacor (valsartan), including the combination with a diuretic, Doreta (tramadol and paracetamol), Lorista (losartan), including the combination with a diuretic, Nolpaza (pantoprazole), and Tolura (telmisartan) and Karbis (candesartan), both including combinations with a diuretic. The leading brands of non-prescription products in terms of sales were Bilobil (ginkgo biloba) and Septolete, followed by Naklofen Top (diclofenac) and the Septanazal (xylometazoline and dexpanthenol). The most important animal health products in terms of sales were Fypryst (fipronil) and Floron (florfenicol). Krka is the fourth-ranked foreign generic pharmaceutical company in Poland, its sales growing faster than the market. In Hungary, one of Krka's key markets, sales for the period were on the same level as in the six months last year both in terms of volume and value, the latter totalling €22.3 million. The leading group of products in terms of sales was prescription pharmaceuticals, among which the key products remain Prenessa (perindopril), including the combination with a diuretic, Atoris (atorvastatin), Roxera (rosuvastatin), Dalnessa (perindopril and amlodipine), including the combination with a diuretic, Nolpaza (pantoprazole) and Zyllt (clopidogrel). Bilobil (ginkgo biloba) remains the most important non-prescription product, and Fypryst (fipronil) and Enroxil (enrofloxacin) the most important in the group of animal health products. Six-month sales in the Czech Republic, another one of Krka's key markets, remained influenced by changes to the country's health care system and the related price drops. By changing our sales structure we nevertheless managed to increase the value of sales by 4% to €12.4 million. Krka has preserved its market share and remains one of the most successful generic pharmaceutical companies in the market. The leading product in the group of
prescription pharmaceuticals became Lexaurin (bromazepam), followed by Tanyz (tamsulosin), Tonarssa (perindopril and amlodipine), including the combination with a diuretic, Atoris (atorvastatin), Emanera (esomeprazole), Prenessa (perindopril), including the combination with a diuretic, and Pragiola (pregabalin). As to non-prescription products and animal health products, the main sales drivers were Nalgesin (naproxen) and Septolete, and Fypryst (fipronil) and Dehinel (febantel), respectively. The volume of sales was up 2% in Slovakia, sales value there increased by 4% to €18.0 million. Our best-selling products in the reported period were the prescription pharmaceuticals Prenessa (perindopril), including the combination with a diuretic, Nolpaza (pantoprazole), Valsacor (valsartan), including the combination with a diuretic, Atoris (atorvastatin) and Amlessa (perindopril and amlodipine), including the combination with a diuretic. The sales of non-prescription products were up 4%, the main sales drivers Nalgesin (naproxen) and Septolete. The leading animal health products were Enroxil (enrofloxacin) and Fypryst (fipronil), overall sales for this product group were up 8%. Sales in Lithuania were €8.0 million, a 6% year-on-year decrease. The most important prescription pharmaceuticals in terms of sales were Valsacor (valsartan), Prenessa (perindopril) and Amlessa (perindopril and amlodipine), all including combinations with a diuretic. The leading non-prescription product was Septolete, followed by Panzynorm, and in the group of animal health products the best-sellers were Fypryst (fipronil) and Enroxil (enrofloxacin). The fastest growing market in the Region in the six months to June was Latvia, Krka's sales there up 13% compared to the same period last year, totalling €5.3 million. The main sales drivers were the prescription pharmaceuticals Prenessa (perindopril), including the combination with a diuretic, Atoris (atorvastatin), and Amlessa (perindopril and amlodipine), including the combination with a diuretic. The Septanazal (xylometazoline and dexpanthenol) and Nalgesin (naproxen) were the leading non-prescription products in terms of sales, and the leading animal

22 Unaudited Interim Report for the Krka Group and the Krka Company for the First Half of 2016
health products were Fypryst (fipronil) and Dehinel (febantel). In Estonia we sold 11% more products than in the same period last year, resulting in €3.3 million of sales. The most important prescription pharmaceuticals were Prenessa (perindopril),
including the combination with a diuretic, Roswera (rosuvastatin), and Valsacor (valsartan), including the combination with a diuretic. The leading non-prescription product remains Septolete, followed by Herbion and Nalgesin (naproxen), and as to animal health products, the sales results were the best for Fypryst (fipronil).
West Europe
Product sales in Region West Europe totalled €150.4 million, down 8% compared to the first half of last year. Despite sales volume increasing by 14%, price erosion caused the value of sales to drop. The proportion of sales generated by Krka's subsidiaries was up to 64%, while sales via third-party partners decreased compared to the same period last year and represented 36% of overall sales in the Region. Prescription pharmaceuticals represent 86% of sales in the Region. The most important products are the generic pharmaceuticals with esomeprazole, duloxetine, pregabalin, pantoprazole and clopidogrel. Krka holds the leading market shares in terms of the volume of sold products in Western Europe for the generic pantoprazole, esomeprazole, clopidogrel, perindopril, galantamine, ropinirole, duloxetine, pregabalin and aripiprazole. Animal health product sales doubled from the first half of 2015, amounting to €18.4 million. Accounting for almost 40% of animal health product sales in the Region, the best-selling product remains the combination of milbemycin and praziquantel in the form of tablets, used to prevent and treat internal parasite infestations in companion animals. Substantial sales growth has also been recorded for products containing the active ingredient carprofen. As to individual markets, the highest growth has been recorded in the UK, Portugal and Germany, with the most important individual market remaining France. The majority of animal health product sales are generated via third-party partners, although the proportion of sales via subsidiaries has increased to 36% in the first half of 2016. Non-prescription product sales were up 17% from the same period last year, however they only represent a little over 1% of total sales in the Region. The most important markets for these products remain Germany and Portugal. In Germany, our most important and largest West European market, product sales totalled €49.8
million, up 4% from the same period last year. More than four fifths of sales were generated by the subsidiary TAD Pharma. The best-selling products were Pregabador (pregabalin), Pantoprazol TAD, Duloxalta (duloxetine) and Candecor (candesartan), including the combination with hydrochlorothiazide. In June we were the only company in the market to launch a product of the BisoDipin (bisoprolol and amlodipine) brand, a single-tablet fixed-dose combination used to treat high blood pressure. The Region's second-ranking market in terms of sales was Spain, where we sold €19.7 million worth of products. The 13% year-on-year sales decrease in Spain is the result of some of the public tenders in Andalusia having expired. In France sales were up 4% compared to the first half of 2015, to €18.3 million, mainly driven by the launched animal health products and increased sales via the subsidiary Krka France, which currently generates as much as one third of overall sales in this market. Six-month sales in the Scandinavian countries fell behind last year's in the same period by 38%, totalling €13.5 million. This is due to severe price reductions, especially for duloxetine and aripiprazole in Sweden and Denmark. In Finland and Norway sales increased by 9% and 23%, respectively. In Italy product sales were up 20% to €11.2 million. The sales of Krka's brands via its subsidiary Krka Farmaceutici Milano was up 52% and now represents more than a half of overall sales in this market. Sales in the UK totalled €10.7 million. Having faced a severe erosion of prices in this market as well, our sales decreased by 37% compared to the first half of last year. In Portugal Krka sold €9.7 million worth of products, a 7% year-on-year decrease. Despite major price pressures and the consequently lower sales, Krka's market share has been increasing, preserving Krka's position as the fastest growing generic

Unaudited Interim Report for the Krka Group and the Krka Company for the First Half of 2016 23
pharmaceutical company in Portugal. In the Benelux countries products were sold primarily via third-party partners and generated sales revenues of €5.1 million, down 16% compared to the same period last year. Meanwhile sales via the subsidiary Krka Belgium more than doubled compared to the same period last year, so that they now represent as much as 12% of overall sales in this market. Sales in Ireland totalled €3.9 million, up 20% compared to the same period last year. Three quarters of sales there are generated via the
subsidiary Krka Pharma Dublin, which witnessed an 18% sales increase. In Austria product sales increased by 31% to €3.2 million. The Vienna-based subsidiary Krka Pharma remains the leading generic provider of pregabalin, duloxetine and aripiprazole in the Austrian market, having recorded a 49% year-on-year increase in sales. Sales via third-party partners in the other European countries totalled €5.3 million, up 28% compared to the first half of last year.
Overseas Markets
Six-month product sales in Region Overseas Markets amounted to €18.5 million, up 25% compared to the same period last year. Sales increased in all three sales offices. The majority of sales, 88%, came from prescription pharmaceuticals, which are sold under our own brands in most of the Region's markets. The sales office Middle East sold €9.2 million worth of products despite the difficult situation there, up 34% compared to the same period last year. Our most important markets remain Iran, Iraq and Lebanon, and our best-selling products Nolpaza (pantoprazole), Asentra (sertraline), Letizen (cetirizine), Vizarsin (sildenafil), Zyllt (clopidogrel), Yasnal (donepezil), Valsacor (valsartan) and Ultop (omeprazole).
The sales office Far East and Africa reported a 15% sales increase and €8.8 million of sales. The most important markets were the Republic of South Africa, China, Ghana and Malaysia. We achieved the best results for products with lansoprazole, for Sabal (serenoa repens), for products with amlodipine, enalapril, simvastatin, and for products of the Emanera (esomeprazole) brand. Mainly due to good sales results in the markets of Central America, six-month product sales in the sales office the Americas totalled €0.5 million, up 71% compared to the same period last year. The leading prescription pharmaceuticals in terms of sales were Valsacor (valsartan), including the combination with hydrochlorothiazide, Tolura (telmisartan), including the combination with hydrochlorothiazide, and Vizarsin (sildenafil).
Sales by product and service groups
The Krka Group generated 91.0% of overall sales during the six months to June 2016 in human health products, making this Krka’s most important product group. The largest proportion of sales, 82.7%, is generated in prescription pharmaceuticals, followed
by non-prescription products on 8.3% and animal health products on 6.2% of total Group sales. Health resort and tourist services represent 2.6% of overall Krka Group sales, and 0.2% is other sales revenues.
Krka Group Krka Company
In € thousand 1–6/2016 1–6/2015 Index 1–6/2016 1–6/2015 Index
Human health products 549,708 558,780 98 500,915 543,730 92
– Prescription pharmaceuticals 499,400 507,924 98 457,609 498,333 92
– Non-prescription products 50,308 50,856 99 43,306 45,397 95
Animal health products 37,335 26,012 144 36,690 24,144 152
Health resort and tourist services 15,425 14,006 110
Other 1,335 1,052 127 2,053 2,004 102
Total 603,803 599,850 101 539,658 569,878 95

24 Unaudited Interim Report for the Krka Group and the Krka Company for the First Half of 2016
Krka Group sales by product and service groups, January–June 2016
Prescription pharmaceuticals
The Group sold €499.4 million worth of prescription pharmaceuticals in the first half of the year, down 2% compared to the same period of 2015, but the sales volume was up 12%. Sales value increased in regions South-East Europe (up 29%), Overseas Markets (up 23%), Central Europe (up 1%) and Slovenia (1%), while it decreased in regions East Europe (down 4%) and West Europe (down 14%). With respect to the largest markets for Krka's prescription pharmaceuticals, sales value increased in Poland (by 3%), but decreased in the Russian Federation (down 5%) and Germany (down 8%), where sales results in the first half of 2015 had been very good due to important product launches. As to other large markets, year-on-year sales of prescription pharmaceuticals were up the most in Romania (up 81%) and Ukraine (37%). With respect to mid-size markets, the highest sales growth rates were recorded in Serbia (up 99%), Italy (up 17%), Macedonia (up 12%) and Croatia (9%). Among the markets considered small in terms of the sales of Krka's prescription pharmaceuticals, sales increased the most in Kyrgyzstan (up 85%), Austria (up 31%), the Benelux (up 30%), Kosovo (up 15%), Ireland (up 14%) and Latvia (up 13%). The ten leading prescription pharmaceuticals in terms of sales are Atoris (atorvastatin), Lorista* (losartan), Nolpaza* (pantoprazole), Prenessa* (perindopril), Enap (enalapril), Valsacor (valsartan),
Emanera* (esomeprazole), Roswera* (rosuvastatin), Zyllt* (clopidogrel) and Dulsevia* (duloxetine). The highest year-on-year sales growth rates in absolute terms were recorded for Nolpaza* (pantoprazole), Roswera* (rosuvastatin) and Doreta (tramadol and paracetamol), while it was Ralago* (rasagiline), launched on the majority of markets this year, that recorded the best sales results among the newest products. We were the first provider in Europe to launch the fixed-dose combination Rosudapin* (rosuvastatin and amlodipine) in Poland and Slovenia in the first half of 2016. We were among the first generic providers to launch Ralago* (rasagiline), a treatment for Parkinson's disease, on several markets, including Central European markets (in Hungary, Slovakia, Lithuania, Latvia and Estonia), Western European markets (in Portugal, Finland, Ireland, Spain and Austria) and Romania. We also launched other existing products on new markets: • candesartan and hydrochlorothiazide in
Belgium; • Vamloset (valsartan and amlodipine) in
Azerbaijan and Uzbekistan; • Prenessa (perindopril) in Moldova; • Co-Amlessa (perindopril, indapamide and
amlodipine) in Belarus; • carvedilol in Spain;

Unaudited Interim Report for the Krka Group and the Krka Company for the First Half of 2016 25
• Alortia* (losartan and amlodipine) in Georgia and Uzbekistan;
• Levalox* (levofloxacin) in Lithuania, Ireland, France and Austria;
• Furocef* (cephuroxime) in Lithuania, Latvia and Spain;
• linezolid in Germany, Slovenia, Finland, Ireland and Slovakia;
• Dilaxa* (celecoxib) in the Russian Federation;
• Doreta* SR (tramadol and paracetamol) sustained release tablets in Poland, Portugal, Slovakia and Slovenia;
• Ulcavis (bismuth) in the Russian Federation; • the oncology assortment imatinib and letrozole
in Serbia, • Ecansya (capecitabine) in Latvia.
Non-prescription products
The sales of non-prescription products amounted to €50.3 million, a decrease by 1% compared to the same period last year, with sales volume up 4%. Sales increased in regions Slovenia (up 22%), Central Europe (up 22%), South-East Europe (up 19%), West Europe (up 17%) and Overseas Markets (up 10%), while they decreased in Region East Europe (down 17%). With respect to larger markets, the highest sales growth rates were recorded in the Czech Republic (up 98%), Hungary (up 97%), Romania (up 31%),
Bosnia and Herzegovina (up 28%), Croatia (up 23%), Turkmenistan (up 11%), Poland (up 10%), Kazakhstan (up 10%) and Slovakia (up 4%). Sales were also up considerably in Ukraine, while they were down in Eastern European markets, especially in the Russian Federation, Belarus, Uzbekistan and Moldova. The successful sales of newly launched products Septolete total/Septabene and Septanazal also continued, and the sales of Nalgesin* (naproxen) were also up.
Animal health products
Animal health product sales totalled €37.3 million, up 44% compared to the same period last year. Sales growth was recorded in all markets apart from Slovenia, increasing the most in regions West Europe (up 98%), Central Europe (up 24%) and East Europe (up 7%). As to the largest markets, sales increased the most in Germany and the UK – fivefold and twofold, respectively –, and they were also up in France (up 44%), Poland (19%) and the Russian Federation (4%). As to the other large markets, sales growth was the highest in Hungary (up 33%), Lithuania (up
33%), the Czech Republic (up 32%) and Ukraine (up 28%). The top five sales leaders are Milprazon* (milbemycin oxime and praziquantel), Fypryst* (fipronil), Floron* (florfenicol), Enroxil* (enrofloxacin) and Dehinel plus (febantel and pyrantel embonate and praziquantel). A new product launched this year is Ataxxa* (imidacloprid and permethrin), a spot-on solution for dogs, which we launched on certain markets of Central and South-East Europe and in Slovenia.
Health resort and tourist services
In the six months to June 2016 the Terme Krka Group generated €15.4 million of sales, an increase by 10% compared to the first half last year. Overnight stays by domestic guests were up 9%, this group representing 74% of the almost 165,000 total overnight stays. The most numerous group of foreign guests were Italians, which represent 30% of all foreign guests. Overnight stays by Russian guests started to increase again, their numbers up 15%, and we also witnessed a 10% increase in the
number of Austrian guests. As to Terme Krka business units, the largest was Talaso Strunjan, where sales were up 9%, followed by Terme Dolenjske Toplice, where sales increased by 18%, and Terme Šmarješke Toplice with an 8% increase in sales. The Hoteli Otočec business unit reported sales comparable to those of the same period last year.
* Products marked with the asterisk are marketed under different brand names in individual markets.

26 Unaudited Interim Report for the Krka Group and the Krka Company for the First Half of 2016
Research and development In the first half of 2016 we obtained marketing authorisations for three new products: Bixebro/Bravadin film-coated tablets, the Moloxin 400 mg/250 ml solution for infusion, and Flebaven
film-coated tablets. We acquired 170 new marketing authorisations in different markets in this period.
Prescription pharmaceuticals
Applying decentralised procedures we obtained marketing authorisations in 11 European countries for Bixebro/Bravadin (ivabradine) film-coated tablets in the strengths of 5 mg and 7.5 mg. The product is a medicine for cardiovascular system used to treat patients with angina pectoris. A marketing authorisation was obtained under the decentralised procedure in 14 European countries for the Moloxin (moxifloxacin) 400 mg/250 ml solution for infusion. Having a wide-spectrum antimicrobial action, Moloxin is used to treat pneumonia, dermal infections and soft tissue infections. Together with Moloxin tablets, it supplements Krka's portfolio of antimicrobial pharmaceuticals. We expanded marketing opportunities in European markets by obtaining marketing authorisations for Krka's key cardiovascular pharmaceuticals and analgesics. An important new product is the innovative cardiovascular combination Alortya/Tenloris/LosAmlo (losartan and amlodipine) in the form of film-coated tablets in four strengths, which we were the first to obtain marketing authorisations for under the decentralised procedure in Slovenia, Germany and the Czech Republic. The complementary action of the product’s two active substances reduces the likelihood of adverse effects and improves treatment tolerability. Applying decentralised procedures we obtained approvals to market Olimesta/Olmecor/Olimestra (olmesartan) film-coated tablets in three strengths, and the fixed-dose combination Olimesta Comp/Olimesta Combi/Olmecor HCT/Co-Olimestra (olmesartan and hydrochlorothiazide) in the form of film-coated tablets in four strengths. Applying the national procedure we acquired marketing authorisation in Portugal for the combination analgesic tramadol and paracetamol Krka in the form of 75 mg/650 mg film-coated tablets. Additional marketing authorisations were obtained in different markets of East Europe for Krka's key
products from various indication areas. As to cardiovascular treatments, we obtained approvals for Roswera (rosuvastatin) and the fixed-dose combinations Co-Amlessa (perindopril, amlodipine and indapamide) and Sobycombi/Niperten combi (bisoprolol and amlodipine). As to sartans in combination products, we expanded marketing opportunities for Telmista H and Telmista HD (telmisartan and hydrochlorothiazide), Lorista H 100 (losartan and hydrochlorothiazide) and Lortenza (losartan and amlodipine). As to antimicrobial pharmaceuticals, we obtained approvals for Azibiot (azithromycin) 250 mg and 500 mg tablets, Moflaxya (moxifloxacin) tablets, and Levaxela (levofloxacin) film-coated tablets and solution for infusion. As to cancer treatments, we obtained marketing authorisations for Neopax (imatinib) and Letrozole Krka (letrozole). Additional marketing authorisations expanded our marketing opportunities for Kventiax SR (quetiapine) sustained release tablets, Kventiax (quetiapine) film-coated tablets, the Nolpaza (pantoprazole) powder for the preparation of solution for injection, Doreta (tramadol and paracetamol), the Naklofen gel, and Vizarsin QTab (sildenafil) dispersible tablets. In the markets of South-East Europe we expanded marketing opportunities for products from various indication areas. We obtained marketing approvals for the antibiotics Azibiot (azithromycin), Amatib (amoxicillin) in the form of oral powder, Furocef (cephuroxime) in the form of film-coated tablets, and Levalox (levofloxacin) in the form of film-coated tablets and solution for infusion . In addition, marketing authorisations were obtained for the cardiovascular treatments Bloxazoc (metoprolol) and the dual combinations Rosudapin (rosuvastatin and amlodipine) and Tenloris (losartan and amlodipine). As to treatments for the central nervous system, we obtained marketing authorisations for Dulsevia (duloxetine), Pragiola (pregabalin), Aryzalera (aripiprazole) and Oprymea (pramipexole). We expanded marketing opportunities for the Ecansya
Unaudited Interim Report for the Krka Group and the Krka Company for the First Half of 2016 27
(capecitabine) cytostatic and the tramadol analgesic in the form of solution for injection.
Non-prescription products
In the Russian Federation we obtained a first marketing authorisation for Flebaven film-coated tablets. They contain 500 mg of purified flavonoid fraction, which equals 450 mg of diosmin and 50 mg of flavonoids expressed as hesperidin. It is used to treat symptoms of chronic venous insufficiency, lymphedema and acute hemorrhoidal disease. Applying the decentralised procedure we obtained additional approvals in European markets for the Septanazal nasal spray for adults and the Septanazal nasal spray for children.
We expanded different markets for certain key cold and flu products by obtaining additional marketing authorisations there. The Septanazal nasal spray for adults and the Septanazal nasal spray for children were approved in Azerbaijan, and the Septolete Total spray and lozenges in Moldova, Turkmenistan and Uzbekistan. As to our herbal products, the Herbion Iceland moss syrup was additionally approved in Mongolia.
Animal health products
In the first half of 2016 we increased the number of marketing authorisations and strengthened brand recognition for our well-established products. Applying the decentralised procedure we were the first generic company to obtain marketing authorisations in ten Western European countries, and in the Czech Republic and Slovakia, for Fypryst/Amflee Combo (fipronil and S-methoprene) in the form of spot-on solution in five strengths, a product preventing and treating tick, flea and lice infestations in cats, dogs and skunks. The product enables a modern and wholesome treatment of external parasite infestations and acts on all life cycle stages of fleas. As to treatments for food-producing animals, we obtained marketing authorisations under the national procedure in Belgium for the Enrox classic (enrofloxacin) solution for injection. In Serbia and Ukraine marketing authorisations were acquired for
the Amatib (amoxicillin) oral powder for the treatment of respiratory infections. We were additionally granted marketing authorisations for the Dehelman (levamisole) oral powder for the treatment of intestinal parasites and lung worms. We expanded markets for our products for companion animals. In Bosnia and Herzegovina and in Macedonia we obtained approvals to market the fixed-dose combination Ataxxa (imidacloprid and permethrin) in the form of spot-on solution in four strengths, for dogs. Marketing authorisations were granted in Ukraine and Macedonia for the Marfloxin (marbofloxacin) solution for injection treating infections in cats and dogs. In Serbia we additionally obtained marketing authorisations for the fixed-dose combination Milprazon (milbemycin oxime and praziquantel) in the form of film-coated tablets in two strengths, for cats. It is intended to treat and prevent infestations with intestinal worms.
Investments In the first half of 2016 the Krka Group allocated €61.8 million to investments, of which the controlling company invested €30.0 million and subsidiaries €31.8 million. Investments were primarily increasing and modernising our production and R&D capacities. At Krka's main location in Ločna, Novo mesto, Slovenia, we officially opened in November 2015 a plant for solid dosage pharmaceuticals, Notol 2. The €200 million investment provides new capacities for
implementing the vertically integrated business model, with which we control the entire process from development to production of both raw materials and finished products. New production lines will gradually be added by the end of next year to increase the plant's production capacity to the target 4.5 billion tablets and capsules per year. Krka's key investment to support development activities and quality assurance in the following years is the Development and Control Centre

CONFIDENTIAL
28 Unaudited Interim Report for the Krka Group and the Krka Company for the First Half of 2016
(RKC) 4, located in the group of production facilities in Novo mesto. RKC 4 will be located in the immediate vicinity of the other three development and control centres and will connect to RKC 2 and RKC 3. Preparation works for the building worth €54 million started in June 2015. By the end of this year the facility's stage of construction will allow us to commence installing equipment. The construction of the new facility with the total surface area of 18,000 m² will be finished in 2017. The €8 million investment into increasing the production of sprays in the sterile product production plant is in its final phase. Production lines will be ready for operation this autumn. The €11 million investment into increasing capacities for the coating of pellets in the solid dosage forms plant (OTO) is in the design phase. Additional capacities will be made ready for production by the end of June 2017.
As to Krka's subsidiaries, the most important ongoing investment is Krka-Rus 2 in Istra, the Russian Federation. The first stage of the project had included building a new plant and logistics centre, and in 2015 we started fitting additional technological and logistics equipment, which will bring the warehouse and logistics centre to full capacity. The total value of additional equipment, which will be installed by the end of 2016, is €30 million. Due to the expansion of the production programme in the Jastrebarsko distribution and production centre in Croatia, we are converting the warehousing and distribution segment of the facility to acquire new production and laboratory facilities for solid dosage pharmaceuticals. Equipment installation and assembly will be taking place through to the end of the year, and the start-up of production on the new technological equipment is planned for the first quarter of 2017. The investment is estimated at €33 million.
Employees In the first half of 2016 the number of Krka Group employees increased by 257, or 2.4%. At the end of June the Krka Group had 10,821 employees.
Krka's subsidiaries and representation offices outside Slovenia employ 54% of the Group’s employees, and 56% of the entire Krka team have at least a university-level qualification.
Educational structure
30 Jun 2016 31 Dec 2015
No. of employees Share (%)
No. of employees Share (%)
PhD 163 1.5 152 1.4
MSc 364 3.4 349 3.3
University degree 5,532 51.1 5,291 50.1
Higher professional education degree 1,410 13.0 1,385 13.1
Vocational college degree 259 2.4 304 2.9
Secondary school education, level V 1,886 17.4 1,844 17.5
Other 1,207 11.2 1,239 11.7
Krka Group 10,821 100.0 10,564 100.0
We ensure a continuous inflow of new talented staff by offering study grants to students. There are currently 45 students receiving Krka study grants. They are primarily pharmacy and chemistry students, while Krka also awards grants to outstanding students from other fields that are of interest to the company.
Krka has always invested into employee development, upholding good relations among employees and catering for the well-being of employees in the workplace and outside it. Employees show a keen interest in new knowledge and further schooling. There are currently 46 employees enrolled into postgraduate studies

Unaudited Interim Report for the Krka Group and the Krka Company for the First Half of 2016 29
towards obtaining a specialisation, master's degree or doctoral degree, and a total of 211 are enrolled into part time graduate studies, all with the Company's support. Ten employees completed their studies in the first half of the year. Krka is the only certificate-awarding body in Slovenia with the power to examine and approve National Vocational Qualifications (NVQ) in the area of pharmacy. By examining and approving candidates under the NVQ system between 2002 and June 2016, we awarded a total of 1,305 NVQ certificates for four vocational qualifications to 1,163 Krka employees and to 142 participants from other organisations in the pharmaceutical industry. There are currently 66 Krka employees in the process of obtaining a NVQ certificate. By caring for their health and by offering them a wide range of activities, we provide for a wholesome quality of work and life in our employees, which contributes to their satisfaction and raises the
Group's appeal to high-quality staff, thus contributing to our successful performance. Every year we organise a joint sporting and social event for all employees. At the end of 2015 we measured the organisational climate and the level of employee satisfaction and commitment. The results of the measurement show employee commitment and loyalty to the Krka Group to be high. The Krka Group promotes initiative and innovation, cooperation and team work, loyalty and commitment in employees. At this year's traditional Krka Awards Day we bestowed the special Boris Adrijanič MSc Award for exceptional achievements. 656 most loyal employees, 19 best managers and 50 best employees received recognition awards, and we also conferred awards and recognitions for inventive work. In the first half of 2016, 347 Krka employees had put forward 407 useful proposals.

30 Unaudited Interim Report for the Krka Group and the Krka Company for the First Half of 2016
CONDENSED CONSOLIDATED FINANCIAL STATEMENTS OF THE KRKA GROUP, WITH NOTES
Consolidated statement of financial position of the Krka Group In € thousand 30 Jun 2016 31 Dec 2015 Index
Assets
Property, plant and equipment 847,472 826,192 103
Intangible assets 114,736 116,940 98
Loans 9,113 7,696 118
Investments 7,899 7,580 104
Deferred tax assets 27,707 27,949 99
Other non-current assets 254 241 105
Total non-current assets 1,007,181 986,598 102
Assets held for sale 41 41 100
Inventories 271,360 272,878 99
Trade receivables 487,947 433,133 113
Other receivables 36,128 31,540 115
Loans 71,738 37,380 192
Investments 74 11,808 1
Cash and cash equivalents 54,154 35,826 151
Total current assets 921,442 822,606 112
Total assets 1,928,623 1,809,204 107
Equity
Share capital 54,732 54,732 100
Treasury shares -22,516 -20,071 112
Reserves 88,537 73,387 121
Retained earnings 1,363,737 1,296,688 105
Total equity holders of the parent 1,484,490 1,404,736 106
Non-controlling interests within equity 1,339 1,248 107
Total equity 1,485,829 1,405,984 106
Liabilities
Provisions 84,659 84,865 100
Deferred revenue 12,750 13,381 95
Deferred tax liabilities 12,553 12,736 99
Total non-current liabilities 109,962 110,982 99
Trade payables 109,764 103,871 106
Income tax payable 3,822 8,030 48
Other current liabilities 219,246 180,337 122
Total current liabilities 332,832 292,238 114
Total liabilities 442,794 403,220 110
Total equity and liabilities 1,928,623 1,809,204 107

Unaudited Interim Report for the Krka Group and the Krka Company for the First Half of 2016 31
Consolidated income statement of the Krka Group In € thousand 1–6/2016 1–6/2015 Index
Revenues 603,803 599,850 101
Costs of goods sold -261,053 -248,943 105
Gross profit 342,750 350,907 98
Other operating income 3,919 2,861 137
Selling and distribution expenses -154,766 -155,822 99
R&D expenses -58,735 -56,446 104
General and administrative expenses -38,868 -37,168 105
Operating profit 94,300 104,332 90
Financial income 42,618 24,459 174
Financial expenses -55,893 -402
Net financial result -13,275 24,057
Profit before tax 81,025 128,389 63
Income tax -10,909 -16,100 68
Net profit 70,116 112,289 62
Attributable to:
– equity holders of the parent 70,024 112,308 62
– non-controlling interest 92 -19
Basic earnings per share* (in €) 2.16 3.45 63
Diluted earnings per share** (in €) 2.16 3.45 63
* Net profit/Average number of shares issued in the period, exclusive of treasury shares ** All shares issued by the controlling company are ordinary registered shares, therefore the diluted EPS equals the basic
EPS.
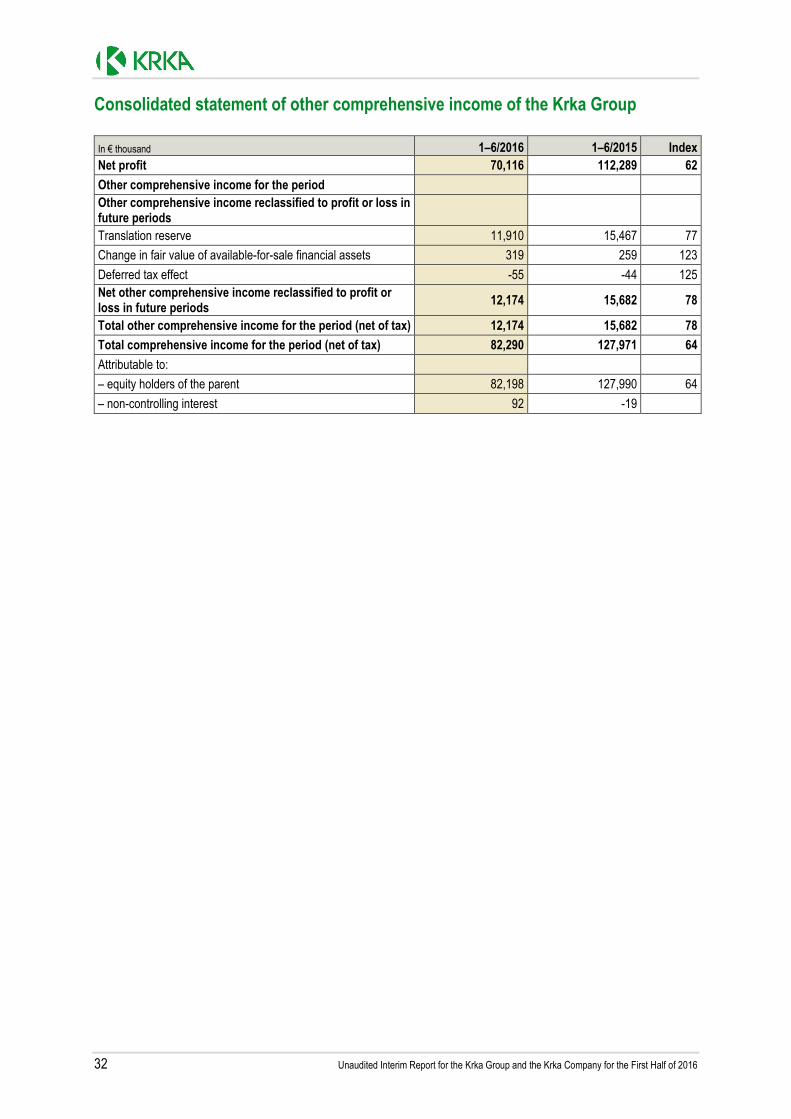
32 Unaudited Interim Report for the Krka Group and the Krka Company for the First Half of 2016
Consolidated statement of other comprehensive income of the Krka Group In € thousand 1–6/2016 1–6/2015 Index
Net profit 70,116 112,289 62
Other comprehensive income for the period Other comprehensive income reclassified to profit or loss in future periods
Translation reserve 11,910 15,467 77
Change in fair value of available-for-sale financial assets 319 259 123
Deferred tax effect -55 -44 125 Net other comprehensive income reclassified to profit or loss in future periods
12,174 15,682 78
Total other comprehensive income for the period (net of tax) 12,174 15,682 78
Total comprehensive income for the period (net of tax) 82,290 127,971 64
Attributable to:
– equity holders of the parent 82,198 127,990 64
– non-controlling interest 92 -19

Unaudited Interim Report for the Krka Group and the Krka Company for the First Half of 2016 33
Consolidated statement of changes in equity of the Krka Group
In € thousand Share
capital Treasury
shares
Reserves Retained earnings
Total equity holders of the parent
Non-controlling
interests within equity
Total equity
Reserves for treasury
shares Share
premium Legal
reserves Statutory reserves
Fair value reserve
Translation reserve
Other profit reserves
Retained earnings
Profit for the period
Balance at 1 Jan 2016 54,732 -20,071 20,071 105,897 14,990 30,000 -12,453 -85,118 1,051,677 96,160 148,851 1,404,736 1,248 1,405,984
Net profit 0 0 0 0 0 0 0 0 0 0 70,024 70,024 92 70,116
Total other comprehensive income for the period (net of tax)
0 0 0 0 0 0 795 11,910 0 -531 0 12,174 0 12,174
Total comprehensive income for the period (net of tax)
0 0 0 0 0 0 795 11,910 0 -531 70,024 82,198 92 82,290
Transactions with owners, recognised directly in equity
Transfer of previous period's profit to retained earnings
0 0 0 0 0 0 0 0 0 148,851 -148,851 0 0 0
Repurchase of treasury shares 0 -2,445 0 0 0 0 0 0 0 0 0 -2,445 0 -2,445
Formation of reserves for treasury shares
0 0 2,445 0 0 0 0 0 0 0 -2,445 0 0 0
Total transactions with owners, recognised directly in equity
0 -2,445 2,445 0 0 0 0 0 0 148,851 -151,296 -2,445 0 -2,445
Balance at 30 Jun 2016 54,732 -22,516 22,516 105,897 14,990 30,000 -11,658 -73,208 1,051,677 244,480 67,579 1,484,489 1,340 1,485,829
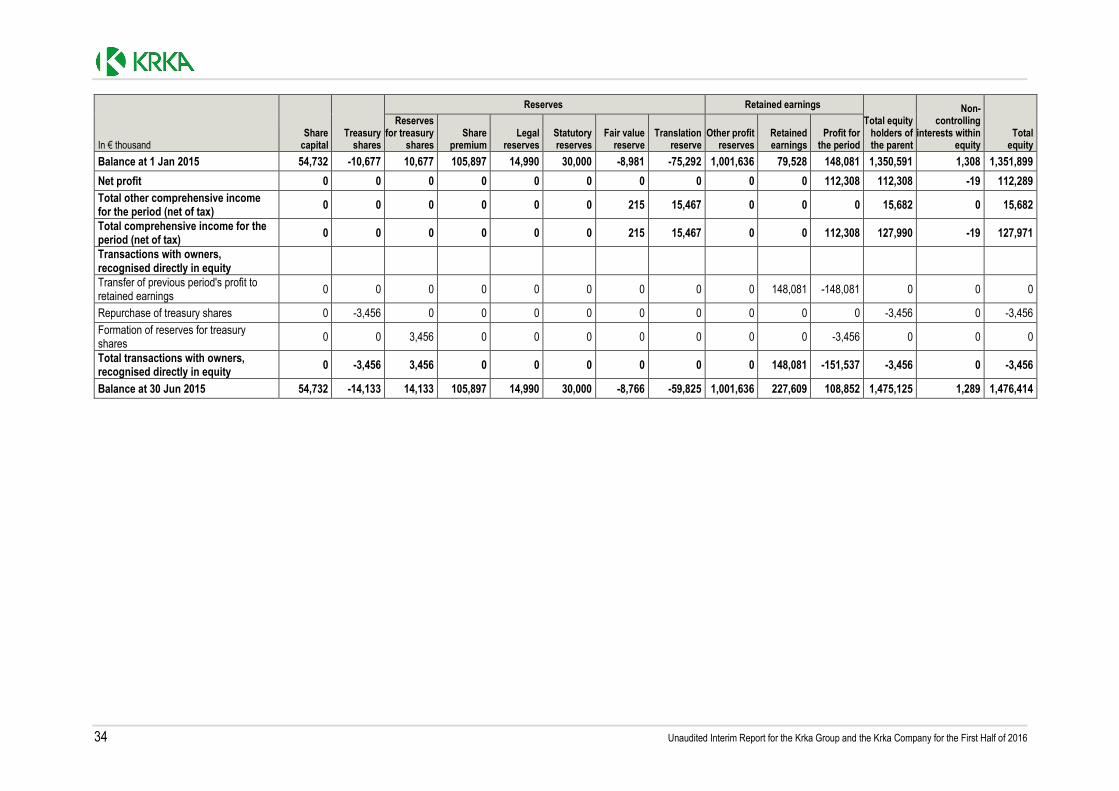
34 Unaudited Interim Report for the Krka Group and the Krka Company for the First Half of 2016
In € thousand Share
capital Treasury
shares
Reserves Retained earnings
Total equity holders of the parent
Non-controlling
interests within equity
Total equity
Reserves for treasury
shares Share
premium Legal
reserves Statutory reserves
Fair value reserve
Translation reserve
Other profit reserves
Retained earnings
Profit for the period
Balance at 1 Jan 2015 54,732 -10,677 10,677 105,897 14,990 30,000 -8,981 -75,292 1,001,636 79,528 148,081 1,350,591 1,308 1,351,899
Net profit 0 0 0 0 0 0 0 0 0 0 112,308 112,308 -19 112,289
Total other comprehensive income for the period (net of tax)
0 0 0 0 0 0 215 15,467 0 0 0 15,682 0 15,682
Total comprehensive income for the period (net of tax)
0 0 0 0 0 0 215 15,467 0 0 112,308 127,990 -19 127,971
Transactions with owners, recognised directly in equity
Transfer of previous period's profit to retained earnings
0 0 0 0 0 0 0 0 0 148,081 -148,081 0 0 0
Repurchase of treasury shares 0 -3,456 0 0 0 0 0 0 0 0 0 -3,456 0 -3,456
Formation of reserves for treasury shares
0 0 3,456 0 0 0 0 0 0 0 -3,456 0 0 0
Total transactions with owners, recognised directly in equity
0 -3,456 3,456 0 0 0 0 0 0 148,081 -151,537 -3,456 0 -3,456
Balance at 30 Jun 2015 54,732 -14,133 14,133 105,897 14,990 30,000 -8,766 -59,825 1,001,636 227,609 108,852 1,475,125 1,289 1,476,414
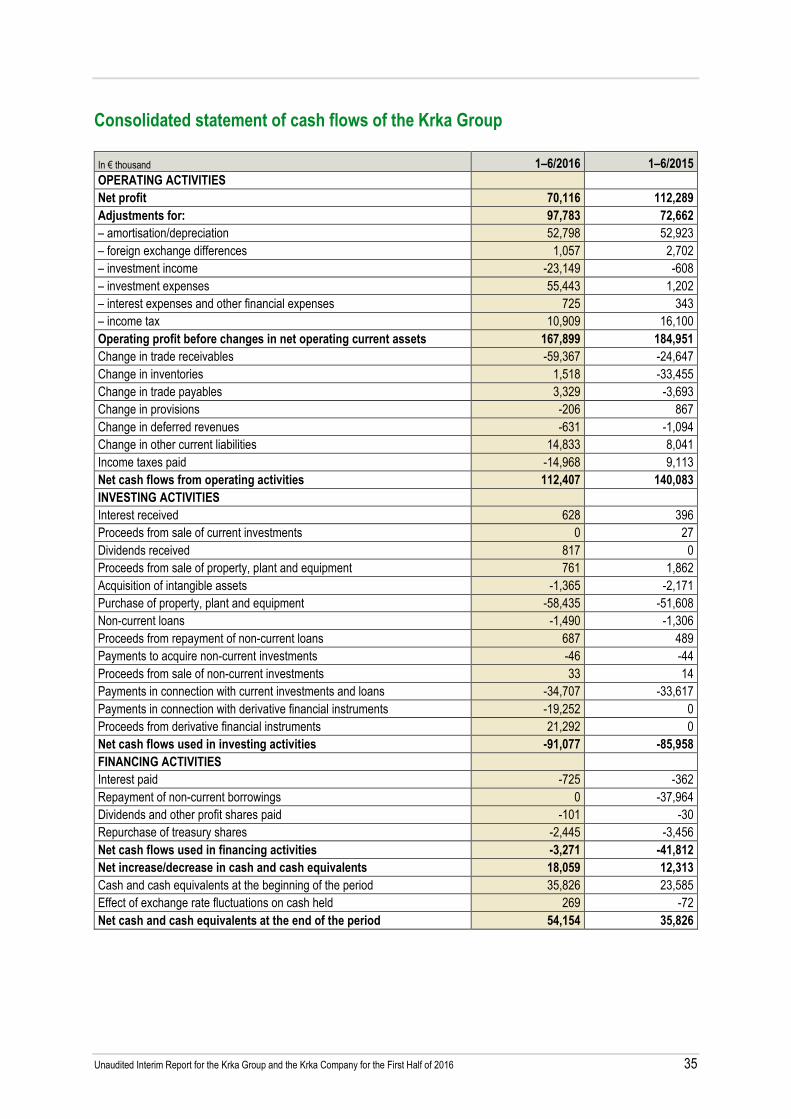
Unaudited Interim Report for the Krka Group and the Krka Company for the First Half of 2016 35
Consolidated statement of cash flows of the Krka Group In € thousand 1–6/2016 1–6/2015
OPERATING ACTIVITIES
Net profit 70,116 112,289
Adjustments for: 97,783 72,662
– amortisation/depreciation 52,798 52,923 – foreign exchange differences 1,057 2,702 – investment income -23,149 -608 – investment expenses 55,443 1,202 – interest expenses and other financial expenses 725 343 – income tax 10,909 16,100 Operating profit before changes in net operating current assets 167,899 184,951
Change in trade receivables -59,367 -24,647 Change in inventories 1,518 -33,455 Change in trade payables 3,329 -3,693 Change in provisions -206 867 Change in deferred revenues -631 -1,094 Change in other current liabilities 14,833 8,041 Income taxes paid -14,968 9,113 Net cash flows from operating activities 112,407 140,083
INVESTING ACTIVITIES Interest received 628 396 Proceeds from sale of current investments 0 27 Dividends received 817 0 Proceeds from sale of property, plant and equipment 761 1,862 Acquisition of intangible assets -1,365 -2,171 Purchase of property, plant and equipment -58,435 -51,608 Non-current loans -1,490 -1,306 Proceeds from repayment of non-current loans 687 489 Payments to acquire non-current investments -46 -44 Proceeds from sale of non-current investments 33 14 Payments in connection with current investments and loans -34,707 -33,617 Payments in connection with derivative financial instruments -19,252 0 Proceeds from derivative financial instruments 21,292 0 Net cash flows used in investing activities -91,077 -85,958
FINANCING ACTIVITIES
Interest paid -725 -362 Repayment of non-current borrowings 0 -37,964 Dividends and other profit shares paid -101 -30 Repurchase of treasury shares -2,445 -3,456 Net cash flows used in financing activities -3,271 -41,812
Net increase/decrease in cash and cash equivalents 18,059 12,313
Cash and cash equivalents at the beginning of the period 35,826 23,585 Effect of exchange rate fluctuations on cash held 269 -72 Net cash and cash equivalents at the end of the period 54,154 35,826

36 Unaudited Interim Report for the Krka Group and the Krka Company for the First Half of 2016
Segment reporting of the Krka Group
In € thousand European Union South-East Europe East Europe Other Elimination Total
1–6/2016 1–6/2015 1–6/2016 1–6/2015 1–6/2016 1–6/2015 1–6/2016 1–6/2015 1–6/2016 1–6/2015 1–6/2016 1–6/2015
Revenues from non-Group companies
374,431 369,367 30,099 25,693 175,542 185,942 23,731 18,848 0 0 603,803 599,850
Intra-Group revenues 105,478 127,398 13,560 11,305 82,605 105,673 0 0 -201,643 -244,376 0 0
Other operating income 1,955 1,579 759 44 1,205 1,238 0 0 0 0 3,919 2,861 Operating expenses -324,090 -301,175 -22,766 -21,294 -152,585 -163,685 -13,981 -12,225 0 0 -513,422 -498,379 Intra-Group operating expenses
-181,676 -208,945 -14,920 -12,893 -172,531 -190,176 -4 -5 369,131 412,019 0 0
Operating profit 52,296 69,771 8,092 4,443 24,162 23,495 9,750 6,623 0 0 94,300 104,332
Interest income 267 224 204 2 158 170 0 0 0 0 629 396 Intra-group interest income 446 533 0 0 0 0 0 0 -446 -533 0 0 Interest expenses -608 -243 0 0 0 -5 0 0 0 0 -608 -248 Intra-group interest expenses
-157 -314 0 0 -380 -330 0 0 537 644 0 0
Net financial result -1,966 1,010 -421 6 -9,874 23,925 -1,014 -884 0 0 -13,275 24,057
Income tax -6,845 -11,336 -642 -834 -2,794 -3,144 -628 -786 0 0 -10,909 -16,100 Net profit 43,485 59,445 7,029 3,615 11,494 44,276 8,108 4,953 0 0 70,116 112,289
Investments 49,350 40,472 99 54 12,306 4,871 0 0 0 0 61,755 45,397 Depreciation 34,914 34,583 997 912 12,972 13,413 191 176 0 0 49,074 49,084 Amortisation 2,413 2,517 158 139 1,040 1,099 113 84 0 0 3,724 3,839 30 Jun 2016 31 Dec 2015 30 Jun 2016 31 Dec 2015 30 Jun 2016 31 Dec 2015 30 Jun 2016 31 Dec 2015 30 Jun 2016 31 Dec 2015 30 Jun 2016 31 Dec 2015
Total assets 1,435,520 1,394,853 43,064 38,680 439,710 368,309 10,329 7,362 0 0 1,928,623 1,809,204
Goodwill 42,644 42,644 0 0 0 0 0 0 0 0 42,644 42,644 Trademark 39,435 39,859 0 0 0 0 0 0 0 0 39,435 39,859 Total liabilities 340,561 309,305 8,972 8,231 68,972 64,079 24,289 21,605 0 0 442,794 403,220
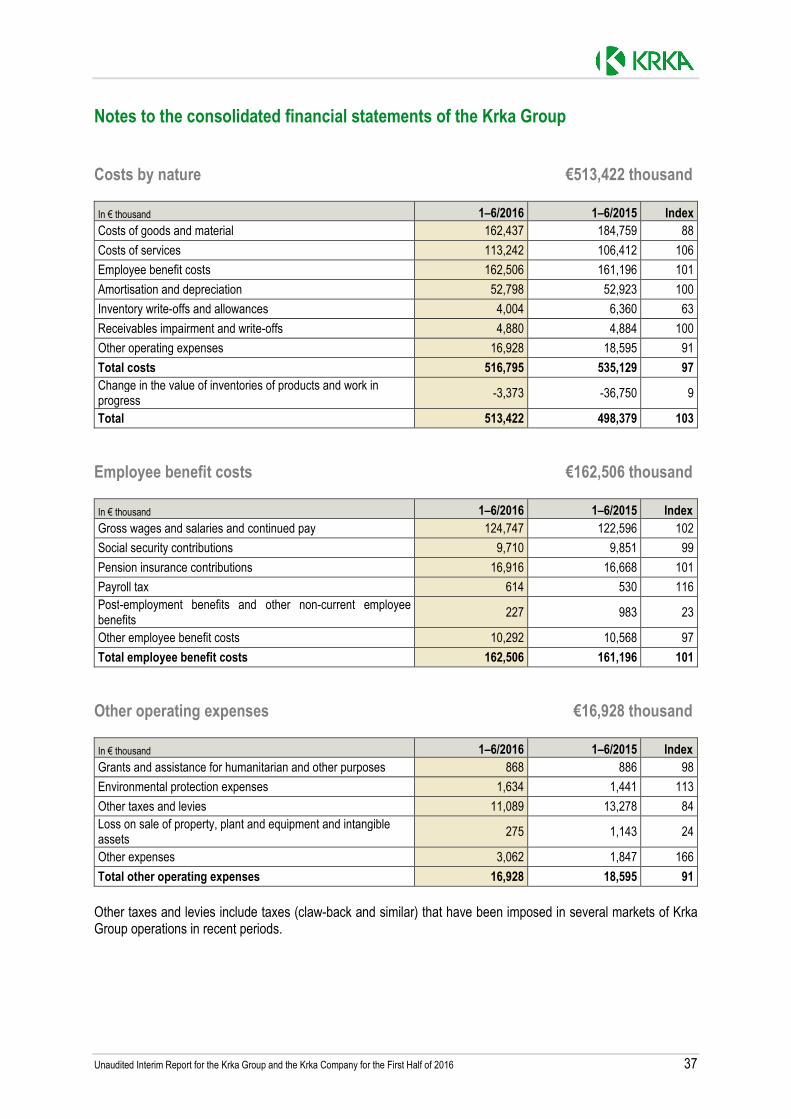
Unaudited Interim Report for the Krka Group and the Krka Company for the First Half of 2016 37
Notes to the consolidated financial statements of the Krka Group Costs by nature €513,422 thousand In € thousand 1–6/2016 1–6/2015 Index
Costs of goods and material 162,437 184,759 88
Costs of services 113,242 106,412 106
Employee benefit costs 162,506 161,196 101
Amortisation and depreciation 52,798 52,923 100
Inventory write-offs and allowances 4,004 6,360 63
Receivables impairment and write-offs 4,880 4,884 100
Other operating expenses 16,928 18,595 91
Total costs 516,795 535,129 97
Change in the value of inventories of products and work in progress
-3,373 -36,750 9
Total 513,422 498,379 103
Employee benefit costs €162,506 thousand
In € thousand 1–6/2016 1–6/2015 Index
Gross wages and salaries and continued pay 124,747 122,596 102
Social security contributions 9,710 9,851 99
Pension insurance contributions 16,916 16,668 101
Payroll tax 614 530 116 Post-employment benefits and other non-current employee benefits
227 983 23
Other employee benefit costs 10,292 10,568 97
Total employee benefit costs 162,506 161,196 101
Other operating expenses €16,928 thousand
In € thousand 1–6/2016 1–6/2015 Index
Grants and assistance for humanitarian and other purposes 868 886 98
Environmental protection expenses 1,634 1,441 113
Other taxes and levies 11,089 13,278 84 Loss on sale of property, plant and equipment and intangible assets
275 1,143 24
Other expenses 3,062 1,847 166
Total other operating expenses 16,928 18,595 91
Other taxes and levies include taxes (claw-back and similar) that have been imposed in several markets of Krka Group operations in recent periods.

38 Unaudited Interim Report for the Krka Group and the Krka Company for the First Half of 2016
Financial income and expenses In € thousand 1–6/2016 1–6/2015 Index
Net foreign exchange differences 19,874 24,039 83
Interest income 629 396 159
Change in fair value of investments through profit or loss 6 0
Proceeds from sale of investments 0 24 0
Derivatives income 21,292 0
– income 21,292 0
Income from dividends 817 0
Total financial income 42,618 24,459 174
Interest expenses -608 -248 245
Change in fair value of investments through profit or loss -11 -59 19
Derivatives expenses -55,157 0
– expenses -19,251 0
– change in fair value -35,906 0
Other financial expenses -117 -95 123
Total financial expenses -55,893 -402
Net financial result -13,275 24,057
Income tax €10,909 thousand Current income tax amounts to €10,750 thousand, which is 13.3% of pre-tax profit. Together with the deferred tax of €159 thousand, the total income tax expense in the income statement equals
€10,909 thousand. The effective tax rate is 13.5%, up 1.0 of a percentage point from the same period last year.
Property, plant and equipment €847,472 thousand In € thousand 30 Jun 2016 31 Dec 2015 Index
Land 35,422 35,227 101
Buildings 402,092 408,238 98
Equipment 342,408 352,005 97
Property, plant and equipment being acquired 67,550 30,722 220
Total property, plant and equipment 847,472 826,192 103
The value of property, plant and equipment represents 44% of the Group's total assets. Krka’s
major investments are described in the chapter Investments in the Business Report.

Unaudited Interim Report for the Krka Group and the Krka Company for the First Half of 2016 39
Intangible assets €114,736 thousand In € thousand 30 Jun 2016 31 Dec 2015 Index
Goodwill 42,644 42,644 100
Trademark 39,435 39,859 99
Concessions, patents, licences and similar rights 28,035 30,506 92
Intangible assets being acquired 4,622 3,931 118
Total intangible assets 114,736 116,940 98
Loans €80,851 thousand In € thousand 30 Jun 2016 31 Dec 2015 Index
Non-current loans 9,113 7,696 118
– loans to others 9,113 7,696 118
Current loans 71,738 37,380 192
– portion of non-current loans maturing next year 364 155 235
– loans to others 71,373 37,224 192
– current interest receivable 1 1 100
Total loans 80,851 45,076 179
Non-current loans represent 11% of total loans. Non-current loans to others include loans that the Group extends in accordance with its internal acts to its employees, and that are primarily housing
loans. Current loans to others include €71,000 thousand of the controlling company's short-term bank deposits with maturities longer than 30 days.
Investments €7,973 thousand In € thousand 30 Jun 2016 31 Dec 2015 Index
Non-current investments 7,899 7,580 104
– available-for-sale financial assets 7,899 7,580 104
Current investments including derivatives 74 11,808 1
– shares and interests held for trading 74 79 94
– derivatives 0 11,729 0
Total investments 7,973 19,388 41
Available-for-sale financial assets include €695 thousand of investments in shares and interests in companies in Slovenia, and €7,204 thousand of
investments in shares and interests in companies abroad.

40 Unaudited Interim Report for the Krka Group and the Krka Company for the First Half of 2016
Inventories €271,360 thousand In € thousand 30 Jun 2016 31 Dec 2015 Index
Material 107,284 111,113 97
Work in progress 65,583 64,369 102
Products 90,896 90,395 101
Merchandise 6,700 6,287 107
Inventory advances 897 714 126
Total inventories 271,360 272,878 99
Trade and other receivables €524,075 thousand In € thousand 30 Jun 2016 31 Dec 2015 Index
Current trade receivables 487,947 433,133 113
Other current receivables 36,128 31,540 115
Total receivables 524,075 464,673 113
Cash and cash equivalents €54,154 thousand In € thousand 30 Jun 2016 31 Dec 2015 Index
Cash in hand 25 32 78
Bank balances 54,129 35,794 151
Total cash and cash equivalents 54,154 35,826 151
Equity €1,485,829 thousand In € thousand 30 Jun 2016 31 Dec 2015 Index
Share capital 54,732 54,732 100
Treasury shares -22,516 -20,071 112
Reserves 88,537 73,387 121
– reserves for treasury shares 22,516 20,071 112
– share premium 105,897 105,897 100
– legal reserves 14,990 14,990 100
– statutory reserves 30,000 30,000 100
– fair value reserve -11,658 -12,453 94
– translation reserve -73,208 -85,118 86
Retained earnings 1,363,736 1,296,688 105
Total equity holders of the parent 1,484,489 1,404,736 106
Non-controlling interests within equity 1,340 1,248 107
Total equity 1,485,829 1,405,984 106
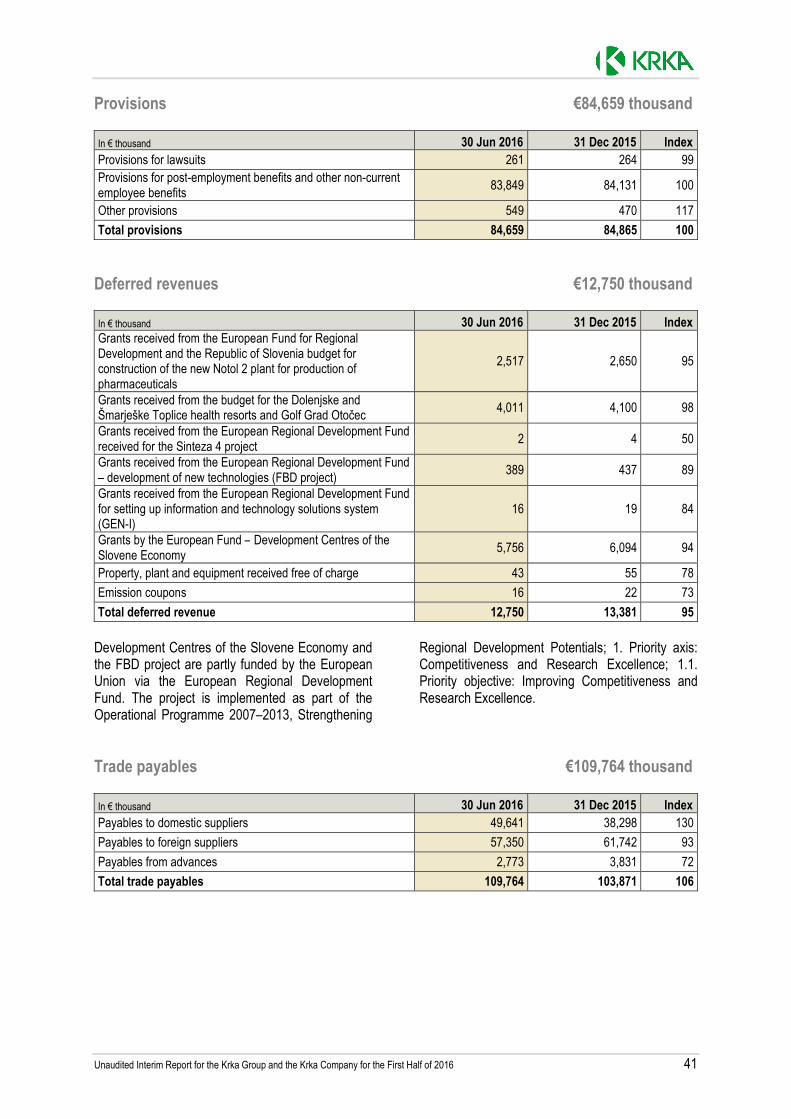
Unaudited Interim Report for the Krka Group and the Krka Company for the First Half of 2016 41
Provisions €84,659 thousand In € thousand 30 Jun 2016 31 Dec 2015 Index
Provisions for lawsuits 261 264 99 Provisions for post-employment benefits and other non-current employee benefits
83,849 84,131 100
Other provisions 549 470 117
Total provisions 84,659 84,865 100
Deferred revenues €12,750 thousand In € thousand 30 Jun 2016 31 Dec 2015 Index
Grants received from the European Fund for Regional Development and the Republic of Slovenia budget for construction of the new Notol 2 plant for production of pharmaceuticals
2,517 2,650 95
Grants received from the budget for the Dolenjske and Šmarješke Toplice health resorts and Golf Grad Otočec
4,011 4,100 98
Grants received from the European Regional Development Fund received for the Sinteza 4 project
2 4 50
Grants received from the European Regional Development Fund – development of new technologies (FBD project)
389 437 89
Grants received from the European Regional Development Fund for setting up information and technology solutions system (GEN-I)
16 19 84
Grants by the European Fund – Development Centres of the Slovene Economy
5,756 6,094 94
Property, plant and equipment received free of charge 43 55 78
Emission coupons 16 22 73
Total deferred revenue 12,750 13,381 95
Development Centres of the Slovene Economy and the FBD project are partly funded by the European Union via the European Regional Development Fund. The project is implemented as part of the Operational Programme 2007–2013, Strengthening
Regional Development Potentials; 1. Priority axis: Competitiveness and Research Excellence; 1.1. Priority objective: Improving Competitiveness and Research Excellence.
Trade payables €109,764 thousand In € thousand 30 Jun 2016 31 Dec 2015 Index
Payables to domestic suppliers 49,641 38,298 130
Payables to foreign suppliers 57,350 61,742 93
Payables from advances 2,773 3,831 72
Total trade payables 109,764 103,871 106

42 Unaudited Interim Report for the Krka Group and the Krka Company for the First Half of 2016
Other current liabilities €219,246 thousand In € thousand 30 Jun 2016 31 Dec 2015 Index
Accrued contractual discounts on products sold 138,626 128,179 108 Payables to employees – gross wages, other receipts and charges
37,397 33,657 111
Derivatives 24,176 0
Other 19,047 18,501 103
Total other current liabilities 219,246 180,337 122
Contingent liabilities €14,089 thousand In € thousand 30 Jun 2016 31 Dec 2015 Index
Guarantees issued 13,469 19,150 70
Other 620 620 100
Total contingent liabilities 14,089 19,770 71
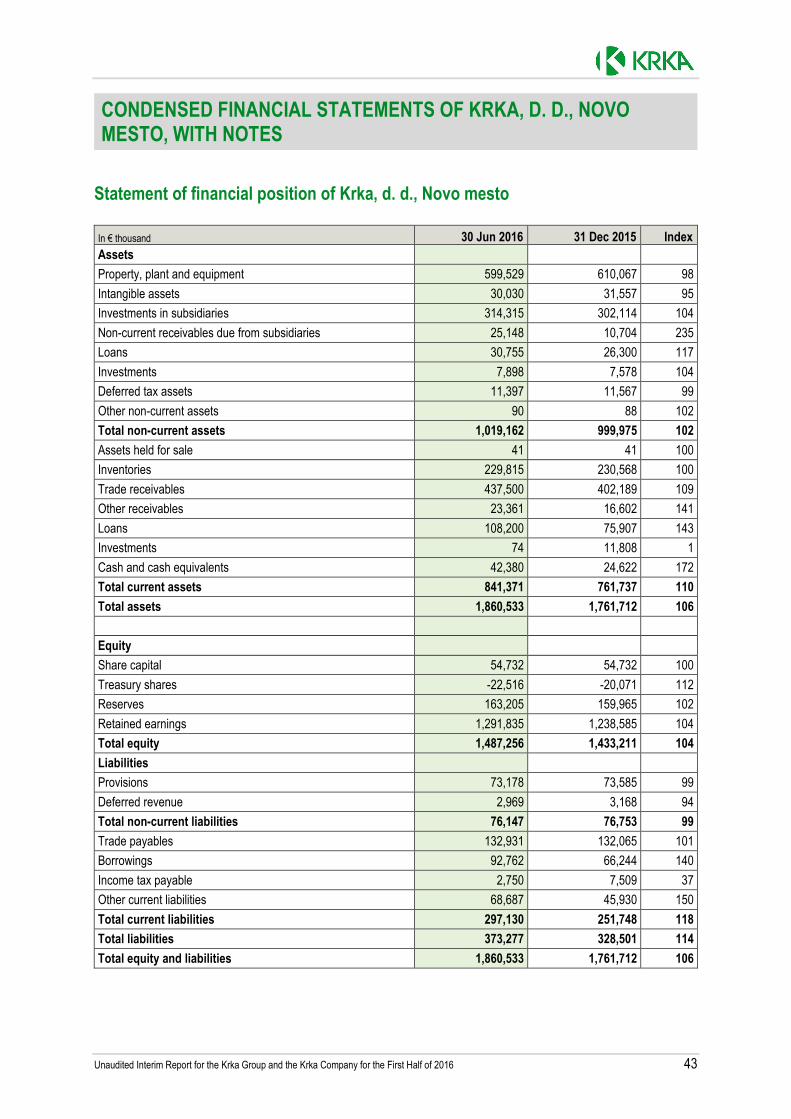
Unaudited Interim Report for the Krka Group and the Krka Company for the First Half of 2016 43
CONDENSED FINANCIAL STATEMENTS OF KRKA, D. D., NOVO MESTO, WITH NOTES
Statement of financial position of Krka, d. d., Novo mesto In € thousand 30 Jun 2016 31 Dec 2015 Index
Assets
Property, plant and equipment 599,529 610,067 98
Intangible assets 30,030 31,557 95
Investments in subsidiaries 314,315 302,114 104
Non-current receivables due from subsidiaries 25,148 10,704 235
Loans 30,755 26,300 117
Investments 7,898 7,578 104
Deferred tax assets 11,397 11,567 99
Other non-current assets 90 88 102
Total non-current assets 1,019,162 999,975 102
Assets held for sale 41 41 100
Inventories 229,815 230,568 100
Trade receivables 437,500 402,189 109
Other receivables 23,361 16,602 141
Loans 108,200 75,907 143
Investments 74 11,808 1
Cash and cash equivalents 42,380 24,622 172
Total current assets 841,371 761,737 110
Total assets 1,860,533 1,761,712 106
Equity
Share capital 54,732 54,732 100
Treasury shares -22,516 -20,071 112
Reserves 163,205 159,965 102
Retained earnings 1,291,835 1,238,585 104
Total equity 1,487,256 1,433,211 104
Liabilities
Provisions 73,178 73,585 99
Deferred revenue 2,969 3,168 94
Total non-current liabilities 76,147 76,753 99
Trade payables 132,931 132,065 101
Borrowings 92,762 66,244 140
Income tax payable 2,750 7,509 37
Other current liabilities 68,687 45,930 150
Total current liabilities 297,130 251,748 118
Total liabilities 373,277 328,501 114
Total equity and liabilities 1,860,533 1,761,712 106
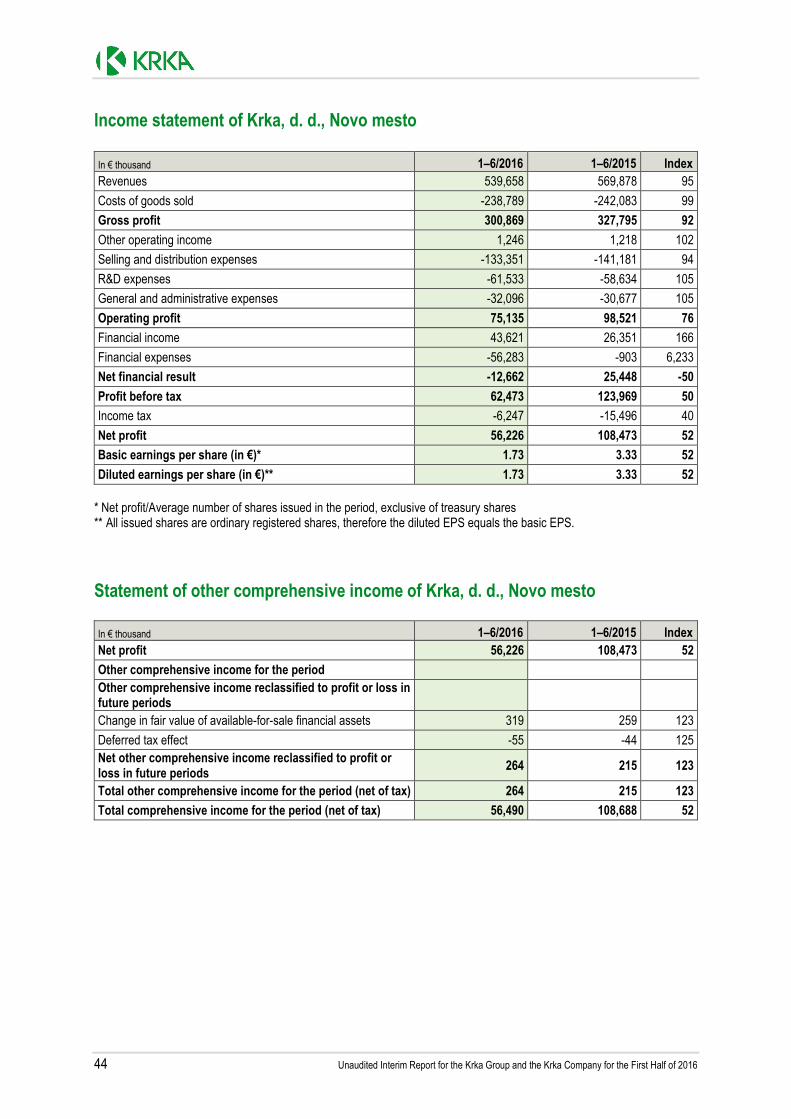
44 Unaudited Interim Report for the Krka Group and the Krka Company for the First Half of 2016
Income statement of Krka, d. d., Novo mesto In € thousand 1–6/2016 1–6/2015 Index
Revenues 539,658 569,878 95
Costs of goods sold -238,789 -242,083 99
Gross profit 300,869 327,795 92
Other operating income 1,246 1,218 102
Selling and distribution expenses -133,351 -141,181 94
R&D expenses -61,533 -58,634 105
General and administrative expenses -32,096 -30,677 105
Operating profit 75,135 98,521 76
Financial income 43,621 26,351 166
Financial expenses -56,283 -903 6,233
Net financial result -12,662 25,448 -50
Profit before tax 62,473 123,969 50
Income tax -6,247 -15,496 40
Net profit 56,226 108,473 52
Basic earnings per share (in €)* 1.73 3.33 52
Diluted earnings per share (in €)** 1.73 3.33 52
* Net profit/Average number of shares issued in the period, exclusive of treasury shares ** All issued shares are ordinary registered shares, therefore the diluted EPS equals the basic EPS.
Statement of other comprehensive income of Krka, d. d., Novo mesto
In € thousand 1–6/2016 1–6/2015 Index
Net profit 56,226 108,473 52
Other comprehensive income for the period Other comprehensive income reclassified to profit or loss in future periods
Change in fair value of available-for-sale financial assets 319 259 123
Deferred tax effect -55 -44 125 Net other comprehensive income reclassified to profit or loss in future periods
264 215 123
Total other comprehensive income for the period (net of tax) 264 215 123
Total comprehensive income for the period (net of tax) 56,490 108,688 52
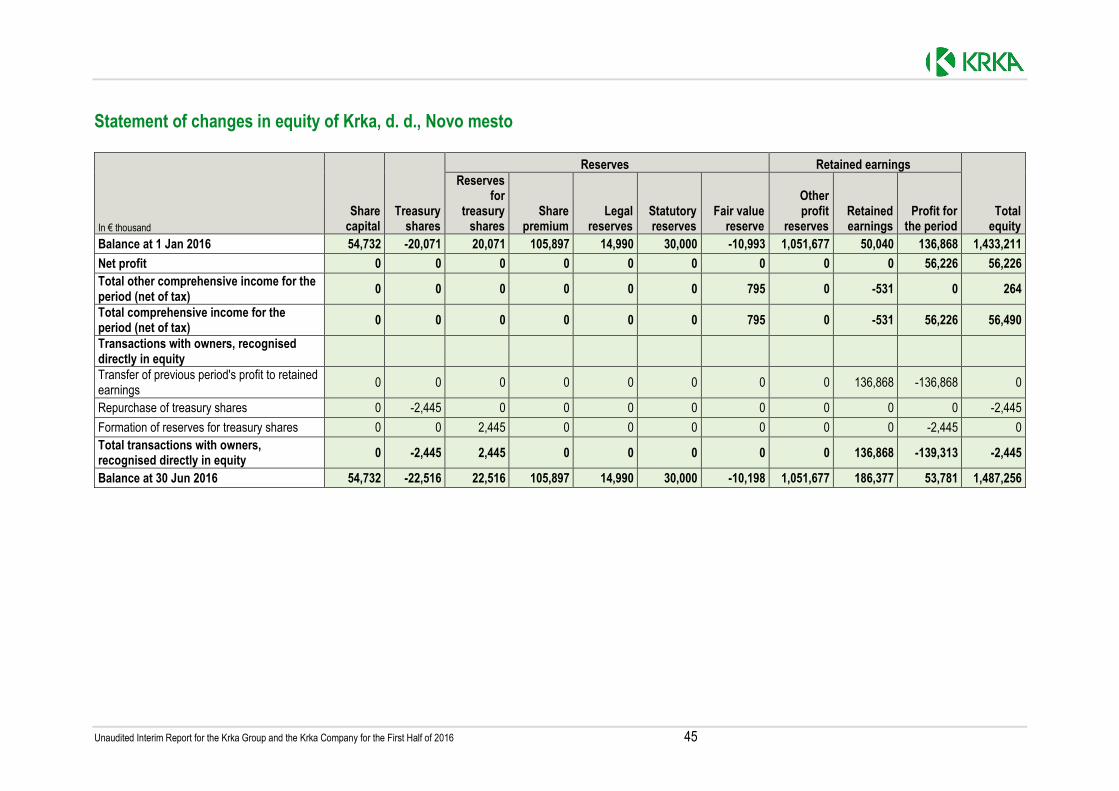
Unaudited Interim Report for the Krka Group and the Krka Company for the First Half of 2016 45
Statement of changes in equity of Krka, d. d., Novo mesto
In € thousand
Share capital
Treasury shares
Reserves Retained earnings
Total equity
Reserves for
treasury shares
Share premium
Legal reserves
Statutory reserves
Fair value reserve
Other profit
reserves Retained earnings
Profit for the period
Balance at 1 Jan 2016 54,732 -20,071 20,071 105,897 14,990 30,000 -10,993 1,051,677 50,040 136,868 1,433,211
Net profit 0 0 0 0 0 0 0 0 0 56,226 56,226
Total other comprehensive income for the period (net of tax)
0 0 0 0 0 0 795 0 -531 0 264
Total comprehensive income for the period (net of tax)
0 0 0 0 0 0 795 0 -531 56,226 56,490
Transactions with owners, recognised directly in equity
Transfer of previous period's profit to retained earnings
0 0 0 0 0 0 0 0 136,868 -136,868 0
Repurchase of treasury shares 0 -2,445 0 0 0 0 0 0 0 0 -2,445
Formation of reserves for treasury shares 0 0 2,445 0 0 0 0 0 0 -2,445 0 Total transactions with owners, recognised directly in equity
0 -2,445 2,445 0 0 0 0 0 136,868 -139,313 -2,445
Balance at 30 Jun 2016 54,732 -22,516 22,516 105,897 14,990 30,000 -10,198 1,051,677 186,377 53,781 1,487,256

46 Unaudited Interim Report for the Krka Group and the Krka Company for the First Half of 2016
In € thousand
Share capital
Treasury shares
Reserves Retained earnings
Total equity
Reserves for
treasury shares
Share premium
Legal reserves
Statutory reserves
Fair value reserve
Other profit
reserves Retained earnings
Profit for the period
Balance at 1 Jan 2015 54,732 -10,677 10,677 105,897 14,990 30,000 -7,431 1,001,636 55,244 126,245 1,381,313
Net profit 0 0 0 0 0 0 0 0 0 108,473 108,473
Total other comprehensive income for the period (net of tax)
0 0 0 0 0 0 215 0 0 0 215
Total comprehensive income for the period (net of tax)
0 0 0 0 0 0 215 0 0 108,473 108,688
Transactions with owners, recognised directly in equity
Transfer of previous period's profit to retained earnings
0 0 0 0 0 0 0 0 126,245 -126,245 0
Repurchase of treasury shares 0 -3,456 0 0 0 0 0 0 0 0 -3,456
Formation of reserves for treasury shares 0 0 3,456 0 0 0 0 0 0 -3,456 0 Total transactions with owners, recognised directly in equity
0 -3,456 3,456 0 0 0 0 0 126,245 -129,701 -3,456
Balance at 30 Jun 2015 54,732 -14,133 14,133 105,897 14,990 30,000 -7,216 1,001,636 181,489 105,017 1,486,545
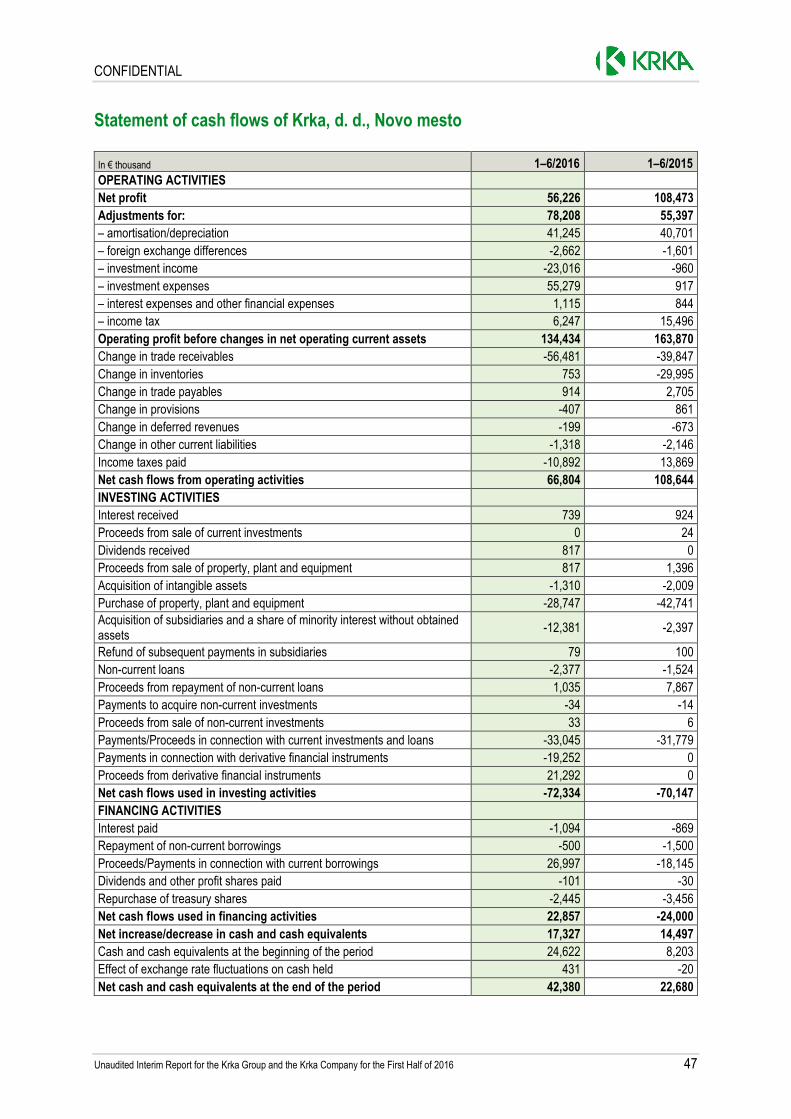
CONFIDENTIAL
Unaudited Interim Report for the Krka Group and the Krka Company for the First Half of 2016 47
Statement of cash flows of Krka, d. d., Novo mesto In € thousand 1–6/2016 1–6/2015
OPERATING ACTIVITIES
Net profit 56,226 108,473
Adjustments for: 78,208 55,397
– amortisation/depreciation 41,245 40,701 – foreign exchange differences -2,662 -1,601 – investment income -23,016 -960 – investment expenses 55,279 917 – interest expenses and other financial expenses 1,115 844 – income tax 6,247 15,496 Operating profit before changes in net operating current assets 134,434 163,870
Change in trade receivables -56,481 -39,847 Change in inventories 753 -29,995 Change in trade payables 914 2,705 Change in provisions -407 861 Change in deferred revenues -199 -673 Change in other current liabilities -1,318 -2,146 Income taxes paid -10,892 13,869 Net cash flows from operating activities 66,804 108,644
INVESTING ACTIVITIES Interest received 739 924 Proceeds from sale of current investments 0 24 Dividends received 817 0 Proceeds from sale of property, plant and equipment 817 1,396 Acquisition of intangible assets -1,310 -2,009 Purchase of property, plant and equipment -28,747 -42,741 Acquisition of subsidiaries and a share of minority interest without obtained assets
-12,381 -2,397
Refund of subsequent payments in subsidiaries 79 100 Non-current loans -2,377 -1,524 Proceeds from repayment of non-current loans 1,035 7,867 Payments to acquire non-current investments -34 -14 Proceeds from sale of non-current investments 33 6 Payments/Proceeds in connection with current investments and loans -33,045 -31,779 Payments in connection with derivative financial instruments -19,252 0 Proceeds from derivative financial instruments 21,292 0 Net cash flows used in investing activities -72,334 -70,147
FINANCING ACTIVITIES Interest paid -1,094 -869 Repayment of non-current borrowings -500 -1,500 Proceeds/Payments in connection with current borrowings 26,997 -18,145 Dividends and other profit shares paid -101 -30 Repurchase of treasury shares -2,445 -3,456 Net cash flows used in financing activities 22,857 -24,000
Net increase/decrease in cash and cash equivalents 17,327 14,497
Cash and cash equivalents at the beginning of the period 24,622 8,203 Effect of exchange rate fluctuations on cash held 431 -20 Net cash and cash equivalents at the end of the period 42,380 22,680
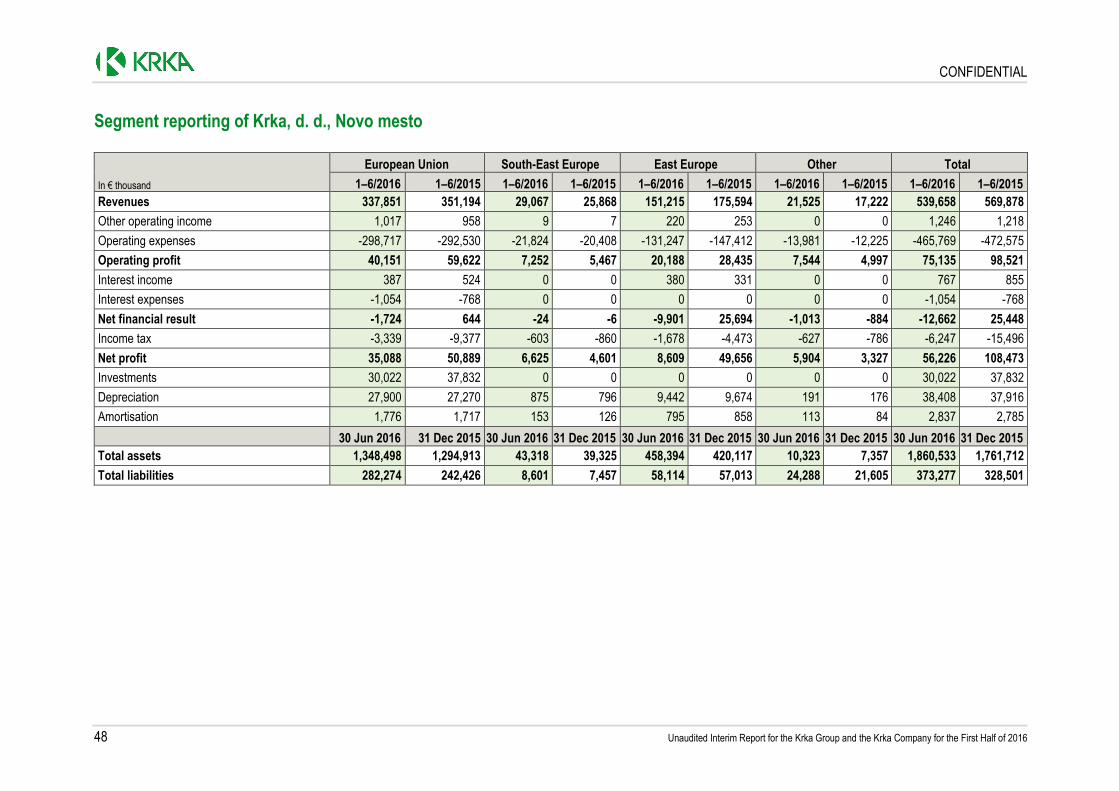
CONFIDENTIAL
48 Unaudited Interim Report for the Krka Group and the Krka Company for the First Half of 2016
Segment reporting of Krka, d. d., Novo mesto
In € thousand
European Union South-East Europe East Europe Other Total
1–6/2016 1–6/2015 1–6/2016 1–6/2015 1–6/2016 1–6/2015 1–6/2016 1–6/2015 1–6/2016 1–6/2015
Revenues 337,851 351,194 29,067 25,868 151,215 175,594 21,525 17,222 539,658 569,878
Other operating income 1,017 958 9 7 220 253 0 0 1,246 1,218
Operating expenses -298,717 -292,530 -21,824 -20,408 -131,247 -147,412 -13,981 -12,225 -465,769 -472,575
Operating profit 40,151 59,622 7,252 5,467 20,188 28,435 7,544 4,997 75,135 98,521
Interest income 387 524 0 0 380 331 0 0 767 855
Interest expenses -1,054 -768 0 0 0 0 0 0 -1,054 -768
Net financial result -1,724 644 -24 -6 -9,901 25,694 -1,013 -884 -12,662 25,448
Income tax -3,339 -9,377 -603 -860 -1,678 -4,473 -627 -786 -6,247 -15,496
Net profit 35,088 50,889 6,625 4,601 8,609 49,656 5,904 3,327 56,226 108,473
Investments 30,022 37,832 0 0 0 0 0 0 30,022 37,832
Depreciation 27,900 27,270 875 796 9,442 9,674 191 176 38,408 37,916
Amortisation 1,776 1,717 153 126 795 858 113 84 2,837 2,785
30 Jun 2016 31 Dec 2015 30 Jun 2016 31 Dec 2015 30 Jun 2016 31 Dec 2015 30 Jun 2016 31 Dec 2015 30 Jun 2016 31 Dec 2015
Total assets 1,348,498 1,294,913 43,318 39,325 458,394 420,117 10,323 7,357 1,860,533 1,761,712
Total liabilities 282,274 242,426 8,601 7,457 58,114 57,013 24,288 21,605 373,277 328,501

Unaudited Interim Report for the Krka Group and the Krka Company for the First Half of 2016 49
Notes to the financial statements of Krka, d. d., Novo mesto Costs by nature €465,769 thousand In € thousand 1–6/2016 1–6/2015 Index
Costs of goods and material 161,581 187,782 86
Costs of services 155,316 154,871 100
Employee benefit costs 99,976 98,761 101
Amortisation and depreciation 41,245 40,701 101
Inventory write-offs and allowances 3,321 2,562 130
Receivables impairment and write-offs 1,367 3,852 35
Other operating expenses 11,725 13,267 88
Total costs 474,531 501,796 95
Change in the value of inventories of products and work in progress
-8,762 -29,221 30
Total 465,769 472,575 99
Employee benefit costs €99,976 thousand
In € thousand 1–6/2016 1–6/2015 Index
Gross wages and salaries and continued pay 76,858 76,001 101
Social security contributions 5,370 4,750 113
Pension insurance contributions 9,742 8,798 111 Post-employment benefits and other non-current employee benefits
0 861 0
Other employee benefit costs 8,006 8,351 96
Total employee benefit costs 99,976 98,761 101
Other operating expenses €11,725 thousand In € thousand 1–6/2016 1–6/2015 Index
Grants and assistance for humanitarian and other purposes 653 652 100
Environmental protection expenses 1,032 1,034 100
Other taxes and levies 7,331 9,411 78 Loss on sale of property, plant and equipment and intangible assets
110 858 13
Other expenses 2,599 1,312 198
Total other operating expenses 11,725 13,267 88
Other taxes and levies include taxes (claw-back and similar) that have been imposed in several markets of Krka Group operations in recent periods.

50 Unaudited Interim Report for the Krka Group and the Krka Company for the First Half of 2016
Financial income and expenses In € thousand 1–6/2016 1–6/2015 Index
Net foreign exchange differences 20,739 25,472 81
Interest income 767 855 90
Change in fair value of investments through profit or loss 6 0
Proceeds from sale of investments 0 24 0
Derivatives income 21,292 0
– income 21,292 0
Income from dividends and other shares of the profit 817 0
– dividends 817 0
Total financial income 43,621 26,351 166
Interest expenses -1,054 -768 137
Change in fair value of investments through profit or loss -11 -59 19
Derivatives expenses -55,157 0
– expenses -19,251 0
– change in fair value -35,906 0
Other financial expenses -61 -76 80
Total financial expenses -56,283 -903 6,233
Net financial result -12,662 25,448
Income tax €6,247 thousand Current income tax amounts to €6,132 thousand, which is 9.8% of pre-tax profit. Together with the deferred tax of €115 thousand, the total income tax expense in the income statement amounts to
€6,247 thousand. The effective tax rate is 10.0%, down 2.5 of a percentage point from the same period last year.
Property, plant and equipment €599,529 thousand
In € thousand 30 Jun 2016 31 Dec 2015 Index
Land 22,934 22,826 100
Buildings 266,225 275,657 97
Equipment 281,684 295,893 95
Property, plant and equipment being acquired 28,686 15,691 183
Total property, plant and equipment 599,529 610,067 98
The value of property, plant and equipment represents just over 32% of the Company's total
assets. Krka’s major investments are described in the chapter Investments in the Business Report.
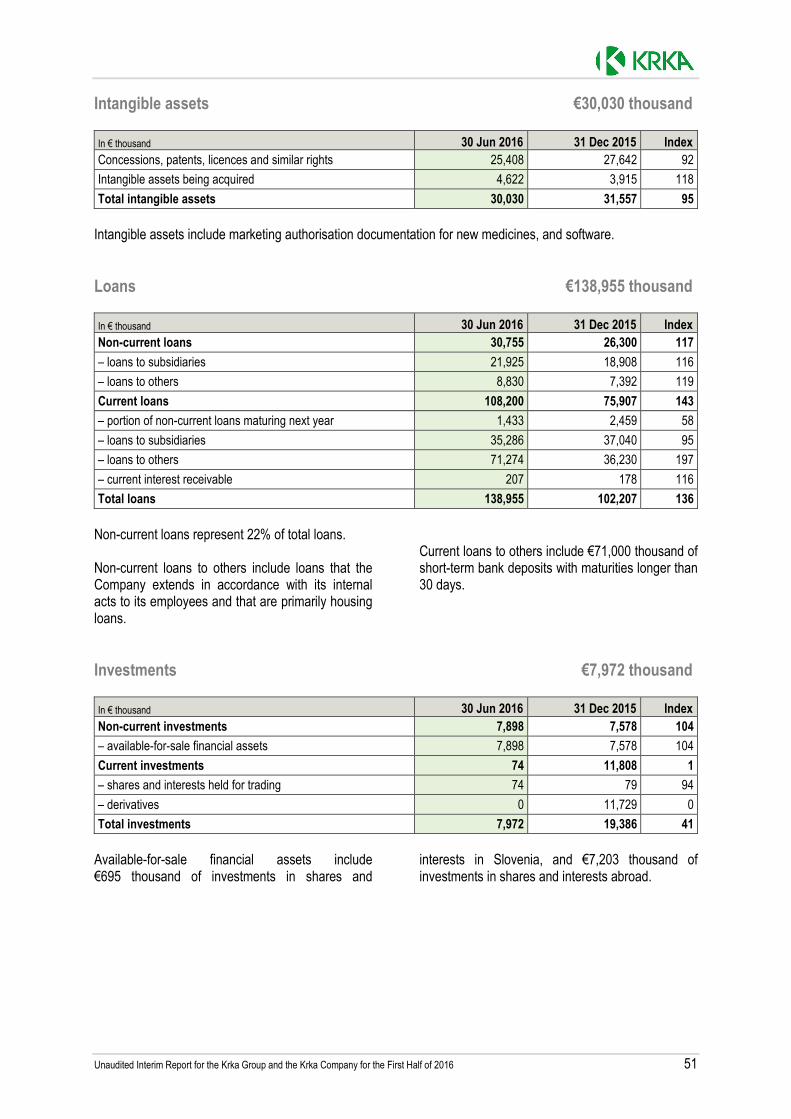
Unaudited Interim Report for the Krka Group and the Krka Company for the First Half of 2016 51
Intangible assets €30,030 thousand In € thousand 30 Jun 2016 31 Dec 2015 Index
Concessions, patents, licences and similar rights 25,408 27,642 92
Intangible assets being acquired 4,622 3,915 118
Total intangible assets 30,030 31,557 95
Intangible assets include marketing authorisation documentation for new medicines, and software. Loans €138,955 thousand In € thousand 30 Jun 2016 31 Dec 2015 Index
Non-current loans 30,755 26,300 117
– loans to subsidiaries 21,925 18,908 116
– loans to others 8,830 7,392 119
Current loans 108,200 75,907 143
– portion of non-current loans maturing next year 1,433 2,459 58
– loans to subsidiaries 35,286 37,040 95
– loans to others 71,274 36,230 197
– current interest receivable 207 178 116
Total loans 138,955 102,207 136
Non-current loans represent 22% of total loans. Non-current loans to others include loans that the Company extends in accordance with its internal acts to its employees and that are primarily housing loans.
Current loans to others include €71,000 thousand of short-term bank deposits with maturities longer than 30 days.
Investments €7,972 thousand
In € thousand 30 Jun 2016 31 Dec 2015 Index
Non-current investments 7,898 7,578 104
– available-for-sale financial assets 7,898 7,578 104
Current investments 74 11,808 1
– shares and interests held for trading 74 79 94
– derivatives 0 11,729 0
Total investments 7,972 19,386 41
Available-for-sale financial assets include €695 thousand of investments in shares and
interests in Slovenia, and €7,203 thousand of investments in shares and interests abroad.

52 Unaudited Interim Report for the Krka Group and the Krka Company for the First Half of 2016
Inventories €229,815 thousand In € thousand 30 Jun 2016 31 Dec 2015 Index
Material 98,088 103,895 94
Work in progress 62,452 61,941 101
Products 60,282 54,934 110
Merchandise 8,288 9,172 90
Inventory advances 705 626 113
Total inventories 229,815 230,568 100
Trade and other receivables €460,861 thousand In € thousand 30 Jun 2016 31 Dec 2015 Index
Current trade receivables 437,500 402,189 109
– current receivables due from subsidiaries 236,305 217,352 109 – current receivables due from customers other than Group companies
201,195 184,837 109
Other current receivables 23,361 16,602 141
Total receivables 460,861 418,791 110
Cash and cash equivalents €42,380 thousand In € thousand 30 Jun 2016 31 Dec 2015 Index
Cash in hand 4 1 400
Bank balances 42,376 24,621 172
Total cash and cash equivalents 42,380 24,622 172
Equity €1,487,256 thousand In € thousand 30 Jun 2016 31 Dec 2015 Index
Share capital 54,732 54,732 100
Treasury shares -22,516 -20,071 112
Reserves: 163,205 159,965 102
– reserves for treasury shares 22,516 20,071 112
– share premium 105,897 105,897 100
– legal reserves 14,990 14,990 100
– statutory reserves 30,000 30,000 100
– fair value reserve -10,198 -10,993 93
Retained earnings 1,291,835 1,238,585 104
Total equity 1,487,256 1,433,211 104
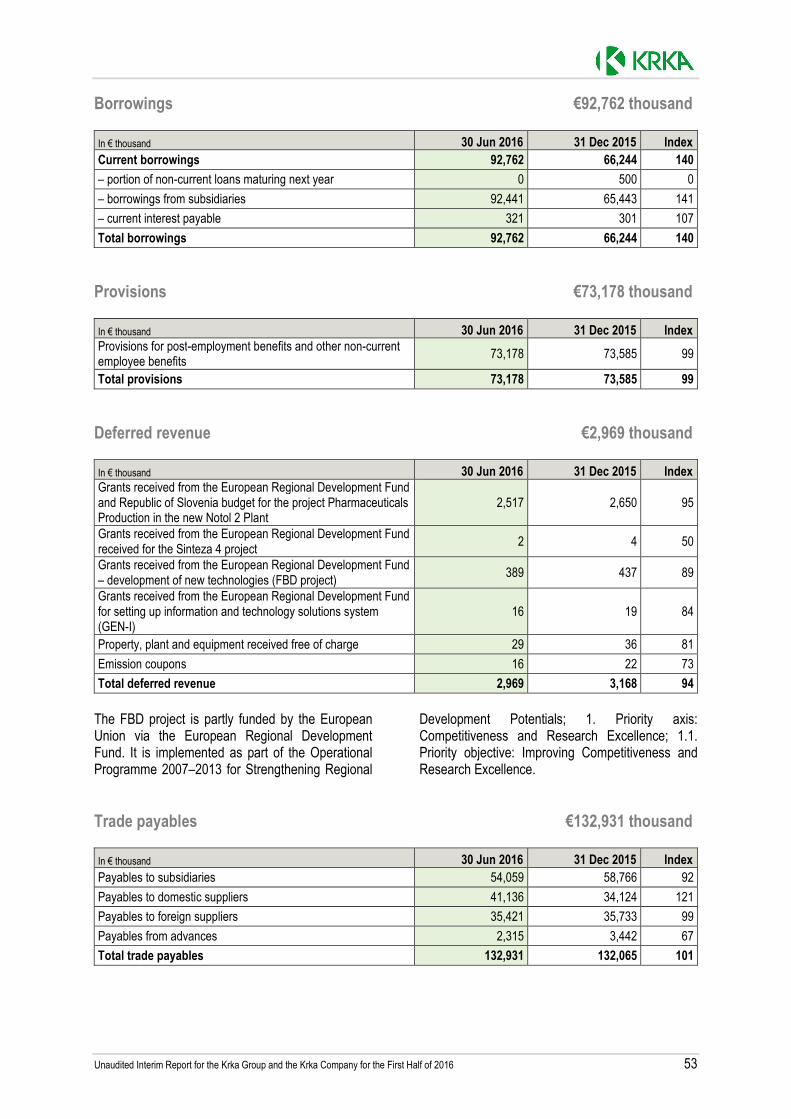
Unaudited Interim Report for the Krka Group and the Krka Company for the First Half of 2016 53
Borrowings €92,762 thousand In € thousand 30 Jun 2016 31 Dec 2015 Index
Current borrowings 92,762 66,244 140
– portion of non-current loans maturing next year 0 500 0
– borrowings from subsidiaries 92,441 65,443 141
– current interest payable 321 301 107
Total borrowings 92,762 66,244 140
Provisions €73,178 thousand In € thousand 30 Jun 2016 31 Dec 2015 Index
Provisions for post-employment benefits and other non-current employee benefits
73,178 73,585 99
Total provisions 73,178 73,585 99
Deferred revenue €2,969 thousand In € thousand 30 Jun 2016 31 Dec 2015 Index
Grants received from the European Regional Development Fund and Republic of Slovenia budget for the project Pharmaceuticals Production in the new Notol 2 Plant
2,517 2,650 95
Grants received from the European Regional Development Fund received for the Sinteza 4 project
2 4 50
Grants received from the European Regional Development Fund – development of new technologies (FBD project)
389 437 89
Grants received from the European Regional Development Fund for setting up information and technology solutions system (GEN-I)
16 19 84
Property, plant and equipment received free of charge 29 36 81
Emission coupons 16 22 73
Total deferred revenue 2,969 3,168 94
The FBD project is partly funded by the European Union via the European Regional Development Fund. It is implemented as part of the Operational Programme 2007–2013 for Strengthening Regional
Development Potentials; 1. Priority axis: Competitiveness and Research Excellence; 1.1. Priority objective: Improving Competitiveness and Research Excellence.
Trade payables €132,931 thousand In € thousand 30 Jun 2016 31 Dec 2015 Index
Payables to subsidiaries 54,059 58,766 92
Payables to domestic suppliers 41,136 34,124 121
Payables to foreign suppliers 35,421 35,733 99
Payables from advances 2,315 3,442 67
Total trade payables 132,931 132,065 101

54 Unaudited Interim Report for the Krka Group and the Krka Company for the First Half of 2016
Other current liabilities €68,687 thousand In € thousand 30 Jun 2016 31 Dec 2015 Index
Accrued contractual discounts on products sold 12,985 12,985 100 Payables to employees – gross wages, other receipts and charges
26,019 26,185 99
Derivatives 24,176 0
Other 5,507 6,760 81
Total other current liabilities 68,687 45,930 150
Contingent liabilities €15,652 thousand In € thousand 30 Jun 2016 31 Dec 2015 Index
Guarantees issued 15,032 21,306 71
Other 620 620 100
Total contingent liabilities 15,652 21,926 71
Unaudited Interim Report for the Krka Group and the Krka Company for the First Half of 2016 55
MANAGEMENT BOARD STATEMENT OF RESPONSIBILITIES
The Management Board of Krka, d. d., Novo mesto hereby states that the condensed financial statements of the Krka Company and the condensed consolidated financial statements of the Krka Group for the six months ended 30 June 2016 were drawn up so as to provide a true and fair view of the financial standing and operating results of the Krka Company and the Krka Group. The condensed statements for the period January–June 2016 were drawn up using the same accounting principles as for the annual financial statements of the Krka Company and Group for 2015. The condensed interim financial statements for the six months ended 30 June 2016 were drawn up pursuant to IAS 34 – Interim Financial Reporting,
and must be read in conjunction with the annual financial statements drawn up for the business year ended 31 December 2015. The Management Board is responsible for implementing measures to maintain the value of the Krka Company and Krka Group assets, and to prevent and detect frauds or other forms of misconduct. The Management Board states that all transactions between subsidiaries in the Krka Group were executed on the basis of purchase contracts, using market prices for products and services. There were not any significant transactions with other related parties.
Novo mesto, 18 July 2016
Jože Colarič,
President of the Management Board and Chief Executive
Dr Aleš Rotar,
Member of the Management Board
Dr Vinko Zupančič,
Member of the Management Board
David Bratož,
Member of the Management Board
Milena Kastelic,
Member of the Management Board – Worker Director