Embed Size (px)
Citation preview
First Financial Restructuring and Operating Efficiency:
Evidence from Taiwan Commercial Banks
Hsihui Chang Drexel University [email protected]
Anna M. Cianci
Drexel University
Hsing-Chin Hsiao National Taipei College of Business
Li-Hua Huang
National Taipei College of Business
Abstract
This paper investigates the effect of the “First Financial Restructuring” (FFR) on the operating efficiency of commercial banks in Taiwan. Applying data envelopment analysis (DEA) to operations data for 40 commercial banks over the five year period 2000-2004, we find that while the banks had lower operating efficiency on average during the reform period (2002-2003) compared to the pre-reform period (2000-2001), improved operating efficiency was reflected in the post-reform period (2004). Our results remain unchanged even after controlling for the nonperforming loan ratio, capital adequacy ratio, bank ownership and size. Overall, our results indicate that the improved efficiency in the post-reform period was possibly due to the reduction of nonperforming loans rather than the boosting of capital adequacy in the reform period.
Keywords: First Financial Restructuring (FFR); Commercial banks; Taiwan; Operating efficiency; Data envelopment analysis (DEA)
1. Introduction
The banking systems of many developing economies have exhibited poor performance,
perhaps due, in part, to excessive government regulations. To address this problem, various
financial liberalizations, reforms and restructuring programs have been implemented in an effort
to foster banking efficiency and a better allocation of resources (Isik and Hassan, 2003).1 The
impact of these measures on bank efficiency has been widely studied with approximately 95% of
this research focusing on banks of industrialized countries, especially the US (e.g., Berger and
Mester, 2003; Sturm and Williams, 2004). However, only a limited number of these studies
have examined the impact of deregulation and liberalization programs on developing economies
(e.g., Kwan, 2003; Williams and Nguyen, 2005; see Berger and Humphrey, 1997, for a review).
Overall, the effects of these regulatory efforts have been mixed (e.g., Kumbhakar and Sarkar,
2003; Altunbas et al., 2000; Yildirim and Philippatos, 2007).
The current study addresses the scant research on developing economies by examining
whether a Taiwan government regulatory banking reform – the so-called “First Financial
Restructuring” (FFR hereafter) – accomplished its mission to improve the operating efficiency of
the banking sector. Taiwan banking had been severely impacted by various political and
environmental factors including threats from the military exercises of Mainland China conducted
in 1995; the East Asian financial crisis beginning in Thailand in 1997; and local financial scandal
tornados derived from massive nonperforming loans in 1998. In an effort to avert a possible
financial crisis and to establish a sound banking system, the regulatory authorities issued various
1 A better resource allocation will benefit society by leading to greater and more appropriate innovations, improved profitability, greater amounts of funds intermediated, better prices and service quality for consumers, and greater safety and soundness in the financial system.
1
reforms, regulations, and restructuring programs, including the FFR2 (Konishi and Yasuda, 2004).
This reform required the nonperforming loan ratio of financial institutions to be below 5% and
the capital adequacy ratio to be at least 8% by 2003 (i.e., within 2 years of the regulation being
passed by Congress in 2002). Prior research has emphasized the importance of these ratios to
accounting and regulatory consequences (e.g., Anandarajan et al., 2005; Moyer, 1990) and
documented their relation to efficiency (e.g., Niswander and Swanson, 2000; Das and Ghosh
2006).
We use data envelopment analysis (DEA), a non-parametric approach, to analyze the
extent of change in operating efficiency in the Taiwan banking sector following FFR. We
examine banking data for the five year period 2000-2004 for a sample of 40 commercial banks in
Taiwan. Our results indicate that banks had lower operating efficiency during the FFR reform
period (2002-2003) compared to the pre-reform period (2000-2001), but had higher operating
efficiency in the post-reform period (2004). Further, our results indicate that while banks with
a higher capital adequacy ratio had higher operating efficiency, banks with a higher
nonperforming loan ratio during the reform period had lower operating efficiency. These
results suggest that the FFR led to improved operating efficiency in the banking sector in the
post-reform period, possibly due to the reduction of nonperforming loans rather than the boosting
of capital adequacy during the FFR reform period.
Our study contributes to the literature in at least three ways. First, our study provides
evidence of the efficiency change of the banking industry in Taiwan in response to the FFR. The
ability of banks to allocate funds as efficiently as possible to finance productive investment and
consumption expenditures is crucial in producing a high and sustainable rate of economic growth.
2 Measures adopted by the Taiwan government include: deregulation of interest rates and foreign exchange rates restrictions, liberalization of the establishment of new banks and foreign entry, enlargement of the business scope of financial institutions, and internationalization of financial market operations.
2
Evaluating how the FFR affects efficiency will provide insight for bank management seeking to
improve operating performance and policymakers considering financial reforms. Second, our
study provides additional empirical evidence on the impact of reforms on bank efficiency outside
the United States. While financial reform and liberalization policies may be effective for
developed economies, such policies may not bring optimal outcomes for developing countries
where markets and institutional structures are different from those of developed countries.
Therefore, it is important to examine the effects of government regulations on bank efficiency in
developing countries (Isik and Hassan, 2003). Third, the current study provides evidence of the
impact of reforms before, during and after the financial restructuring. Most prior studies
examining the effects of reforms investigate the efficiency after or during the deregulation period
without covering the period before the liberalization or deregulation programs (Denizer et al.,
2007). Extending the evaluation to before and after deregulation may be important in
determining future bank performance (Berger and Humphrey, 1997) and the real impact of
liberalization programs on efficiency (Harker and Zenios, 2000).
The remainder of this paper is organized as follows. In section 2, we briefly review
studies related to financial reforms of banking and discuss the impact of nonperforming loans
and capital adequacy on operating efficiency to motivate our research hypotheses. In section 3,
we describe our research methodology including data and sample as well as the DEA model used
to estimate bank operating efficiency. In section 4, we present and discuss our empirical results.
Finally, conclusions and implications of our findings are discussed and directions for future
research are offered in section 5.
2. Literature review and hypotheses development
3
2.1 The impact of financial reform on banking operating efficiency
Efficiency represents the ability of management to control costs and use resources
available to produce output. Although a primary goal of deregulation is to improve efficiency,
numerous studies examining the impact of financial reforms on banking performance and
efficiency provide mixed results. 3 Some studies suggest that financial reform improves
efficiency. For instance, Norwegian and Turkish banks experienced improved efficiency after
deregulation (Berg et al., 1992; Zaim, 1995, respectively). In addition, Kumbhakar and Sarkar
(2003) analyzed the relationship between deregulation and performance improvement using data
from the Indian banking industry over a 12-year period from 1985 to 1996. They found that the
performance of private, but not public, banks improved in response to deregulation measures.
Recently, Das and Ghosh (2006) used DEA to evaluate the efficiency of Indian commercial
banks during the post reform period of 1992-2002. They found that medium-sized public banks
performed reasonably well and efficiency improved.
In contrast, other studies find that financial reform has no efficiency effect or leads to a
decline in operating efficiency. For instance, banking efficiency in the US was relatively
unchanged by deregulation (Bauer et al., 1993; Elyasiani and Mehdian, 1995). Halkos and
Salamouris (2004) employed DEA to examine the performance of the Greek banking sector
during 1997-1999, a period of various financial reforms.4 They found a decrease in average
efficiency level in 1988, followed by a significant increase and maximum attained performance
in 1999. Similarly, Fukuyama and Weber (2002) found that the efficiency of Japanese banks
during 1992-1996 declined and Park and Weber (2006) found declines in efficiency for Korean
3 See Berger and Humphrey (1997) for a discussion of the possible explanations for this mixed evidence and Berger (2004) for a detailed review of banking efficiency studies. 4 Such reforms included the liberalization of interest rate determination; the abolition of various credit rules; the free movement of capital; and the increased competition from banks of the European Union.
4
banks during 1992-2002.
2.2 The impact of the FFR on banking operating efficiency
In this study, we examine the operating efficiency of the banking sector during the
pre-reform (2000-2001), reform (2002-2003), and post-reform (2004) periods of the FFR in
Taiwan. Recall that this reform required banks to have a minimum capital adequacy ratio of
8% and a maximum nonperforming loan ratio of 5% by the end of 2003.5 If a bank complies
with these two criteria of the FFR, then it enjoys several benefits including improved bank
efficiency through entry deregulation, branch de-licensing, and deregulation of interest rates.
Penalties would be imposed on banks not complying with these requirements. For instance, by
the end of 2003, if the nonperforming loan ratio was over 5%, the addition of new domestic and
international branches would be prohibited, as well as applications for converting a general
branch to a combo branch. If the ratio is over 15%, the banks would be required to simplify
their branches, which would decrease the market share, increase operating costs, and lower
operating profit.
2.2.1 Nonperforming loans and banking operating efficiency
According to Berger and DeYoung (1997), in order to reduce nonperforming loans, banks
incur more costs associated with performing additional operating activities including: (a)
additional monitoring of outstanding accounts receivable, delinquent borrowers and the value of
their collateral; (b) analyzing and negotiating possible workout arrangements; (c) seizing,
maintaining, and eventually disposing of collateral; (d) defending the bank’s safety and
5 In Taiwan, the principal government agencies responsible for the supervision of financial institutions are the Central Bank of China, the Ministry of Finance, and the Central Deposit Insurance Corporation. These three bank regulators use the CAMELS rating system, which consists of six categories – Capital adequacy, Asset quality, Management, Earnings, Liquidity, and Sensitivity to market risk – to evaluate the banks in Taiwan (Kao and Liu, 2004). This system relies on various financial ratios obtained from periodic reports of the entities under their jurisdiction. Nonperforming loan and capital adequacy ratios are two such performance indicators relevant to banking performance.
5
soundness record to bank supervisors and market participants; (e) taking additional precautions
to preserve the high quality of loans; (f) writing-off nonperforming loans to bad debt expense;6
and (g) managing financial risk. The increase in operating expenses from reducing bad debt
will offset revenues and negatively impact banking operating efficiency. Thus, nonperforming
loans may lead to lower efficiency because of the increased expenses associated with the
managing nonperforming loans (i.e., monitoring, negotiating workout arrangements, seizing and
disposing of collateral, and diverting senior management focus).
Consistent with this notion, prior research has documented a negative relation between
nonperforming loans and efficiency. For instance, Berger and DeYoung (1997) found that prior
to failure, failing banks have a large proportion of nonperforming loans, suggesting weak balance
sheet conditions, poor quality of loan assets, and bank fragility. Using bank data from 1996 to
2001, Das (2002) found that higher nonperforming loans lead to lower efficiency. In addition,
Das and Ghosh (2006) found that increases in nonperforming loans tend to be followed by
decreases in efficiency, suggesting that high levels of sticky loans cause banks to increase
spending on monitoring, administering and/or selling off these loans, and possibly become more
diligent in administering the portion of their existing loan portfolio that is currently performing.
Furthermore, Berger and Mester (2003) found that lower nonperforming loans improved
operating efficiency over time in that the costs required to deal with problem loans decreased as
the amount of outstanding loans declined. Finally, examining Japanese commercial banks
between 1993 and 1996, Altunbas, Liu, Molyneux, and Seth (2000) found that the level of
nonperforming loans is positively related to bank inefficiency.
2.2.2 Capital adequacy and banking operating efficiency
6 According to the Ministry of Finance, write-offs of bad debts were quite high, totaling approximately $974 billion New Taiwan Dollars between 2000 and 2003.
6
Regarding the capital adequacy requirement, an important aspect of efficiency
measurement is the treatment of financial capital. A bank’s insolvency risk depends on its
financial capital available to absorb portfolio losses and risks. Insolvency risk affects bank costs
and profits via the risk premium the bank must pay for uninsured debt, and through the intensity
of risk management activities the bank undertakes. For this reason, the financial capital of the
bank should be considered when studying changes in efficiency.
The FFR imposed a minimum level of 8% capital adequacy in an effort to stabilize the
financial system (Rime, 2001) and to prevent losses (Barth, Caprio and Levine, 2004). The
increased emphasis on capital adequacy necessitates changes in the internal functioning of banks,
especially in the systems of credit evaluation, risk assessment and management and the quality of
human resources, internal control, and corporate governance. Such changes are expected to lead
to financial soundness that reduces uncertainties and systemic risk, thereby contributing to
improved efficiency. With adequate capital, a bank can pursue profitable opportunities, take
intelligent risks, or expand operations. Without adequate capital, banks are constrained to hold
large amounts of less risky government securities instead of making potentially more profitable
commercial loans and are less able to make desirable investments that can enhance their
efficiency. Thus, capital adequacy should have a positive impact on efficiency.
Supporting the rationale for the capital adequacy requirement, Das and Ghosh (2006)
documented a positive relationship between banking efficiency and capital adequacy. This results
is consistent with the notion that well-capitalized banks are perceived to be relatively safe and
have better credit risk management practices, which in turn lowers their cost of borrowing,
leading to enhanced efficiency. In addition, Niswander and Swanson (2000) found that banks
with substandard or marginal capital adequacy ratios have higher operating costs.
7
Failure to comply with this capital adequacy requirement of the FFR may result in costly
penalties, which may impair efficiency. Specifically, for banks with substandard or marginal
capital ratios, regulators can impose costly restrictions including disapproving the establishment
of a new branch, merger, project or change in ownership or control and requiring changes to
financial statement data or higher minimum capital requirements than other banks (Code of
Federal Regulations, 1990, paras. 3.10, 325.3, and 325.4). In addition, banks that are close to
their capital constraints come under increased regulatory scrutiny (Thomson, 1991), thereby
reducing bank managers’ flexibility in using accounting or financing discretion, since available
options would then be influenced by the preferences of auditors and regulators.
2.3 Research hypotheses
Given the response to the nonperforming loan requirement of the FFR, we hypothesize
that operating efficiency during the reform period (2002-2003) of the FFR will be significantly
worse than the pre-reform period (2000-2001). However, in the post-reform period (2004), we
argue that with the reduction of bad debts resulting from compliance with the nonperforming
loan requirement of the FFR, the bank’s asset quality will improve and financial risk will
decrease. In addition, as discussed above, prior research has documented a positive relation
between the capital adequacy ratio and operating efficiency. Given these two effects, we
hypothesize that bank operating efficiency will ultimately improve in the post-reform period
compared to reform period. Based on the above discussion, we state our two research
hypotheses (all in alternate forms) as follows:
H1: Bank operating efficiency drops during the reform period of the FFR.
H2: Bank operating efficiency improves in the post-reform period compared to the reform
period of the FFR.
8
3. Methodology
3.1 Data and sample
The sample of commercial banks that is included in this study is derived from the Taiwan
Economic Journal (TEJ) database, the Central Bank of Taiwan, the Taiwanese Economic and
Regulation Commission, and related resources. We began with an original sample of 52 banks
but eliminated four due to exceptional business types, six due to incomplete data, and two due to
merger and acquisition depletion banks. Our final sample consists of 40 commercial banks In
Taiwan. Our research period was from 2000 to 2004, including two years before and one year
after the FFR program of 2002-2003.7
3.2 Data Envelopment Analysis and its test statistics
Performance evaluation and benchmarking have become important continuous
assessment and improvement tools for banks in a business environment facing global
competition (Cook et al., 2004). Contrary to the incompleteness of a single performance
evaluation measure, benchmarking models integrate multiple performance measures. One such
model is Data Envelopment Analysis (DEA), a linear programming technique introduced by
Charnes et al. (1978) and extended by Banker et al. (1984). DEA has been proven to be an
effective tool for evaluating the relative efficiency of peer decision making units (DMUs) when
multiple performance measures are present (Banker et al., 1989; Mensah and Li, 1993; Sherman
and Zhu, 2005). In addition, it has been used to evaluate banking operating efficiency in
response to financial reform (Cook et al., 2004; Das and Ghosh, 2006; Park and Weber, 2006).
7 We examine only one year (2004) after the FFR because the second phase of the reform began in 2005 and would therefore confound our results. The purpose of this second phase is to promote consolidations by revising outdated regulations to be consistent with international norms, implementing supervisory measures to encourage well-performing financial institutions, and offering incentives for consolidation (Executive Yuan, 2006).
9
Efficiency can be measured as the minimal consumption of inputs for a given level of
output or the maximal augmentation of outputs for a given level of inputs. In general, banks
anticipate demand and invest in inputs necessary to support the expected level of demand.
Since it is hard for them to adjust input levels once they are committed, we adopt an
output-based efficiency measure by assuming that banks maximize outputs given the available
inputs. This output-based approach measures how much output can be generated from a given
level of inputs (Chang et al., 2004).
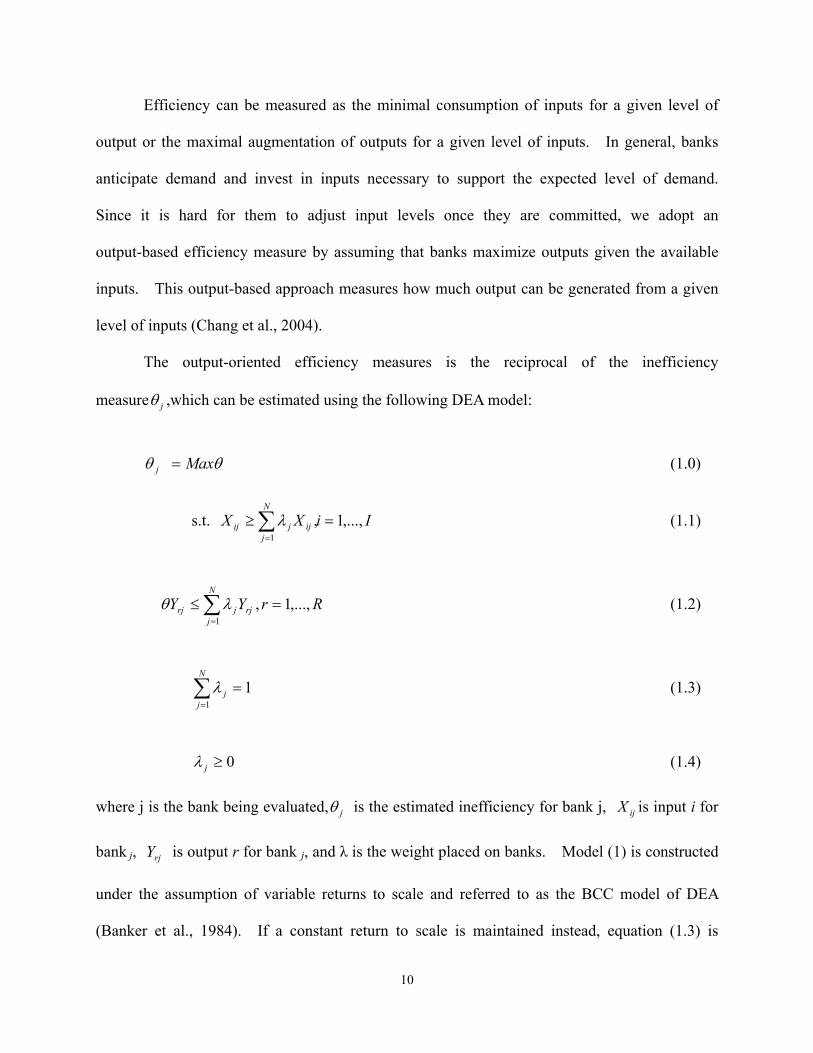
The output-oriented efficiency measures is the reciprocal of the inefficiency
measure jθ ,which can be estimated using the following DEA model:
θθ Maxj =
X
(1.0)
s.t. (1.1) IiXN
jijjij ,...,1,
1=≥ ∑
=
λ
RrYY rj
N
jjrj ,...,1,
1=≤ ∑
=
λθ (1.2)
11
=∑=
N
jjλ (1.3)
(1.4) 0≥jλ
where j is the bank being evaluated, jθ is the estimated inefficiency for bank j, is input i for
bank j, is output r for bank j, and λ is the weight placed on banks. Model (1) is constructed
under the assumption of variable returns to scale and referred to as the BCC model of DEA
(Banker et al., 1984). If a constant return to scale is maintained instead, equation (1.3) is
ijX
rjY
10
removed and the resulting model is labeled as the CCR model of DEA (Charnes et al., 1979).
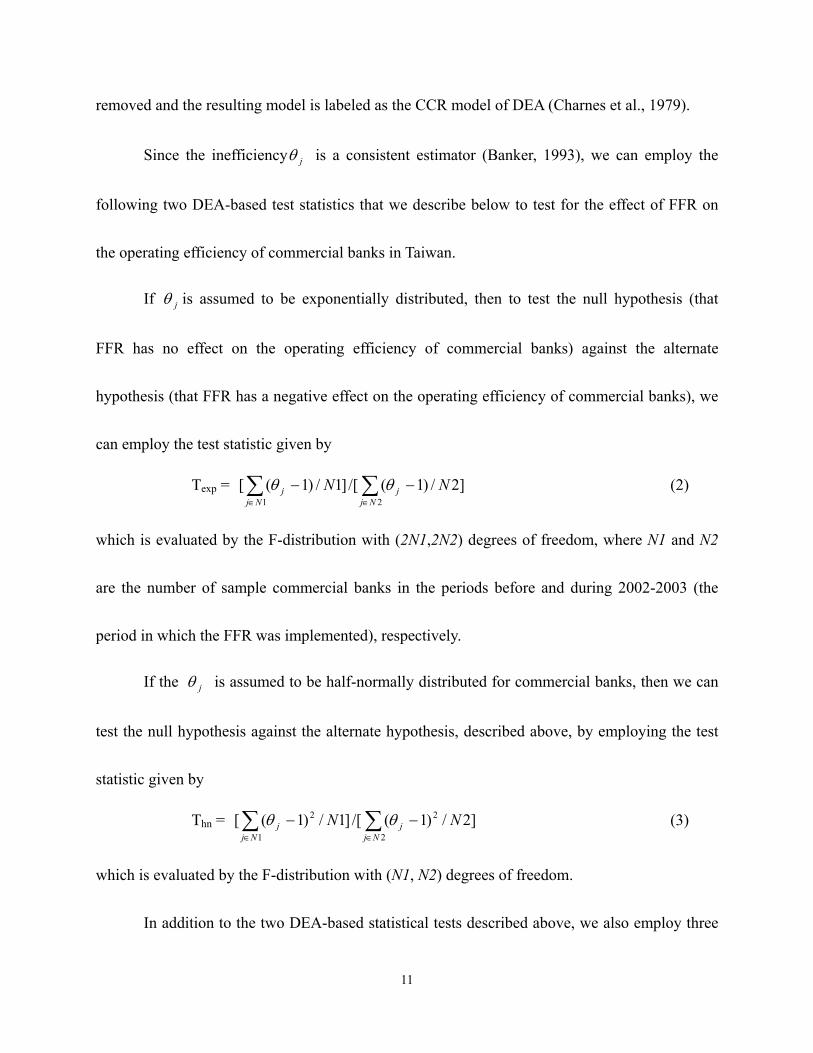
Since the inefficiency is a consistent estimator (Banker, 1993), we can employ the
following two DEA-based test statistics that we describe below to test for the effect of FFR on
the operating efficiency of commercial banks in Taiwan.
jθ
If jθ is assumed to be exponentially distributed, then to test the null hypothesis (that
FFR has no effect on the operating efficiency of commercial banks) against the alternate
hypothesis (that FFR has a negative effect on the operating efficiency of commercial banks), we
can employ the test statistic given by
Texp = ∑∑∈∈
−−21
]2/)1(/[]1/)1([Nj
jNj
j NN θθ (2)
which is evaluated by the F-distribution with (2N1,2N2) degrees of freedom, where N1 and N2
are the number of sample commercial banks in the periods before and during 2002-2003 (the
period in which the FFR was implemented), respectively.
If the jθ is assumed to be half-normally distributed for commercial banks, then we can
test the null hypothesis against the alternate hypothesis, described above, by employing the test
statistic given by
Thn = ]2/)1(/[]1/)1([2
2
1
2 NNNj
jNj
j ∑∑∈∈
−− θθ (3)
which is evaluated by the F-distribution with (N1, N2) degrees of freedom.
In addition to the two DEA-based statistical tests described above, we also employ three
11
conventional parametric based tests: (1) the Welch test; (2) the Mann-Whitney test; and (3) the
Kolmogorov-Sminrov test to test for the effect of FFR on the operating efficiency of commercial
banks in Taiwan.
3.3 Selection of input and output variables
Identifying appropriate inputs and outputs is crucial for the assessment of operating
efficiency. Prior banking efficiency studies have employed two different approaches in
selecting inputs and outputs: the production approach and the intermediation approach. The
production approach emphasizes operational activity and primarily views banks as providers of
services to customers. Under this approach, the inputs usually include physical variables such
as labor, materials, space, information systems, and branches. The output represents the
services provided to customers and are best measured by the number and type of transactions and
documents processed or specialized services provided over a given time period (Das and Ghosh,
2006). In contrast, the intermediation approach primarily views banks as financial
intermediaries between savers and investors that purchase inputs to generate earning assets
(Sealy and Lindley, 1977). Under this approach, both operating and interest expenses are
considered as inputs, whereas loans and other major assets are counted as outputs (Drake and
Hall, 2003; Isik and Hassan, 2003; Kao and Liu, 2004; Sturm and Williams, 2004; Das and
Ghosh, 2006; Havrylchyk, 2006; Park and Weber, 2006). The intermediation approach is
preferable since it normally includes interest expense, a large proportion of any bank’s total costs
(Elyasiani and Mehdian, 1990; Berger and Humphrey, 1991).
According to the Taiwan Banking Law, the role of commercial banks of Taiwan is
primarily to mediate funds between depositors and borrowers whose main business is to borrow
funds from depositors to lend to others (Kao and Liu, 2004). Given this and the above
12

mentioned advantages of the intermediation approach, we adopt the intermediation approach in
this study. Specifically, following Sturm and Williams (2004), Das and Ghosh (2006), and Park
and Weber (2006), we choose two outputs and two inputs for our estimation of banking
efficiency. The two inputs we consider are interest expenses and non-interest expenses, while
the two outputs we choose consist of interest revenue and non-interest revenue. Interest
expenses include expenses for deposits and other borrowed money. Non-interest expenses
include service charges and commissions, expenses of general management affairs, salaries, and
other expenses. The interest revenue includes interest on loans, income from government
bonds and corporate bonds. Non-interest revenue includes services charges on loans and
transactions, income from renting and fiduciary activities, commissions, and other operating
income.
4. Results and discussions
4.1. Descriptive statistics
Table 1 provides descriptive statistics for bank inputs, outputs, and the FFR policy
variables for the five year period from 2000 to 2004. Due to the lower interest rate, the interest
expense and revenue of 2002-2004 were substantially lower than those of 2000 and 2001. The
monetary values are in New Taiwan (NT) dollars, where 1 US dollar is approximately equal to
33 NT dollars. In 2002, the first year of the FFR, the mean (median) of the non-interest
operating expenses (excluding the interest expenses) dramatically increased to $14,323.1
($8,067.5) million NT dollars which was 21.4% higher than the five year average of $11,255.9
million NT dollars. This appears to result from compliance with the restructuring policy that
required bad debt write-offs. Meanwhile, the 2002 mean of the non-interest revenue decreased
13
24.38% compared to the five year average.
[Insert Table 1]
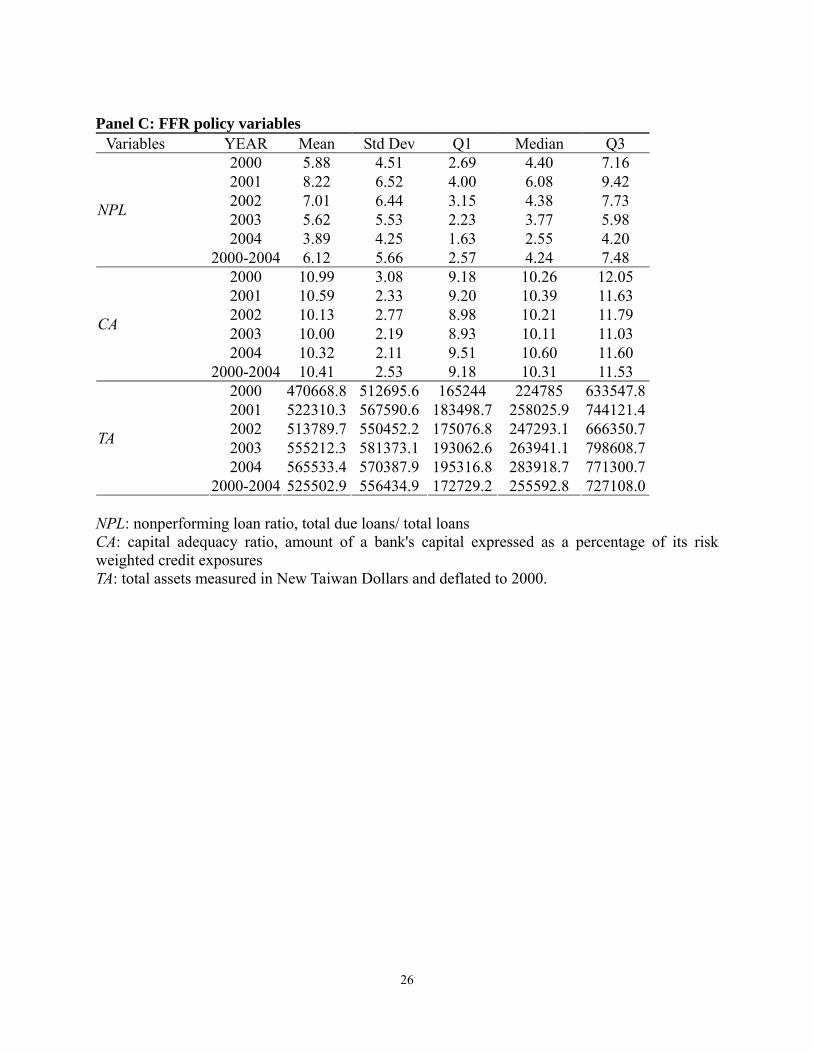
In Table 1 Panel C, the mean of the nonperforming loan ratio was 8.22% in 2001 and
decreased steadily to 3.89% in 2004. The mean of the nonperforming loan ratio for each year
was higher than the median. Declining during the four-year period, the means of the
nonperforming loan ratio are 8.22%; 7.01%; 5.62%; and 3.89% for 2001; 2002; 2003; and 2004,
respectively. Also, decreasing during the four-year period, the medians of the nonperforming
loan ratio are 6.08%; 4.38%; 3.77%; and 2.55% for 2001; 2002; 2003; and 2004, respectively.
Therefore, it appears that most banks complied with the nonperforming loan ratio requirement of
the government regulation in 2002.
The mean (median) of the capital adequacy ratio8 from 2000 to 2004 is 10.41% (10.31%)
which is higher than the minimum 8% official requirement. The means (medians) for each year
are 10.99% (10.26%); 10.59% (10.39%); 10.13% (10.21%); 10% (10.11%); and 10.32% (10.6%),
respectively, for 2000 to 2004. These findings suggest that the banks may have adopted the 8%
capital adequacy requirement of the Basel accord prior to the FFR period.
4.2 FFR Impact on banking efficiency
4.2.1 Univariate analysis
We first use the DEA model in (1) to estimate inefficiency for each bank for the five year
period 2000-2004 using observed data on input-output vectors. We present the descriptive
statistics for operating inefficiency in Table 2.
[Insert Table 2 here]
As reported in Table 2, the mean (median) of operating inefficiency is 1.2192 (1.1622)
8 Capital adequacy ratio is defined as a measure of the amount of a bank's capital expressed as a percentage of its risk weighted credit exposures. Taiwan's bank capital adequacy ratio calculation is in accordance with international standards.
14
for the full sample period 2000-2004. The operating inefficiency of banks, on average, increased
from 2000 to 2002, reaching its highest level in 2002. Also, operating inefficiency had increased
approximately 18.2% in 2002 compared to 2000. The mean (median) operating inefficiency
value during the pre-reform period is 1.1805 (1.1223), increasing to 1.2891 (1.224), its worse
level, during the reform period, and decreasing to 1.1566 (1.0913) during the post-reform period.
As described, we used two DEA-based tests and three traditional tests (Welch test,
Mann-Whitney test, and Kolmogorov-Sminrov test) to evaluate the inefficiency differences of
banks between the reform period (2002-2003) of the FFR and the pre- (2000-2001) and post-
(2004) reform periods. Results of the two DEA-based tests are shown in Table 3 along with the
traditional tests for inefficiency differences between two groups.
From Table 3, we observe that the mean difference in inefficiency between the reform
period and the other periods is statistically significant at the 1% level from the DEA-based
statistical tests, indicating that banking operating efficiency was lower during the reform period.
Similarly, results of the three non-DEA-based statistical tests indicate that the mean difference in
operating inefficiency between the pre-FFR and FFR periods, as well as between FFR and the
post-FFR periods is statistically significant at conventional level, suggesting that bank efficiency
deteriorated in the reform period (H1), but improved in the post-reform period (H2). Thus, our
hypotheses H1 and H2 are confirmed.
[Insert Table 3 here]
4.2.2 Multivariate analysis
We expect that the FFR program will shift the bank’s business process; we model this
potential shift as an interrupted time series and evaluate it using intervention analysis (Banker et
al., 1989). Specifically, we specify the regression model to evaluate how the intervention
15
impacts the operating inefficiency from 2000 to 2004. Two dummy variables, REFORM and
POST, are included as intervention variables to differentiate among the pre-reform, reform, and
post-reform periods and to reflect the operating inefficiency difference among the three periods.
As discussed in section 2, nonperforming loans have been found to be negatively associated with
banking efficiency while capital adequacy has been found to be positively associated with
banking efficiency. Further, since FFR required banks to have a minimum capital adequacy
ratio of 8% and a maximum nonperforming loan ratio of 5% by the end of 2003, we expect
banks to comply with these two requirements. Thus, we include the nonperforming loan ratio
(NPL), capital adequacy ratio (CA), changes in the nonperforming loan ratio ( NPL), and
changes in the capital adequacy ratio (
Δ
ΔCA) in our regression models. Finally, prior studies in
banking efficiency observe that bank operating efficiency was affected by its ownership type and
size. Therefore, we also include a dummy variable (OWN) for private banks and the natural
logarithm of total asset (lnTA) to proxy for bank size. Specifically, we specify and estimate the
following two fixed-effects regression models:
lnθ = β0 + β1NPL + β2CA + Β3REFORM + Β4POST + β5OWN + β6lnTA + ε (4a)
lnθ = β0 + β1NPL + β2CA + Β3REFORM + Β4POST +β31REFORM*ΔNPL + β32REFORM* CA+ β41POST*Δ ΔNPL + β42POST*ΔCA + β5OWN + β6lnTA +ε (4b)
where θln is the natural logarithm of the inefficiency estimatorθ obtained from equation (1);
NPL is nonperforming loan ratio and defined as total due loans divided by total loans; CA is
capital adequacy ratio; REFORM takes a value of 1 for 2002 and 2003, and 0 otherwise; POST
takes a value of 1 for 2004, and 0 otherwise; ΔNPL is the change in nonperforming loan ratio;
CA is the change in the capital adequacy ratio; OWN is an indicator for private banksΔ 9; lnTA is
9 There are 11 public banks each year in our sample.
16
the natural logarithm of total assets; and ε is the disturbance term.
Note that REFORM and POST are included to capture the difference in inefficiencies
between the two years in the pre-FFR and FFR periods and between the two years in the FFR
period and one year in the post-FFR period. These dummies and their corresponding
interactions enable us to evaluate whether there is a significant change in the operating efficiency
of commercial banks in Taiwan both before and after the FFR.
Our research design using the two-stage procedures represented in (4a) and (4b) is
motivated by prior research. For instance, Chang et al. (2004) regress DEA scores on a variety
of hospital specific characteristics in their study of health care regulation and the operating
efficiency of hospitals. Further, Banker and Natarajan (2008) have provided theoretical
justification for the use of the two-stage models in DEA to evaluate contextual variables
affecting DEA efficiency scores.
We present regression results in Table 4. From Table 4 (4a and 4b), we observe that the
coefficients of NPL are positive (0.0078 and 0.0073) and CA are insignificantly negative
(-0.0012 and -0.0028), respectively, indicating that the higher the nonperforming loan ratio the
higher the inefficiency. These results are consistent with findings of prior studies on banking
efficiency that the nonperforming loan ratio is positively associated with the operating
inefficiency as described earlier.
The coefficients of REFORM in (4a and 4b) are all significantly positive at a 1% level
indicating that bank operating efficiency declined during the reform period (2002 to 2003). The
coefficients for POST are negative, indicating that bank operating efficiency improved post FFR
period compared to the pre-FFR period. The results of statistical tests of efficiency changes
during the FFR period and between the post and FFR periods are also reported in Table 4.
17
Evidently, our hypotheses H1 and H2 are confirmed. That is, bank operating efficiency
deteriorates in the reform period but improves in the post-reform period.
[Insert Table 4 here]
4.3. Sensitivity analyses
To evaluate the robustness of our empirical results, we conduct the following additional
analyses. First, we check serial correlation for our residuals using Durbin-Watson test and we
do not find evidence of autocorrelation. Second, we use Belsley, Kuh, and Welsch's (1980)
diagnostics for collinearity and we do not find evidence of collinearity between contextual
variables in our regression models. Third, we check heteroscedasticity for our residuals using
White's (1980) test and we find evidence of heteroscedasticity. However, the results using White
adjusted statistics reveal no appreciably difference from what we discussed earlier. Fourth, we
use the CCR model of DEA (Charnes et al., 1978) to estimate the inefficiency for commercial
banks and we find results similar to those of BCC discussed earlier. Finally, we follow Yeh
(1996) and Kao and Liu (2004) to consider three inputs and three outputs by adding total
deposits and total loans to our estimation of operating inefficiency. The results (not reported
here) are similar to those discussed for the two inputs and two outputs specification case.
Therefore, we conclude that our results are robust.
5. Conclusion
The current study investigates the impact of the FFR regulation on the operating
efficiency of 40 commercial banks in Taiwan during 2000 to 2004. Using data over this five
year period, two years before and one year after the FFR and two years during the FFR
implementation, the results show that the efficiency of commercial banks in Taiwan deteriorated
18
during the implementation of the FFR. Specifically, banks had lower operating efficiency
during the FFR reform period (2002-2003) compared to the pre-reform period (2000-2001) but
had higher operating efficiency in the post-reform period (2004). This suggests that more time
might be needed to reap the long-term benefits of restructuring.
We also find that banks with higher nonperforming loan ratios had lower operating
efficiency and those with higher capital adequacy ratios had higher operating efficiency.
Achieving the mission of the reform, the mean of nonperforming loan ratio had decreased to
3.89% in 2004 from a peak of 8.22% in 2001 and the capital adequacy ratio was consistently
above the regulatory requirement, reaching a peak of 10.32% in 2004. The 5% floor of the
nonperforming loan ratio was accomplished by substantial bad debt write-offs and accelerating
the aging of loans, resulting in lower operating efficiency during the reform period. Overall,
our results indicate that the FFR lead to improved operating efficiency in the banking sector,
possibly due to the reduction of nonperforming loans rather than the boosting of capital adequacy
during FFR.
The results of the current study have implications for the design of public policy by
providing evidence to policymakers of the effectiveness of the FFR. In addition, given an
increasingly competitive environment where inefficient institutions are less likely to survive, it is
essential for regulators and managers to be knowledgeable about inefficiencies in the banking
industry and factors (such as nonperforming loans and capital adequacy) that may exacerbate or
mitigate them. Also, the results reported here suggest that lower nonperforming loans, not
higher capital adequacy, are primarily responsible for improved operating efficiency, although
both are critical indicators of banking operating efficiency. Thus, future regulations should
target the prevention and reduction of nonperforming loans in an effort to improve banking
19
efficiency.
Our results suggest several avenues for future research. First, a theory is needed to
explain the nonlinear reform-efficiency relationship documented over the pre-reform, during
reform, and post-reform periods. The development of such a theory or model would serve as a
guide for regulatory authorities. Second, future research could examine the long-term
implications of restructuring beyond the one-year post-reform period considered in the current
study. Third, while we chose to study the efficiency effects of FFR, future research could
examine the effects of such regulatory changes on accounting and financing choices.
20
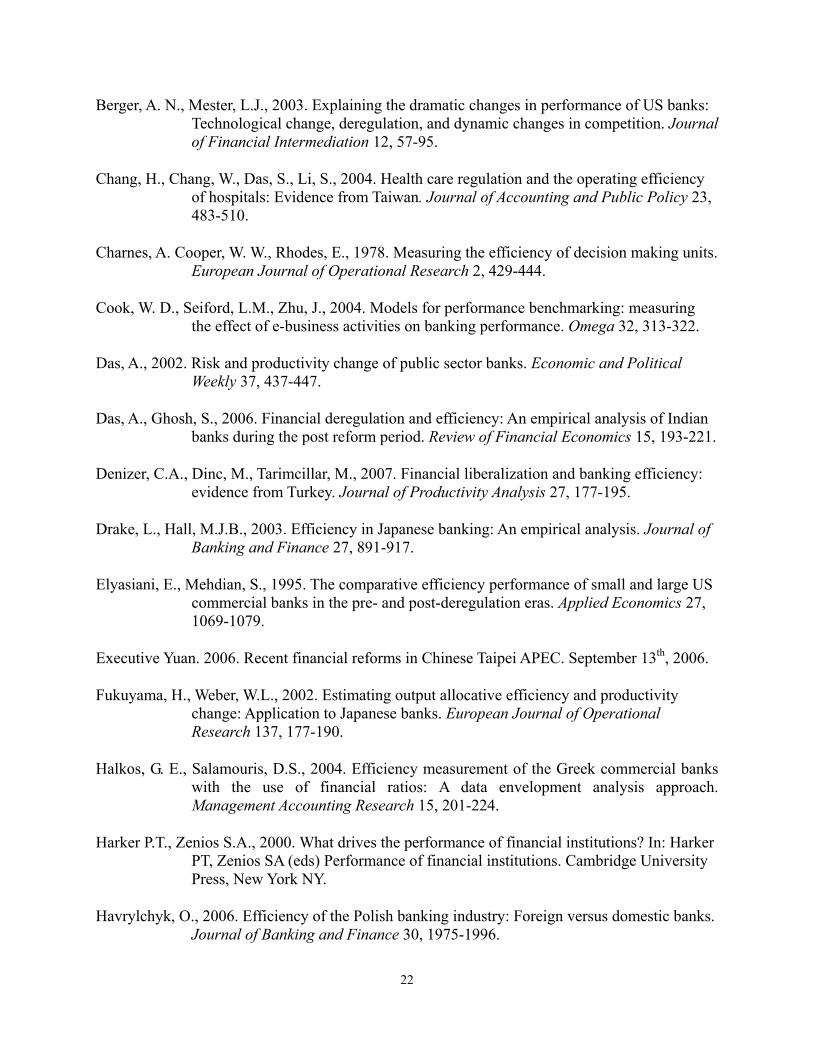
References
Altunbas, Y., Liu, M., Molyneux, P., Seth, R., 2000. Efficiency and risk in Japanese banking. Journal of Banking and Finance 24, 1602-1628.
Anandarajan, A., Hasan, I., Lozano-Vivas, A., 2005. Loan loss provision decisions: An empirical analysis of the Spanish depository institutions. Journal of International Accounting, Auditing and Taxation 14, 55-77.
Banker, R. D., 1993. Maximum likelihood, consistency and data envelopment analysis: A statistical foundation. Management Science 39, 1265-1273.
Banker, R. D., Charnes, A., Cooper, W. W., 1984. Some models for estimating technical and scale inefficiencies in data envelopment analysis. Management Science 30, 1078-1092.
Banker, R. D., Charnes, A., Cooper, W. W., Swarts, J., Thomas, T. 1989. An introduction to Data Envelopment Analysis with some of its models and their uses. Research in Governmental and Nonprofit Accounting 5, 125-163.
Banker, R. D., Natarajan, R., 2008. Evaluating contextual variables affecting productivity
using DEA. Operations Research, Forthcoming.
Barth, J. R., Caprio, G. Jr., Levine, R. 2004. Bank regulation and supervision: what works best? Journal of Financial Intermediation 13, 205-248.
Bauer, P. W., Hancock, D., 1993. The efficiency of the Federal Reserve in providing check processing services. Journal of Banking and Finance 17, 287-301.
Belsley, D.A., Kuh, E, Welsch, R. E., 1980. Regression diagnostics. John Wiley & Son. NY.
Berg, S. A., Forsund, F. R., Finn, R. Jansen, E. S., 1992. Malmquist indices of productivity growth during the deregulation of Norwegian banking, 1980-89. The Scandinavian Journal of Economics 94, S211-228.
Berger A.N., 2004. International comparisons of banking efficiency. In: Aggarwal R (ed) A companion to International Business Finance. Blackwell Publishing, Malden, MA.
Berger, A. N., DeYoung, R., 1997. Problem loans and cost efficiency in commercial banks. Journal of Banking and Finance 21, 849-870.
Berger, A. N., Humphrey, D., 1997. Efficiency of financial institutions: International survey and directions for future research. European Journal of Operational Research 98, 175-212.
21
Berger, A. N., Mester, L.J., 2003. Explaining the dramatic changes in performance of US banks: Technological change, deregulation, and dynamic changes in competition. Journal of Financial Intermediation 12, 57-95.
Chang, H., Chang, W., Das, S., Li, S., 2004. Health care regulation and the operating efficiency of hospitals: Evidence from Taiwan. Journal of Accounting and Public Policy 23, 483-510.
Charnes, A. Cooper, W. W., Rhodes, E., 1978. Measuring the efficiency of decision making units. European Journal of Operational Research 2, 429-444.
Cook, W. D., Seiford, L.M., Zhu, J., 2004. Models for performance benchmarking: measuring the effect of e-business activities on banking performance. Omega 32, 313-322.
Das, A., 2002. Risk and productivity change of public sector banks. Economic and Political Weekly 37, 437-447.
Das, A., Ghosh, S., 2006. Financial deregulation and efficiency: An empirical analysis of Indian banks during the post reform period. Review of Financial Economics 15, 193-221.
Denizer, C.A., Dinc, M., Tarimcillar, M., 2007. Financial liberalization and banking efficiency: evidence from Turkey. Journal of Productivity Analysis 27, 177-195.
Drake, L., Hall, M.J.B., 2003. Efficiency in Japanese banking: An empirical analysis. Journal of Banking and Finance 27, 891-917.
Elyasiani, E., Mehdian, S., 1995. The comparative efficiency performance of small and large US commercial banks in the pre- and post-deregulation eras. Applied Economics 27, 1069-1079.
Executive Yuan. 2006. Recent financial reforms in Chinese Taipei APEC. September 13th, 2006.
Fukuyama, H., Weber, W.L., 2002. Estimating output allocative efficiency and productivity change: Application to Japanese banks. European Journal of Operational Research 137, 177-190.
Halkos, G. E., Salamouris, D.S., 2004. Efficiency measurement of the Greek commercial banks with the use of financial ratios: A data envelopment analysis approach. Management Accounting Research 15, 201-224.
Harker P.T., Zenios S.A., 2000. What drives the performance of financial institutions? In: Harker PT, Zenios SA (eds) Performance of financial institutions. Cambridge University Press, New York NY.
Havrylchyk, O., 2006. Efficiency of the Polish banking industry: Foreign versus domestic banks. Journal of Banking and Finance 30, 1975-1996.
22
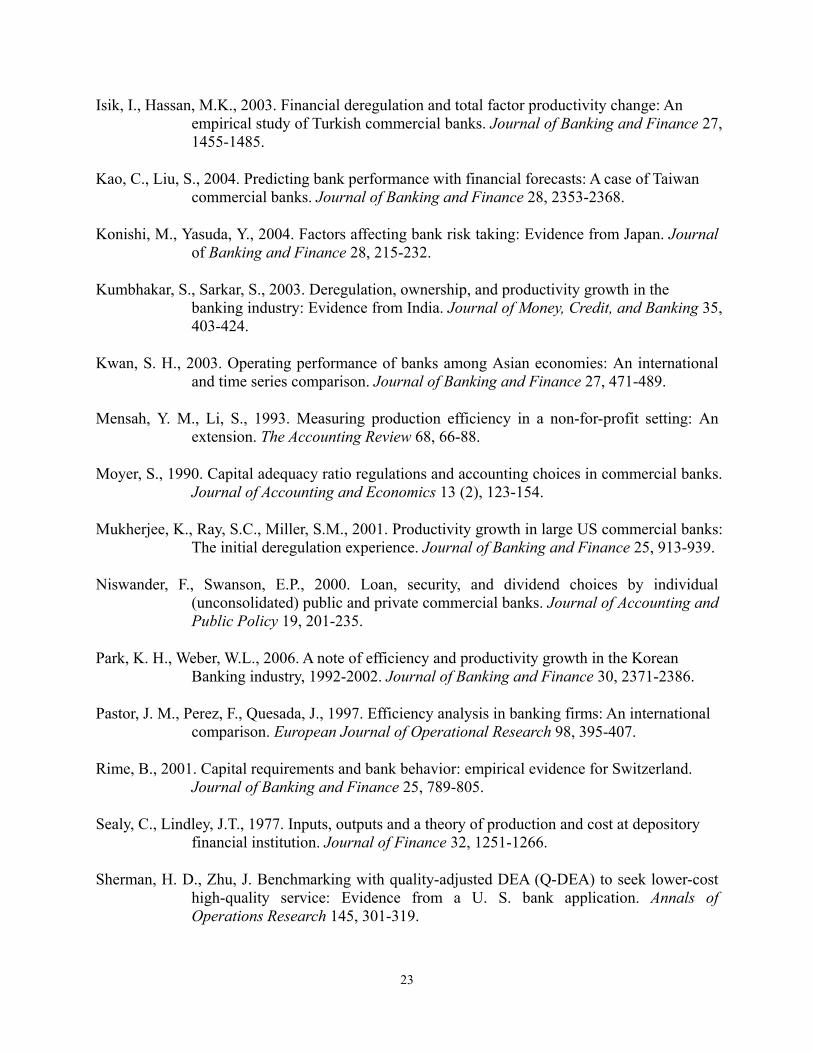
Isik, I., Hassan, M.K., 2003. Financial deregulation and total factor productivity change: An empirical study of Turkish commercial banks. Journal of Banking and Finance 27, 1455-1485.
Kao, C., Liu, S., 2004. Predicting bank performance with financial forecasts: A case of Taiwan commercial banks. Journal of Banking and Finance 28, 2353-2368.
Konishi, M., Yasuda, Y., 2004. Factors affecting bank risk taking: Evidence from Japan. Journal of Banking and Finance 28, 215-232.
Kumbhakar, S., Sarkar, S., 2003. Deregulation, ownership, and productivity growth in the banking industry: Evidence from India. Journal of Money, Credit, and Banking 35, 403-424.
Kwan, S. H., 2003. Operating performance of banks among Asian economies: An international and time series comparison. Journal of Banking and Finance 27, 471-489.
Mensah, Y. M., Li, S., 1993. Measuring production efficiency in a non-for-profit setting: An extension. The Accounting Review 68, 66-88.
Moyer, S., 1990. Capital adequacy ratio regulations and accounting choices in commercial banks. Journal of Accounting and Economics 13 (2), 123-154.
Mukherjee, K., Ray, S.C., Miller, S.M., 2001. Productivity growth in large US commercial banks: The initial deregulation experience. Journal of Banking and Finance 25, 913-939.
Niswander, F., Swanson, E.P., 2000. Loan, security, and dividend choices by individual (unconsolidated) public and private commercial banks. Journal of Accounting and Public Policy 19, 201-235.
Park, K. H., Weber, W.L., 2006. A note of efficiency and productivity growth in the Korean Banking industry, 1992-2002. Journal of Banking and Finance 30, 2371-2386.
Pastor, J. M., Perez, F., Quesada, J., 1997. Efficiency analysis in banking firms: An international comparison. European Journal of Operational Research 98, 395-407.
Rime, B., 2001. Capital requirements and bank behavior: empirical evidence for Switzerland. Journal of Banking and Finance 25, 789-805.
Sealy, C., Lindley, J.T., 1977. Inputs, outputs and a theory of production and cost at depository financial institution. Journal of Finance 32, 1251-1266.
Sherman, H. D., Zhu, J. Benchmarking with quality-adjusted DEA (Q-DEA) to seek lower-cost high-quality service: Evidence from a U. S. bank application. Annals of Operations Research 145, 301-319.
23
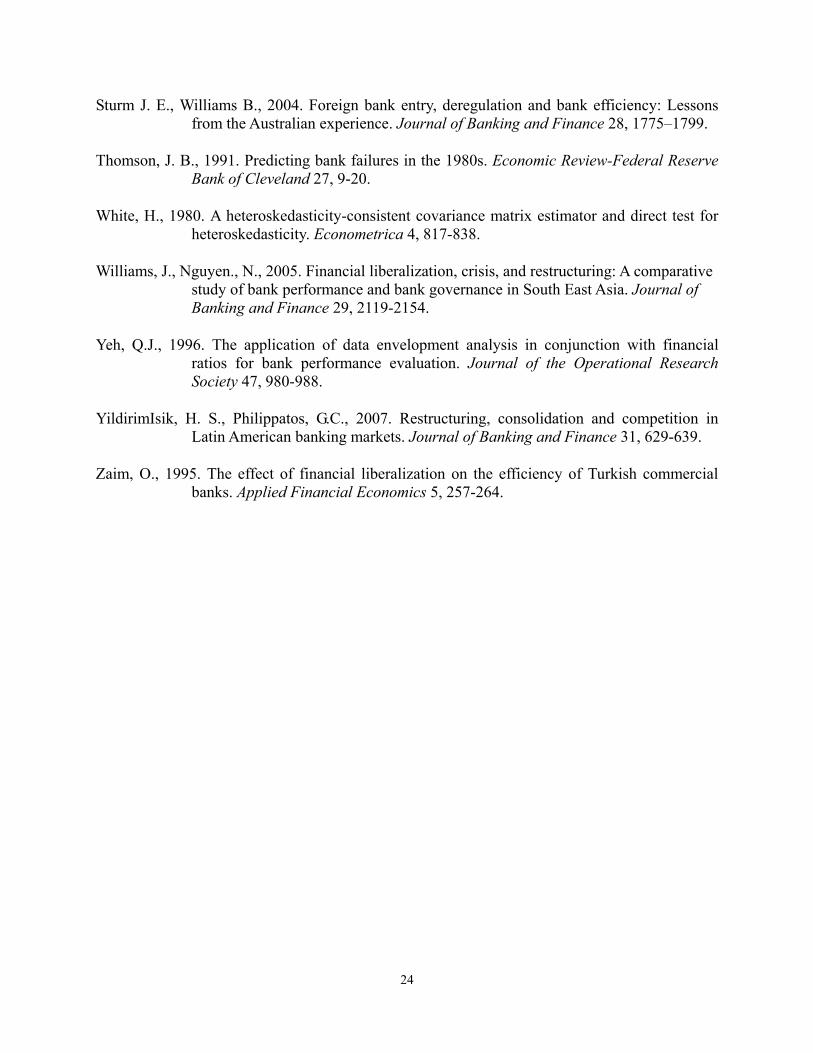
Sturm J. E., Williams B., 2004. Foreign bank entry, deregulation and bank efficiency: Lessons from the Australian experience. Journal of Banking and Finance 28, 1775–1799.
Thomson, J. B., 1991. Predicting bank failures in the 1980s. Economic Review-Federal Reserve Bank of Cleveland 27, 9-20.
White, H., 1980. A heteroskedasticity-consistent covariance matrix estimator and direct test for heteroskedasticity. Econometrica 4, 817-838.
Williams, J., Nguyen., N., 2005. Financial liberalization, crisis, and restructuring: A comparative study of bank performance and bank governance in South East Asia. Journal of Banking and Finance 29, 2119-2154.
Yeh, Q.J., 1996. The application of data envelopment analysis in conjunction with financial ratios for bank performance evaluation. Journal of the Operational Research Society 47, 980-988.
YildirimIsik, H. S., Philippatos, G.C., 2007. Restructuring, consolidation and competition in Latin American banking markets. Journal of Banking and Finance 31, 629-639.
Zaim, O., 1995. The effect of financial liberalization on the efficiency of Turkish commercial banks. Applied Financial Economics 5, 257-264.
24
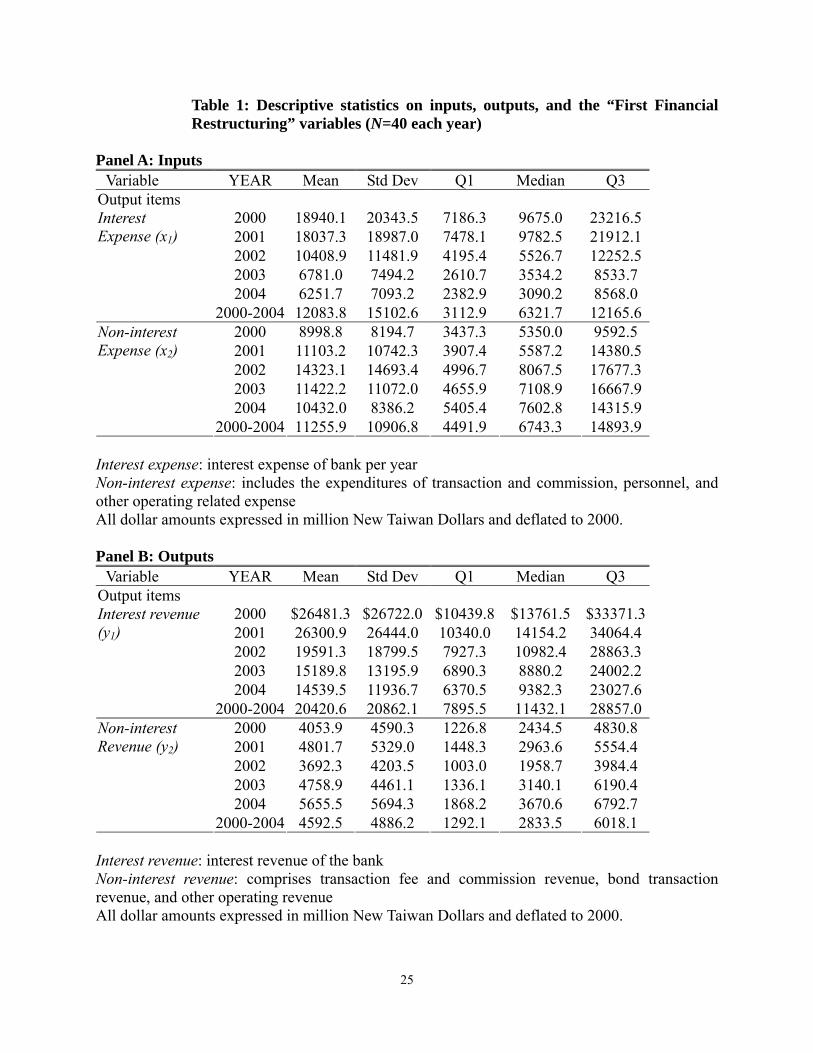
Table 1: Descriptive statistics on inputs, outputs, and the “First Financial Restructuring” variables (N=40 each year)
Panel A: Inputs Variable YEAR Mean Std Dev Q1 Median Q3 Output items
2000 18940.1 20343.5 7186.3 9675.0 23216.5 2001 18037.3 18987.0 7478.1 9782.5 21912.1 2002 10408.9 11481.9 4195.4 5526.7 12252.5 2003 6781.0 7494.2 2610.7 3534.2 8533.7 2004 6251.7 7093.2 2382.9 3090.2 8568.0
Interest Expense (x1)
2000-2004 12083.8 15102.6 3112.9 6321.7 12165.6 2000 8998.8 8194.7 3437.3 5350.0 9592.5 2001 11103.2 10742.3 3907.4 5587.2 14380.5 2002 14323.1 14693.4 4996.7 8067.5 17677.3 2003 11422.2 11072.0 4655.9 7108.9 16667.9 2004 10432.0 8386.2 5405.4 7602.8 14315.9
Non-interest Expense (x2)
2000-2004 11255.9 10906.8 4491.9 6743.3 14893.9 Interest expense: interest expense of bank per year Non-interest expense: includes the expenditures of transaction and commission, personnel, and other operating related expense All dollar amounts expressed in million New Taiwan Dollars and deflated to 2000. Panel B: Outputs Variable YEAR Mean Std Dev Q1 Median Q3 Output items
2000 $26481.3 $26722.0 $10439.8 $13761.5 $33371.3 2001 26300.9 26444.0 10340.0 14154.2 34064.4 2002 19591.3 18799.5 7927.3 10982.4 28863.3 2003 15189.8 13195.9 6890.3 8880.2 24002.2 2004 14539.5 11936.7 6370.5 9382.3 23027.6
Interest revenue (y1)
2000-2004 20420.6 20862.1 7895.5 11432.1 28857.0 2000 4053.9 4590.3 1226.8 2434.5 4830.8 2001 4801.7 5329.0 1448.3 2963.6 5554.4 2002 3692.3 4203.5 1003.0 1958.7 3984.4 2003 4758.9 4461.1 1336.1 3140.1 6190.4 2004 5655.5 5694.3 1868.2 3670.6 6792.7
Non-interest Revenue (y2)
2000-2004 4592.5 4886.2 1292.1 2833.5 6018.1 Interest revenue: interest revenue of the bank Non-interest revenue: comprises transaction fee and commission revenue, bond transaction revenue, and other operating revenue All dollar amounts expressed in million New Taiwan Dollars and deflated to 2000.
25
Panel C: FFR policy variables Variables YEAR Mean Std Dev Q1 Median Q3
2000 5.88 4.51 2.69 4.40 7.16 2001 8.22 6.52 4.00 6.08 9.42 2002 7.01 6.44 3.15 4.38 7.73 2003 5.62 5.53 2.23 3.77 5.98 2004 3.89 4.25 1.63 2.55 4.20
NPL
2000-2004 6.12 5.66 2.57 4.24 7.48 2000 10.99 3.08 9.18 10.26 12.05 2001 10.59 2.33 9.20 10.39 11.63 2002 10.13 2.77 8.98 10.21 11.79 2003 10.00 2.19 8.93 10.11 11.03 2004 10.32 2.11 9.51 10.60 11.60
CA
2000-2004 10.41 2.53 9.18 10.31 11.53 2000 470668.8 512695.6 165244 224785 633547.8 2001 522310.3 567590.6 183498.7 258025.9 744121.4 2002 513789.7 550452.2 175076.8 247293.1 666350.7 2003 555212.3 581373.1 193062.6 263941.1 798608.7 2004 565533.4 570387.9 195316.8 283918.7 771300.7
TA
2000-2004 525502.9 556434.9 172729.2 255592.8 727108.0 NPL: nonperforming loan ratio, total due loans/ total loans CA: capital adequacy ratio, amount of a bank's capital expressed as a percentage of its risk weighted credit exposures TA: total assets measured in New Taiwan Dollars and deflated to 2000.
26
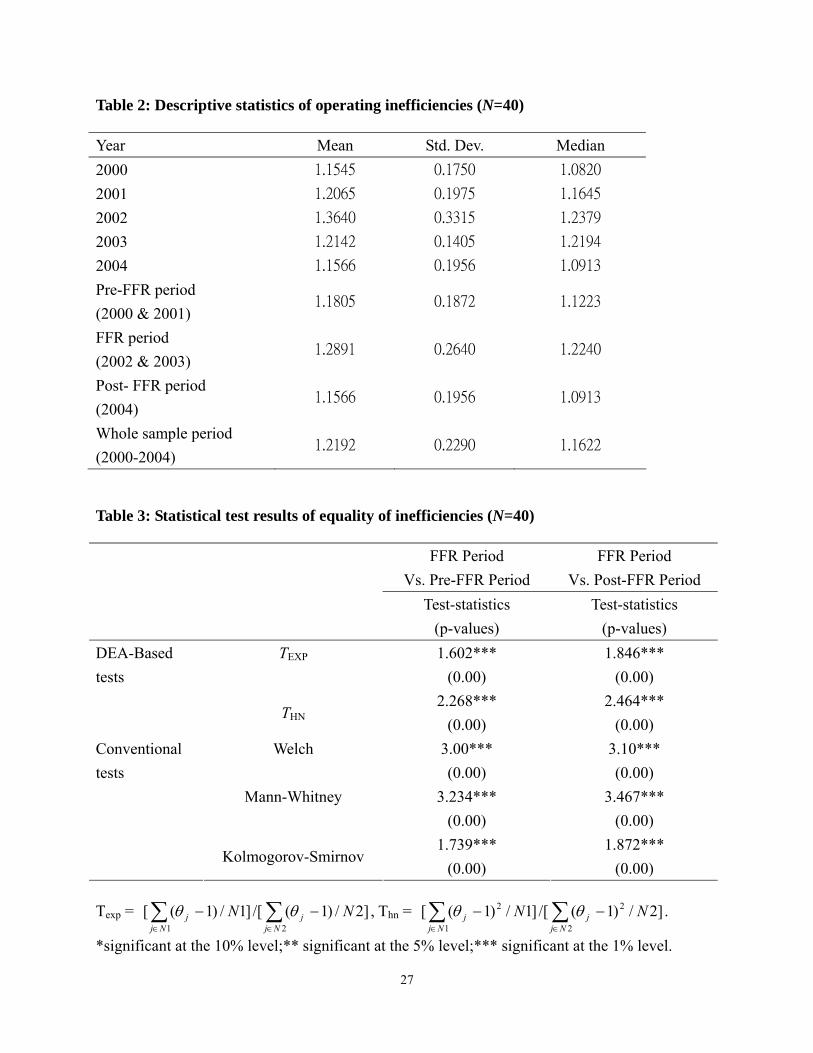
Table 2: Descriptive statistics of operating inefficiencies (N=40) Year Mean Std. Dev. Median 2000 1.1545 0.1750 1.0820 2001 1.2065 0.1975 1.1645 2002 1.3640 0.3315 1.2379 2003 1.2142 0.1405 1.2194 2004 1.1566 0.1956 1.0913 Pre-FFR period (2000 & 2001)
1.1805 0.1872 1.1223
FFR period (2002 & 2003)
1.2891 0.2640 1.2240
Post- FFR period (2004)
1.1566 0.1956 1.0913
Whole sample period (2000-2004)
1.2192 0.2290 1.1622
Table 3: Statistical test results of equality of inefficiencies (N=40)
FFR Period Vs. Pre-FFR Period
FFR Period Vs. Post-FFR Period
Test-statistics (p-values)
Test-statistics (p-values)
TEXP 1.602*** (0.00)
1.846*** (0.00)
DEA-Based tests
THN 2.268***
(0.00) 2.464***
(0.00) Welch 3.00***
(0.00) 3.10*** (0.00)
Mann-Whitney 3.234*** (0.00)
3.467*** (0.00)
Conventional tests
Kolmogorov-Smirnov 1.739***
(0.00) 1.872***
(0.00) Texp = , Thn = ]2/)1(/[]1/)1([
21NN
Njj
Njj ∑∑
∈∈
−− θθ ∑∑∈∈
−−2
2
1
2 ]2/)1(/[]1/)1([Nj
jNj
j NN θθ .
*significant at the 10% level;** significant at the 5% level;*** significant at the 1% level.
27
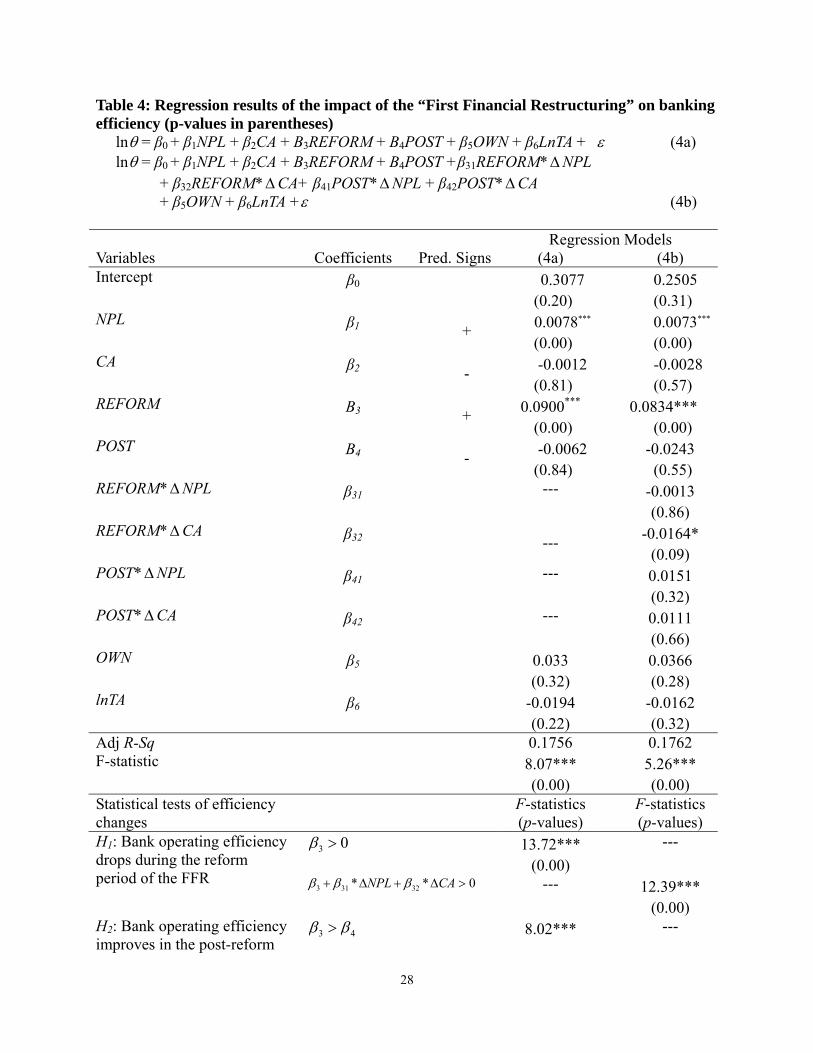
Table 4: Regression results of the impact of the “First Financial Restructuring” on banking efficiency (p-values in parentheses)
lnθ = β0 + β1NPL + β2CA + Β3REFORM + Β4POST + β5OWN + β6LnTA + ε (4a) lnθ = β0 + β1NPL + β2CA + Β3REFORM + Β4POST +β31REFORM*ΔNPL
+ β32REFORM* CA+ β41POST*Δ ΔNPL + β42POST*ΔCA + β5OWN + β6LnTA +ε (4b)
Regression Models Variables
Coefficients
Pred. Signs (4a) (4b)
Intercept β0 0.3077 (0.20)
0.2505 (0.31)
NPL β1 + 0.0078*** (0.00)
0.0073*** (0.00)
CA β2 - -0.0012 (0.81)
-0.0028 (0.57)
REFORM Β3 + 0.0900*** (0.00)
0.0834*** (0.00)
POST Β4 - -0.0062 (0.84)
-0.0243 (0.55)
REFORM* NPL Δ β31 --- -0.0013 (0.86)
REFORM* CA Δ β32 --- -0.0164*
(0.09) POST* NPL Δ β41 --- 0.0151
(0.32) POST* CA Δ β42 ---
0.0111 (0.66)
OWN β5 0.033 (0.32)
0.0366 (0.28)
lnTA β6 -0.0194 (0.22)
-0.0162 (0.32)
Adj R-Sq 0.1756 0.1762 F-statistic 8.07***
(0.00) 5.26***
(0.00) Statistical tests of efficiency changes
F-statistics (p-values)
F-statistics (p-values)
03 >β 13.72*** (0.00)
--- H1: Bank operating efficiency drops during the reform period of the FFR 0** 32313 >Δ+Δ+ CANPL βββ --- 12.39***
(0.00) H2: Bank operating efficiency improves in the post-reform
43 ββ > 8.02*** ---
28

(0.00) period compared to the reform period of the FFR
CANPLCANPLΔ+Δ+>
Δ+Δ+**
**
42414
32313
ββββββ --- 7.88***
(0.00) *significant at the 10% level; ** significant at the 5% level; *** significant at the 1% level. lnθ = natural logarithm of the inefficiency estimatorθ obtained from equation (1) and other variable definitions appear in Table 1.
29