Embed Size (px)
Citation preview

First Financial Corporation
One First Financial PlazaTerre Haute, IN 47807812/238/6000 800/511/0045www.first-online.com
A YE
AR O
F EX
PAN
SIO
N, I
MPR
OVE
MEN
T AN
D IN
VEST
MEN
T 20122012 ANNUAL REPORT
TO THE STAKEHOLDERS
2012The mission of First Financial Corporation is to be the FIRST choice for all your financial needs.

expa
nsio
nA
YEAR
OF
EXPA
NSI
ON
, IM
PRO
VEM
ENT
AND
INVE
STM
ENT
125
INDIANA
VIGO COUNTYTerre Haute Main Office*One First Financial PlazaSixth& Wabash812-238-6000
Honey Creek Mall*U.S. 41 South812-238-6000
Industrial Park*1749 East Industrial Drive812-238-6000
Maple Avenue*4065 Maple Avenue812-238-6000
Meadows*350 South 25th Street812-238-6000
Plaza North*Ft. Harrison & Lafayette812-238-6000
Seelyville*9520 East U.S. 40812-238-6000
Southland*3005 South Seventh Street812-238-6000
Springhill*4500 U.S. 41 South812-238-6000
Sycamore Terrace*2425 South State Road 46812-238-6000
West Terre Haute*309 National Avenue812-238-6000
CLAY COUNTYBrazil*7995 North State Road 59812-443-4481
Brazil Downtown*18 North Walnut812-448-3357
Brazil Eastside*2180 East National Avenue812-448-8110
Clay City*502-504 Main Street812-939-2145
First Financial Banking Centers
DAVIESS COUNTYWashington*300 East Main Street812-257-8860
GIBSON COUNTYPrinceton*1501 West Broadway 812-385-0235
GREENE COUNTYWorthington*9 North Commercial Street812-875-3021
KNOX COUNTYSandborn102 North Anderson Street812-694-8462
Vincennes*2707 North Sixth Street812-882-4800
Vincennes*619 Main Street Vincennes812-886-9690
PARKE COUNTYRockville*1311 North Lincoln Road765-569-3171
Rockville Downtown*120 East Ohio Street765-569-3442
Marshall10 South Main Street765-597-2261
Montezuma*232 East Crawford Street765-245-2706
Rosedale62 East Central Street765-548-2266
PUTNAM COUNTYGreencastle*101 South Warren Drive765-653-4444
SULLIVAN COUNTYSullivan*15 South Main Street812-268-3331
Dugger*879 South 3rd Street812-648-2251
Farmersburg*819 West Main Street812-696-2106
Hymera*102 South Main Street812-383-4933
VANDERBURGH COUNTYEvansville*12600 Highway 41 North812-868-8850
VERMILLION COUNTYNewport*100 West Market Street765-492-3321
Cayuga101 S. Division Street765-492-3391
Clinton*221 South Main Street765-832-3504
Clinton Crown Hill*1775 East State Road 163765-832-5546
ILLINOIS
CHAMPAIGN COUNTYBroadway*410 North Broadway217-351-2701
Mahomet IGA*Eastwood Center IGA217-586-5322
Neil Street*1205 South Neil Street217-352-6700
Philo Road*2510 South Philo Road217-344-1300
South Prospect*1611 South Prospect Avenue217-351-6620
CLARK COUNTYMarshall*215 North Michigan217-826-6311
COLES COUNTYCharleston*820 West Lincoln Avenue217-345-4824
CRAWFORD COUNTYRobinson*108 West Main Street618-544-8666
Robinson Motor Bank*602 West Walnut Street618-544-3355
Oblong*301 East Main Street618-592-4252
JASPER COUNTYNewton*601 West Jourdan Street618-783-2022
LAWRENCE COUNTYLawrenceville*1601 State Street618-943-3323
LIVINGSTON COUNTYMadison Street*521 West Madison Street815-844-3171
Pontiac Main*223 North Mill Street815-844-3171
Pontiac West*Route 116 & Route 66815-844-3171
MCLEAN COUNTYBrickyard Drive - Bloomington*#1 Brickyard Drive Suite 301309-661-9993
Gridley325 Center Street309-747-2100
Towanda Plaza - Bloomington*1218 Towanda Avenue888-876-2638
RICHLAND COUNTYOlney*240 East Chestnut Street618-395-8676
Olney*1110 South West Street618-395-2112
VERMILION COUNTYDanvilleOne Towne Center217-442-0362
Danville Motor Bank*101 West Main Street217-443-3519
Danville*2750 North Vermilion Street217-431-8750
Danville*901 North Gilbert Street217-431-3486
Danville*421 South Gilbert Street217-477-4510
Ridge Farm*11 South State Street217-247-2126
Westville*101 East Main Street217-267-2147
WAYNE COUNTYFairfield*303 West Delaware618-842-2145
Morris Plan Banking Center 817 Wabash Avenue812-238-6063
INSURANCE Forrest Sherer Insurance of Terre Haute24 North Ohio Street812-232-0441
1219 Ohio Street812-232-0441
Forrest Sherer Insurance of Evansville7525 East Virginia Street812-232-0441
*First Plus 24-hour ATM available at these locations
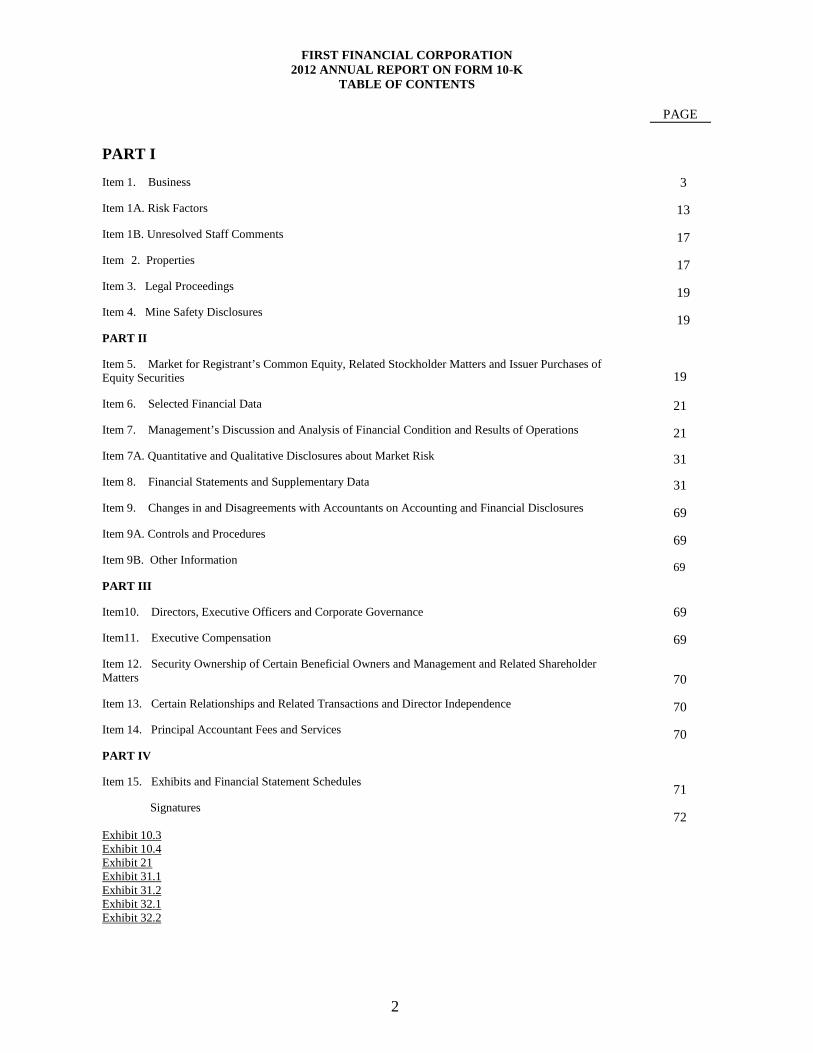
16 new service locationsnew personal banking customers
new service locations
WAYNE
KNOX
JAPSER CRAWFORD
SULLIVANGREENE
CLAY
PUTNAMPARKE
VIGO
CLARK
Greencastle
Marshall
MontezumaRockville
Poland
Clay City
Terre Haute
Carlisle
FarmersburgHymera
RobinsonOblong
Olney Lawrenceville
Sandborn
Vincennes
F
West Terre Haute
MCLEAN
LIVINGSTON
Brickyard Drive-Bloomington
Champaign
Pontiac Main
Mahomet
Urbana
Gridley
CHAMPAIGN
DanvilleWestville
Ridge Farm
VERMILLION
Newport
Clinton
Cayuga
COLESCharleston
VANDERBURG
GIBSONPrinceton
Evansville
DAVIESSWashington
Worthington
LAWRENCERICHLAND
Newton
Pontiac West
Madison Street
Towanda Plaza-Bloomington
Robinson Motor Bank
Brazil Dwntn
SeelyvilleBrazil
Brazil Eastside
Honey Creek Mall
Marshall
DuggerSullivan
Rosedale
WAYNE
KNOX
JASPER CRAWFORD
SULLIVANGREENE
CLAY
PUTNAMPARKE
VIGO
CLARK
Greencastle
Marshall
MontezumaRockville
Clay City
Terre Haute
FarmersburgHymera
Oblong
Olney LawrencevilleSandborn
Vincennes
F
West Terre Haute
MCLEAN
LIVINGSTON
Bloomington
Pontiac
Mahomet
Gridley
CHAMPAIGN
DanvilleWestville
Ridge Farm
VERMILION
Newport
Clinton
Cayuga
COLESCharleston
VANDERBURGH
GIBSONPrinceton
Evansville
DAVIESSWashington
Worthington
LAWRENCERICHLAND
Newton Robinson
SeelyvilleBrazil
Marshall
DuggerSullivan
Rosedale
Urbana
Champaign VERMILLION
4,000
16
new or upgraded ATMs

First Financial corporation | 2012 annual report 1WWW.First-online.coM
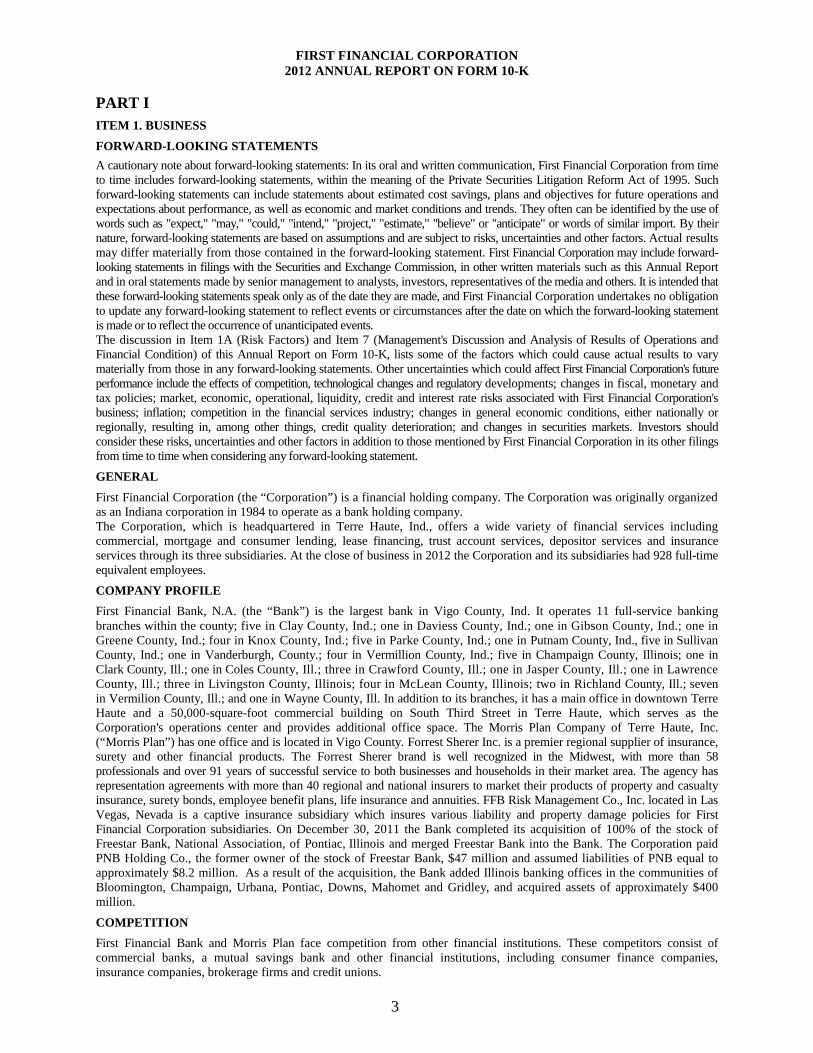
as part of our service expansion to the residents of southern indiana, First Financial was pleased to be able to purchase and renovate four integra Bank branches. the bank re-opened as First Financial in october and held a Grand opening celebration of the newly restored facilities in november. pictured here is the evansville branch located at 12600 Highway 41 north.

lette
r to
shar
ehol
ders
Dear First Financial corporation shareholDers,
We are pleased to report 2012 was another year of solid performance for First Financial corporation with
net income of $32.8 million, the second highest net income in the history of the company. While this
was a notable accomplishment in itself, it also came while the First team was successfully adding Free-
star Bank’s nearly $400 million in assets to our balance sheet; introducing our products and services in
the growth markets of champaign-urbana, Bloomington-normal and pontiac, illinois; replacing and up-
grading our entire atM delivery channel; implementing a state-of-the-art branch automation system
and opening four new branches in southern indiana. as banks across the nation struggled with a slow
economy, the costs and complications of an ever increasing regulatory burden, and declining net interest
margins, we are pleased to advise we have delivered yet another year of consistent earnings.
2012 net interest income was $108.9 million, compared to the $99.2 million reported in 2011, an increase
of $9.7 million. non-interest income increased $6.2 million to $39.5 million from the $33.3 million of the
prior year. non-interest expense increased to $93.1 million in 2012, however most of the increase results
from the costs associated with the additional salary, benefits and one-time expenses related to the
acquisition of Freestar Bank, n.a., upgrades to our technology infrastructure and the opening of four new
banking centers in southern indiana. Book value per share at year-end 2012 was $28.01, a 5.9% increase
from the prior year and shareholders’ equity increased 7.3% to $372.1 million. return on assets was 1.13%.
We were pleased to deliver a dividend increase to you for the 24th consecutive year.
Maintaining our promise to be “always close to Home,” an expression of the convenience we provide to
our customers, we replaced and upgraded our entire Firstplus atM network in 2012 making all of our
atMs aDa compliant and adding new transaction capabilities. We also completed an agreement with a
convenience store chain to integrate our Firstplus atMs into store locations in indiana and illinois, allow-
ing us to offer First Financial customers surcharge-free access to their accounts while shopping in these
locations. Following a complete redesign, we launched a new website providing a customer friendly
interface enabling easier access for account management. at the same time, we launched a new mobile
banking application, enabling users to check account balances, make payments and find atM locations
while using their iphone, Blackberry or android. Finally, we purchased encore® branch automation software.
this technology will upgrade our teller and new account opening system, allowing us to better address
the needs of our customers no matter where they choose to bank with us.

2012 was another year of recognition for First Financial corporation and its associates as the company and its subsidiaries First Financial Bank and
Forrest sherer insurance were recognized for their strong and steady performance. the first quarter issue of Bank Director Magazine included First
Financial Bank in its “nifty 50” list of the best users of capital. Bank Director Magazine, on its Bank performance scorecard, ranked First Financial Bank
number 14 of 106 financial institutions in the $1 to $5 billion category based on a combination of profitability, capital strength and asset quality. in
May, seifreid & Brew llc designated First Financial Bank as a s&B top community Bank, “because of its exemplary performance of balancing risk and
reward” based on the s&B total risk/return composite ranking. in august, american Banker Magazine named First Financial Bank as one of its yearly
“standouts,” ranking it 55th among 229 mid-tier banks, based on a 3-year return on equity. We were especially gratified to receive positive recognition
from our customers as the terre Haute tribune-star and Danville commercial news reader’s choice awards again voted First Financial Bank as Best
Bank and Forrest sherer as Best insurance company.
We do not take our success for granted. it comes from thoughtful planning, steadfast implementation, uncompromised work ethic and most of all,
from the loyalty and abilities of our dedicated associates. We would like to thank our Board of Directors for their insight and support during this year
of investment and innovation as we positioned ourselves to maintain a tradition of award-winning performance. We are grateful to our customers
and the communities we serve for their support and we are particularly thankful to you, our shareholders, for your continued confidence in
First Financial corporation.
Donald e. smith
presiDent anD cHairMan
norman l. lowery
ceo anD Vice cHairMan
All this wAs Accomplished in A yeAr during which we mAde
severAl significAnt investments designed to expAnd our service AreA
And ensure thAt we mAke the improvements needed to stAy
on the leAding edge of technology for our customers And communities
First Financial corporation | 2012 annual report 3WWW.First-online.coM
high
light
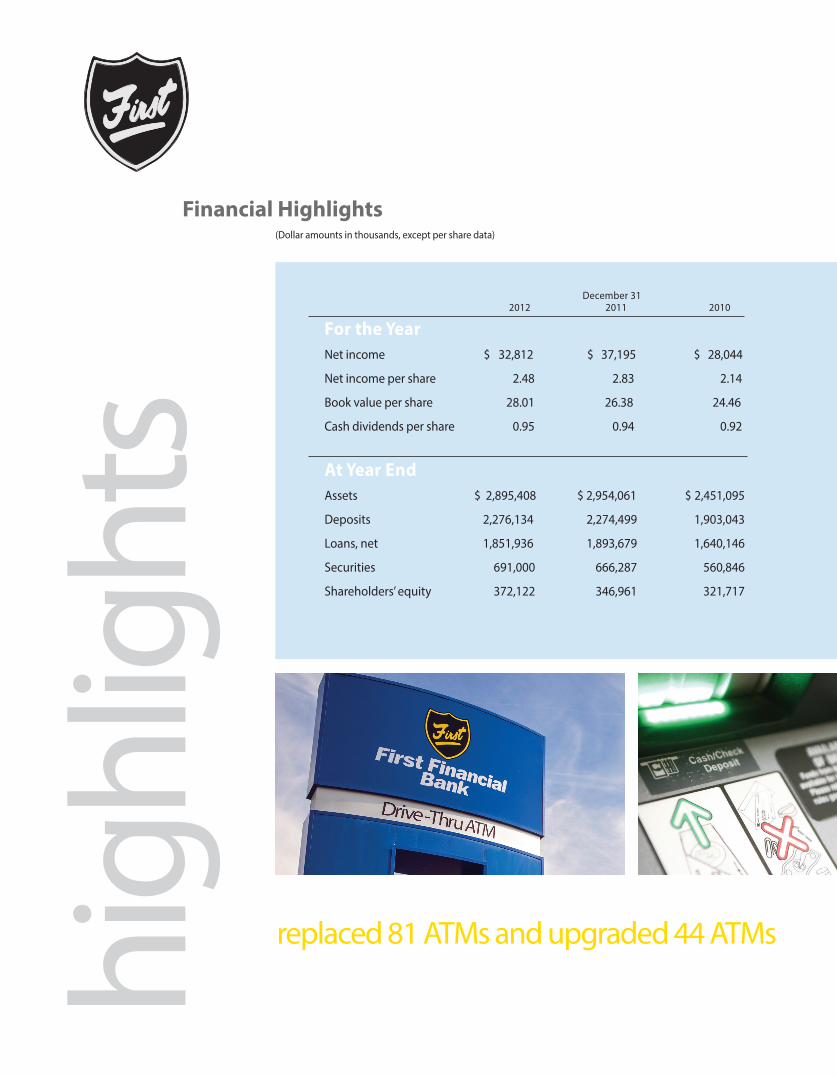
s(Dollar amounts in thousands, except per share data)
Financial highlights
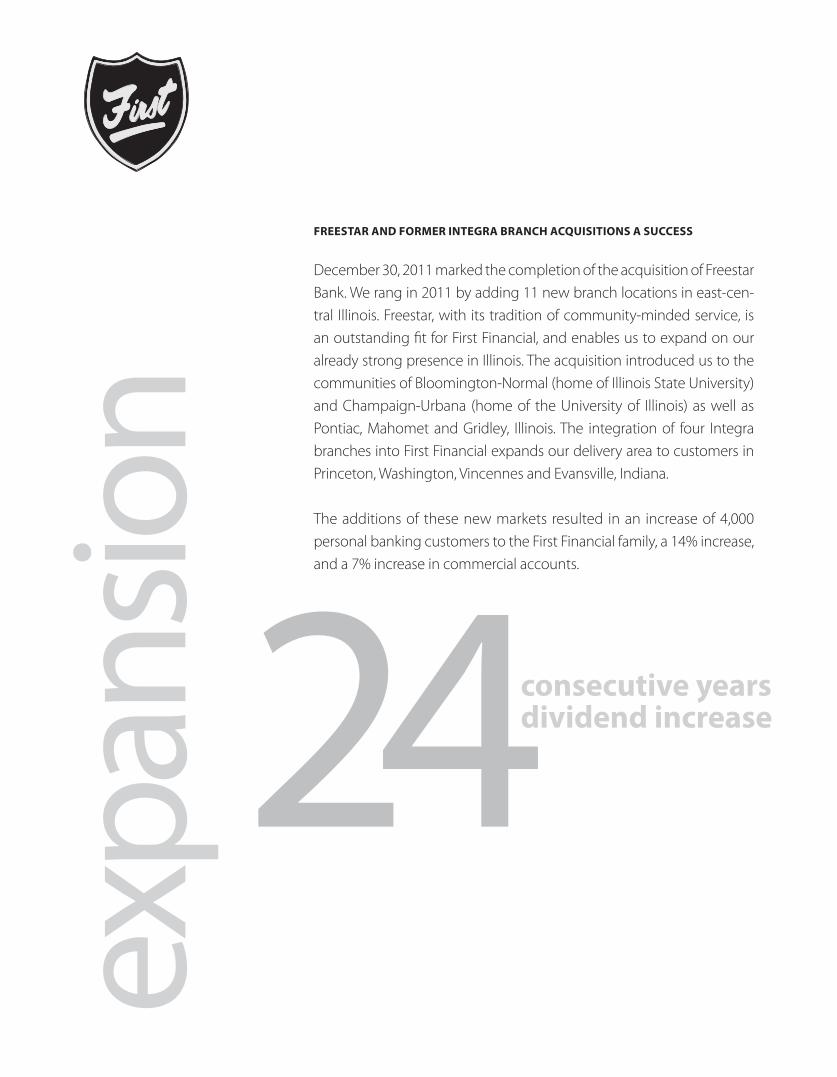
replaced 81 ATMs and upgraded 44 ATMs
December 31 2012 2011 2010
For the YearNet income $ 32,812 $ 37,195 $ 28,044
Net income per share 2.48 2.83 2.14
Book value per share 28.01 26.38 24.46
Cash dividends per share 0.95 0.94 0.92
at Year end
Assets $ 2,895,408 $ 2,954,061 $ 2,451,095
Deposits 2,276,134 2,274,499 1,903,043
Loans, net 1,851,936 1,893,679 1,640,146
Securities 691,000 666,287 560,846
Shareholders’ equity 372,122 346,961 321,717

First Financial corporation | 2012 annual report 5WWW.First-online.coM
2012 finAnciAl highlights
$2,954,061
total assets$ in thousands
$2,451,095$2,518,722
$2,302,675
$2,895,408
2008
2009
2010
2011
2012
shareholDer inFormationThe common stock of First Financial Corporation is traded on the NASDAQ Global under the symbol THFF.
$2.83
earningsper share
$2.14
$1.73$1.89
$2.48
THFF
another exciting upgrade is our development of a mobile bank-ing app, which became available to customers in 2013. the app enables users to check bank balances, make payments and locate the nearest First Financial atM unit while they’re on-the-go using their iphone, Blackberry or android phone.
$2,895,40820
12
2008
2009
2010
2011
2012
Freestar anD Former integra Branch acquisitions a success
December 30, 2011 marked the completion of the acquisition of Freestar Bank. We rang in 2011 by adding 11 new branch locations in east-cen-tral illinois. Freestar, with its tradition of community-minded service, is an outstanding fit for First Financial, and enables us to expand on our already strong presence in illinois. the acquisition introduced us to the communities of Bloomington-normal (home of illinois state university) and champaign-urbana (home of the university of illinois) as well as pontiac, Mahomet and Gridley, illinois. the integration of four integra branches into First Financial expands our delivery area to customers in princeton, Washington, Vincennes and evansville, indiana.
the additions of these new markets resulted in an increase of 4,000 personal banking customers to the First Financial family, a 14% increase, and a 7% increase in commercial accounts.
24
expa
nsio
n
consecutive years dividend increase

expAnsion grows first finAnciAl fAmily
First Financial corporation | 2012 annual report 7WWW.First-online.coM

impr
ovem
ent
WeBsite reDesign commissioneD
customers can expect a whole new look for First Financial Bank online in 2013, thanks to the redevelopment and redesign of the website, which the bank undertook in 2012. We’re excited about the updated appearance; however, we are even more excited about the new online capabilities it brings to customers. the new site makes it easier for customers to execute a variety of transactions by improving the convenience and functionality of the online banking experience.
an added Quicken®/Quickbooks® interface gives customers secure access to their First Financial accounts and the ability to download transactions and account information directly into their Quicken® financial manage-ment program. enhanced online capabilities for commercial customers include the ability to execute online wire transfers.
teller/platForm sYstem upgraDeD
improved technology + increased efficiency = better service. that is an equation we believe in at First Financial as evidenced by investment in the encore® branch automation system, from Harland Financial solutions. the new system streamlines teller transaction processing and new account opening to reduce time-consuming operational functions. this enables tellers to focus on what they do best—providing outstanding service. moBile BanKing arriVes
another exciting upgrade for 2013 is the development of a mobile banking app which enables customers to use their iphone, Blackberry or android phone to check balances, make payments and locate the nearest First Financial atM while they are on-the-go. customers’ banking transactions and privacy information are always as safe and secure as possible with reinforced security features. as we continue to refine and improve online capabilities, we are also making it possible to meet customer needs with the potential to add services like person-to-person payments and personal online deposits in the near future.
First Financial corporation | 2012 annual report 9WWW.First-online.coM
improvements mAke An impAct

events Bring communities together
this year’s “Food for Friends” drive was once again successful in collecting food and household supplies for hundreds of area families in need. “Food for Friends,” now in its fourth year of operation, is a First Financial collaboration with area food banks to aid in collecting and distributing much-needed food items for families in the communities we serve. this year Food for Friends expands with collection barrels for non-perishable foods placed in the western region banking centers.
atm upgraDes
in 2012, we upgraded or replaced all atMs. to facilitate this initiative, we conducted a comprehensive review of existing technology and locations to ensure the investment delivers the highest possible value to customers in terms of conve-nience and functionality. this review guided decisions to replace 81 and upgrade 44 atMs in 2012.
all First Financial atMs are now aDa-compliant, providing lower screen height for greater wheelchair accessibility at non-drive-thru locations, as well as voice guid-ance, Braille signage and input controls for visually-impaired individuals. they also have larger, color screens, clearer backgrounds, and enhanced readability.
Many of the new atMs feature the added functionality of sDM (scalable Deposit Module) check and cash processing that enables customers to deposit both cash and checks through a single slot without a deposit slip or envelope, offering greater convenience and transaction speed. the new technology has an added benefit, improving operational and cost efficiencies for the bank, along with a greener process due to reduction of paper waste.
Bringing You more
First Financial is constantly developing new products and services designed to make banking with us easier and more convenient than ever, including:
• Merchant capture system• social security direct deposits• Bundled/relationship accounts/pricing• innovative “automated teller” drive-up units – freestanding• reloadable, pre-paid debit cards • “start Fresh” account for customers who may not qualify for traditional checking accounts
inve
stm
ent

First Financial corporation | 2012 annual report 11WWW.First-online.coMWWW.First-online.coM
Both the clay county YMca and terre Haute Boys & Girls club took kids fish-ing with First Financial as part of our community service activities for youth.
First Financial once again sponsored many community-based events including the Vigo and sullivan county 4-H fairs, the pontiac rodeo and the pontiac Homecoming pork chop Dinner, both as an institution and through the volunteer efforts of employees.
First Financial Bank is proud to support local law enforcement at the annual police awards Dinner, hosted this year at indiana state university. national night out promotes greater community awareness of the issues of crime prevention and public safety; once again, First Financial Bank exhibited its support through sponsorship.
investments pAy off for customers

First Financial corporation | 2012 annual report 12
BoArd of directors
DirectorsFirst Financial Corporation and First Financial BankW. curtis BrightonB. Guille cox, Jr.thomas t. Dinkelanton Hulman GeorgeGregory l. GibsonWilliam r. Krieblenorman l. loweryronald K. richDonald e. smithVirginia l. smithWilliam J. Voges
The Morris Plan Companyof Terre Haute Inc.David l. BaileyJeffrey G. Belskusthomas s. claryMark J. Fusonnorman D. loweryJames F. nasserJeffrey B. smith
seated, (left to right): William r. Krieble, norman l. lowery, Donald e. smith, thomas t. Dinkel and anton H. Georgestanding, (left to right): B. Guille cox, Jr., Virginia l. smith, William J. Voges, Gregory l. Gibson, W. curtis Brighton and ronald K. rich
Forrest Sherer Inc.John W. DinkelJ. Barton Douglasnorman l. loweryJohn s. lukensDavid W. MariettaDennis s. MichaelJerry r. Muellerrobert F. prox iii
communitY DirectorsFirst Financial Bank, Clay RegionDavid l. BarrJames e. Brown (emeritus)sam J. emmertMax Gibsonrodger a. McHargueJohn p. stelle
First Financial Bank, Citizens RegionHenry J. antoninirobert DeVerterDanny F. Weschterri M. Williamson
First Financial Bank, Community Regionnorman D. loweryavery J. McKinneyV. Bruce WalkupJeffery l. Wilson
First Financial Bank, Crawford RegionJerry l. BaileyW.J. chamblinnorman D. lowerysteven a. McGaheyV. Bruce Walkup
First Financial Bank, Marshall RegionFred s. BarthWilliam F. Meehlingnorman p. Yeley
First Financial Bank, Parke RegionJames r. Bosleythomas s. clarycharles a. cooper
First Financial Bank, Sullivan Regionthomas s. claryrobert F. DukesHenry t. smithrobert e. springerV. Bruce Walkup
WWW.First-online.coM
UNITED STATES SECURITIES AND EXCHANGE COMMISSION
Washington, D.C. 20549
FORM 10-K ANNUAL REPORT PURSUANT TO SECTION 13 OR 15(d) OF THE SECURITIES EXCHANGE ACT OF
1934 For the fiscal year ended December 31, 2012
OR TRANSITION REPORT PURSUANT TO SECTION 13 OR 15(d) OF THE SECURITIES EXCHANGE ACT
OF 1934 For the transition period from _________ to ___________
Commission file number 0-16759 FIRST FINANCIAL CORPORATION
(Exact name of registrant as specified in its charter)
INDIANA 35-1546989 (State of Incorporation) (I.R.S. Employer Identification Number)
One First Financial Plaza Terre Haute, Indiana
47807
(Address of Registrant’s Principal Executive Offices) (Zip Code) (812) 238-6000
(Registrant’s Telephone Number, Including Area Code) Securities registered pursuant to Section 12(b) of the Act:
Title of each class Name of Exchange on Which Registered Common Stock, no par value
The NASDAQ Stock Market LLC (NASDAQ Global Select Market)
Securities registered pursuant to Section 12(g) of the Act: None
Indicate by check mark if the registrant is a well-known-seasoned issuer, as defined in Rule 405 of the Securities Act. Yes No
Indicate by check mark if the registrant is not required to file reports pursuant to Section 13 or Section 15(d) of the Act. Yes No
Indicate by check mark whether the registrant (1) has filed all reports required to be filed by Section 13 or 15(d) of the Securities Exchange Act of 1934 during the preceding 12 months (or for such shorter period that the registrant was required to file such reports), and (2) has been subject to such filing requirements for the past 90 days. Yes No
Indicate by check mark whether the registrant has submitted electronically and posted on its corporate Web site, if any, every Interactive Data File required to be submitted and posted pursuant to Rule 405 of Regulation S-T (§ 232.405 of this chapter) during the preceding 12 months (or for such shorter period that the registrant was required to submit and post such files). Yes No
Indicate by check mark if disclosure of delinquent filers pursuant to Item 405 of Regulation S-K is not contained herein, and will not be contained, to the best of registrant’s knowledge, in definitive proxy or information statements incorporated by reference in Part III of this Form 10-K or any amendment to this Form 10-K.
Indicate by check mark whether the registrant is a large accelerated filer, an accelerated filer, a non-accelerated filer, or a smaller reporting company. See definition of “accelerated filer”, “large accelerated filer”, and “smaller reporting company” in Rule 12b-2 of the Exchange Act of 1934.
Large accelerated filer Accelerated filer Non-accelerated filer Smaller reporting company
Indicate by check mark whether the registrant is a shell company (as defined in Rule 12b-2 of the Act). Yes No As of June 30, 2012 the aggregate market value of the stock held by non-affiliates of the registrant based on the average bid and ask prices of such stock was $375,338,651. (For purposes of this calculation, the Corporation excluded the stock owned by certain beneficial owners and management and the Corporation’s Employee Stock Ownership Plan.)
Shares of Common Stock outstanding as of March 11, 2013—13,307,498 shares.
DOCUMENTS INCORPORATED BY REFERENCE
Portions of the Definitive Proxy Statement for the First Financial Corporation Annual Meeting of Shareholders to be held April 17, 2013 are incorporated by reference into Part III.
2
FIRST FINANCIAL CORPORATION 2012 ANNUAL REPORT ON FORM 10-K
TABLE OF CONTENTS PAGE
PART I Item 1. Business Item 1A. Risk Factors Item 1B. Unresolved Staff Comments Item 2. Properties Item 3. Legal Proceedings Item 4. Mine Safety Disclosures PART II Item 5. Market for Registrant’s Common Equity, Related Stockholder Matters and Issuer Purchases of Equity Securities Item 6. Selected Financial Data Item 7. Management’s Discussion and Analysis of Financial Condition and Results of Operations Item 7A. Quantitative and Qualitative Disclosures about Market Risk Item 8. Financial Statements and Supplementary Data Item 9. Changes in and Disagreements with Accountants on Accounting and Financial Disclosures Item 9A. Controls and Procedures Item 9B. Other Information PART III Item10. Directors, Executive Officers and Corporate Governance Item11. Executive Compensation Item 12. Security Ownership of Certain Beneficial Owners and Management and Related Shareholder Matters Item 13. Certain Relationships and Related Transactions and Director Independence Item 14. Principal Accountant Fees and Services PART IV Item 15. Exhibits and Financial Statement Schedules Signatures Exhibit 10.3 Exhibit 10.4 Exhibit 21 Exhibit 31.1 Exhibit 31.2 Exhibit 32.1 Exhibit 32.2
3 13 17 17 19 19 19 21 21 31 31 69 69 69 69 69 70 70 70 71 72
3
FIRST FINANCIAL CORPORATION 2012 ANNUAL REPORT ON FORM 10-K
PART I
ITEM 1. BUSINESS
FORWARD-LOOKING STATEMENTS A cautionary note about forward-looking statements: In its oral and written communication, First Financial Corporation from time to time includes forward-looking statements, within the meaning of the Private Securities Litigation Reform Act of 1995. Such forward-looking statements can include statements about estimated cost savings, plans and objectives for future operations and expectations about performance, as well as economic and market conditions and trends. They often can be identified by the use of words such as "expect," "may," "could," "intend," "project," "estimate," "believe" or "anticipate" or words of similar import. By their nature, forward-looking statements are based on assumptions and are subject to risks, uncertainties and other factors. Actual results may differ materially from those contained in the forward-looking statement. First Financial Corporation may include forward-looking statements in filings with the Securities and Exchange Commission, in other written materials such as this Annual Report and in oral statements made by senior management to analysts, investors, representatives of the media and others. It is intended that these forward-looking statements speak only as of the date they are made, and First Financial Corporation undertakes no obligation to update any forward-looking statement to reflect events or circumstances after the date on which the forward-looking statement is made or to reflect the occurrence of unanticipated events. The discussion in Item 1A (Risk Factors) and Item 7 (Management's Discussion and Analysis of Results of Operations and Financial Condition) of this Annual Report on Form 10-K, lists some of the factors which could cause actual results to vary materially from those in any forward-looking statements. Other uncertainties which could affect First Financial Corporation's future performance include the effects of competition, technological changes and regulatory developments; changes in fiscal, monetary and tax policies; market, economic, operational, liquidity, credit and interest rate risks associated with First Financial Corporation's business; inflation; competition in the financial services industry; changes in general economic conditions, either nationally or regionally, resulting in, among other things, credit quality deterioration; and changes in securities markets. Investors should consider these risks, uncertainties and other factors in addition to those mentioned by First Financial Corporation in its other filings from time to time when considering any forward-looking statement.
GENERAL
First Financial Corporation (the “Corporation”) is a financial holding company. The Corporation was originally organized as an Indiana corporation in 1984 to operate as a bank holding company. The Corporation, which is headquartered in Terre Haute, Ind., offers a wide variety of financial services including commercial, mortgage and consumer lending, lease financing, trust account services, depositor services and insurance services through its three subsidiaries. At the close of business in 2012 the Corporation and its subsidiaries had 928 full-time equivalent employees.
COMPANY PROFILE
First Financial Bank, N.A. (the “Bank”) is the largest bank in Vigo County, Ind. It operates 11 full-service banking branches within the county; five in Clay County, Ind.; one in Daviess County, Ind.; one in Gibson County, Ind.; one in Greene County, Ind.; four in Knox County, Ind.; five in Parke County, Ind.; one in Putnam County, Ind., five in Sullivan County, Ind.; one in Vanderburgh, County.; four in Vermillion County, Ind.; five in Champaign County, Illinois; one in Clark County, Ill.; one in Coles County, Ill.; three in Crawford County, Ill.; one in Jasper County, Ill.; one in Lawrence County, Ill.; three in Livingston County, Illinois; four in McLean County, Illinois; two in Richland County, Ill.; seven in Vermilion County, Ill.; and one in Wayne County, Ill. In addition to its branches, it has a main office in downtown Terre Haute and a 50,000-square-foot commercial building on South Third Street in Terre Haute, which serves as the Corporation's operations center and provides additional office space. The Morris Plan Company of Terre Haute, Inc. (“Morris Plan”) has one office and is located in Vigo County. Forrest Sherer Inc. is a premier regional supplier of insurance, surety and other financial products. The Forrest Sherer brand is well recognized in the Midwest, with more than 58 professionals and over 91 years of successful service to both businesses and households in their market area. The agency has representation agreements with more than 40 regional and national insurers to market their products of property and casualty insurance, surety bonds, employee benefit plans, life insurance and annuities. FFB Risk Management Co., Inc. located in Las Vegas, Nevada is a captive insurance subsidiary which insures various liability and property damage policies for First Financial Corporation subsidiaries. On December 30, 2011 the Bank completed its acquisition of 100% of the stock of Freestar Bank, National Association, of Pontiac, Illinois and merged Freestar Bank into the Bank. The Corporation paid PNB Holding Co., the former owner of the stock of Freestar Bank, $47 million and assumed liabilities of PNB equal to approximately $8.2 million. As a result of the acquisition, the Bank added Illinois banking offices in the communities of Bloomington, Champaign, Urbana, Pontiac, Downs, Mahomet and Gridley, and acquired assets of approximately $400 million.
COMPETITION
First Financial Bank and Morris Plan face competition from other financial institutions. These competitors consist of commercial banks, a mutual savings bank and other financial institutions, including consumer finance companies, insurance companies, brokerage firms and credit unions.
4
The Corporation's business activities are centered in west-central Indiana and east-central Illinois. The Corporation has no foreign activities other than periodically investing available funds in time deposits held in foreign branches of domestic banks. REGULATION AND SUPERVISION
The Corporation and its subsidiaries operate in highly regulated environments and are subject to supervision and regulation by several governmental regulatory agencies, including the Board of Governors of the Federal Reserve System (the "Federal Reserve"), the Office of the Comptroller of the Currency (the “OCC”), the Federal Deposit Insurance Corporation (the “FDIC”), and the Indiana Department of Financial Institutions (the “DFI”). The laws and regulations established by these agencies are generally intended to protect depositors, not shareholders. Changes in applicable laws, regulations, governmental policies, income tax laws and accounting principles may have a material effect on the Corporation’s business and prospects. The following summary is qualified by reference to the statutory and regulatory provisions discussed. The Dodd-Frank Act On July 21, 2010, financial regulatory reform legislation entitled the “Dodd-Frank Wall Street Reform and Consumer Protection Act” (the “Dodd-Frank Act”) was signed into law. The Dodd-Frank Act implements far-reaching changes across the financial industry, including provisions that, among other things, will:
• Centralize responsibility for consumer financial protection by creating a new agency, the Consumer Financial Protection Bureau, responsible for implementing, examining, and enforcing compliance with federal consumer financial laws.
• Create the Financial Stability Oversight Council that will recommend to the Federal Reserve increasingly strict rules for capital, leverage, liquidity, risk management, and other requirements as companies grow in size and complexity.
• Apply the same leverage and risk-based capital requirements that apply to insured depository institutions to most bank holding companies.
• Require financial holding companies to be well capitalized and well managed. Impose more stringent capital on bank holding companies and subject certain activities, including interstate mergers and acquisitions, to higher capital conditions.
• Restrict the preemption of state law by federal law and disallow subsidiaries and affiliates of national banks from availing themselves of such preemption.
• Provide mortgage reform provisions regarding a customer’s ability to repay, restricting variable-rate lending by requiring that the ability to repay variable-rate loans be determined by using the maximum rate that will apply during the first five years of a variable-rate loan term, and making more loans subject to provisions for higher cost loans and new disclosures. In addition, certain compensation for mortgage brokers based on certain loan terms will be restricted.
• Require financial institutions to make a reasonable and good faith determination that borrowers have the ability to repay loans for which they apply. If a financial institution fails to make such a determination, a borrower can assert this failure as a defense to foreclosure.
• Require financial institutions to retain a specified percentage (5% or more) of certain non-traditional mortgage loans and other assets in the event that they seek to securitize such assets.
• Change the assessment base for federal deposit insurance from the amount of insured deposits to consolidated assets less tangible capital, eliminate the ceiling on the size of the Deposit Insurance Fund (“DIF”), and increase the floor on the size of the DIF, which generally will require an increase in the level of assessments for institutions with assets in excess of $10 billion.
• Make permanent the $250,000 limit for federal deposit insurance. • Implement corporate governance revisions, including with regard to executive compensation, say on pay
votes, proxy access by shareholders, and clawback policies which apply to all public companies, not just financial institutions.
• Repeal the federal prohibitions on the payment of interest on demand deposits, thereby permitting depository institutions to pay interest on business transactions and other accounts.
• Amend the Electronic Fund Transfer Act (“EFTA”) to, among other things, give the Federal Reserve the authority to establish rules regarding interchange fees charged for electronic debit transactions by payment card issuers having assets over $10 billion and to enforce a new statutory requirement that such fees be reasonable and proportional to the actual cost of a transaction to the issuer.
• Limit the hedging activities and private equity investments that may be made by various financial institutions.
The Consumer Financial Protection Bureau (the “CFPB”), created by the Dodd-Frank Act as discussed above, is responsible for administering federal consumer financial protection laws. The CFPB, which began operations on July 21, 2011, is an independent bureau within the Federal Reserve and has broad rule-making, supervisory and examination
5
authority to set and enforce rules in the consumer protection area over financial institutions that have assets of $10 billion or more. The CFPB also has data collecting powers for fair lending purposes for both small business and mortgage loans, as well as authority to prevent unfair, deceptive and abusive practices.
Although many aspects of the Dodd-Frank Act remain subject to rulemaking, several provisions of the Dodd-Frank Act have been implemented. In addition to the establishment of the CFPB, the Federal Reserve Board’s final rule implementing the Dodd-Frank Act’s “Durbin Amendment,” which limits debit card interchange fees, was issued on July 21, 2011 for transactions occurring after September 30, 2011. The final rule established a cap on the fees banks with more than $10 billion in assets can charge merchants for debit card transactions. The fee was set at $0.21 per transaction plus an additional 5 bps of the transaction amount and $0.01 to cover fraud losses. The Federal Reserve Board also repealed Regulation Q as mandated by the Dodd-Frank Act on July 21, 2011. Regulation Q was implemented as part of the Glass-Steagall Act in the 1930’s and provided a prohibition against the payment of interest on demand deposits.
Because full implementation of the Dodd-Frank Act will occur over several years, it is difficult to anticipate the overall financial impact on the Corporation, its customers or the financial industry generally. However, the impact is expected to be substantial and may have an adverse impact on the Corporation’s financial performance and growth opportunities. Provisions in the legislation that affect the payment of interest on demand deposits and interchange fees are likely to increase the costs associated with deposits as well as place limitations on certain revenues those deposits may generate. Provisions in the legislation that require revisions to the capital requirements of financial institutions could require the Corporation and its financial institution subsidiaries to seek other sources of capital in the future.
BASEL III In December 2010 and January 2011, the Basel Committee published the final texts of reforms on capital and liquidity generally referred to as “Basel III.” Although Basel III is intended to be implemented by participating countries for large, internationally active banks, its provisions are likely to be considered by United States banking regulators in developing new regulations applicable to other banks in the United States, including the Bank. For banks in the United States, among the most significant provisions of Basel III concerning capital are the following:
• a minimum ratio of common equity to risk-weighted assets reaching 4.5%, plus an additional 2.5% as a capital conservation buffer, by 2019 after a phase-in period;
• a minimum ratio of Tier 1 capital to risk-weighted assets reaching 6.0% by 2019 after a phase-in period;
• a minimum ratio of total capital to risk-weighted assets, plus the additional 2.5% capital conservation buffer,
reaching 10.5% by 2019 after a phase-in period;
• an additional countercyclical capital buffer to be imposed by applicable national banking regulators periodically at their discretion, with advance notice;
• restrictions on capital distributions and discretionary bonuses applicable when capital ratios fall within the buffer
zone;
• deduction from common equity of deferred tax assets that depend on future profitability to be realized; and
• increased capital requirements for counterparty credit risk relating to over the counter derivatives, repos and securities financing activities..
The Basel III provisions on liquidity include complex criteria establishing the liquidity coverage ratio (“LCR”) and the net stable funding ratio (“NSFR”). The purpose of the LCR is to ensure that a bank maintains adequate unencumbered, high quality liquid assets to meet its liquidity needs for 30 days under a severe liquidity stress scenario. The purpose of the NSFR is to promote more medium and long-term funding of assets and activities, using a one-year horizon. Although Basel III is described as a “final text,” it is subject to the resolution of certain issues and to further guidance and modification, as well as to adoption by United States banking regulators, including decisions as to whether and to what extent it will apply to United States banks that are not large, internationally active banks. On June 7, 2012, the federal bank regulatory agencies issued a series of proposed rules that would revise their risk-based and leverage capital requirements and their method for calculating risk-weighted assets to make them consistent with Basel III and certain provisions of the Dodd-Frank Act. The three separate but related proposals are: (i) the “Basel III Proposal,” which applies the Basel III capital framework to almost all U.S. banking organizations; (ii) the “Standardized Approach Proposal,” which applies certain elements of the Basel II standardized approach for credit risk weightings to almost all U.S. banking organizations; and (iii) the “Advanced Approaches Proposal,” which applies changes made to Basel II and Basel III in the past few years to large U.S. banking organizations subject to the advanced Basel II capital framework. The proposed rules would apply to all depository institutions, top-tier bank holding companies with total
6
consolidated assets of $500 million or more, and top-tier savings and loan holding companies (“banking organizations”). The comment period for these notices of proposed rulemaking ended October 22, 2012. Among other things, the proposed rules establish a new Common Equity Tier 1 minimum capital requirement of 4.5% and a higher minimum Tier 1 capital requirement of 6.0%. The proposed rules limit a banking organization’s capital distributions and certain discretionary bonus payments if the banking organization does not hold a “capital conservation buffer” consisting of a specified amount of Common Equity Tier 1 capital in addition to the amount necessary to meet its minimum risk-based capital requirements. The Basel III implementation proposal provides for a number of deductions from and adjustments to CET1. These include, for example, the requirement that mortgage servicing rights, deferred tax assets dependent upon future taxable income and significant investments in non-consolidated financial entities be deducted from CET1 to the extent that any one such category exceeds 10% of CET1 or all such categories in the aggregate exceed 15% of CET1. Under current capital standards, the effects of accumulated other comprehensive income items included in capital are excluded for the purposes of determining regulatory capital ratios. Under the Basel III Proposal, the effects of certain accumulated other comprehensive items are not excluded, which could result in significant variations in the level of capital depending upon the impact of interest rate fluctuations on the fair value of the Corporation’s securities portfolio. The Basel III Proposal also requires the phase-out of certain hybrid securities, such as trust preferred securities, as Tier 1 capital of bank holding companies in equal installments between 2013 and 2016. Trust preferred securities no longer included in Tier 1 capital may nonetheless be included as a component of Tier 2 capital. Implementation of the deductions and other adjustments to CET1 will begin on January 1, 2014 and will be phased-in over a five-year period (20% per year). The implementation of the capital conservation buffer will begin on January 1, 2016 at the 0.625% level and be phased in over a four-year period (increasing by that amount on each subsequent January 1, until it reaches 2.5% on January 1, 2019). The Basel III implementation proposal would also revise the “prompt corrective action” regulations described below by (i) introducing a CET1 ratio requirement at each level (other than critically undercapitalized), with the required CET1 ratio being 6.5% for well-capitalized status; (ii) increasing the minimum Tier 1 capital ratio requirement for each category, with the minimum Tier 1 capital ratio for well-capitalized status being 8% (as compared to the current 6%); and (iii) eliminating the current provision that provides that a bank with a composite supervisory rating of 1 may have a 3% leverage ratio and still be adequately capitalized. The Basel III proposal does not change the total risk-based capital requirement for any category. In addition to the changes in capital requirements included within the Basel III Proposal, the Standardized Approach Proposal revises a large number of the risk weights (or their methodologies) for bank assets that are used to determine the capital ratios. For nearly every class of assets, the proposal requires a more complex, detailed and calibrated assessment of credit risk and calculation of risk weightings. For example, under the current risk-weighting rules, residential mortgages have a risk weighting of 50%. Under the proposed new rules, two categories of residential mortgage lending would be created: (i) traditional lending would be category 1, where the risk weights range from 35 to 100%; and (ii) nontraditional loans would fall within category 2, where the risk weights would range from 50 to 150%. Because of the number of comments received by the regulatory agencies on the proposals discussed above, the regulatory agencies have indicated that the date for the implementation of the proposed Basel III rules has been delayed . At this time it is unclear when the Basel III regime will become effective in the United States, no guarantee that the proposals will be adopted in their current form, what changes may be made before adoption, or when ultimate adoption will occur. Requirements to maintain higher levels of capital or to maintain higher levels of liquid assets could adversely impact the Corporation’s net income and return on equity. The Corporation The Bank Holding Company Act. Because the Corporation owns all of the outstanding capital stock of the Bank, it is registered as a bank holding company under the federal Bank Holding Company Act of 1956 (“Act”) and is subject to periodic examination by the Federal Reserve and required to file periodic reports of its operations and any additional information that the Federal Reserve may require. Investments, Control, and Activities. With some limited exceptions, the Bank Holding Company Act requires every bank holding company to obtain the prior approval of the Federal Reserve before acquiring another bank holding company or acquiring more than five percent of the voting shares of a bank (unless it already owns or controls the majority of such shares). Bank holding companies are prohibited, with certain limited exceptions, from engaging in activities other than those of banking or of managing or controlling banks. They are also prohibited from acquiring or retaining direct or indirect ownership or control of voting shares or assets of any company which is not a bank or bank holding company, other than subsidiary companies furnishing services to or performing services for their subsidiaries, and other subsidiaries engaged in
7
activities which the Federal Reserve determines to be so closely related to banking or managing or controlling banks as to be incidental to these operations. The Bank Holding Company Act does not place territorial restrictions on the activities of such nonbanking-related activities. Bank holding companies which meet certain management, capital, and Community Reinvestment Act of 1977 (“CRA”) standards may elect to become a financial holding company, which would allow them to engage in a substantially broader range of nonbanking activities than is permitted for a bank holding company, including insurance underwriting and making merchant banking investments in commercial and financial companies. The Corporation does not currently plan to engage in any activity other than owning the stock of the Bank. Gramm-Leach-Bliley Financial Modernization Act. The Corporation is a financial holding company (“FHC”) within the meaning of the Act. This Act restricts the business of FHC’s to financial and related activities. The Gramm-Leach-Bliley Financial Modernization Act of 1999 (“GLB Act”), which amended the , provides the following:
•
it allows bank holding companies that qualify as “financial holding companies” to engage in a broad range of financial and related activities;
• it allows insurers and other financial services companies to acquire banks;
•
it removes various restrictions that applied to bank holding company ownership of securities firms and mutual fund advisory companies; and
•
it establishes the overall regulatory structure applicable to bank holding companies that also engage in insurance and securities operations.
As a qualified FHC, the Corporation is eligible to engage in, or acquire companies engaged in, the broader range of activities that are permitted by the GLB Act. These activities include those that are determined to be “financial in nature,” including insurance underwriting, securities underwriting and dealing, and making merchant banking investments in commercial and financial companies. If any of the Corporation’s banking subsidiaries ceases to be “well capitalized” or “well managed” under applicable regulatory standards, the Federal Reserve Board may, among other things, place limitations on the Corporation’s ability to conduct these broader financial activities or, if the deficiencies persist, require the divestiture of the banking subsidiary. In addition, if any of the Corporation’s banking subsidiaries receives a rating of less than satisfactory under the Community Reinvestment Act of 1977 (“CRA”), the Corporation would be prohibited from engaging in any additional activities other than those permissible for bank holding companies that are not financial holding companies. The Corporation’s banking subsidiaries currently meet these capital, management and CRA requirements. Capital Adequacy Guidelines for Bank Holding Companies. The Federal Reserve, as the regulatory authority for bank holding companies, has adopted capital adequacy guidelines for bank holding companies. Bank holding companies with assets in excess of $500 million must comply with the Federal Reserve's risk-based capital guidelines which require a minimum ratio of total capital to risk-weighted assets (including certain off-balance sheet activities such as standby letters of credit) of 8%. At least half of the total required capital must be "Tier 1 capital", consisting principally of common stockholders' equity, non-cumulative perpetual preferred stock, a limited amount of cumulative perpetual preferred stock and minority interest in the equity accounts of consolidated subsidiaries, less certain goodwill items. The remainder ("Tier 2 capital") may consist of a limited amount of subordinated debt and intermediate-term preferred stock, certain hybrid capital instruments and other debt securities, cumulative perpetual preferred stock, and a limited amount of the general loan loss allowance. In addition to the risk-based capital guidelines, the Federal Reserve has adopted a Tier 1 (leverage) capital ratio under which the bank holding company must maintain a minimum level of Tier 1 capital to average total consolidated assets of 3% in the case of bank holding companies which have the highest regulatory examination ratings and are not contemplating significant growth or expansion. All other bank holding companies are expected to maintain a ratio of at least 1% to 2% above the stated minimum. Certain regulatory capital ratios for the Corporation as of December 31, 2012, are shown below: Tier 1 Capital to Risk-Weighted Assets 15.38% Total Risk Based Capital to Risk-Weighted Asset 16.37% Tier 1 Leverage Ratio 11.43% Dividends. The Federal Reserve's policy is that a bank holding company experiencing earnings weakness should not pay cash dividends exceeding its net income or which could only be funded in ways that weaken the bank holding company's financial health, such as by borrowing. Additionally, the Federal Reserve possesses enforcement powers over bank holding companies and their non-bank subsidiaries to prevent or remedy actions that represent unsafe or unsound practices or violations of applicable statutes and regulations. Among these powers is the ability to proscribe the payment of dividends by banks and bank holding companies.
8
Source of Strength. In accordance with Federal Reserve policy, the Corporation is expected to act as a source of financial strength to the Bank and Morris Plan and to commit resources to support the Bank and Morris Plan in circumstances in which the Corporation might not otherwise do so. Sarbanes-Oxley Act of 2002. The Sarbanes-Oxley Act of 2002 (the "Sarbanes-Oxley Act") represents a comprehensive revision of laws affecting corporate governance, accounting obligations and corporate reporting. Among other requirements, the Sarbanes-Oxley Act established: (i) requirements for audit committees of public companies, including independence and expertise standards; (ii) additional responsibilities regarding financial statements for the chief executive officers and chief financial officers of reporting companies; (iii) standards for auditors and regulation of audits; (iv) increased disclosure and reporting obligations for reporting companies regarding various matters relating to corporate governance, and (v) new and increased civil and criminal penalties for violation of the securities laws. The Bank and Morris Plan General Regulatory Supervision. The Bank is a national bank organized under the laws of the United States of America and is subject to the supervision of the OCC, whose examiners conduct periodic examinations of the Bank. The Bank must undergo regular on-site examinations by the OCC and must submit quarterly and annual reports to the OCC concerning its activities and financial condition. Morris Plan is an Indiana-chartered institution and is subject to the supervision of the FDIC and the DFI, whose examiners conduct periodic examinations of Morris Plan. Morris Plan must undergo regular on-site examinations by the FDIC and the DFI and must submit quarterly and annual reports to the FDIC and the DFI concerning its activities and financial condition. The deposits of the Bank and Morris Plan are insured by the FDIC and are subject to the FDIC's rules and regulations respecting the insurance of deposits. See "Deposit Insurance". Lending Limits. The total loans and extensions of credit to a borrower outstanding at one time and not fully secured may not exceed 15 percent of the bank's capital and unimpaired surplus. In addition, the total amount of outstanding loans and extensions of credit to any borrower outstanding at one time and fully secured by readily marketable collateral may not exceed 10 percent of the unimpaired capital and unimpaired surplus of the bank (this limitation is separate from and in addition to the above limitation). If a loan is secured by United States obligations, such as treasury bills, it is not subject to the legal lending limit. Deposit Insurance. The Dodd-Frank Act has permanently increased the maximum amount of deposit insurance for financial institutions per insured depositor to $250,000. The deposits of the Bank and Morris Plan are insured up to the applicable limits under the DIF. The FDIC maintains the DIF by assessing depository institutions an insurance premium. Pursuant to the Dodd-Frank Act, the FDIC is required to set a DIF reserve ratio of 1.35% of estimated insured deposits and is required to achieve this ratio by September 30, 2020. Also, the Dodd-Frank Act has eliminated the 1.50% ceiling on the reserve ratio and provides that the FDIC is no longer required to refund amounts in the DIF that exceed 1.50% of insured deposits. In connection with the Dodd-Frank Act’s requirement that insurance assessments be based on assets, the FDIC bases assessments on an institution’s average consolidated assets (less average tangible equity) as opposed to its deposit level. This may shift the burden of deposit premiums toward larger depository institutions which rely on funding sources other than U.S. deposits. Under the FDIC’s risk-based assessment system, insured institutions are required to pay deposit insurance premiums based on the risk that each institution poses to the DIF. An institution’s risk to the DIF is measured by its regulatory capital levels, supervisory evaluations, and certain other factors. An institution’s assessment rate depends upon the risk category to which it is assigned. As noted above, pursuant to the Dodd-Frank Act, the FDIC will calculate an institution’s assessment level based on its total average consolidated assets during the assessment period less average tangible equity (i.e., Tier 1 capital) as opposed to an institution’s deposit level which was the previous basis for calculating insurance assessments. Pursuant to the Dodd-Frank Act, institutions will be placed into one of four risk categories for purposes of determining the institution’s actual assessment rate. The FDIC will determine the risk category based on the institution’s capital position (well capitalized, adequately capitalized, or undercapitalized) and supervisory condition (based on exam reports and related information provided by the institution’s primary federal regulator). The Bank paid a total FDIC assessment of $1.88 million and Morris Plan paid a total FDIC assessment of $34 thousand in 2012. During 2009, the FDIC adopted a rule requiring each insured institution to prepay on December 30, 2009 the estimated amount of its quarterly assessments for the fourth quarter of 2009 and all quarters through the end of 2012 (in addition to the regular quarterly assessment for the third quarter which was due on December 30, 2009). The prepaid amount is recorded as an asset with a zero risk weight and the institution will continue to record quarterly expenses for FDIC deposit insurance. Collection of the prepayment amount does not preclude the FDIC from changing assessment rates or revising
9
the risk-based assessment system in the future. If events cause actual assessments during the prepayment period to vary from the prepaid amount, institutions will pay excess assessments or receive a rebate of prepaid amounts not fully utilized after the collection of assessments due in June 2013. The amount of the Bank’s prepayment was $8.96 million and the amount of Morris Plan’s prepayment was $249 thousand. In addition to the FDIC insurance premiums, the Bank and the Morris Plan are required to make quarterly payments on bonds issued by the Financing Corporation (“FICO”), an agency of the Federal government established to recapitalize a predecessor deposit insurance fund. These assessments will continue until the FICO bonds are repaid. Transactions with Affiliates and Insiders. Pursuant to Sections 23A and 23B of the Federal Reserve Act and Regulation W, the Bank and Morris Plan are subject to limitations on the amount of loans or extensions of credit to, or investments in, or certain other transactions with, affiliates (including the Corporation) and insiders and on the amount of advances to third parties collateralized by the securities or obligations of affiliates. Furthermore, within the foregoing limitations as to amount, each covered transaction must meet specified collateral requirements. Compliance is also required with certain provisions designed to avoid the taking of low quality assets. The Bank and Morris Plan are also prohibited from engaging in certain transactions with certain affiliates and insiders unless the transactions are on terms substantially the same, or at least as favorable to such institution or its subsidiaries, as those prevailing at the time for comparable transactions with nonaffiliated companies. Extensions of credit by the Bank or Morris Plan to their executive officers, directors, certain principal shareholders, and their related interests must:
• be made on substantially the same terms, including interest rates and collateral, as those prevailing at the time for comparable transactions with third parties; and
• not involve more than the normal risk of repayment or present other unfavorable features. The Dodd-Frank Act also included specific changes to the law related to the definition of a “covered transaction” in Sections 23A and 23B and limitations on asset purchases from insiders. With respect to the definition of a “covered transaction,” the Dodd-Frank Act now defines that term to include the acceptance of debt obligations issued by an affiliate as collateral for an institution’s loan or extension of credit to another person or company. In addition, a “derivative transaction” with an affiliate is now deemed to be a “covered transaction” to the extent that such a transaction causes an institution or its subsidiary to have a credit exposure to the affiliate. A separate provision of the Dodd-Frank Act states that an insured depository institution may not “purchase an asset from, or sell an asset to” a bank insider (or their related interests) unless (1) the transaction is conducted on market terms between the parties and (2) if the proposed transaction represents more than 10 percent of the capital stock and surplus of the insured institution, it has been approved in advance by a majority of the institution’s non-interested directors. Dividends. Applicable law provides that a financial institution, such as the Bank or Morris Plan, may pay dividends from its undivided profits in an amount declared by its Board of Directors, subject to prior regulatory approval if the proposed dividend, when added to all prior dividends declared during the current calendar year, would be greater than the current year's net income and retained earnings for the previous two calendar years. Federal law generally prohibits the Bank or Morris Plan from paying a dividend to the Corporation if it would thereafter be undercapitalized. The FDIC may prevent a financial institution from paying dividends if it is in default of payment of any assessment due to the FDIC. In addition, payment of dividends by a bank may be prevented by the applicable federal regulatory authority if such payment is determined, by reason of the financial condition of such bank, to be an unsafe and unsound banking practice. Community Reinvestment Act. The CRA requires that the federal banking regulators evaluate the records of a financial institution in meeting the credit needs of its local community, including low and moderate income neighborhoods. These factors are also considered in evaluating mergers, acquisitions, and applications to open a branch or facility. Failure to adequately meet these criteria could result in the imposition of additional requirements and limitations on the Bank or on Morris Plan. Capital Regulations. The OCC has adopted risk-based capital ratio guidelines to which the Bank is subject. The guidelines establish a systematic analytical framework that makes regulatory capital requirements more sensitive to differences in risk profiles among banking organizations. Risk-based capital ratios are determined by allocating assets and specified off-balance sheet commitments to four risk weighted categories, with higher levels of capital being required for the categories perceived as representing greater risk. These guidelines divide a bank's capital into two tiers. The first tier (Tier 1) includes common equity, certain non-cumulative perpetual preferred stock (excluding auction rate issues) and minority interests in equity accounts of consolidated subsidiaries, less goodwill and certain other intangible assets (except mortgage servicing rights and purchased credit card relationships, subject to certain limitations). Supplementary (Tier 2) capital includes, among other items, cumulative perpetual and long-term limited-life preferred stock, mandatory convertible securities, certain hybrid
10
capital instruments, term subordinated debt and the allowance for loan and lease losses, subject to certain limitations, less required deductions. Banks are required to maintain a total risk-based capital ratio of 8%, of which 4% must be Tier 1 capital. The OCC may, however, set higher capital requirements when a bank's particular circumstances warrant. Banks experiencing or anticipating significant growth are expected to maintain capital ratios, including tangible capital positions, well above the minimum levels. In addition, the OCC established guidelines prescribing a minimum Tier 1 leverage ratio (Tier 1 capital to adjusted total assets as specified in the guidelines). These guidelines provide for a minimum Tier 1 leverage ratio of 3% for banks that meet certain specified criteria, including that they have the highest regulatory rating and are not experiencing or anticipating significant growth. All other banks are required to maintain a Tier 1 leverage ratio of 3% plus an additional cushion of at least 1% to 2% basis points. Certain actual regulatory capital ratios under the OCC's risk-based capital guidelines for the Bank at December 31, 2012, are shown below: Tier 1 Capital to Risk-Weighted Assets 14.78% Total Risk-Based Capital to Risk-Weighted Assets 15.67% Tier 1 Leverage Ratio 10.98% The federal bank regulators also have issued a joint policy statement to provide guidance on sound practices for managing interest rate risk. The statement sets forth the factors the federal regulatory examiners will use to determine the adequacy of a bank's capital for interest rate risk. These qualitative factors include the adequacy and effectiveness of the bank's internal interest rate risk management process and the level of interest rate exposure. Other qualitative factors that will be considered include the size of the bank, the nature and complexity of its activities, the adequacy of its capital and earnings in relation to the bank's overall risk profile, and its earning exposure to interest rate movements. The interagency supervisory policy statement describes the responsibilities of a bank's board of directors in implementing a risk management process and the requirements of the bank's senior management in ensuring the effective management of interest rate risk. Further, the statement specifies the elements that a risk management process must contain. The federal banking regulators have also issued regulations revising the risk-based capital standards to include a supervisory framework for measuring market risk. The effect of these regulations is that any bank holding company or bank which has significant exposure to market risk must measure such risk using its own internal model, subject to the requirements contained in the regulations, and must maintain adequate capital to support that exposure. These regulations apply to any bank holding company or bank whose trading activity equals 10% or more of its total assets, or whose trading activity equals $1 billion or more. Examiners may require a bank holding company or bank that does not meet the applicability criteria to comply with the capital requirements if necessary for safety and soundness purposes. These regulations contain supplemental rules to determine qualifying and excess capital, calculate risk-weighted assets, calculate market risk-equivalent assets and calculate risk-based capital ratios adjusted for market risk. Morris Plan is also subject to the capital adequacy guidelines of the FDIC in its examination and regulation of Morris Plan. In addition, the Bank and Morris Plan are also subject to the "prompt corrective action" regulations, which implement a capital-based regulatory scheme designed to promote early intervention for troubled banks. This framework contains five categories of compliance with regulatory capital requirements, including "well capitalized", "adequately capitalized", "undercapitalized", "significantly undercapitalized", and "critically undercapitalized". As of December 31, 2012, the Bank and Morris Plan were qualified as "well capitalized." It should be noted that a bank's capital category is determined solely for the purpose of applying the "prompt corrective action" regulations and that the capital category may not constitute an accurate representation of the bank's overall financial condition or prospects. The degree of regulatory scrutiny of a financial institution increases, and the permissible activities of the institution decrease, as it moves downward through the capital categories. Bank holding companies controlling financial institutions can be required to boost the institutions' capital and to partially guarantee the institutions' performance. Ability-to-Repay Requirement and Qualified Mortgage Rule. The Dodd-Frank Act contains additional provisions that affect consumer mortgage lending. First, it significantly expands underwriting requirements applicable to loans secured by 1-4 family residential real property and augments federal law combating predatory lending practices. In addition to numerous new disclosure requirements, the Dodd-Frank Act imposes new standards for mortgage loan originations on all lenders, including banks and savings associations, in an effort to encourage lenders to verify a borrower’s ability to repay, while also establishing a presumption of compliance for certain “qualified mortgages.” Most significantly, the new standards limit the total points and fees that the Bank and/or a broker may charge on conforming and jumbo loans to 3% of the total loan amount. In addition, the Dodd-Frank Act generally requires lenders or securitizers to retain an economic interest in the credit risk relating to loans that the lender sells and other asset-backed securities that the securitizer issues if the loans have not complied with the ability-to-repay standards. The risk retention requirement generally will be 5%, but could be increased or decreased by regulation. In 2013, the CFPB issued a final rule, effective January 10, 2014, that implements the Dodd-Frank Act’s ability-to-repay requirements, and clarifies the presumption of compliance for “qualified mortgages.” Further, the final rule also clarifies
11
that qualified mortgages do not include “no-doc” loans and loans with negative amortization, interest-only payments, balloon payments, terms in excess of 30 years, or points and fees paid by the borrower that exceed 3% of the loan amount, subject to certain exceptions. In addition, for qualified mortgages, the monthly payment must be calculated on the highest payment that will occur in the first five years of the loan, and the borrower’s total debt-to-income ratio generally may not be more than 43%. The final rule also provides that certain mortgages that satisfy the general product feature requirements for qualified mortgages and that also satisfy the underwriting requirements of Fannie Mae and Freddie Mac (while they operate under federal conservatorship or receivership) or the U.S. Department of Housing and Urban Development, Department of Veterans Affairs, or Department of Agriculture or Rural Housing Service are also considered to be qualified mortgages. This second category of qualified mortgages will phase out as the aforementioned federal agencies issue their own rules regarding qualified mortgages, the conservatorship of Fannie Mae and Freddie Mac ends, and, in any event, after seven years. As set forth in the Dodd-Frank Act, subprime (or higher-priced) mortgage loans are subject to the ability-to-repay requirement, and the final rule provides for a rebuttable presumption of lender compliance for those loans. The final rule also applies the ability-to-repay requirement to prime loans, while also providing a conclusive presumption of compliance ( i.e. , a safe harbor) for prime loans that are also qualified mortgages. Additionally, the final rule generally prohibits prepayment penalties (subject to certain exceptions) and sets forth a 3-year record retention period with respect to documenting and demonstrating the ability-to-repay requirement and other provisions. USA Patriot Act. The Uniting and Strengthening America by Providing Appropriate Tools Required to Intercept and Obstruct Terrorism Act of 2001 (the “USA Patriot Act”) is intended to strengthen the ability of U.S. Law Enforcement to combat terrorism on a variety of fronts. The potential impact of the USA Patriot Act on financial institutions is significant and wide-ranging. The USA Patriot Act contains sweeping anti-money laundering and financial transparency laws and requires financial institutions to implement additional policies and procedures with respect to, or additional measures designed to address, any or all of the following matters, among others: money laundering and currency crimes, customer identification verification, cooperation among financial institutions, suspicious activities and currency transaction reporting. S.A.F.E. Act Requirements. Regulations issued under the Secure and Fair Enforcement for Mortgage Licensing Act of 2008 ( the “S.A.F.E. Act” ) require residential mortgage loan originators who are employees of institutions regulated by the foregoing agencies, including national banks, to meet the registration requirements of the S.A.F.E. Act. The S.A.F.E. Act requires residential mortgage loan originators who are employees of regulated financial institutions to be registered with the Nationwide Mortgage Licensing System and Registry, a database created by the Conference of State Bank Supervisors and the American Association of Residential Mortgage Regulators to support the licensing of mortgage loan originators by the states. Employees of regulated financial institutions are generally prohibited from originating residential mortgage loans unless they are registered. Other Regulations Federal law extensively regulates other various aspects of the banking business such as reserve requirements. Current federal law also requires banks, among other things to make deposited funds available within specified time periods. In addition, with certain exceptions, a bank and a subsidiary may not extend credit, lease or sell property or furnish any services or fix or vary the consideration for the foregoing on the condition that (i) the customer must obtain or provide some additional credit, property or services from, or to, any of them, or (ii) the customer may not obtain some other credit, property or service from a competitor, except to the extent reasonable conditions are imposed to assure the soundness of credit extended. Interest and other charges collected or contracted by the Bank or Morris Plan are subject to state usury laws and federal laws concerning interest rates. The loan operations are also subject to federal and state laws applicable to credit transactions, such as the:
• Truth-In-Lending Act and state consumer protection laws governing disclosures of credit terms and prohibiting certain practices with regard to consumer borrowers;
• Home Mortgage Disclosure Act of 1975, requiring financial institutions to provide information to enable the public and public officials to determine whether a financial institution is fulfilling its obligation to help meet the housing needs of the community it serves;
• Equal Credit Opportunity Act and other fair lending laws, prohibiting discrimination on the basis of race, creed or other prohibited factors in extending credit;
• Fair Credit Reporting Act of 1978 and Fair and Accurate Credit Transactions Act of 2003, governing the use and provision of information to credit reporting agencies;
• Fair Debt Collection Practices Act, governing the manner in which consumer debts may be collected by collection agencies; and rules and regulations of the various federal agencies charged with the responsibility of implementing such federal laws.
12
The deposit operations also are subject to the:
• Customer Information Security Guidelines. The federal bank regulatory agencies have adopted final guidelines (the "Guidelines") for safeguarding confidential customer information. The Guidelines require each financial institution, under the supervision and ongoing oversight of its Board of Directors, to create a comprehensive written information security program designed to ensure the security and confidentiality of customer information, protect against any anticipated threats or hazards to the security or integrity of such information; protect against unauthorized access to or use of such information that could result in substantial harm or inconvenience to any customer; and implement response programs for security breaches.
• Electronic Funds Transfer Act and Regulation E. The Electronic Funds Transfer Act, which is implemented by Regulation E, governs automatic deposits to and withdrawals from deposit accounts and customers' rights and liabilities arising from the use of automated teller machines and other electronic banking service.
• Gramm-Leach-Bliley Act, Fair and Accurate Credit Transactions Act. The Gramm-Leach-Bliley Act, the Fair and Accurate Credit Transactions Act, and the implementing regulations govern consumer financial privacy, provide disclosure requirements and restrict the sharing of certain consumer financial information with other parties.
The federal banking agencies have established guidelines which prescribe standards for depository institutions relating to internal controls, information systems, internal audit systems, loan documentation, credit underwriting, interest rate exposure, asset growth, asset quality, earnings, compensation fees and benefits, and management compensation. The agencies may require an institution which fails to meet the standards set forth in the guidelines to submit a compliance plan. Failure to submit an acceptable plan or adhere to an accepted plan may be grounds for further enforcement action. As noted above, the new Bureau of Consumer Financial Protection will have authority for amending existing consumer compliance regulations and implementing new such regulations. In addition, the Bureau will have the power to examine the compliance of financial institutions with an excess of $10 billion in assets with these consumer protection rules. The Bank’s and Morris Plan’s compliance with consumer protection rules will be examined by the OCC and the FDIC, respectively, since neither the Bank nor Morris Plan meet this $10 billion asset level threshold. Enforcement Powers. Federal regulatory agencies may assess civil and criminal penalties against depository institutions and certain "institution-affiliated parties", including management, employees, and agents of a financial institution, as well as independent contractors and consultants such as attorneys and accountants and others who participate in the conduct of the financial institution's affairs. In addition, regulators may commence enforcement actions against institutions and institution-affiliated parties. Possible enforcement actions include the termination of deposit insurance. Furthermore, regulators may issue cease-and-desist orders to, among other things, require affirmative action to correct any harm resulting from a violation or practice, including restitution, reimbursement, indemnifications or guarantees against loss. A financial institution may also be ordered to restrict its growth, dispose of certain assets, rescind agreements or contracts, or take other actions as determined by the regulator to be appropriate. Effect of Governmental Monetary Policies. The Corporation's earnings are affected by domestic economic conditions and the monetary and fiscal policies of the United States government and its agencies. The Federal Reserve Bank's monetary policies have had, and are likely to continue to have, an important impact on the operating results of commercial banks through its power to implement national monetary policy in order, among other things, to curb inflation or combat a recession. The monetary policies of the Federal Reserve have major effects upon the levels of bank loans, investments and deposits through its open market operations in United States government securities and through its regulation of the discount rate on borrowings of member banks and the reserve requirements against member bank deposits. It is not possible to predict the nature or impact of future changes in monetary and fiscal policies. Available Information The Corporation files annual reports on Form 10-K, quarterly reports on Form 10-Q, proxy statements and other information with the Securities and Exchange Commission. Such reports, proxy statements and other information can be read and copied at the public reference facilities maintained by the Securities and Exchange Commission at the Public Reference Room, 100 F Street, NE, Washington, D.C. 20549. Information regarding the operation of the Public Reference Room may be obtained by calling the Securities and Exchange Commission at 1-800-SEC-0330. The Securities and Exchange Commission maintains a web site (http://www.sec.gov) that contains reports, proxy statements, and other information. The Corporation’s filings are also accessible at no cost on the Corporation's website at www.first-online.com.
13
ITEM 1A. RISK FACTORS
Difficult conditions in the capital markets and the economy generally may materially adversely affect the Corporation’s business and results of operations From December 2007 through June 2009, the U.S. economy was in recession. Business activity across a wide range of industries and regions in the U.S. was greatly reduced. Although economic conditions have begun to improve, certain sectors, such as real estate, remain weak and unemployment remains high. Local governments and many businesses are still in serious difficulty due to lower consumer spending and the lack of liquidity in the credit markets.
Market conditions also led to the failure or merger of several prominent financial institutions and numerous regional and community-based financial institutions. These failures, as well as projected future failures, have had a significant negative impact on the capitalization level of the deposit insurance fund of the FDIC, which, in turn, has led to a significant increase in deposit insurance premiums paid by financial institutions.
The Corporation’s financial performance generally, and in particular the ability of borrowers to pay interest on and repay principal of outstanding loans and the value of collateral securing those loans, as well as demand for loans and other products and services that the Corporation offers, is highly dependent upon the business environment in the markets where the Corporation operates and in the United States as a whole. A favorable business environment is generally characterized by, among other factors, economic growth, efficient capital markets, low inflation, low unemployment, high business and investor confidence, and strong business earnings. Unfavorable or uncertain economic and market conditions can be caused by declines in economic growth, business activity or investor or business confidence; limitations on the availability or increases in the cost of credit and capital; increases in inflation or interest rates; high unemployment, natural disasters, or a combination of these or other factors.
The business environment has been adverse for many households and businesses in the United States and worldwide. While economic conditions in the United States and worldwide have begun to improve, there can be no assurance that this improvement will continue. Such conditions have affected, and could continue to adversely affect, the credit quality of the Corporation’s loans, results of operations and financial condition.
In response to economic and market conditions, from time to time the Corporation has undertaken initiatives to reduce its cost structure where appropriate. These initiatives may not be sufficient to meet current and future changes in economic and market conditions and allow the Corporation to maintain profitability. In addition, costs actually incurred in connection with these restructuring actions may be higher than our estimates of such costs or may not lead to the anticipated cost savings.
Recently enacted and potential further financial regulatory reforms could have a significant impact on our business, financial condition and results of operations
The Dodd−Frank Wall Street Reform and Consumer Protection Act (the “Dodd−Frank Act”), enacted in July 2010, instituted major changes to the banking and financial institutions regulatory regimes in light of the recent performance of and government intervention in the financial services sector. Many aspects of the Dodd-Frank Act are subject to rulemaking and will take effect over several years, making it difficult to anticipate the overall financial impact on the Corporation. The changes resulting from the Dodd−Frank Act may impact the profitability of business activities, require changes to certain business practices, impose more stringent capital, liquidity and leverage requirements or otherwise adversely affect the Corporation’s business. In particular, the potential impact of the Dodd−Frank Act on the Corporation’s operations and activities, both currently and prospectively, include, among others:
• a reduction in the ability to generate or originate revenue−producing assets as a result of compliance with heightened capital standards;
• increased cost of operations due to greater regulatory oversight, supervision and examination of banks and bank holding companies, and higher deposit insurance premiums;·
• the limitation on the ability to raise new capital through the use of trust preferred securities, as any new issuances of these securities will no longer be included as Tier 1 capital going forward;
• a potential reduction in fee income due to limits on interchange fees applicable to larger institutions which could effectively reduce the fees we can charge; and
• the limitation on the ability to expand consumer product and service offerings due to anticipated stricter consumer protection laws and regulations.
Further, the Corporation may be required to invest significant management attention and resources to evaluate and make any changes necessary to comply with new statutory and regulatory requirements under the Dodd−Frank Act, which may negatively impact results of operations and financial condition.

14
Contemplated and proposed legislation, state and federal programs, and increased government control or influence may adversely affect the Corporation by increasing the uncertainty on its lending operations and expose it to increased losses. Statutes and regulations may be altered which potentially increase the Corporation’s cost of service and underwrite mortgage loans.
In June 2012 the respective federal bank regulatory agencies proposed for comment proposed rulemakings for new capital standards generally consistent with Basel III. The comment period for these notices of proposed rulemakings has expired, but final regulations have not yet been released and the federal bank regulatory agencies announced that the implementation of the proposed rules under Basel III was indefinitely delayed. If and when implemented, Basel III would require capital to be held in the form of tangible common equity, generally increase the required capital ratios, phase out certain kinds of intangibles treated as capital and certain types of instruments, such as trust preferred securities, and change the risk weightings of assets used to determine required capital ratios. Such changes, including changes regarding interpretations and implementation, could affect the Corporation in substantial and unpredictable ways and could have a material adverse effect on us. Further, among other things, such changes could subject us to additional costs and limit the types of financial services and products we may offer.
The Corporation cannot predict whether there will be additional proposed laws or reforms that would affect the U.S. financial system or financial institutions, whether or when such changes may be adopted, how such changes may be interpreted and enforced or how such changes may impact the Corporation’s financial condition and results of operations. However, the costs of complying with any additional laws or regulations could have a material adverse effect on the Corporation’s financial condition and results of operations.
The recent repeal of federal prohibitions on payment of interest on business demand deposits could increase our interest expense and have a material adverse effect on us All federal prohibitions on the ability of financial institutions to pay interest on business demand deposit accounts were repealed as part of the Dodd-Frank Act. As a result, some financial institutions have commenced offering interest on these demand deposits to compete for customers. If competitive pressures require us to pay interest on these demand deposits to attract and retain business customers, our interest expense would increase and our net interest margin would decrease. This could have a material adverse effect on us. Further, the effect of the repeal of the prohibition could be more significant in a higher interest rate environment as business customers would have a greater incentive to seek interest on demand deposits. The Corporation is subject to interest rate risk The Corporation’s earnings and cash flows are largely dependent upon the Corporation’s net interest income. Net interest income is the difference between interest income earned on interest earning assets such as loans and securities and interest expense paid on interest bearing liabilities such as deposits and borrowed funds. Interest rates are highly sensitive to many factors that are beyond the Corporation’s control, including general economic conditions and policies of various governmental and regulatory agencies. Changes in monetary policy, including changes in interest rates, could influence not only the interest that is received on loans and securities and the interest that is paid on deposits and borrowings, but such changes could also affect (i) the Corporation’s ability to originate loans and obtain deposits, and (ii) the fair value of the Corporation’s financial assets and liabilities. Currently, the Corporation is in an asset-sensitive position. In a rising interest rate environment, the Corporation may be unable to sell its lower-yielding mortgage loans, thus impacting its ability to generate higher yielding loans which could adversely impact earnings.
The Corporation is subject to lending risk There are inherent risks associated with the Corporation's lending activities. These risks include, among other things, the impact of changes in interest rates and changes in the economic conditions in the markets where the Corporation operates as well as those across Indiana, Illinois and the United States. Increases in interest rates and/or weakening economic conditions could adversely impact the ability of borrowers to repay outstanding loans or the value of the collateral securing these loans. Credit issues may continue to broaden during 2013 depending on the severity and duration of the stagnant economy and the current credit cycle.
The Corporation originates commercial real estate loans, commercial loans, consumer loans and residential real estate loans primarily within its market areas. Commercial real estate, commercial, and consumer loans may expose a lender to greater credit risk than loans secured by residential real estate because the collateral securing these loans may not be sold as easily as residential real estate. These loans also have greater credit risk than residential real estate for the following reasons:
• Commercial Real Estate Loans. Repayment is dependent upon income being generated in amounts sufficient to cover operating expenses and debt service.
• Commercial Loans. Repayment is dependent upon the successful operation of the borrower’s business. • Consumer Loans. Consumer loans (such as personal lines of credit) are collateralized, if at all, with
assets that may not provide an adequate source of payment of the loan due to depreciation, damage, or loss.
15
The Corporation is also subject to various laws and regulations that affect its lending activities. Failure to comply with applicable laws and regulations could subject the Corporation to regulatory enforcement action that could result in the assessment of significant civil money penalties against the Corporation. The Corporation's allowance for loan losses may be insufficient The Corporation maintains an allowance for loan losses, which is a reserve established through a provision for loan losses charged to expense, that represents management's best estimate of probable incurred losses that are inherent within the existing portfolio of loans. The level of the allowance reflects management's continuing evaluation of industry concentrations; specific credit risks; loan loss experience; current loan portfolio quality; present economic, political and regulatory conditions and unidentified losses inherent in the current loan portfolio. The determination of the appropriate level of the allowance for loan losses inherently involves a high degree of subjectivity and requires the Corporation to make significant estimates of current credit risks and future trends, all of which may undergo material changes. Changes in economic conditions affecting borrowers, new information regarding existing loans, identification of additional problem loans and other factors, both within and outside of the Corporation's control, may require an increase in the allowance for loan losses. In addition, bank regulatory agencies periodically review the Corporation's allowance for loan losses and may require an increase in the provision for loan losses or the recognition of further loan charge-offs, based on judgments different than those of management. In addition, if charge-offs in future periods exceed the allowance for loan losses, the Corporation will need additional provisions to increase the allowance for loan losses. Any increases in the allowance for loan losses will result in a decrease in net income and, possibly, capital, and may have a material adverse effect on the Corporation's financial condition and results of operations. The Corporation may foreclose on collateral property and would be subject to the increased costs associated with ownership of real property, resulting in reduced revenues and earnings
The Corporation forecloses on collateral property from time to time to protect its investment and thereafter owns and operates such property, in which case it is exposed to the risks inherent in the ownership of real estate. The amount that the Corporation, as a mortgagee, may realize after a default is dependent upon factors outside of its control, including, but not limited to: (i) general or local economic conditions; (ii) neighborhood values; (iii) interest rates; (iv) real estate tax rates; (v) operating expenses of the mortgaged properties; (vi) environmental remediation liabilities; (vii) ability to obtain and maintain adequate occupancy of the properties; (viii) zoning laws; (ix) governmental rules, regulations and fiscal policies; and (x) acts of God. Certain expenditures associated with the ownership of real estate, principally real estate taxes, insurance, and maintenance costs, may adversely affect the income from the real estate. Therefore, the cost of operating real property may exceed the income earned from such property, and the Corporation may have to advance funds in order to protect its investment, or it may be required to dispose of the real property at a loss. These expenditures and costs could adversely affect the Corporation’s ability to generate revenues, resulting in reduced levels of profitability.
The Corporation operates in a highly competitive industry and market area The Corporation faces substantial competition in all areas of its operations from a variety of different competitors, many of which are larger and may have more financial resources. Such competitors include banks and many other types of financial institutions, including, without limitation, savings and loans, credit unions, finance companies, brokerage firms, insurance companies, factoring companies and other financial intermediaries. The financial services industry could become even more competitive as a result of legislative, regulatory and technological changes and continued consolidation. Banks, securities firms and insurance companies can merge under the umbrella of a financial holding company, which can offer virtually any type of financial service, including banking, securities underwriting, insurance (both agency and underwriting) and merchant banking. Also, technology has lowered barriers to entry and made it possible for non-banks to offer products and services traditionally provided by banks, such as automatic transfer and automatic payment systems. Many of the Corporation's competitors have fewer regulatory constraints and may have lower cost structures. Additionally, due to their size, many competitors may be able to achieve economies of scale and, as a result, may offer a broader range of products and services as well as better pricing for those products and services than the Corporation can. The Corporation's ability to compete successfully depends on a number of factors, including, among other things:
• The ability to develop, maintain and build upon long-term customer relationships based on top quality service, and safe, sound assets;
• The ability to expand the Corporation's market position; • The scope, relevance and pricing of products and services offered to meet customer needs and demands; • The rate at which the Corporation introduces new products and services relative to its competitors; • Customer satisfaction with the Corporation's level of service; and • Industry and general economic trends.
16
Failure to perform in any of these areas could significantly weaken the Corporation's competitive position, which could adversely affect the Corporation's growth and profitability, which, in turn, could have a material adverse effect on the Corporation's financial condition and results of operations. The Corporation is subject to extensive government regulation and supervision The Corporation, primarily through the Bank, is subject to extensive federal regulation and supervision. Banking regulations are primarily intended to protect depositors' funds, federal deposit insurance funds and the banking system as a whole, not shareholders. These regulations affect the Corporation's lending practices, capital structure, investment practices, and growth, among other things. Congress and federal regulatory agencies continually review banking laws, regulations and policies for possible changes. Changes to statutes, regulations or regulatory policies, including changes in interpretation or implementation of statutes, regulations or policies, could affect the Corporation in substantial and unpredictable ways. Such changes could subject the Corporation to additional costs, limit the types of financial services and products the Corporation may offer and/or increase the ability of non-banks to offer competing financial services and products, among other things. Failure to comply with laws, regulations or policies could result in sanctions by regulatory agencies, civil money penalties and/or reputation damage, which could have a material adverse effect on the Corporation's business, financial condition and results of operations. While the Corporation has policies and procedures designed to prevent any such violations, there can be no assurance that such violations will not occur. The Corporation is dependent on certain key management and staff The Corporation relies on key personnel to manage and operate its business. The loss of key staff may adversely affect the Corporation’s ability to maintain and manage these portfolios effectively, which could negatively affect the Corporation’s revenues. In addition, loss of key personnel could result in increased recruiting and hiring expenses, which could cause a decrease in the Corporation's net income. The Corporation’s internal operations are subject to a number of risks The Corporation’s internal operations are subject to certain risks, including but not limited to, data processing system failures and errors, customer or employee fraud and catastrophic failures resulting from terrorist acts or natural disasters. Operational risk resulting from inadequate or failed internal processes, people, and systems includes the risk of fraud by employees or persons outside of our company, the execution of unauthorized transactions by employees, errors relating to transaction processing and systems, and breaches of the internal control system and compliance requirements. This risk of loss also includes potential legal actions that could arise as a result of the operational deficiency or as a result of noncompliance with applicable regulatory standards. The financial services industry is continually undergoing rapid technological change with frequent introductions of new technology-driven products and services. The effective use of technology increases efficiency and enables financial institutions to better serve customers and to reduce costs. The Corporation's future success depends, in part, upon its ability to address the needs of its customers by using technology to provide products and services that will satisfy customer demands, as well as to create additional efficiencies in the Corporation's operations. Failure to successfully keep pace with technological change affecting the financial services industry could have a material adverse impact on the Corporation's business and, in turn, the Corporation's financial condition and results of operations. The Corporation’s earnings could be adversely impacted by incidences of fraud and compliance failures that are not within our direct control Financial institutions are inherently exposed to fraud risk. A fraud can be perpetrated by a customer of the Bank, an employee, a vendor, or members of the general public. We are most subject to fraud and compliance risk in connection with the origination of loans, ACH transactions, ATM transactions and checking transactions. Our largest fraud risk, associated with the origination of loans, includes the intentional misstatement of information in property appraisals or other underwriting documentation provided to us by third parties. Compliance risk is the risk that loans are not originated in compliance with applicable laws and regulations and our standards. There can be no assurance that we can prevent or detect acts of fraud or violation of law or our compliance standards by the third parties that we deal with. Repeated incidences of fraud or compliance failures would adversely impact the performance of our loan portfolio. The Corporation's information systems may experience an interruption or breach in security The Corporation relies heavily on communications and information systems to conduct its business. Any failure, interruption or breach in security of these systems could result in failures or disruptions in the Corporation's customer relationship management, general ledger, deposit, loan and other systems. While the Corporation has policies and procedures designed to prevent or limit the effect of the failure, interruption or security breach of its information systems, there can be no assurance that any such failures, interruptions or security breaches will not occur or, if they do occur, that they will be adequately addressed. The occurrence of any failures, interruptions or security breaches of the Corporation's information systems could damage the Corporation's reputation, result in a loss of customer business, subject the
17
Corporation to additional regulatory scrutiny, or expose the Corporation to civil litigation and possible financial liability, any of which could have a material adverse effect on the Corporation's financial condition and results of operations. The Corporation has opened new offices The Corporation has placed a strategic emphasis on expanding its banking office network. Executing this strategy carries risks of slower than anticipated growth in the new offices, which require a significant investment of both financial and personnel resources. Lower than expected loan and deposit growth in new offices can decrease anticipated revenues and net income generated by those offices, and opening new offices could result in more additional expenses than anticipated and divert resources from current core operations. The geographic concentration of the Corporation’s markets makes the Corporation’s business highly susceptible to local economic conditions Unlike larger banking organizations that are more geographically diversified, the Corporation’s operations are currently concentrated in three counties located in central Indiana. As a result of this geographic concentration, the Corporation’s financial results depend largely upon economic conditions in these market areas. Deterioration in economic conditions in the Corporation’s market could result in one or more of the following:
• an increase in loan delinquencies; • an increase in problem assets and foreclosures; • a decrease in the demand for the Corporation’s products and services; and • a decrease in the value of collateral for loans, especially real estate, in turn reducing customers’ borrowing
power, the value of assets associated with problem loans and collateral coverage.
Future growth or operating results may require the Corporation to raise additional capital but that capital may not be available or it may be dilutive
The Corporation is required by federal and state regulatory authorities to maintain adequate levels of capital to support its operations. To the extent the Corporation’s future operating results erode capital or the Corporation elects to expand through loan growth or acquisition it may be required to raise capital. The Corporation’s ability to raise capital will depend on conditions in the capital markets, which are outside of its control, and on the Corporation’s financial performance. Accordingly, the Corporation cannot be assured of its ability to raise capital when needed or on favorable terms. If the Corporation cannot raise additional capital when needed, it will be subject to increased regulatory supervision and the imposition of restrictions on its growth and business. These could negatively impact the Corporation’s ability to operate or further expand its operations through acquisitions or the establishment of additional branches and may result in increases in operating expenses and reductions in revenues that could have a material adverse effect on its financial condition and results of operations.
The Corporation may not be able to pay dividends in the future in accordance with past practice
The Corporation has historically paid a semi-annual dividend to common stockholders. The payment of dividends is subject to legal and regulatory restrictions. Any payment of dividends in the future will depend, in large part, on the Corporation’s earnings, capital requirements, financial condition and other factors considered relevant by the Corporation’s Board of Directors. The price of the Corporation’s common stock may be volatile, which may result in losses for investors
General market price declines or market volatility in the future could adversely affect the price of the Corporation’s common stock. In addition, the following factors may cause the market price for shares of the Corporation’s common stock to fluctuate:
• announcements of developments related to the Corporation’s business; • fluctuations in the Corporation’s results of operations; • sales or purchases of substantial amounts of the Corporation’s securities in the marketplace; • general conditions in the Corporation’s banking niche or the worldwide economy; • a shortfall or excess in revenues or earnings compared to securities analysts’ expectations; • changes in analysts’ recommendations or projections; and • the Corporation’s announcement of new acquisitions or other projects.
ITEM 1B. UNRESOLVED STAFF COMMENTS
None.
ITEM 2. PROPERTIES
The Corporation is located in a four-story office building in downtown Terre Haute, Indiana that was first occupied in

18
June 1988. It is leased to the Bank. The Bank also owns two other facilities in downtown Terre Haute. One is available for lease and the other is a 50,000-square-foot building housing operations and administrative staff and equipment. In addition, the Bank holds in fee six other branch buildings. One of the branch buildings is a single-story 36,000-square-foot building which is located in a Terre Haute suburban area. Four other branch bank buildings are leased by the Bank. The expiration dates on the three leases are May 31, 2016, February 14, 2016 and May 31, 2014. The other lease is on a month to month basis.
Facilities of the Corporation’s banking center in Daviess County include an office in Washington, Indiana. This building
is held in fee. Facilities of the Corporation’s banking centers in Clay County include three offices in Brazil, Indiana and offices in Clay
City and Poland, Indiana. All five buildings are held in fee. Facilities of the Corporation’s banking centers in Vermillion County include two offices in Clinton, Indiana and offices in
Cayuga and Newport, Indiana. All four buildings are held in fee. Facilities of the Corporation’s banking centers in Sullivan County include offices in Sullivan, Carlisle, Dugger,
Farmersburg and Hymera, Indiana. All five buildings are held in fee. Facilities of the Corporation’s banking center in Gibson County include an office in Princeton, Indiana. This building is
held in fee. Facilities of the Corporation’s banking center in Greene County include an office in Worthington, Indiana. This building
is held in fee. Facilities of the Corporation’s banking centers in Knox County include offices in Monroe City, Sandborn and two in
Vincennes, Indiana. All four buildings are held in fee. Facilities of the Corporation’s banking centers in Parke County include two offices in Rockville, Indiana and offices in
Marshall, Montezuma and Rosedale, Indiana. All five buildings are held in fee. Facilities of the Corporation’s banking center in Putnam County include an office in Greencastle, Indiana. This building is
held in fee. Facilities of the Corporation’s banking center in Vanderburgh County include an office in Evansville, Indiana. This
building is held in fee. Facilities of the Corporation’s banking centers in Crawford County include its main office and a drive-up facility in
Robinson, Illinois and a branch facility in Oblong, Illinois. All three of the buildings are held in fee. Facilities of the Corporation’s banking center in Lawrence County include an office in Lawrenceville, Illinois. This
building is held in fee. Facilities of the Corporation’s banking centers in Livingston include three offices in Pontiac, Illinois. All of the buildings
are held in fee. Facilities of the Corporation’s banking center in McLean County include two offices in Bloomington, Illinois, an office in
Downs, Illinois and an office in Gridley, Illinois. These building are all held in fee. Facilities of the Corporation’s banking center in Wayne County include an office in Fairfield, Illinois. This building is
held in fee. Facilities of the Corporation’s banking center in Jasper County include an office in Newton, Illinois. This building is held
in fee. Facilities of the Corporation’s banking center in Coles County include an office in Charleston, Illinois. This building is
held in fee. Facilities of the Corporation’s banking center in Clark County include an office in Marshall, Illinois. This building is held
in fee. Facilities of the Corporation’s banking center in Champaign County include two offices in Champaign, Illinois, an office
in Mohomet, Illinois, and two offices in Urbana, Illinois. One of the banking centers in Champaign is held in fee while the land is leased. The land lease expires September 6, 2036. One of the banking centers in Champaign is leased and the lease expires on December 31, 2017. The banking center in Mohomet is leased and the lease expires on June 30, 2016. One of the banking centers in Urbana is held in fee while the other banking center in Urbana is held in fee while the land is leased and the lease
19
expires on November 30, 2014. Facilities of the Corporation’s banking center in Vermilion County include five offices in Danville, Illinois, an office in
Westville, Illinois, and an office in Ridge Farm, Illinois. One of the buildings in Danville is leased and the lease expires on December 31, 2016 and the other six buildings are held in fee.
Facilities of the Corporation’s banking centers in Richland County include two offices in Olney, Illinois. One building is
held in fee and the other building is leased. The expiration date on the lease is March 1, 2015. The facility of the Corporation’s subsidiary, The Morris Plan Company, includes an office facility in Terre Haute, Indiana.
The building is leased by The Morris Plan Company. The expiration date on the lease is October 31, 2020. Facilities of the Corporation’s subsidiary, Forrest Sherer, Inc., include its main office and one satellite office in Terre
Haute, Indiana. The buildings are held in fee by Forrest Sherer, Inc. Facilities of the Corporation’s subsidiary, FFB Management Co., Inc., include an office facility in Las Vegas, Nevada.
This office facility is leased.
ITEM 3. LEGAL PROCEEDINGS
There are no material pending legal proceedings to which the Corporation or its subsidiaries is a party, other than ordinary routine litigation incidental to its business.
ITEM 4. MINE SAFETY DISCLOSURES
Not applicable
PART II ITEM 5. MARKET FOR REGISTRANT’S COMMON EQUITY, RELATED STOCKHOLDER MATTERS AND ISSUER PURCHASES OF EQUITY SECURITIES.
MARKET AND DIVIDEND INFORMATION
As of March 11, 2013 shareholders owned 13,307,498 shares of the Corporation's common stock. The stock is traded on the NASDAQ Global Select Market under the symbol “THFF”. On March 11, 2013, approximately 3,806 shareholders held our common stock.
Historically, the Corporation has paid cash dividends semi-annually and currently expects that comparable cash dividends will continue to be paid in the future. The following table gives quarterly high and low trade prices and dividends per share during each quarter for 2012 and 2011.
Cash Cash Dividends DividendsQuarter ended High Low Declared High Low Declared
March 31 36.84$ 30.31$ 35.00$ 29.73$ June 30 32.23$ 27.09$ 0.47$ 33.98$ 30.36$ 0.47$
September 30 32.93$ 28.25$ 33.91$ 26.63$ December 31 32.18$ 28.07$ 0.48$ 34.23$ 26.47$ 0.47$
Trade Price Trade Price
2012 2011
The Corporation periodically acquires shares of its common stock directly from shareholders in individually negotiated transactions. The Corporation has not adopted a formal policy or adopted a formal program for repurchases of shares of its common stock. There were no purchases of common stock by the Corporation during the quarter covered by this report. The Corporation contributed 49,825 shares of treasury stock to the ESOP in November of 2012.
The graph below represents the five-year total return of the Corporation’s stock. The five year total return for our stock during this time was 23.73%. During this same period, the return on The Russell 2000 Index was 19.09% and the SNL Index of Banks $1 - $5 Billion actually had a negative return of 25.22%.
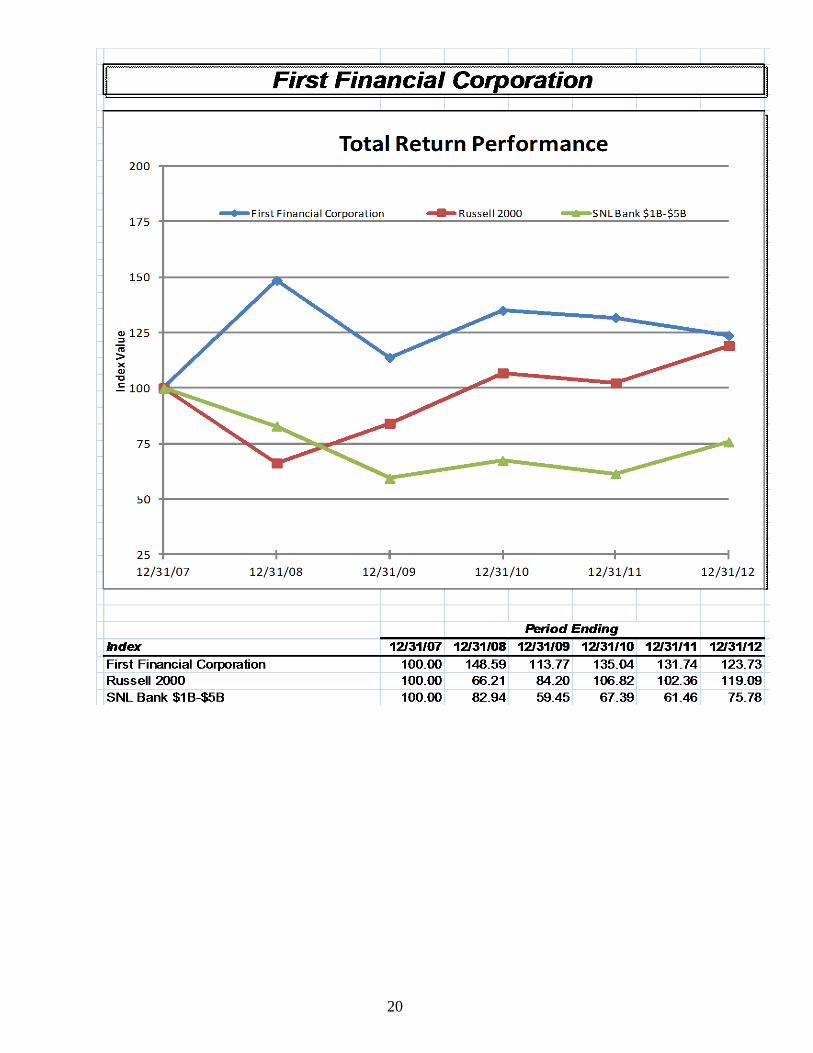
20
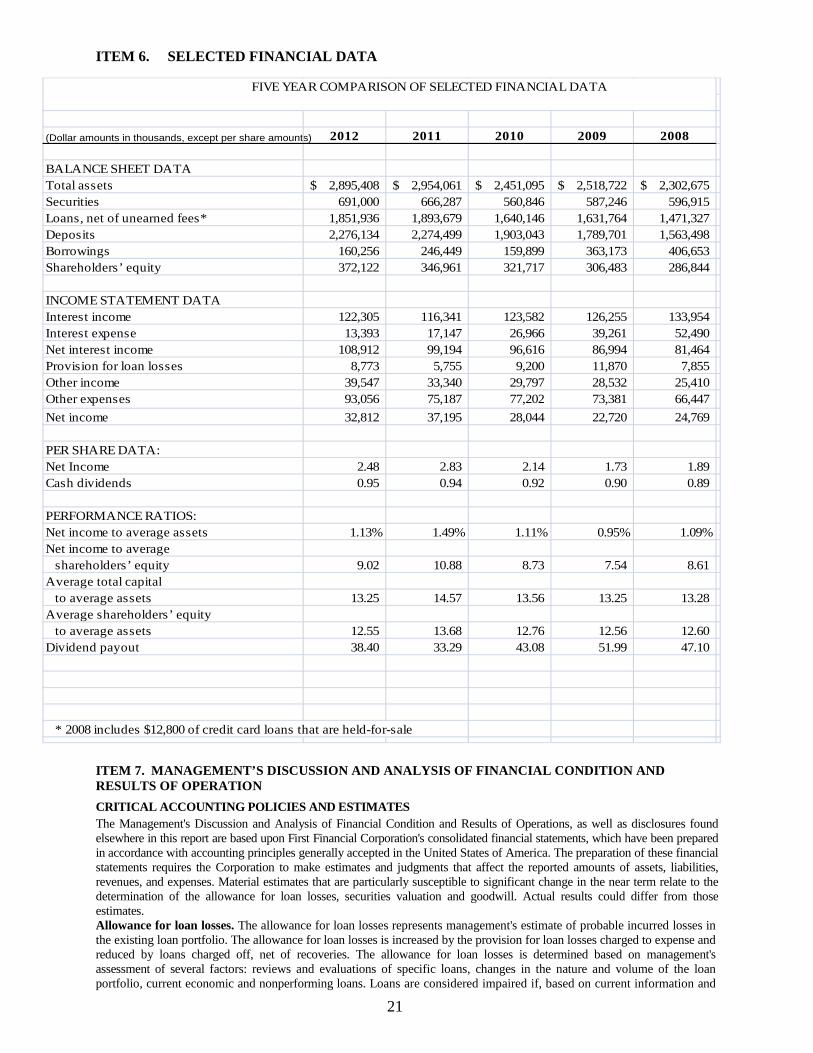
21
ITEM 6. SELECTED FINANCIAL DATA
(Dollar amounts in thousands, except per share amounts) 2012 2011 2010 2009 2008
BALANCE SHEET DATATotal assets 2,895,408$ 2,954,061$ 2,451,095$ 2,518,722$ 2,302,675$ Securities 691,000 666,287 560,846 587,246 596,915 Loans, net of unearned fees* 1,851,936 1,893,679 1,640,146 1,631,764 1,471,327 Deposits 2,276,134 2,274,499 1,903,043 1,789,701 1,563,498 Borrowings 160,256 246,449 159,899 363,173 406,653 Shareholders’ equity 372,122 346,961 321,717 306,483 286,844
INCOME STATEMENT DATAInterest income 122,305 116,341 123,582 126,255 133,954 Interest expense 13,393 17,147 26,966 39,261 52,490 Net interest income 108,912 99,194 96,616 86,994 81,464 Provision for loan losses 8,773 5,755 9,200 11,870 7,855 Other income 39,547 33,340 29,797 28,532 25,410 Other expenses 93,056 75,187 77,202 73,381 66,447 Net income 32,812 37,195 28,044 22,720 24,769
PER SHARE DATA:Net Income 2.48 2.83 2.14 1.73 1.89 Cash dividends 0.95 0.94 0.92 0.90 0.89
PERFORMANCE RATIOS:Net income to average assets 1.13% 1.49% 1.11% 0.95% 1.09%Net income to average shareholders’ equity 9.02 10.88 8.73 7.54 8.61 Average total capital to average assets 13.25 14.57 13.56 13.25 13.28 Average shareholders’ equity to average assets 12.55 13.68 12.76 12.56 12.60 Dividend payout 38.40 33.29 43.08 51.99 47.10
* 2008 includes $12,800 of credit card loans that are held-for-sale
FIVE YEAR COMPARISON OF SELECTED FINANCIAL DATA
ITEM 7. MANAGEMENT’S DISCUSSION AND ANALYSIS OF FINANCIAL CONDITION AND RESULTS OF OPERATION
CRITICAL ACCOUNTING POLICIES AND ESTIMATES The Management's Discussion and Analysis of Financial Condition and Results of Operations, as well as disclosures found elsewhere in this report are based upon First Financial Corporation's consolidated financial statements, which have been prepared in accordance with accounting principles generally accepted in the United States of America. The preparation of these financial statements requires the Corporation to make estimates and judgments that affect the reported amounts of assets, liabilities, revenues, and expenses. Material estimates that are particularly susceptible to significant change in the near term relate to the determination of the allowance for loan losses, securities valuation and goodwill. Actual results could differ from those estimates. Allowance for loan losses. The allowance for loan losses represents management's estimate of probable incurred losses in the existing loan portfolio. The allowance for loan losses is increased by the provision for loan losses charged to expense and reduced by loans charged off, net of recoveries. The allowance for loan losses is determined based on management's assessment of several factors: reviews and evaluations of specific loans, changes in the nature and volume of the loan portfolio, current economic and nonperforming loans. Loans are considered impaired if, based on current information and
22
events, it is probable that the Corporation will be unable to collect the scheduled payments of principal or interest according to the contractual terms of the loan agreement. When a loan is deemed impaired, impairment is measured by using the fair value of underlying collateral,for loans deemed to be collateral dependent, the present value of the future cash flows discounted at the effective interest rate stipulated in the loan agreement, or the estimated market value of the loan. In measuring the fair value of the collateral, management uses assumptions (e.g., discount rate) and methodologies (e.g., comparison to the recent selling price of similar assets) consistent with those that would be utilized by unrelated third parties. Changes in the financial condition of individual borrowers, economic conditions, historical loss experience, or the condition of the various markets in which collateral may be sold may affect the required level of the allowance for loan losses and the associated provision for loan losses. Should cash flow assumptions or market conditions change, a different amount may be recorded for the allowance for loan losses and the associated provision for loan losses. Securities valuation and potential impairment. Securities available-for-sale are carried at fair value, with unrealized holding gains and losses reported separately in accumulated other comprehensive income (loss), net of tax. The Corporation obtains market values from a third party on a monthly basis in order to adjust the securities to fair value. Equity securities that do not have readily determinable fair values are carried at cost. Additionally, all securities are required to be evaluated for other than temporary impairment (OTTI). In determining whether a market value decline is other than temporary, management considers the reason for the decline, the extent of the decline, the duration of the decline and whether the Corporation intends to sell a security or is more likely than not to be required to sell a security before recovery of its amortized cost. If an entity intends to sell or it is more likely than not it will be required to sell the security before recovery of its amortized cost basis, the OTTI shall be recognized in earnings equal to the entire difference between the investment's amortized cost basis and its fair value at the balance sheet date. If an entity does not intend to sell the security and it is not more likely than not that the entity will be required to sell the security before recovery of its amortized cost basis less any current-period loss, the OTTI shall be separated into the amount representing the credit loss and the amount related to all other factors. The amount of the total OTTI related to the credit loss is determined based on the present value of cash flows expected to be collected and is recognized in earnings. Changes in credit ratings, financial condition of underlying debtors, default experience and market liquidity affect the conclusions on whether securities are other-than-temporarily impaired. Additional losses may be recorded through earnings for other than temporary impairment, should there be an adverse change in the expected cash flows for these investments. Goodwill. The carrying value of goodwill requires management to use estimates and assumptions about the fair value of the reporting unit compared to its book value. An impairment analysis is prepared on an annual basis. Fair values of the reporting units are determined by an analysis which considers cash flows streams, profitability and estimated market values of the reporting unit. The majority of the Corporation's goodwill is recorded at First Financial Bank, N. A. Management believes the accounting estimates related to the allowance for loan losses, valuation of investment securities and the valuation of goodwill are "critical accounting estimates" because: (1) the estimates are highly susceptible to change from period to period because they require management to make assumptions concerning, among other factors, the changes in the types and volumes of the portfolios, valuation assumptions, and economic conditions, and (2) the impact of recognizing an impairment or loan loss could have a material effect on the Corporation's assets reported on the balance sheet as well as net income. RESULTS OF OPERATIONS - SUMMARY FOR 2012
COMPARISON OF 2012 TO 2011 Net income for 2012 was $32.8 million, or $2.48 per share. This represents a 11.8% decrease in net income and a 12.4% decrease in earnings per share, compared to 2011. Return on assets at December 31, 2012 decreased 24.2% to 1.13% compared to 1.49% at December 31, 2011. The primary components of income and expense affecting net income are discussed in the following analysis. 2012 includes income and expense associated with the purchase of Freestar Bank on December 30, 2011 that were not part of the results for 2011.
NET INTEREST INCOME
The principal source of the Corporation's earnings is net interest income, which represents the difference between interest earned on loans and investments and the interest cost associated with deposits and other sources of funding .Net interest income increased in 2012 to $108.9 million compared to $99.2 million in 2011. Total average interest earning assets increased to $2.67 billion in 2012 from $2.33 billion in 2011. The tax-equivalent yield on these assets decreased to 4.80% in 2012 from 5.23% in 2011. Total average interest-bearing liabilities increased to $2.02 billion in 2012 from $1.76 billion in 2011. The average cost of these interest-bearing liabilities decreased to 0.66% in 2012 from 0.98% in 2011. The net interest margin decreased from 4.50% in 2011 to 4.30% in 2012. This decrease is primarily the result of the decreased income provided by earning assets. Earning asset yields decreased 43 basis points while the rate on interest-bearing liabilities decreased by 32 basis points.
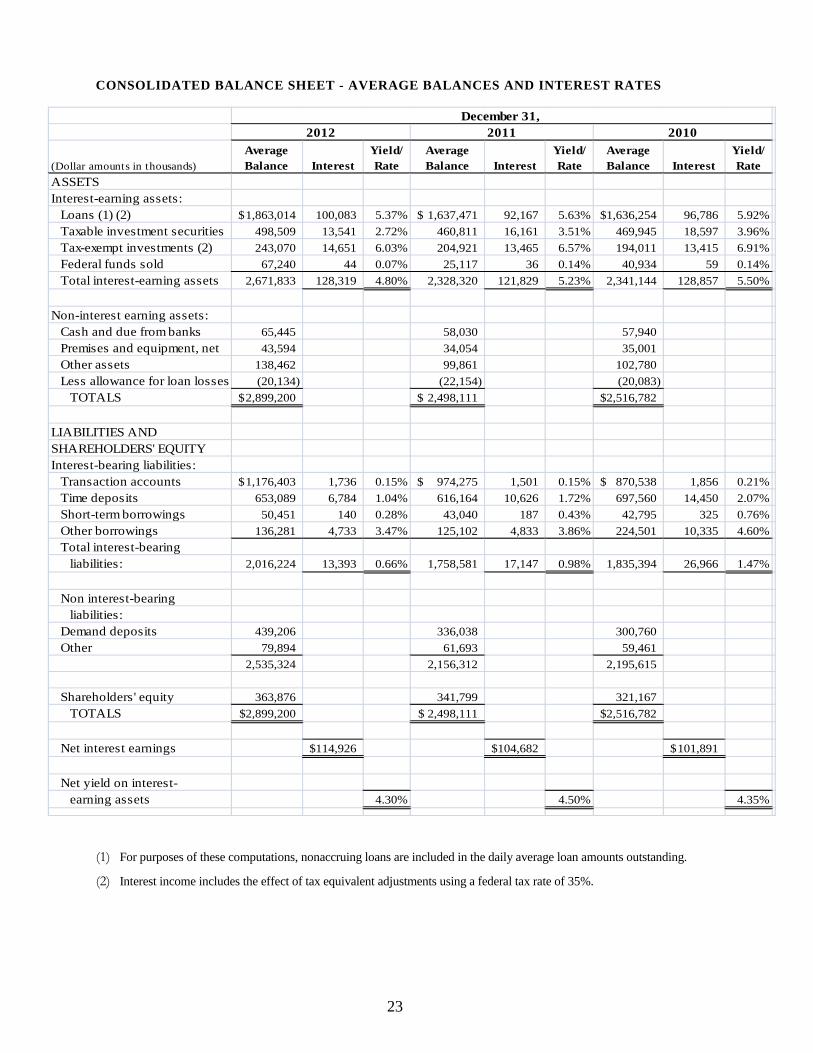
23
CONSOLIDATED BALANCE SHEET - AVERAGE BALANCES AND INTEREST RATES
(Dollar amounts in thousands)Average Balance Interest
Yield/ Rate
Average Balance Interest
Yield/ Rate
Average Balance Interest
Yield/ Rate
ASSETSInterest-earning assets: Loans (1) (2) 1,863,014$ 100,083 5.37% 1,637,471$ 92,167 5.63% 1,636,254$ 96,786 5.92% Taxable investment securities 498,509 13,541 2.72% 460,811 16,161 3.51% 469,945 18,597 3.96% Tax-exempt investments (2) 243,070 14,651 6.03% 204,921 13,465 6.57% 194,011 13,415 6.91% Federal funds sold 67,240 44 0.07% 25,117 36 0.14% 40,934 59 0.14% Total interest-earning assets 2,671,833 128,319 4.80% 2,328,320 121,829 5.23% 2,341,144 128,857 5.50%
Non-interest earning assets: Cash and due from banks 65,445 58,030 57,940 Premises and equipment, net 43,594 34,054 35,001 Other assets 138,462 99,861 102,780 Less allowance for loan losses (20,134) (22,154) (20,083) TOTALS 2,899,200$ 2,498,111$ 2,516,782$
LIABILITIES ANDSHAREHOLDERS' EQUITYInterest-bearing liabilities: Transaction accounts 1,176,403$ 1,736 0.15% 974,275$ 1,501 0.15% 870,538$ 1,856 0.21% Time deposits 653,089 6,784 1.04% 616,164 10,626 1.72% 697,560 14,450 2.07% Short-term borrowings 50,451 140 0.28% 43,040 187 0.43% 42,795 325 0.76% Other borrowings 136,281 4,733 3.47% 125,102 4,833 3.86% 224,501 10,335 4.60% Total interest-bearing liabilities: 2,016,224 13,393 0.66% 1,758,581 17,147 0.98% 1,835,394 26,966 1.47%
Non interest-bearing liabilities: Demand deposits 439,206 336,038 300,760 Other 79,894 61,693 59,461
2,535,324 2,156,312 2,195,615
Shareholders' equity 363,876 341,799 321,167 TOTALS 2,899,200$ 2,498,111$ 2,516,782$
Net interest earnings 114,926$ 104,682$ 101,891$
Net yield on interest- earning assets 4.30% 4.50% 4.35%
December 31, 2012 2011 2010
(1) For purposes of these computations, nonaccruing loans are included in the daily average loan amounts outstanding.
(2) Interest income includes the effect of tax equivalent adjustments using a federal tax rate of 35%.
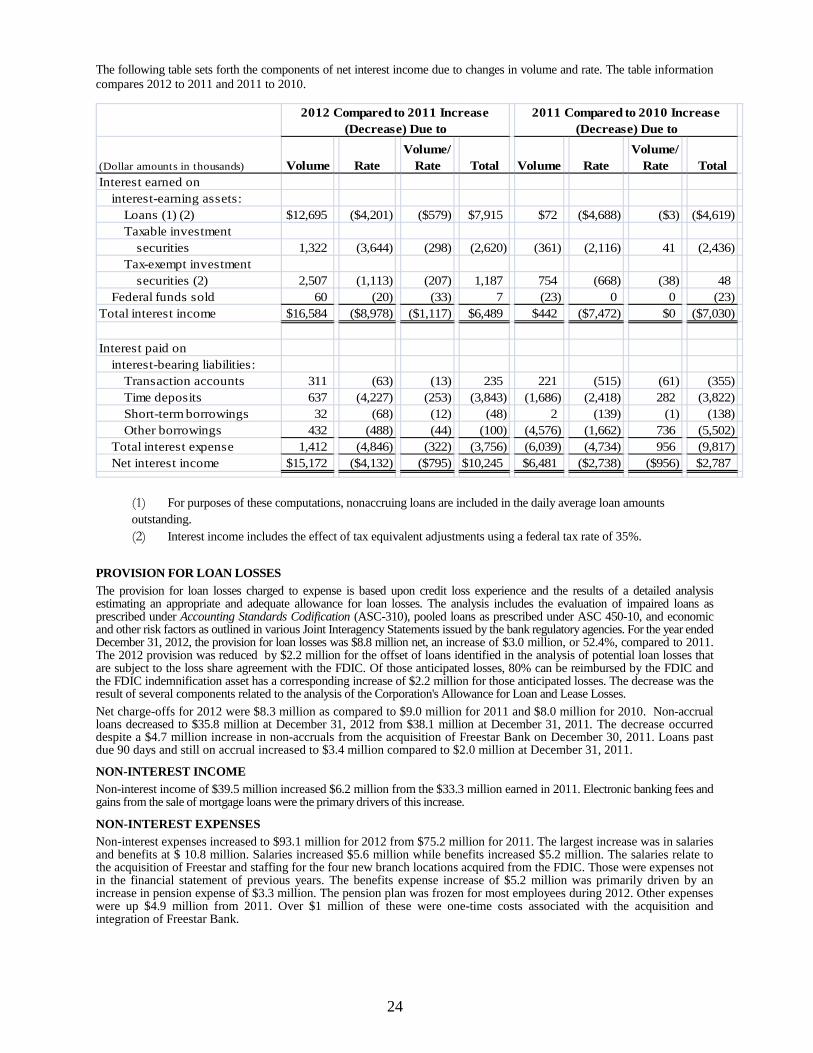
24
The following table sets forth the components of net interest income due to changes in volume and rate. The table information compares 2012 to 2011 and 2011 to 2010.
(Dollar amounts in thousands) Volume RateVolume/
Rate Total Volume RateVolume/
Rate TotalInterest earned on
interest-earning assets:Loans (1) (2) $12,695 ($4,201) ($579) $7,915 $72 ($4,688) ($3) ($4,619)Taxable investment
securities 1,322 (3,644) (298) (2,620) (361) (2,116) 41 (2,436)Tax-exempt investment
securities (2) 2,507 (1,113) (207) 1,187 754 (668) (38) 48Federal funds sold 60 (20) (33) 7 (23) 0 0 (23)
Total interest income $16,584 ($8,978) ($1,117) $6,489 $442 ($7,472) $0 ($7,030)
Interest paid oninterest-bearing liabilities:
Transaction accounts 311 (63) (13) 235 221 (515) (61) (355)Time deposits 637 (4,227) (253) (3,843) (1,686) (2,418) 282 (3,822)Short-term borrowings 32 (68) (12) (48) 2 (139) (1) (138)Other borrowings 432 (488) (44) (100) (4,576) (1,662) 736 (5,502)
Total interest expense 1,412 (4,846) (322) (3,756) (6,039) (4,734) 956 (9,817)Net interest income $15,172 ($4,132) ($795) $10,245 $6,481 ($2,738) ($956) $2,787
2011 Compared to 2010 Increase (Decrease) Due to
2012 Compared to 2011 Increase (Decrease) Due to
(1) For purposes of these computations, nonaccruing loans are included in the daily average loan amounts outstanding. (2) Interest income includes the effect of tax equivalent adjustments using a federal tax rate of 35%.
PROVISION FOR LOAN LOSSES The provision for loan losses charged to expense is based upon credit loss experience and the results of a detailed analysis estimating an appropriate and adequate allowance for loan losses. The analysis includes the evaluation of impaired loans as prescribed under Accounting Standards Codification (ASC-310), pooled loans as prescribed under ASC 450-10, and economic and other risk factors as outlined in various Joint Interagency Statements issued by the bank regulatory agencies. For the year ended December 31, 2012, the provision for loan losses was $8.8 million net, an increase of $3.0 million, or 52.4%, compared to 2011. The 2012 provision was reduced by $2.2 million for the offset of loans identified in the analysis of potential loan losses that are subject to the loss share agreement with the FDIC. Of those anticipated losses, 80% can be reimbursed by the FDIC and the FDIC indemnification asset has a corresponding increase of $2.2 million for those anticipated losses. The decrease was the result of several components related to the analysis of the Corporation's Allowance for Loan and Lease Losses. Net charge-offs for 2012 were $8.3 million as compared to $9.0 million for 2011 and $8.0 million for 2010. Non-accrual loans decreased to $35.8 million at December 31, 2012 from $38.1 million at December 31, 2011. The decrease occurred despite a $4.7 million increase in non-accruals from the acquisition of Freestar Bank on December 30, 2011. Loans past due 90 days and still on accrual increased to $3.4 million compared to $2.0 million at December 31, 2011.
NON-INTEREST INCOME Non-interest income of $39.5 million increased $6.2 million from the $33.3 million earned in 2011. Electronic banking fees and gains from the sale of mortgage loans were the primary drivers of this increase.
NON-INTEREST EXPENSES Non-interest expenses increased to $93.1 million for 2012 from $75.2 million for 2011. The largest increase was in salaries and benefits at $ 10.8 million. Salaries increased $5.6 million while benefits increased $5.2 million. The salaries relate to the acquisition of Freestar and staffing for the four new branch locations acquired from the FDIC. Those were expenses not in the financial statement of previous years. The benefits expense increase of $5.2 million was primarily driven by an increase in pension expense of $3.3 million. The pension plan was frozen for most employees during 2012. Other expenses were up $4.9 million from 2011. Over $1 million of these were one-time costs associated with the acquisition and integration of Freestar Bank.
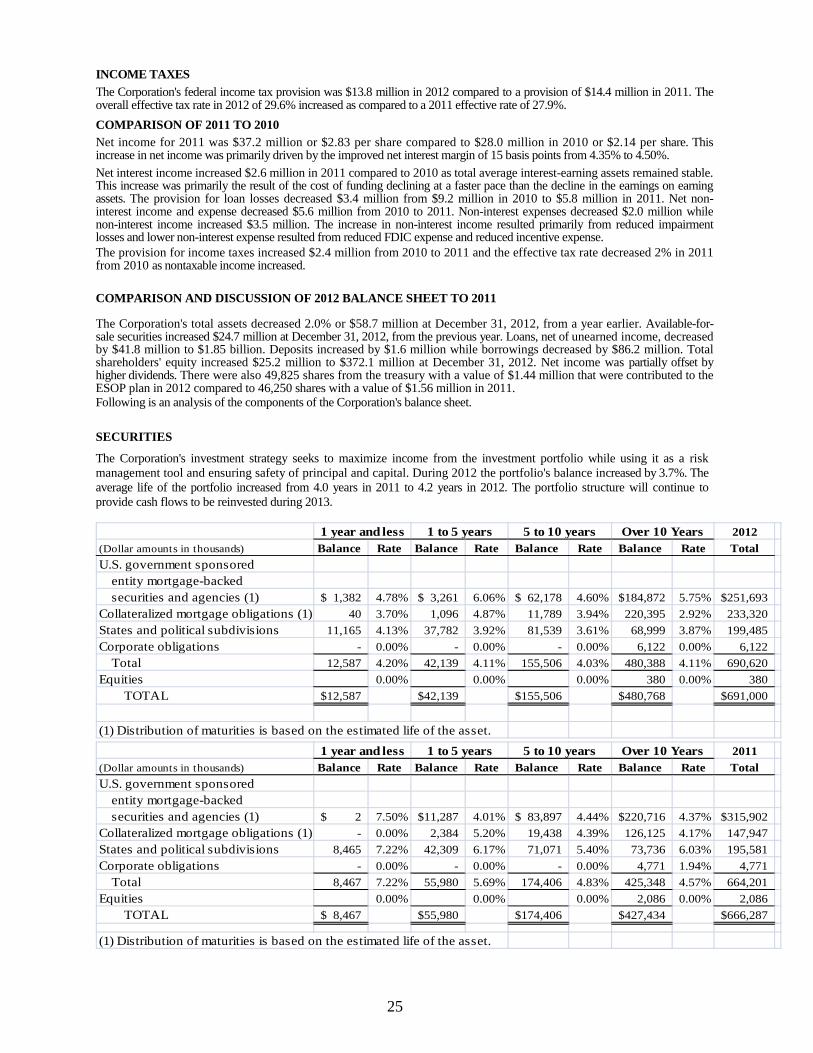
25
INCOME TAXES The Corporation's federal income tax provision was $13.8 million in 2012 compared to a provision of $14.4 million in 2011. The overall effective tax rate in 2012 of 29.6% increased as compared to a 2011 effective rate of 27.9%. COMPARISON OF 2011 TO 2010 Net income for 2011 was $37.2 million or $2.83 per share compared to $28.0 million in 2010 or $2.14 per share. This increase in net income was primarily driven by the improved net interest margin of 15 basis points from 4.35% to 4.50%. Net interest income increased $2.6 million in 2011 compared to 2010 as total average interest-earning assets remained stable. This increase was primarily the result of the cost of funding declining at a faster pace than the decline in the earnings on earning assets. The provision for loan losses decreased $3.4 million from $9.2 million in 2010 to $5.8 million in 2011. Net non-interest income and expense decreased $5.6 million from 2010 to 2011. Non-interest expenses decreased $2.0 million while non-interest income increased $3.5 million. The increase in non-interest income resulted primarily from reduced impairment losses and lower non-interest expense resulted from reduced FDIC expense and reduced incentive expense. The provision for income taxes increased $2.4 million from 2010 to 2011 and the effective tax rate decreased 2% in 2011 from 2010 as nontaxable income increased.
COMPARISON AND DISCUSSION OF 2012 BALANCE SHEET TO 2011 The Corporation's total assets decreased 2.0% or $58.7 million at December 31, 2012, from a year earlier. Available-for-sale securities increased $24.7 million at December 31, 2012, from the previous year. Loans, net of unearned income, decreased by $41.8 million to $1.85 billion. Deposits increased by $1.6 million while borrowings decreased by $86.2 million. Total shareholders' equity increased $25.2 million to $372.1 million at December 31, 2012. Net income was partially offset by higher dividends. There were also 49,825 shares from the treasury with a value of $1.44 million that were contributed to the ESOP plan in 2012 compared to 46,250 shares with a value of $1.56 million in 2011. Following is an analysis of the components of the Corporation's balance sheet.
SECURITIES
The Corporation's investment strategy seeks to maximize income from the investment portfolio while using it as a risk management tool and ensuring safety of principal and capital. During 2012 the portfolio's balance increased by 3.7%. The average life of the portfolio increased from 4.0 years in 2011 to 4.2 years in 2012. The portfolio structure will continue to provide cash flows to be reinvested during 2013.
2012(Dollar amounts in thousands) Balance Rate Balance Rate Balance Rate Balance Rate TotalU.S. government sponsored
entity mortgage-backedsecurities and agencies (1) 1,382$ 4.78% 3,261$ 6.06% 62,178$ 4.60% 184,872$ 5.75% 251,693$
Collateralized mortgage obligations (1) 40 3.70% 1,096 4.87% 11,789 3.94% 220,395 2.92% 233,320 States and political subdivisions 11,165 4.13% 37,782 3.92% 81,539 3.61% 68,999 3.87% 199,485 Corporate obligations - 0.00% - 0.00% - 0.00% 6,122 0.00% 6,122
Total 12,587 4.20% 42,139 4.11% 155,506 4.03% 480,388 4.11% 690,620 Equities 0.00% 0.00% 0.00% 380 0.00% 380
TOTAL 12,587$ 42,139$ 155,506$ 480,768$ 691,000$
(1) Distribution of maturities is based on the estimated life of the asset.
Over 10 Years5 to 10 years1 to 5 years1 year and less
2011
(Dollar amounts in thousands) Balance Rate Balance Rate Balance Rate Balance Rate TotalU.S. government sponsored
entity mortgage-backedsecurities and agencies (1) 2$ 7.50% 11,287$ 4.01% 83,897$ 4.44% 220,716$ 4.37% 315,902$
Collateralized mortgage obligations (1) - 0.00% 2,384 5.20% 19,438 4.39% 126,125 4.17% 147,947 States and political subdivisions 8,465 7.22% 42,309 6.17% 71,071 5.40% 73,736 6.03% 195,581 Corporate obligations - 0.00% - 0.00% - 0.00% 4,771 1.94% 4,771
Total 8,467 7.22% 55,980 5.69% 174,406 4.83% 425,348 4.57% 664,201 Equities 0.00% 0.00% 0.00% 2,086 0.00% 2,086
TOTAL 8,467$ 55,980$ 174,406$ 427,434$ 666,287$
(1) Distribution of maturities is based on the estimated life of the asset.
Over 10 Years5 to 10 years1 to 5 years1 year and less
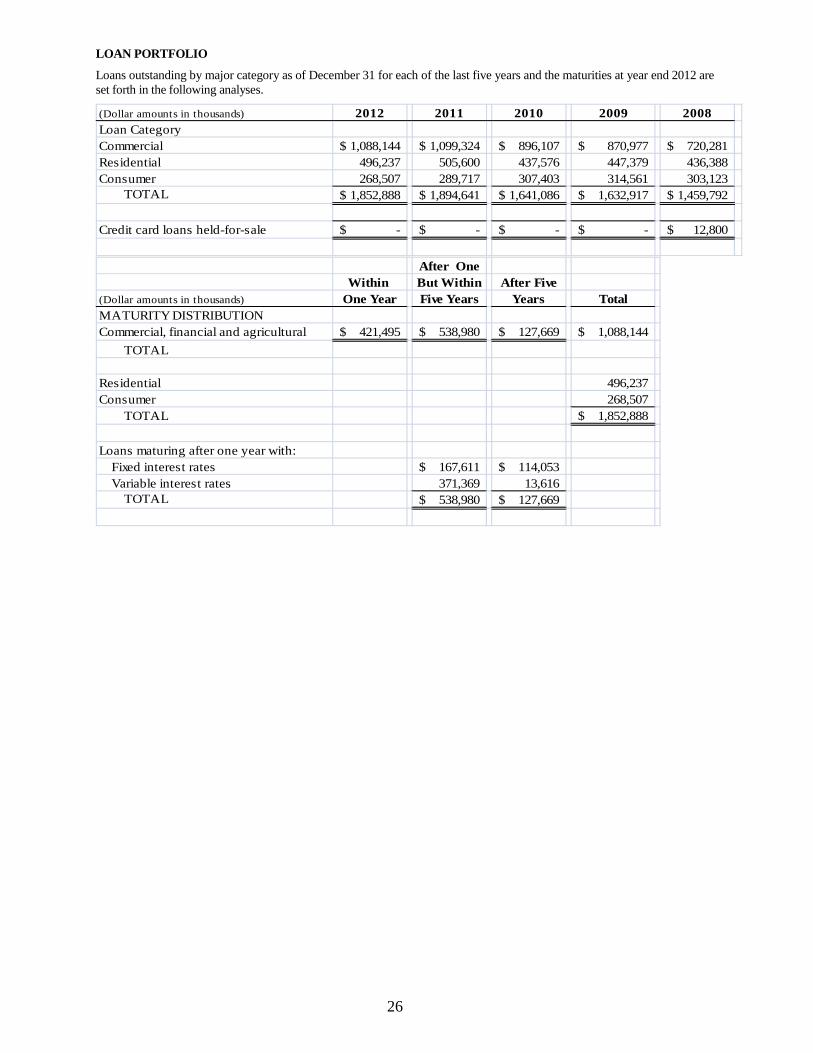
26
LOAN PORTFOLIO
Loans outstanding by major category as of December 31 for each of the last five years and the maturities at year end 2012 are set forth in the following analyses.
(Dollar amounts in thousands) 2012 2011 2010 2009 2008Loan CategoryCommercial 1,088,144$ 1,099,324$ 896,107$ 870,977$ 720,281$ Residential 496,237 505,600 437,576 447,379 436,388 Consumer 268,507 289,717 307,403 314,561 303,123
TOTAL 1,852,888$ 1,894,641$ 1,641,086$ 1,632,917$ 1,459,792$
Credit card loans held-for-sale -$ -$ -$ -$ 12,800$
After OneWithin But Within After Five
(Dollar amounts in thousands) One Year Five Years Years TotalMATURITY DISTRIBUTIONCommercial, financial and agricultural 421,495$ 538,980$ 127,669$ 1,088,144$
TOTAL
Residential 496,237 Consumer 268,507
TOTAL 1,852,888$
Loans maturing after one year with:Fixed interest rates 167,611$ 114,053$ Variable interest rates 371,369 13,616
TOTAL 538,980$ 127,669$
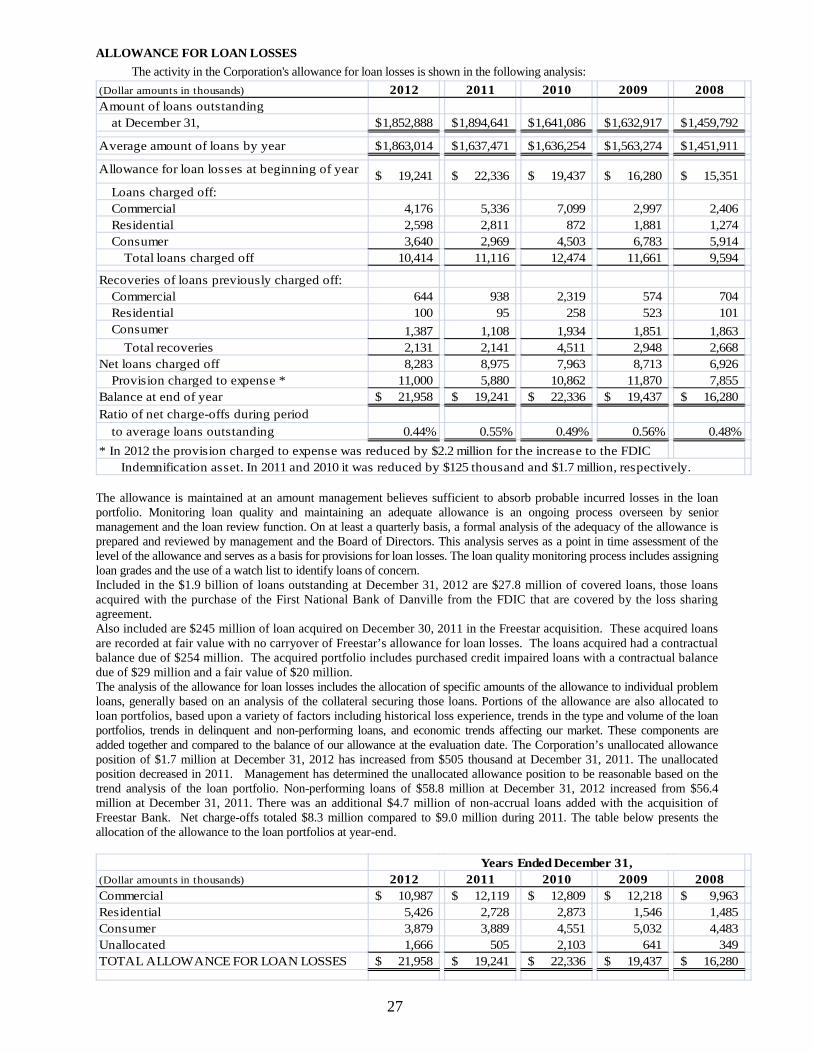
27
ALLOWANCE FOR LOAN LOSSES The activity in the Corporation's allowance for loan losses is shown in the following analysis:
(Dollar amounts in thousands) 2012 2011 2010 2009 2008Amount of loans outstanding
at December 31, 1,852,888$ 1,894,641$ 1,641,086$ 1,632,917$ 1,459,792$
Average amount of loans by year 1,863,014$ 1,637,471$ 1,636,254$ 1,563,274$ 1,451,911$
Allowance for loan losses at beginning of year 19,241$ 22,336$ 19,437$ 16,280$ 15,351$ Loans charged off:Commercial 4,176 5,336 7,099 2,997 2,406 Residential 2,598 2,811 872 1,881 1,274 Consumer 3,640 2,969 4,503 6,783 5,914
Total loans charged off 10,414 11,116 12,474 11,661 9,594
Recoveries of loans previously charged off:Commercial 644 938 2,319 574 704 Residential 100 95 258 523 101 Consumer 1,387 1,108 1,934 1,851 1,863
Total recoveries 2,131 2,141 4,511 2,948 2,668 Net loans charged off 8,283 8,975 7,963 8,713 6,926
Provision charged to expense * 11,000 5,880 10,862 11,870 7,855 Balance at end of year 21,958$ 19,241$ 22,336$ 19,437$ 16,280$ Ratio of net charge-offs during period
to average loans outstanding 0.44% 0.55% 0.49% 0.56% 0.48%* In 2012 the provision charged to expense was reduced by $2.2 million for the increase to the FDIC Indemnification asset. In 2011 and 2010 it was reduced by $125 thousand and $1.7 million, respectively.
The allowance is maintained at an amount management believes sufficient to absorb probable incurred losses in the loan portfolio. Monitoring loan quality and maintaining an adequate allowance is an ongoing process overseen by senior management and the loan review function. On at least a quarterly basis, a formal analysis of the adequacy of the allowance is prepared and reviewed by management and the Board of Directors. This analysis serves as a point in time assessment of the level of the allowance and serves as a basis for provisions for loan losses. The loan quality monitoring process includes assigning loan grades and the use of a watch list to identify loans of concern. Included in the $1.9 billion of loans outstanding at December 31, 2012 are $27.8 million of covered loans, those loans acquired with the purchase of the First National Bank of Danville from the FDIC that are covered by the loss sharing agreement. Also included are $245 million of loan acquired on December 30, 2011 in the Freestar acquisition. These acquired loans are recorded at fair value with no carryover of Freestar’s allowance for loan losses. The loans acquired had a contractual balance due of $254 million. The acquired portfolio includes purchased credit impaired loans with a contractual balance due of $29 million and a fair value of $20 million. The analysis of the allowance for loan losses includes the allocation of specific amounts of the allowance to individual problem loans, generally based on an analysis of the collateral securing those loans. Portions of the allowance are also allocated to loan portfolios, based upon a variety of factors including historical loss experience, trends in the type and volume of the loan portfolios, trends in delinquent and non-performing loans, and economic trends affecting our market. These components are added together and compared to the balance of our allowance at the evaluation date. The Corporation’s unallocated allowance position of $1.7 million at December 31, 2012 has increased from $505 thousand at December 31, 2011. The unallocated position decreased in 2011. Management has determined the unallocated allowance position to be reasonable based on the trend analysis of the loan portfolio. Non-performing loans of $58.8 million at December 31, 2012 increased from $56.4 million at December 31, 2011. There was an additional $4.7 million of non-accrual loans added with the acquisition of Freestar Bank. Net charge-offs totaled $8.3 million compared to $9.0 million during 2011. The table below presents the allocation of the allowance to the loan portfolios at year-end.
(Dollar amounts in thousands) 2012 2011 2010 2009 2008Commercial 10,987$ 12,119$ 12,809$ 12,218$ 9,963$ Residential 5,426 2,728 2,873 1,546 1,485 Consumer 3,879 3,889 4,551 5,032 4,483 Unallocated 1,666 505 2,103 641 349 TOTAL ALLOWANCE FOR LOAN LOSSES 21,958$ 19,241$ 22,336$ 19,437$ 16,280$
Years Ended December 31,
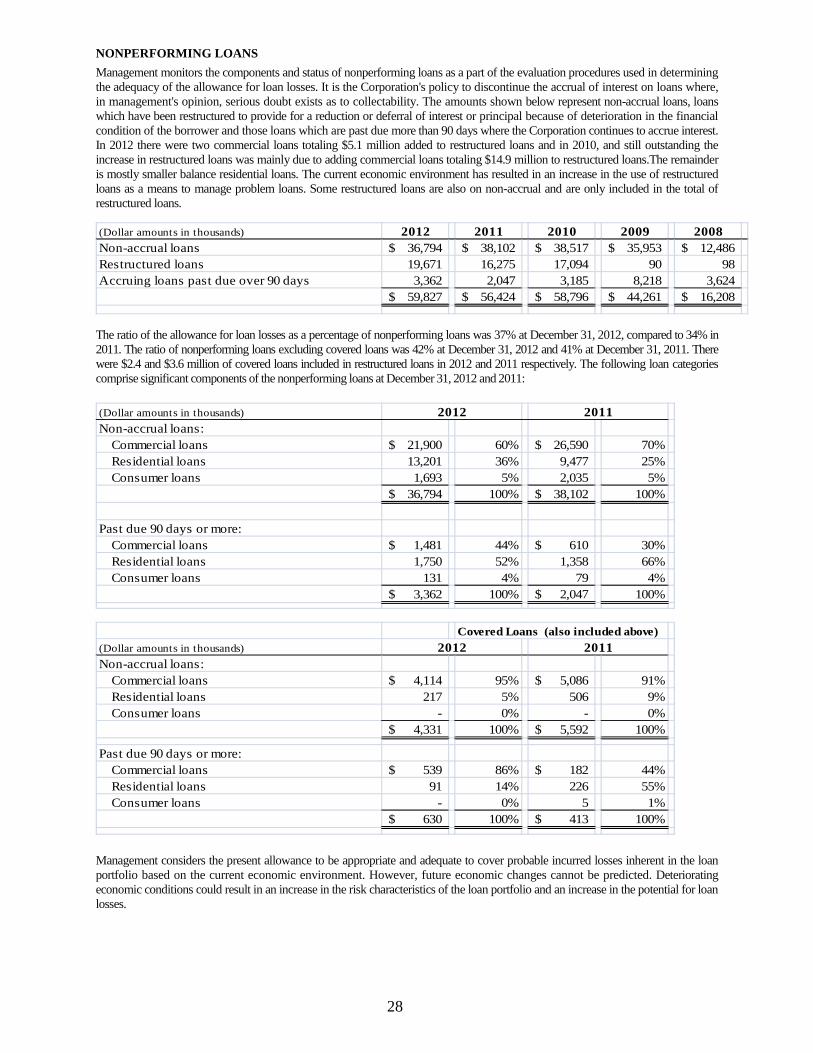
28
NONPERFORMING LOANS Management monitors the components and status of nonperforming loans as a part of the evaluation procedures used in determining the adequacy of the allowance for loan losses. It is the Corporation's policy to discontinue the accrual of interest on loans where, in management's opinion, serious doubt exists as to collectability. The amounts shown below represent non-accrual loans, loans which have been restructured to provide for a reduction or deferral of interest or principal because of deterioration in the financial condition of the borrower and those loans which are past due more than 90 days where the Corporation continues to accrue interest. In 2012 there were two commercial loans totaling $5.1 million added to restructured loans and in 2010, and still outstanding the increase in restructured loans was mainly due to adding commercial loans totaling $14.9 million to restructured loans.The remainder is mostly smaller balance residential loans. The current economic environment has resulted in an increase in the use of restructured loans as a means to manage problem loans. Some restructured loans are also on non-accrual and are only included in the total of restructured loans.
(Dollar amounts in thousands) 2012 2011 2010 2009 2008Non-accrual loans 36,794$ 38,102$ 38,517$ 35,953$ 12,486$ Restructured loans 19,671 16,275 17,094 90 98 Accruing loans past due over 90 days 3,362 2,047 3,185 8,218 3,624
59,827$ 56,424$ 58,796$ 44,261$ 16,208$
The ratio of the allowance for loan losses as a percentage of nonperforming loans was 37% at December 31, 2012, compared to 34% in 2011. The ratio of nonperforming loans excluding covered loans was 42% at December 31, 2012 and 41% at December 31, 2011. There were $2.4 and $3.6 million of covered loans included in restructured loans in 2012 and 2011 respectively. The following loan categories comprise significant components of the nonperforming loans at December 31, 2012 and 2011:
(Dollar amounts in thousands)Non-accrual loans:
Commercial loans 21,900$ 60% 26,590$ 70%Residential loans 13,201 36% 9,477 25%Consumer loans 1,693 5% 2,035 5%
36,794$ 100% 38,102$ 100%
Past due 90 days or more:Commercial loans 1,481$ 44% 610$ 30%Residential loans 1,750 52% 1,358 66%Consumer loans 131 4% 79 4%
3,362$ 100% 2,047$ 100%
20112012
Covered Loans (also included above)(Dollar amounts in thousands)Non-accrual loans:
Commercial loans 4,114$ 95% 5,086$ 91%Residential loans 217 5% 506 9%Consumer loans - 0% - 0%
4,331$ 100% 5,592$ 100%
Past due 90 days or more:Commercial loans 539$ 86% 182$ 44%Residential loans 91 14% 226 55%Consumer loans - 0% 5 1%
630$ 100% 413$ 100%
2012 2011
Management considers the present allowance to be appropriate and adequate to cover probable incurred losses inherent in the loan portfolio based on the current economic environment. However, future economic changes cannot be predicted. Deteriorating economic conditions could result in an increase in the risk characteristics of the loan portfolio and an increase in the potential for loan losses.
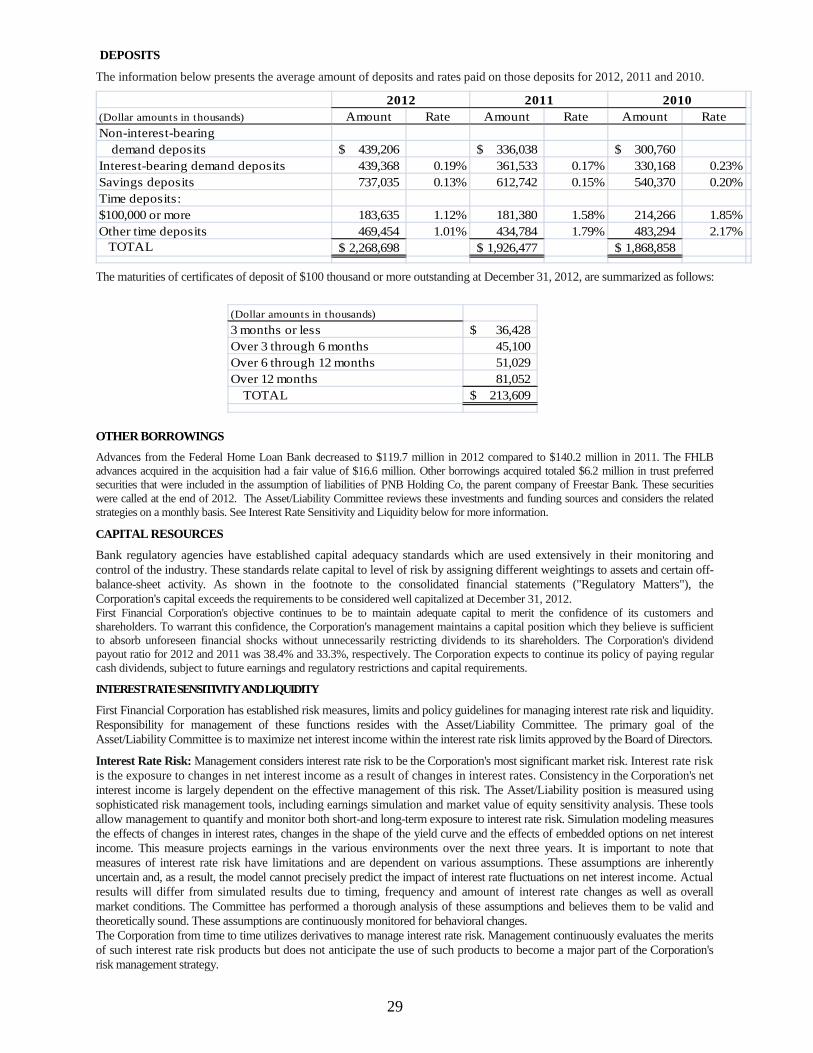
29
DEPOSITS
The information below presents the average amount of deposits and rates paid on those deposits for 2012, 2011 and 2010.
(Dollar amounts in thousands) Amount Rate Amount Rate Amount RateNon-interest-bearing
demand deposits 439,206$ 336,038$ 300,760$ Interest-bearing demand deposits 439,368 0.19% 361,533 0.17% 330,168 0.23%Savings deposits 737,035 0.13% 612,742 0.15% 540,370 0.20%Time deposits:$100,000 or more 183,635 1.12% 181,380 1.58% 214,266 1.85%Other time deposits 469,454 1.01% 434,784 1.79% 483,294 2.17% TOTAL 2,268,698$ 1,926,477$ 1,868,858$
201020112012
The maturities of certificates of deposit of $100 thousand or more outstanding at December 31, 2012, are summarized as follows:
(Dollar amounts in thousands)3 months or less 36,428$ Over 3 through 6 months 45,100 Over 6 through 12 months 51,029 Over 12 months 81,052
TOTAL 213,609$
OTHER BORROWINGS Advances from the Federal Home Loan Bank decreased to $119.7 million in 2012 compared to $140.2 million in 2011. The FHLB advances acquired in the acquisition had a fair value of $16.6 million. Other borrowings acquired totaled $6.2 million in trust preferred securities that were included in the assumption of liabilities of PNB Holding Co, the parent company of Freestar Bank. These securities were called at the end of 2012. The Asset/Liability Committee reviews these investments and funding sources and considers the related strategies on a monthly basis. See Interest Rate Sensitivity and Liquidity below for more information.
CAPITAL RESOURCES
Bank regulatory agencies have established capital adequacy standards which are used extensively in their monitoring and control of the industry. These standards relate capital to level of risk by assigning different weightings to assets and certain off-balance-sheet activity. As shown in the footnote to the consolidated financial statements ("Regulatory Matters"), the Corporation's capital exceeds the requirements to be considered well capitalized at December 31, 2012. First Financial Corporation's objective continues to be to maintain adequate capital to merit the confidence of its customers and shareholders. To warrant this confidence, the Corporation's management maintains a capital position which they believe is sufficient to absorb unforeseen financial shocks without unnecessarily restricting dividends to its shareholders. The Corporation's dividend payout ratio for 2012 and 2011 was 38.4% and 33.3%, respectively. The Corporation expects to continue its policy of paying regular cash dividends, subject to future earnings and regulatory restrictions and capital requirements.
INTEREST RATE SENSITIVITY AND LIQUIDITY
First Financial Corporation has established risk measures, limits and policy guidelines for managing interest rate risk and liquidity. Responsibility for management of these functions resides with the Asset/Liability Committee. The primary goal of the Asset/Liability Committee is to maximize net interest income within the interest rate risk limits approved by the Board of Directors.
Interest Rate Risk: Management considers interest rate risk to be the Corporation's most significant market risk. Interest rate risk is the exposure to changes in net interest income as a result of changes in interest rates. Consistency in the Corporation's net interest income is largely dependent on the effective management of this risk. The Asset/Liability position is measured using sophisticated risk management tools, including earnings simulation and market value of equity sensitivity analysis. These tools allow management to quantify and monitor both short-and long-term exposure to interest rate risk. Simulation modeling measures the effects of changes in interest rates, changes in the shape of the yield curve and the effects of embedded options on net interest income. This measure projects earnings in the various environments over the next three years. It is important to note that measures of interest rate risk have limitations and are dependent on various assumptions. These assumptions are inherently uncertain and, as a result, the model cannot precisely predict the impact of interest rate fluctuations on net interest income. Actual results will differ from simulated results due to timing, frequency and amount of interest rate changes as well as overall market conditions. The Committee has performed a thorough analysis of these assumptions and believes them to be valid and theoretically sound. These assumptions are continuously monitored for behavioral changes. The Corporation from time to time utilizes derivatives to manage interest rate risk. Management continuously evaluates the merits of such interest rate risk products but does not anticipate the use of such products to become a major part of the Corporation's risk management strategy.
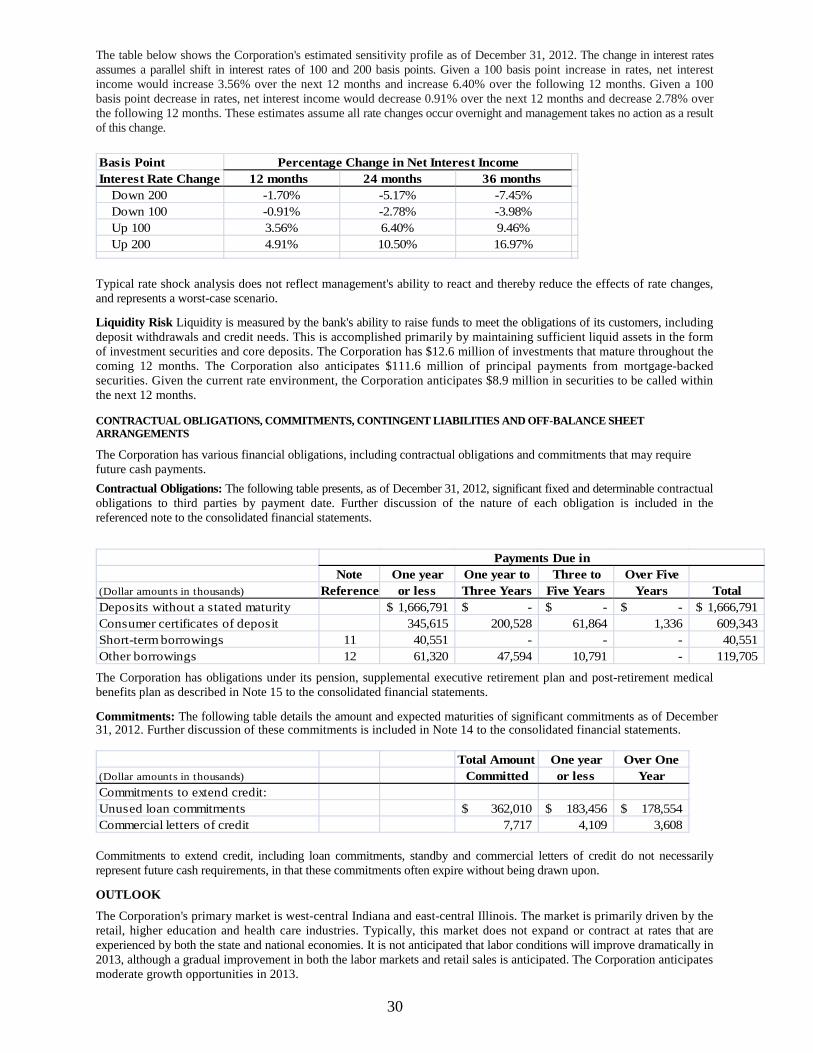
30
The table below shows the Corporation's estimated sensitivity profile as of December 31, 2012. The change in interest rates assumes a parallel shift in interest rates of 100 and 200 basis points. Given a 100 basis point increase in rates, net interest income would increase 3.56% over the next 12 months and increase 6.40% over the following 12 months. Given a 100 basis point decrease in rates, net interest income would decrease 0.91% over the next 12 months and decrease 2.78% over the following 12 months. These estimates assume all rate changes occur overnight and management takes no action as a result of this change.
Basis PointInterest Rate Change 12 months 24 months 36 months
Down 200 -1.70% -5.17% -7.45%Down 100 -0.91% -2.78% -3.98%Up 100 3.56% 6.40% 9.46%Up 200 4.91% 10.50% 16.97%
Percentage Change in Net Interest Income
Typical rate shock analysis does not reflect management's ability to react and thereby reduce the effects of rate changes, and represents a worst-case scenario.
Liquidity Risk Liquidity is measured by the bank's ability to raise funds to meet the obligations of its customers, including deposit withdrawals and credit needs. This is accomplished primarily by maintaining sufficient liquid assets in the form of investment securities and core deposits. The Corporation has $12.6 million of investments that mature throughout the coming 12 months. The Corporation also anticipates $111.6 million of principal payments from mortgage-backed securities. Given the current rate environment, the Corporation anticipates $8.9 million in securities to be called within the next 12 months.
CONTRACTUAL OBLIGATIONS, COMMITMENTS, CONTINGENT LIABILITIES AND OFF-BALANCE SHEET ARRANGEMENTS
The Corporation has various financial obligations, including contractual obligations and commitments that may require future cash payments. Contractual Obligations: The following table presents, as of December 31, 2012, significant fixed and determinable contractual obligations to third parties by payment date. Further discussion of the nature of each obligation is included in the referenced note to the consolidated financial statements.
Note One year One year to Three to Over Five(Dollar amounts in thousands) Reference or less Three Years Five Years Years TotalDeposits without a stated maturity 1,666,791$ -$ -$ -$ 1,666,791$ Consumer certificates of deposit 345,615 200,528 61,864 1,336 609,343 Short-term borrowings 11 40,551 - - - 40,551 Other borrowings 12 61,320 47,594 10,791 - 119,705
Payments Due in
The Corporation has obligations under its pension, supplemental executive retirement plan and post-retirement medical benefits plan as described in Note 15 to the consolidated financial statements.
Commitments: The following table details the amount and expected maturities of significant commitments as of December 31, 2012. Further discussion of these commitments is included in Note 14 to the consolidated financial statements.
Total Amount One year Over One
(Dollar amounts in thousands) Committed or less YearCommitments to extend credit:Unused loan commitments 362,010$ 183,456$ 178,554$ Commercial letters of credit 7,717 4,109 3,608
Commitments to extend credit, including loan commitments, standby and commercial letters of credit do not necessarily represent future cash requirements, in that these commitments often expire without being drawn upon.
OUTLOOK
The Corporation's primary market is west-central Indiana and east-central Illinois. The market is primarily driven by the retail, higher education and health care industries. Typically, this market does not expand or contract at rates that are experienced by both the state and national economies. It is not anticipated that labor conditions will improve dramatically in 2013, although a gradual improvement in both the labor markets and retail sales is anticipated. The Corporation anticipates moderate growth opportunities in 2013.
31
ITEM 7A.
QUANTITATIVE AND QUALITATIVE DISCLOSURES ABOUT MARKET RISK
The information contained under the caption “Management’s Discussion and Analysis of Financial Condition and Results of Operations — Market Risk” on pages 28 and 29 of this Form 10-K is incorporated herein by reference in response to this item.
ITEM 8. FINANCIAL STATEMENTS AND SUPPLEMENTARY DATA
MANAGEMENT'S REPORT ON INTERNAL CONTROL OVER FINANCIAL REPORTING
The management of First Financial Corporation (the "Corporation") has prepared and is responsible for the preparation and accuracy of the consolidated financial statements and related financial information included in the Annual Report. The management of the Corporation is responsible for establishing and maintaining adequate internal control over financial reporting as defined in Rules 13a-15(f) and 15d-15(f) under the Securities Exchange Act of 1934. The Corporation's internal control over financial reporting is designed to provide reasonable assurance regarding the reliability of financial reporting and the preparation of financial statements for external purposes in accordance with generally accepted accounting principles. The Corporation's internal control over financial reporting includes those policies and procedures that: (i) pertain to the maintenance of records that, in reasonable detail, accurately and fairly reflect the transactions and dispositions of the assets of the Corporation; (ii) provide reasonable assurance that transactions are recorded as necessary to permit preparation of financial statements in accordance with generally accepted accounting principles, and that receipts and expenditures of the Corporation are being made only in accordance with authorizations of management and directors of the Corporation; and (iii) provide reasonable assurance regarding prevention or timely detection of unauthorized acquisition, use or disposition of the Corporation's assets that could have a material effect on the financial statements. Because of its inherent limitations, internal control over financial reporting may not prevent or detect misstatements. Also, projections of any evaluation of effectiveness to future periods are subject to the risk that controls may become inadequate because of changes in conditions, or that the degree of compliance with the policies or procedures may deteriorate. Management assessed the Corporation's system of internal control over financial reporting as of December 31, 2012, in relation to criteria for effective internal control over financial reporting as described in "Internal Control—Integrated Framework," issued by the Committee of Sponsoring Organizations of the Treadway Commission. Based on this assessment, management concluded that, as of December 31, 2012, its system of internal control over financial reporting is effective and meets the criteria of the "Internal Control—Integrated Framework." Crowe Horwath LLP, independent registered public accounting firm, has issued a report dated March 15, 2013 on the Corporation's internal control over financial reporting.
32
REPORT OF INDEPENDENT REGISTERED PUBLIC ACCOUNTING FIRM To the Shareholders and Board of Directors of First Financial Corporation: We have audited the accompanying consolidated balance sheets of First Financial Corporation as of December 31, 2012 and 2011 and the related consolidated statements of income and comprehensive income, changes in shareholders' equity, and cash flows for each of the three years in the period ended December 31, 2012. We also have audited First Financial Corporation's internal control over financial reporting as of December 31, 2012, based on criteria established in Internal Control—Integrated Framework issued by the Committee of Sponsoring Organizations of the Treadway Commission (COSO). First Financial Corporation's management is responsible for these financial statements, for maintaining effective internal control over financial reporting, and for its assessment of the effectiveness of internal control over financial reporting, included in the accompanying Management's Report on Internal Control over Financial Reporting. Our responsibility is to express an opinion on these financial statements and an opinion on the company's internal control over financial reporting based on our audits. We conducted our audits in accordance with the standards of the Public Company Accounting Oversight Board (United States). Those standards require that we plan and perform the audits to obtain reasonable assurance about whether the financial statements are free of material misstatement and whether effective internal control over financial reporting was maintained in all material respects. Our audits of the financial statements included examining, on a test basis, evidence supporting the amounts and disclosures in the financial statements, assessing the accounting principles used and significant estimates made by management, and evaluating the overall financial statement presentation. Our audit of internal control over financial reporting included obtaining an understanding of internal control over financial reporting, assessing the risk that a material weakness exists, and testing and evaluating the design and operating effectiveness of internal control based on the assessed risk. Our audits also included performing such other procedures as we considered necessary in the circumstances. We believe that our audits provide a reasonable basis for our opinions. A company's internal control over financial reporting is a process designed to provide reasonable assurance regarding the reliability of financial reporting and the preparation of financial statements for external purposes in accordance with generally accepted accounting principles. A company's internal control over financial reporting includes those policies and procedures that (1) pertain to the maintenance of records that, in reasonable detail, accurately and fairly reflect the transactions and dispositions of the assets of the company; (2) provide reasonable assurance that transactions are recorded as necessary to permit preparation of financial statements in accordance with generally accepted accounting principles, and that receipts and expenditures of the company are being made only in accordance with authorizations of management and directors of the company; and (3) provide reasonable assurance regarding prevention or timely detection of unauthorized acquisition, use, or disposition of the company's assets that could have a material effect on the financial statements. Because of its inherent limitations, internal control over financial reporting may not prevent or detect misstatements. Also, projections of any evaluation of effectiveness to future periods are subject to the risk that controls may become inadequate because of changes in conditions, or that the degree of compliance with the policies or procedures may deteriorate. In our opinion, the consolidated financial statements referred to above present fairly, in all material respects, the financial position of First Financial Corporation as of December 31, 2012 and 2011, and the results of its operations and its cash flows for each of the three years in the period ended December 31, 2012, in conformity with accounting principles generally accepted in the United States of America. Also in our opinion First Financial Corporation maintained, in all material respects, effective internal control over financial reporting as of December 31, 2012, based on criteria established in Internal Control —Integrated Framework issued by the COSO.
Crowe Horwath LLP
Indianapolis, Indiana March 15, 2013
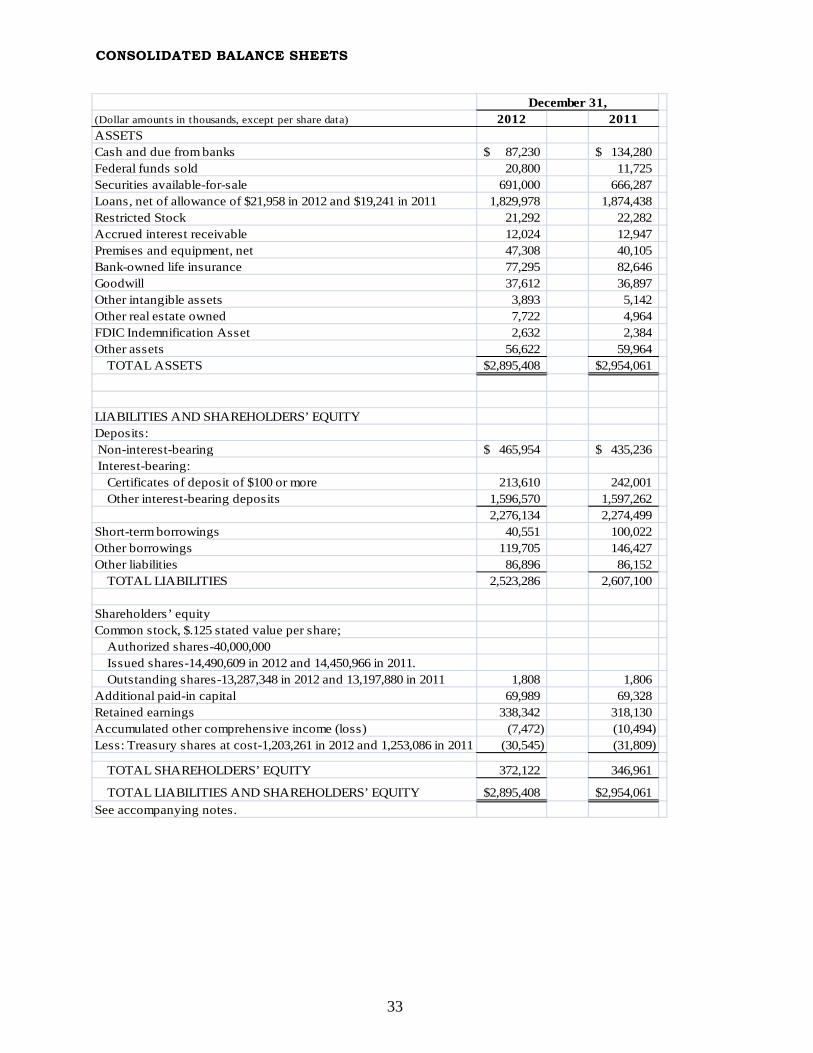
33
CONSOLIDATED BALANCE SHEETS
December 31,
(Dollar amounts in thousands, except per share data) 2012 2011ASSETSCash and due from banks 87,230$ 134,280$ Federal funds sold 20,800 11,725 Securities available-for-sale 691,000 666,287 Loans, net of allowance of $21,958 in 2012 and $19,241 in 2011 1,829,978 1,874,438 Restricted Stock 21,292 22,282 Accrued interest receivable 12,024 12,947 Premises and equipment, net 47,308 40,105 Bank-owned life insurance 77,295 82,646 Goodwill 37,612 36,897 Other intangible assets 3,893 5,142 Other real estate owned 7,722 4,964 FDIC Indemnification Asset 2,632 2,384 Other assets 56,622 59,964
TOTAL ASSETS 2,895,408$ 2,954,061$
LIABILITIES AND SHAREHOLDERS’ EQUITYDeposits: Non-interest-bearing 465,954$ 435,236$ Interest-bearing:
Certificates of deposit of $100 or more 213,610 242,001 Other interest-bearing deposits 1,596,570 1,597,262
2,276,134 2,274,499 Short-term borrowings 40,551 100,022 Other borrowings 119,705 146,427 Other liabilities 86,896 86,152
TOTAL LIABILITIES 2,523,286 2,607,100
Shareholders’ equityCommon stock, $.125 stated value per share;
Authorized shares-40,000,000Issued shares-14,490,609 in 2012 and 14,450,966 in 2011.Outstanding shares-13,287,348 in 2012 and 13,197,880 in 2011 1,808 1,806
Additional paid-in capital 69,989 69,328 Retained earnings 338,342 318,130 Accumulated other comprehensive income (loss) (7,472) (10,494) Less: Treasury shares at cost-1,203,261 in 2012 and 1,253,086 in 2011 (30,545) (31,809)
TOTAL SHAREHOLDERS’ EQUITY 372,122 346,961
TOTAL LIABILITIES AND SHAREHOLDERS’ EQUITY 2,895,408$ 2,954,061$ See accompanying notes.
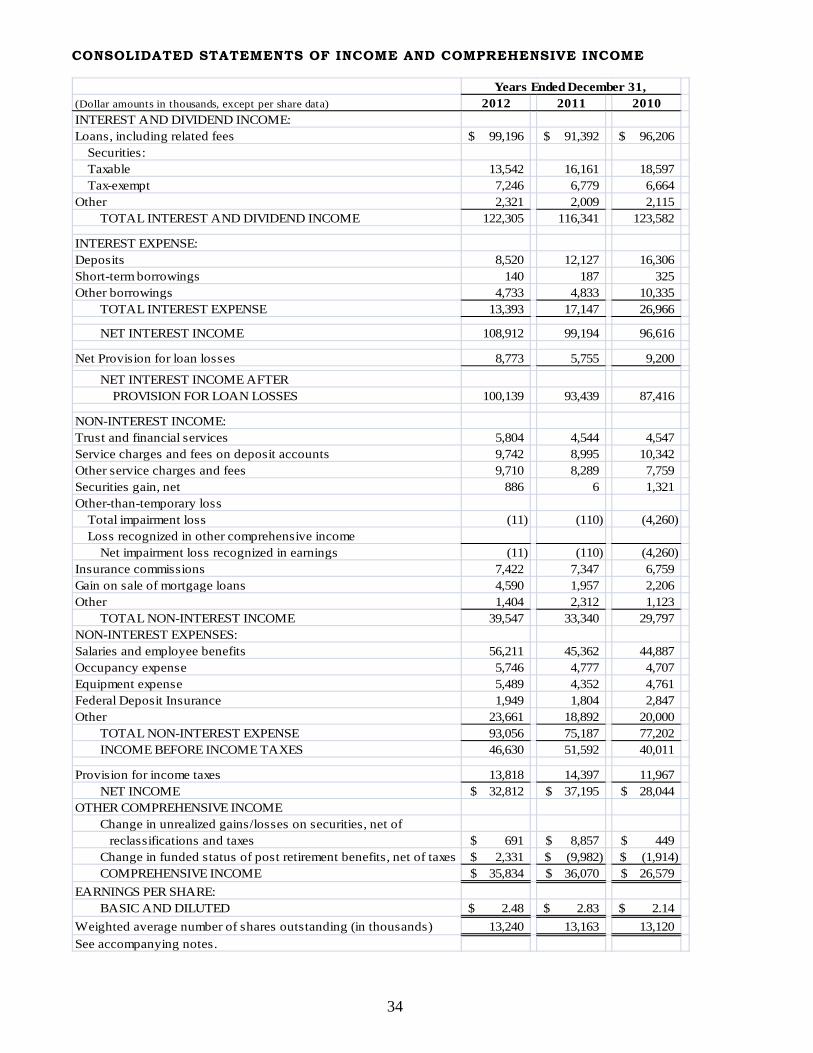
34
CONSOLIDATED STATEMENTS OF INCOME AND COMPREHENSIVE INCOME
Years Ended December 31, (Dollar amounts in thousands, except per share data) 2012 2011 2010INTEREST AND DIVIDEND INCOME:Loans, including related fees 99,196$ 91,392$ 96,206$
Securities:Taxable 13,542 16,161 18,597 Tax-exempt 7,246 6,779 6,664
Other 2,321 2,009 2,115 TOTAL INTEREST AND DIVIDEND INCOME 122,305 116,341 123,582
INTEREST EXPENSE:Deposits 8,520 12,127 16,306 Short-term borrowings 140 187 325 Other borrowings 4,733 4,833 10,335
TOTAL INTEREST EXPENSE 13,393 17,147 26,966
NET INTEREST INCOME 108,912 99,194 96,616
Net Provision for loan losses 8,773 5,755 9,200
NET INTEREST INCOME AFTERPROVISION FOR LOAN LOSSES 100,139 93,439 87,416
NON-INTEREST INCOME:Trust and financial services 5,804 4,544 4,547 Service charges and fees on deposit accounts 9,742 8,995 10,342 Other service charges and fees 9,710 8,289 7,759 Securities gain, net 886 6 1,321 Other-than-temporary loss
Total impairment loss (11) (110) (4,260) Loss recognized in other comprehensive income
Net impairment loss recognized in earnings (11) (110) (4,260) Insurance commissions 7,422 7,347 6,759 Gain on sale of mortgage loans 4,590 1,957 2,206 Other 1,404 2,312 1,123
TOTAL NON-INTEREST INCOME 39,547 33,340 29,797 NON-INTEREST EXPENSES:Salaries and employee benefits 56,211 45,362 44,887 Occupancy expense 5,746 4,777 4,707 Equipment expense 5,489 4,352 4,761 Federal Deposit Insurance 1,949 1,804 2,847 Other 23,661 18,892 20,000
TOTAL NON-INTEREST EXPENSE 93,056 75,187 77,202 INCOME BEFORE INCOME TAXES 46,630 51,592 40,011
Provision for income taxes 13,818 14,397 11,967 NET INCOME 32,812$ 37,195$ 28,044$
OTHER COMPREHENSIVE INCOMEChange in unrealized gains/losses on securities, net of reclassifications and taxes 691$ 8,857$ 449$ Change in funded status of post retirement benefits, net of taxes 2,331$ (9,982)$ (1,914)$ COMPREHENSIVE INCOME 35,834$ 36,070$ 26,579$
EARNINGS PER SHARE:BASIC AND DILUTED 2.48$ 2.83$ 2.14$
Weighted average number of shares outstanding (in thousands) 13,240 13,163 13,120 See accompanying notes.
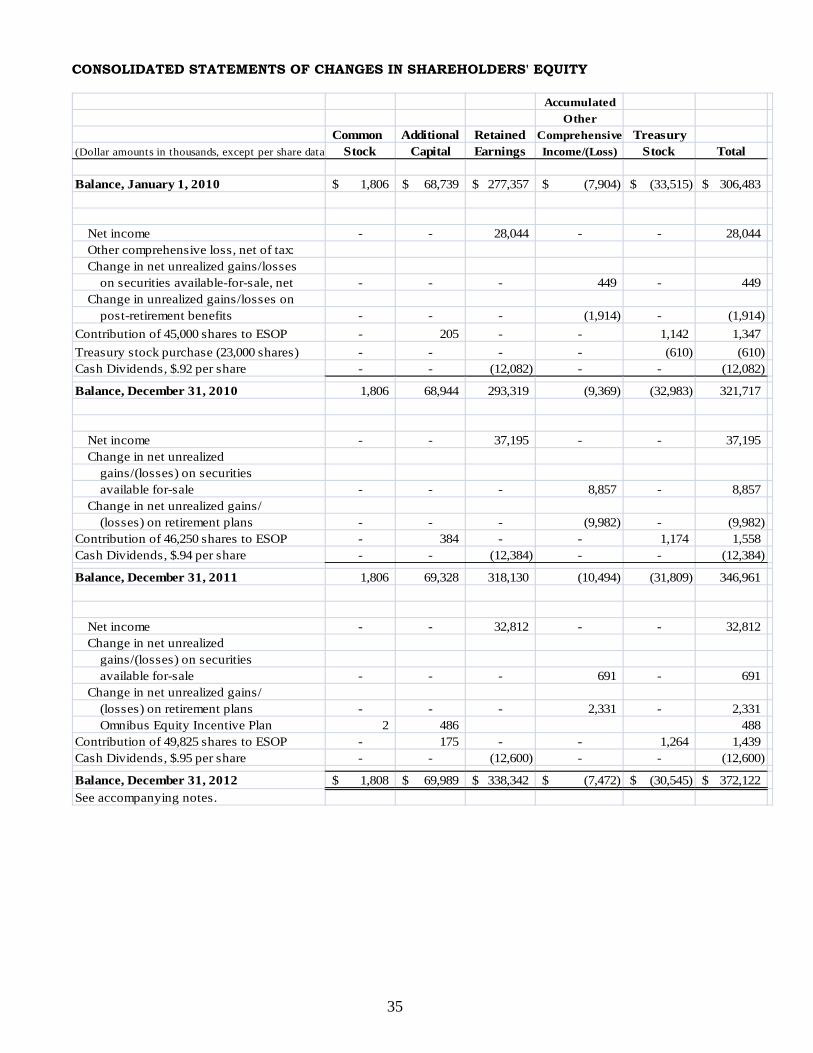
35
CONSOLIDATED STATEMENTS OF CHANGES IN SHAREHOLDERS' EQUITY
AccumulatedOther
Common Additional Retained Comprehensive Treasury(Dollar amounts in thousands, except per share data) Stock Capital Earnings Income/(Loss) Stock Total
Balance, January 1, 2010 1,806$ 68,739$ 277,357$ (7,904)$ (33,515)$ 306,483$
Net income - - 28,044 - - 28,044 Other comprehensive loss, net of tax:Change in net unrealized gains/losses
on securities available-for-sale, net - - - 449 - 449 Change in unrealized gains/losses on
post-retirement benefits - - - (1,914) - (1,914) Contribution of 45,000 shares to ESOP - 205 - - 1,142 1,347 Treasury stock purchase (23,000 shares) - - - - (610) (610) Cash Dividends, $.92 per share - - (12,082) - - (12,082)
Balance, December 31, 2010 1,806 68,944 293,319 (9,369) (32,983) 321,717
Net income - - 37,195 - - 37,195 Change in net unrealized
gains/(losses) on securitiesavailable for-sale - - - 8,857 - 8,857
Change in net unrealized gains/(losses) on retirement plans - - - (9,982) - (9,982)
Contribution of 46,250 shares to ESOP - 384 - - 1,174 1,558 Cash Dividends, $.94 per share - - (12,384) - - (12,384)
Balance, December 31, 2011 1,806 69,328 318,130 (10,494) (31,809) 346,961
Net income - - 32,812 - - 32,812 Change in net unrealized
gains/(losses) on securitiesavailable for-sale - - - 691 - 691
Change in net unrealized gains/(losses) on retirement plans - - - 2,331 - 2,331 Omnibus Equity Incentive Plan 2 486 488
Contribution of 49,825 shares to ESOP - 175 - - 1,264 1,439 Cash Dividends, $.95 per share - - (12,600) - - (12,600)
Balance, December 31, 2012 1,808$ 69,989$ 338,342$ (7,472)$ (30,545)$ 372,122$ See accompanying notes.
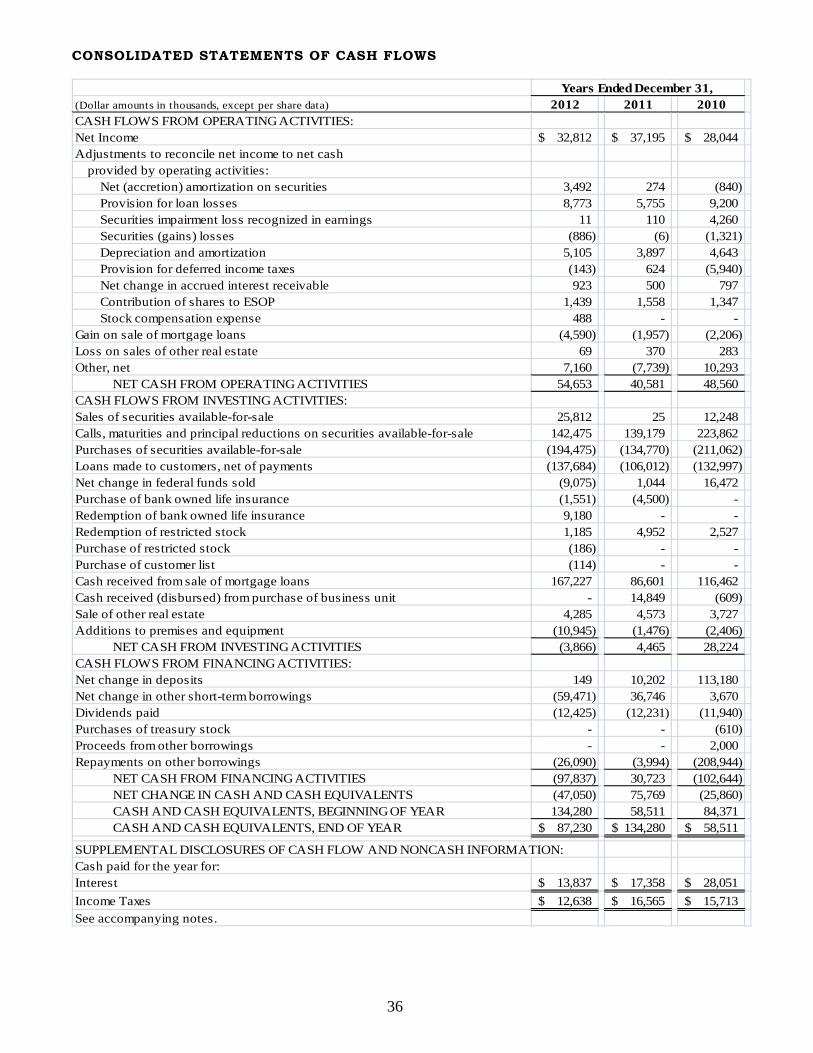
36
CONSOLIDATED STATEMENTS OF CASH FLOWS
Years Ended December 31, (Dollar amounts in thousands, except per share data) 2012 2011 2010CASH FLOWS FROM OPERATING ACTIVITIES:Net Income 32,812$ 37,195$ 28,044$ Adjustments to reconcile net income to net cash
provided by operating activities:Net (accretion) amortization on securities 3,492 274 (840) Provision for loan losses 8,773 5,755 9,200 Securities impairment loss recognized in earnings 11 110 4,260 Securities (gains) losses (886) (6) (1,321) Depreciation and amortization 5,105 3,897 4,643 Provision for deferred income taxes (143) 624 (5,940) Net change in accrued interest receivable 923 500 797 Contribution of shares to ESOP 1,439 1,558 1,347 Stock compensation expense 488 - -
Gain on sale of mortgage loans (4,590) (1,957) (2,206) Loss on sales of other real estate 69 370 283 Other, net 7,160 (7,739) 10,293
NET CASH FROM OPERATING ACTIVITIES 54,653 40,581 48,560 CASH FLOWS FROM INVESTING ACTIVITIES:Sales of securities available-for-sale 25,812 25 12,248 Calls, maturities and principal reductions on securities available-for-sale 142,475 139,179 223,862 Purchases of securities available-for-sale (194,475) (134,770) (211,062) Loans made to customers, net of payments (137,684) (106,012) (132,997) Net change in federal funds sold (9,075) 1,044 16,472 Purchase of bank owned life insurance (1,551) (4,500) - Redemption of bank owned life insurance 9,180 - - Redemption of restricted stock 1,185 4,952 2,527 Purchase of restricted stock (186) - - Purchase of customer list (114) - - Cash received from sale of mortgage loans 167,227 86,601 116,462 Cash received (disbursed) from purchase of business unit - 14,849 (609) Sale of other real estate 4,285 4,573 3,727 Additions to premises and equipment (10,945) (1,476) (2,406)
NET CASH FROM INVESTING ACTIVITIES (3,866) 4,465 28,224 CASH FLOWS FROM FINANCING ACTIVITIES:Net change in deposits 149 10,202 113,180 Net change in other short-term borrowings (59,471) 36,746 3,670 Dividends paid (12,425) (12,231) (11,940) Purchases of treasury stock - - (610) Proceeds from other borrowings - - 2,000 Repayments on other borrowings (26,090) (3,994) (208,944)
NET CASH FROM FINANCING ACTIVITIES (97,837) 30,723 (102,644) NET CHANGE IN CASH AND CASH EQUIVALENTS (47,050) 75,769 (25,860) CASH AND CASH EQUIVALENTS, BEGINNING OF YEAR 134,280 58,511 84,371 CASH AND CASH EQUIVALENTS, END OF YEAR 87,230$ 134,280$ 58,511$
SUPPLEMENTAL DISCLOSURES OF CASH FLOW AND NONCASH INFORMATION:Cash paid for the year for:Interest 13,837$ 17,358$ 28,051$ Income Taxes 12,638$ 16,565$ 15,713$ See accompanying notes.
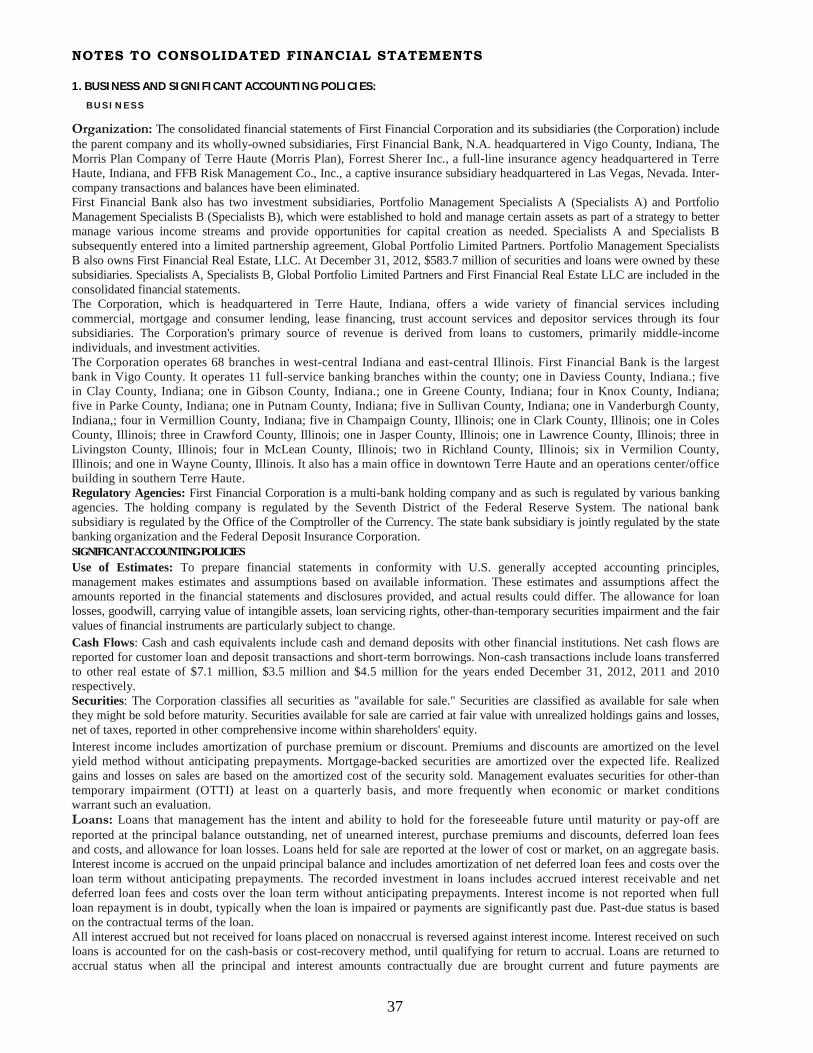
37
NOTES TO CONSOLIDATED FINANCIAL STATEMENTS
1. BUSINESS AND SIGNIFICANT ACCOUNTING POLICIES:
BUSINE SS
Organization: The consolidated financial statements of First Financial Corporation and its subsidiaries (the Corporation) include the parent company and its wholly-owned subsidiaries, First Financial Bank, N.A. headquartered in Vigo County, Indiana, The Morris Plan Company of Terre Haute (Morris Plan), Forrest Sherer Inc., a full-line insurance agency headquartered in Terre Haute, Indiana, and FFB Risk Management Co., Inc., a captive insurance subsidiary headquartered in Las Vegas, Nevada. Inter-company transactions and balances have been eliminated. First Financial Bank also has two investment subsidiaries, Portfolio Management Specialists A (Specialists A) and Portfolio Management Specialists B (Specialists B), which were established to hold and manage certain assets as part of a strategy to better manage various income streams and provide opportunities for capital creation as needed. Specialists A and Specialists B subsequently entered into a limited partnership agreement, Global Portfolio Limited Partners. Portfolio Management Specialists B also owns First Financial Real Estate, LLC. At December 31, 2012, $583.7 million of securities and loans were owned by these subsidiaries. Specialists A, Specialists B, Global Portfolio Limited Partners and First Financial Real Estate LLC are included in the consolidated financial statements. The Corporation, which is headquartered in Terre Haute, Indiana, offers a wide variety of financial services including commercial, mortgage and consumer lending, lease financing, trust account services and depositor services through its four subsidiaries. The Corporation's primary source of revenue is derived from loans to customers, primarily middle-income individuals, and investment activities. The Corporation operates 68 branches in west-central Indiana and east-central Illinois. First Financial Bank is the largest bank in Vigo County. It operates 11 full-service banking branches within the county; one in Daviess County, Indiana.; five in Clay County, Indiana; one in Gibson County, Indiana.; one in Greene County, Indiana; four in Knox County, Indiana; five in Parke County, Indiana; one in Putnam County, Indiana; five in Sullivan County, Indiana; one in Vanderburgh County, Indiana,; four in Vermillion County, Indiana; five in Champaign County, Illinois; one in Clark County, Illinois; one in Coles County, Illinois; three in Crawford County, Illinois; one in Jasper County, Illinois; one in Lawrence County, Illinois; three in Livingston County, Illinois; four in McLean County, Illinois; two in Richland County, Illinois; six in Vermilion County, Illinois; and one in Wayne County, Illinois. It also has a main office in downtown Terre Haute and an operations center/office building in southern Terre Haute. Regulatory Agencies: First Financial Corporation is a multi-bank holding company and as such is regulated by various banking agencies. The holding company is regulated by the Seventh District of the Federal Reserve System. The national bank subsidiary is regulated by the Office of the Comptroller of the Currency. The state bank subsidiary is jointly regulated by the state banking organization and the Federal Deposit Insurance Corporation. SIGNIFICANT ACCOUNTING POLICIES Use of Estimates: To prepare financial statements in conformity with U.S. generally accepted accounting principles, management makes estimates and assumptions based on available information. These estimates and assumptions affect the amounts reported in the financial statements and disclosures provided, and actual results could differ. The allowance for loan losses, goodwill, carrying value of intangible assets, loan servicing rights, other-than-temporary securities impairment and the fair values of financial instruments are particularly subject to change. Cash Flows: Cash and cash equivalents include cash and demand deposits with other financial institutions. Net cash flows are reported for customer loan and deposit transactions and short-term borrowings. Non-cash transactions include loans transferred to other real estate of $7.1 million, $3.5 million and $4.5 million for the years ended December 31, 2012, 2011 and 2010 respectively. Securities: The Corporation classifies all securities as "available for sale." Securities are classified as available for sale when they might be sold before maturity. Securities available for sale are carried at fair value with unrealized holdings gains and losses, net of taxes, reported in other comprehensive income within shareholders' equity. Interest income includes amortization of purchase premium or discount. Premiums and discounts are amortized on the level yield method without anticipating prepayments. Mortgage-backed securities are amortized over the expected life. Realized gains and losses on sales are based on the amortized cost of the security sold. Management evaluates securities for other-than temporary impairment (OTTI) at least on a quarterly basis, and more frequently when economic or market conditions warrant such an evaluation. Loans: Loans that management has the intent and ability to hold for the foreseeable future until maturity or pay-off are reported at the principal balance outstanding, net of unearned interest, purchase premiums and discounts, deferred loan fees and costs, and allowance for loan losses. Loans held for sale are reported at the lower of cost or market, on an aggregate basis. Interest income is accrued on the unpaid principal balance and includes amortization of net deferred loan fees and costs over the loan term without anticipating prepayments. The recorded investment in loans includes accrued interest receivable and net deferred loan fees and costs over the loan term without anticipating prepayments. Interest income is not reported when full loan repayment is in doubt, typically when the loan is impaired or payments are significantly past due. Past-due status is based on the contractual terms of the loan. All interest accrued but not received for loans placed on nonaccrual is reversed against interest income. Interest received on such loans is accounted for on the cash-basis or cost-recovery method, until qualifying for return to accrual. Loans are returned to accrual status when all the principal and interest amounts contractually due are brought current and future payments are
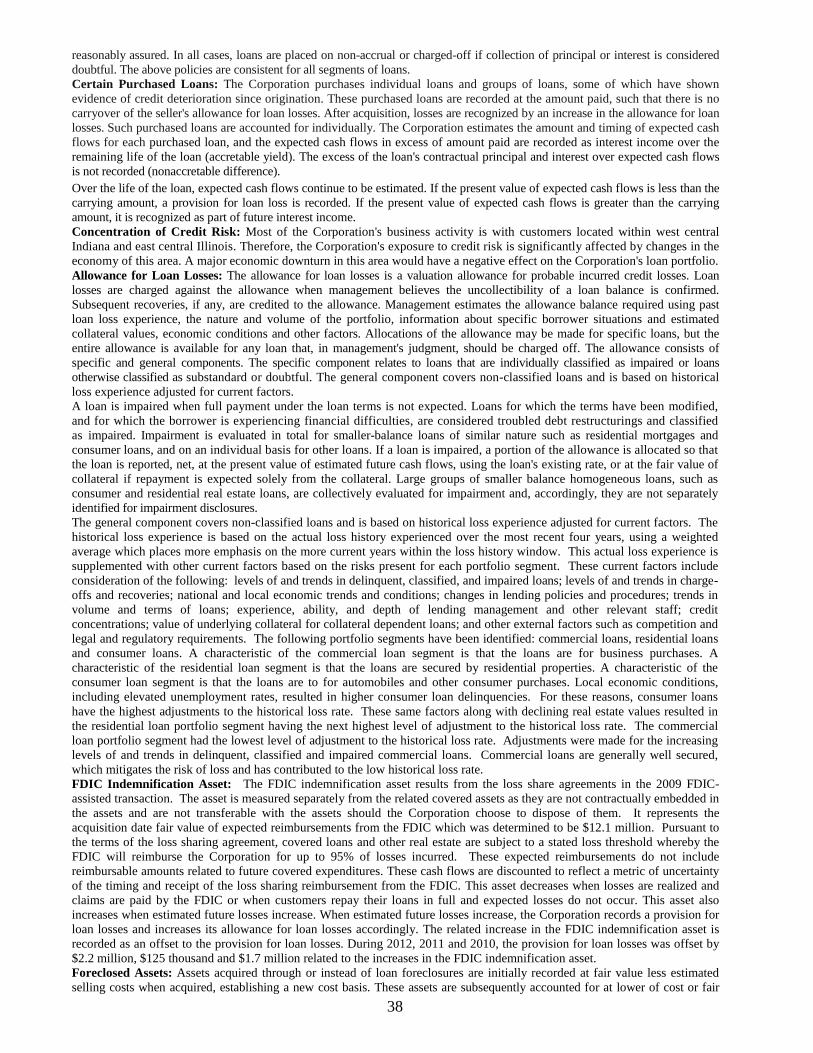
38
reasonably assured. In all cases, loans are placed on non-accrual or charged-off if collection of principal or interest is considered doubtful. The above policies are consistent for all segments of loans. Certain Purchased Loans: The Corporation purchases individual loans and groups of loans, some of which have shown evidence of credit deterioration since origination. These purchased loans are recorded at the amount paid, such that there is no carryover of the seller's allowance for loan losses. After acquisition, losses are recognized by an increase in the allowance for loan losses. Such purchased loans are accounted for individually. The Corporation estimates the amount and timing of expected cash flows for each purchased loan, and the expected cash flows in excess of amount paid are recorded as interest income over the remaining life of the loan (accretable yield). The excess of the loan's contractual principal and interest over expected cash flows is not recorded (nonaccretable difference). Over the life of the loan, expected cash flows continue to be estimated. If the present value of expected cash flows is less than the carrying amount, a provision for loan loss is recorded. If the present value of expected cash flows is greater than the carrying amount, it is recognized as part of future interest income. Concentration of Credit Risk: Most of the Corporation's business activity is with customers located within west central Indiana and east central Illinois. Therefore, the Corporation's exposure to credit risk is significantly affected by changes in the economy of this area. A major economic downturn in this area would have a negative effect on the Corporation's loan portfolio. Allowance for Loan Losses: The allowance for loan losses is a valuation allowance for probable incurred credit losses. Loan losses are charged against the allowance when management believes the uncollectibility of a loan balance is confirmed. Subsequent recoveries, if any, are credited to the allowance. Management estimates the allowance balance required using past loan loss experience, the nature and volume of the portfolio, information about specific borrower situations and estimated collateral values, economic conditions and other factors. Allocations of the allowance may be made for specific loans, but the entire allowance is available for any loan that, in management's judgment, should be charged off. The allowance consists of specific and general components. The specific component relates to loans that are individually classified as impaired or loans otherwise classified as substandard or doubtful. The general component covers non-classified loans and is based on historical loss experience adjusted for current factors. A loan is impaired when full payment under the loan terms is not expected. Loans for which the terms have been modified, and for which the borrower is experiencing financial difficulties, are considered troubled debt restructurings and classified as impaired. Impairment is evaluated in total for smaller-balance loans of similar nature such as residential mortgages and consumer loans, and on an individual basis for other loans. If a loan is impaired, a portion of the allowance is allocated so that the loan is reported, net, at the present value of estimated future cash flows, using the loan's existing rate, or at the fair value of collateral if repayment is expected solely from the collateral. Large groups of smaller balance homogeneous loans, such as consumer and residential real estate loans, are collectively evaluated for impairment and, accordingly, they are not separately identified for impairment disclosures. The general component covers non-classified loans and is based on historical loss experience adjusted for current factors. The historical loss experience is based on the actual loss history experienced over the most recent four years, using a weighted average which places more emphasis on the more current years within the loss history window. This actual loss experience is supplemented with other current factors based on the risks present for each portfolio segment. These current factors include consideration of the following: levels of and trends in delinquent, classified, and impaired loans; levels of and trends in charge-offs and recoveries; national and local economic trends and conditions; changes in lending policies and procedures; trends in volume and terms of loans; experience, ability, and depth of lending management and other relevant staff; credit concentrations; value of underlying collateral for collateral dependent loans; and other external factors such as competition and legal and regulatory requirements. The following portfolio segments have been identified: commercial loans, residential loans and consumer loans. A characteristic of the commercial loan segment is that the loans are for business purchases. A characteristic of the residential loan segment is that the loans are secured by residential properties. A characteristic of the consumer loan segment is that the loans are to for automobiles and other consumer purchases. Local economic conditions, including elevated unemployment rates, resulted in higher consumer loan delinquencies. For these reasons, consumer loans have the highest adjustments to the historical loss rate. These same factors along with declining real estate values resulted in the residential loan portfolio segment having the next highest level of adjustment to the historical loss rate. The commercial loan portfolio segment had the lowest level of adjustment to the historical loss rate. Adjustments were made for the increasing levels of and trends in delinquent, classified and impaired commercial loans. Commercial loans are generally well secured, which mitigates the risk of loss and has contributed to the low historical loss rate. FDIC Indemnification Asset: The FDIC indemnification asset results from the loss share agreements in the 2009 FDIC-assisted transaction. The asset is measured separately from the related covered assets as they are not contractually embedded in the assets and are not transferable with the assets should the Corporation choose to dispose of them. It represents the acquisition date fair value of expected reimbursements from the FDIC which was determined to be $12.1 million. Pursuant to the terms of the loss sharing agreement, covered loans and other real estate are subject to a stated loss threshold whereby the FDIC will reimburse the Corporation for up to 95% of losses incurred. These expected reimbursements do not include reimbursable amounts related to future covered expenditures. These cash flows are discounted to reflect a metric of uncertainty of the timing and receipt of the loss sharing reimbursement from the FDIC. This asset decreases when losses are realized and claims are paid by the FDIC or when customers repay their loans in full and expected losses do not occur. This asset also increases when estimated future losses increase. When estimated future losses increase, the Corporation records a provision for loan losses and increases its allowance for loan losses accordingly. The related increase in the FDIC indemnification asset is recorded as an offset to the provision for loan losses. During 2012, 2011 and 2010, the provision for loan losses was offset by $2.2 million, $125 thousand and $1.7 million related to the increases in the FDIC indemnification asset. Foreclosed Assets: Assets acquired through or instead of loan foreclosures are initially recorded at fair value less estimated selling costs when acquired, establishing a new cost basis. These assets are subsequently accounted for at lower of cost or fair
39
valueless estimated costs to sell. If fair value declines, a valuation allowance is recorded through expense. Costs after acquisition are expensed. Premises and Equipment: Land is carried at cost. Premises and equipment are stated at cost less accumulated depreciation. Depreciation is computed over the useful lives of the assets, which range from 3 to 33 years for furniture and equipment and 5 to 39 years for buildings and leasehold improvements. Restricted Stock: Restricted stock includes Federal Home Loan Bank (FHLB) of Indianapolis and Chicago and Federal Reserve stock. This restricted stock is carried at cost and periodically evaluated for impairment. Because this stock is viewed as a long-term investment, impairment is based on ultimate recovery of par value. Both cash and stock dividends are reported as income. Servicing Rights: Servicing rights are recognized separately when they are acquired through sales of loans. When mortgage loans are sold, servicing rights are initially recorded at fair value with the income statement effect recorded in gains on sales of loans. Fair value is based on market prices for comparable mortgage servicing contracts, when available, or alternatively, is based on third-party valuations that incorporate assumptions that market participants would use in estimating future net servicing income, such as the cost to service, the discount rate, ancillary income, prepayment speeds and default rates and losses. All classes of servicing assets are subsequently measured using the amortization method, which requires servicing rights to be amortized into non-interest income in proportion to, and over the period of, the estimated future net servicing income of the underlying loans. Servicing assets are evaluated for impairment based upon the fair value of the rights as compared to carrying amount. Impairment is determined by stratifying rights into groupings based on predominant risk characteristics, such as interest rate, loan type and investor type. Impairment is recognized through a valuation allowance for an individual grouping, to the extent that fair value is less than the carrying amount. If the Corporation later determines that all or a portion of the impairment no longer exists for a particular grouping, a reduction of the allowance may be recorded as an increase to income. Changes in valuation allowances are reported with Other Service Fees on the income statement. The fair values of servicing rights are subject to significant fluctuations as a result of changes in estimated and actual prepayment speeds and default rates and losses. Servicing fee income, which is included in Other Service Fees on the income statement, is for fees earned for servicing loans. The fees are based on a contractual percentage of the outstanding principal or a fixed amount per loan and are recorded as income when earned. The amortization of mortgage servicing rights is netted against loan servicing fee income. Servicing fees totaled $1.3 million, $1.2 million and $1.2 million for the years ended December 31, 2012, 2011 and 2010. Late fees and ancillary fees related to loan servicing are not material. Stock based compensation: Compensation cost is recognized for restricted stock awards and units issued to employees based on the fair value of these awards at the date of grant. Market price of the Corporation’s common stock at the date of grant is used for restricted stock awards. Compensation expense is recognized over the requisite service period. Transfers of Financial Assets: Transfers of financial assets are accounted for as sales, when control over the assets has been relinquished. Control over transferred assets is deemed to be surrendered when the assets have been isolated from the Corporation, the transferee obtains the right (free of conditions that constrain it from taking advantage of that right) to pledge or exchange the transferred assets, and the Corporation does not maintain effective control over the transferred assets through an agreement to repurchase them before their maturity. Bank-Owned Life Insurance: The Corporation has purchased life insurance policies on certain key executives. Bank-owned life insurance is recorded at its cash surrender value, or the amount that can be realized. Income on the investments in life insurance is included in other interest income. Goodwill and Other Intangible Assets: Goodwill resulting from business combinations prior to January 1, 2009 represents the excess of the purchase price over the fair value of the net assets of businesses acquired. Goodwill resulting from business combinations after January 1, 2009 represents the future economic benefits arising from other assets acquired that are not individually identified and separately recognized. Goodwill and intangible assets acquired in a purchase business combination and determined to have an indefinite useful life are not amortized, but tested for impairment at least annually. The Corporation has selected November 30 as the date to perform the annual impairment test. Intangible assets with definite useful lives are amortized over their estimated useful lives to their estimated residual values. Goodwill is the only intangible asset with an indefinite life on our balance sheet. Other intangible assets consist of core deposit and acquired customer list intangible assets arising from the whole bank, insurance agency and branch acquisitions. They are initially measured at fair value and then are amortized on an accelerated basis over their estimated useful lives, which are 12 and 10 years, respectively. Long-Term Assets: Premises and equipment and other long-term assets are reviewed for impairment when events indicate their carrying amount may not be recoverable from future undiscounted cash flows. If impaired, the assets are recorded at fair value. Benefit Plans: Pension expense is the net of service and interest cost, return on plan assets and amortization of gains and losses not immediately recognized. The amount contributed is determined by a formula as decided by the Board of Directors. Deferred compensation and supplemental retirement plan expense allocates the benefits over years of service. Employee Stock Ownership Plan: Shares of treasury stock are issued to the ESOP and compensation expense is recognized based upon the total market price of shares when contributed. Deferred Compensation Plan: A deferred compensation plan covers all directors. Under the plan, the Corporation pays each director, or their beneficiary, the amount of fees deferred plus interest over 10 years, beginning when the director achieves age 65. A liability is accrued for the obligation under these plans. The expense incurred for the deferred compensation for each of the last three years was $142 thousand, $144 thousand and $183 thousand, resulting in a deferred compensation liability of $2.6 million at both December 31, 2012 and 2011. Incentive Plans: A long-term incentive plan established in 2000 provides for the payment of incentive rewards as a 15-year annuity to all directors and certain key officers. That plan was in place through December 31, 2009, and compensation expense is recognized over the service period. Payments under the plan generally do not begin until the earlier of January 1, 2015, or the January 1 immediately following the year in which the participant reaches age 65. There was no compensation expense related to this plan for 2012, 2011and 2010. There is a liability of $15.0 million and $15.4 million as of year-end 2012 and 2011. In 2010 the Corporation adopted
40
incentive compensation plans designed to reward key officers based on certain performance measures. The short-term portion of the plan is paid out within 75 days of year end and the long-term plan vests over a three year period and will payout within 75 days of the three year vesting period beginning with December 31, 2012. The compensation expense related to the plans in 2012, 2011 and 2010 was $1.3 million, $972 thousand and $2.2 million, respectively, and resulted in a liability of $1.6 million at December 31, 2012 and $2.2 million at December 31, 2011. The Omnibus Equity Incentive Plan is a long term incentive plan that was designed to align the interests of participants with the interest of shareholders. Under the plan, awards may be made based on certain performance measures. The grants are made in restricted stock units that are subject to a vesting schedule. Income Taxes: Income tax expense is the total of the current year income tax due or refundable and the change in deferred tax assets and liabilities. Deferred tax assets and liabilities are the expected future tax amounts for the temporary differences between carrying amounts and tax bases of assets and liabilities, computed using enacted tax rates. A valuation allowance, if needed, reduces deferred tax assets to the amount expected to be realized. A tax position is recognized as a benefit only if it is "more likely than not" that the tax position would be sustained in a tax examination, with a tax examination being presumed to occur. The amount recognized is the largest amount of tax benefit that is greater than 50% likely of being realized on examination. For tax positions not meeting the "more likely than not" test, no tax benefit is recorded The Corporation recognizes interest and/or penalties related to income tax matters in income tax expense. Loan Commitments and Related Financial Instruments: Financial instruments include credit instruments, such as commitments to make loans and standby letters of credit, issued to meet customer financing needs. The face amount for these items represents the exposure to loss, before considering customer collateral or ability to repay. Such financial instruments are recorded when they are funded. Earnings Per Share: Earnings per common share is net income divided by the weighted average number of common shares outstanding during the period. The Corporation does not have any potentially dilutive securities. Earnings and dividends per share are restated for stock splits and dividends through the date of issue of the financial statements. Comprehensive Income: Comprehensive income consists of net income and other comprehensive income. Other comprehensive income includes unrealized gains and losses on securities available for sale and changes in the funded status of the retirement plans, which are also recognized as separate components of equity. Loss Contingencies: Loss contingencies, including claims and legal actions arising in the ordinary course of business, are recorded as liabilities when the likelihood of loss is probable and an amount of range of loss can be reasonably estimated. Management does not believe there are currently such matters that will have a material effect on the financial statements. Dividend Restriction: Banking regulations require maintaining certain capital levels and may limit the dividends paid by the bank to the holding company or by the holding company to shareholders. Fair Value of Financial Instruments: Fair values of financial instruments are estimated using relevant market information and other assumptions, as more fully disclosed in a separate note. Fair value estimates involve uncertainties and matters of significant judgment regarding interest rates, credit risk, prepayments and other factors, especially in the absence of broad markets for particular items. Changes in assumptions or market conditions could significantly affect the estimates. Operating Segment: While the Corporation's chief decision-makers monitor the revenue streams of the various products and services, the operating results of significant segments are similar and operations are managed and financial performance is evaluated on a corporate-wide basis. Accordingly, all of the Corporation's financial service operations are considered by management to be aggregated in one reportable operating segment, which is banking. Adoption of New Accounting Standards: In October 2012, the Financial Accounting Standards Board (“FASB”) issued guidance on the subsequent accounting for an indemnification asset recognized at the acquisition date as a result of a government assisted acquisition of a financial institution. When an entity recognizes such an indemnification asset and subsequently a change in the cash flows expected to be collected on the indemnification asset occurs as a result of a change in the cash flows expected to be collected on the indemnified asset, the guidance requires the entity to recognize the change in the measurement of the indemnification asset on the same basis as the indemnified assets. Any amortization of changes in value of the indemnification asset should be limited to the lesser of the term of the indemnification agreement and the remaining life of the indemnified assets. The amendments are effective for fiscal years beginning on or after December 15, 2012 and early adoption is permitted. The amendments are to be applied prospectively to any new indemnification assets acquired after the date of adoption and to indemnification assets existing as of the date of adoption arising from a government-assisted acquisition of a financial institution. The effect of adopting this standard did not have a material effect on the Corporation’s operating results or financial condition. In July 2012, the FASB amended existing guidance relating to testing indefinite-lived intangible assets for impairment. The amendment permits an assessment of qualitative factors to determine whether the existence of events and circumstances indicates that it is more likely than not that the indefinite-lived intangible asset is impaired. If, after assessing the totality of events and circumstances, it is concluded that it is not more likely than not that the indefinite-lived intangible asset is impaired, then no further action is required. However, after the same assessment, if it is concluded that it is more like than not that the indefinite-lived intangible asset is impaired, then a quantitative impairment test should be performed whereby the fair value of the indefinite-lived intangible asset is compared to the carrying amount. The amendments in this guidance are effective for annual and interim impairment tests performed for fiscal years beginning after September 15, 2012. Early adoption is permitted. The effect of adopting this standard did not have a material effect on the Corporation’s operating results or financial condition. In September 2011, the FASB amended existing guidance relating to goodwill impairment testing. The amendment permits an assessment of qualitative factors to determine whether the existence of events or circumstances leads to a determination that it is more likely than not that the fair value of a reporting unit is less than its carrying amount. If, after assessing these events or circumstances, it is concluded that it is not more likely than not that the fair value of a reporting unit is less than its carrying amount, then performing the two-step impairment test is unnecessary. The amendments in this guidance are effective for
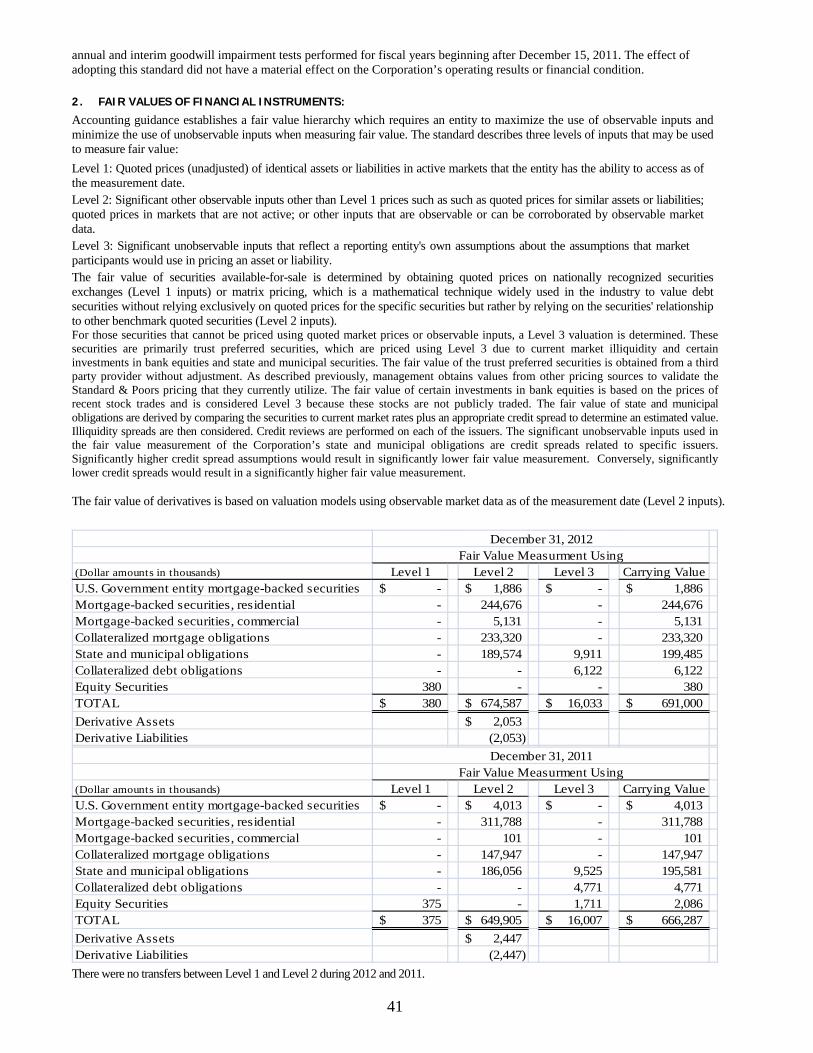
41
annual and interim goodwill impairment tests performed for fiscal years beginning after December 15, 2011. The effect of adopting this standard did not have a material effect on the Corporation’s operating results or financial condition.
2. FAIR VALUES OF FINANCIAL INSTRUMENTS:
Accounting guidance establishes a fair value hierarchy which requires an entity to maximize the use of observable inputs and minimize the use of unobservable inputs when measuring fair value. The standard describes three levels of inputs that may be used to measure fair value: Level 1: Quoted prices (unadjusted) of identical assets or liabilities in active markets that the entity has the ability to access as of the measurement date. Level 2: Significant other observable inputs other than Level 1 prices such as such as quoted prices for similar assets or liabilities; quoted prices in markets that are not active; or other inputs that are observable or can be corroborated by observable market data. Level 3: Significant unobservable inputs that reflect a reporting entity's own assumptions about the assumptions that market participants would use in pricing an asset or liability. The fair value of securities available-for-sale is determined by obtaining quoted prices on nationally recognized securities exchanges (Level 1 inputs) or matrix pricing, which is a mathematical technique widely used in the industry to value debt securities without relying exclusively on quoted prices for the specific securities but rather by relying on the securities' relationship to other benchmark quoted securities (Level 2 inputs). For those securities that cannot be priced using quoted market prices or observable inputs, a Level 3 valuation is determined. These securities are primarily trust preferred securities, which are priced using Level 3 due to current market illiquidity and certain investments in bank equities and state and municipal securities. The fair value of the trust preferred securities is obtained from a third party provider without adjustment. As described previously, management obtains values from other pricing sources to validate the Standard & Poors pricing that they currently utilize. The fair value of certain investments in bank equities is based on the prices of recent stock trades and is considered Level 3 because these stocks are not publicly traded. The fair value of state and municipal obligations are derived by comparing the securities to current market rates plus an appropriate credit spread to determine an estimated value. Illiquidity spreads are then considered. Credit reviews are performed on each of the issuers. The significant unobservable inputs used in the fair value measurement of the Corporation’s state and municipal obligations are credit spreads related to specific issuers. Significantly higher credit spread assumptions would result in significantly lower fair value measurement. Conversely, significantly lower credit spreads would result in a significantly higher fair value measurement. The fair value of derivatives is based on valuation models using observable market data as of the measurement date (Level 2 inputs).
(Dollar amounts in thousands) Level 1 Level 2 Level 3 Carrying ValueU.S. Government entity mortgage-backed securities -$ 1,886$ -$ 1,886$ Mortgage-backed securities, residential - 244,676 - 244,676 Mortgage-backed securities, commercial - 5,131 - 5,131 Collateralized mortgage obligations - 233,320 - 233,320 State and municipal obligations - 189,574 9,911 199,485 Collateralized debt obligations - - 6,122 6,122 Equity Securities 380 - - 380 TOTAL 380$ 674,587$ 16,033$ 691,000$ Derivative Assets 2,053$ Derivative Liabilities (2,053)
December 31, 2012Fair Value Measurment Using
(Dollar amounts in thousands) Level 1 Level 2 Level 3 Carrying ValueU.S. Government entity mortgage-backed securities -$ 4,013$ -$ 4,013$ Mortgage-backed securities, residential - 311,788 - 311,788 Mortgage-backed securities, commercial - 101 - 101 Collateralized mortgage obligations - 147,947 - 147,947 State and municipal obligations - 186,056 9,525 195,581 Collateralized debt obligations - - 4,771 4,771 Equity Securities 375 - 1,711 2,086 TOTAL 375$ 649,905$ 16,007$ 666,287$ Derivative Assets 2,447$ Derivative Liabilities (2,447)
December 31, 2011Fair Value Measurment Using
There were no transfers between Level 1 and Level 2 during 2012 and 2011.
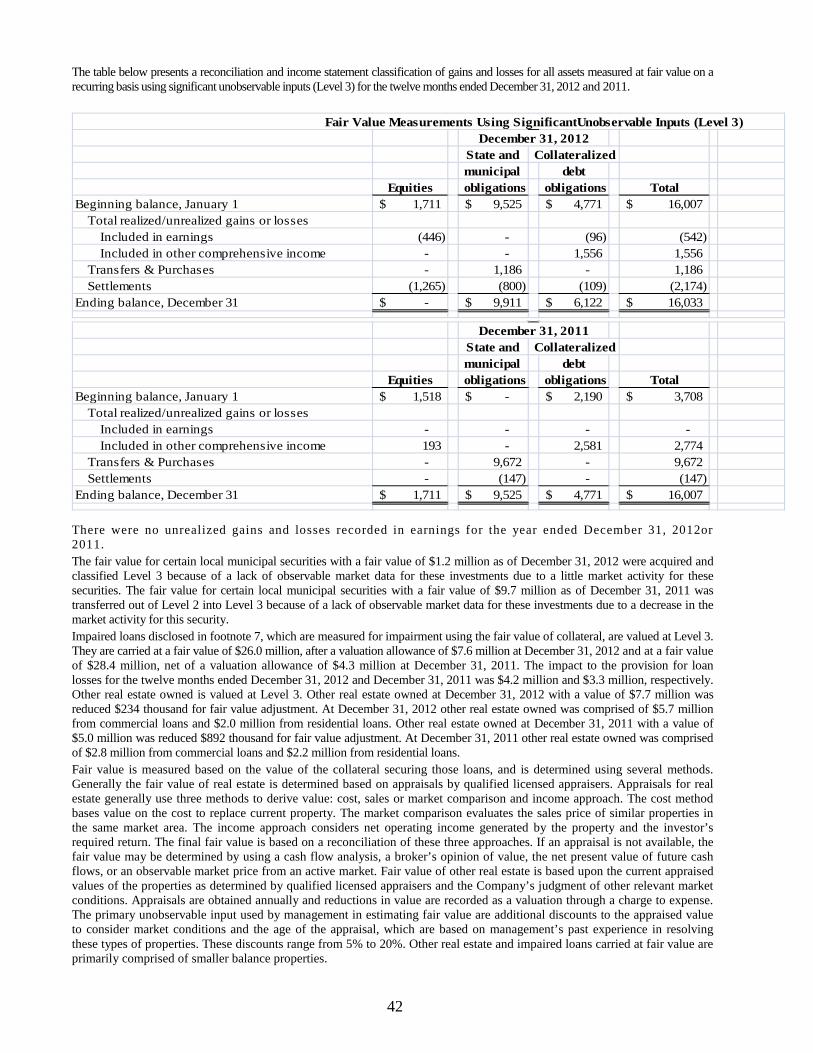
42
The table below presents a reconciliation and income statement classification of gains and losses for all assets measured at fair value on a recurring basis using significant unobservable inputs (Level 3) for the twelve months ended December 31, 2012 and 2011.
Fair Value Measurements Using SignificantUnobservable Inputs (Level 3)December 31, 2012
State and Collateralizedmunicipal debt
Equities obligations obligations TotalBeginning balance, January 1 1,711$ 9,525$ 4,771$ 16,007$
Total realized/unrealized gains or lossesIncluded in earnings (446) - (96) (542) Included in other comprehensive income - - 1,556 1,556
Transfers & Purchases - 1,186 - 1,186 Settlements (1,265) (800) (109) (2,174)
Ending balance, December 31 -$ 9,911$ 6,122$ 16,033$
December 31, 2011State and Collateralizedmunicipal debt
Equities obligations obligations TotalBeginning balance, January 1 1,518$ -$ 2,190$ 3,708$
Total realized/unrealized gains or lossesIncluded in earnings - - - - Included in other comprehensive income 193 - 2,581 2,774
Transfers & Purchases - 9,672 - 9,672 Settlements - (147) - (147)
Ending balance, December 31 1,711$ 9,525$ 4,771$ 16,007$
There were no unrealized gains and losses recorded in earnings for the year ended December 31, 2012or 2011. The fair value for certain local municipal securities with a fair value of $1.2 million as of December 31, 2012 were acquired and classified Level 3 because of a lack of observable market data for these investments due to a little market activity for these securities. The fair value for certain local municipal securities with a fair value of $9.7 million as of December 31, 2011 was transferred out of Level 2 into Level 3 because of a lack of observable market data for these investments due to a decrease in the market activity for this security. Impaired loans disclosed in footnote 7, which are measured for impairment using the fair value of collateral, are valued at Level 3. They are carried at a fair value of $26.0 million, after a valuation allowance of $7.6 million at December 31, 2012 and at a fair value of $28.4 million, net of a valuation allowance of $4.3 million at December 31, 2011. The impact to the provision for loan losses for the twelve months ended December 31, 2012 and December 31, 2011 was $4.2 million and $3.3 million, respectively. Other real estate owned is valued at Level 3. Other real estate owned at December 31, 2012 with a value of $7.7 million was reduced $234 thousand for fair value adjustment. At December 31, 2012 other real estate owned was comprised of $5.7 million from commercial loans and $2.0 million from residential loans. Other real estate owned at December 31, 2011 with a value of $5.0 million was reduced $892 thousand for fair value adjustment. At December 31, 2011 other real estate owned was comprised of $2.8 million from commercial loans and $2.2 million from residential loans. Fair value is measured based on the value of the collateral securing those loans, and is determined using several methods. Generally the fair value of real estate is determined based on appraisals by qualified licensed appraisers. Appraisals for real estate generally use three methods to derive value: cost, sales or market comparison and income approach. The cost method bases value on the cost to replace current property. The market comparison evaluates the sales price of similar properties in the same market area. The income approach considers net operating income generated by the property and the investor’s required return. The final fair value is based on a reconciliation of these three approaches. If an appraisal is not available, the fair value may be determined by using a cash flow analysis, a broker’s opinion of value, the net present value of future cash flows, or an observable market price from an active market. Fair value of other real estate is based upon the current appraised values of the properties as determined by qualified licensed appraisers and the Company’s judgment of other relevant market conditions. Appraisals are obtained annually and reductions in value are recorded as a valuation through a charge to expense. The primary unobservable input used by management in estimating fair value are additional discounts to the appraised value to consider market conditions and the age of the appraisal, which are based on management’s past experience in resolving these types of properties. These discounts range from 5% to 20%. Other real estate and impaired loans carried at fair value are primarily comprised of smaller balance properties.
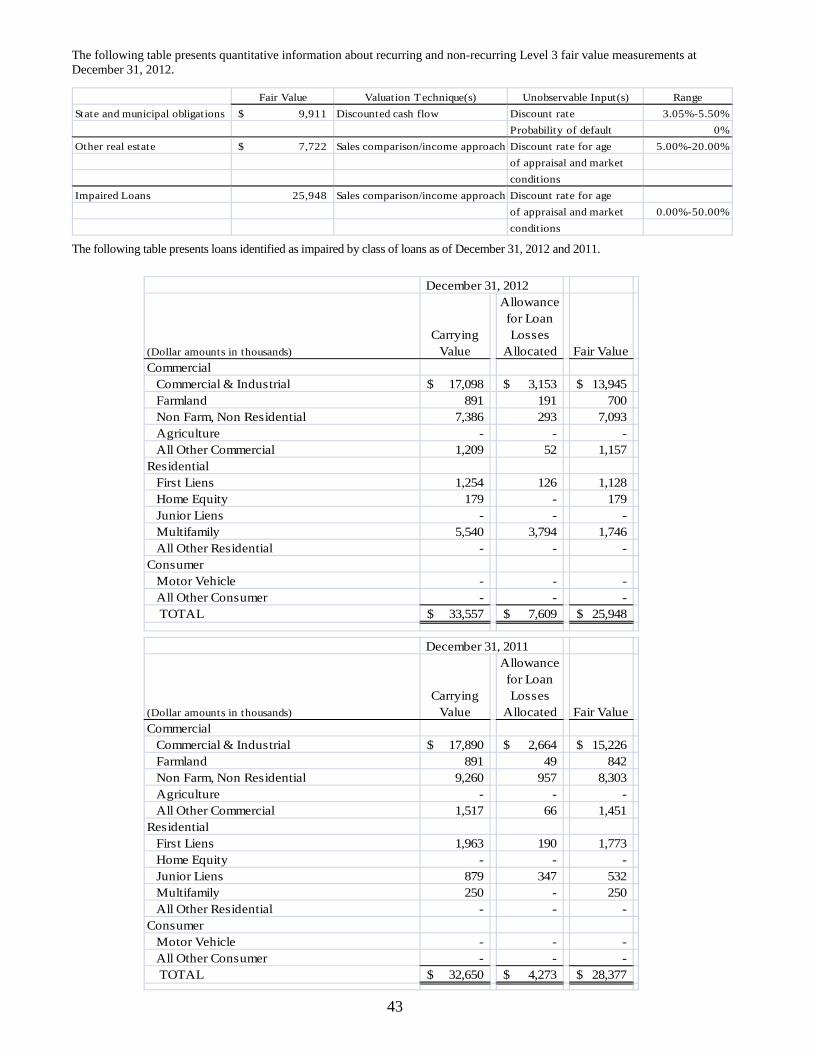
43
The following table presents quantitative information about recurring and non-recurring Level 3 fair value measurements at December 31, 2012.
Fair Value Valuation Technique(s) Unobservable Input(s) RangeState and municipal obligations 9,911$ Discounted cash flow Discount rate 3.05%-5.50%
Probability of default 0%Other real estate 7,722$ Sales comparison/income approach Discount rate for age 5.00%-20.00%
of appraisal and marketconditions
Impaired Loans 25,948 Sales comparison/income approach Discount rate for age of appraisal and market 0.00%-50.00%conditions
The following table presents loans identified as impaired by class of loans as of December 31, 2012 and 2011.
December 31, 2012
(Dollar amounts in thousands)Carrying
Value
Allowance for Loan Losses
Allocated Fair ValueCommercial Commercial & Industrial 17,098$ 3,153$ 13,945$ Farmland 891 191 700 Non Farm, Non Residential 7,386 293 7,093 Agriculture - - - All Other Commercial 1,209 52 1,157 Residential First Liens 1,254 126 1,128 Home Equity 179 - 179 Junior Liens - - - Multifamily 5,540 3,794 1,746 All Other Residential - - - Consumer Motor Vehicle - - - All Other Consumer - - -
TOTAL 33,557$ 7,609$ 25,948$
December 31, 2011
(Dollar amounts in thousands)Carrying
Value
Allowance for Loan Losses
Allocated Fair ValueCommercial Commercial & Industrial 17,890$ 2,664$ 15,226$ Farmland 891 49 842 Non Farm, Non Residential 9,260 957 8,303 Agriculture - - - All Other Commercial 1,517 66 1,451 Residential First Liens 1,963 190 1,773 Home Equity - - - Junior Liens 879 347 532 Multifamily 250 - 250 All Other Residential - - - Consumer Motor Vehicle - - - All Other Consumer - - -
TOTAL 32,650$ 4,273$ 28,377$
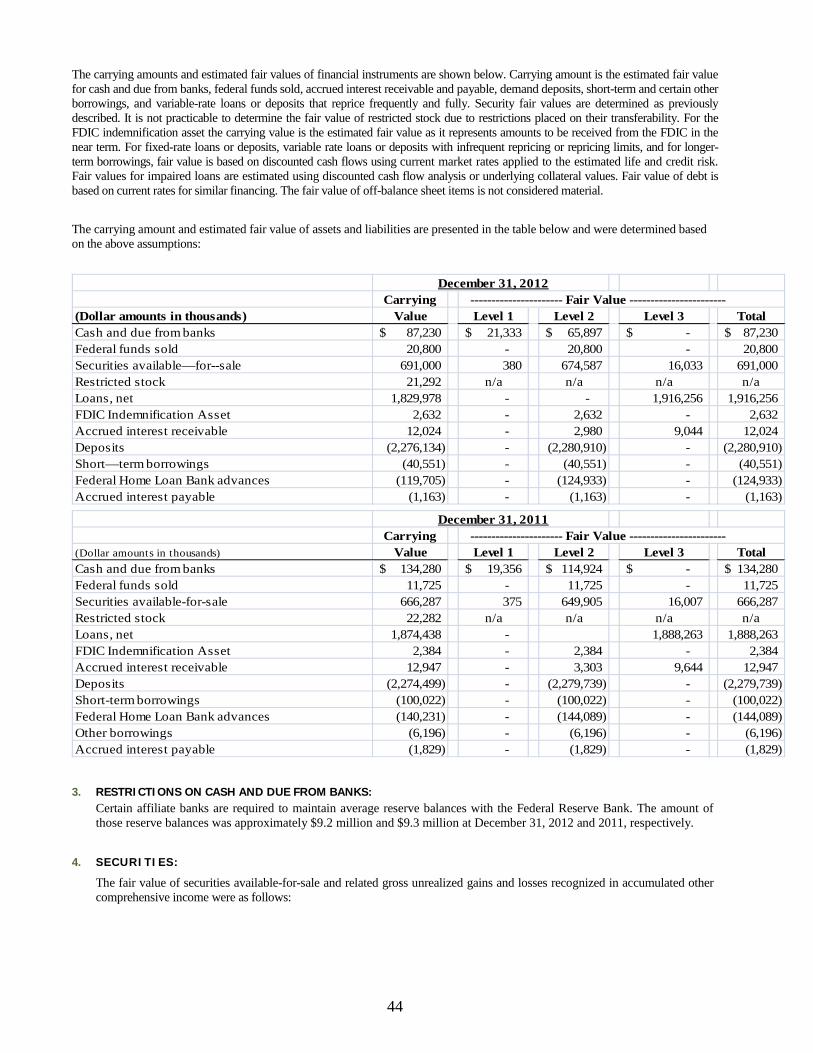
44
The carrying amounts and estimated fair values of financial instruments are shown below. Carrying amount is the estimated fair value for cash and due from banks, federal funds sold, accrued interest receivable and payable, demand deposits, short-term and certain other borrowings, and variable-rate loans or deposits that reprice frequently and fully. Security fair values are determined as previously described. It is not practicable to determine the fair value of restricted stock due to restrictions placed on their transferability. For the FDIC indemnification asset the carrying value is the estimated fair value as it represents amounts to be received from the FDIC in the near term. For fixed-rate loans or deposits, variable rate loans or deposits with infrequent repricing or repricing limits, and for longer-term borrowings, fair value is based on discounted cash flows using current market rates applied to the estimated life and credit risk. Fair values for impaired loans are estimated using discounted cash flow analysis or underlying collateral values. Fair value of debt is based on current rates for similar financing. The fair value of off-balance sheet items is not considered material. The carrying amount and estimated fair value of assets and liabilities are presented in the table below and were determined based on the above assumptions:
December 31, 2012
Carrying ---------------------- Fair Value -----------------------(Dollar amounts in thousands) Value Level 1 Level 2 Level 3 TotalCash and due from banks 87,230$ 21,333$ 65,897$ -$ 87,230$ Federal funds sold 20,800 - 20,800 - 20,800Securities available—for--sale 691,000 380 674,587 16,033 691,000Restricted stock 21,292 n/a n/a n/a n/aLoans, net 1,829,978 - - 1,916,256 1,916,256FDIC Indemnification Asset 2,632 - 2,632 - 2,632Accrued interest receivable 12,024 - 2,980 9,044 12,024Deposits (2,276,134) - (2,280,910) - (2,280,910)Short—term borrowings (40,551) - (40,551) - (40,551)Federal Home Loan Bank advances (119,705) - (124,933) - (124,933)Accrued interest payable (1,163) - (1,163) - (1,163)
December 31, 2011Carrying ---------------------- Fair Value -----------------------
(Dollar amounts in thousands) Value Level 1 Level 2 Level 3 TotalCash and due from banks 134,280$ 19,356$ 114,924$ -$ 134,280$ Federal funds sold 11,725 - 11,725 - 11,725Securities available-for-sale 666,287 375 649,905 16,007 666,287Restricted stock 22,282 n/a n/a n/a n/aLoans, net 1,874,438 - 1,888,263 1,888,263FDIC Indemnification Asset 2,384 - 2,384 - 2,384Accrued interest receivable 12,947 - 3,303 9,644 12,947Deposits (2,274,499) - (2,279,739) - (2,279,739)Short-term borrowings (100,022) - (100,022) - (100,022)Federal Home Loan Bank advances (140,231) - (144,089) - (144,089)Other borrowings (6,196) - (6,196) - (6,196)Accrued interest payable (1,829) - (1,829) - (1,829)
3. RESTRICTIONS ON CASH AND DUE FROM BANKS: Certain affiliate banks are required to maintain average reserve balances with the Federal Reserve Bank. The amount of those reserve balances was approximately $9.2 million and $9.3 million at December 31, 2012 and 2011, respectively.
4. SECURITIES:
The fair value of securities available-for-sale and related gross unrealized gains and losses recognized in accumulated other comprehensive income were as follows:
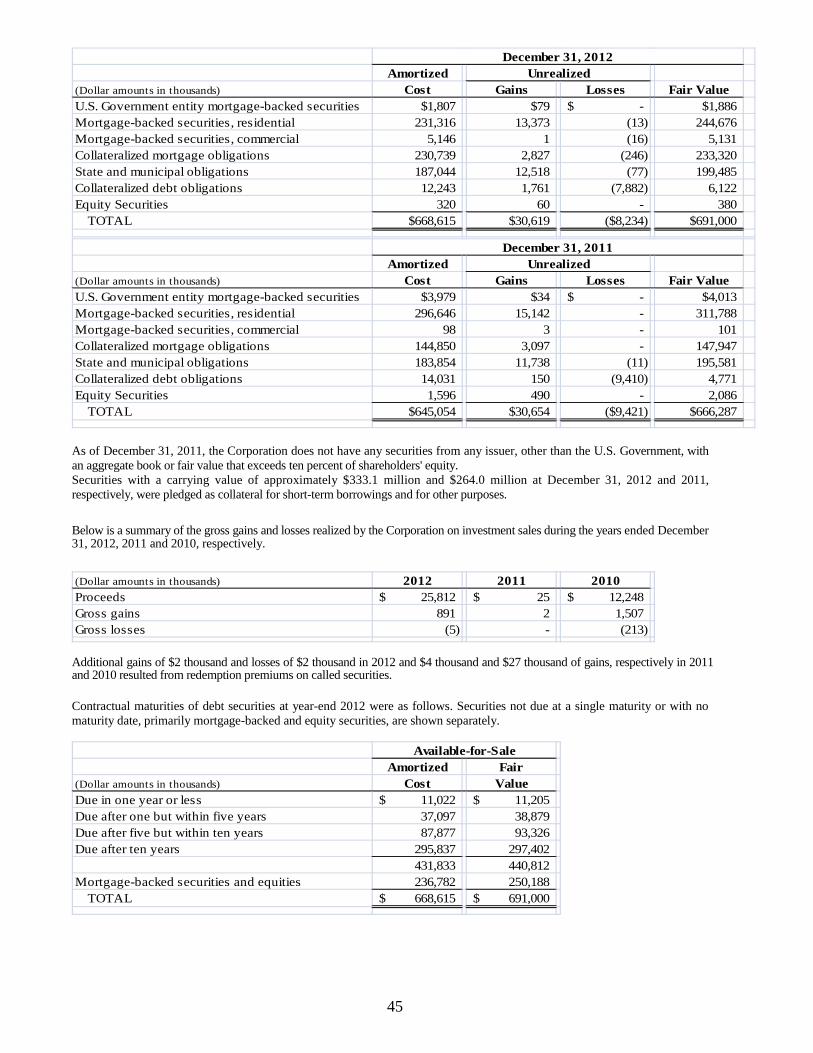
45
Amortized(Dollar amounts in thousands) Cost Gains Losses Fair ValueU.S. Government entity mortgage-backed securities $1,807 $79 -$ $1,886Mortgage-backed securities, residential 231,316 13,373 (13) 244,676 Mortgage-backed securities, commercial 5,146 1 (16) 5,131 Collateralized mortgage obligations 230,739 2,827 (246) 233,320 State and municipal obligations 187,044 12,518 (77) 199,485 Collateralized debt obligations 12,243 1,761 (7,882) 6,122 Equity Securities 320 60 - 380
TOTAL $668,615 $30,619 ($8,234) $691,000
UnrealizedDecember 31, 2012
Amortized(Dollar amounts in thousands) Cost Gains Losses Fair ValueU.S. Government entity mortgage-backed securities $3,979 $34 -$ $4,013Mortgage-backed securities, residential 296,646 15,142 - 311,788 Mortgage-backed securities, commercial 98 3 - 101 Collateralized mortgage obligations 144,850 3,097 - 147,947 State and municipal obligations 183,854 11,738 (11) 195,581 Collateralized debt obligations 14,031 150 (9,410) 4,771 Equity Securities 1,596 490 - 2,086
TOTAL $645,054 $30,654 ($9,421) $666,287
UnrealizedDecember 31, 2011
As of December 31, 2011, the Corporation does not have any securities from any issuer, other than the U.S. Government, with an aggregate book or fair value that exceeds ten percent of shareholders' equity. Securities with a carrying value of approximately $333.1 million and $264.0 million at December 31, 2012 and 2011, respectively, were pledged as collateral for short-term borrowings and for other purposes. Below is a summary of the gross gains and losses realized by the Corporation on investment sales during the years ended December 31, 2012, 2011 and 2010, respectively.
(Dollar amounts in thousands) 2012 2011 2010Proceeds 25,812$ 25$ 12,248$ Gross gains 891 2 1,507 Gross losses (5) - (213)
Additional gains of $2 thousand and losses of $2 thousand in 2012 and $4 thousand and $27 thousand of gains, respectively in 2011 and 2010 resulted from redemption premiums on called securities.
Contractual maturities of debt securities at year-end 2012 were as follows. Securities not due at a single maturity or with no maturity date, primarily mortgage-backed and equity securities, are shown separately.
Amortized Fair(Dollar amounts in thousands) Cost ValueDue in one year or less 11,022$ 11,205$ Due after one but within five years 37,097 38,879 Due after five but within ten years 87,877 93,326 Due after ten years 295,837 297,402
431,833 440,812 Mortgage-backed securities and equities 236,782 250,188
TOTAL 668,615$ 691,000$
Available-for-Sale
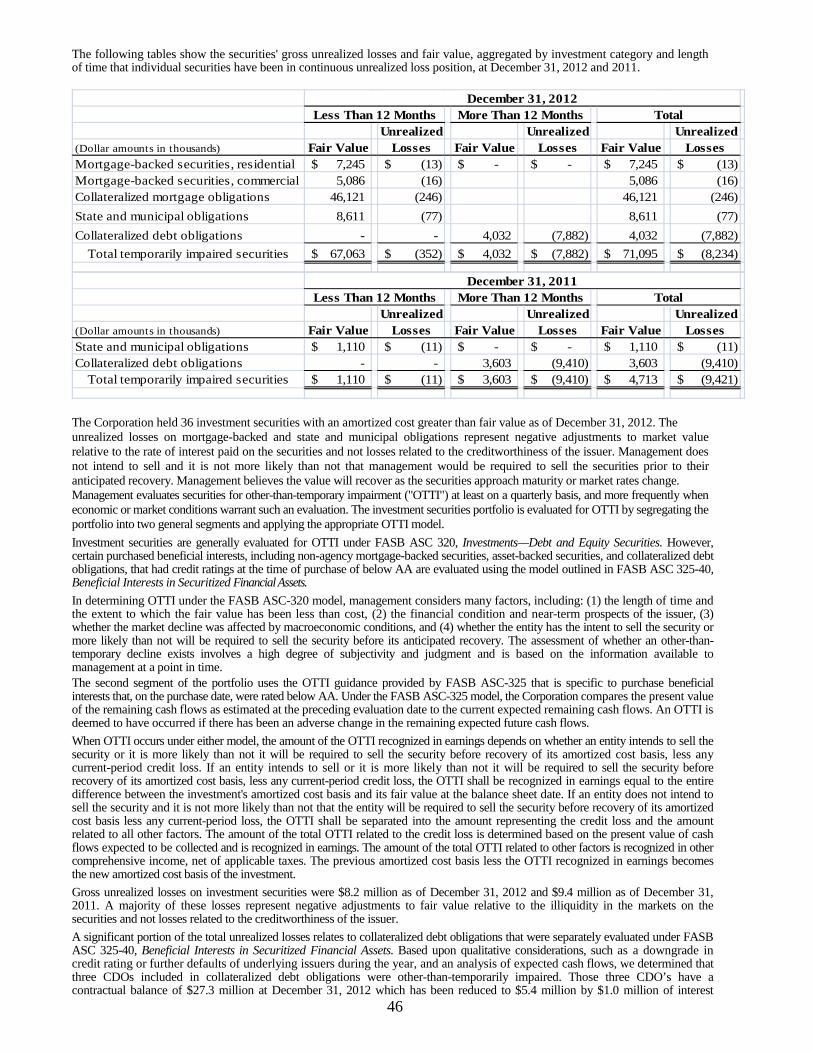
46
The following tables show the securities' gross unrealized losses and fair value, aggregated by investment category and length of time that individual securities have been in continuous unrealized loss position, at December 31, 2012 and 2011.
Unrealized Unrealized Unrealized(Dollar amounts in thousands) Fair Value Losses Fair Value Losses Fair Value LossesMortgage-backed securities, residential 7,245$ (13)$ -$ -$ 7,245$ (13)$ Mortgage-backed securities, commercial 5,086 (16) 5,086 (16) Collateralized mortgage obligations 46,121 (246) 46,121 (246) State and municipal obligations 8,611 (77) 8,611 (77) Collateralized debt obligations - - 4,032 (7,882) 4,032 (7,882)
Total temporarily impaired securities 67,063$ (352)$ 4,032$ (7,882)$ 71,095$ (8,234)$
December 31, 2012TotalMore Than 12 MonthsLess Than 12 Months
Unrealized Unrealized Unrealized(Dollar amounts in thousands) Fair Value Losses Fair Value Losses Fair Value LossesState and municipal obligations 1,110$ (11)$ -$ -$ 1,110$ (11)$ Collateralized debt obligations - - 3,603 (9,410) 3,603 (9,410)
Total temporarily impaired securities 1,110$ (11)$ 3,603$ (9,410)$ 4,713$ (9,421)$
TotalMore Than 12 MonthsLess Than 12 MonthsDecember 31, 2011
The Corporation held 36 investment securities with an amortized cost greater than fair value as of December 31, 2012. The unrealized losses on mortgage-backed and state and municipal obligations represent negative adjustments to market value relative to the rate of interest paid on the securities and not losses related to the creditworthiness of the issuer. Management does not intend to sell and it is not more likely than not that management would be required to sell the securities prior to their anticipated recovery. Management believes the value will recover as the securities approach maturity or market rates change. Management evaluates securities for other-than-temporary impairment ("OTTI") at least on a quarterly basis, and more frequently when economic or market conditions warrant such an evaluation. The investment securities portfolio is evaluated for OTTI by segregating the portfolio into two general segments and applying the appropriate OTTI model. Investment securities are generally evaluated for OTTI under FASB ASC 320, Investments—Debt and Equity Securities. However, certain purchased beneficial interests, including non-agency mortgage-backed securities, asset-backed securities, and collateralized debt obligations, that had credit ratings at the time of purchase of below AA are evaluated using the model outlined in FASB ASC 325-40, Beneficial Interests in Securitized Financial Assets. In determining OTTI under the FASB ASC-320 model, management considers many factors, including: (1) the length of time and the extent to which the fair value has been less than cost, (2) the financial condition and near-term prospects of the issuer, (3) whether the market decline was affected by macroeconomic conditions, and (4) whether the entity has the intent to sell the security or more likely than not will be required to sell the security before its anticipated recovery. The assessment of whether an other-than-temporary decline exists involves a high degree of subjectivity and judgment and is based on the information available to management at a point in time. The second segment of the portfolio uses the OTTI guidance provided by FASB ASC-325 that is specific to purchase beneficial interests that, on the purchase date, were rated below AA. Under the FASB ASC-325 model, the Corporation compares the present value of the remaining cash flows as estimated at the preceding evaluation date to the current expected remaining cash flows. An OTTI is deemed to have occurred if there has been an adverse change in the remaining expected future cash flows. When OTTI occurs under either model, the amount of the OTTI recognized in earnings depends on whether an entity intends to sell the security or it is more likely than not it will be required to sell the security before recovery of its amortized cost basis, less any current-period credit loss. If an entity intends to sell or it is more likely than not it will be required to sell the security before recovery of its amortized cost basis, less any current-period credit loss, the OTTI shall be recognized in earnings equal to the entire difference between the investment's amortized cost basis and its fair value at the balance sheet date. If an entity does not intend to sell the security and it is not more likely than not that the entity will be required to sell the security before recovery of its amortized cost basis less any current-period loss, the OTTI shall be separated into the amount representing the credit loss and the amount related to all other factors. The amount of the total OTTI related to the credit loss is determined based on the present value of cash flows expected to be collected and is recognized in earnings. The amount of the total OTTI related to other factors is recognized in other comprehensive income, net of applicable taxes. The previous amortized cost basis less the OTTI recognized in earnings becomes the new amortized cost basis of the investment. Gross unrealized losses on investment securities were $8.2 million as of December 31, 2012 and $9.4 million as of December 31, 2011. A majority of these losses represent negative adjustments to fair value relative to the illiquidity in the markets on the securities and not losses related to the creditworthiness of the issuer. A significant portion of the total unrealized losses relates to collateralized debt obligations that were separately evaluated under FASB ASC 325-40, Beneficial Interests in Securitized Financial Assets. Based upon qualitative considerations, such as a downgrade in credit rating or further defaults of underlying issuers during the year, and an analysis of expected cash flows, we determined that three CDOs included in collateralized debt obligations were other-than-temporarily impaired. Those three CDO’s have a contractual balance of $27.3 million at December 31, 2012 which has been reduced to $5.4 million by $1.0 million of interest
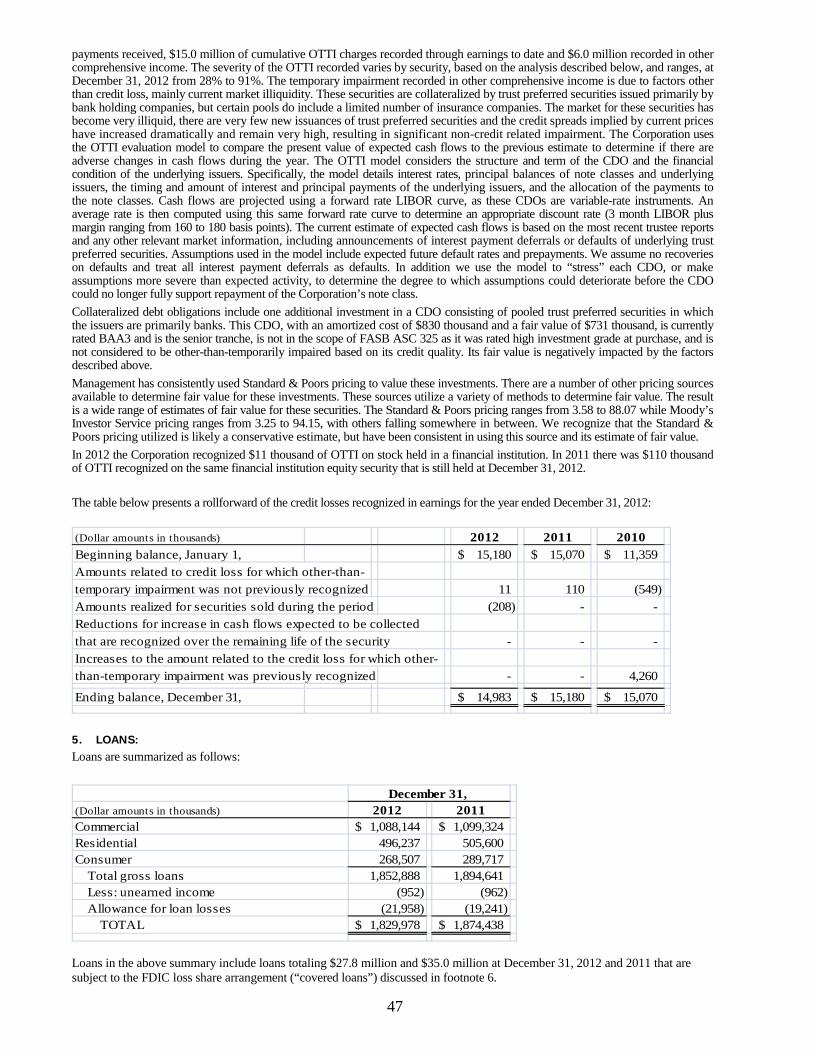
47
payments received, $15.0 million of cumulative OTTI charges recorded through earnings to date and $6.0 million recorded in other comprehensive income. The severity of the OTTI recorded varies by security, based on the analysis described below, and ranges, at December 31, 2012 from 28% to 91%. The temporary impairment recorded in other comprehensive income is due to factors other than credit loss, mainly current market illiquidity. These securities are collateralized by trust preferred securities issued primarily by bank holding companies, but certain pools do include a limited number of insurance companies. The market for these securities has become very illiquid, there are very few new issuances of trust preferred securities and the credit spreads implied by current prices have increased dramatically and remain very high, resulting in significant non-credit related impairment. The Corporation uses the OTTI evaluation model to compare the present value of expected cash flows to the previous estimate to determine if there are adverse changes in cash flows during the year. The OTTI model considers the structure and term of the CDO and the financial condition of the underlying issuers. Specifically, the model details interest rates, principal balances of note classes and underlying issuers, the timing and amount of interest and principal payments of the underlying issuers, and the allocation of the payments to the note classes. Cash flows are projected using a forward rate LIBOR curve, as these CDOs are variable-rate instruments. An average rate is then computed using this same forward rate curve to determine an appropriate discount rate (3 month LIBOR plus margin ranging from 160 to 180 basis points). The current estimate of expected cash flows is based on the most recent trustee reports and any other relevant market information, including announcements of interest payment deferrals or defaults of underlying trust preferred securities. Assumptions used in the model include expected future default rates and prepayments. We assume no recoveries on defaults and treat all interest payment deferrals as defaults. In addition we use the model to “stress” each CDO, or make assumptions more severe than expected activity, to determine the degree to which assumptions could deteriorate before the CDO could no longer fully support repayment of the Corporation’s note class. Collateralized debt obligations include one additional investment in a CDO consisting of pooled trust preferred securities in which the issuers are primarily banks. This CDO, with an amortized cost of $830 thousand and a fair value of $731 thousand, is currently rated BAA3 and is the senior tranche, is not in the scope of FASB ASC 325 as it was rated high investment grade at purchase, and is not considered to be other-than-temporarily impaired based on its credit quality. Its fair value is negatively impacted by the factors described above. Management has consistently used Standard & Poors pricing to value these investments. There are a number of other pricing sources available to determine fair value for these investments. These sources utilize a variety of methods to determine fair value. The result is a wide range of estimates of fair value for these securities. The Standard & Poors pricing ranges from 3.58 to 88.07 while Moody’s Investor Service pricing ranges from 3.25 to 94.15, with others falling somewhere in between. We recognize that the Standard & Poors pricing utilized is likely a conservative estimate, but have been consistent in using this source and its estimate of fair value. In 2012 the Corporation recognized $11 thousand of OTTI on stock held in a financial institution. In 2011 there was $110 thousand of OTTI recognized on the same financial institution equity security that is still held at December 31, 2012. The table below presents a rollforward of the credit losses recognized in earnings for the year ended December 31, 2012:
(Dollar amounts in thousands) 2012 2011 2010Beginning balance, January 1, 15,180$ 15,070$ 11,359$ Amounts related to credit loss for which other-than-temporary impairment was not previously recognized 11 110 (549) Amounts realized for securities sold during the period (208) - - Reductions for increase in cash flows expected to be collectedthat are recognized over the remaining life of the security - - - Increases to the amount related to the credit loss for which other-than-temporary impairment was previously recognized - - 4,260
Ending balance, December 31, 14,983$ 15,180$ 15,070$
5. LOANS: Loans are summarized as follows:
(Dollar amounts in thousands) 2012 2011Commercial 1,088,144$ 1,099,324$ Residential 496,237 505,600 Consumer 268,507 289,717
Total gross loans 1,852,888 1,894,641 Less: unearned income (952) (962) Allowance for loan losses (21,958) (19,241)
TOTAL 1,829,978$ 1,874,438$
December 31,
Loans in the above summary include loans totaling $27.8 million and $35.0 million at December 31, 2012 and 2011 that are subject to the FDIC loss share arrangement (“covered loans”) discussed in footnote 6.
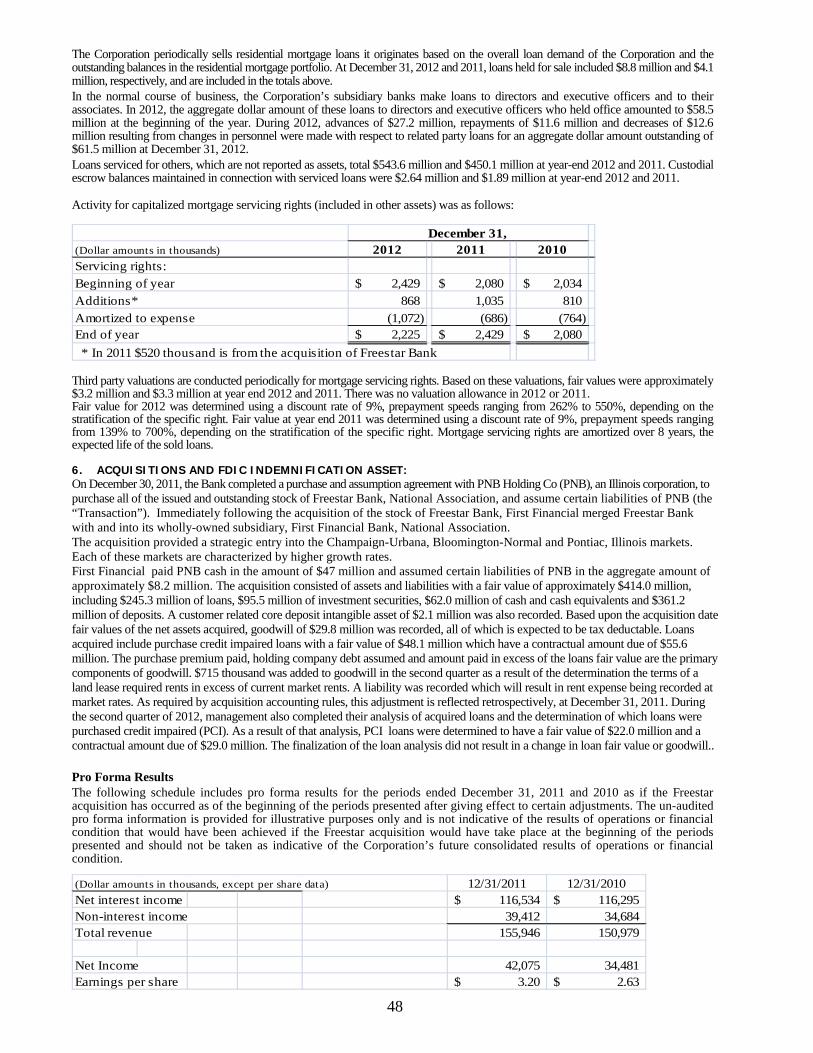
48
The Corporation periodically sells residential mortgage loans it originates based on the overall loan demand of the Corporation and the outstanding balances in the residential mortgage portfolio. At December 31, 2012 and 2011, loans held for sale included $8.8 million and $4.1 million, respectively, and are included in the totals above. In the normal course of business, the Corporation’s subsidiary banks make loans to directors and executive officers and to their associates. In 2012, the aggregate dollar amount of these loans to directors and executive officers who held office amounted to $58.5 million at the beginning of the year. During 2012, advances of $27.2 million, repayments of $11.6 million and decreases of $12.6 million resulting from changes in personnel were made with respect to related party loans for an aggregate dollar amount outstanding of $61.5 million at December 31, 2012. Loans serviced for others, which are not reported as assets, total $543.6 million and $450.1 million at year-end 2012 and 2011. Custodial escrow balances maintained in connection with serviced loans were $2.64 million and $1.89 million at year-end 2012 and 2011.
Activity for capitalized mortgage servicing rights (included in other assets) was as follows:
(Dollar amounts in thousands) 2012 2011 2010Servicing rights:Beginning of year 2,429$ 2,080$ 2,034$ Additions* 868 1,035 810 Amortized to expense (1,072) (686) (764) End of year 2,225$ 2,429$ 2,080$ * In 2011 $520 thousand is from the acquisition of Freestar Bank
December 31,
Third party valuations are conducted periodically for mortgage servicing rights. Based on these valuations, fair values were approximately $3.2 million and $3.3 million at year end 2012 and 2011. There was no valuation allowance in 2012 or 2011. Fair value for 2012 was determined using a discount rate of 9%, prepayment speeds ranging from 262% to 550%, depending on the stratification of the specific right. Fair value at year end 2011 was determined using a discount rate of 9%, prepayment speeds ranging from 139% to 700%, depending on the stratification of the specific right. Mortgage servicing rights are amortized over 8 years, the expected life of the sold loans.
6. ACQUISITIONS AND FDIC INDEMNIFICATION ASSET: On December 30, 2011, the Bank completed a purchase and assumption agreement with PNB Holding Co (PNB), an Illinois corporation, to purchase all of the issued and outstanding stock of Freestar Bank, National Association, and assume certain liabilities of PNB (the “Transaction”). Immediately following the acquisition of the stock of Freestar Bank, First Financial merged Freestar Bank with and into its wholly-owned subsidiary, First Financial Bank, National Association. The acquisition provided a strategic entry into the Champaign-Urbana, Bloomington-Normal and Pontiac, Illinois markets. Each of these markets are characterized by higher growth rates. First Financial paid PNB cash in the amount of $47 million and assumed certain liabilities of PNB in the aggregate amount of approximately $8.2 million. The acquisition consisted of assets and liabilities with a fair value of approximately $414.0 million, including $245.3 million of loans, $95.5 million of investment securities, $62.0 million of cash and cash equivalents and $361.2 million of deposits. A customer related core deposit intangible asset of $2.1 million was also recorded. Based upon the acquisition date fair values of the net assets acquired, goodwill of $29.8 million was recorded, all of which is expected to be tax deductable. Loans acquired include purchase credit impaired loans with a fair value of $48.1 million which have a contractual amount due of $55.6 million. The purchase premium paid, holding company debt assumed and amount paid in excess of the loans fair value are the primary components of goodwill. $715 thousand was added to goodwill in the second quarter as a result of the determination the terms of a land lease required rents in excess of current market rents. A liability was recorded which will result in rent expense being recorded at market rates. As required by acquisition accounting rules, this adjustment is reflected retrospectively, at December 31, 2011. During the second quarter of 2012, management also completed their analysis of acquired loans and the determination of which loans were purchased credit impaired (PCI). As a result of that analysis, PCI loans were determined to have a fair value of $22.0 million and a contractual amount due of $29.0 million. The finalization of the loan analysis did not result in a change in loan fair value or goodwill.. Pro Forma Results The following schedule includes pro forma results for the periods ended December 31, 2011 and 2010 as if the Freestar acquisition has occurred as of the beginning of the periods presented after giving effect to certain adjustments. The un-audited pro forma information is provided for illustrative purposes only and is not indicative of the results of operations or financial condition that would have been achieved if the Freestar acquisition would have take place at the beginning of the periods presented and should not be taken as indicative of the Corporation’s future consolidated results of operations or financial condition.
(Dollar amounts in thousands, except per share data) 12/31/2011 12/31/2010Net interest income 116,534$ 116,295$ Non-interest income 39,412 34,684 Total revenue 155,946 150,979
Net Income 42,075 34,481 Earnings per share 3.20$ 2.63$
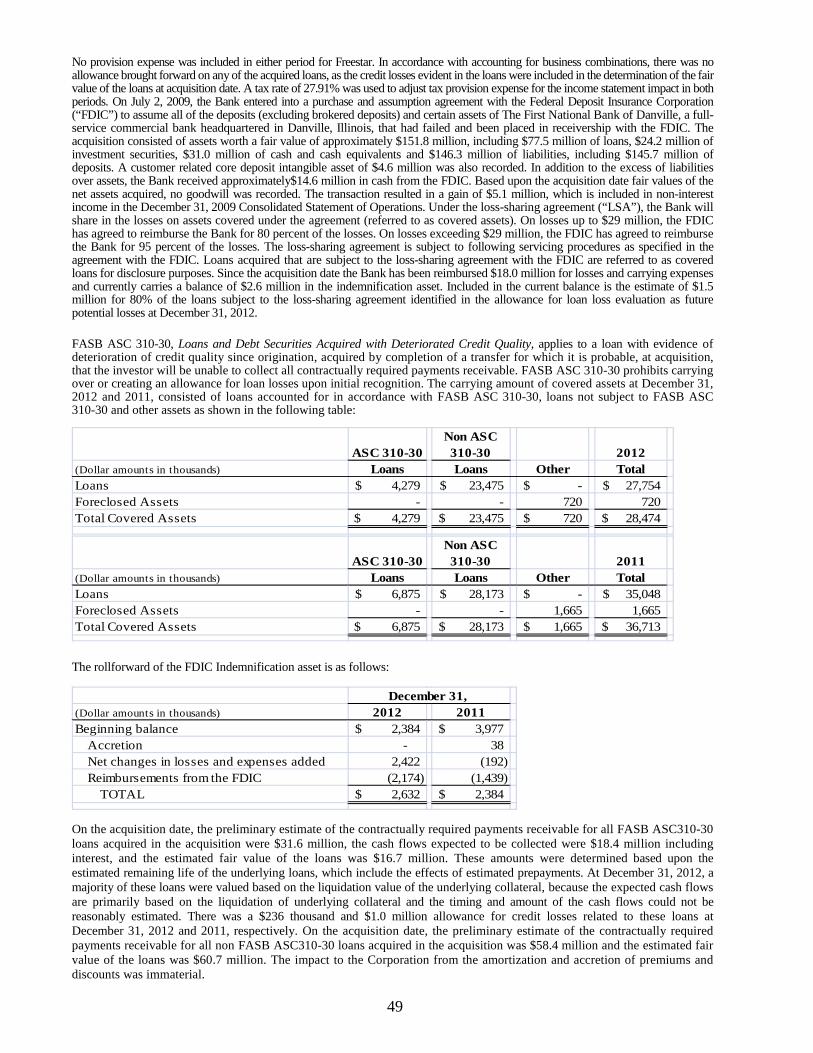
49
No provision expense was included in either period for Freestar. In accordance with accounting for business combinations, there was no allowance brought forward on any of the acquired loans, as the credit losses evident in the loans were included in the determination of the fair value of the loans at acquisition date. A tax rate of 27.91% was used to adjust tax provision expense for the income statement impact in both periods. On July 2, 2009, the Bank entered into a purchase and assumption agreement with the Federal Deposit Insurance Corporation (“FDIC”) to assume all of the deposits (excluding brokered deposits) and certain assets of The First National Bank of Danville, a full-service commercial bank headquartered in Danville, Illinois, that had failed and been placed in receivership with the FDIC. The acquisition consisted of assets worth a fair value of approximately $151.8 million, including $77.5 million of loans, $24.2 million of investment securities, $31.0 million of cash and cash equivalents and $146.3 million of liabilities, including $145.7 million of deposits. A customer related core deposit intangible asset of $4.6 million was also recorded. In addition to the excess of liabilities over assets, the Bank received approximately$14.6 million in cash from the FDIC. Based upon the acquisition date fair values of the net assets acquired, no goodwill was recorded. The transaction resulted in a gain of $5.1 million, which is included in non-interest income in the December 31, 2009 Consolidated Statement of Operations. Under the loss-sharing agreement (“LSA”), the Bank will share in the losses on assets covered under the agreement (referred to as covered assets). On losses up to $29 million, the FDIC has agreed to reimburse the Bank for 80 percent of the losses. On losses exceeding $29 million, the FDIC has agreed to reimburse the Bank for 95 percent of the losses. The loss-sharing agreement is subject to following servicing procedures as specified in the agreement with the FDIC. Loans acquired that are subject to the loss-sharing agreement with the FDIC are referred to as covered loans for disclosure purposes. Since the acquisition date the Bank has been reimbursed $18.0 million for losses and carrying expenses and currently carries a balance of $2.6 million in the indemnification asset. Included in the current balance is the estimate of $1.5 million for 80% of the loans subject to the loss-sharing agreement identified in the allowance for loan loss evaluation as future potential losses at December 31, 2012. FASB ASC 310-30, Loans and Debt Securities Acquired with Deteriorated Credit Quality, applies to a loan with evidence of deterioration of credit quality since origination, acquired by completion of a transfer for which it is probable, at acquisition, that the investor will be unable to collect all contractually required payments receivable. FASB ASC 310-30 prohibits carrying over or creating an allowance for loan losses upon initial recognition. The carrying amount of covered assets at December 31, 2012 and 2011, consisted of loans accounted for in accordance with FASB ASC 310-30, loans not subject to FASB ASC 310-30 and other assets as shown in the following table:
ASC 310-30Non ASC 310-30 2012
(Dollar amounts in thousands) Loans Loans Other TotalLoans 4,279$ 23,475$ -$ 27,754$ Foreclosed Assets - - 720 720 Total Covered Assets $ 4,279 23,475$ 720$ 28,474$
ASC 310-30Non ASC 310-30 2011
(Dollar amounts in thousands) Loans Loans Other TotalLoans 6,875$ 28,173$ -$ 35,048$ Foreclosed Assets - - 1,665 1,665 Total Covered Assets $ 6,875 28,173$ 1,665$ 36,713$
The rollforward of the FDIC Indemnification asset is as follows:
(Dollar amounts in thousands) 2012 2011Beginning balance 2,384$ 3,977$
Accretion - 38 Net changes in losses and expenses added 2,422 (192) Reimbursements from the FDIC (2,174) (1,439)
TOTAL 2,632$ 2,384$
December 31,
On the acquisition date, the preliminary estimate of the contractually required payments receivable for all FASB ASC310-30 loans acquired in the acquisition were $31.6 million, the cash flows expected to be collected were $18.4 million including interest, and the estimated fair value of the loans was $16.7 million. These amounts were determined based upon the estimated remaining life of the underlying loans, which include the effects of estimated prepayments. At December 31, 2012, a majority of these loans were valued based on the liquidation value of the underlying collateral, because the expected cash flows are primarily based on the liquidation of underlying collateral and the timing and amount of the cash flows could not be reasonably estimated. There was a $236 thousand and $1.0 million allowance for credit losses related to these loans at December 31, 2012 and 2011, respectively. On the acquisition date, the preliminary estimate of the contractually required payments receivable for all non FASB ASC310-30 loans acquired in the acquisition was $58.4 million and the estimated fair value of the loans was $60.7 million. The impact to the Corporation from the amortization and accretion of premiums and discounts was immaterial.
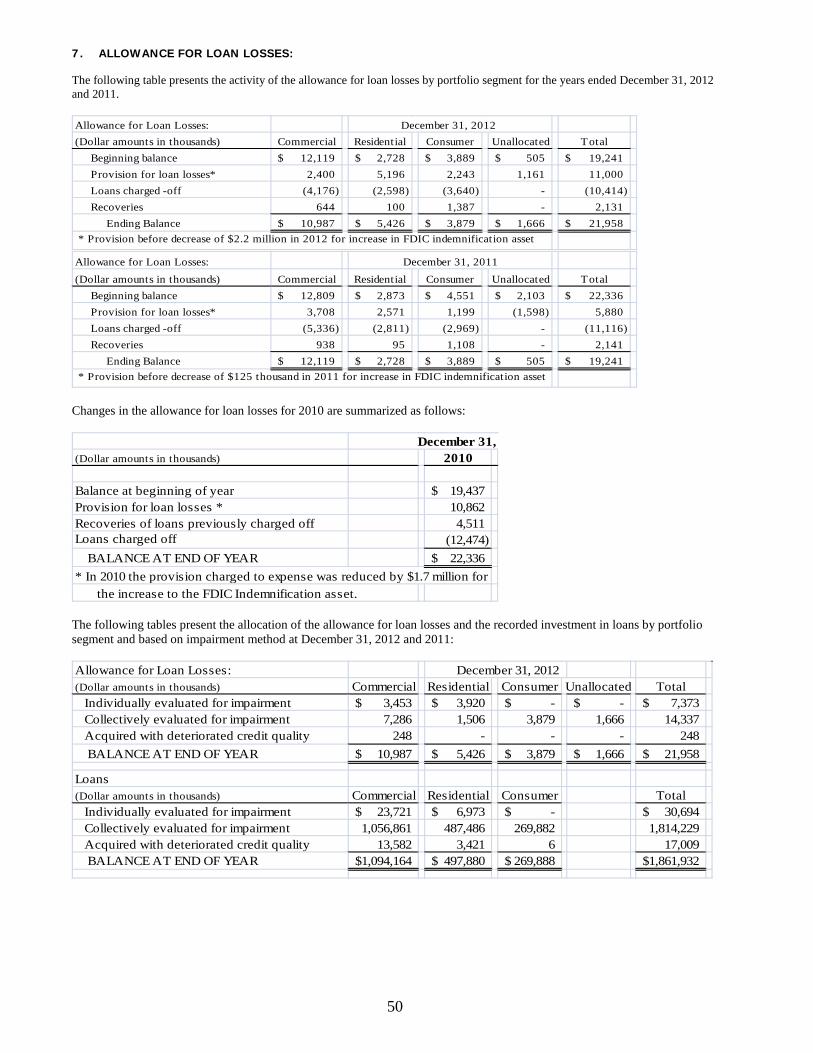
50
7. ALLOWANCE FOR LOAN LOSSES: The following table presents the activity of the allowance for loan losses by portfolio segment for the years ended December 31, 2012 and 2011. Allowance for Loan Losses: December 31, 2012 (Dollar amounts in thousands) Commercial Residential Consumer Unallocated Total Beginning balance 12,119$ 2,728$ 3,889$ 505$ 19,241$ Provision for loan losses* 2,400 5,196 2,243 1,161 11,000 Loans charged -off (4,176) (2,598) (3,640) - (10,414) Recoveries 644 100 1,387 - 2,131
Ending Balance 10,987$ 5,426$ 3,879$ 1,666$ 21,958$ * Provision before decrease of $2.2 million in 2012 for increase in FDIC indemnification asset
Allowance for Loan Losses: December 31, 2011(Dollar amounts in thousands) Commercial Residential Consumer Unallocated Total Beginning balance 12,809$ 2,873$ 4,551$ 2,103$ 22,336$ Provision for loan losses* 3,708 2,571 1,199 (1,598) 5,880 Loans charged -off (5,336) (2,811) (2,969) - (11,116) Recoveries 938 95 1,108 - 2,141
Ending Balance 12,119$ 2,728$ 3,889$ 505$ 19,241$ * Provision before decrease of $125 thousand in 2011 for increase in FDIC indemnification asset
Changes in the allowance for loan losses for 2010 are summarized as follows:
December 31, (Dollar amounts in thousands) 2010
Balance at beginning of year 19,437$ Provision for loan losses * 10,862 Recoveries of loans previously charged off 4,511 Loans charged off (12,474)
BALANCE AT END OF YEAR 22,336$ * In 2010 the provision charged to expense was reduced by $1.7 million for the increase to the FDIC Indemnification asset.
The following tables present the allocation of the allowance for loan losses and the recorded investment in loans by portfolio segment and based on impairment method at December 31, 2012 and 2011:
Allowance for Loan Losses: December 31, 2012(Dollar amounts in thousands) Commercial Residential Consumer Unallocated Total Individually evaluated for impairment 3,453$ 3,920$ -$ -$ 7,373$ Collectively evaluated for impairment 7,286 1,506 3,879 1,666 14,337 Acquired with deteriorated credit quality 248 - - - 248
BALANCE AT END OF YEAR 10,987$ 5,426$ 3,879$ 1,666$ 21,958$
Loans(Dollar amounts in thousands) Commercial Residential Consumer Total Individually evaluated for impairment 23,721$ 6,973$ -$ 30,694$ Collectively evaluated for impairment 1,056,861 487,486 269,882 1,814,229 Acquired with deteriorated credit quality 13,582 3,421 6 17,009
BALANCE AT END OF YEAR 1,094,164$ 497,880$ 269,888$ 1,861,932$
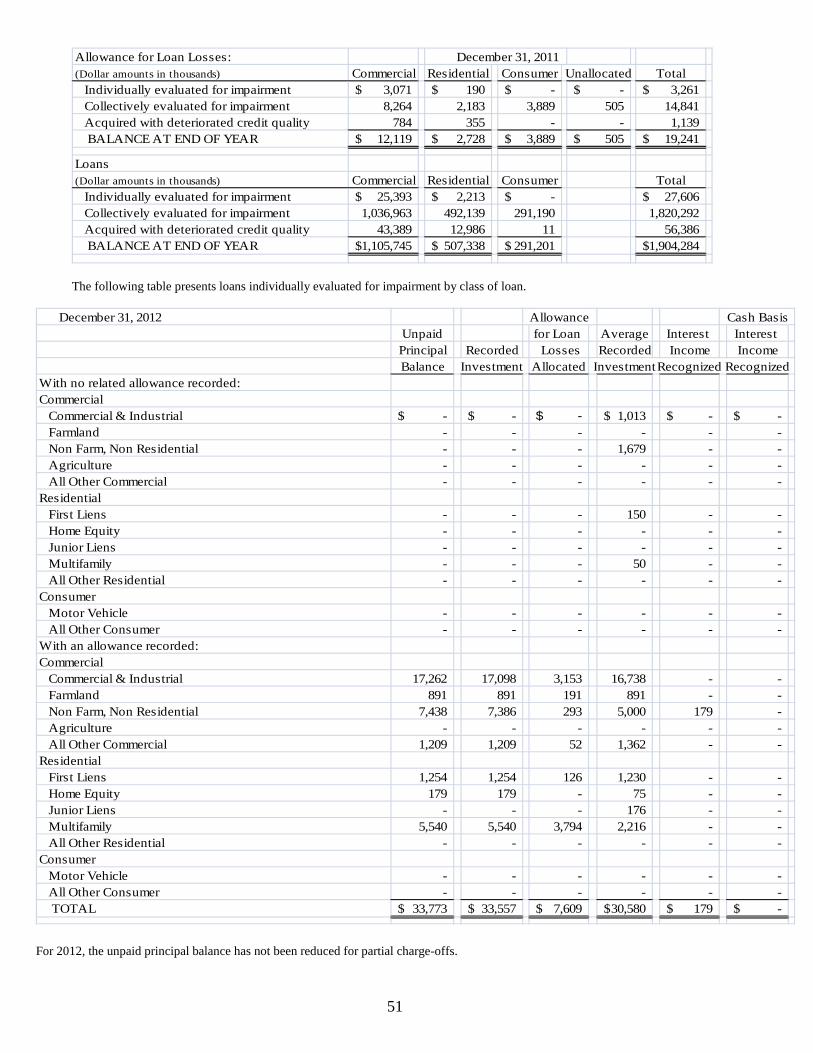
51
Allowance for Loan Losses: December 31, 2011(Dollar amounts in thousands) Commercial Residential Consumer Unallocated Total Individually evaluated for impairment 3,071$ 190$ -$ -$ 3,261$ Collectively evaluated for impairment 8,264 2,183 3,889 505 14,841 Acquired with deteriorated credit quality 784 355 - - 1,139
BALANCE AT END OF YEAR 12,119$ 2,728$ 3,889$ 505$ 19,241$
Loans(Dollar amounts in thousands) Commercial Residential Consumer Total Individually evaluated for impairment 25,393$ 2,213$ -$ 27,606$ Collectively evaluated for impairment 1,036,963 492,139 291,190 1,820,292 Acquired with deteriorated credit quality 43,389 12,986 11 56,386
BALANCE AT END OF YEAR 1,105,745$ 507,338$ 291,201$ 1,904,284$
The following table presents loans individually evaluated for impairment by class of loan.
December 31, 2012 Allowance Cash Basis
Unpaid for Loan Average Interest Interest Principal Recorded Losses Recorded Income IncomeBalance Investment Allocated InvestmentRecognized Recognized
With no related allowance recorded:Commercial Commercial & Industrial -$ -$ -$ 1,013$ -$ -$ Farmland - - - - - - Non Farm, Non Residential - - - 1,679 - - Agriculture - - - - - - All Other Commercial - - - - - - Residential First Liens - - - 150 - - Home Equity - - - - - - Junior Liens - - - - - - Multifamily - - - 50 - - All Other Residential - - - - - - Consumer Motor Vehicle - - - - - - All Other Consumer - - - - - - With an allowance recorded:Commercial Commercial & Industrial 17,262 17,098 3,153 16,738 - - Farmland 891 891 191 891 - - Non Farm, Non Residential 7,438 7,386 293 5,000 179 - Agriculture - - - - - - All Other Commercial 1,209 1,209 52 1,362 - - Residential First Liens 1,254 1,254 126 1,230 - - Home Equity 179 179 - 75 - - Junior Liens - - - 176 - - Multifamily 5,540 5,540 3,794 2,216 - - All Other Residential - - - - - - Consumer Motor Vehicle - - - - - - All Other Consumer - - - - - -
TOTAL 33,773$ 33,557$ 7,609$ 30,580$ 179$ -$
For 2012, the unpaid principal balance has not been reduced for partial charge-offs.
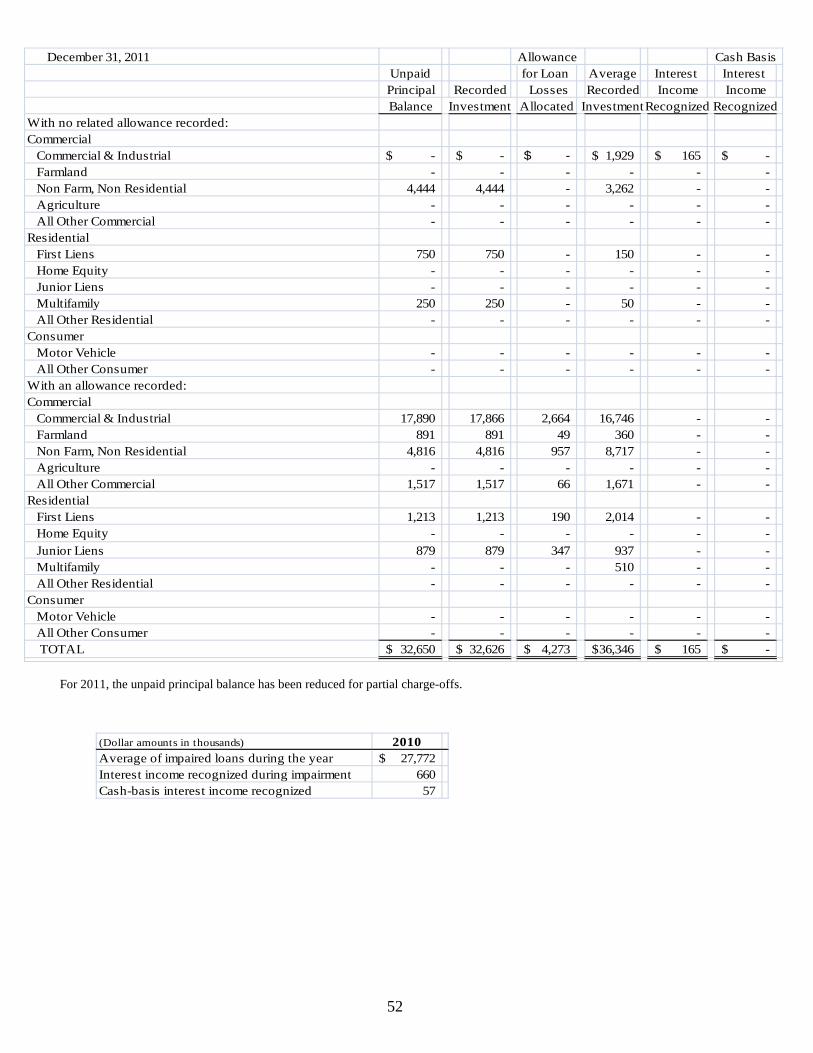
52
December 31, 2011 Allowance Cash BasisUnpaid for Loan Average Interest Interest Principal Recorded Losses Recorded Income IncomeBalance Investment Allocated InvestmentRecognized Recognized
With no related allowance recorded:Commercial Commercial & Industrial -$ -$ -$ 1,929$ 165$ -$ Farmland - - - - - - Non Farm, Non Residential 4,444 4,444 - 3,262 - - Agriculture - - - - - - All Other Commercial - - - - - - Residential First Liens 750 750 - 150 - - Home Equity - - - - - - Junior Liens - - - - - - Multifamily 250 250 - 50 - - All Other Residential - - - - - - Consumer Motor Vehicle - - - - - - All Other Consumer - - - - - - With an allowance recorded:Commercial Commercial & Industrial 17,890 17,866 2,664 16,746 - - Farmland 891 891 49 360 - - Non Farm, Non Residential 4,816 4,816 957 8,717 - - Agriculture - - - - - - All Other Commercial 1,517 1,517 66 1,671 - - Residential First Liens 1,213 1,213 190 2,014 - - Home Equity - - - - - - Junior Liens 879 879 347 937 - - Multifamily - - - 510 - - All Other Residential - - - - - - Consumer Motor Vehicle - - - - - - All Other Consumer - - - - - -
TOTAL 32,650$ 32,626$ 4,273$ 36,346$ 165$ -$
For 2011, the unpaid principal balance has been reduced for partial charge-offs. (Dollar amounts in thousands) 2010Average of impaired loans during the year 27,772$ Interest income recognized during impairment 660 Cash-basis interest income recognized 57
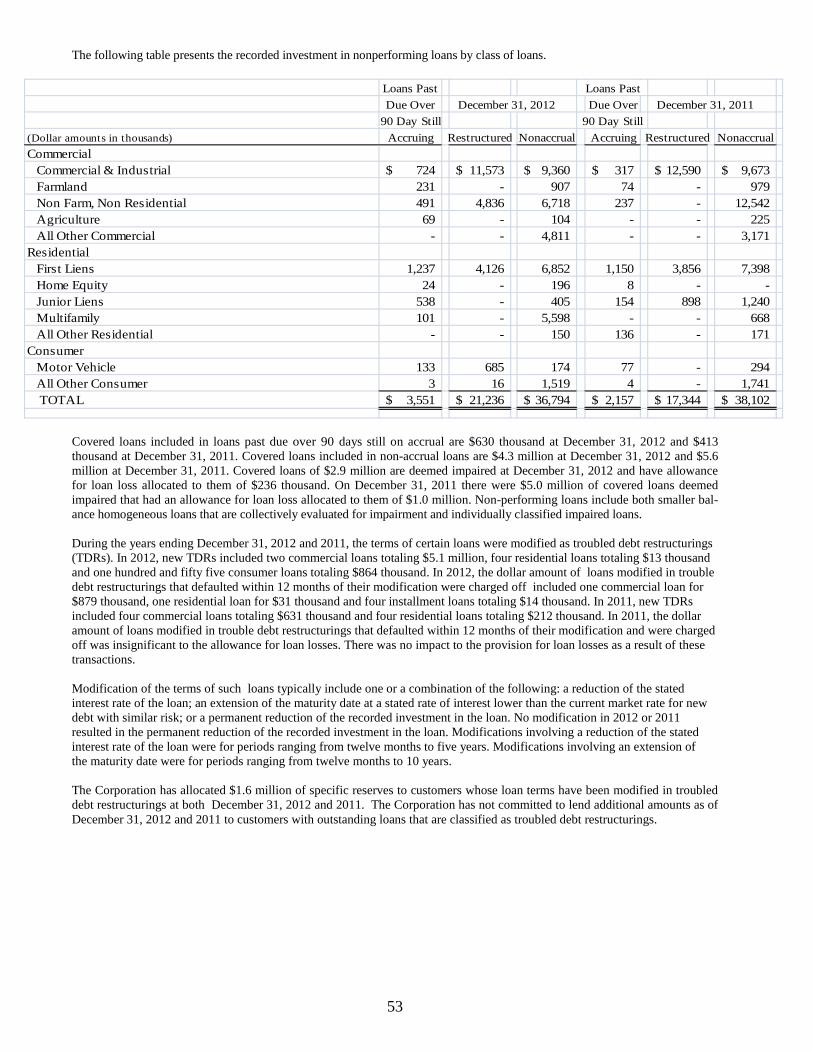
53
The following table presents the recorded investment in nonperforming loans by class of loans.
Loans Past Loans PastDue Over December 31, 2012 Due Over December 31, 2011
90 Day Still 90 Day Still(Dollar amounts in thousands) Accruing Restructured Nonaccrual Accruing Restructured NonaccrualCommercial Commercial & Industrial 724$ 11,573$ 9,360$ 317$ 12,590$ 9,673$ Farmland 231 - 907 74 - 979 Non Farm, Non Residential 491 4,836 6,718 237 - 12,542 Agriculture 69 - 104 - - 225 All Other Commercial - - 4,811 - - 3,171 Residential First Liens 1,237 4,126 6,852 1,150 3,856 7,398 Home Equity 24 - 196 8 - - Junior Liens 538 - 405 154 898 1,240 Multifamily 101 - 5,598 - - 668 All Other Residential - - 150 136 - 171 Consumer Motor Vehicle 133 685 174 77 - 294 All Other Consumer 3 16 1,519 4 - 1,741
TOTAL 3,551$ 21,236$ 36,794$ 2,157$ 17,344$ 38,102$
Covered loans included in loans past due over 90 days still on accrual are $630 thousand at December 31, 2012 and $413 thousand at December 31, 2011. Covered loans included in non-accrual loans are $4.3 million at December 31, 2012 and $5.6 million at December 31, 2011. Covered loans of $2.9 million are deemed impaired at December 31, 2012 and have allowance for loan loss allocated to them of $236 thousand. On December 31, 2011 there were $5.0 million of covered loans deemed impaired that had an allowance for loan loss allocated to them of $1.0 million. Non-performing loans include both smaller bal-ance homogeneous loans that are collectively evaluated for impairment and individually classified impaired loans. During the years ending December 31, 2012 and 2011, the terms of certain loans were modified as troubled debt restructurings (TDRs). In 2012, new TDRs included two commercial loans totaling $5.1 million, four residential loans totaling $13 thousand and one hundred and fifty five consumer loans totaling $864 thousand. In 2012, the dollar amount of loans modified in trouble debt restructurings that defaulted within 12 months of their modification were charged off included one commercial loan for $879 thousand, one residential loan for $31 thousand and four installment loans totaling $14 thousand. In 2011, new TDRs included four commercial loans totaling $631 thousand and four residential loans totaling $212 thousand. In 2011, the dollar amount of loans modified in trouble debt restructurings that defaulted within 12 months of their modification and were charged off was insignificant to the allowance for loan losses. There was no impact to the provision for loan losses as a result of these transactions. Modification of the terms of such loans typically include one or a combination of the following: a reduction of the stated interest rate of the loan; an extension of the maturity date at a stated rate of interest lower than the current market rate for new debt with similar risk; or a permanent reduction of the recorded investment in the loan. No modification in 2012 or 2011 resulted in the permanent reduction of the recorded investment in the loan. Modifications involving a reduction of the stated interest rate of the loan were for periods ranging from twelve months to five years. Modifications involving an extension of the maturity date were for periods ranging from twelve months to 10 years. The Corporation has allocated $1.6 million of specific reserves to customers whose loan terms have been modified in troubled debt restructurings at both December 31, 2012 and 2011. The Corporation has not committed to lend additional amounts as of December 31, 2012 and 2011 to customers with outstanding loans that are classified as troubled debt restructurings.
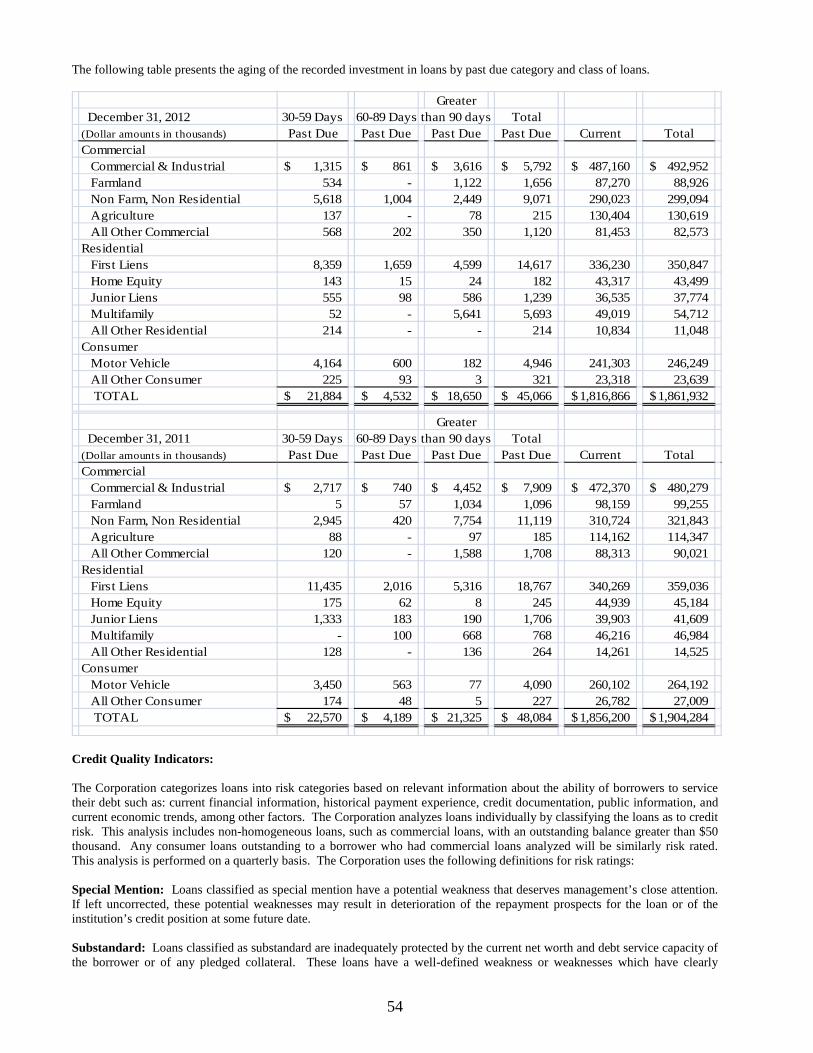
54
The following table presents the aging of the recorded investment in loans by past due category and class of loans.
Greater
December 31, 2012 30-59 Days 60-89 Days than 90 days Total(Dollar amounts in thousands) Past Due Past Due Past Due Past Due Current TotalCommercial Commercial & Industrial 1,315$ 861$ 3,616$ 5,792$ 487,160$ 492,952$ Farmland 534 - 1,122 1,656 87,270 88,926 Non Farm, Non Residential 5,618 1,004 2,449 9,071 290,023 299,094 Agriculture 137 - 78 215 130,404 130,619 All Other Commercial 568 202 350 1,120 81,453 82,573 Residential First Liens 8,359 1,659 4,599 14,617 336,230 350,847 Home Equity 143 15 24 182 43,317 43,499 Junior Liens 555 98 586 1,239 36,535 37,774 Multifamily 52 - 5,641 5,693 49,019 54,712 All Other Residential 214 - - 214 10,834 11,048 Consumer Motor Vehicle 4,164 600 182 4,946 241,303 246,249 All Other Consumer 225 93 3 321 23,318 23,639
TOTAL 21,884$ 4,532$ 18,650$ 45,066$ 1,816,866$ 1,861,932$
Greater December 31, 2011 30-59 Days 60-89 Days than 90 days Total(Dollar amounts in thousands) Past Due Past Due Past Due Past Due Current TotalCommercial Commercial & Industrial 2,717$ 740$ 4,452$ 7,909$ 472,370$ 480,279$ Farmland 5 57 1,034 1,096 98,159 99,255 Non Farm, Non Residential 2,945 420 7,754 11,119 310,724 321,843 Agriculture 88 - 97 185 114,162 114,347 All Other Commercial 120 - 1,588 1,708 88,313 90,021 Residential First Liens 11,435 2,016 5,316 18,767 340,269 359,036 Home Equity 175 62 8 245 44,939 45,184 Junior Liens 1,333 183 190 1,706 39,903 41,609 Multifamily - 100 668 768 46,216 46,984 All Other Residential 128 - 136 264 14,261 14,525 Consumer Motor Vehicle 3,450 563 77 4,090 260,102 264,192 All Other Consumer 174 48 5 227 26,782 27,009
TOTAL 22,570$ 4,189$ 21,325$ 48,084$ 1,856,200$ 1,904,284$
Credit Quality Indicators:
The Corporation categorizes loans into risk categories based on relevant information about the ability of borrowers to service their debt such as: current financial information, historical payment experience, credit documentation, public information, and current economic trends, among other factors. The Corporation analyzes loans individually by classifying the loans as to credit risk. This analysis includes non-homogeneous loans, such as commercial loans, with an outstanding balance greater than $50 thousand. Any consumer loans outstanding to a borrower who had commercial loans analyzed will be similarly risk rated. This analysis is performed on a quarterly basis. The Corporation uses the following definitions for risk ratings:
Special Mention: Loans classified as special mention have a potential weakness that deserves management’s close attention. If left uncorrected, these potential weaknesses may result in deterioration of the repayment prospects for the loan or of the institution’s credit position at some future date.
Substandard: Loans classified as substandard are inadequately protected by the current net worth and debt service capacity of the borrower or of any pledged collateral. These loans have a well-defined weakness or weaknesses which have clearly
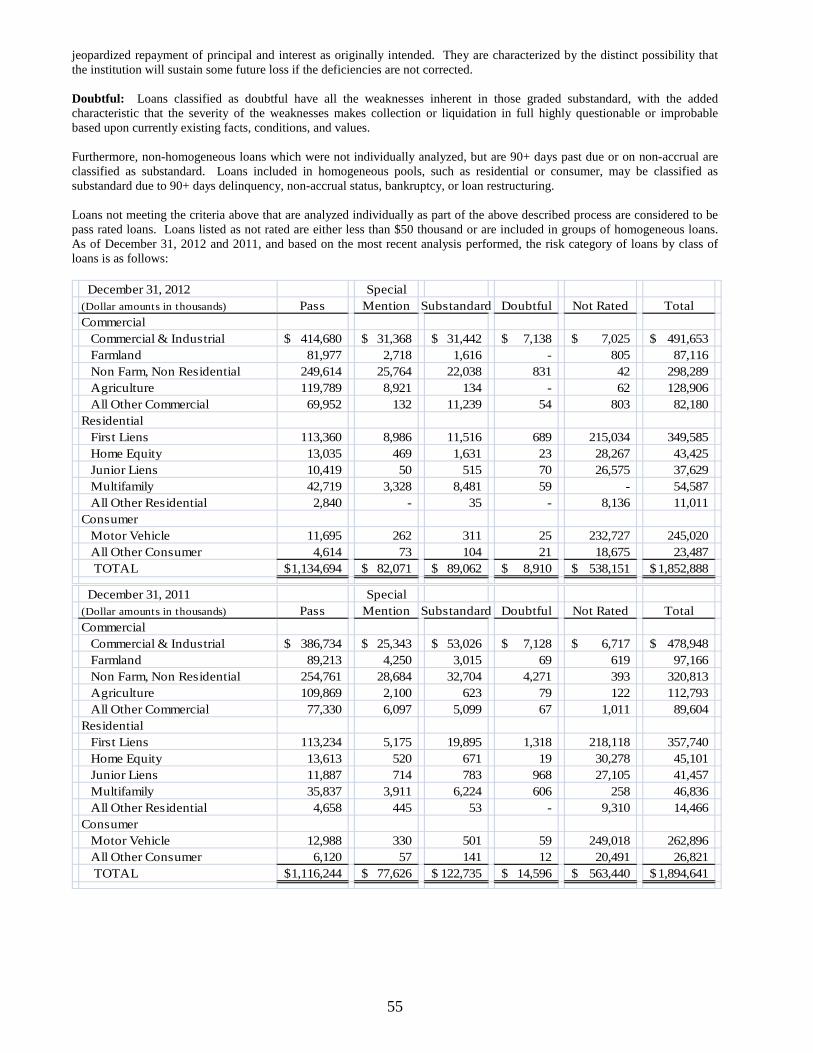
55
jeopardized repayment of principal and interest as originally intended. They are characterized by the distinct possibility that the institution will sustain some future loss if the deficiencies are not corrected. Doubtful: Loans classified as doubtful have all the weaknesses inherent in those graded substandard, with the added characteristic that the severity of the weaknesses makes collection or liquidation in full highly questionable or improbable based upon currently existing facts, conditions, and values.
Furthermore, non-homogeneous loans which were not individually analyzed, but are 90+ days past due or on non-accrual are classified as substandard. Loans included in homogeneous pools, such as residential or consumer, may be classified as substandard due to 90+ days delinquency, non-accrual status, bankruptcy, or loan restructuring.
Loans not meeting the criteria above that are analyzed individually as part of the above described process are considered to be pass rated loans. Loans listed as not rated are either less than $50 thousand or are included in groups of homogeneous loans. As of December 31, 2012 and 2011, and based on the most recent analysis performed, the risk category of loans by class of loans is as follows:
December 31, 2012 Special(Dollar amounts in thousands) Pass Mention Substandard Doubtful Not Rated TotalCommercial Commercial & Industrial 414,680$ 31,368$ 31,442$ 7,138$ 7,025$ 491,653$ Farmland 81,977 2,718 1,616 - 805 87,116 Non Farm, Non Residential 249,614 25,764 22,038 831 42 298,289 Agriculture 119,789 8,921 134 - 62 128,906 All Other Commercial 69,952 132 11,239 54 803 82,180 Residential First Liens 113,360 8,986 11,516 689 215,034 349,585 Home Equity 13,035 469 1,631 23 28,267 43,425 Junior Liens 10,419 50 515 70 26,575 37,629 Multifamily 42,719 3,328 8,481 59 - 54,587 All Other Residential 2,840 - 35 - 8,136 11,011 Consumer Motor Vehicle 11,695 262 311 25 232,727 245,020 All Other Consumer 4,614 73 104 21 18,675 23,487
TOTAL 1,134,694$ 82,071$ 89,062$ 8,910$ 538,151$ 1,852,888$
December 31, 2011 Special(Dollar amounts in thousands) Pass Mention Substandard Doubtful Not Rated TotalCommercial Commercial & Industrial 386,734$ 25,343$ 53,026$ 7,128$ 6,717$ 478,948$ Farmland 89,213 4,250 3,015 69 619 97,166 Non Farm, Non Residential 254,761 28,684 32,704 4,271 393 320,813 Agriculture 109,869 2,100 623 79 122 112,793 All Other Commercial 77,330 6,097 5,099 67 1,011 89,604 Residential First Liens 113,234 5,175 19,895 1,318 218,118 357,740 Home Equity 13,613 520 671 19 30,278 45,101 Junior Liens 11,887 714 783 968 27,105 41,457 Multifamily 35,837 3,911 6,224 606 258 46,836 All Other Residential 4,658 445 53 - 9,310 14,466 Consumer Motor Vehicle 12,988 330 501 59 249,018 262,896 All Other Consumer 6,120 57 141 12 20,491 26,821
TOTAL 1,116,244$ 77,626$ 122,735$ 14,596$ 563,440$ 1,894,641$
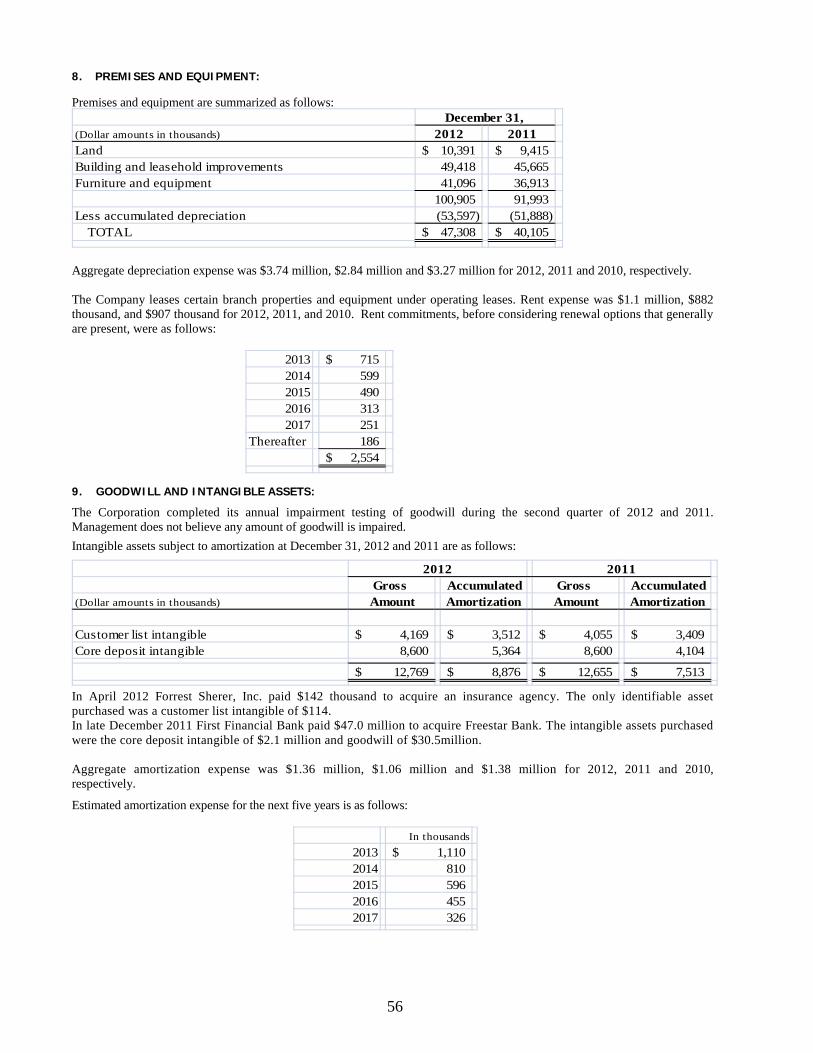
56
8. PREMISES AND EQUIPMENT:
Premises and equipment are summarized as follows:
(Dollar amounts in thousands) 2012 2011Land 10,391$ 9,415$ Building and leasehold improvements 49,418 45,665 Furniture and equipment 41,096 36,913
100,905 91,993 Less accumulated depreciation (53,597) (51,888)
TOTAL 47,308$ 40,105$
December 31,
Aggregate depreciation expense was $3.74 million, $2.84 million and $3.27 million for 2012, 2011 and 2010, respectively. The Company leases certain branch properties and equipment under operating leases. Rent expense was $1.1 million, $882 thousand, and $907 thousand for 2012, 2011, and 2010. Rent commitments, before considering renewal options that generally are present, were as follows:
2013 715$ 2014 599 2015 490 2016 313 2017 251
Thereafter 186 2,554$
9. GOODWILL AND INTANGIBLE ASSETS:
The Corporation completed its annual impairment testing of goodwill during the second quarter of 2012 and 2011. Management does not believe any amount of goodwill is impaired. Intangible assets subject to amortization at December 31, 2012 and 2011 are as follows:
Gross Accumulated Gross Accumulated(Dollar amounts in thousands) Amount Amortization Amount Amortization
Customer list intangible 4,169$ 3,512$ 4,055$ 3,409$ Core deposit intangible 8,600 5,364 8,600 4,104
12,769$ 8,876$ 12,655$ 7,513$
20112012
In April 2012 Forrest Sherer, Inc. paid $142 thousand to acquire an insurance agency. The only identifiable asset purchased was a customer list intangible of $114. In late December 2011 First Financial Bank paid $47.0 million to acquire Freestar Bank. The intangible assets purchased were the core deposit intangible of $2.1 million and goodwill of $30.5million. Aggregate amortization expense was $1.36 million, $1.06 million and $1.38 million for 2012, 2011 and 2010, respectively.
Estimated amortization expense for the next five years is as follows:
In thousands2013 1,110$ 2014 810 2015 596 2016 455 2017 326
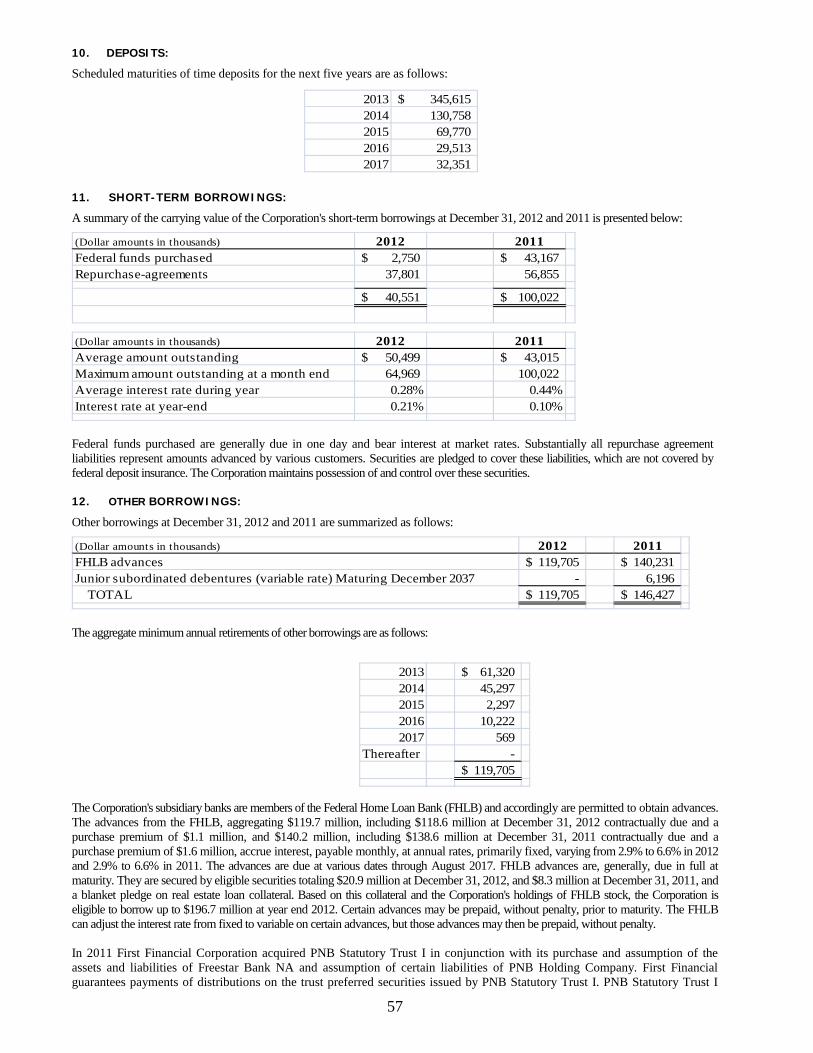
57
10. DEPOSITS:
Scheduled maturities of time deposits for the next five years are as follows:
2013 345,615$ 2014 130,758 2015 69,770 2016 29,513 2017 32,351
11. SHORT-TERM BORROWINGS:
A summary of the carrying value of the Corporation's short-term borrowings at December 31, 2012 and 2011 is presented below:
(Dollar amounts in thousands) 2012 2011Federal funds purchased 2,750$ 43,167$ Repurchase-agreements 37,801 56,855
40,551$ 100,022$
(Dollar amounts in thousands) 2012 2011Average amount outstanding 50,499$ 43,015$ Maximum amount outstanding at a month end 64,969 100,022 Average interest rate during year 0.28% 0.44%Interest rate at year-end 0.21% 0.10%
Federal funds purchased are generally due in one day and bear interest at market rates. Substantially all repurchase agreement liabilities represent amounts advanced by various customers. Securities are pledged to cover these liabilities, which are not covered by federal deposit insurance. The Corporation maintains possession of and control over these securities.
12. OTHER BORROWINGS:
Other borrowings at December 31, 2012 and 2011 are summarized as follows:
(Dollar amounts in thousands) 2012 2011FHLB advances 119,705$ 140,231$ Junior subordinated debentures (variable rate) Maturing December 2037 - 6,196
TOTAL 119,705$ 146,427$
The aggregate minimum annual retirements of other borrowings are as follows:
2013 61,320$ 2014 45,297 2015 2,297 2016 10,222 2017 569
Thereafter - 119,705$
The Corporation's subsidiary banks are members of the Federal Home Loan Bank (FHLB) and accordingly are permitted to obtain advances. The advances from the FHLB, aggregating $119.7 million, including $118.6 million at December 31, 2012 contractually due and a purchase premium of $1.1 million, and $140.2 million, including $138.6 million at December 31, 2011 contractually due and a purchase premium of $1.6 million, accrue interest, payable monthly, at annual rates, primarily fixed, varying from 2.9% to 6.6% in 2012 and 2.9% to 6.6% in 2011. The advances are due at various dates through August 2017. FHLB advances are, generally, due in full at maturity. They are secured by eligible securities totaling $20.9 million at December 31, 2012, and $8.3 million at December 31, 2011, and a blanket pledge on real estate loan collateral. Based on this collateral and the Corporation's holdings of FHLB stock, the Corporation is eligible to borrow up to $196.7 million at year end 2012. Certain advances may be prepaid, without penalty, prior to maturity. The FHLB can adjust the interest rate from fixed to variable on certain advances, but those advances may then be prepaid, without penalty. In 2011 First Financial Corporation acquired PNB Statutory Trust I in conjunction with its purchase and assumption of the assets and liabilities of Freestar Bank NA and assumption of certain liabilities of PNB Holding Company. First Financial guarantees payments of distributions on the trust preferred securities issued by PNB Statutory Trust I. PNB Statutory Trust I
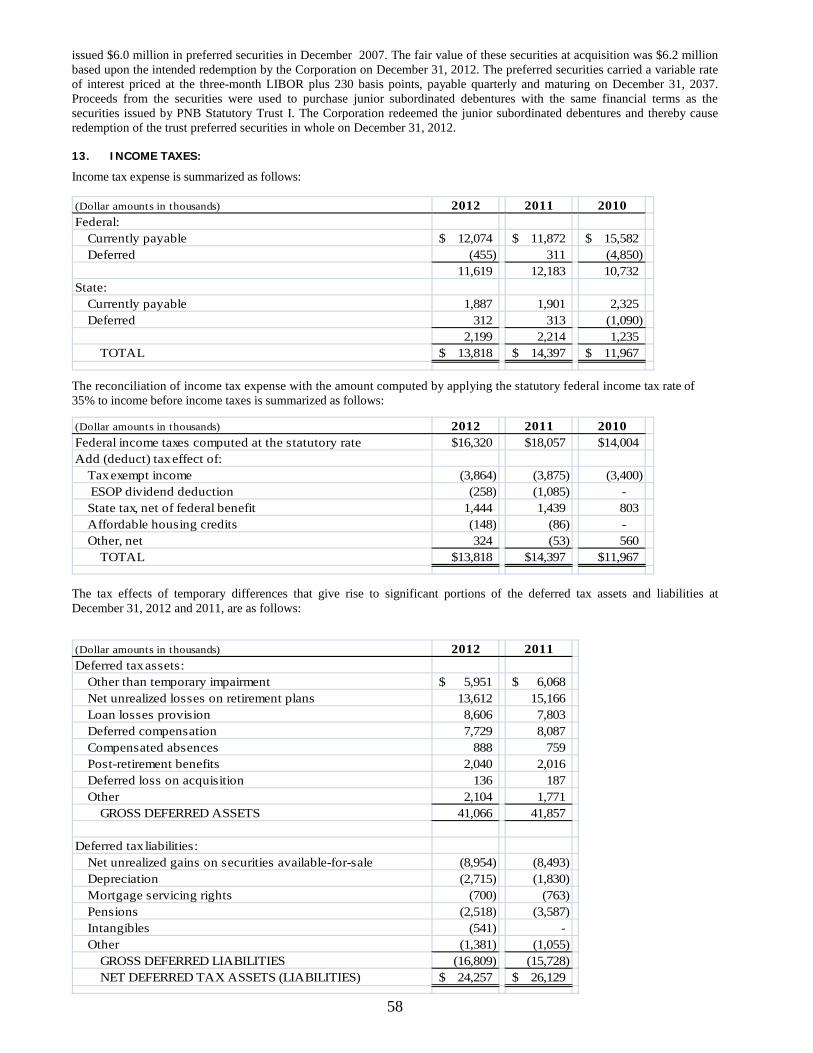
58
issued $6.0 million in preferred securities in December 2007. The fair value of these securities at acquisition was $6.2 million based upon the intended redemption by the Corporation on December 31, 2012. The preferred securities carried a variable rate of interest priced at the three-month LIBOR plus 230 basis points, payable quarterly and maturing on December 31, 2037. Proceeds from the securities were used to purchase junior subordinated debentures with the same financial terms as the securities issued by PNB Statutory Trust I. The Corporation redeemed the junior subordinated debentures and thereby cause redemption of the trust preferred securities in whole on December 31, 2012.
13. INCOME TAXES:
Income tax expense is summarized as follows:
(Dollar amounts in thousands) 2012 2011 2010Federal:
Currently payable 12,074$ 11,872$ 15,582$ Deferred (455) 311 (4,850)
11,619 12,183 10,732 State:
Currently payable 1,887 1,901 2,325 Deferred 312 313 (1,090)
2,199 2,214 1,235 TOTAL 13,818$ 14,397$ 11,967$
The reconciliation of income tax expense with the amount computed by applying the statutory federal income tax rate of 35% to income before income taxes is summarized as follows:
(Dollar amounts in thousands) 2012 2011 2010Federal income taxes computed at the statutory rate $16,320 $18,057 $14,004Add (deduct) tax effect of:
Tax exempt income (3,864) (3,875) (3,400) ESOP dividend deduction (258) (1,085) - State tax, net of federal benefit 1,444 1,439 803 Affordable housing credits (148) (86) - Other, net 324 (53) 560
TOTAL $13,818 $14,397 $11,967
The tax effects of temporary differences that give rise to significant portions of the deferred tax assets and liabilities at December 31, 2012 and 2011, are as follows:
(Dollar amounts in thousands) 2012 2011Deferred tax assets:
Other than temporary impairment 5,951$ 6,068$ Net unrealized losses on retirement plans 13,612 15,166 Loan losses provision 8,606 7,803 Deferred compensation 7,729 8,087 Compensated absences 888 759 Post-retirement benefits 2,040 2,016 Deferred loss on acquisition 136 187 Other 2,104 1,771
GROSS DEFERRED ASSETS 41,066 41,857
Deferred tax liabilities:Net unrealized gains on securities available-for-sale (8,954) (8,493) Depreciation (2,715) (1,830) Mortgage servicing rights (700) (763) Pensions (2,518) (3,587) Intangibles (541) - Other (1,381) (1,055)
GROSS DEFERRED LIABILITIES (16,809) (15,728) NET DEFERRED TAX ASSETS (LIABILITIES) 24,257$ 26,129$
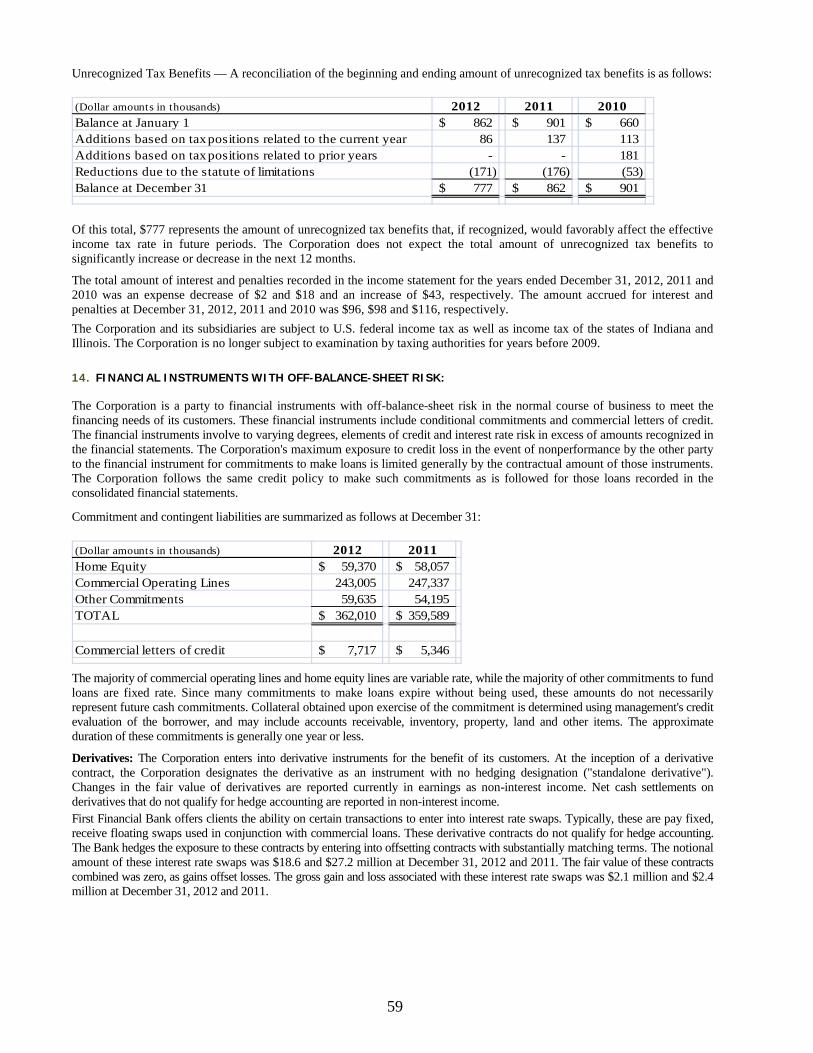
59
Unrecognized Tax Benefits — A reconciliation of the beginning and ending amount of unrecognized tax benefits is as follows:
(Dollar amounts in thousands) 2012 2011 2010Balance at January 1 862$ 901$ 660$ Additions based on tax positions related to the current year 86 137 113 Additions based on tax positions related to prior years - - 181 Reductions due to the statute of limitations (171) (176) (53) Balance at December 31 777$ 862$ 901$
Of this total, $777 represents the amount of unrecognized tax benefits that, if recognized, would favorably affect the effective income tax rate in future periods. The Corporation does not expect the total amount of unrecognized tax benefits to significantly increase or decrease in the next 12 months.
The total amount of interest and penalties recorded in the income statement for the years ended December 31, 2012, 2011 and 2010 was an expense decrease of $2 and $18 and an increase of $43, respectively. The amount accrued for interest and penalties at December 31, 2012, 2011 and 2010 was $96, $98 and $116, respectively. The Corporation and its subsidiaries are subject to U.S. federal income tax as well as income tax of the states of Indiana and Illinois. The Corporation is no longer subject to examination by taxing authorities for years before 2009.
14. FINANCIAL INSTRUMENTS WITH OFF-BALANCE-SHEET RISK:
The Corporation is a party to financial instruments with off-balance-sheet risk in the normal course of business to meet the financing needs of its customers. These financial instruments include conditional commitments and commercial letters of credit. The financial instruments involve to varying degrees, elements of credit and interest rate risk in excess of amounts recognized in the financial statements. The Corporation's maximum exposure to credit loss in the event of nonperformance by the other party to the financial instrument for commitments to make loans is limited generally by the contractual amount of those instruments. The Corporation follows the same credit policy to make such commitments as is followed for those loans recorded in the consolidated financial statements.
Commitment and contingent liabilities are summarized as follows at December 31:
(Dollar amounts in thousands) 2012 2011Home Equity 59,370$ 58,057$ Commercial Operating Lines 243,005 247,337 Other Commitments 59,635 54,195 TOTAL 362,010$ 359,589$
Commercial letters of credit 7,717$ 5,346$
The majority of commercial operating lines and home equity lines are variable rate, while the majority of other commitments to fund loans are fixed rate. Since many commitments to make loans expire without being used, these amounts do not necessarily represent future cash commitments. Collateral obtained upon exercise of the commitment is determined using management's credit evaluation of the borrower, and may include accounts receivable, inventory, property, land and other items. The approximate duration of these commitments is generally one year or less.
Derivatives: The Corporation enters into derivative instruments for the benefit of its customers. At the inception of a derivative contract, the Corporation designates the derivative as an instrument with no hedging designation ("standalone derivative"). Changes in the fair value of derivatives are reported currently in earnings as non-interest income. Net cash settlements on derivatives that do not qualify for hedge accounting are reported in non-interest income. First Financial Bank offers clients the ability on certain transactions to enter into interest rate swaps. Typically, these are pay fixed, receive floating swaps used in conjunction with commercial loans. These derivative contracts do not qualify for hedge accounting. The Bank hedges the exposure to these contracts by entering into offsetting contracts with substantially matching terms. The notional amount of these interest rate swaps was $18.6 and $27.2 million at December 31, 2012 and 2011. The fair value of these contracts combined was zero, as gains offset losses. The gross gain and loss associated with these interest rate swaps was $2.1 million and $2.4 million at December 31, 2012 and 2011.
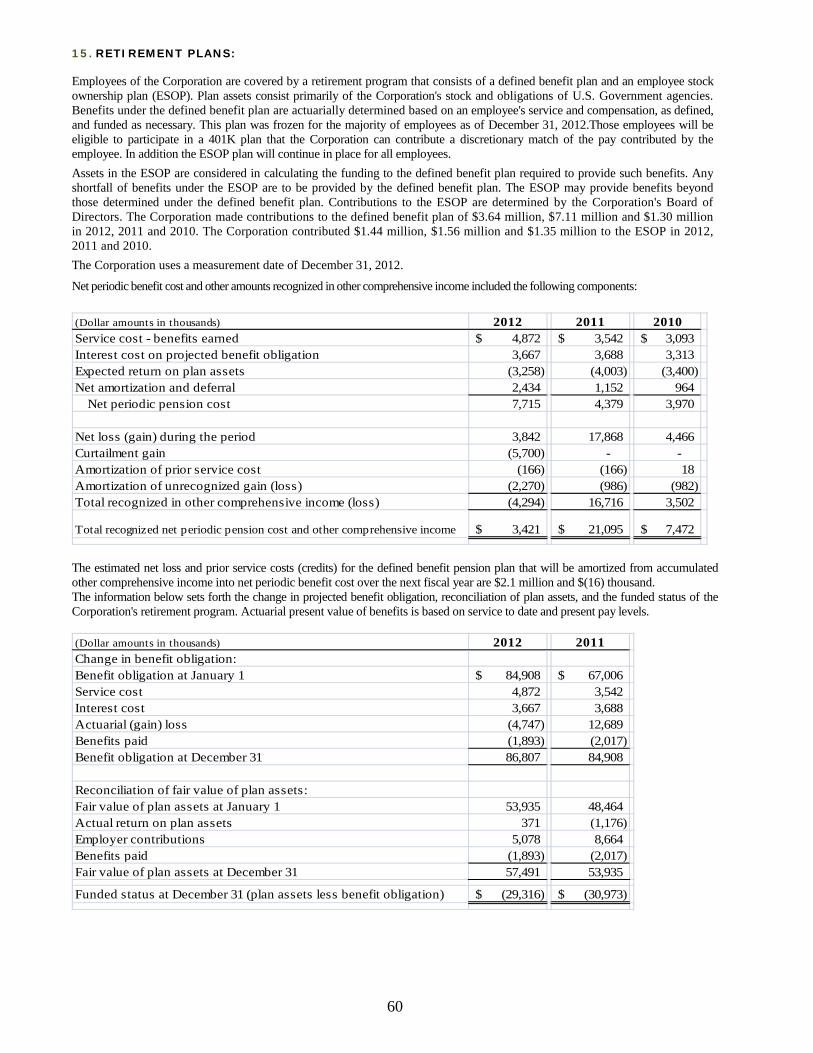
60
15. RETIREMENT PLANS:
Employees of the Corporation are covered by a retirement program that consists of a defined benefit plan and an employee stock ownership plan (ESOP). Plan assets consist primarily of the Corporation's stock and obligations of U.S. Government agencies. Benefits under the defined benefit plan are actuarially determined based on an employee's service and compensation, as defined, and funded as necessary. This plan was frozen for the majority of employees as of December 31, 2012.Those employees will be eligible to participate in a 401K plan that the Corporation can contribute a discretionary match of the pay contributed by the employee. In addition the ESOP plan will continue in place for all employees. Assets in the ESOP are considered in calculating the funding to the defined benefit plan required to provide such benefits. Any shortfall of benefits under the ESOP are to be provided by the defined benefit plan. The ESOP may provide benefits beyond those determined under the defined benefit plan. Contributions to the ESOP are determined by the Corporation's Board of Directors. The Corporation made contributions to the defined benefit plan of $3.64 million, $7.11 million and $1.30 million in 2012, 2011 and 2010. The Corporation contributed $1.44 million, $1.56 million and $1.35 million to the ESOP in 2012, 2011 and 2010. The Corporation uses a measurement date of December 31, 2012. Net periodic benefit cost and other amounts recognized in other comprehensive income included the following components:
(Dollar amounts in thousands) 2012 2011 2010Service cost - benefits earned 4,872$ 3,542$ 3,093$ Interest cost on projected benefit obligation 3,667 3,688 3,313Expected return on plan assets (3,258) (4,003) (3,400)Net amortization and deferral 2,434 1,152 964
Net periodic pension cost 7,715 4,379 3,970
Net loss (gain) during the period 3,842 17,868 4,466 Curtailment gain (5,700) - - Amortization of prior service cost (166) (166) 18 Amortization of unrecognized gain (loss) (2,270) (986) (982) Total recognized in other comprehensive income (loss) (4,294) 16,716 3,502
Total recognized net periodic pension cost and other comprehensive income 3,421$ 21,095$ 7,472$
The estimated net loss and prior service costs (credits) for the defined benefit pension plan that will be amortized from accumulated other comprehensive income into net periodic benefit cost over the next fiscal year are $2.1 million and $(16) thousand. The information below sets forth the change in projected benefit obligation, reconciliation of plan assets, and the funded status of the Corporation's retirement program. Actuarial present value of benefits is based on service to date and present pay levels.
(Dollar amounts in thousands) 2012 2011Change in benefit obligation: Benefit obligation at January 1 84,908$ 67,006$ Service cost 4,872 3,542 Interest cost 3,667 3,688 Actuarial (gain) loss (4,747) 12,689 Benefits paid (1,893) (2,017) Benefit obligation at December 31 86,807 84,908
Reconciliation of fair value of plan assets:Fair value of plan assets at January 1 53,935 48,464 Actual return on plan assets 371 (1,176) Employer contributions 5,078 8,664 Benefits paid (1,893) (2,017) Fair value of plan assets at December 31 57,491 53,935
Funded status at December 31 (plan assets less benefit obligation) (29,316)$ (30,973)$
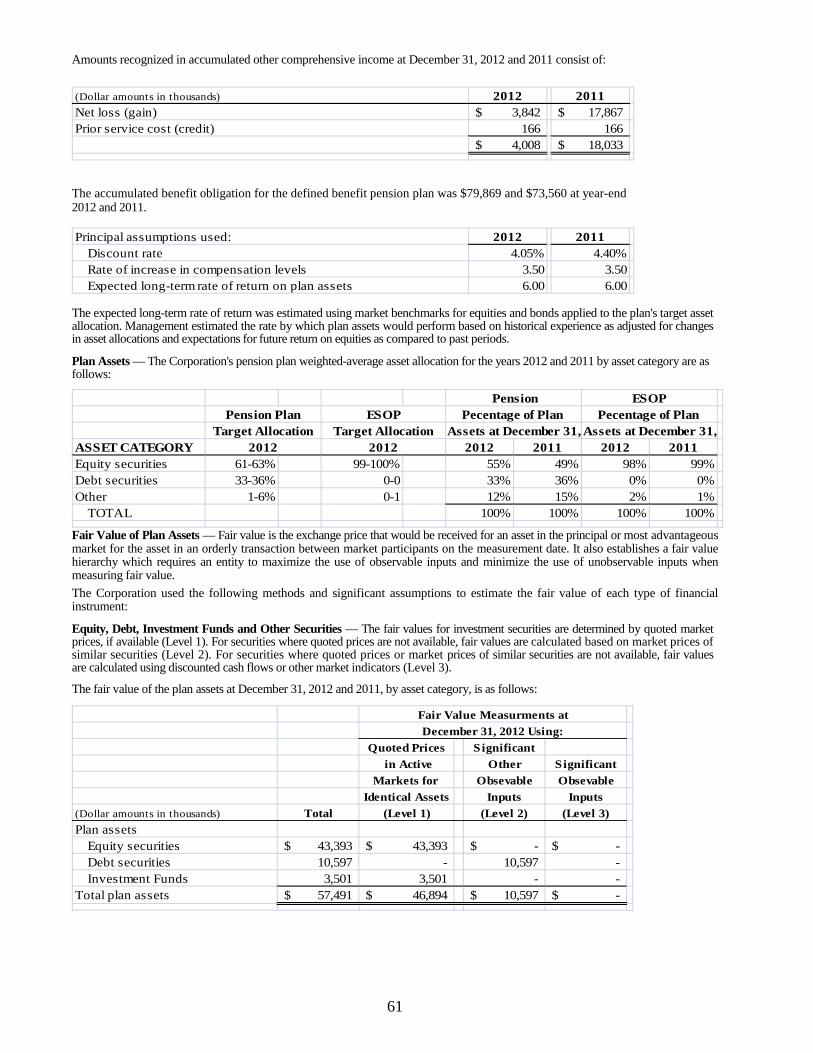
61
Amounts recognized in accumulated other comprehensive income at December 31, 2012 and 2011 consist of:
(Dollar amounts in thousands) 2012 2011Net loss (gain) 3,842$ 17,867$ Prior service cost (credit) 166 166
4,008$ 18,033$
The accumulated benefit obligation for the defined benefit pension plan was $79,869 and $73,560 at year-end 2012 and 2011.
Principal assumptions used: 2012 2011
Discount rate 4.05% 4.40%Rate of increase in compensation levels 3.50 3.50Expected long-term rate of return on plan assets 6.00 6.00
The expected long-term rate of return was estimated using market benchmarks for equities and bonds applied to the plan's target asset allocation. Management estimated the rate by which plan assets would perform based on historical experience as adjusted for changes in asset allocations and expectations for future return on equities as compared to past periods.
Plan Assets — The Corporation's pension plan weighted-average asset allocation for the years 2012 and 2011 by asset category are as follows:
ASSET CATEGORY 2012 2011 2012 2011Equity securities 61-63% 99-100% 55% 49% 98% 99%Debt securities 33-36% 0-0 33% 36% 0% 0%Other 1-6% 0-1 12% 15% 2% 1%
TOTAL 100% 100% 100% 100%
ESOPPecentage of Plan
Assets at December 31,Pecentage of Plan
Target AllocationESOP
Assets at December 31,Pension Plan
20122012Target Allocation
Pension
Fair Value of Plan Assets — Fair value is the exchange price that would be received for an asset in the principal or most advantageous market for the asset in an orderly transaction between market participants on the measurement date. It also establishes a fair value hierarchy which requires an entity to maximize the use of observable inputs and minimize the use of unobservable inputs when measuring fair value. The Corporation used the following methods and significant assumptions to estimate the fair value of each type of financial instrument:
Equity, Debt, Investment Funds and Other Securities — The fair values for investment securities are determined by quoted market prices, if available (Level 1). For securities where quoted prices are not available, fair values are calculated based on market prices of similar securities (Level 2). For securities where quoted prices or market prices of similar securities are not available, fair values are calculated using discounted cash flows or other market indicators (Level 3). The fair value of the plan assets at December 31, 2012 and 2011, by asset category, is as follows:
Quoted Prices Significant in Active Other Significant
Markets for Obsevable ObsevableIdentical Assets Inputs Inputs
(Dollar amounts in thousands) Total (Level 1) (Level 2) (Level 3)Plan assets
Equity securities 43,393$ 43,393$ -$ -$ Debt securities 10,597 - 10,597 - Investment Funds 3,501 3,501 - -
Total plan assets 57,491$ 46,894$ 10,597$ -$
Fair Value Measurments atDecember 31, 2012 Using:
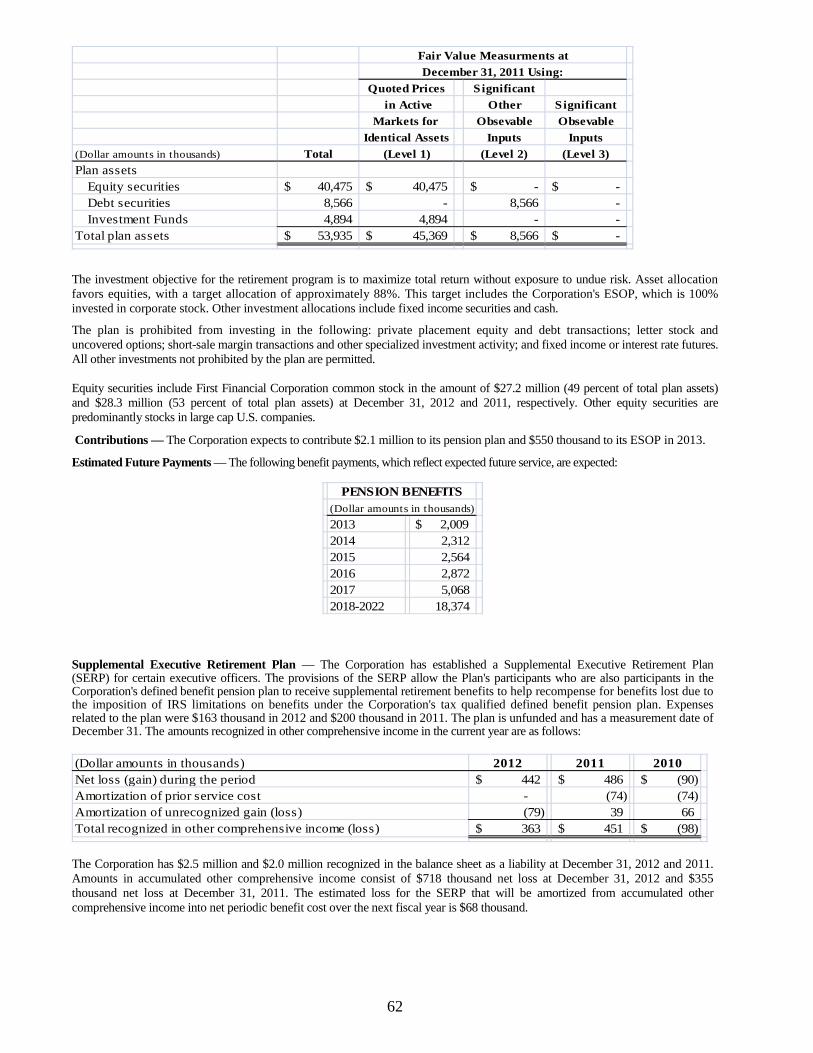
62
Quoted Prices Significant in Active Other Significant
Markets for Obsevable ObsevableIdentical Assets Inputs Inputs
(Dollar amounts in thousands) Total (Level 1) (Level 2) (Level 3)Plan assets
Equity securities 40,475$ 40,475$ -$ -$ Debt securities 8,566 - 8,566 - Investment Funds 4,894 4,894 - -
Total plan assets 53,935$ 45,369$ 8,566$ -$
Fair Value Measurments atDecember 31, 2011 Using:
The investment objective for the retirement program is to maximize total return without exposure to undue risk. Asset allocation favors equities, with a target allocation of approximately 88%. This target includes the Corporation's ESOP, which is 100% invested in corporate stock. Other investment allocations include fixed income securities and cash.
The plan is prohibited from investing in the following: private placement equity and debt transactions; letter stock and uncovered options; short-sale margin transactions and other specialized investment activity; and fixed income or interest rate futures. All other investments not prohibited by the plan are permitted.
Equity securities include First Financial Corporation common stock in the amount of $27.2 million (49 percent of total plan assets) and $28.3 million (53 percent of total plan assets) at December 31, 2012 and 2011, respectively. Other equity securities are predominantly stocks in large cap U.S. companies.
Contributions — The Corporation expects to contribute $2.1 million to its pension plan and $550 thousand to its ESOP in 2013.
Estimated Future Payments — The following benefit payments, which reflect expected future service, are expected:
2013 $ 2,009 2014 2,3122015 2,5642016 2,8722017 5,0682018-2022 18,374
(Dollar amounts in thousands)PENSION BENEFITS
Supplemental Executive Retirement Plan — The Corporation has established a Supplemental Executive Retirement Plan (SERP) for certain executive officers. The provisions of the SERP allow the Plan's participants who are also participants in the Corporation's defined benefit pension plan to receive supplemental retirement benefits to help recompense for benefits lost due to the imposition of IRS limitations on benefits under the Corporation's tax qualified defined benefit pension plan. Expenses related to the plan were $163 thousand in 2012 and $200 thousand in 2011. The plan is unfunded and has a measurement date of December 31. The amounts recognized in other comprehensive income in the current year are as follows:
(Dollar amounts in thousands) 2012 2011 2010Net loss (gain) during the period 442$ 486$ (90)$ Amortization of prior service cost - (74) (74) Amortization of unrecognized gain (loss) (79) 39 66 Total recognized in other comprehensive income (loss) 363$ 451$ (98)$
The Corporation has $2.5 million and $2.0 million recognized in the balance sheet as a liability at December 31, 2012 and 2011. Amounts in accumulated other comprehensive income consist of $718 thousand net loss at December 31, 2012 and $355 thousand net loss at December 31, 2011. The estimated loss for the SERP that will be amortized from accumulated other comprehensive income into net periodic benefit cost over the next fiscal year is $68 thousand.
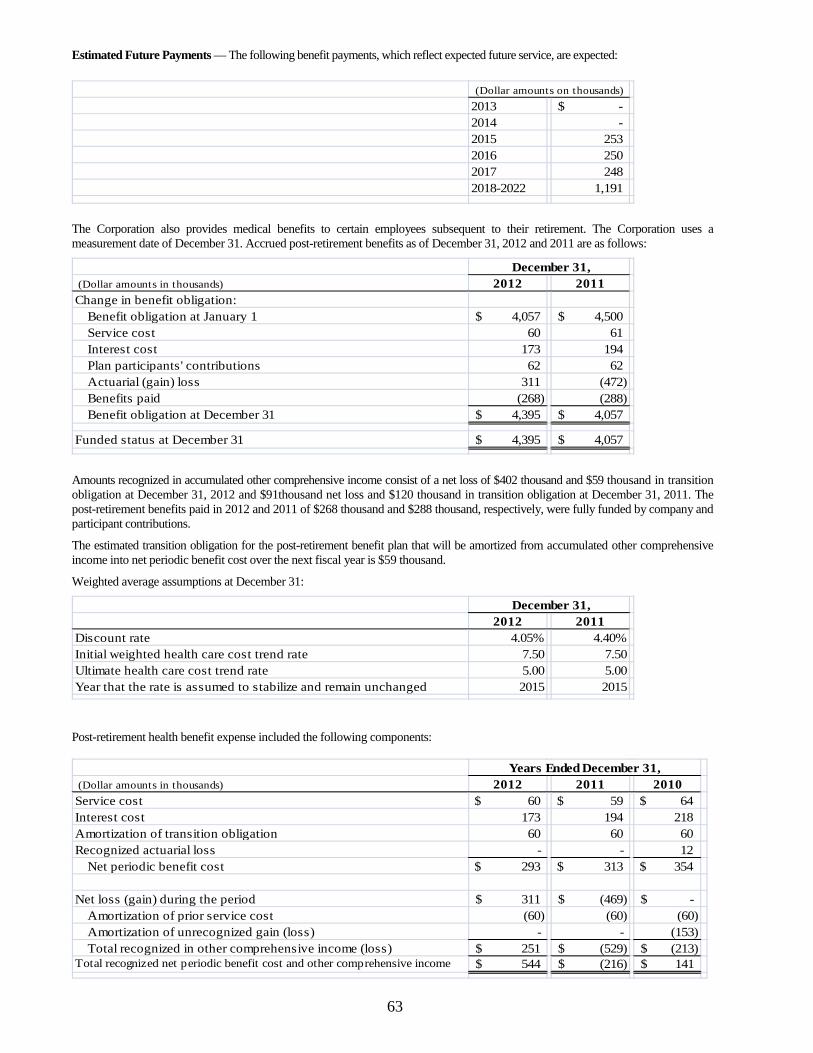
63
Estimated Future Payments — The following benefit payments, which reflect expected future service, are expected:
2013 -$ 2014 - 2015 253 2016 250 2017 248 2018-2022 1,191
(Dollar amounts on thousands)
The Corporation also provides medical benefits to certain employees subsequent to their retirement. The Corporation uses a measurement date of December 31. Accrued post-retirement benefits as of December 31, 2012 and 2011 are as follows:
(Dollar amounts in thousands) 2012 2011Change in benefit obligation:
Benefit obligation at January 1 4,057$ 4,500$ Service cost 60 61 Interest cost 173 194 Plan participants' contributions 62 62 Actuarial (gain) loss 311 (472) Benefits paid (268) (288) Benefit obligation at December 31 4,395$ 4,057$
Funded status at December 31 4,395$ 4,057$
December 31,
Amounts recognized in accumulated other comprehensive income consist of a net loss of $402 thousand and $59 thousand in transition obligation at December 31, 2012 and $91thousand net loss and $120 thousand in transition obligation at December 31, 2011. The post-retirement benefits paid in 2012 and 2011 of $268 thousand and $288 thousand, respectively, were fully funded by company and participant contributions.
The estimated transition obligation for the post-retirement benefit plan that will be amortized from accumulated other comprehensive income into net periodic benefit cost over the next fiscal year is $59 thousand.
Weighted average assumptions at December 31:
2012 2011Discount rate 4.05% 4.40%Initial weighted health care cost trend rate 7.50 7.50Ultimate health care cost trend rate 5.00 5.00Year that the rate is assumed to stabilize and remain unchanged 2015 2015
December 31,
Post-retirement health benefit expense included the following components:
(Dollar amounts in thousands) 2012 2011 2010Service cost $ 60 $ 59 $ 64 Interest cost 173 194 218 Amortization of transition obligation 60 60 60 Recognized actuarial loss - - 12
Net periodic benefit cost $ 293 $ 313 $ 354
Net loss (gain) during the period 311$ (469)$ -$ Amortization of prior service cost (60) (60) (60) Amortization of unrecognized gain (loss) - - (153) Total recognized in other comprehensive income (loss) 251$ (529)$ (213)$
Total recognized net periodic benefit cost and other comprehensive income 544$ (216)$ 141$
Years Ended December 31,
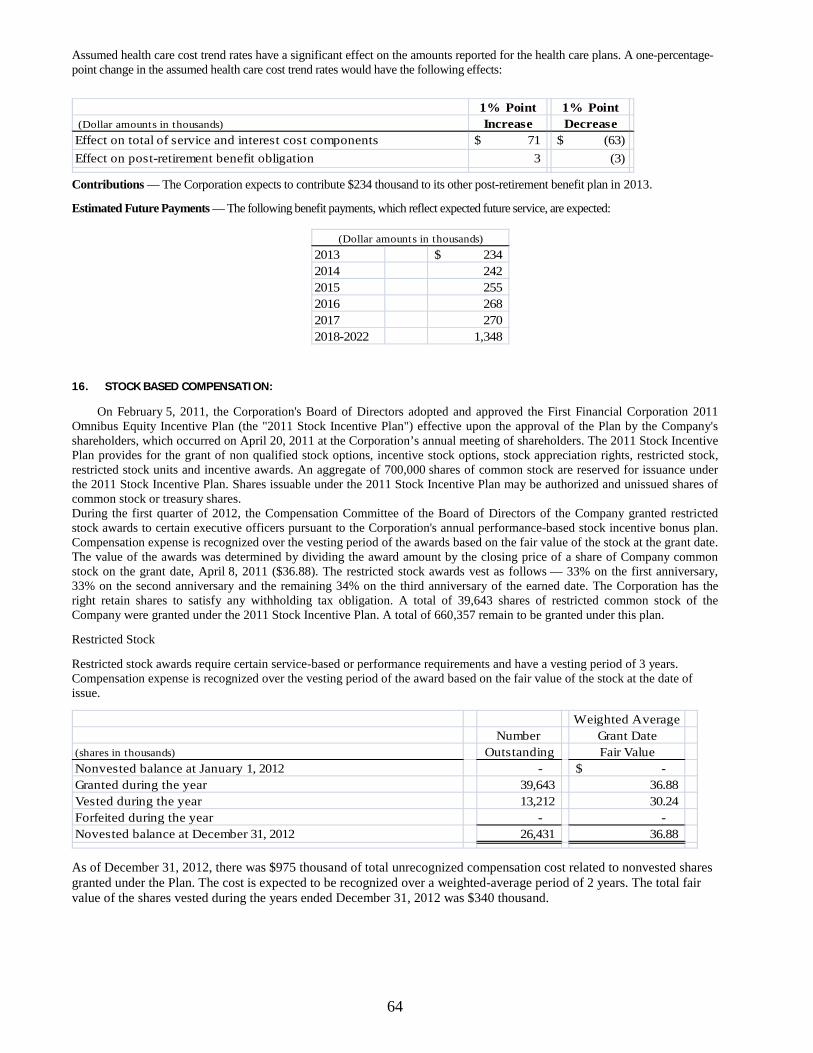
64
Assumed health care cost trend rates have a significant effect on the amounts reported for the health care plans. A one-percentage-point change in the assumed health care cost trend rates would have the following effects:
1% Point 1% Point (Dollar amounts in thousands) Increase DecreaseEffect on total of service and interest cost components $ 71 $ (63)Effect on post-retirement benefit obligation 3 (3)
Contributions — The Corporation expects to contribute $234 thousand to its other post-retirement benefit plan in 2013.
Estimated Future Payments — The following benefit payments, which reflect expected future service, are expected:
2013 234$ 2014 242 2015 255 2016 268 2017 270 2018-2022 1,348
(Dollar amounts in thousands)
16. STOCK BASED COMPENSATION: On February 5, 2011, the Corporation's Board of Directors adopted and approved the First Financial Corporation 2011 Omnibus Equity Incentive Plan (the "2011 Stock Incentive Plan") effective upon the approval of the Plan by the Company's shareholders, which occurred on April 20, 2011 at the Corporation’s annual meeting of shareholders. The 2011 Stock Incentive Plan provides for the grant of non qualified stock options, incentive stock options, stock appreciation rights, restricted stock, restricted stock units and incentive awards. An aggregate of 700,000 shares of common stock are reserved for issuance under the 2011 Stock Incentive Plan. Shares issuable under the 2011 Stock Incentive Plan may be authorized and unissued shares of common stock or treasury shares. During the first quarter of 2012, the Compensation Committee of the Board of Directors of the Company granted restricted stock awards to certain executive officers pursuant to the Corporation's annual performance-based stock incentive bonus plan. Compensation expense is recognized over the vesting period of the awards based on the fair value of the stock at the grant date. The value of the awards was determined by dividing the award amount by the closing price of a share of Company common stock on the grant date, April 8, 2011 ($36.88). The restricted stock awards vest as follows — 33% on the first anniversary, 33% on the second anniversary and the remaining 34% on the third anniversary of the earned date. The Corporation has the right retain shares to satisfy any withholding tax obligation. A total of 39,643 shares of restricted common stock of the Company were granted under the 2011 Stock Incentive Plan. A total of 660,357 remain to be granted under this plan.
Restricted Stock
Restricted stock awards require certain service-based or performance requirements and have a vesting period of 3 years. Compensation expense is recognized over the vesting period of the award based on the fair value of the stock at the date of issue.
Weighted AverageNumber Grant Date
(shares in thousands) Outstanding Fair ValueNonvested balance at January 1, 2012 - -$ Granted during the year 39,643 36.88 Vested during the year 13,212 30.24 Forfeited during the year - - Novested balance at December 31, 2012 26,431 36.88
As of December 31, 2012, there was $975 thousand of total unrecognized compensation cost related to nonvested shares granted under the Plan. The cost is expected to be recognized over a weighted-average period of 2 years. The total fair value of the shares vested during the years ended December 31, 2012 was $340 thousand.
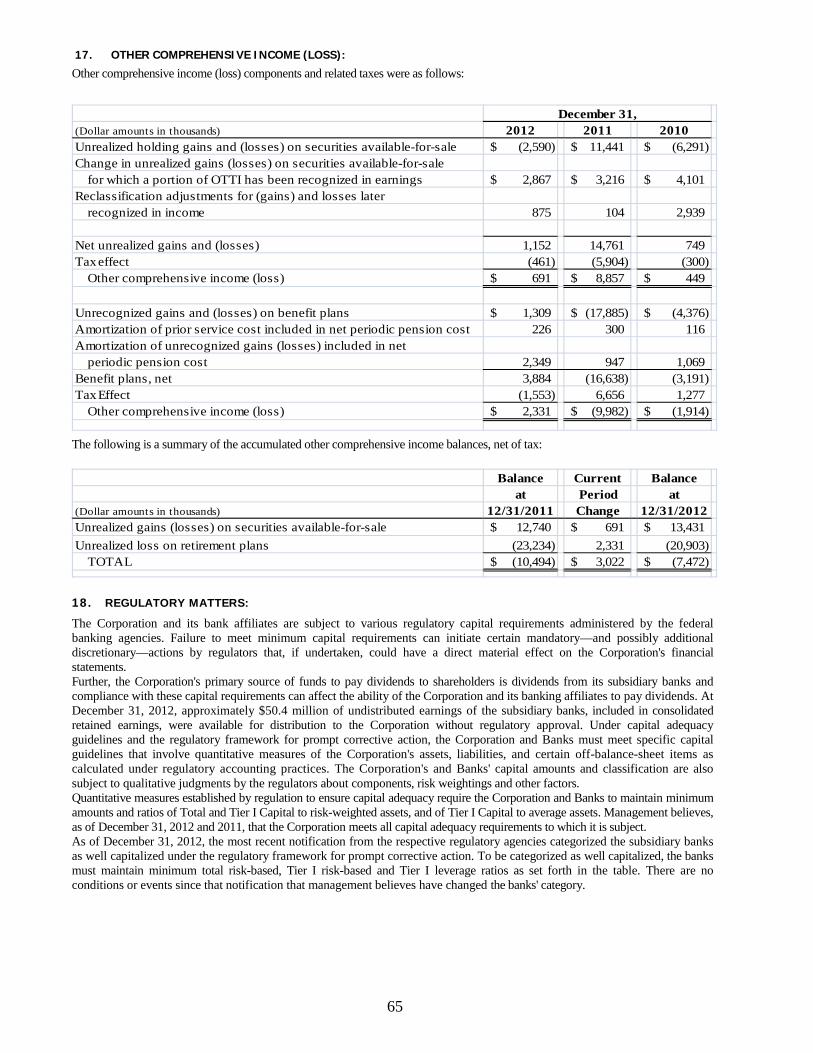
65
17. OTHER COMPREHENSIVE INCOME (LOSS):
Other comprehensive income (loss) components and related taxes were as follows:
(Dollar amounts in thousands) 2012 2011 2010Unrealized holding gains and (losses) on securities available-for-sale (2,590)$ 11,441$ (6,291)$ Change in unrealized gains (losses) on securities available-for-sale
for which a portion of OTTI has been recognized in earnings 2,867$ 3,216$ 4,101$ Reclassification adjustments for (gains) and losses later
recognized in income 875 104 2,939
Net unrealized gains and (losses) 1,152 14,761 749 Tax effect (461) (5,904) (300)
Other comprehensive income (loss) 691$ 8,857$ 449$
Unrecognized gains and (losses) on benefit plans 1,309$ (17,885)$ (4,376)$ Amortization of prior service cost included in net periodic pension cost 226 300 116 Amortization of unrecognized gains (losses) included in net
periodic pension cost 2,349 947 1,069 Benefit plans, net 3,884 (16,638) (3,191) Tax Effect (1,553) 6,656 1,277
Other comprehensive income (loss) 2,331$ (9,982)$ (1,914)$
December 31,
The following is a summary of the accumulated other comprehensive income balances, net of tax:
Balance Current Balanceat Period at
(Dollar amounts in thousands) 12/31/2011 Change 12/31/2012Unrealized gains (losses) on securities available-for-sale 12,740$ 691$ 13,431$ Unrealized loss on retirement plans (23,234) 2,331 (20,903)
TOTAL (10,494)$ 3,022$ (7,472)$
18. REGULATORY MATTERS: The Corporation and its bank affiliates are subject to various regulatory capital requirements administered by the federal banking agencies. Failure to meet minimum capital requirements can initiate certain mandatory—and possibly additional discretionary—actions by regulators that, if undertaken, could have a direct material effect on the Corporation's financial statements. Further, the Corporation's primary source of funds to pay dividends to shareholders is dividends from its subsidiary banks and compliance with these capital requirements can affect the ability of the Corporation and its banking affiliates to pay dividends. At December 31, 2012, approximately $50.4 million of undistributed earnings of the subsidiary banks, included in consolidated retained earnings, were available for distribution to the Corporation without regulatory approval. Under capital adequacy guidelines and the regulatory framework for prompt corrective action, the Corporation and Banks must meet specific capital guidelines that involve quantitative measures of the Corporation's assets, liabilities, and certain off-balance-sheet items as calculated under regulatory accounting practices. The Corporation's and Banks' capital amounts and classification are also subject to qualitative judgments by the regulators about components, risk weightings and other factors. Quantitative measures established by regulation to ensure capital adequacy require the Corporation and Banks to maintain minimum amounts and ratios of Total and Tier I Capital to risk-weighted assets, and of Tier I Capital to average assets. Management believes, as of December 31, 2012 and 2011, that the Corporation meets all capital adequacy requirements to which it is subject. As of December 31, 2012, the most recent notification from the respective regulatory agencies categorized the subsidiary banks as well capitalized under the regulatory framework for prompt corrective action. To be categorized as well capitalized, the banks must maintain minimum total risk-based, Tier I risk-based and Tier I leverage ratios as set forth in the table. There are no conditions or events since that notification that management believes have changed the banks' category.
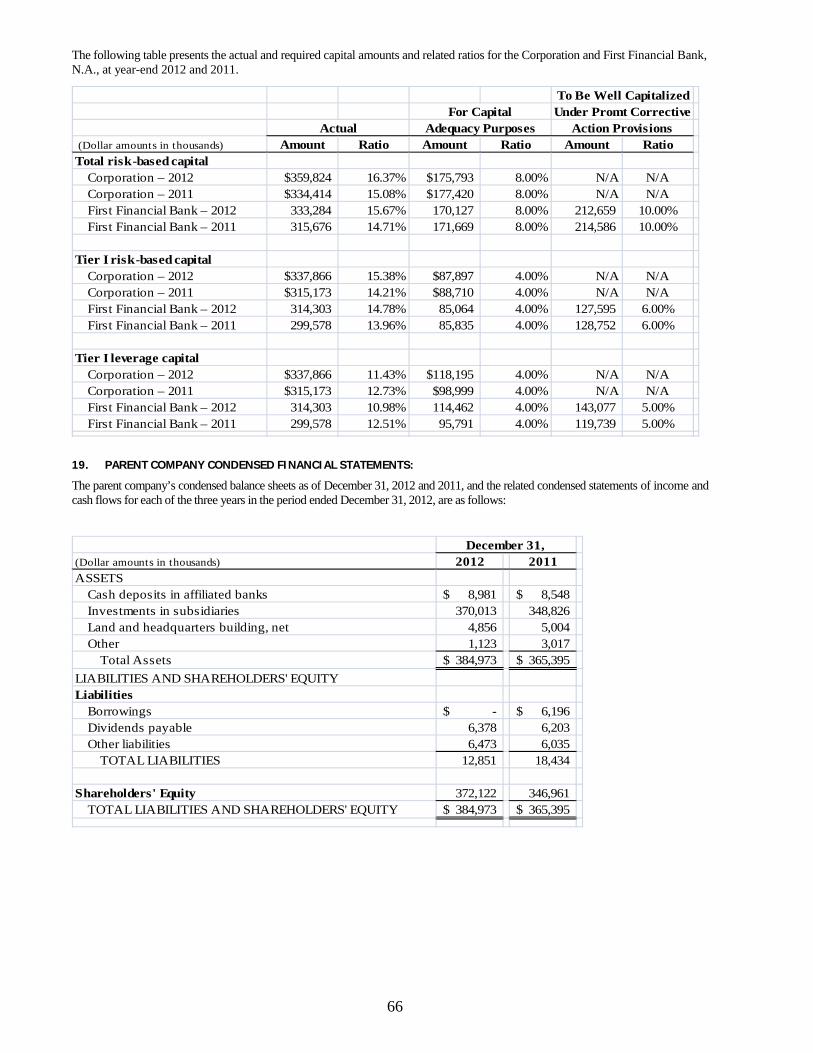
66
The following table presents the actual and required capital amounts and related ratios for the Corporation and First Financial Bank, N.A., at year-end 2012 and 2011.
(Dollar amounts in thousands) Amount Ratio Amount Ratio Amount RatioTotal risk-based capital
Corporation – 2012 $359,824 16.37% $175,793 8.00% N/A N/ACorporation – 2011 $334,414 15.08% $177,420 8.00% N/A N/AFirst Financial Bank – 2012 333,284 15.67% 170,127 8.00% 212,659 10.00%First Financial Bank – 2011 315,676 14.71% 171,669 8.00% 214,586 10.00%
Tier I risk-based capitalCorporation – 2012 $337,866 15.38% $87,897 4.00% N/A N/ACorporation – 2011 $315,173 14.21% $88,710 4.00% N/A N/AFirst Financial Bank – 2012 314,303 14.78% 85,064 4.00% 127,595 6.00%First Financial Bank – 2011 299,578 13.96% 85,835 4.00% 128,752 6.00%
Tier I leverage capitalCorporation – 2012 $337,866 11.43% $118,195 4.00% N/A N/ACorporation – 2011 $315,173 12.73% $98,999 4.00% N/A N/AFirst Financial Bank – 2012 314,303 10.98% 114,462 4.00% 143,077 5.00%First Financial Bank – 2011 299,578 12.51% 95,791 4.00% 119,739 5.00%
Actual Action ProvisionsUnder Promt CorrectiveTo Be Well Capitalized
Adequacy PurposesFor Capital
19. PARENT COMPANY CONDENSED FINANCIAL STATEMENTS:
The parent company’s condensed balance sheets as of December 31, 2012 and 2011, and the related condensed statements of income and cash flows for each of the three years in the period ended December 31, 2012, are as follows:
December 31, (Dollar amounts in thousands) 2012 2011ASSETS
Cash deposits in affiliated banks 8,981$ 8,548$ Investments in subsidiaries 370,013 348,826 Land and headquarters building, net 4,856 5,004 Other 1,123 3,017
Total Assets 384,973$ 365,395$ LIABILITIES AND SHAREHOLDERS' EQUITYLiabilities
Borrowings -$ 6,196$ Dividends payable 6,378 6,203 Other liabilities 6,473 6,035
TOTAL LIABILITIES 12,851 18,434
Shareholders' Equity 372,122 346,961 TOTAL LIABILITIES AND SHAREHOLDERS' EQUITY 384,973$ 365,395$
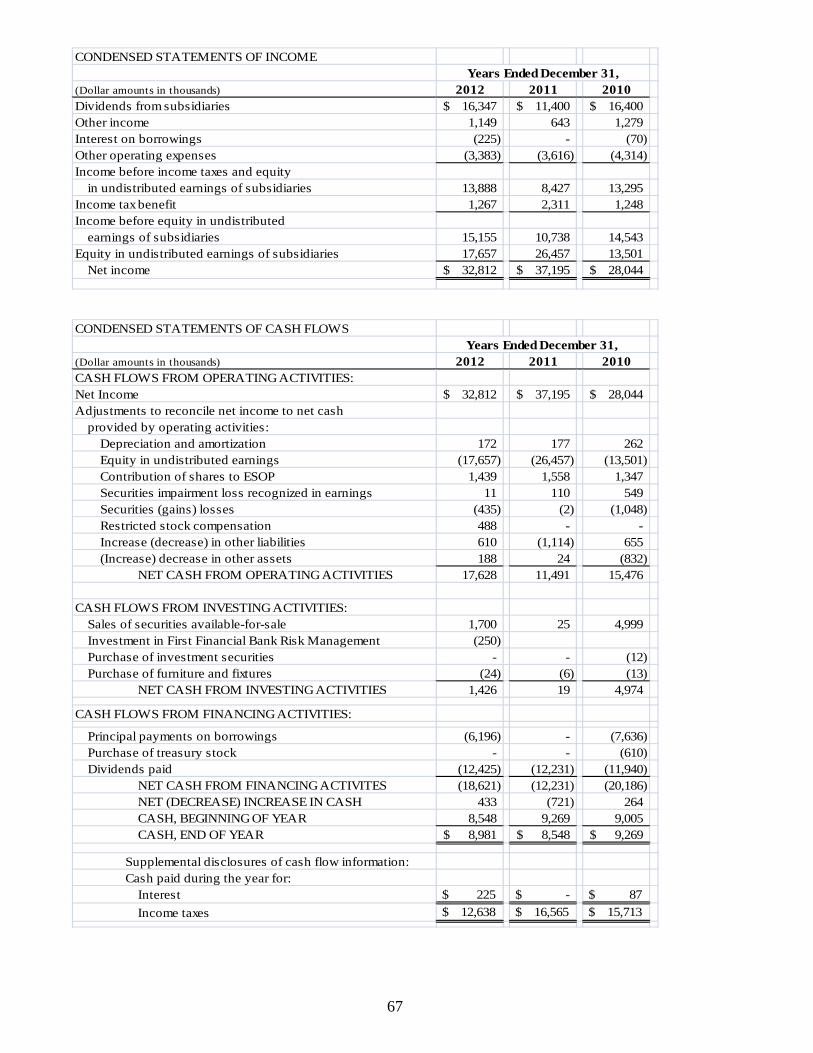
67
CONDENSED STATEMENTS OF INCOMEYears Ended December 31,
(Dollar amounts in thousands) 2012 2011 2010Dividends from subsidiaries 16,347$ 11,400$ 16,400$ Other income 1,149 643 1,279 Interest on borrowings (225) - (70) Other operating expenses (3,383) (3,616) (4,314) Income before income taxes and equity
in undistributed earnings of subsidiaries 13,888 8,427 13,295 Income tax benefit 1,267 2,311 1,248 Income before equity in undistributed
earnings of subsidiaries 15,155 10,738 14,543 Equity in undistributed earnings of subsidiaries 17,657 26,457 13,501
Net income 32,812$ 37,195$ 28,044$
CONDENSED STATEMENTS OF CASH FLOWSYears Ended December 31,
(Dollar amounts in thousands) 2012 2011 2010CASH FLOWS FROM OPERATING ACTIVITIES:Net Income 32,812$ 37,195$ 28,044$ Adjustments to reconcile net income to net cash
provided by operating activities:Depreciation and amortization 172 177 262 Equity in undistributed earnings (17,657) (26,457) (13,501) Contribution of shares to ESOP 1,439 1,558 1,347 Securities impairment loss recognized in earnings 11 110 549 Securities (gains) losses (435) (2) (1,048) Restricted stock compensation 488 - - Increase (decrease) in other liabilities 610 (1,114) 655 (Increase) decrease in other assets 188 24 (832)
NET CASH FROM OPERATING ACTIVITIES 17,628 11,491 15,476
CASH FLOWS FROM INVESTING ACTIVITIES: Sales of securities available-for-sale 1,700 25 4,999 Investment in First Financial Bank Risk Management (250)
Purchase of investment securities - - (12) Purchase of furniture and fixtures (24) (6) (13)
NET CASH FROM INVESTING ACTIVITIES 1,426 19 4,974
CASH FLOWS FROM FINANCING ACTIVITIES:
Principal payments on borrowings (6,196) - (7,636) Purchase of treasury stock - - (610) Dividends paid (12,425) (12,231) (11,940)
NET CASH FROM FINANCING ACTIVITES (18,621) (12,231) (20,186) NET (DECREASE) INCREASE IN CASH 433 (721) 264 CASH, BEGINNING OF YEAR 8,548 9,269 9,005 CASH, END OF YEAR 8,981$ 8,548$ 9,269$
Supplemental disclosures of cash flow information:Cash paid during the year for:
Interest $ 225 $ - $ 87 Income taxes $ 12,638 $ 16,565 $ 15,713
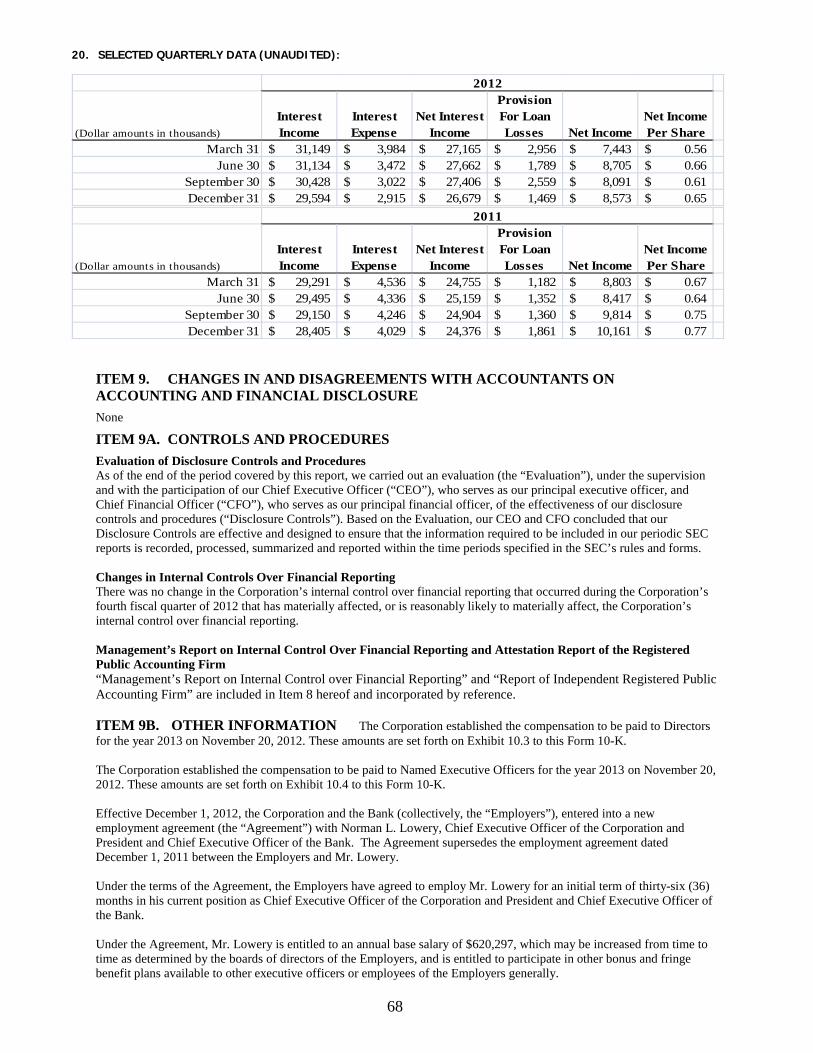
68
20. SELECTED QUARTERLY DATA (UNAUDITED):
(Dollar amounts in thousands) Interest Income
Interest Expense
Net Interest Income
Provision For Loan Losses Net Income
Net Income Per Share
March 31 31,149$ 3,984$ 27,165$ 2,956$ 7,443$ 0.56$ June 30 31,134$ 3,472$ 27,662$ 1,789$ 8,705$ 0.66$
September 30 30,428$ 3,022$ 27,406$ 2,559$ 8,091$ 0.61$ December 31 29,594$ 2,915$ 26,679$ 1,469$ 8,573$ 0.65$
2012
(Dollar amounts in thousands) Interest Income
Interest Expense
Net Interest Income
Provision For Loan Losses Net Income
Net Income Per Share
March 31 29,291$ 4,536$ 24,755$ 1,182$ 8,803$ 0.67$ June 30 29,495$ 4,336$ 25,159$ 1,352$ 8,417$ 0.64$
September 30 29,150$ 4,246$ 24,904$ 1,360$ 9,814$ 0.75$ December 31 28,405$ 4,029$ 24,376$ 1,861$ 10,161$ 0.77$
2011
ITEM 9. CHANGES IN AND DISAGREEMENTS WITH ACCOUNTANTS ON ACCOUNTING AND FINANCIAL DISCLOSURE
None
ITEM 9A. CONTROLS AND PROCEDURES
Evaluation of Disclosure Controls and Procedures As of the end of the period covered by this report, we carried out an evaluation (the “Evaluation”), under the supervision and with the participation of our Chief Executive Officer (“CEO”), who serves as our principal executive officer, and Chief Financial Officer (“CFO”), who serves as our principal financial officer, of the effectiveness of our disclosure controls and procedures (“Disclosure Controls”). Based on the Evaluation, our CEO and CFO concluded that our Disclosure Controls are effective and designed to ensure that the information required to be included in our periodic SEC reports is recorded, processed, summarized and reported within the time periods specified in the SEC’s rules and forms. Changes in Internal Controls Over Financial Reporting There was no change in the Corporation’s internal control over financial reporting that occurred during the Corporation’s fourth fiscal quarter of 2012 that has materially affected, or is reasonably likely to materially affect, the Corporation’s internal control over financial reporting. Management’s Report on Internal Control Over Financial Reporting and Attestation Report of the Registered Public Accounting Firm “Management’s Report on Internal Control over Financial Reporting” and “Report of Independent Registered Public Accounting Firm” are included in Item 8 hereof and incorporated by reference. ITEM 9B. OTHER INFORMATION The Corporation established the compensation to be paid to Directors for the year 2013 on November 20, 2012. These amounts are set forth on Exhibit 10.3 to this Form 10-K. The Corporation established the compensation to be paid to Named Executive Officers for the year 2013 on November 20, 2012. These amounts are set forth on Exhibit 10.4 to this Form 10-K.
Effective December 1, 2012, the Corporation and the Bank (collectively, the “Employers”), entered into a new employment agreement (the “Agreement”) with Norman L. Lowery, Chief Executive Officer of the Corporation and President and Chief Executive Officer of the Bank. The Agreement supersedes the employment agreement dated December 1, 2011 between the Employers and Mr. Lowery. Under the terms of the Agreement, the Employers have agreed to employ Mr. Lowery for an initial term of thirty-six (36) months in his current position as Chief Executive Officer of the Corporation and President and Chief Executive Officer of the Bank.
Under the Agreement, Mr. Lowery is entitled to an annual base salary of $620,297, which may be increased from time to time as determined by the boards of directors of the Employers, and is entitled to participate in other bonus and fringe benefit plans available to other executive officers or employees of the Employers generally.
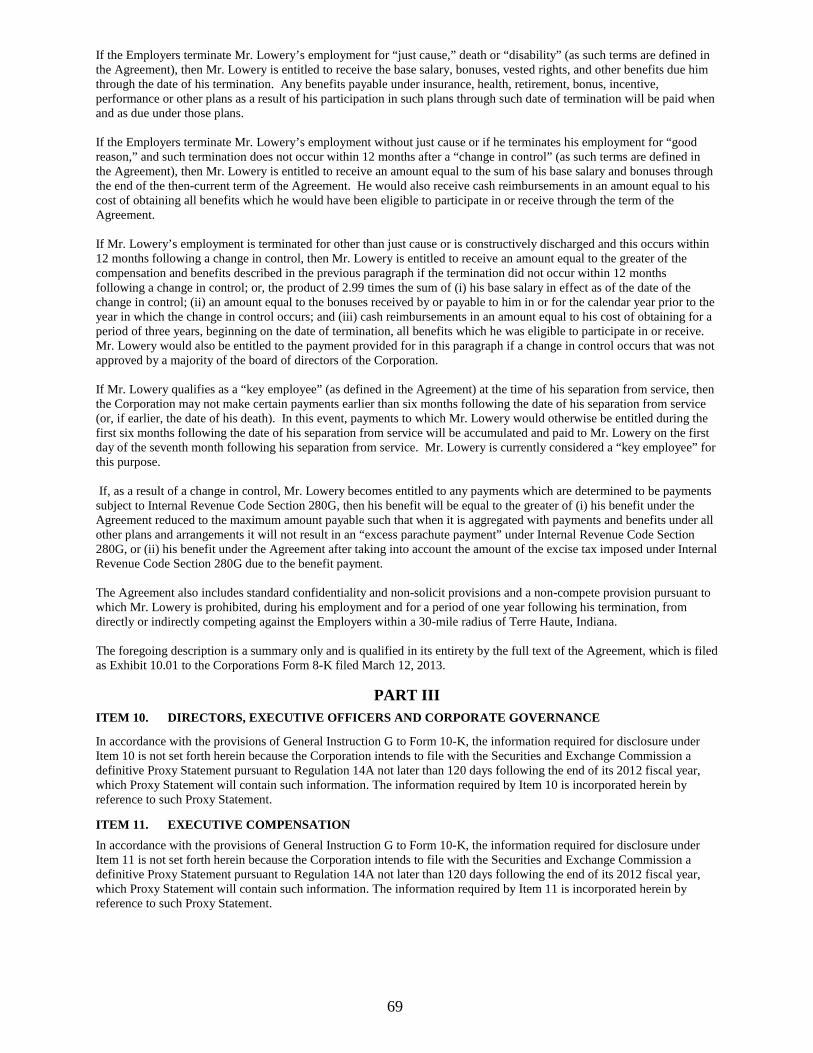
69
If the Employers terminate Mr. Lowery’s employment for “just cause,” death or “disability” (as such terms are defined in the Agreement), then Mr. Lowery is entitled to receive the base salary, bonuses, vested rights, and other benefits due him through the date of his termination. Any benefits payable under insurance, health, retirement, bonus, incentive, performance or other plans as a result of his participation in such plans through such date of termination will be paid when and as due under those plans.
If the Employers terminate Mr. Lowery’s employment without just cause or if he terminates his employment for “good reason,” and such termination does not occur within 12 months after a “change in control” (as such terms are defined in the Agreement), then Mr. Lowery is entitled to receive an amount equal to the sum of his base salary and bonuses through the end of the then-current term of the Agreement. He would also receive cash reimbursements in an amount equal to his cost of obtaining all benefits which he would have been eligible to participate in or receive through the term of the Agreement.
If Mr. Lowery’s employment is terminated for other than just cause or is constructively discharged and this occurs within 12 months following a change in control, then Mr. Lowery is entitled to receive an amount equal to the greater of the compensation and benefits described in the previous paragraph if the termination did not occur within 12 months following a change in control; or, the product of 2.99 times the sum of (i) his base salary in effect as of the date of the change in control; (ii) an amount equal to the bonuses received by or payable to him in or for the calendar year prior to the year in which the change in control occurs; and (iii) cash reimbursements in an amount equal to his cost of obtaining for a period of three years, beginning on the date of termination, all benefits which he was eligible to participate in or receive. Mr. Lowery would also be entitled to the payment provided for in this paragraph if a change in control occurs that was not approved by a majority of the board of directors of the Corporation.
If Mr. Lowery qualifies as a “key employee” (as defined in the Agreement) at the time of his separation from service, then the Corporation may not make certain payments earlier than six months following the date of his separation from service (or, if earlier, the date of his death). In this event, payments to which Mr. Lowery would otherwise be entitled during the first six months following the date of his separation from service will be accumulated and paid to Mr. Lowery on the first day of the seventh month following his separation from service. Mr. Lowery is currently considered a “key employee” for this purpose.
If, as a result of a change in control, Mr. Lowery becomes entitled to any payments which are determined to be payments subject to Internal Revenue Code Section 280G, then his benefit will be equal to the greater of (i) his benefit under the Agreement reduced to the maximum amount payable such that when it is aggregated with payments and benefits under all other plans and arrangements it will not result in an “excess parachute payment” under Internal Revenue Code Section 280G, or (ii) his benefit under the Agreement after taking into account the amount of the excise tax imposed under Internal Revenue Code Section 280G due to the benefit payment.
The Agreement also includes standard confidentiality and non-solicit provisions and a non-compete provision pursuant to which Mr. Lowery is prohibited, during his employment and for a period of one year following his termination, from directly or indirectly competing against the Employers within a 30-mile radius of Terre Haute, Indiana. The foregoing description is a summary only and is qualified in its entirety by the full text of the Agreement, which is filed as Exhibit 10.01 to the Corporations Form 8-K filed March 12, 2013.
PART III
ITEM 10. DIRECTORS, EXECUTIVE OFFICERS AND CORPORATE GOVERNANCE
In accordance with the provisions of General Instruction G to Form 10-K, the information required for disclosure under Item 10 is not set forth herein because the Corporation intends to file with the Securities and Exchange Commission a definitive Proxy Statement pursuant to Regulation 14A not later than 120 days following the end of its 2012 fiscal year, which Proxy Statement will contain such information. The information required by Item 10 is incorporated herein by reference to such Proxy Statement. ITEM 11. EXECUTIVE COMPENSATION
In accordance with the provisions of General Instruction G to Form 10-K, the information required for disclosure under Item 11 is not set forth herein because the Corporation intends to file with the Securities and Exchange Commission a definitive Proxy Statement pursuant to Regulation 14A not later than 120 days following the end of its 2012 fiscal year, which Proxy Statement will contain such information. The information required by Item 11 is incorporated herein by reference to such Proxy Statement.
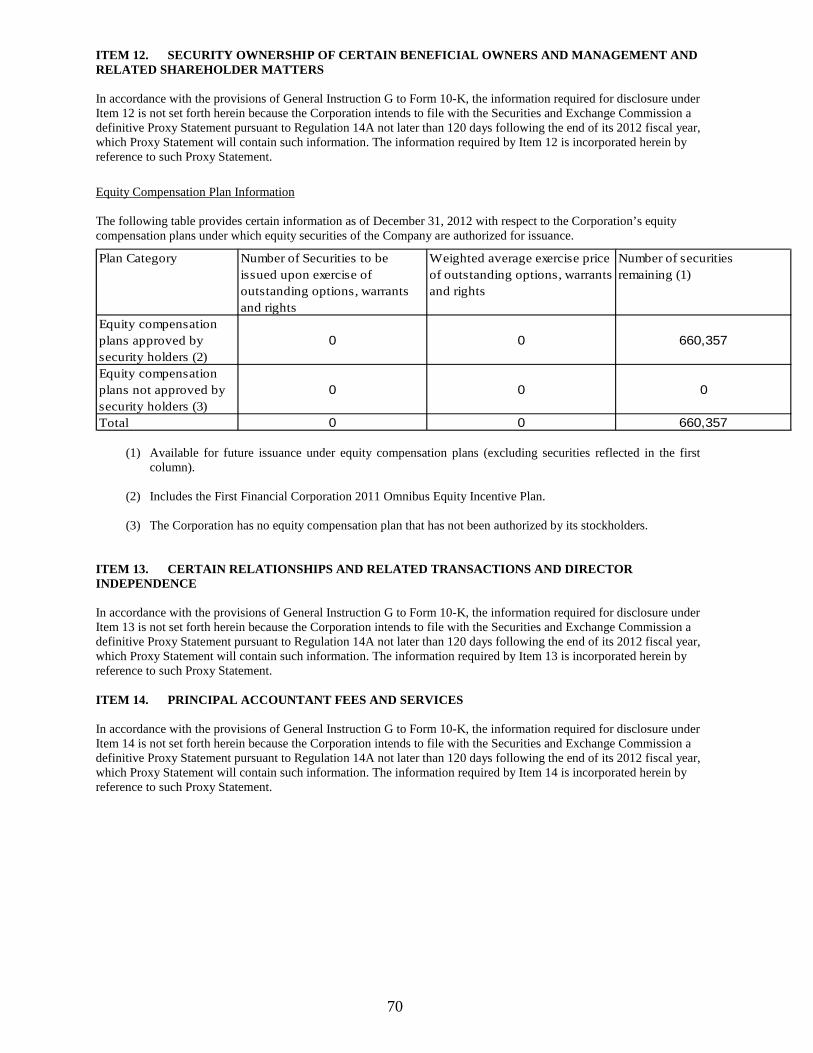
70
ITEM 12. SECURITY OWNERSHIP OF CERTAIN BENEFICIAL OWNERS AND MANAGEMENT AND RELATED SHAREHOLDER MATTERS In accordance with the provisions of General Instruction G to Form 10-K, the information required for disclosure under Item 12 is not set forth herein because the Corporation intends to file with the Securities and Exchange Commission a definitive Proxy Statement pursuant to Regulation 14A not later than 120 days following the end of its 2012 fiscal year, which Proxy Statement will contain such information. The information required by Item 12 is incorporated herein by reference to such Proxy Statement.
Equity Compensation Plan Information The following table provides certain information as of December 31, 2012 with respect to the Corporation’s equity compensation plans under which equity securities of the Company are authorized for issuance.
Plan Category Number of Securities to be issued upon exercise of outstanding options, warrants and rights
Weighted average exercise price of outstanding options, warrants and rights
Number of securities remaining (1)
Equity compensation plans approved by security holders (2)
0 0 660,357
Equity compensation plans not approved by security holders (3)
0 0 0
Total 0 0 660,357
(1) Available for future issuance under equity compensation plans (excluding securities reflected in the first column).
(2) Includes the First Financial Corporation 2011 Omnibus Equity Incentive Plan.
(3) The Corporation has no equity compensation plan that has not been authorized by its stockholders.
ITEM 13. CERTAIN RELATIONSHIPS AND RELATED TRANSACTIONS AND DIRECTOR INDEPENDENCE In accordance with the provisions of General Instruction G to Form 10-K, the information required for disclosure under Item 13 is not set forth herein because the Corporation intends to file with the Securities and Exchange Commission a definitive Proxy Statement pursuant to Regulation 14A not later than 120 days following the end of its 2012 fiscal year, which Proxy Statement will contain such information. The information required by Item 13 is incorporated herein by reference to such Proxy Statement. ITEM 14. PRINCIPAL ACCOUNTANT FEES AND SERVICES In accordance with the provisions of General Instruction G to Form 10-K, the information required for disclosure under Item 14 is not set forth herein because the Corporation intends to file with the Securities and Exchange Commission a definitive Proxy Statement pursuant to Regulation 14A not later than 120 days following the end of its 2012 fiscal year, which Proxy Statement will contain such information. The information required by Item 14 is incorporated herein by reference to such Proxy Statement.
71
PART IV ITEM 15. EXHIBITS, FINANCIAL STATEMENT SCHEDULES
(a) (1) The following consolidated financial statements of the Registrant and its subsidiaries are filed as part of this document under “Item 8. Financial Statements and Supplementary Data.”
Consolidated Balance Sheets—-December 31, 2012 and 2011
Consolidated Statements of Income and Comprehensive Income—Years ended December 31, 2012, 2011, and 2010
Consolidated Statements of Changes in Shareholders’ Equity—Years ended December 31, 2012, 2011, and 2010
Consolidated Statements of Cash Flows—Years ended December 31, 2012, 2011, and 2010
Notes to Consolidated Financial Statements
(a) (2) Schedules to the Consolidated Financial Statements required by Article 9 of Regulation S-X are not required, inapplicable, or the required information has been disclosed elsewhere.
(a) (3) Listing of Exhibits:
Exhibit Number Description 3.1 Amended and Restated Articles of Incorporation of First Financial Corporation, incorporated by
reference to Exhibit 3(i) of the Corporation’s Form 10-Q filed for the quarter ended September 30, 2002. 3.2 Code of By-Laws of First Financial Corporation, incorporated by reference to Exhibit 3(ii) of the
Corporation’s Form 8-K filed August 24, 2012. 10.1* Employment Agreement for Norman L. Lowery, dated and effective December 1, 2012 incorporated by
reference to Exhibit 10.1 of the Corporation’s Form 8-K filed March 12, 2013. 10.2* 2001 Long-Term Incentive Plan of First Financial Corporation, incorporated by reference to Exhibit
10.3 of the Corporation’s Form 10-Q filed for the quarter ended September 30, 2002. 10.3* 2012 Schedule of Director Compensation 10.4* 2012 Schedule of Named Executive Officer Compensation 10.5* 2005 Long-Term Incentive Plan of First Financial Corporation, incorporated by reference to Exhibit
10.7 of the Corporation’s Form 8-K filed September 4, 2007. 10.6* 2005 Executives Deferred Compensation Plan, incorporated by reference to Exhibit 10.5 of the
Corporation’s Form 8-K filed September 4, 2007. 10.7* 2005 Executives Supplemental Retirement Plan, incorporated by reference to Exhibit 10.6 of the
Corporation’s Form 8-K filed September 4, 2007. 10.9* First Financial Corporation 2010 Long-Term Incentive Compensation Plan, incorporated by reference
to Exhibit 10.9 to the Corporation’s Form 10-K filed March 15, 2011. 10.10* First Financial Corporation 2011 Short Term Incentive Compensation Plan, incorporated by reference
to Exhibit 10.10 to the Corporation’s Form 10-K filed March 15, 2011. 10.11 First Financial Corporation 2011 Omnibus Equity Incentive Plan, incorporated by reference to exhibit
10.11 to the Corporation’s Form 10-Q filed May 9, 2011. 21 Subsidiaries 31.1 Certification pursuant to Rule 13a-14(a) for Annual Report of Form 10-K by Principal Executive
Officer 31.2 Certification pursuant to Rule 13a-14(a) for Annual Report of Form 10-K by Principal Financial Officer 32.1 Certification pursuant to 18 U.S.C. Section 1350 of Principal Executive Officer 32.2 Certification pursuant to 18 U.S.C. Section 1350 of Principal Financial Officer 101. The following material from First Financial Corporation’s Form 10-K Report for the annual period
ended December 31, 2012, formatted in XBRL pursuant to Rule 405 of Regulation S-T: (i) the Consolidated Balance Sheets, (ii) the Consolidated Statements of Income and Comprehensive Income, (iii) the Consolidated Statements of Cash Flows, (iv) the Consolidated Statements of Shareholders’ Equity, and (v) the Notes to Consolidated Financial Statements**
* Indicates management contract or compensatory plan or arrangement required to be filed as an exhibit to this report.
**Furnished, not filed, for purposes of Sections 11 and 12 of the Securities Act of 1933 and Section 18 of the Securities Exchange Act of 1934.
(b) Exhibits-Filed Exhibits to (a) (3) listed above are attached to this report. (c) Financial Statements Schedules-No schedules are required to be submitted. See response to ITEM 15(a) (2).

72
SIGNATURES
Pursuant to the requirements of Section 13 or 15(d) of the Securities Exchange Act of 1934, the registrant has duly caused this report to be signed on its behalf by the undersigned, thereunto duly authorized.
First Financial Corporation
/s/ Rodger A. McHargue Rodger A. McHargue, Chief Financial Officer (Principal Financial Officer and Principal Accounting Officer)
Date: March 15, 2013

73
Pursuant to the requirements of the Securities Exchange Act of 1934, this report has been signed below by the following persons on behalf of the registrant and in the capacities and on the dates indicated. NAME DATE _/s/ Donald E. Smith March 15, 2013 Donald E. Smith, President and Director /s/ Rodger A. McHargue March 15, 2013 Rodger A. McHargue, Chief Financial Officer (Principal Financial Officer and Principal Accounting Officer) /s/ W. Curtis Brighton March 15, 2013 W. Curtis Brighton, Director /s/ B. Guille Cox, Jr. March 15, 2013 B. Guille Cox, Jr., Director /s/ Thomas T. Dinkel March 15, 2013 Thomas T. Dinkel, Director /s/ Anton H. George March 15, 2013 Anton H. George, Director /s/ Gregory L. Gibson March 15, 2013 Gregory L. Gibson, Director /s/ Norman L. Lowery March 15, 2013 Norman L. Lowery, Vice Chairman, CEO & Director (Principal Executive Officer) /s/ Ronald K. Rich March 15, 2013 Ronald K. Rich, Director /s/ Virginia L. Smith March 15, 2013 Virginia L. Smith, Director /s/ William J. Voges March 15, 2013 William J. Voges, Director /s/ William R. Krieble March 15, 2013 William R. Krieble, Director
74
EXHIBIT INDEX Exhibit Number Description 10.3 2011 Schedule of Director Compensation 10.4 2011 Schedule of Named Executive Officers Compensation 21 Subsidiaries 31.1 Certification Pursuant to Rule 13a-14(a) for Annual Report of Form 10-K by Principal Executive Officer 31.2 Certification Pursuant to Rule 13a-14(a) for Annual Report of Form 10-K by Principal Financial Officer 32.1 Certification Pursuant to Rule 18 U.S.C. Section 1350 of Principal Executive Officer 32.2 Certification Pursuant to Rule 18 U.S.C. Section 1350 of Principal Financial Officer 101. The following material from First Financial Corporation’s Form 10-K Report for the annual period ended December
31, 2012, formatted in XBRL pursuant to Rule 405 of Regulation S-T: (i) the Consolidated Balance Sheets, (ii) the Consolidated Statements of Income and Comprehensive Income, (iii) the Consolidated Statements of Cash Flows, (iv) the Consolidated Statements of Shareholders’ Equity, and (v) the Notes to Consolidated Financial Statements.*
*Furnished, not filed, for purposes of Sections 11 and 12 of the Securities Act of 1933 and Section 18 of the Securities Exchange Act of 1934.
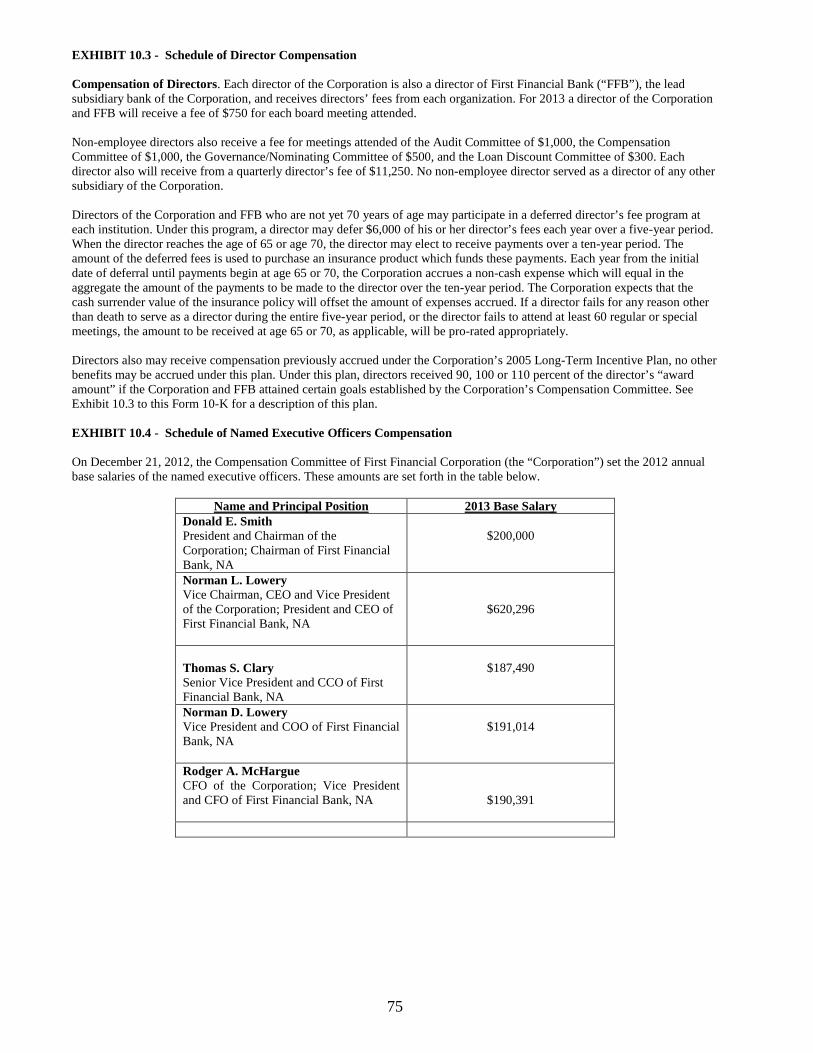
75
EXHIBIT 10.3 - Schedule of Director Compensation Compensation of Directors. Each director of the Corporation is also a director of First Financial Bank (“FFB”), the lead subsidiary bank of the Corporation, and receives directors’ fees from each organization. For 2013 a director of the Corporation and FFB will receive a fee of $750 for each board meeting attended.
Non-employee directors also receive a fee for meetings attended of the Audit Committee of $1,000, the Compensation Committee of $1,000, the Governance/Nominating Committee of $500, and the Loan Discount Committee of $300. Each director also will receive from a quarterly director’s fee of $11,250. No non-employee director served as a director of any other subsidiary of the Corporation. Directors of the Corporation and FFB who are not yet 70 years of age may participate in a deferred director’s fee program at each institution. Under this program, a director may defer $6,000 of his or her director’s fees each year over a five-year period. When the director reaches the age of 65 or age 70, the director may elect to receive payments over a ten-year period. The amount of the deferred fees is used to purchase an insurance product which funds these payments. Each year from the initial date of deferral until payments begin at age 65 or 70, the Corporation accrues a non-cash expense which will equal in the aggregate the amount of the payments to be made to the director over the ten-year period. The Corporation expects that the cash surrender value of the insurance policy will offset the amount of expenses accrued. If a director fails for any reason other than death to serve as a director during the entire five-year period, or the director fails to attend at least 60 regular or special meetings, the amount to be received at age 65 or 70, as applicable, will be pro-rated appropriately. Directors also may receive compensation previously accrued under the Corporation’s 2005 Long-Term Incentive Plan, no other benefits may be accrued under this plan. Under this plan, directors received 90, 100 or 110 percent of the director’s “award amount” if the Corporation and FFB attained certain goals established by the Corporation’s Compensation Committee. See Exhibit 10.3 to this Form 10-K for a description of this plan. EXHIBIT 10.4 - Schedule of Named Executive Officers Compensation On December 21, 2012, the Compensation Committee of First Financial Corporation (the “Corporation”) set the 2012 annual base salaries of the named executive officers. These amounts are set forth in the table below.
Name and Principal Position 2013 Base Salary Donald E. Smith President and Chairman of the Corporation; Chairman of First Financial Bank, NA
$200,000
Norman L. Lowery Vice Chairman, CEO and Vice President of the Corporation; President and CEO of First Financial Bank, NA
$620,296
Thomas S. Clary Senior Vice President and CCO of First Financial Bank, NA
$187,490
Norman D. Lowery Vice President and COO of First Financial Bank, NA
$191,014
Rodger A. McHargue CFO of the Corporation; Vice President and CFO of First Financial Bank, NA
$190,391

76
Exhibit 21 - Subsidiaries of the Registrant
First Financial Bank N.A. is a wholly-owned subsidiary of the Registrant. It is a national banking association. The bank conducts its business under the name of First Financial Bank N.A.
The Morris Plan Company is a wholly-owned subsidiary of the Registrant. It is an Indiana corporation. The company conducts its business under the name of The Morris Plan Company of Terre Haute, Inc.
Forrest Sherer, Inc. is a wholly-owned subsidiary of the Registrant. It is an Indiana corporation. It is a full-line insurance
agency and conducts its business under the name Forrest Sherer, Inc.
FFB Risk Management Co., Inc is a wholly-owned subsidiary of the Registrant. It is an insurance captive and conducts its business under the name of FFB Risk Management Co,, Inc.
77
Exhibit 31.1 -- Certification pursuant to Rule 13a-14(a) for Annual Report of Form 10-K by Principal Executive Officer I, Norman L. Lowery, certify that:
1 I have reviewed this annual report on Form 10-K of First Financial Corporation;
2 Based on my knowledge, this report does not contain any untrue statement of a material fact or omit to state a material fact necessary to make the statements made, in light of the circumstances under which such statements were made, not misleading with respect to the period covered by this report;
3 Based on my knowledge, the financial statements, and other financial information included in this report, fairly
present in all material respects the financial condition, results of operations and cash flows of the registrant as of, and for, the periods presented in this report;
4 The registrant's other certifying officer(s) and I are responsible for establishing and maintaining disclosure controls
and procedures (as defined in Exchange Act Rules 13a-15(e) and 15d-15(e)) and internal control over financial reporting (as defined in Exchange Act Rules 13a-15(f) and l5d--15(f)) for the registrant and have:
a. Designed such disclosure controls and procedures, or caused such disclosure controls and procedures to be
designed under our supervision, to ensure that material information relating to the registrant, including its consolidated subsidiaries, is made known to us by others within those entities, particularly during the period in which this report is being prepared;
b. Designed such internal control over financial reporting, or caused such internal control over financial reporting to be designed under our supervision, to provide reasonable assurance regarding the reliability of financial reporting and the preparation of financial statements for external purpose in accordance with generally accepted accounting principles;
c. Evaluated the effectiveness of the registrant’s disclosure controls and procedures and presented in this report our conclusions about the effectiveness of the disclosure controls and procedures, as of the end of the period covered by this report based on such evaluation; and
d. Disclosed in this report any change in the registrant’s internal control over financial reporting that occurred during the registrant’s most recent fiscal quarter (the registrant’s fourth fiscal quarter in the case of an annual report) that has materially affected, or is reasonably likely to materially affect, the registrant’s internal control over financial reporting; and
5 The registrant's other certifying officer(s) and I have disclosed, based on our most recent evaluation of internal control
over financial reporting, to the registrant's auditors and the audit committee of the registrant's board of directors (or persons performing the equivalent functions):
a. All significant deficiencies and material weaknesses in the design or operation of internal control over financial reporting which are reasonably likely to adversely affect the registrant's ability to record, process, summarize and report financial information; and
b. Any fraud, whether or not material, that involves management or other employees who have a significant role in the registrant's internal control over financial reporting.
Date: March 15, 2013 By /s/ Norman L. Lowery Norman L. Lowery, Vice Chairman and CEO (Principal Executive Officer)
78
Exhibit 31.2 -- Certification pursuant to Rule 13a-14(a) for Annual Report of Form 10-K by Principal Financial Officer I, Rodger A. McHargue, certify that:
1 I have reviewed this annual report on Form 10-K of First Financial Corporation;
2 Based on my knowledge, this report does not contain any untrue statement of a material fact or omit to state a material fact necessary to make the statements made, in light of the circumstances under which such statements were made, not misleading with respect to the period covered by this report;
3 Based on my knowledge, the financial statements, and other financial information included in this report, fairly
present in all material respects the financial condition, results of operations and cash flows of the registrant as of, and for, the periods presented in this report;
4 The registrant's other certifying officer(s) and I are responsible for establishing and maintaining disclosure controls
and procedures (as defined in Exchange Act Rules 13a-15(e) and 15d-15(e)) and internal control over financial reporting (as defined in Exchange Act Rules 13a-15(f) and l5d--15(f)) for the registrant and have:
a. Designed such disclosure controls and procedures, or caused such disclosure controls and procedures to be
designed under our supervision, to ensure that material information relating to the registrant, including its consolidated subsidiaries, is made known to us by others within those entities, particularly during the period in which this report is being prepared;
b. Designed such internal control over financial reporting, or caused such internal control over financial reporting to be designed under our supervision, to provide reasonable assurance regarding the reliability of financial reporting and the preparation of financial statements for external purpose in accordance with generally accepted accounting principles;
c. Evaluated the effectiveness of the registrant’s disclosure controls and procedures and presented in this report our conclusions about the effectiveness of the disclosure controls and procedures, as of the end of the period covered by this report based on such evaluation; and
d. Disclosed in this report any change in the registrant’s internal control over financial reporting that occurred during the registrant’s most recent fiscal quarter (the registrant’s fourth fiscal quarter in the case of an annual report) that has materially affected, or is reasonably likely to materially affect, the registrant’s internal control over financial reporting; and
5 The registrant's other certifying officer(s) and I have disclosed, based on our most recent evaluation of internal control
over financial reporting, to the registrant's auditors and the audit committee of the registrant's board of directors (or persons performing the equivalent functions):
a. All significant deficiencies and material weaknesses in the design or operation of internal control over financial reporting which are reasonably likely to adversely affect the registrant's ability to record, process, summarize and report financial information; and
b. Any fraud, whether or not material, that involves management or other employees who have a significant role in the registrant's internal control over financial reporting.
Date: March 15, 2013 By /s/ Rodger a. McHargue Rodger A. McHargue, Chief Financial Officer (Principal Financial Officer and Principal Accounting Officer)

79
Exhibit 32.1 -- Certification Pursuant to 18 U.S.C. Section 1350, as Adopted Pursuant to Section 906 of the Sarbanes-Oxley Act of 2002
In connection with the Annual Report of First Financial Corporation (the “Corporation”) on Form 10-K for the year ended December 31, 2012 as filed with the Securities and Exchange Commission on the date hereof (the “Report”), I, Norman L. Lowery, Vice Chairman and CEO of the Corporation, certify, pursuant to 18 U.S.C. section 1350, as adopted pursuant to section 906 of the Sarbanes-Oxley Act of 2002, that:
(1) the Report fully complies with the requirements of section 13(a) or 15(d) of the Securities Exchange Act of
1934; and (2) the information contained in the Report fairly presents, in all material respects, the financial condition and results
of operations of the Corporation.
This certification is furnished solely pursuant to 18 U.S.C. section 1350 and is not being filed for any other purpose. Date: March 15, 2013 /s/ Norman L. Lowery Norman L. Lowery Vice Chairman and CEO (Principal Executive Officer)

80
Exhibit 32.2 -- Certification Pursuant to 18 U.S.C. Section 1350, as Adopted Pursuant to Section 906 of the Sarbanes-Oxley Act of 2002
In connection with the Annual Report of First Financial Corporation (the “Corporation”) on Form 10-K for the year ended December 31, 2012 as filed with the Securities and Exchange Commission on the date hereof (the “Report”), I, Rodger A. McHargue, Chief Financial Officer of the Corporation, certify, pursuant to 18 U.S.C. section 1350, as adopted pursuant to section 906 of the Sarbanes-Oxley Act of 2002, that:
(1) the Report fully complies with the requirements of section 13(a) or 15(d) of the Securities Exchange Act of
1934; and (2) the information contained in the Report fairly presents, in all material respects, the financial condition and
results of operations of the Corporation. This certification is furnished solely pursuant to 18 U.S.C. section 1350 and is not being filed for any other purpose. Date: March 15, 2013 /s/ Rodger A. McHargue Rodger A. McHargue
Chief Financial Officer (Principal Financial Officer and Principal Accounting Officer)

expa
nsio
nA
YEAR
OF
EXPA
NSI
ON
, IM
PRO
VEM
ENT
AND
INVE
STM
ENT
125
INDIANA
VIGO COUNTYTerre Haute Main Office*One First Financial PlazaSixth& Wabash812-238-6000
Honey Creek Mall*U.S. 41 South812-238-6000
Industrial Park*1749 East Industrial Drive812-238-6000
Maple Avenue*4065 Maple Avenue812-238-6000
Meadows*350 South 25th Street812-238-6000
Plaza North*Ft. Harrison & Lafayette812-238-6000
Seelyville*9520 East U.S. 40812-238-6000
Southland*3005 South Seventh Street812-238-6000
Springhill*4500 U.S. 41 South812-238-6000
Sycamore Terrace*2425 South State Road 46812-238-6000
West Terre Haute*309 National Avenue812-238-6000
CLAY COUNTYBrazil*7995 North State Road 59812-443-4481
Brazil Downtown*18 North Walnut812-448-3357
Brazil Eastside*2180 East National Avenue812-448-8110
Clay City*502-504 Main Street812-939-2145
First Financial Banking Centers
DAVIESS COUNTYWashington*300 East Main Street812-257-8860
GIBSON COUNTYPrinceton*1501 West Broadway 812-385-0235
GREENE COUNTYWorthington*9 North Commercial Street812-875-3021
KNOX COUNTYSandborn102 North Anderson Street812-694-8462
Vincennes*2707 North Sixth Street812-882-4800
Vincennes*619 Main Street Vincennes812-886-9690
PARKE COUNTYRockville*1311 North Lincoln Road765-569-3171
Rockville Downtown*120 East Ohio Street765-569-3442
Marshall10 South Main Street765-597-2261
Montezuma*232 East Crawford Street765-245-2706
Rosedale62 East Central Street765-548-2266
PUTNAM COUNTYGreencastle*101 South Warren Drive765-653-4444
SULLIVAN COUNTYSullivan*15 South Main Street812-268-3331
Dugger*879 South 3rd Street812-648-2251
Farmersburg*819 West Main Street812-696-2106
Hymera*102 South Main Street812-383-4933
VANDERBURGH COUNTYEvansville*12600 Highway 41 North812-868-8850
VERMILLION COUNTYNewport*100 West Market Street765-492-3321
Cayuga101 S. Division Street765-492-3391
Clinton*221 South Main Street765-832-3504
Clinton Crown Hill*1775 East State Road 163765-832-5546
ILLINOIS
CHAMPAIGN COUNTYBroadway*410 North Broadway217-351-2701
Mahomet IGA*Eastwood Center IGA217-586-5322
Neil Street*1205 South Neil Street217-352-6700
Philo Road*2510 South Philo Road217-344-1300
South Prospect*1611 South Prospect Avenue217-351-6620
CLARK COUNTYMarshall*215 North Michigan217-826-6311
COLES COUNTYCharleston*820 West Lincoln Avenue217-345-4824
CRAWFORD COUNTYRobinson*108 West Main Street618-544-8666
Robinson Motor Bank*602 West Walnut Street618-544-3355
Oblong*301 East Main Street618-592-4252
JASPER COUNTYNewton*601 West Jourdan Street618-783-2022
LAWRENCE COUNTYLawrenceville*1601 State Street618-943-3323
LIVINGSTON COUNTYMadison Street*521 West Madison Street815-844-3171
Pontiac Main*223 North Mill Street815-844-3171
Pontiac West*Route 116 & Route 66815-844-3171
MCLEAN COUNTYBrickyard Drive - Bloomington*#1 Brickyard Drive Suite 301309-661-9993
Gridley325 Center Street309-747-2100
Towanda Plaza - Bloomington*1218 Towanda Avenue888-876-2638
RICHLAND COUNTYOlney*240 East Chestnut Street618-395-8676
Olney*1110 South West Street618-395-2112
VERMILION COUNTYDanvilleOne Towne Center217-442-0362
Danville Motor Bank*101 West Main Street217-443-3519
Danville*2750 North Vermilion Street217-431-8750
Danville*901 North Gilbert Street217-431-3486
Danville*421 South Gilbert Street217-477-4510
Ridge Farm*11 South State Street217-247-2126
Westville*101 East Main Street217-267-2147
WAYNE COUNTYFairfield*303 West Delaware618-842-2145
Morris Plan Banking Center 817 Wabash Avenue812-238-6063
INSURANCE Forrest Sherer Insurance of Terre Haute24 North Ohio Street812-232-0441
1219 Ohio Street812-232-0441
Forrest Sherer Insurance of Evansville7525 East Virginia Street812-232-0441
*First Plus 24-hour ATM available at these locations
16 new service locationsnew personal banking customers
new service locations
WAYNE
KNOX
JAPSER CRAWFORD
SULLIVANGREENE
CLAY
PUTNAMPARKE
VIGO
CLARK
Greencastle
Marshall
MontezumaRockville
Poland
Clay City
Terre Haute
Carlisle
FarmersburgHymera
RobinsonOblong
Olney Lawrenceville
Sandborn
Vincennes
F
West Terre Haute
MCLEAN
LIVINGSTON
Brickyard Drive-Bloomington
Champaign
Pontiac Main
Mahomet
Urbana
Gridley
CHAMPAIGN
DanvilleWestville
Ridge Farm
VERMILLION
Newport
Clinton
Cayuga
COLESCharleston
VANDERBURG
GIBSONPrinceton
Evansville
DAVIESSWashington
Worthington
LAWRENCERICHLAND
Newton
Pontiac West
Madison Street
Towanda Plaza-Bloomington
Robinson Motor Bank
Brazil Dwntn
SeelyvilleBrazil
Brazil Eastside
Honey Creek Mall
Marshall
DuggerSullivan
Rosedale
WAYNE
KNOX
JASPER CRAWFORD
SULLIVANGREENE
CLAY
PUTNAMPARKE
VIGO
CLARK
Greencastle
Marshall
MontezumaRockville
Clay City
Terre Haute
FarmersburgHymera
Oblong
Olney LawrencevilleSandborn
Vincennes
F
West Terre Haute
MCLEAN
LIVINGSTON
Bloomington
Pontiac
Mahomet
Gridley
CHAMPAIGN
DanvilleWestville
Ridge Farm
VERMILION
Newport
Clinton
Cayuga
COLESCharleston
VANDERBURGH
GIBSONPrinceton
Evansville
DAVIESSWashington
Worthington
LAWRENCERICHLAND
Newton Robinson
SeelyvilleBrazil
Marshall
DuggerSullivan
Rosedale
Urbana
Champaign VERMILLION
4,000
16
new or upgraded ATMs

First Financial Corporation
One First Financial PlazaTerre Haute, IN 47807812/238/6000 800/511/0045www.first-online.com
A YE
AR O
F EX
PAN
SIO
N, I
MPR
OVE
MEN
T AN
D IN
VEST
MEN
T 20122012 ANNUAL REPORT
TO THE STAKEHOLDERS
2012
The mission of First Financial Corporation is to be the FIRST choice for all your financial needs.