Embed Size (px)
Citation preview
Report on Trend & Progress of Housing in India, June
2002
Report on Trend & Progress of Housing in India, June 2002
CONTENTS
Chapter I: Housing in the Backdrop of Overall Economic Scenario: 2001-02
Chapter-II: Institutional Framework for Housing Finance: HFCs
Chapter-III: Institutional Framework for Housing Finance: Banks
Chapter-IV: Institutional Framework for Housing Finance: Cooperatives
Chapter-V: Asset Quality in housing Finance
Chapter-VI: Activities of NHB 2001-02
Chapter-VII: Government Housing Initiatives
Chapter VIII: Assessment & Prospect
2
Chapter-I
Housing in the Backdrop of Overall Economic Scenario: 2001-02
Housing being one of the three basic needs of life always remains in the top priorities of any person, society and economy. As a human being, an individual needs his own space and privacy, which can be provided by the ownership of house. The home is the basic unit of the society. Home provides a platform to the family and the family is the most important social institution, which leaves its imprint on an individual for whole life. Thus housing deserves significant attention in the context of developing policies and strategies for human development. But still the majority of human populace lives in slums, shanties and temporary shabby shelters in rural areas. This shortage of housing is a big impediment in the healthy development of an individual and consequently the society, and the nation.
The problem of space, privacy, security and sanitation leads to social, economic and environmental degeneration. The perpetual strife for space and house-ownership leads to personal and social disorganization, which is detrimental for society and the economy. A developing nation like India has to focus more on housing sector to cater to the housing needs of burgeoning population and to accelerate the economic growth. The housing sector has been globally used as an engine to propel the economic growth as it is generates employment and demand in the market. Last one decade has seen the authorities according significant focus on the housing sector in India. The government of India has been trying to nurture and strengthen the housing sector in recent times through various fiscal and legislative measures.
The incentives given through fiscal and monetary policies in tandem with conducive economic environment in India are providing boost to housing sector. South bound interest rates, reduced CRR, low NPAs in housing finance sector and slowdown in growth of other sectors of economy have made the housing sector more attractive. In order to attract the customers further, the financial institutions have liberalized the lending norms, reduced the rates of interest, increased the period of loan, eased the collateral requirement etc.
The Macro-economy and Budgetary Stance
GDP at factor cost grew at the rate of 5.4% as against the 4.0% in year 2000-01 which is considered significant keeping the adverse conditions in the domestic and global economy in view. Orissa cyclone, Gujarat earthquake and global economic recession resulting after the September 11 terrorist attack in the USA though hampered the export growth and industrial profitability. However, India survived an uncertain global environment with a growth rate far better than majority of other countries. The Agricultural sector rebounded with growth rate of 5.7% , Growth in services sector was
3
highest with a rate of 6.2% and Industrial growth was sluggish with a rate of 2.9% . The inflation rates were at comfortable level. The balance of payment also saw an improvement reflected by swelling foreign exchange reserves and remarkable improvement in the external debt position.
As the housing sector is closely intertwined with the macro economy, broad changes in the policy and performance therein affect the sector to a large extent. Thus the Union Budget has strong implications for the housing sector. The Union Budget for the year 2001-02 outlined following broad strategies: Continued reform in agriculture and food economy
Increased public & private investment in infrastructure
Strengthening of the financial sector & capital markets
Deepening of structural reforms and revival of industrial growth
Provision of social sector to poor
Consolidation of tax reforms with continued fiscal adjustment at both the Central and State levels
The Impact of Budget proposals on Housing Sector
National Housing Bank to introduce a Mortgage Credit Guarantee Scheme that would be extended in a phased manner to all housing loans thereby fully protecting the lenders against default.
The target under the Golden Jubilee Rural Housing Finance Scheme for 2002-03 set at 2.25 lakh units, up from 1.75 lakh units during 2001-02.
The allocation of the Indira Awas Yojana increased by 13% to Rs.1725 crore. The increased allocation is expected to benefit the people of targeted class who neither have the desired affordability nor the accessibility to formal sector financial assistance.
The houses constructed under the Indira Awas Yojana in the disaster-prone areas to be provided insurance cover through a Master Policy.
An Urban Reform Incentive Fund (URIF) proposed to be set up with an initial corpus of Rs.500 crore to provide reform linked assistance to States. The fund will seek to incentivize reforms in the areas of rent control laws and repeal of Urban Land Ceiling Act, rationalization of high stamp duties, streamlining of approval process for development and construction of buildings, simplification of procedures for conversion of agricultural land for non agricultural purposes, and revision of municipal laws in line with model legislation prepared by the Ministry of Urban Development and Poverty Alleviation. This fund is to be established to address some of the critical problems and long standing demands of the housing sector in the country. It is expected that the steps contemplated will simplify various
4
laws and procedures related to housing and iron out any anomalies, thereby propelling the sector on to a faster growth path.
Fiscal policy incentives
The Government of India continued with its endeavor to propel the housing and housing finance sector through various fiscal and budgetary incentives included in the Budget for the year 2001-02, which can be listed as below:
The deduction for interest payable on housing loans for self occupied houses will be allowed even if the house is constructed or acquired after March 31, 2003, provided such acquisition or construction is completed within three years from the end of the financial year in which the loan was taken. The interest rate concession under Section 24(b) of the Income Tax Act, 1961 was introduced with the specific purpose of enhancing consumer interest in the housing sector, and so far this concession has proved to be a major facilitating factor towards the growth in the sector during the last few years. It is expected that the waiver of the time limit for construction/acquisition will lead to a much-simplified procedure in claiming this concession and thus pave the way for a continued growth of the sector.
The capital gains exemption provided under Section 54EC of the Income Tax Act, 1961 has been extended to bonds issued by the National Housing Bank. The proposed measure is expected to help NHB in mobilizing low cost funds from the public, thereby leading to a reduction in the rate of interest on refinance offered by NHB and overall interest rate in housing finance market.
The customs duty on cement has been lowered from 25% to 20%. Cement accounts for around 18% of the cost of construction of a house. This measure is expected to bring down the prices of imported cement, thereby lowering the overall cost of construction of a house.
The provisions of Chapter XX-C, which require a clearance to be obtained from the Appropriate Authority before registering the transfer of an immovable property, have been abolished. This step is expected to expedite the procedure of transfer of immovable properties thereby leading to greater volumes and thus providing an impetus to the growth of the housing sector.
With various measures which have been introduced to resolve the numerous problems hitherto being faced on the demand as well as the supply side of the sector, the Union Budget for the year 2002-03 is expected to augment the growth of housing sector.
5
Monetary Policy Measures
Recognising the contribution of the banking sector in the housing finance sector in the country, the Reserve Bank of India (RBI) in the Credit and Monetary Policy in April, 2002, announced certain measures for housing finance by Banks.
Accordingly, in order to improve the flow of credit to the housing sector, the prudential requirements for housing finance by banks have been liberalised as under :
The risk weight on bank loans against residential housing properties was reduced to 50 percent against 100 percent stipulated earlier.
Investments by banks in mortgage-backed securities (MBS) of residential assets by housing finance companies (HFCs) recognized and supervised by National Housing Bank (NHB) have also been assigned a risk weight of 50%.
Investments by banks in MBS issued by HFCs under NHB’s supervisory ambit will be reckoned for inclusion in the prescribed housing finance allocation of 3 per cent.
Besides, it is proposed to set up a Working Group to suggest modalities for widening the investor base in MBS, improving the quality of assets, creating liquidity for trading in such assets and other related issues.
The bank rate hit the lowest ground since May, 1973. It was brought down to 6.50% on 0ctober 23, 2001.
The CRR was brought down to the level of 5.00% with effect from June 1, 2002.
The Housing Finance Scenario: 2001-2002
Though there were certain inherent problems such as scarcity of long-term funding, inelastic supply of land, legal issues related to land mortgaging and foreclosure, but still the housing sector continued to grow robustly during the year 2001-02. The disbursement of housing loans kept a fast pace and the amount disbursed soared high. Both he banking sector and the housing finance companies (HFCs) infused around Rs.15,000 crore each in the year 2001-02.
The NHB modified the Housing Finance Companies (NHB) Directions, 1989 and the same was notified as Housing Finance Companies (NHB) Directions, 2001 on December 29, 2001. The new Directions include the guidelines on prudential norms as well.
The NHB issued the Guidelines for Asset-liability Management for the HFCs in June 2002.
6
The National Housing Bank (Recovery of Dues of the Approved Institutions) General Regulation, 2002 was notified on May 8, 2002 providing procedure for transfer by sale, lease or otherwise of the mortgaged property by the recovery officer.
For the fifth consecutive year the targets under the Golden Jubilee Rural Housing Finance Scheme of NHB were successfully achieved.
NHB introduced a Scheme for extending Guarantee to the Bonds to be floated by the HFCs. This Scheme is aimed at providing credit enhancement for the long-term resource mobilisation instruments of HFCs.
Chapter-II
Institutional Framework for Housing Finance:Housing Finance Companies
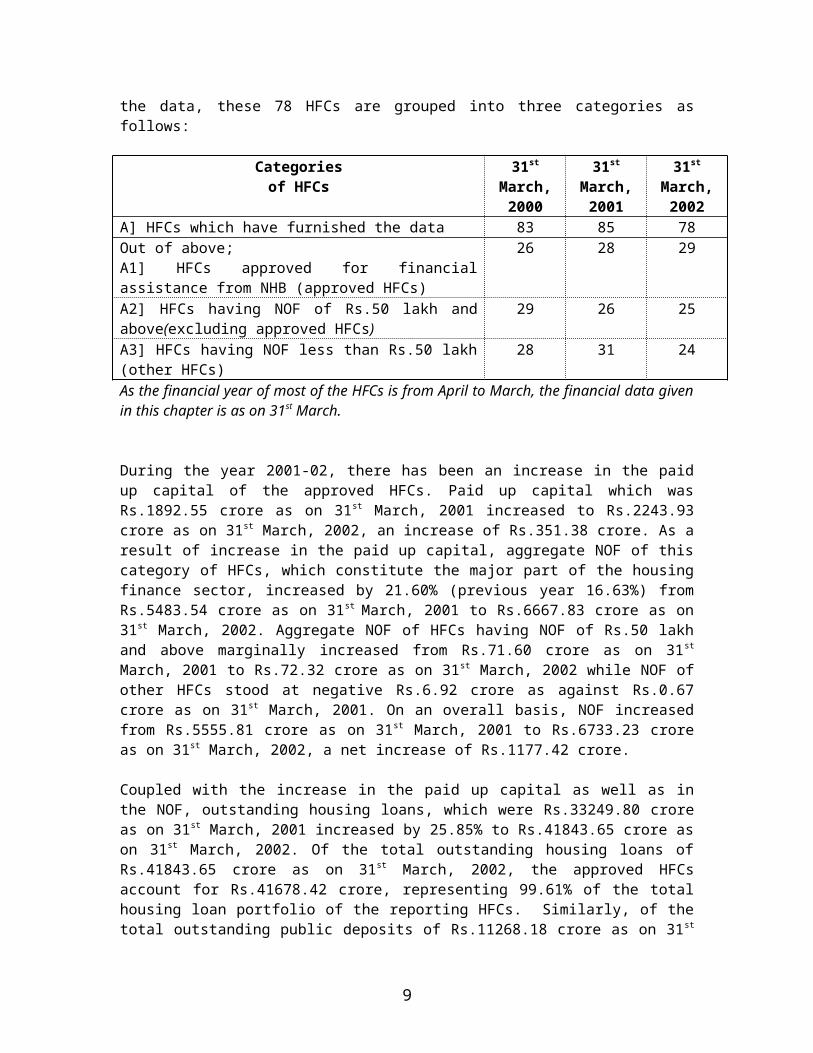
As on 31st March, 2002 the total number of companies in the mailing list of NHB was 349 as against 342 in the preceding year. In terms of Section 29A of the National Housing Bank Act, 1987 (as amended in 2000), effective from 12th June, 2000, companies are required to obtain Certificate of Registration from NHB to be eligible to carry on or commence the business of a Housing Finance Institution (HFI). Of these 349 companies, 257 had failed to apply for registration within the stipulated period and, therefore, these companies have become ineligible to carry on the business of HFI. NHB has received data from 78 HFCs (including the HFCs which had failed to apply for registration) under its system of off-site supervision in terms of the Housing Finance Companies (NHB) Directions, 2001. For the purpose of analysis of the data, these 78 HFCs are grouped into three categories as follows:
Categories of HFCs
31st
March, 2000
31st
March, 2001
31st
March, 2002
A] HFCs which have furnished the data 83 85 78Out of above;A1] HFCs approved for financial assistance from NHB (approved HFCs)
26 28 29
A2] HFCs having NOF of Rs.50 lakh and above(excluding approved HFCs)
29 26 25
A3] HFCs having NOF less than Rs.50 lakh (other HFCs)
28 31 24
As the financial year of most of the HFCs is from April to March, the financial data given in this chapter is as on 31st March.
7
During the year 2001-02, there has been an increase in the paid up capital of the approved HFCs. Paid up capital which was Rs.1892.55 crore as on 31st
March, 2001 increased to Rs.2243.93 crore as on 31st March, 2002, an increase of Rs.351.38 crore. As a result of increase in the paid up capital, aggregate NOF of this category of HFCs, which constitute the major part of the housing finance sector, increased by 21.60% (previous year 16.63%) from Rs.5483.54 crore as on 31st March, 2001 to Rs.6667.83 crore as on 31st March, 2002. Aggregate NOF of HFCs having NOF of Rs.50 lakh and above marginally increased from Rs.71.60 crore as on 31st March, 2001 to Rs.72.32 crore as on 31st March, 2002 while NOF of other HFCs stood at negative Rs.6.92 crore as against Rs.0.67 crore as on 31st March, 2001. On an overall basis, NOF increased from Rs.5555.81 crore as on 31st March, 2001 to Rs.6733.23 crore as on 31st March, 2002, a net increase of Rs.1177.42 crore.
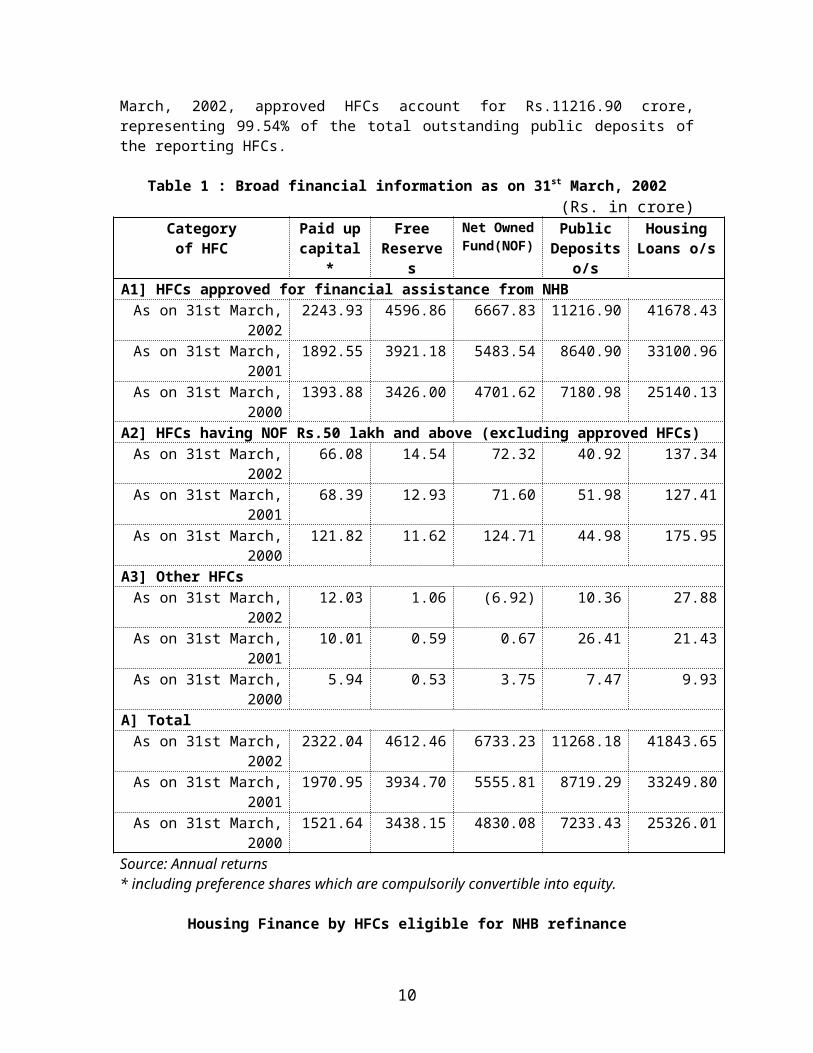
Coupled with the increase in the paid up capital as well as in the NOF, outstanding housing loans, which were Rs.33249.80 crore as on 31st March, 2001 increased by 25.85% to Rs.41843.65 crore as on 31st March, 2002. Of the total outstanding housing loans of Rs.41843.65 crore as on 31st March, 2002, the approved HFCs account for Rs.41678.42 crore, representing 99.61% of the total housing loan portfolio of the reporting HFCs. Similarly, of the total outstanding public deposits of Rs.11268.18 crore as on 31st March, 2002, approved HFCs account for Rs.11216.90 crore, representing 99.54% of the total outstanding public deposits of the reporting HFCs.
Table 1 : Broad financial information as on 31st March, 2002(Rs. in crore)
Category of HFC
Paid up capital*
Free Reserve
s
Net Owned
Fund(NOF)
Public Deposit
s o/s
Housing Loans o/s
A1] HFCs approved for financial assistance from NHB As on 31st March,
20022243.93 4596.86 6667.83 11216.90 41678.43
As on 31st March, 2001
1892.55 3921.18 5483.54 8640.90 33100.96
As on 31st March, 2000
1393.88 3426.00 4701.62 7180.98 25140.13
A2] HFCs having NOF Rs.50 lakh and above (excluding approved HFCs)As on 31st March,
200266.08 14.54 72.32 40.92 137.34
As on 31st March, 2001
68.39 12.93 71.60 51.98 127.41
As on 31st March, 2000
121.82 11.62 124.71 44.98 175.95
A3] Other HFCsAs on 31st March,
200212.03 1.06 (6.92) 10.36 27.88
As on 31st March, 2001
10.01 0.59 0.67 26.41 21.43
As on 31st March, 5.94 0.53 3.75 7.47 9.93
8
2000A] Total
As on 31st March, 2002
2322.04 4612.46 6733.23 11268.18 41843.65
As on 31st March, 2001
1970.95 3934.70 5555.81 8719.29 33249.80
As on 31st March, 2000
1521.64 3438.15 4830.08 7233.43 25326.01
Source: Annual returns * including preference shares which are compulsorily convertible into equity.
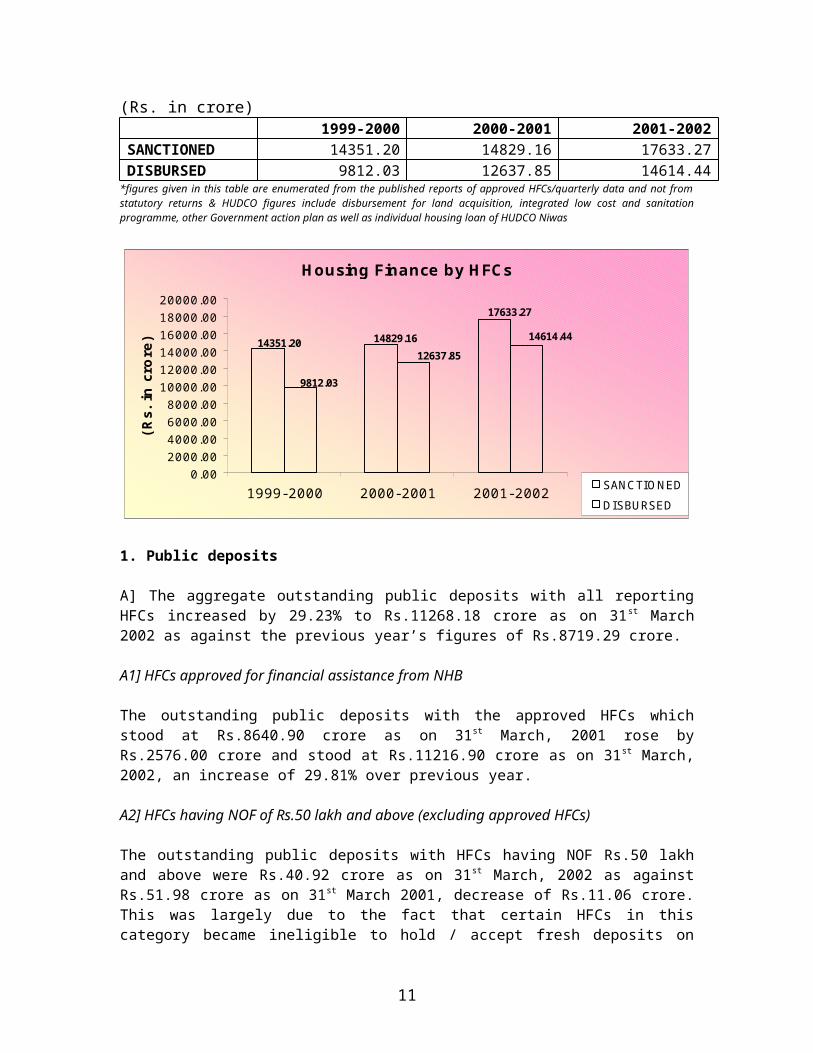
Housing Finance by HFCs eligible for NHB refinance
(Rs. in crore) 1999-2000 2000-2001 2001-2002
SANCTIONED 14351.20 14829.16 17633.27DISBURSED 9812.03 12637.85 14614.44
*figures given in this table are enumerated from the published reports of approved HFCs/quarterly data and not from statutory returns & HUDCO figures include disbursement for land acquisition, integrated low cost and sanitation programme, other Government action plan as well as individual housing loan of HUDCO Niwas
Housing Finance by HFCs
17633.27
14829.1614351.20 14614.44
12637.85
9812.03
0.002000.004000.006000.008000.00
10000.0012000.0014000.0016000.0018000.0020000.00
1999-2000 2000-2001 2001-2002
(Rs.
in c
rore
)
SANCTIONEDDISBURSED
1. Public deposits
A] The aggregate outstanding public deposits with all reporting HFCs increased by 29.23% to Rs.11268.18 crore as on 31st March 2002 as against the previous year’s figures of Rs.8719.29 crore.
A1] HFCs approved for financial assistance from NHB
The outstanding public deposits with the approved HFCs which stood at Rs.8640.90 crore as on 31st March, 2001 rose by Rs.2576.00 crore and stood
9
at Rs.11216.90 crore as on 31st March, 2002, an increase of 29.81% over previous year.
A2] HFCs having NOF of Rs.50 lakh and above (excluding approved HFCs)
The outstanding public deposits with HFCs having NOF Rs.50 lakh and above were Rs.40.92 crore as on 31st March, 2002 as against Rs.51.98 crore as on 31st March 2001, decrease of Rs.11.06 crore. This was largely due to the fact that certain HFCs in this category became ineligible to hold / accept fresh deposits on account of non-compliance with the provisions of the NHB Directions / NHB Act.
A3] Other HFCs
The outstanding public deposits with other HFCs, which were Rs.26.41 crore as on 31st March, 2001 substantially reduced to Rs.10.36 crore as on 31st
March 2002. Reduction in the public deposits of this category of HFCs is due to the fact that most of the HFCs became ineligible to hold / accept fresh deposits on account of non-compliance with the provisions of the Directions/NHB Act.
2. Classification of public deposits
The classification of public deposits as per the size, maturity and interest rate for different categories of HFCs is given below:
2.1 Size-wise classification
A] All reporting HFCs
The share of public deposits of over Rs.1,00,000 which accounted for 52.35% of the total deposits as on 31st March, 2001 increased to 56.67% as on 31st
March, 2002.
Table 2 : Size-wise public deposits with all reporting HFCs(Rs. in crore)
Outstanding public deposits as on 31st MarchSize 2000 2001 2002
Amount
% Amount % Amount %
Upto Rs.5,000 104.47 1.44 84.14 0.97 53.55 0.47Rs.5,001 to Rs.10,000 343.69 4.75 353.15 4.05 467.13 4.15Rs.10,001 to Rs.25,000 877.88 12.14 1042.04 11.95 1240.28 11.01Rs.25,001 to Rs.50,000 1208.55 16.71 1393.31 15.98 1808.71 16.05Rs.50,001 to 1042.24 14.41 1281.89 14.70 1313.09 11.65
10
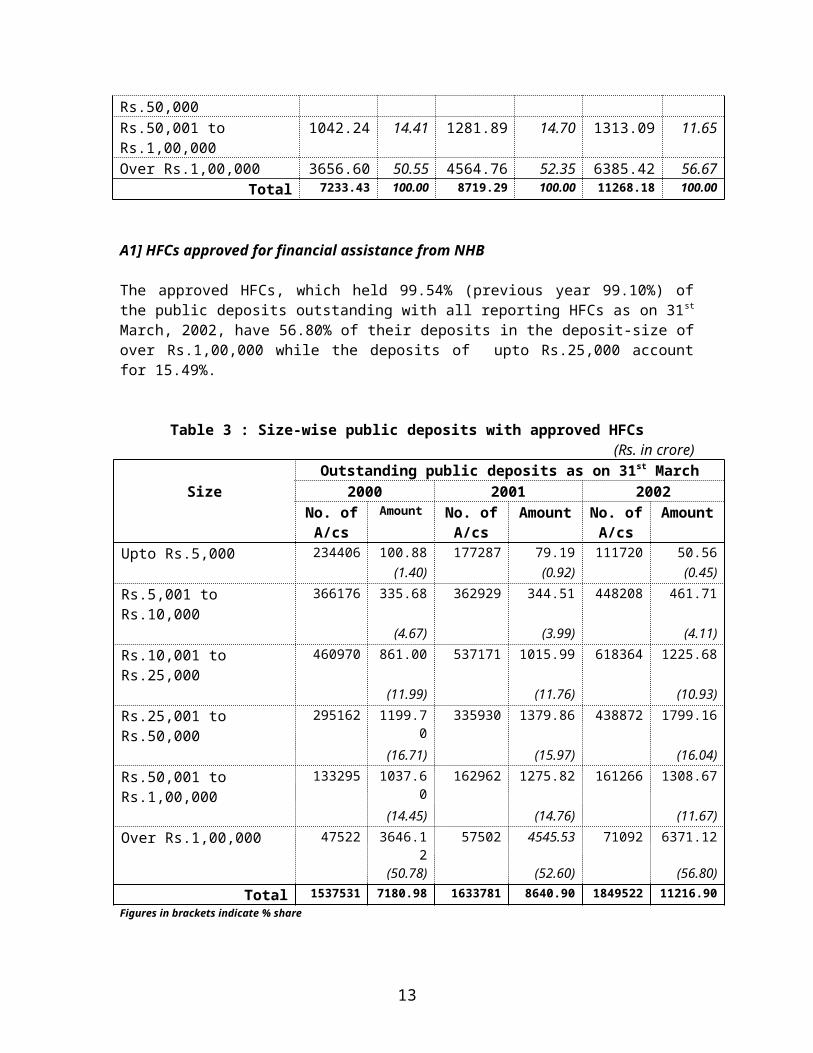
Rs.1,00,000Over Rs.1,00,000 3656.60 50.55 4564.76 52.35 6385.42 56.67
Total 7233.43 100.00
8719.29 100.00 11268.18 100.00
A1] HFCs approved for financial assistance from NHB
The approved HFCs, which held 99.54% (previous year 99.10%) of the public deposits outstanding with all reporting HFCs as on 31st March, 2002, have 56.80% of their deposits in the deposit-size of over Rs.1,00,000 while the deposits of upto Rs.25,000 account for 15.49%.
Table 3 : Size-wise public deposits with approved HFCs (Rs. in crore)
Outstanding public deposits as on 31st MarchSize 2000 2001 2002
No. of A/cs
Amount
No. of A/cs
Amount
No. of A/cs
Amount
Upto Rs.5,000 234406 100.88 177287 79.19 111720 50.56(1.40) (0.92) (0.45)
Rs.5,001 to Rs.10,000 366176 335.68 362929 344.51 448208 461.71(4.67) (3.99) (4.11)
Rs.10,001 to Rs.25,000
460970 861.00 537171 1015.99 618364 1225.68
(11.99) (11.76) (10.93)Rs.25,001 to Rs.50,000
295162 1199.70
335930 1379.86 438872 1799.16
(16.71) (15.97) (16.04)Rs.50,001 to Rs.1,00,000
133295 1037.60
162962 1275.82 161266 1308.67
(14.45) (14.76) (11.67)Over Rs.1,00,000 47522 3646.1
257502 4545.53 71092 6371.12
(50.78) (52.60) (56.80)Total 153753
17180.9
81633781 8640.90 184952
211216.9
0Figures in brackets indicate % share
A2] HFCs having NOF of Rs.50 lakh and above (excluding approved HFCs)
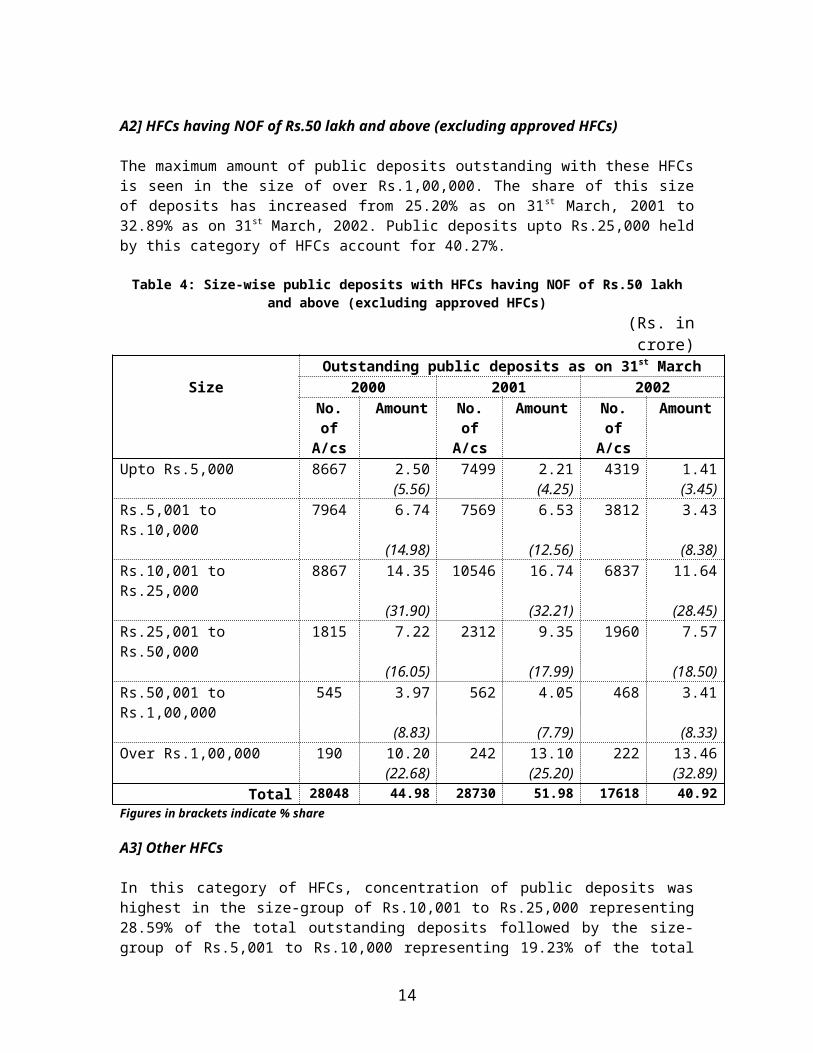
The maximum amount of public deposits outstanding with these HFCs is seen in the size of over Rs.1,00,000. The share of this size of deposits has increased from 25.20% as on 31st March, 2001 to 32.89% as on 31st March, 2002. Public deposits upto Rs.25,000 held by this category of HFCs account for 40.27%.
11
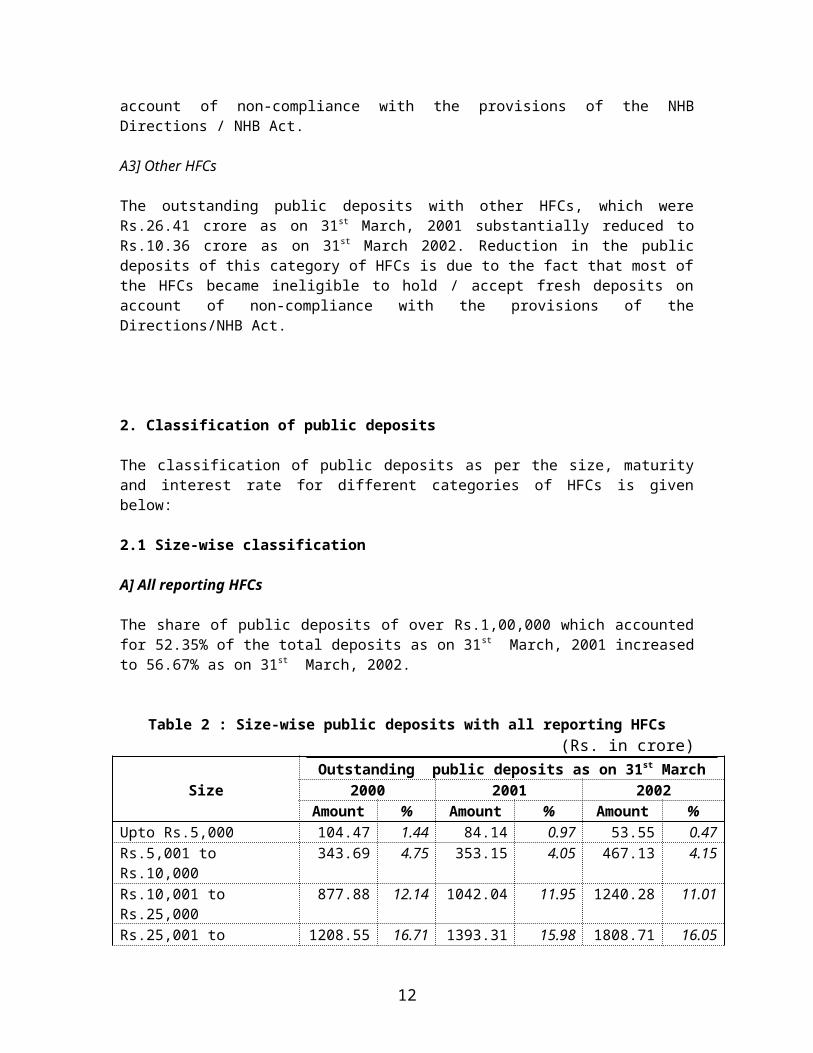
Table 4: Size-wise public deposits with HFCs having NOF of Rs.50 lakh and above (excluding approved HFCs)
(Rs. in crore)Outstanding public deposits as on 31st March
Size 2000 2001 2002No. of
A/cs
Amount No. of A/cs
Amount
No. of A/cs
Amount
Upto Rs.5,000 8667 2.50 7499 2.21 4319 1.41(5.56) (4.25) (3.45)
Rs.5,001 to Rs.10,000 7964 6.74 7569 6.53 3812 3.43(14.98) (12.56) (8.38)
Rs.10,001 to Rs.25,000 8867 14.35 10546 16.74 6837 11.64(31.90) (32.21) (28.45)
Rs.25,001 to Rs.50,000 1815 7.22 2312 9.35 1960 7.57(16.05) (17.99) (18.50)
Rs.50,001 to Rs.1,00,000
545 3.97 562 4.05 468 3.41
(8.83) (7.79) (8.33)Over Rs.1,00,000 190 10.20 242 13.10 222 13.46
(22.68) (25.20) (32.89)Total 2804
844.98 28730 51.98 17618 40.92
Figures in brackets indicate % share
A3] Other HFCs
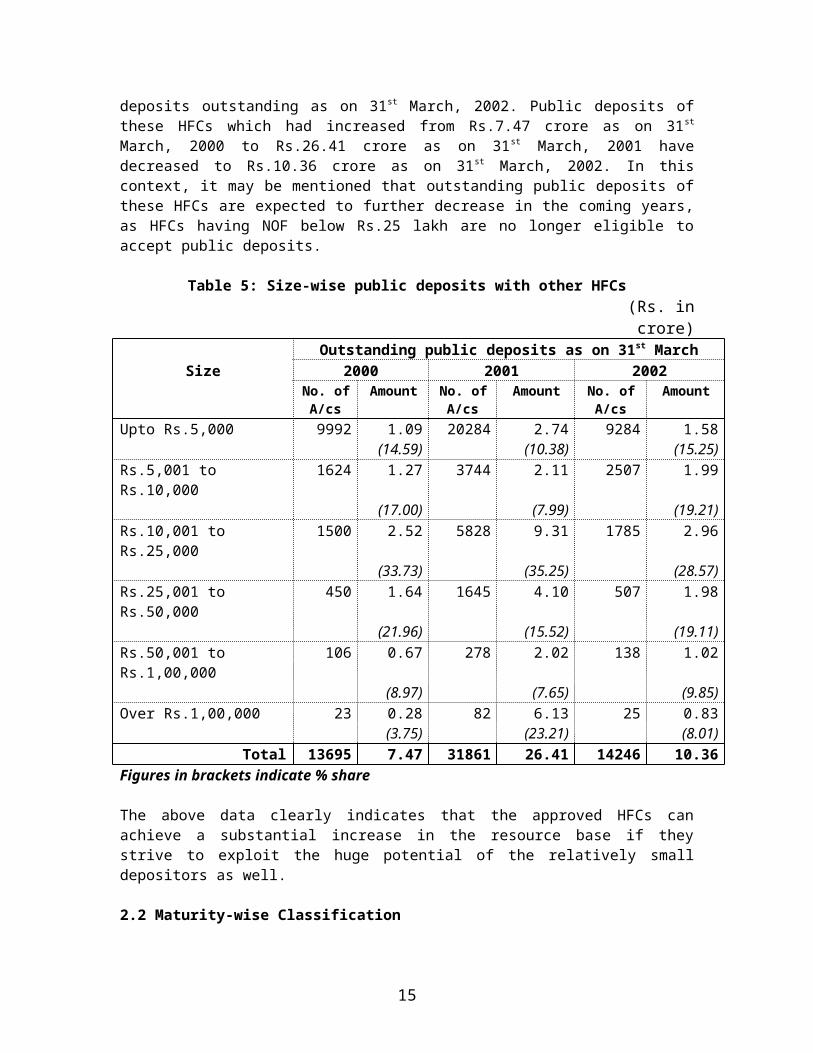
In this category of HFCs, concentration of public deposits was highest in the size-group of Rs.10,001 to Rs.25,000 representing 28.59% of the total outstanding deposits followed by the size-group of Rs.5,001 to Rs.10,000 representing 19.23% of the total deposits outstanding as on 31st March, 2002. Public deposits of these HFCs which had increased from Rs.7.47 crore as on 31st March, 2000 to Rs.26.41 crore as on 31st March, 2001 have decreased to Rs.10.36 crore as on 31st March, 2002. In this context, it may be mentioned that outstanding public deposits of these HFCs are expected to further decrease in the coming years, as HFCs having NOF below Rs.25 lakh are no longer eligible to accept public deposits.
Table 5: Size-wise public deposits with other HFCs (Rs. in crore)
Outstanding public deposits as on 31st MarchSize 2000 2001 2002
No. of A/cs
Amount
No. of A/cs
Amount No. of A/cs
Amount
Upto Rs.5,000 9992 1.09 20284 2.74 9284 1.58(14.59) (10.38) (15.25)
Rs.5,001 to Rs.10,000 1624 1.27 3744 2.11 2507 1.99(17.00) (7.99) (19.21)
Rs.10,001 to Rs.25,000
1500 2.52 5828 9.31 1785 2.96
12
(33.73) (35.25) (28.57)Rs.25,001 to Rs.50,000
450 1.64 1645 4.10 507 1.98
(21.96) (15.52) (19.11)Rs.50,001 to Rs.1,00,000
106 0.67 278 2.02 138 1.02
(8.97) (7.65) (9.85)Over Rs.1,00,000 23 0.28 82 6.13 25 0.83
(3.75) (23.21) (8.01)Total 13695 7.47 31861 26.41 14246 10.36
Figures in brackets indicate % share
The above data clearly indicates that the approved HFCs can achieve a substantial increase in the resource base if they strive to exploit the huge potential of the relatively small depositors as well.
2.2 Maturity-wise Classification
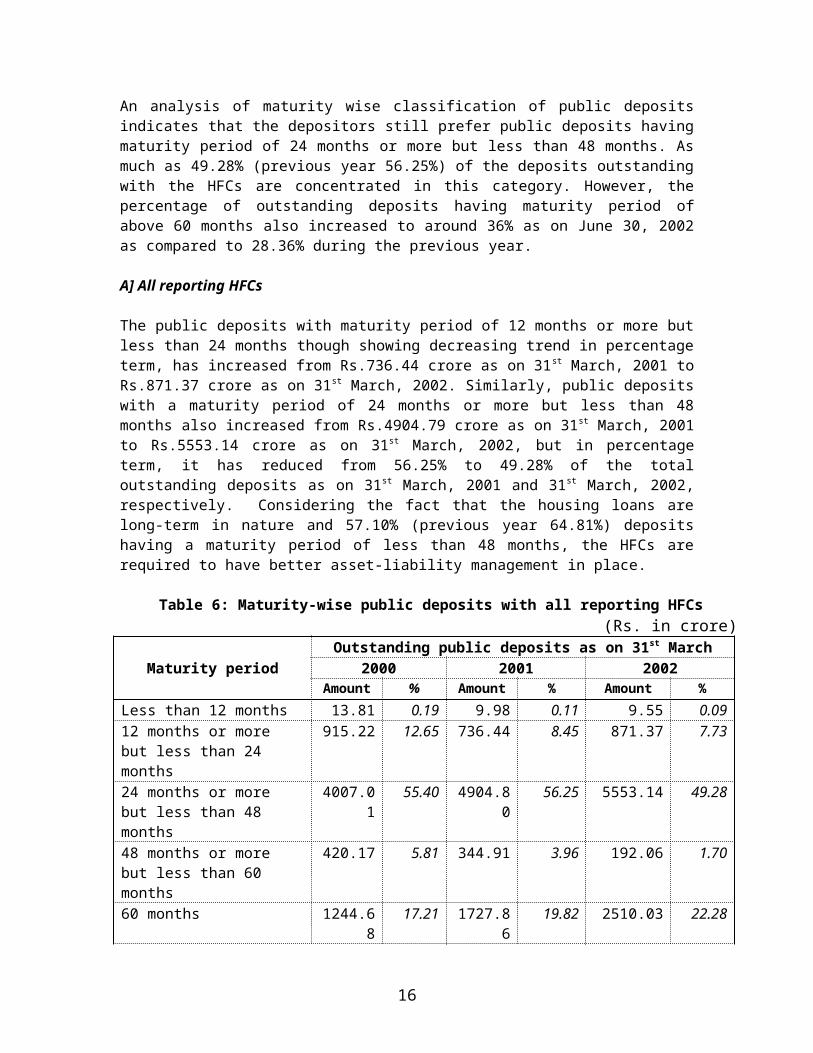
An analysis of maturity wise classification of public deposits indicates that the depositors still prefer public deposits having maturity period of 24 months or more but less than 48 months. As much as 49.28% (previous year 56.25%) of the deposits outstanding with the HFCs are concentrated in this category. However, the percentage of outstanding deposits having maturity period of above 60 months also increased to around 36% as on June 30, 2002 as compared to 28.36% during the previous year.
A] All reporting HFCs
The public deposits with maturity period of 12 months or more but less than 24 months though showing decreasing trend in percentage term, has increased from Rs.736.44 crore as on 31st March, 2001 to Rs.871.37 crore as on 31st March, 2002. Similarly, public deposits with a maturity period of 24 months or more but less than 48 months also increased from Rs.4904.79 crore as on 31st March, 2001 to Rs.5553.14 crore as on 31st March, 2002, but in percentage term, it has reduced from 56.25% to 49.28% of the total outstanding deposits as on 31st March, 2001 and 31st March, 2002, respectively. Considering the fact that the housing loans are long-term in nature and 57.10% (previous year 64.81%) deposits having a maturity period of less than 48 months, the HFCs are required to have better asset-liability management in place.
Table 6: Maturity-wise public deposits with all reporting HFCs(Rs. in crore)
Outstanding public deposits as on 31st MarchMaturity period 2000 2001 2002
Amount
% Amount
% Amount %
Less than 12 months 13.81 0.19 9.98 0.11 9.55 0.0912 months or more but less than 24 months
915.22 12.65 736.44 8.45 871.37 7.73
13
24 months or more but less than 48 months
4007.01
55.40 4904.80
56.25 5553.14 49.28
48 months or more but less than 60 months
420.17 5.81 344.91 3.96 192.06 1.70
60 months 1244.68
17.21 1727.86
19.82 2510.03 22.28
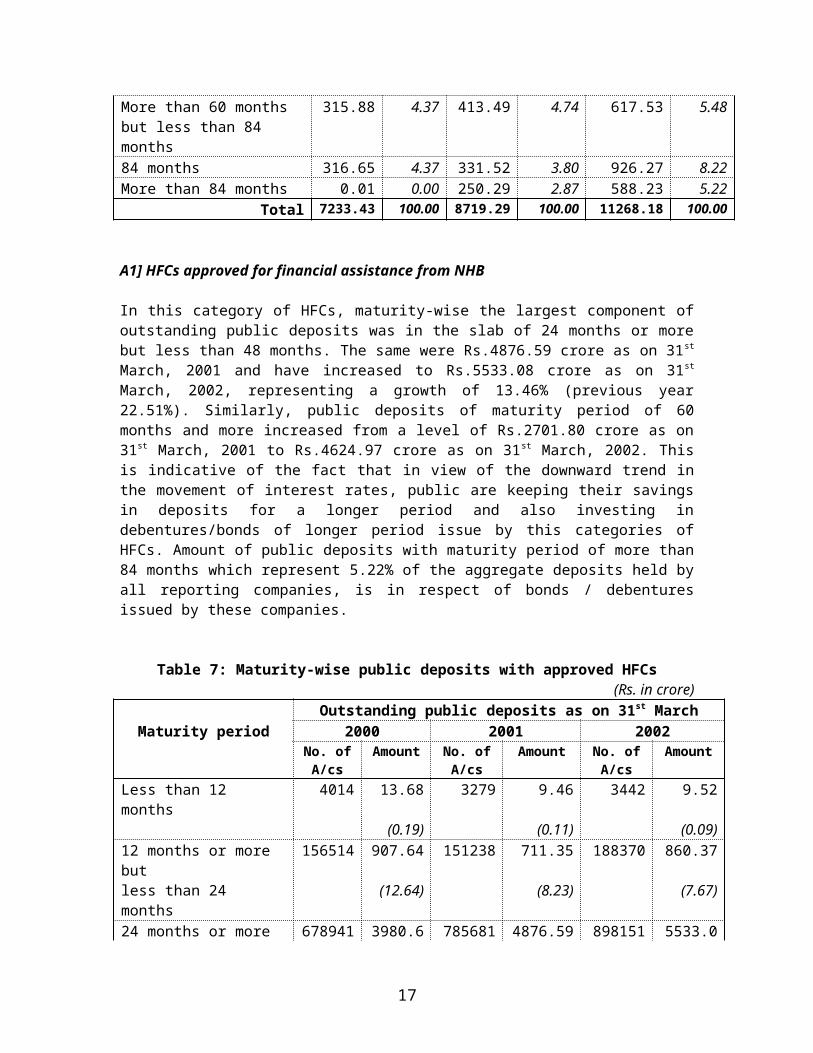
More than 60 months but less than 84 months
315.88 4.37 413.49 4.74 617.53 5.48
84 months 316.65 4.37 331.52 3.80 926.27 8.22More than 84 months 0.01 0.00 250.29 2.87 588.23 5.22
Total 7233.43
100.00
8719.29
100.00 11268.18 100.00
A1] HFCs approved for financial assistance from NHB
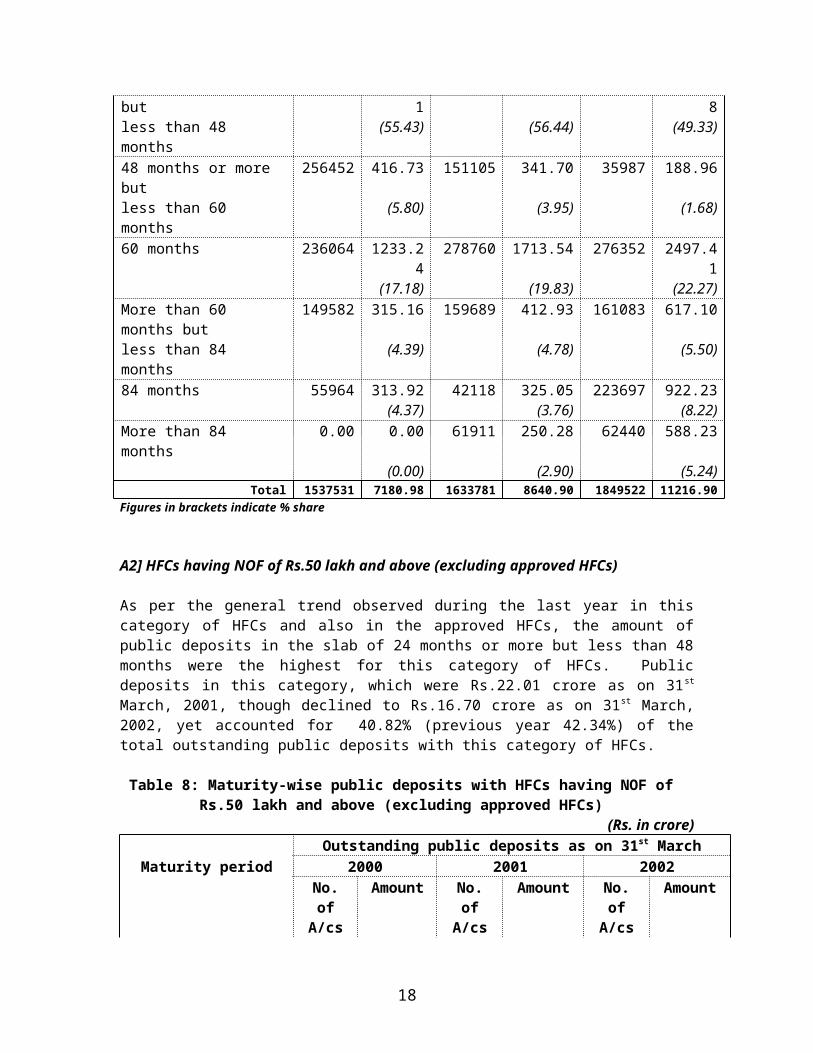
In this category of HFCs, maturity-wise the largest component of outstanding public deposits was in the slab of 24 months or more but less than 48 months. The same were Rs.4876.59 crore as on 31st March, 2001 and have increased to Rs.5533.08 crore as on 31st March, 2002, representing a growth of 13.46% (previous year 22.51%). Similarly, public deposits of maturity period of 60 months and more increased from a level of Rs.2701.80 crore as on 31st March, 2001 to Rs.4624.97 crore as on 31st March, 2002. This is indicative of the fact that in view of the downward trend in the movement of interest rates, public are keeping their savings in deposits for a longer period and also investing in debentures/bonds of longer period issue by this categories of HFCs. Amount of public deposits with maturity period of more than 84 months which represent 5.22% of the aggregate deposits held by all reporting companies, is in respect of bonds / debentures issued by these companies.
Table 7: Maturity-wise public deposits with approved HFCs(Rs. in crore)
Outstanding public deposits as on 31st MarchMaturity period 2000 2001 2002
No. of A/cs
Amount
No. of A/cs
Amount No. of A/cs
Amount
Less than 12 months 4014 13.68 3279 9.46 3442 9.52(0.19) (0.11) (0.09)
12 months or more but
156514
907.64 151238 711.35 188370 860.37
less than 24 months (12.64) (8.23) (7.67)24 months or more but
678941
3980.61
785681 4876.59 898151 5533.08
less than 48 months (55.43) (56.44) (49.33)48 months or more but
256452
416.73 151105 341.70 35987 188.96
less than 60 months (5.80) (3.95) (1.68)
14
60 months 236064
1233.24
278760 1713.54 276352 2497.41
(17.18) (19.83) (22.27)More than 60 months but
149582
315.16 159689 412.93 161083 617.10
less than 84 months (4.39) (4.78) (5.50)84 months 55964 313.92 42118 325.05 223697 922.23
(4.37) (3.76) (8.22)More than 84 months 0.00 0.00 61911 250.28 62440 588.23
(0.00) (2.90) (5.24)Total 153753
17180.98 163378
18640.90 184952
211216.9
0Figures in brackets indicate % share
A2] HFCs having NOF of Rs.50 lakh and above (excluding approved HFCs)
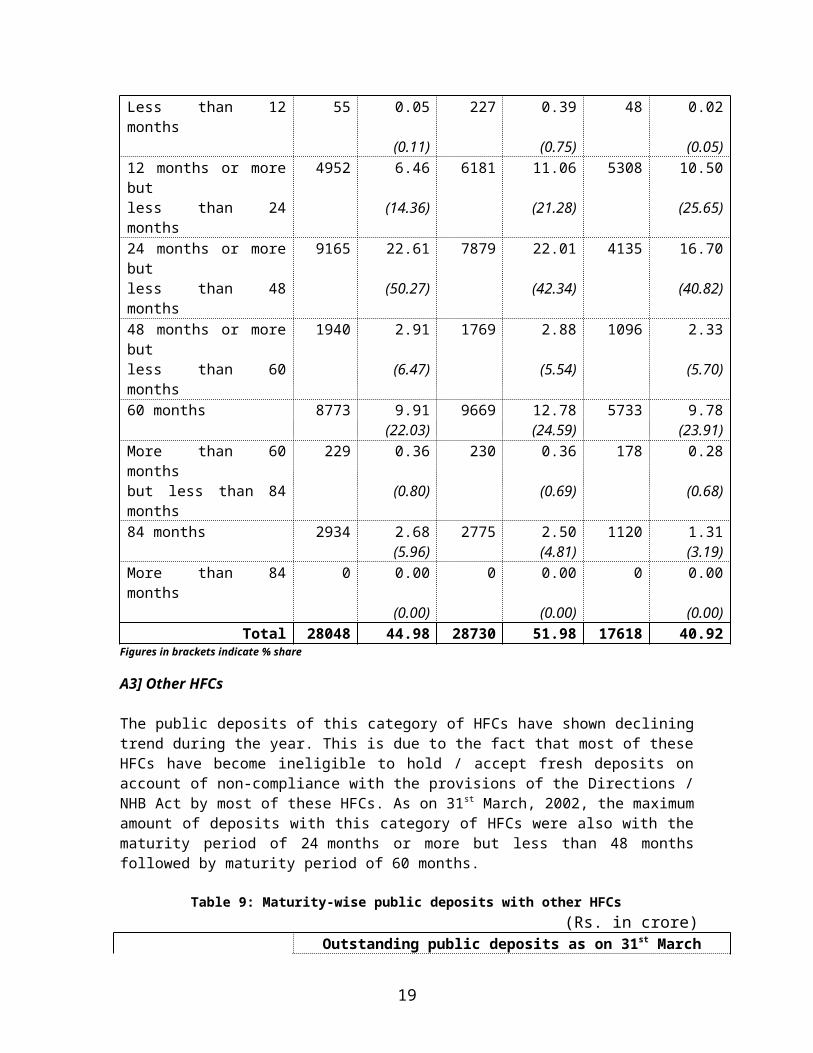
As per the general trend observed during the last year in this category of HFCs and also in the approved HFCs, the amount of public deposits in the slab of 24 months or more but less than 48 months were the highest for this category of HFCs. Public deposits in this category, which were Rs.22.01 crore as on 31st March, 2001, though declined to Rs.16.70 crore as on 31st March, 2002, yet accounted for 40.82% (previous year 42.34%) of the total outstanding public deposits with this category of HFCs.
Table 8: Maturity-wise public deposits with HFCs having NOF of Rs.50 lakh and above (excluding approved HFCs)
(Rs. in crore)Outstanding public deposits as on 31st March
Maturity period 2000 2001 2002No. of A/cs
Amount No. of A/cs
Amount No. of A/cs
Amount
Less than 12 months 55 0.05 227 0.39 48 0.02(0.11) (0.75) (0.05)
12 months or more but
4952 6.46 6181 11.06 5308 10.50
less than 24 months (14.36) (21.28) (25.65)24 months or more but
9165 22.61 7879 22.01 4135 16.70
less than 48 months (50.27) (42.34) (40.82)48 months or more but
1940 2.91 1769 2.88 1096 2.33
less than 60 months (6.47) (5.54) (5.70)60 months 8773 9.91 9669 12.78 5733 9.78
(22.03) (24.59) (23.91)More than 60 months 229 0.36 230 0.36 178 0.28but less than 84 months
(0.80) (0.69) (0.68)
84 months 2934 2.68 2775 2.50 1120 1.31
15
(5.96) (4.81) (3.19)More than 84 months 0 0.00 0 0.00 0 0.00
(0.00) (0.00) (0.00)Total 28048 44.98 28730 51.98 17618 40.92
Figures in brackets indicate % share
A3] Other HFCs
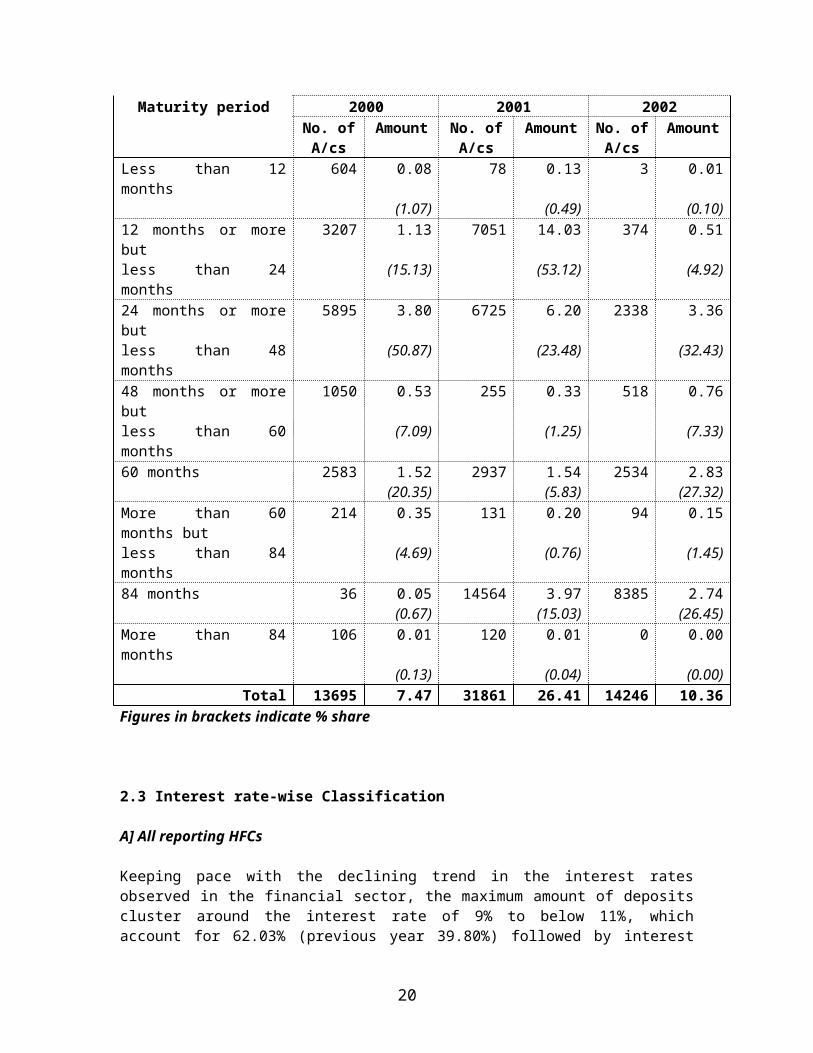
The public deposits of this category of HFCs have shown declining trend during the year. This is due to the fact that most of these HFCs have become ineligible to hold / accept fresh deposits on account of non-compliance with the provisions of the Directions / NHB Act by most of these HFCs. As on 31st
March, 2002, the maximum amount of deposits with this category of HFCs were also with the maturity period of 24 months or more but less than 48 months followed by maturity period of 60 months.
Table 9: Maturity-wise public deposits with other HFCs (Rs. in crore)
Outstanding public deposits as on 31st MarchMaturity period 2000 2001 2002
No. of A/cs
Amount
No. of A/cs
Amount
No. of A/cs
Amount
Less than 12 months 604 0.08 78 0.13 3 0.01(1.07) (0.49) (0.10)
12 months or more but
3207 1.13 7051 14.03 374 0.51
less than 24 months (15.13) (53.12) (4.92)24 months or more but
5895 3.80 6725 6.20 2338 3.36
less than 48 months (50.87) (23.48) (32.43)48 months or more but
1050 0.53 255 0.33 518 0.76
less than 60 months (7.09) (1.25) (7.33)60 months 2583 1.52 2937 1.54 2534 2.83
(20.35) (5.83) (27.32)More than 60 months but
214 0.35 131 0.20 94 0.15
less than 84 months (4.69) (0.76) (1.45)84 months 36 0.05 14564 3.97 8385 2.74
(0.67) (15.03) (26.45)More than 84 months 106 0.01 120 0.01 0 0.00
(0.13) (0.04) (0.00)Total 13695 7.47 31861 26.41 14246 10.36
Figures in brackets indicate % share
2.3 Interest rate-wise Classification
16
A] All reporting HFCs
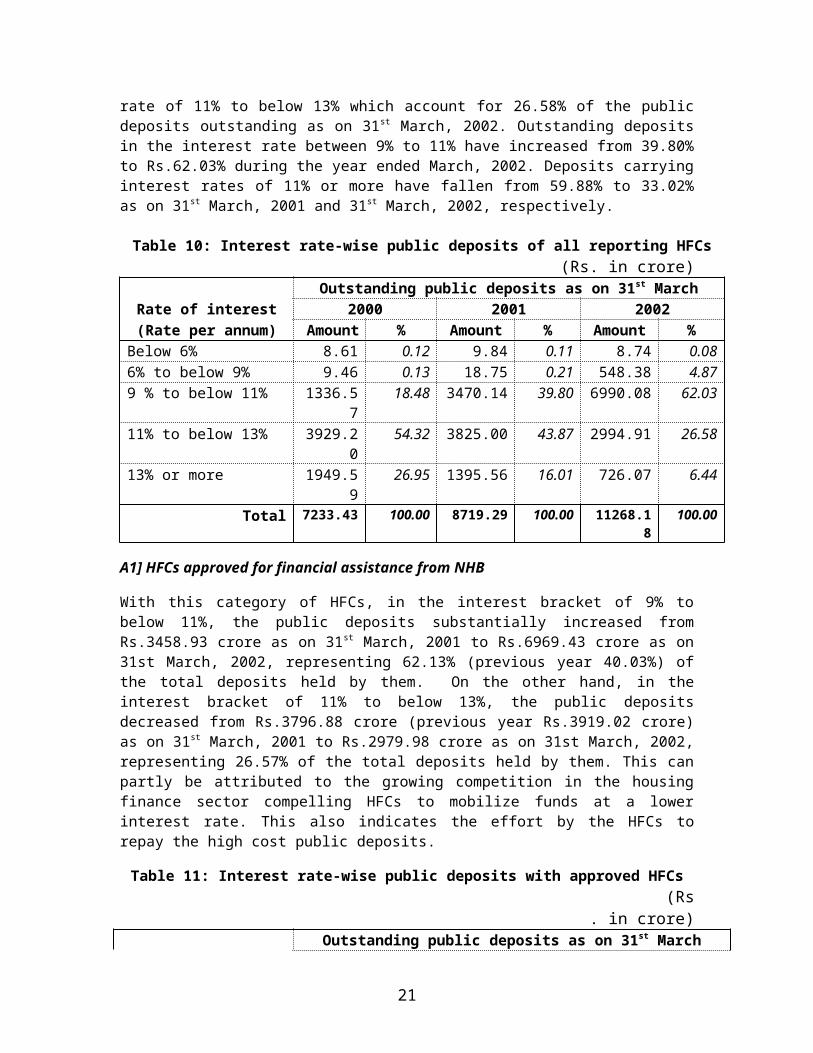
Keeping pace with the declining trend in the interest rates observed in the financial sector, the maximum amount of deposits cluster around the interest rate of 9% to below 11%, which account for 62.03% (previous year 39.80%) followed by interest rate of 11% to below 13% which account for 26.58% of the public deposits outstanding as on 31st March, 2002. Outstanding deposits in the interest rate between 9% to 11% have increased from 39.80% to Rs.62.03% during the year ended March, 2002. Deposits carrying interest rates of 11% or more have fallen from 59.88% to 33.02% as on 31st March, 2001 and 31st March, 2002, respectively.
Table 10: Interest rate-wise public deposits of all reporting HFCs(Rs. in crore)
Outstanding public deposits as on 31st MarchRate of interest 2000 2001 2002
(Rate per annum) Amount % Amount
% Amount
%
Below 6% 8.61 0.12 9.84 0.11 8.74 0.086% to below 9% 9.46 0.13 18.75 0.21 548.38 4.879 % to below 11% 1336.5
718.48 3470.14 39.80 6990.08 62.03
11% to below 13% 3929.20
54.32 3825.00 43.87 2994.91 26.58
13% or more 1949.59
26.95 1395.56 16.01 726.07 6.44
Total 7233.43
100.00 8719.29 100.00 11268.18
100.00
A1] HFCs approved for financial assistance from NHB
With this category of HFCs, in the interest bracket of 9% to below 11%, the public deposits substantially increased from Rs.3458.93 crore as on 31st
March, 2001 to Rs.6969.43 crore as on 31st March, 2002, representing 62.13% (previous year 40.03%) of the total deposits held by them. On the other hand, in the interest bracket of 11% to below 13%, the public deposits decreased from Rs.3796.88 crore (previous year Rs.3919.02 crore) as on 31st
March, 2001 to Rs.2979.98 crore as on 31st March, 2002, representing 26.57% of the total deposits held by them. This can partly be attributed to the growing competition in the housing finance sector compelling HFCs to mobilize funds at a lower interest rate. This also indicates the effort by the HFCs to repay the high cost public deposits.
Table 11: Interest rate-wise public deposits with approved HFCs (Rs. in crore)
Outstanding public deposits as on 31st MarchRate of interest 2000 2001 2002(Rate per annum) No. of
A/csAmount No. of
A/csAmount No. of
A/csAmount
Below 6% 2928 8.05 3274 9.46 3187 8.73
17
(0.11) (0.11) (0.08)6% to below 9% 11347 9.42 14167 18.63 96558 548.30
(0.13) (0.22) (4.89)9 % to below 11% 252127 1335.5
6669835 3458.9
3115864
16969.43
(18.60) (40.03) (62.13)11% to below 13% 618279 3919.0
2542522 3796.8
8439480 2979.98
(54.58) (43.94) (26.57)13% or more 652850 1908.9
3403983 1357.0
0151656 710.46
(26.58) (15.70) (6.33) Total 1537531 7180.98 163378
18640.9
0184952
211216.90
Figures in brackets indicate % share
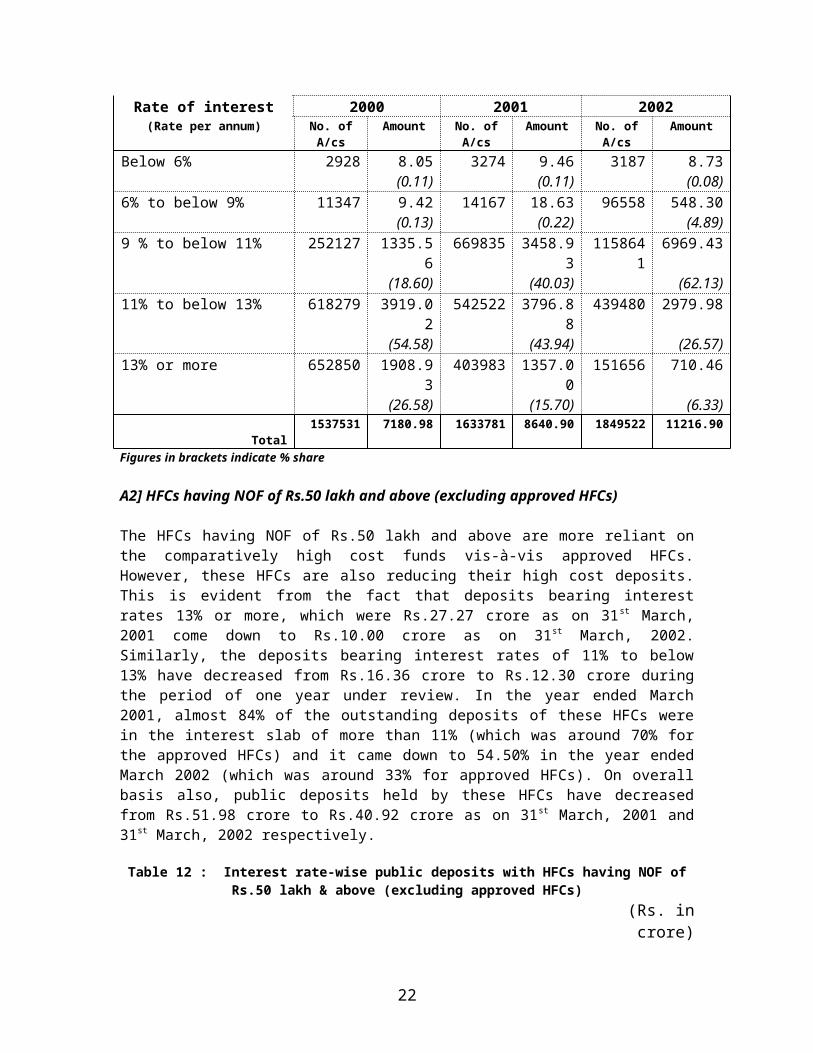
A2] HFCs having NOF of Rs.50 lakh and above (excluding approved HFCs)
The HFCs having NOF of Rs.50 lakh and above are more reliant on the comparatively high cost funds vis-à-vis approved HFCs. However, these HFCs are also reducing their high cost deposits. This is evident from the fact that deposits bearing interest rates 13% or more, which were Rs.27.27 crore as on 31st March, 2001 come down to Rs.10.00 crore as on 31st March, 2002. Similarly, the deposits bearing interest rates of 11% to below 13% have decreased from Rs.16.36 crore to Rs.12.30 crore during the period of one year under review. In the year ended March 2001, almost 84% of the outstanding deposits of these HFCs were in the interest slab of more than 11% (which was around 70% for the approved HFCs) and it came down to 54.50% in the year ended March 2002 (which was around 33% for approved HFCs). On overall basis also, public deposits held by these HFCs have decreased from Rs.51.98 crore to Rs.40.92 crore as on 31st March, 2001 and 31st March, 2002 respectively.
Table 12 : Interest rate-wise public deposits with HFCs having NOF of Rs.50 lakh & above (excluding approved HFCs)
(Rs. in crore)Outstanding public deposits as on 31st March
Rate of interest 2000 2001 2002(Rate per annum) No. of
A/csAmoun
tNo. of A/cs
Amount
No. of A/cs
Amount
Below 6% 136 0.28 2 0.00* 0 0.00(0.62) (0.00) (0.00)
6% to below 9% 4 0.01 208 0.04 194 0.08(0.02) (0.08) (0.19)
9 % to below 11% 840 0.41 4126 8.31 6740 18.54(0.91) (15.99) (45.31)
11% to below 13% 6611 9.57 8330 16.36 5095 12.30(21.28) (31.47) (30.06)
13% or more 20457 34.71 16064 27.27 5589 10.00
18
(77.17) (52.46) (24.44)Total 28048 44.98 28730 51.98 17618 40.92
Figures in brackets indicate % share*Amount less than Rs.50,000/-
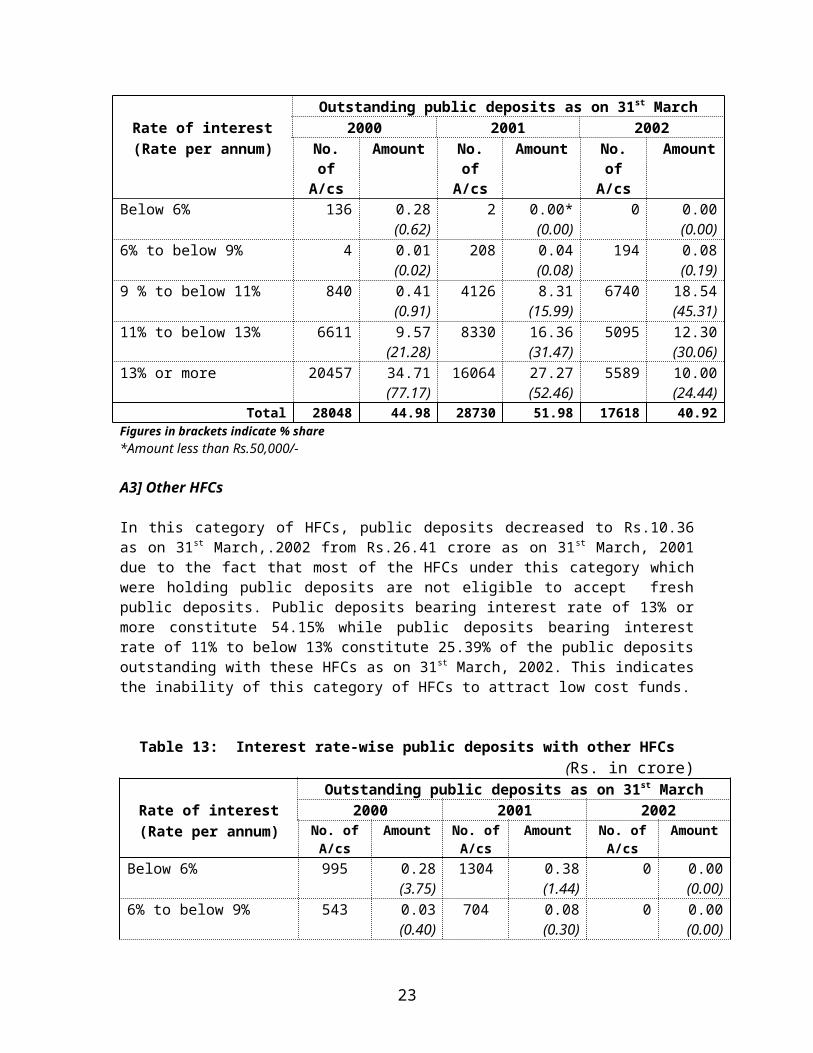
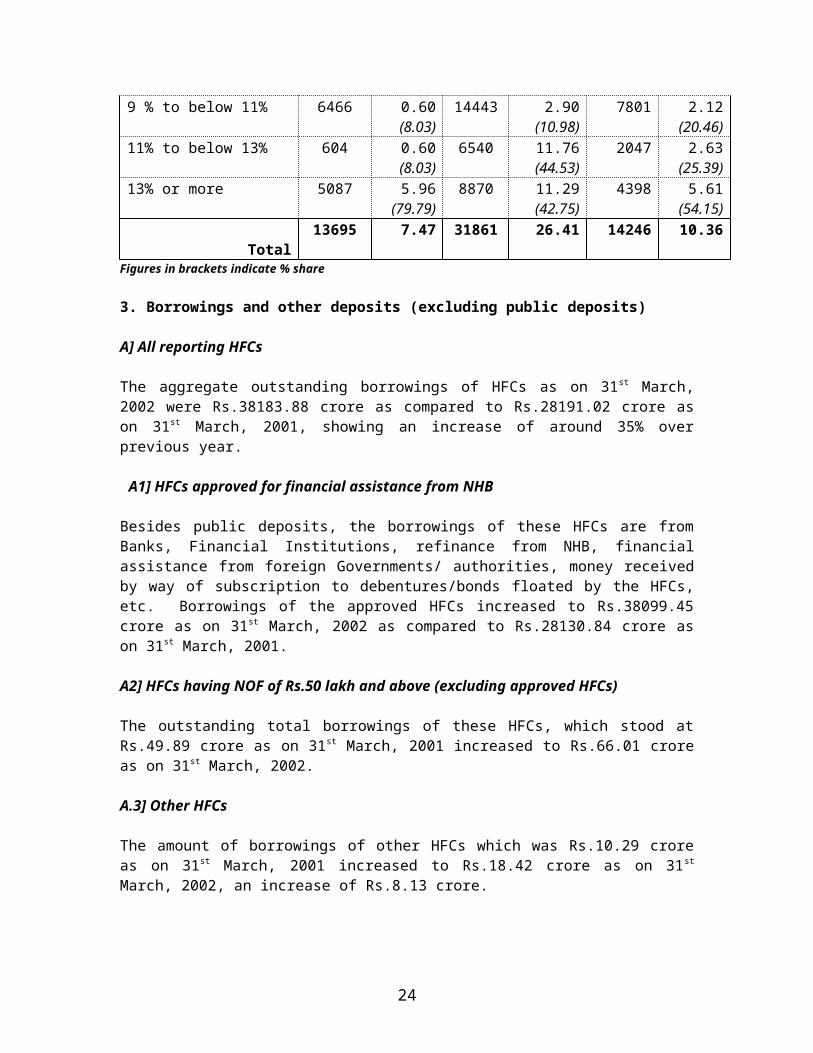
A3] Other HFCs
In this category of HFCs, public deposits decreased to Rs.10.36 as on 31 st
March,.2002 from Rs.26.41 crore as on 31st March, 2001 due to the fact that most of the HFCs under this category which were holding public deposits are not eligible to accept fresh public deposits. Public deposits bearing interest rate of 13% or more constitute 54.15% while public deposits bearing interest rate of 11% to below 13% constitute 25.39% of the public deposits outstanding with these HFCs as on 31st March, 2002. This indicates the inability of this category of HFCs to attract low cost funds.
Table 13: Interest rate-wise public deposits with other HFCs (Rs. in crore)
Outstanding public deposits as on 31st MarchRate of interest 2000 2001 2002
(Rate per annum) No. of A/cs
Amount
No. of A/cs
Amount No. of A/cs
Amount
Below 6% 995 0.28 1304 0.38 0 0.00(3.75) (1.44) (0.00)
6% to below 9% 543 0.03 704 0.08 0 0.00(0.40) (0.30) (0.00)
9 % to below 11% 6466 0.60 14443 2.90 7801 2.12(8.03) (10.98) (20.46)
11% to below 13% 604 0.60 6540 11.76 2047 2.63(8.03) (44.53) (25.39)
13% or more 5087 5.96 8870 11.29 4398 5.61(79.79) (42.75) (54.15)
Total 13695 7.47 31861 26.41 14246 10.36Figures in brackets indicate % share
3. Borrowings and other deposits (excluding public deposits)
A] All reporting HFCs
The aggregate outstanding borrowings of HFCs as on 31st March, 2002 were Rs.38183.88 crore as compared to Rs.28191.02 crore as on 31st March, 2001, showing an increase of around 35% over previous year.
A1] HFCs approved for financial assistance from NHB
Besides public deposits, the borrowings of these HFCs are from Banks, Financial Institutions, refinance from NHB, financial assistance from foreign Governments/ authorities, money received by way of subscription to debentures/bonds floated by the HFCs, etc. Borrowings of the approved HFCs
19
increased to Rs.38099.45 crore as on 31st March, 2002 as compared to Rs.28130.84 crore as on 31st March, 2001.
A2] HFCs having NOF of Rs.50 lakh and above (excluding approved HFCs)
The outstanding total borrowings of these HFCs, which stood at Rs.49.89 crore as on 31st March, 2001 increased to Rs.66.01 crore as on 31st March, 2002.
A.3] Other HFCs
The amount of borrowings of other HFCs which was Rs.10.29 crore as on 31st
March, 2001 increased to Rs.18.42 crore as on 31st March, 2002, an increase of Rs.8.13 crore.
4. Housing Loans
A] All reporting HFCs
The aggregate outstanding housing loans of all reporting HFCs, which were Rs.33249.80 crore as on 31st March, 2001 increased by 25.85% and stood at Rs.41843.65 crore as on 31st March, 2002.
A.1] HFCs approved for financial assistance from NHB
The outstanding housing loans of approved HFCs which stood at Rs.33100.96 crore as on 31st March, 2001 increased to Rs.41678.43 crore as on 31st March, 2002, an increased of Rs.8577.47 crore (25.91%).
A.2] HFCs having NOF of Rs.50 lakh and above (excluding approved HFCs)
Aggregate outstanding housing loans of this segment of HFCs stood at Rs.137.34 crore as on 31st March, 2002 as compared to Rs.127.41 crore as on 31st March, 2001, increased of 7.79%.
A.3] Other HFCs
Aggregate outstanding housing loans of these HFCs, which were Rs.21.43, crore as on 31st March, 2001 increased by 30.10% to Rs.27.88 crore as on 31st
March, 2002.
5. Other loans and advances
Other loans and advances outstanding of all reporting HFCs were Rs.9666.35 crore as on 31st March, 2002. Out of these, HUDCO accounted for Rs.8192.87
20
crore which was mainly urban and infrastructure loans. Besides, HDFC accounted for Rs.1154.31 crore which mainly included loans to companies not in the same group. Approved HFCs accounted for 99.67% of these loans and advances.
6. Investments
A] All reporting HFCs
Aggregate investments of all reporting HFCs, which stood at Rs.5325.26 crore as on 31st March, 2001, increase to Rs.5702.07 crore as on 31st March, 2002, an increase of 7.08% over previous year.
A.1] HFCs approved for financial assistance from NHB
The investments of this segment of HFCs have increased to Rs.5676.82 crore as on 31st March, 2002 from Rs.5296.89 crore as on 31st March, 2001 showing an increase of 7.17% over previous year.
A.2] HFCs having NOF of Rs.50 lakh and above
The investments of these HFCs stood at Rs.17.75 crore as on 31st March, 2002 as compared to Rs.21.77 crore as on 31st March, 2001, decline of 4.02 crore.
A.3] Other HFCs
The investments of other HFCs has also increased to Rs.7.50 crore as on 31st
March, 2002 as compared to Rs.6.60 crore as on 31st March, 2001, an increase of Rs.0.90 crore.
21
Chapter-III
Institutional Framework for Housing Finance: Scheduled Commercial Banks
The National Housing & Habitat Policy, among other things, envisaged the development of a viable and accessible institutional system for the provision of housing finance wherein housing boards and development authorities would concentrate on acquisition and development of land and infrastructure with the financial system providing easy access to more affordable institutional finance for individuals for construction/buying of houses/flats. In this context, the banking sector, with its vast branch network throughout the length and breadth of the country, occupy a very strategic position in the financial system and is expected to play an important role to play in providing credit to the housing sector.
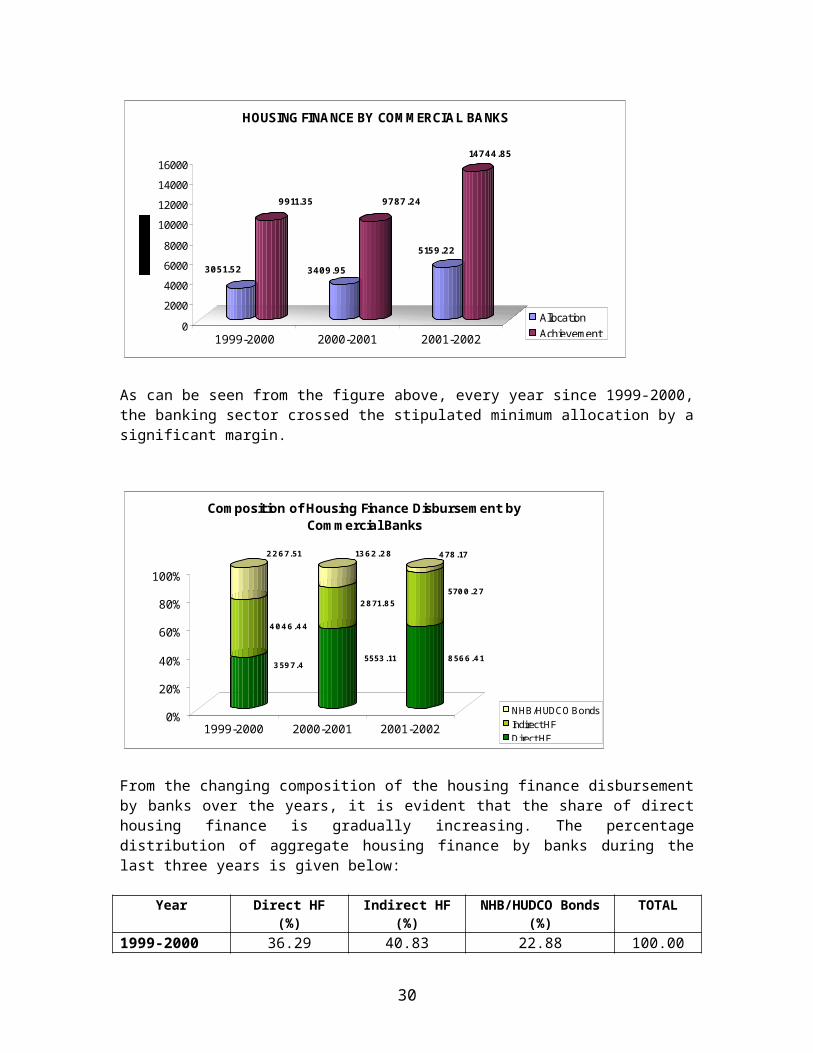
The banking sector continued with the vigor displayed in the field of housing finance in the last few years and once again surpassed the minimum yearly housing finance allocation of 3% of the incremental deposits as stipulated by the Reserve Bank of India by a considerable margin. Significantly, the aggregate housing finance by banks, inclusive of direct, indirect housing finance and subscription to NHB/HUDCO bonds, matched that of the housing finance companies during 2001-02 with the disbursal figure touching Rs.14744.85 crore as against that of Rs.14614.44 by the HFCs.
With a view to encourage the growing contribution of the banking sector in the housing finance sector in the country, the Reserve Bank of India (RBI) in the Credit and Monetary Policy in April, 2002, announced certain measures for facilitating housing finance by Banks.
Till the time banks’ loans and advances secured by mortgage on residential property and also commercial property were assigned a risk weight of 100 per cent for capital adequacy purposes. However, no explicit risk weights had been prescribed for banks’ investment in securitised papers. The Basel Capital Accord of 1988 and also the New Capital Adequacy Framework, which is at the consultative stage, envisage risk weight of 50 per cent and 100 per cent for claims secured by residential property and commercial real estate, respectively.
Accordingly, RBI also liberalised the prudential requirements for housing finance by banks on the following lines:
i) Banks extending loans against residential housing properties would be required to assign risk weight of 50 per cent, instead of present 100 per cent. Loans against the security of commercial real estate would continue to attract 100 per cent risk weight as hitherto.
ii) Investments made by banks in Mortgage Backed Securities (MBS) of residential assets by HFCs, which are recognised and supervised by NHB, would also be assigned a risk weight of 50 per cent for the purpose of capital
22
adequacy. However, investment by banks in MBS of housing assets, which include commercial properties, would attract 100 per cent risk weight.
iii) Investments by banks in MBS issued by HFCs supervised by NHB will be reckoned for inclusion in the prescribed housing finance allocation of 3.0 per cent.
iii) Besides, a Working Group was proposed to be set up to suggest modalities for widening the investor base in MBS, improving the quality of assets, creating liquidity for trading in such assets and other related issues.
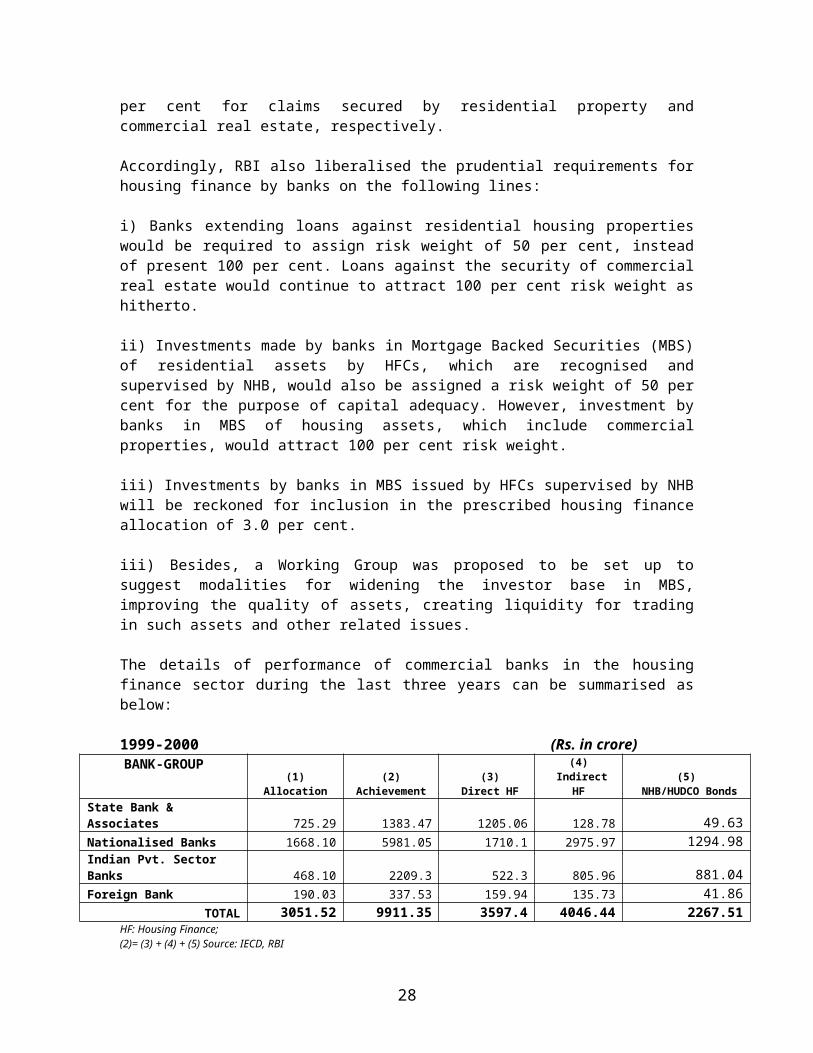
The details of performance of commercial banks in the housing finance sector during the last three years can be summarised as below:
1999-2000 (Rs. in crore) BANK-GROUP
(1) Allocation
(2) Achievement
(3) Direct HF
(4) Indirect HF
(5) NHB/HUDCO
Bonds State Bank & Associates 725.29 1383.47 1205.06 128.78 49.63Nationalised Banks 1668.10 5981.05 1710.1 2975.97 1294.98Indian Pvt. Sector Banks 468.10 2209.3 522.3 805.96 881.04Foreign Bank 190.03 337.53 159.94 135.73 41.86
TOTAL 3051.52 9911.35 3597.4 4046.44 2267.51HF: Housing Finance; (2)= (3) + (4) + (5) Source: IECD, RBI
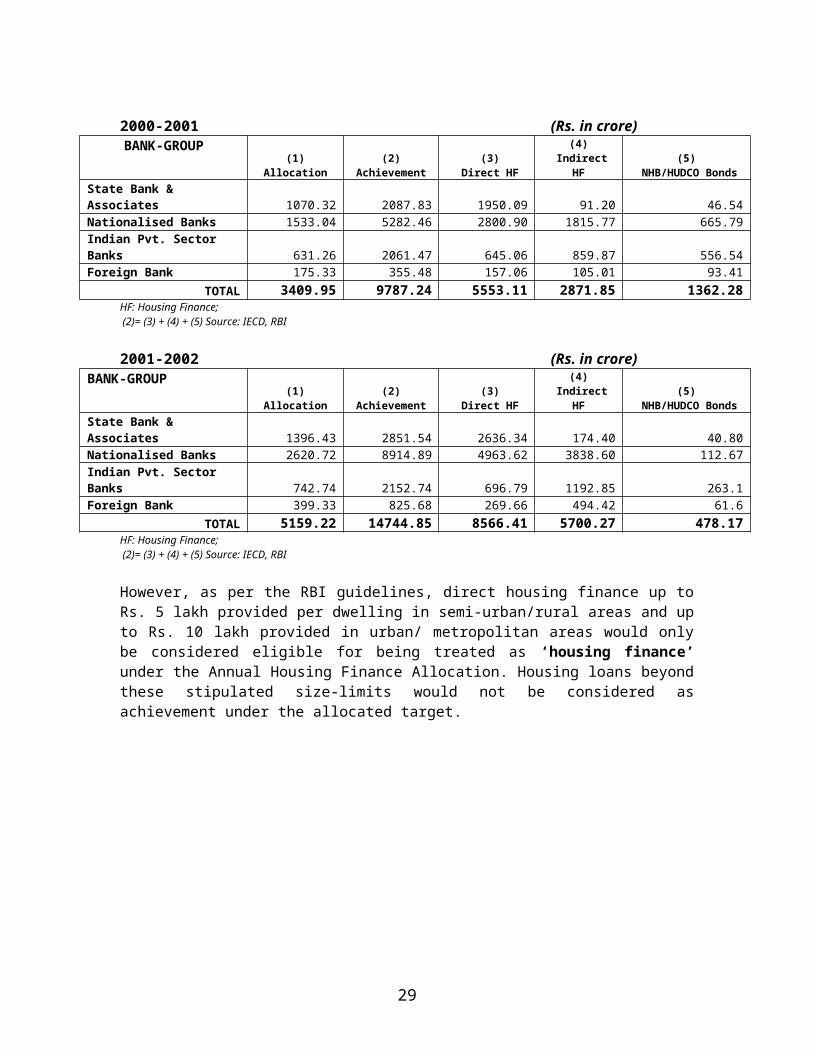
2000-2001 (Rs. in crore)BANK-GROUP
(1) Allocation
(2) Achievement
(3) Direct HF
(4) Indirect HF
(5) NHB/HUDCO
Bonds State Bank & Associates 1070.32 2087.83 1950.09 91.20 46.54Nationalised Banks 1533.04 5282.46 2800.90 1815.77 665.79Indian Pvt. Sector Banks 631.26 2061.47 645.06 859.87 556.54Foreign Bank 175.33 355.48 157.06 105.01 93.41
TOTAL 3409.95 9787.24 5553.11 2871.85 1362.28HF: Housing Finance; (2)= (3) + (4) + (5) Source: IECD, RBI
2001-2002 (Rs. in crore)BANK-GROUP
(1) Allocation
(2) Achievement
(3) Direct HF
(4) Indirect HF
(5) NHB/HUDCO
Bonds State Bank & Associates 1396.43 2851.54 2636.34 174.40 40.80Nationalised Banks 2620.72 8914.89 4963.62 3838.60 112.67Indian Pvt. Sector Banks 742.74 2152.74 696.79 1192.85 263.1Foreign Bank 399.33 825.68 269.66 494.42 61.6
TOTAL 5159.22 14744.85 8566.41 5700.27 478.17HF: Housing Finance; (2)= (3) + (4) + (5) Source: IECD, RBI
23
However, as per the RBI guidelines, direct housing finance up to Rs. 5 lakh provided per dwelling in semi-urban/rural areas and up to Rs. 10 lakh provided in urban/ metropolitan areas would only be considered eligible for being treated as ‘housing finance’ under the Annual Housing Finance Allocation. Housing loans beyond these stipulated size-limits would not be considered as achievement under the allocated target.
3051.52
9911.35
3409.95
9787.24
5159.22
14744.85
02000400060008000
10000120001400016000
1999-2000 2000-2001 2001-2002
HOUSING FINANCE BY COMMERCIAL BANKS
AllocationAchievement
As can be seen from the figure above, every year since 1999-2000, the banking sector crossed the stipulated minimum allocation by a significant margin.
3597.4
4046.44
2267.51
5553.11
2871.85
1362.28
8566.41
5700.27
478.17
0%
20%
40%
60%
80%
100%
1999-2000 2000-2001 2001-2002
Composition of Housing Finance Disbursement by Commercial Banks
NHB/HUDCO BondsIndirect HFDirect HF
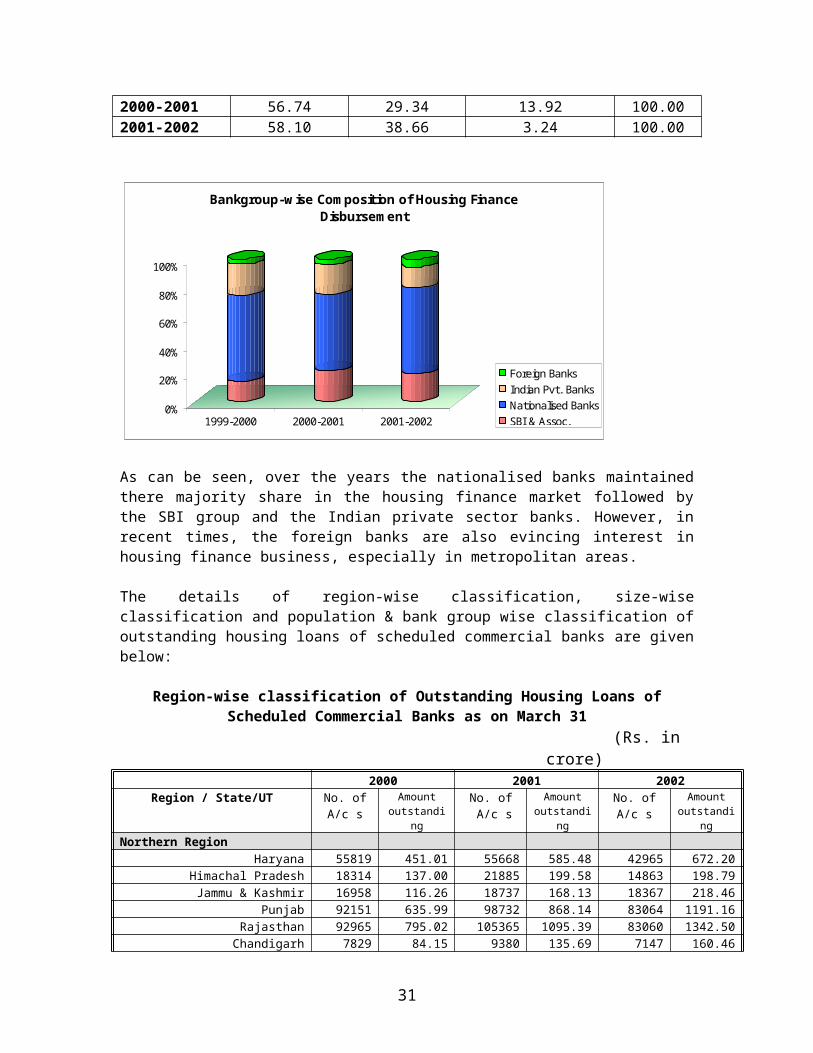
From the changing composition of the housing finance disbursement by banks over the years, it is evident that the share of direct housing finance is
24
gradually increasing. The percentage distribution of aggregate housing finance by banks during the last three years is given below:
Year Direct HF (%)
Indirect HF (%)
NHB/HUDCO Bonds (%)
TOTAL
1999-2000 36.29 40.83 22.88 100.002000-2001 56.74 29.34 13.92 100.002001-2002 58.10 38.66 3.24 100.00
0%
20%
40%
60%
80%
100%
1999-2000 2000-2001 2001-2002
Bankgroup-wise Composition of Housing Finance Disbursement
Foreign Banks Indian Pvt. BanksNationalised BanksSBI & Assoc.
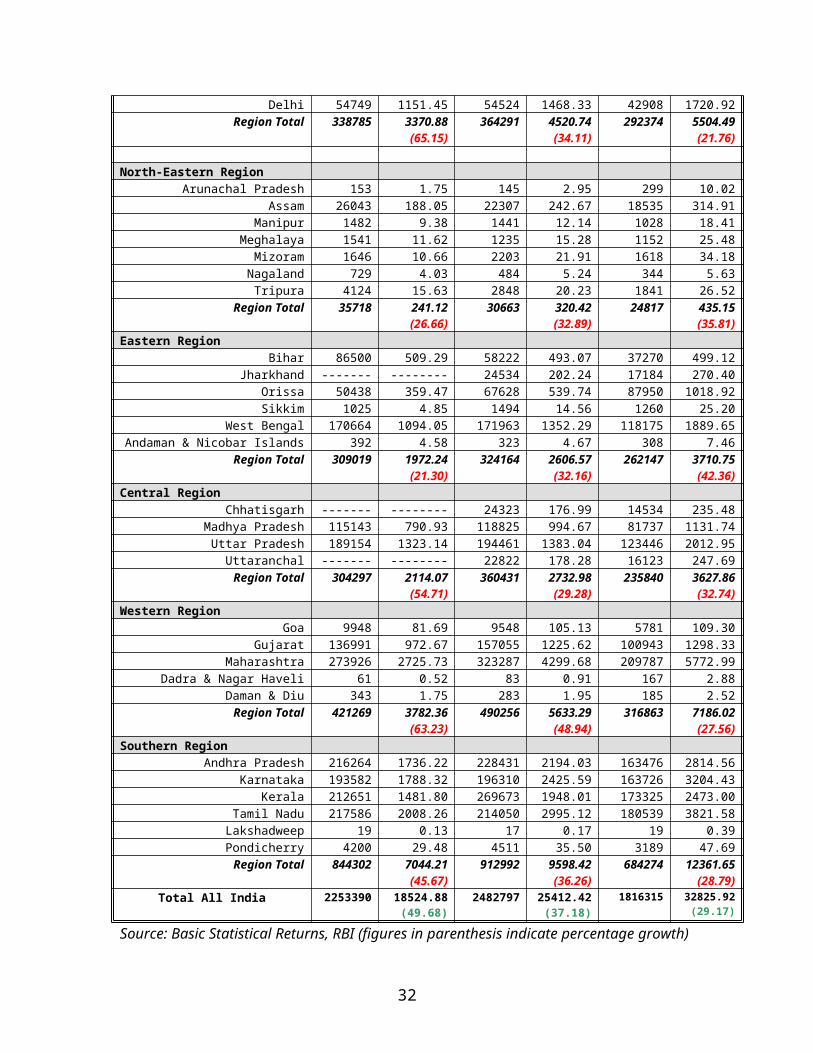
As can be seen, over the years the nationalised banks maintained there majority share in the housing finance market followed by the SBI group and the Indian private sector banks. However, in recent times, the foreign banks are also evincing interest in housing finance business, especially in metropolitan areas.
The details of region-wise classification, size-wise classification and population & bank group wise classification of outstanding housing loans of scheduled commercial banks are given below:
Region-wise classification of Outstanding Housing Loans of Scheduled Commercial Banks as on March 31
(Rs. in crore)2000 2001 2002
Region / State/UT No. of A/c s
Amountoutstandin
g
No. of A/c s
Amountoutstandin
g
No. of A/c s
Amountoutstandin
gNorthern Region
Haryana 55819 451.01 55668 585.48 42965 672.20Himachal Pradesh 18314 137.00 21885 199.58 14863 198.79Jammu & Kashmir 16958 116.26 18737 168.13 18367 218.46
Punjab 92151 635.99 98732 868.14 83064 1191.16Rajasthan 92965 795.02 105365 1095.39 83060 1342.50
Chandigarh 7829 84.15 9380 135.69 7147 160.46Delhi 54749 1151.45 54524 1468.33 42908 1720.92
25
Region Total 338785 3370.88(65.15)
364291 4520.74(34.11)
292374 5504.49(21.76)
North-Eastern RegionArunachal Pradesh 153 1.75 145 2.95 299 10.02
Assam 26043 188.05 22307 242.67 18535 314.91Manipur 1482 9.38 1441 12.14 1028 18.41
Meghalaya 1541 11.62 1235 15.28 1152 25.48Mizoram 1646 10.66 2203 21.91 1618 34.18
Nagaland 729 4.03 484 5.24 344 5.63Tripura 4124 15.63 2848 20.23 1841 26.52
Region Total 35718 241.12(26.66)
30663 320.42(32.89)
24817 435.15(35.81)
Eastern RegionBihar 86500 509.29 58222 493.07 37270 499.12
Jharkhand ------- -------- 24534 202.24 17184 270.40Orissa 50438 359.47 67628 539.74 87950 1018.92Sikkim 1025 4.85 1494 14.56 1260 25.20
West Bengal 170664 1094.05 171963 1352.29 118175 1889.65Andaman & Nicobar Islands 392 4.58 323 4.67 308 7.46
Region Total 309019 1972.24(21.30)
324164 2606.57(32.16)
262147 3710.75(42.36)
Central RegionChhatisgarh ------- -------- 24323 176.99 14534 235.48
Madhya Pradesh 115143 790.93 118825 994.67 81737 1131.74Uttar Pradesh 189154 1323.14 194461 1383.04 123446 2012.95
Uttaranchal ------- -------- 22822 178.28 16123 247.69Region Total 304297 2114.07
(54.71)360431 2732.98
(29.28)235840 3627.86
(32.74)Western Region
Goa 9948 81.69 9548 105.13 5781 109.30Gujarat 136991 972.67 157055 1225.62 100943 1298.33
Maharashtra 273926 2725.73 323287 4299.68 209787 5772.99Dadra & Nagar Haveli 61 0.52 83 0.91 167 2.88
Daman & Diu 343 1.75 283 1.95 185 2.52Region Total 421269 3782.36
(63.23)490256 5633.29
(48.94)316863 7186.02
(27.56)Southern Region
Andhra Pradesh 216264 1736.22 228431 2194.03 163476 2814.56Karnataka 193582 1788.32 196310 2425.59 163726 3204.43
Kerala 212651 1481.80 269673 1948.01 173325 2473.00Tamil Nadu 217586 2008.26 214050 2995.12 180539 3821.58
Lakshadweep 19 0.13 17 0.17 19 0.39Pondicherry 4200 29.48 4511 35.50 3189 47.69
Region Total 844302 7044.21(45.67)
912992 9598.42(36.26)
684274 12361.65
(28.79)Total All India 225339
018524.88
(49.68)2482797 25412.4
2(37.18)
1816315 32825.92(29.17)
Source: Basic Statistical Returns, RBI (figures in parenthesis indicate percentage growth)
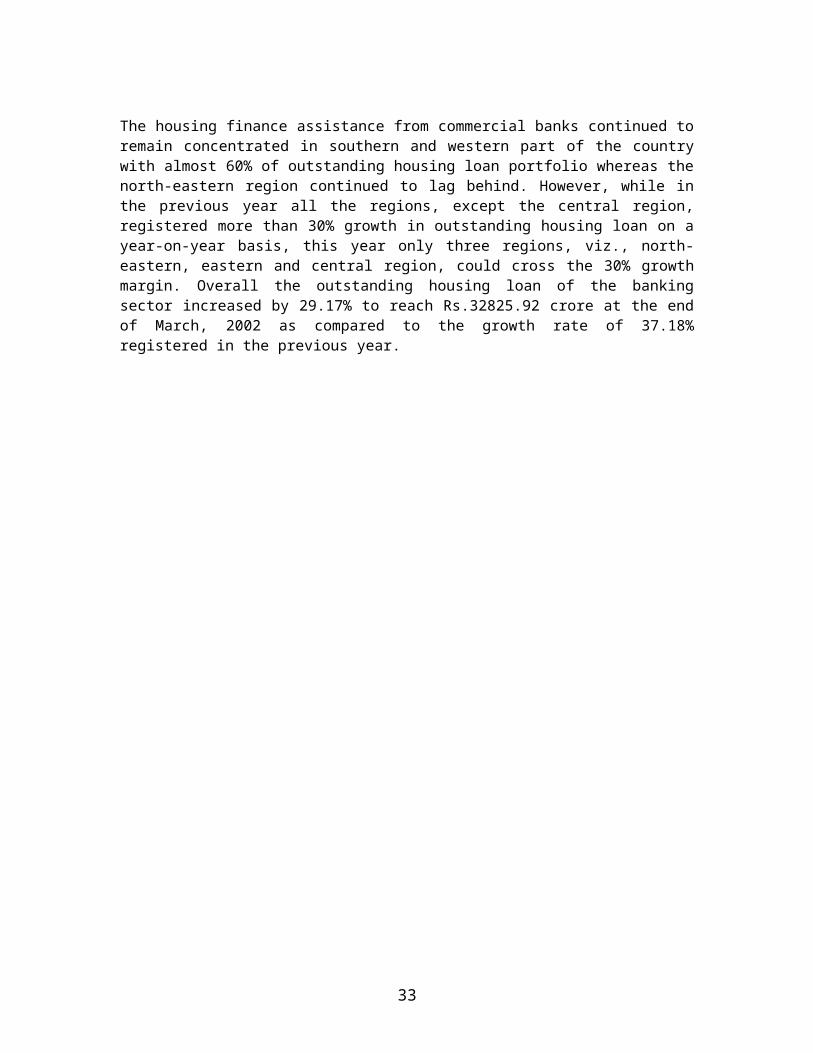
The housing finance assistance from commercial banks continued to remain concentrated in southern and western part of the country with almost 60% of outstanding housing loan portfolio whereas the north-eastern region continued to lag behind. However, while in the previous year all the regions,
26
except the central region, registered more than 30% growth in outstanding housing loan on a year-on-year basis, this year only three regions, viz., north-eastern, eastern and central region, could cross the 30% growth margin. Overall the outstanding housing loan of the banking sector increased by 29.17% to reach Rs.32825.92 crore at the end of March, 2002 as compared to the growth rate of 37.18% registered in the previous year.
27
Size-wise classification of Outstanding Housing Loans ofScheduled Commercial Banks as on March 31
(Rs. in crore)Loan Slab 2000 2001 2002
No. of A/cs
Amount
No. of A/cs
Amount
No. of A/cs
Amount
Rs.25,000 and Below 417271 454.36 536572 552.09 244376 280.1Above Rs.25,000 and
Upto Rs.2 Lakh1627721 8919.06 1620279 9543.99 1133744 10840.76
Above Rs.2 Lakh and Upto Rs.5Lakh
185519 5497.72 285328 9232.89 350284 10979.69
Above Rs.5 Lakh and Upto Rs.10 Lakh
17735 1140.31 30933 1996.41 67146 4305.7
Above Rs. 10 Lakh and Upto Rs.25 Lakh
3873 496.60 7639 1053.29 16870 2197.86
Above Rs. 25 Lakh and Upto Rs.50 Lakh
712 183.62 1278 322.53 2773 772.71
Above Rs. 50 Lakh and Upto Rs.1Crore
280 141.52 380 208.27 610 314.19
Above Rs. 1 Crore and Upto Rs. 4 Crore
171 298.29 252 432.40 344 482.56
Above Rs. 4 Crore and Upto Rs. 6 Crore
49 192.92 49 198.42 55 182.28
Above Rs. 6 Crore and Upto Rs.10 Crore
25 192.12 25 183.60 40 219.55
Above Rs. 10 Crore and Upto Rs. 25 Crore
19 335.95 41 642.79 37 496.48
Above Rs. 25 Crore 15 672.41 21 1045.74 36 1754.04Total 225339
018524.8
8248279
725412.4
2181631
532825.9
2Source: Basic Statistical Returns, RBI
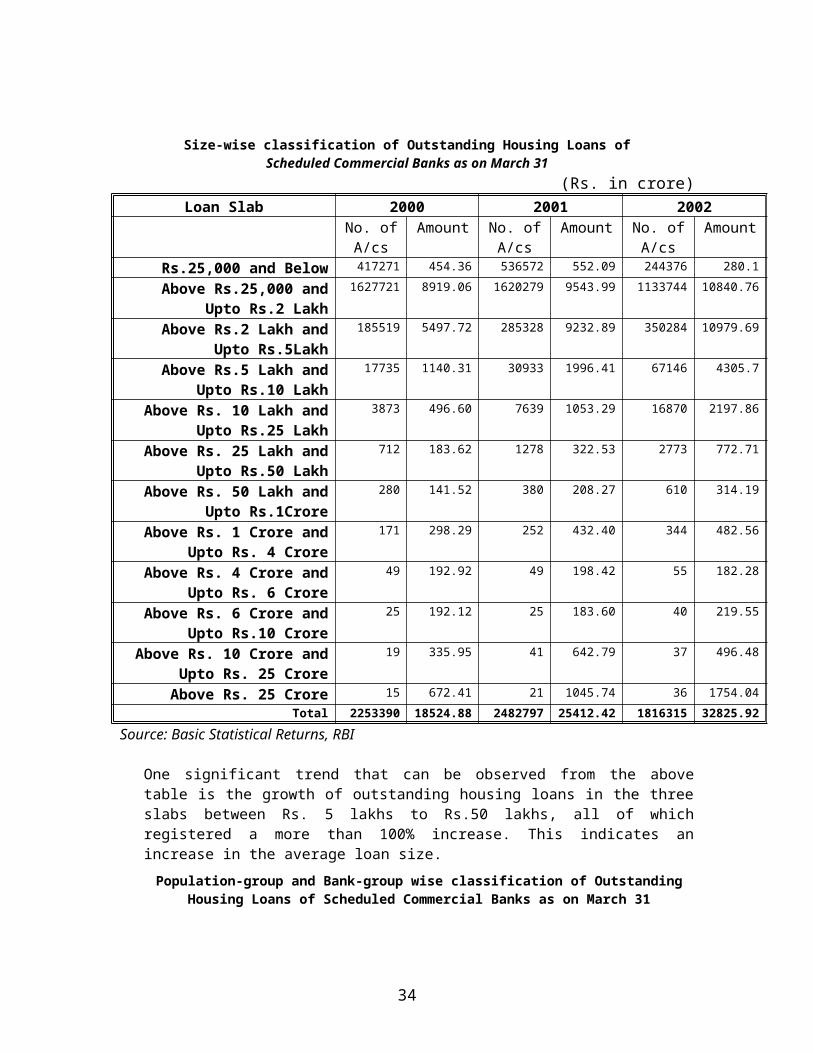
One significant trend that can be observed from the above table is the growth of outstanding housing loans in the three slabs between Rs. 5 lakhs to Rs.50 lakhs, all of which registered a more than 100% increase. This indicates an increase in the average loan size.
Population-group and Bank-group wise classification of Outstanding Housing Loans of Scheduled Commercial Banks as on March 31
(Rs. in crore)2000 2001 2002
No. of A/cs
Amount No. of A/cs
Amount No. of A/cs Amount
RURAL ------------ ------------- ------------ ------------- -------------- ------------- SBI & Associates 71286 431.22 87817 681.09 76727 1079.28
-Nationalised Banks 220578 1125.83 193457 1405.43 137200 1480.97-Foreign Banks 13 3.03 7 0.26 79 4.54
-RRBs 64549 198.45 70941 274.24 63566 430.77
28
-Other SCBs 18761 148.41 20152 172.81 14634 164.31TOTAL 375187 1906.94 372374 2533.83 292206 3159.87
SEMI-URBAN ----------- ----------- ------------ ------------ ------------ ------------- SBI & Associates 241312 1728.17 266044 2298.08 199183 3124.50
-Nationalised Banks 276716 1771.59 266158 2289.99 191234 2523.65-Foreign Banks 0 0 0 0 0 0
-RRBs 39174 184.90 64334 279.54 42065 364.21-Other SCBs 66465 461.12 102965 638.56 47815 681.86
TOTAL 623667 4145.78 699501 5506.17 480297 6694.22URBAN ----------- ----------- ----------- ----------- ------------ ------------
- SBI & Associates 238862 2233.81 298573 3000.58 213726 4105.66-Nationalised Banks 395436 2857.76 390640 3738.76 290572 4840.53
-Foreign Banks 43 2.53 576 32.01 452 27.45-RRBs 35240 189.09 58126 257.50 48762 313.67
-Other SCBs 37693 298.50 47014 397.01 35129 503.10TOTAL 707274 5581.69 794929 7425.86 588641 9790.41
METROPOLITAN ----------- ----------- ----------- ----------- ------------ ------------- SBI & Associates 121686 1434.70 155555 1999.05 110507 2833.09
-Nationalised Banks 337978 3601.09 386982 5250.45 272989 6618.93-Foreign Banks 57753 1244.63 34793 1979.67 38221 2886.44
-RRBs 904 12.04 795 13.45 1211 19.65-Other SCBs 28941 597.97 37868 703.94 32243 823.31
TOTAL 547262 6890.43 615993 9946.56 455171 13181.42All-INDIA ----------- ----------- ----------- ----------- ------------ ------------
- SBI & Associates 673146 5827.89 807989 7978.80 600143 11142.53-Nationalised Banks 1230708 9356.27 1237237 12684.63 891995 15464.08
-Foreign Banks 57809 1250.22 35376 2011.94 38752 2918.43-RRBs 139867 584.48 194196 824.73 155604 1128.30
-Other SCBs 151860 1506.02 207999 1912.32 129821 2172.58TOTAL 2253390 18524.88 2482797 25412.4
21816315 32825.92
Source: Basic Statistical Returns, RBI
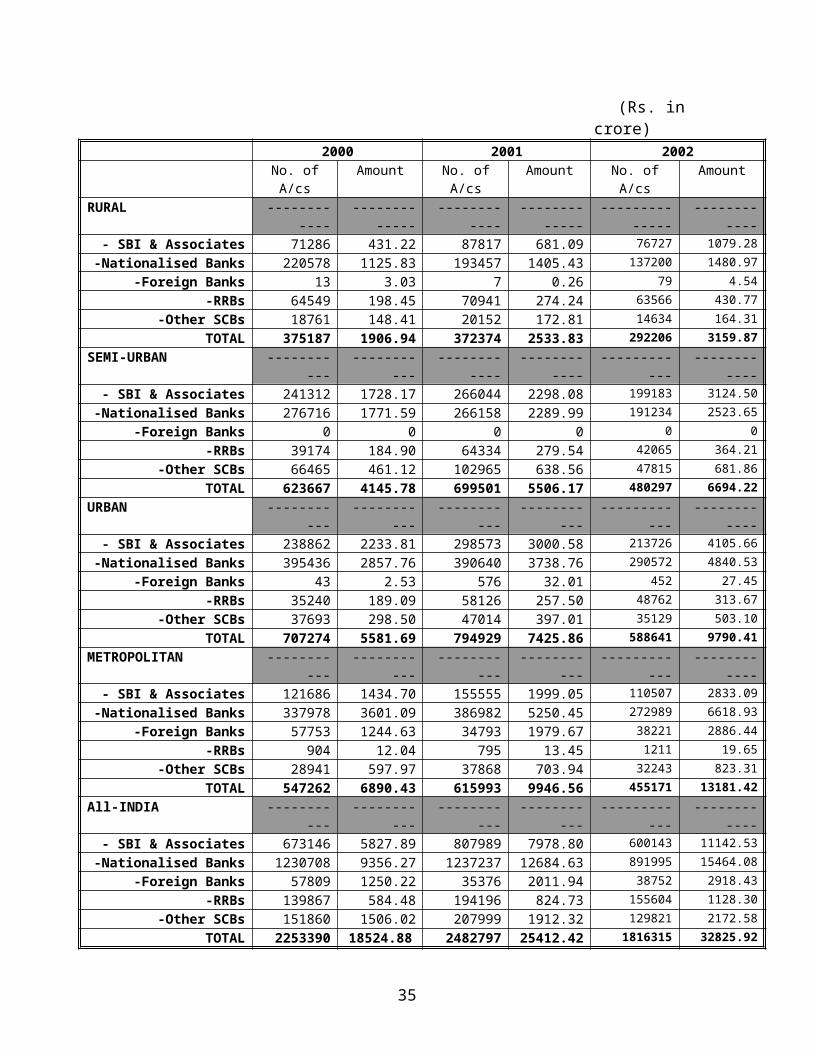
The above analysis indicates that the growth in outstanding housing loans is highest in case of metropolitan areas. Overall, at the end of the financial year 2001-02, the outstanding housing loans of scheduled commercial banks was 6.12% of the outstanding gross bank credit, which was an improvement from 4.83% as at the end of the previous fiscal.
29
Chapter-IV
Institutional Framework for Housing Finance: Cooperative Sector
Apex Cooperative Housing Federations (ACHFs)
The cooperative housing movement in India was started in the early 20th
century to fulfil the desire of a ‘common man’ of owning a decent home. In the nine decades of its existence, it has made significant progress in providing affordable housing with easy accessibility to finance for lakhs of families. At present there are 92,000 housing cooperatives at the grass-root level with a membership of about 65 lakh all over the country represented by 26 Apex Co-operative Housing Federations (ACHFs) at the state / union territory level. The National Co-operative Housing Federation of India (NCHF) has been promoting, guiding and coordinating the activities of housing cooperatives at the national level since its inception in 1969. In all 26 ACHFs are currently members of NCHF.
However, even the housing cooperatives are playing a commendable role in mitigating the housing problems in the country; their performance is highly constrained by the fund shortage, land scarcity and legal bottlenecks. During the year, NCHF took a number of initiatives for increasing the flow of funds in this sector at affordable rates. Besides, it also organized the national level Cooperative Housing Congress, drafted the Model Cooperative Housing Societies Law and also completed a study on “Assessment of Housing Stock in the Country” and the Report on Capacity Building of ACHFs.
So far, an amount of around Rs. 7500 crore has been disbursed by these ACHFs to enable construction of more than 22 lakh dwelling units in the country. Presently, the ACHFs are advancing an amount of approximately Rs. 750 crore a year.
The composition of resource mobilization by the ACHFs during the last 5 years is detailed below:
Table 5.1: Borrowings of Apex Co-operative Housing Federations (cumulative) (Rs. In crore)Year LIC NHB HUDCO State
Govt.Deposits Banks Debenture
s Others Total
1997-98 2606.48 280.17 721.91 185.29 162.71 349.73 142.60 58.31 4507.20
1998-99 2702.48 330.52 922.33 49.07 157.90 565.15 142.60 87.09 4957.14
1999-00 2835.71 440.12 1176.71 48.97 185.77 748.60 142.60 112.28 5690.76
2000-01 2985.65
483.06 1449.42
50.13 156.63 982.00 145.26 179.57
6431.72
2001-02 3121.81
595.06 1514.84
50.13 130.59 1184.17 142.60 283.40
7022.60
30
Source: National Cooperative Housing Federation of India; NHB data as at the end of June
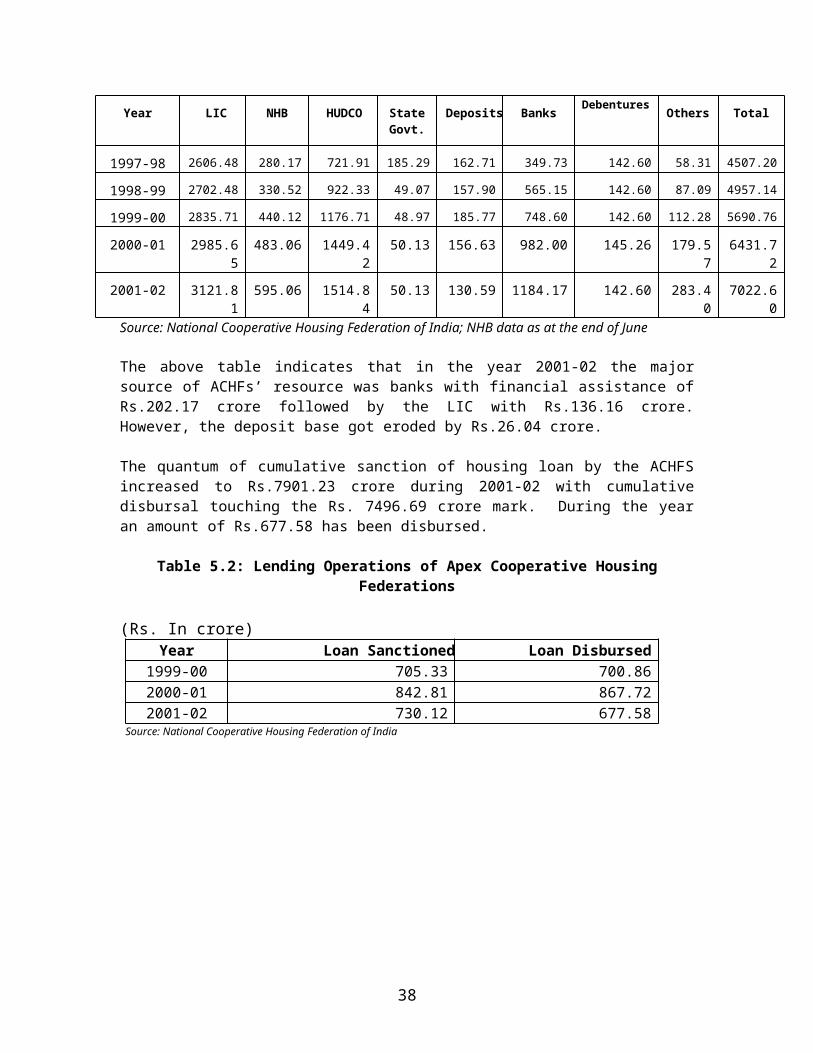
The above table indicates that in the year 2001-02 the major source of ACHFs’ resource was banks with financial assistance of Rs.202.17 crore followed by the LIC with Rs.136.16 crore. However, the deposit base got eroded by Rs.26.04 crore.
The quantum of cumulative sanction of housing loan by the ACHFS increased to Rs.7901.23 crore during 2001-02 with cumulative disbursal touching the Rs. 7496.69 crore mark. During the year an amount of Rs.677.58 has been disbursed.
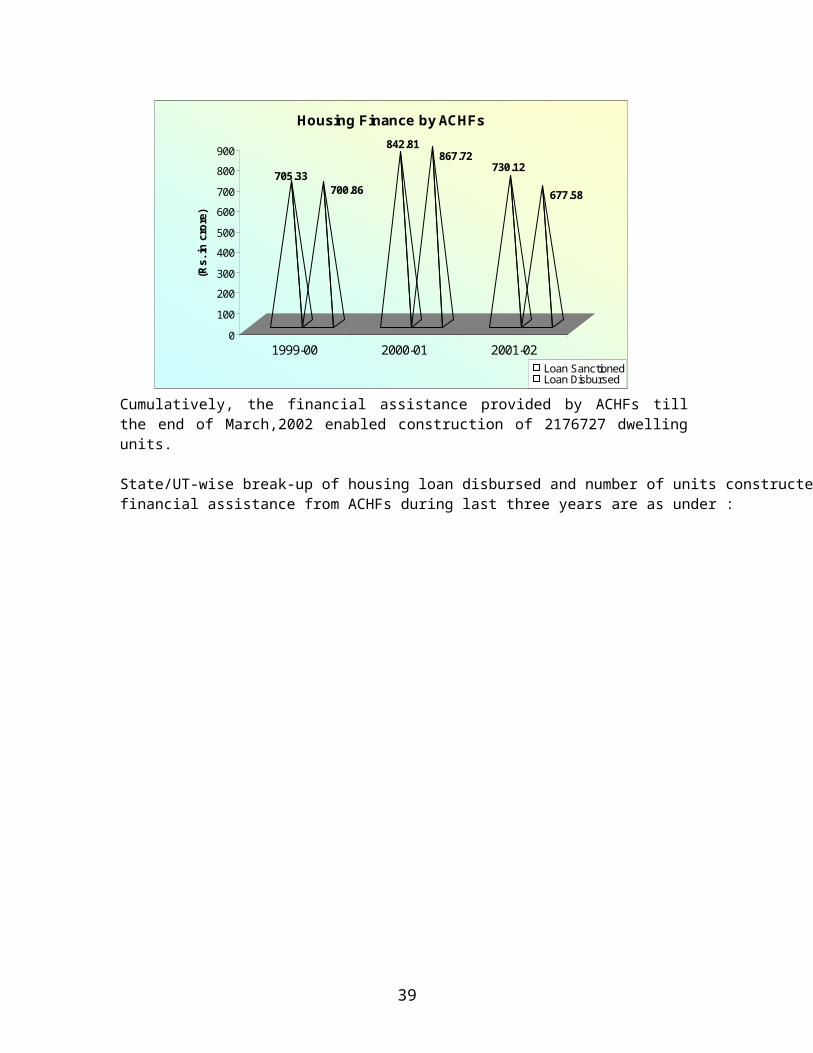
Table 5.2: Lending Operations of Apex Cooperative Housing Federations
(Rs. In crore)Year Loan Sanctioned Loan Disbursed
1999-00 705.33 700.862000-01 842.81 867.722001-02 730.12 677.58
Source: National Cooperative Housing Federation of India
705.33700.86
842.81867.72
730.12
677.58
0
100
200
300
400
500
600
700
800
900
(Rs.
in c
rore
)
1999-00 2000-01 2001-02
Housing Finance by ACHFs
Loan SanctionedLoan Disbursed
Cumulatively, the financial assistance provided by ACHFs till the end of March,2002 enabled construction of 2176727 dwelling units.
State/UT-wise break-up of housing loan disbursed and number of units constructed with financial assistance from ACHFs during last three years are as under :
31
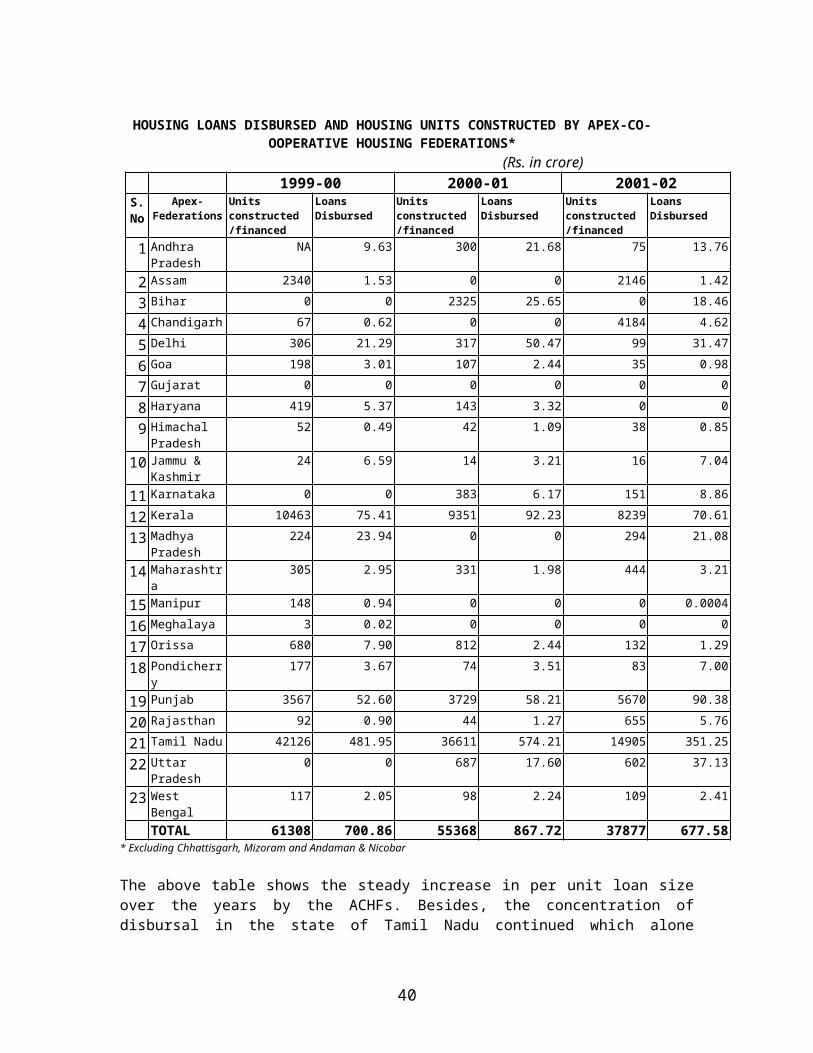
HOUSING LOANS DISBURSED AND HOUSING UNITS CONSTRUCTED BY APEX-CO-OOPERATIVE HOUSING FEDERATIONS*
(Rs. in crore)1999-00 2000-01 2001-02
S.No
Apex-Federations
Units constructed/financed
Loans Disbursed
Units constructed/financed
Loans Disbursed
Units constructed/financed
Loans Disbursed
1 Andhra Pradesh
NA 9.63 300 21.68 75 13.76
2 Assam 2340 1.53 0 0 2146 1.423 Bihar 0 0 2325 25.65 0 18.464 Chandigarh 67 0.62 0 0 4184 4.625 Delhi 306 21.29 317 50.47 99 31.476 Goa 198 3.01 107 2.44 35 0.987 Gujarat 0 0 0 0 0 08 Haryana 419 5.37 143 3.32 0 09 Himachal
Pradesh52 0.49 42 1.09 38 0.85
10 Jammu & Kashmir
24 6.59 14 3.21 16 7.04
11 Karnataka 0 0 383 6.17 151 8.8612 Kerala 10463 75.41 9351 92.23 8239 70.6113 Madhya
Pradesh224 23.94 0 0 294 21.08
14 Maharashtra
305 2.95 331 1.98 444 3.21
15 Manipur 148 0.94 0 0 0 0.000416 Meghalaya 3 0.02 0 0 0 017 Orissa 680 7.90 812 2.44 132 1.2918 Pondicherry 177 3.67 74 3.51 83 7.0019 Punjab 3567 52.60 3729 58.21 5670 90.3820 Rajasthan 92 0.90 44 1.27 655 5.7621 Tamil Nadu 42126 481.95 36611 574.21 14905 351.2522 Uttar
Pradesh0 0 687 17.60 602 37.13
23 West Bengal
117 2.05 98 2.24 109 2.41
TOTAL 61308 700.86 55368 867.72 37877 677.58* Excluding Chhattisgarh, Mizoram and Andaman & Nicobar
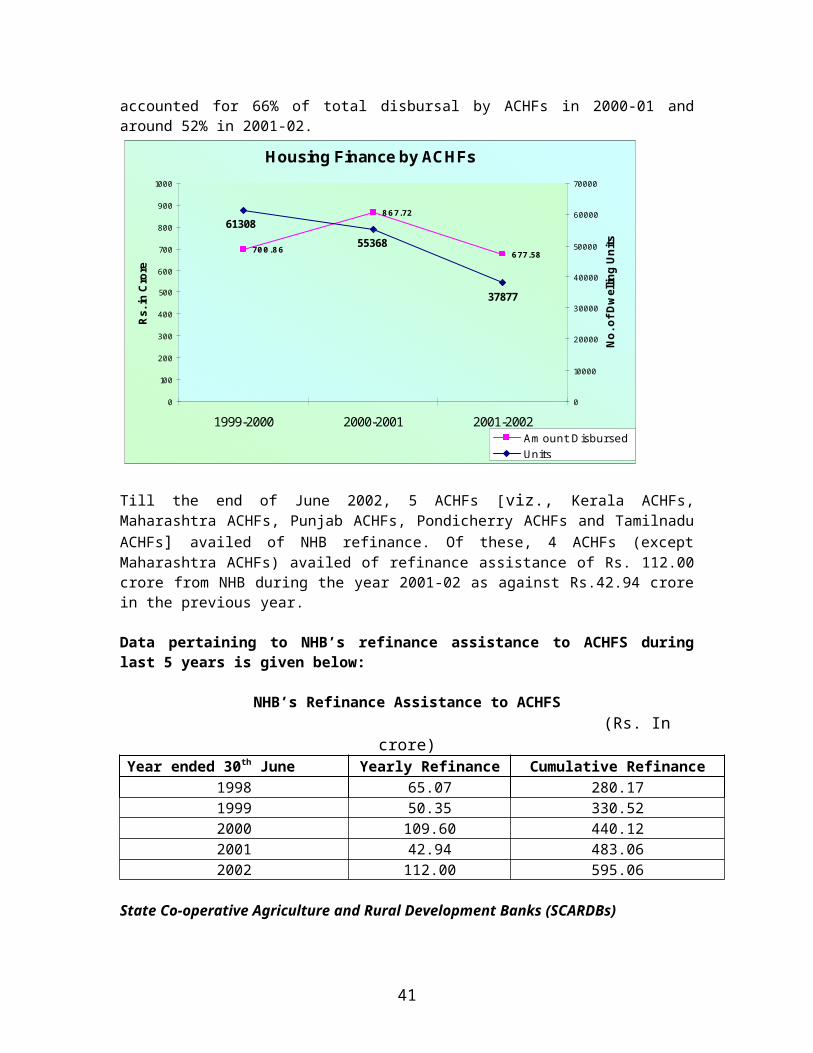
The above table shows the steady increase in per unit loan size over the years by the ACHFs. Besides, the concentration of disbursal in the state of Tamil Nadu continued which alone accounted for 66% of total disbursal by ACHFs in 2000-01 and around 52% in 2001-02.
32
Housing Finance by ACHFs
700.86
867.72
677.58
61308
37877
55368
0
100
200
300
400
500
600
700
800
900
1000
1999-2000 2000-2001 2001-2002
Rs.
in C
rore
0
10000
20000
30000
40000
50000
60000
70000
No.
of D
wel
ling
Uni
ts
Amount Disbursed Units
Till the end of June 2002, 5 ACHFs [viz., Kerala ACHFs, Maharashtra ACHFs, Punjab ACHFs, Pondicherry ACHFs and Tamilnadu ACHFs] availed of NHB refinance. Of these, 4 ACHFs (except Maharashtra ACHFs) availed of refinance assistance of Rs. 112.00 crore from NHB during the year 2001-02 as against Rs.42.94 crore in the previous year.
Data pertaining to NHB’s refinance assistance to ACHFS during last 5 years is given below:
NHB’s Refinance Assistance to ACHFS (Rs. In crore)
Year ended 30th June Yearly Refinance Cumulative Refinance1998 65.07 280.171999 50.35 330.522000 109.60 440.122001 42.94 483.062002 112.00 595.06
State Co-operative Agriculture and Rural Development Banks (SCARDBs)
Keeping in view the housing shortage in rural areas, a few State Governments, after suitable legislative amendments, have permitted the Agriculture and Rural Development Banks (ARDBs) to lend for housing. As the ARDBs do not fall under the category of either scheduled bank or specialised housing finance institutions, NHB, in order to extend financial assistance to this category of institutions, formulated a scheme to subscribe to special rural housing debentures floated by ARDBs backed by the mortgages originated by them.
33
During the year 2001-02, NHB disbursed Rs. 107.16 crore to ARDBs as compared to Rs. 97.62 crore in the previous year. Thus, during the year ended June 30, 2002, NHB extended a total refinance assistance of Rs. 219.15 crore to co-operative sector institutions as against Rs. 140.57 crore in 2000-2001. Thus as at the end of June 30, 2001 NHB’s cumulative refinance assistance to co-operative sector institutions stood at Rs.1285.89 out of the cumulative refinance assistance of Rs.7251.36 crore.
State Co-operative Banks
In order to strengthen the cooperative credit structure of the country which has been performing a commendable task in providing credit to the housing sector, NHB has been extending refinance assistance to the State Cooperative Banks (SCBs) in respect of the housing loans given by them either directly or through the District Central Cooperative Banks/primary agricultural credit societies. So far, a few SCBs have been found eligible for availing the refinance facility from NHB. The cumulative refinance assistance extended by NHB to the SCBs as at the end of June, 2002 stood at Rs.49.89 crore.
Primary (Urban) Co-operative Banks
The scheduled Primary Urban Cooperative Banks are also eligible to avail refinance assistance from NHB provided they meet the recovery norms prescribed by NHB. Like the case of SCBs, not many primary (urban) cooperative banks have been in a position to avail refinance assistance from NHB. During the year ended June 30, 2002, Rs. 32.00 crore was disbursed by NHB to this category of institutions. The cumulative refinance assistance extended by NHB to these institutions stood at Rs.62.15 crore by the end of June, 2002 and the outstanding was Rs.54.37 crore.
Recovery Performance of ARDBs/ACHFs
As per the information available from these institutions, their recovery position has declines, in most of the cases, during the year 2001-02 as compared to the previous year which is not a good sign for this sector.
Recovery Performance of Cooperative Sector Institutions
Institution 2000-2001 2001-02Punjab ACHFS 84.56 84.60Tamil Nadu ACHFS 65.95 61.43Kerala ACHFS 90.30 85.59Pondicherry ACHFS 59.00 66.00Kerala ARDB (state level rec.)
92.35 84.54
Figures in percentage
34
35
CHAPTER V
ASSET QUALITY IN HOUSING FINANCE
Housing finance is characterized by the low level of NPAs and this fact has been the major inducement for various players in the financial sector to look towards housing finance as a viable alternative. This is the only sector in the financial system where the level of NPAs remains to be very low. This fact has led the banks to take housing finance business more seriously resulting in housing finance disbursement by banks to even surpass the total disbursements by housing finance companies during the year 2001-02. The fact that housing finance is a compartively safe business can be observed from the fact that during the last three years, the proportion of NPAs to total assets of the HFCs registered with NHB and having asset base of more than Rs. 10 crores, (these HFCs account for more than 99% of the total business of all HFCs) has been declining. The proportion of gross NPAs to total assets of these companies decreased from a level of 2.88% as at the end of March,2000 to 2.53% as at the end of March,2001 and further to 2.36% as at the end of March,2002.
As at the end of March, 2002, there were 30 HFCs(excluding HUDCO) having asset base more than Rs. 10 crores and registered with NHB. For the purpose of analysis, these companies have been grouped according to their asset size as given below:
Table 5.1: Asset Base of Approved HFCs
Asset Size No. of CompaniesBetween Rs 10 crore and Rs.150 crore (Group A)
12
Between Rs.150 crore and Rs. 500 crore (Group B)
10
Above Rs.500 crore (Group C) 8 (Asset size as on March 31, 2002)
However, the data pertaining to two of these companies is available only for the year ended 31st March, 2002. Accordingly, the analysis given in this chapter is based on the data in respect of 28 companies only [Group A – 12, group B – 9 and Group C – 7].
Total assets of these companies increased from Rs. 28917.20 crore as at the end of March, 2000 to Rs. 34663.41 crore by 31st March, 2001. During the same period gross non-performing assets increased from the level of Rs.731.81 crore to Rs.817.11 crore. However, in the percentage terms, the proportion of gross NPAs to total assets has declined from 2.53% as at the end of March, 2001 to 2.36% as on 31st March, 2002.
However, the net NPAs which were Rs. 636.36 crore as on 31st March, 2001, marginally declined to Rs. 623.72 crore by the end of March, 2002 and the
36
proportion of net NPAs to total assets declined from 2.20 % on 31 st March, 2001 to 1.80% as on 31st March, 2002.
In the case of HFCs with asset size of more than Rs. 10 crore and up to Rs.150 crore the gross NPAs are increasing over the years. Gross NPAs in this category of HFCs increased from Rs. 38.34 crore as at the end of March, 2000 to Rs. 54.54 crore as on 31st March, 2001 and further to Rs.63.27 crore by the end of March, 2002. Similarly, the proportion of gross NPAs to total assets for this category witnessed an increase from the level of 7.68% as on 31st March, 2000 to 8.80% by the end of March, 2001 and further to 11.09% by the end of March, 2002. A similar trend was observed in the case of net NPAs. The proportion of net NPAs to total assets of these companies increased from 5.74% as on 31st March, 2000 to 6.74% by the end of March, 2001 and further increased to 7.88% by end of March, 2001. This clearly shows the decline in appraisal standards in case of these small HFCs.
In respect of HFCs having asset size above Rs.150 crore and up to Rs.500 crore the gross NPAs have marginally increased from the level of Rs.213.28 crore as on 31st March, 2001 to Rs.221.68 crore by the end of March, 2002. However in the percentage terms the proportion of gross NPAs to total assets of these companies is on the decline and this percentage share declined from 12.46% as at the end of March, 2000 to 10.31% by the end of March, 2001 and further to 8.35% by the end of March, 2002. The variation in the proportion of net NPAs to the total assets has been similar to the variation observed in the case of proportion of gross NPAs to total assets. It decreased from 10.77% to 10.09% during 2000-2001 and further to 7.68% during 2001-2002. This decrease may be due to the improvement in the appraisal norms and follow up by the HFCs in this category
For companies having an asset size above Rs.500 crore also a trend similar to the companies with asset size above Rs.150 crore but less than Rs.500 crore is observed in respect of NPAs as a percentage of total assets. This proportion decreased from 2.03% at the end of March, 2000 to 1.77% as at the end of March, 2001 and further declined to 1.69% by the end of March,2002. Similarly, the proportion of net NPAs to total assets for these companies decreased from 1.70% to 1.47% during 2000-2001 and further to 1.19% during 2001-2002. This indicates the high importance being given by HFCs in this category towards loan appraisal, monitoring and follow up.
Table 5.2: NPAs for Various Groups of HFCs Classified according to Asset Size
(Rs in Crore)
Total Assets
Gross NPAs
Gross NPAs as %
of Total assets
Net NPAs
Net NPAs as % of Total
assetsGroup A
2000 499.23 38.34 7.68 28.67 5.742001 620.01 54.54 8.80 41.80 6.742002 570.27 63.27 11.09 44.92 7.88
37
Group B2000 1647.91 205.26 12.46 177.54 10.772001 2068.19 213.28 10.31 208.59 10.092002 2656.03 221.68 8.35 203.85 7.68
Group C2000 21554.55 438.30 2.03 365.81 1.702001 26228.99 463.99 1.77 385.97 1.472002 31437.11 532.16 1.69 374.95 1.19
Total2000 23701.69 681.90 2.88 572.02 2.412001 28917.19 731.81 2.53 636.36 2.202002 34663.41 817.11 2.36 623.72 1.80
Note: It may not be possible to draw a direct comparison with the figures published in the last report due to regrouping of HFCs on the basis of their asset size as on 31.3.2002
In terms of the classification of NPAs as per the prudential norms, the sub-standard assets accounted for about 67% of the total NPAs during the year 2000 and by the year 2001 this share declined to 53.44%. However during 2001-02 the percentage of standard assets to total NPAs again increased to 59.27%. During the year 2001-02, the share of doubtful assets in the total NPAs has declined from 46.49% to about 40%. This decrease in the share of doubtful assets is approximately equal to the increase in the proportion of sub-standard assets in the total NPAs. From this it may be inferred that the accounts, which have become doubtful during the last couple of years have shown some improvement during the year.
Table 5.3: Break-up of Non-Performing Assets (per cent)
Category/Year 2000 2001 2002Sub-standard 67.09 53.44 59.27Doubtful 32.52 46.49 39.93Loss 0.39 0.08 0.80
38
Chapter VI
Activities of the National Housing Bank: 2001-02
A. Promotion and Development
Working on its mandate of ensuring a sound and healthy housing finance system in the country, NHB continued with the promotional tasks of developing housing finance institutions as well as effective human resources for the sector. The Bank endeavoured to resolve the problems faced by the housing finance sector through deliberations with the institutions engaged in the business of providing housing finance in the country besides providing training facilities to the concerned personnel.
During the year, NHB organised a meeting with the representatives of Forum of Housing Finance Companies to discuss certain issues relating to enhancement of capital adequacy ratio for HFCs, reduction in risk weights on housing loans, reduction in NHB refinance rate etc. The sixteenth meeting with the Chief Executives of housing finance companies eligible for NHB refinance was also held to discuss issues pertaining to resource scarcity in housing finance sector and scope for mobilisation of additional resources, appointment of recovery officers and bond guarantee scheme.
The details regarding NHB’s equity participation in HFCs are given below:
NHB’s participation in equity of HFCs(Rs. in Crore)
Name of the HFC Face Value Investment as on 31.03.2002
1.Andhrabank Housing Finance Ltd.
1.90 4.23
2.BOB Housing Finance Ltd. 4.94 4.943.Can Fin Homes Ltd. 0.50 1.754.Centbank Home Finance Ltd. 1.60 1.605.GRUH Finance Ltd. 0.45 0.856. Vysya Bank Housing Finance Ltd.
0.38 0.56
7. Vibank Housing Finance Ltd 1.20 1.20TOTAL ------- 15.13
The National Housing Bank (Amendment) Act, 2000 envisaged for a speedier method of recovery of dues from the defaulting borrowers of housing finance institutions (HFIs), through recovery officers. The Bank, after due deliberations with industry leaders and complying with other requirements of the said Act, framed the National Housing Bank (Recovery of Dues of the Approved Institutions) General Regulation, 2002 providing inter alia procedure for transfer by sale, lease or otherwise of the mortgaged property by recovery officer. Further, as per the provisions of the Amended Act, the
39
Central Government also framed rules to give effect to the provisions of the Act. The said Regulations and Rules were notified on 8th May 2002.
The Government of India (through the Department of Economic Affairs) and the Canadian Government are jointly operating multi-phase programmes on financial sector reforms, aided and supported through the funds under the Canadian International Development Agency (CIDA). A number of initiatives have been mooted by Government of India under this programme. Three such initiatives are Asset Securitisation, Mortgage Insurance and Awareness building and Expertise Development. As the arrangement between NHB and Canada Mortgage Housing Corporation (CMHC) was found to be quite appropriate for these initiatives, NHB and CMHC have been identified as working partners for implementation of the above initiatives. These initiatives include proposals for study of housing finance system in Canada and expose the Indian working partners and the other stake holders to the Canadian experience and the role of CMHC in the development of housing finance sector in India.
Under the Initiative on Mortgage Insurance, a team comprising five members from NHB and Department of Economic Affairs (DEA), Government of India visited Canada during June - July 2001 for understanding the mortgage finance and insurance system in Canada. Another team comprising officers from NHB went to Canada in November, 2001 to further initiatives regarding setting up of a mortgage credit guarantee corporation in India under NHB-CMHC collaboration.
Under the Initiative on Awareness Building and Expertise Development, a team from Canada including officials from CMHC visited India during July - August 2000 and a team comprising representatives from NHB and housing finance institutions visited Canada in December, 2001 to exchange ideas related to training need and initiatives in the housing sector in India and issues related to capacity building.
As a part of the Technical Assistance programme of the Asian Development Bank (ADB), a study tour was organised to USA during February-March, 2002 in which 7 NHB officers were nominated. During the course of the tour, the team participated in a Securitisation symposium organised by Fannie Mae in Miami, Florida, which was followed by specific meetings in New York and Washington.
B. Regulation & Supervision
Consequent to amendments to the National Housing Bank Act, 1987 in the year 2000, which conferred additional powers on NHB in respect of its regulatory role, the policy framework for regulation and supervision of HFCs has been strengthened during 2001-02.
The Housing Finance Companies (NHB) Directions, 2001
40
NHB issued a new set of Directions known as the Housing Finance Companies (NHB) Directions, 2001, in supercession of the earlier Directions and the Guidelines on Prudential Norms. These Directions were notified on December 29, 2001. The Directions cover various aspects of an HFC’s functioning, including acceptance of public deposits and prudential norms relating to income recognition, asset classification, provisioning, concentration of credit/investment, etc. In addition, NHB had for the first time issued directions to auditors of the HFCs, requiring them to make a separate report to the Board of Directors of the HFC on the company’s compliance with various regulatory requirements and exception reports directly to NHB in case of non-compliance.
Some of the new provisions of the Directions are as under:
Definition of public deposits: The definition has been modified in line with the amendments made by RBI in the NBFC directions. The changes are in respect of money received from mutual funds, money received from relatives of directors, money received from shareholders of a private limited company and hybrid/subordinate debt having maturity period less than 60 months.
Introduction of depositors: HFCs are now required to obtain introduction of all prospective depositors, either from one of the existing depositors or on the basis of income tax PAN, election identity card, passport or ration card.
Opening and closing of branches: In terms of the new Directions, an HFC is required to inform NHB before opening a branch. Further, an HFC accepting public deposits is required to publish a public notice 3 months in advance and inform NHB before closing a branch.
Disclosure about exposure to sister concerns: HFCs are required to make certain disclosures in the application form and the advertisement for acceptance of public deposits. Now, an HFC will have to also include information about its exposure to companies in the same group or other entities in which the directors/the HFC hold substantial interest.
Ceiling on borrowings: In view of the enhanced capital adequacy requirement of 12% from March 31, 2002, the ceiling on total borrowing of HFCs has been reduced to 10 times of NOF from the earlier 10, 11 and 12 times based on the NOF size.
Ceiling on rate of interest on public deposits: The rate of interest payable on public deposits of HFCs are subject to a ceiling prescribed under the Directions. The earlier Directions provided that an HFC would be free to determine the rate, notwithstanding the ceiling if it obtains a certificate from NHB about its compliance with the directions, guidelines and instructions of NHB. The freedom allowed to HFCs to pay interest on public deposits in excess of the ceiling stipulated on a case-to-case basis has now been withdrawn. Subsequently, the ceiling on interest rate has also been reviewed in tune with the market trends and with effect from April 24, 2002, the
41
applicable ceiling has been reduced to 12.5% per annum from the earlier level of 14% per annum.
Subordinated debt: Subordinated debt forms part of Tier II capital. The book value of the instrument is subjected to discounting at specified rates depending on remaining maturity of the instruments. The discounting rates earlier specified have been revised so that they are in alignment with the rates applicable to NBFCs in terms of RBI’s Directions.
Income from investments: Separate income recognition norms have been prescribed in the Directions in respect of income from investments.
Inter Corporate Deposits (ICDs): Separate asset classification norms have been prescribed for ICDs. For the purpose of definition of non-performing assets, these will be treated in a manner similar to other loans and the ‘six months overdue’ norm applies.
Provisioning for lease and hire purchase assets: Provisioning requirements for lease and hire purchase assets have been made the same as those stipulated by RBI for NBFCs.
Government guaranteed loans - asset classification: In terms of the erstwhile Guidelines on Prudential Norms which have been superceded by the new Directions, loans and advances to public housing agencies guaranteed by Central/State Government were to be treated as non-performing assets only when the Government concerned repudiates the guarantee. In the new Directions, however, the asset classification norms and the basis of treating a credit facility as NPA have been made identical for all loans, irrespective of the borrower’s status or government guarantee and there is no separate treatment for government guaranteed loans.
Capital adequacy - risk weight on housing loans: An HFC is required to maintain a minimum capital adequacy ratio of 12% of its aggregate risk weighted assets and risk adjusted off-balance sheet items. The capital adequacy requirement for HFCs was reviewed in the light of the general principles and practices prevalent internationally in this regard. In view of the fact that housing loans secured by mortgage of property are considered all over the world to be sound and safe with low risk element and given the stage of development of foreclosure system, mortgage insurance and underwriting standards in the country, it was decided to prescribe a lower risk weight for individual housing loans - 75%, to begin with. Accordingly, in terms of the new Directions, risk weight on individual housing loans that are classified as standard and where loan to value ratio does not exceed 75% has been reduced from 100% to 75%.
Safe custody of approved securities: An HFC is required to entrust the approved securities maintained by it for compliance with the statutory liquidity ratio to a scheduled bank in the place of its registered office. The new Directions provide that such securities may, with prior approval of NHB, be entrusted to the Stock Holding Corporation of India Ltd. or be kept in the
42
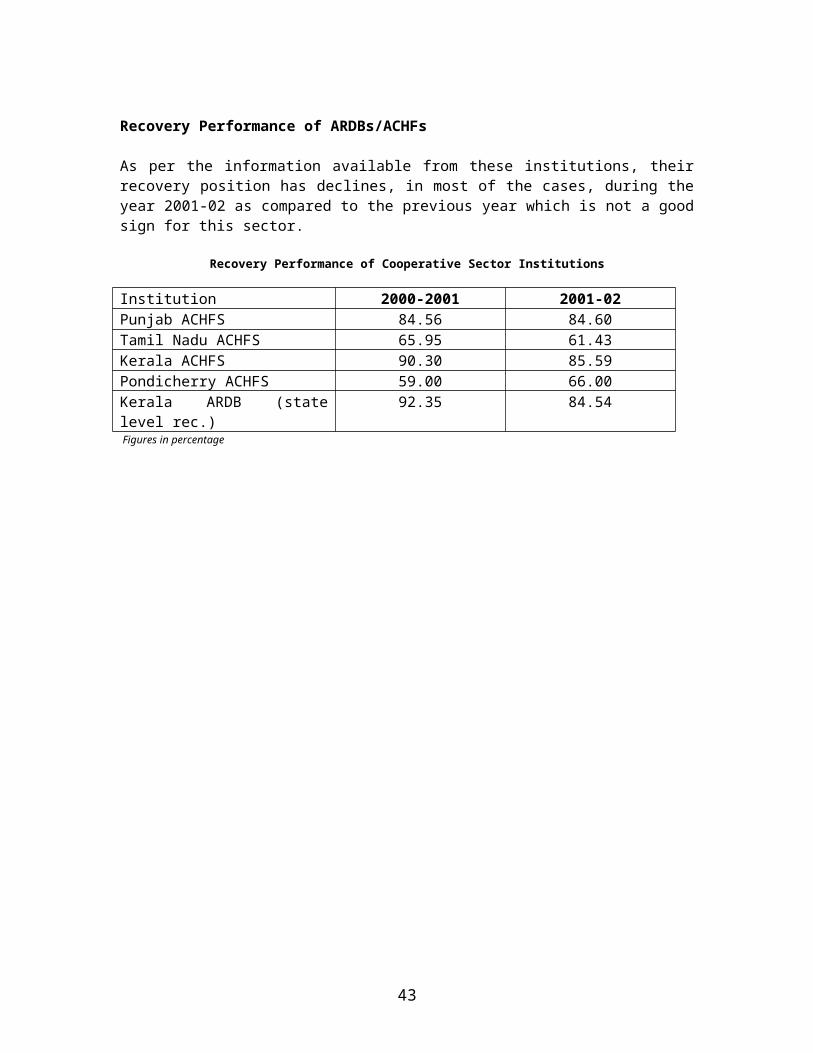
form of constituent’s Subsidiary General Ledger (SGL) account with its designated scheduled commercial bank.
Defaulting HFCs prohibited from making loans/investments: Section 36 A (1) of the NHB Act provides that every deposit accepted by an HFC unless renewed shall be repaid in accordance with the terms and conditions of the deposit. In terms of the Directions, an HFC that has failed to repay a public deposit in accordance with the terms and conditions, is prohibited from granting loans or making investments or creating any other assets, as long as the default exists.
Ceiling on investments in real estate and in unquoted shares: In view of concerns having been expressed about deployment of funds in high risk and speculative avenues, ceilings have been prescribed for investments in real estate and in unquoted shares. An HFC accepting public deposits cannot invest more than 10% of its owned fund (a) in land/building except for own use; or (b) in unquoted shares except in shares of subsidiaries or group companies
Maintenance of Liquid Assets: In terms of the earlier Directions of 1989, an HFC was required to maintain liquid assets at least at 12.5% of the public deposits outstanding on the last day of the second preceding quarter. By the Amendment Act of 2000, a provision on the subject was inserted in the NHB Act (section 29B), which requires the HFCs to maintain liquid assets at least at 10% of the deposits outstanding on the last day of the second preceding quarter and empowers NHB to further increase the percentage by a notification. In order to ensure that the liquid assets requirement continues to be at the same level as prescribed before coming into force of the Amendment Act, a notification has been issued by NHB specifying the requirement in this regard.
Requirement of Registration and Net Owned Fund : Entry point norms for HFCs have been prescribed under the NHB Act, in terms of which no HFC can commence or carry on the business of a housing finance institution without obtaining a certificate of registration from NHB and having the minimum specified NOF. The minimum required NOF which had originally been specified at Rs. 25 lakh, has now been enhanced to Rs. 2 crore. The enhanced requirement of NOF applies to an HFC that commences the business of a housing finance institution on or after February 16, 2002 and not to a company whose application for registration has been submitted to NHB before this date.
Guidelines for Asset Liability Management System in HFCs
With the expansion in the business of HFCs and gradual integration of the housing finance system with the general financial system, the risks associated with the operations of HFCs are getting increasingly complex requiring strategic management. HFCs in general are, because of the nature of their business, vulnerable to the problem of asset - liability mismatch and the concomitant interest rate and liquidity risks. In view of this, it has been
43
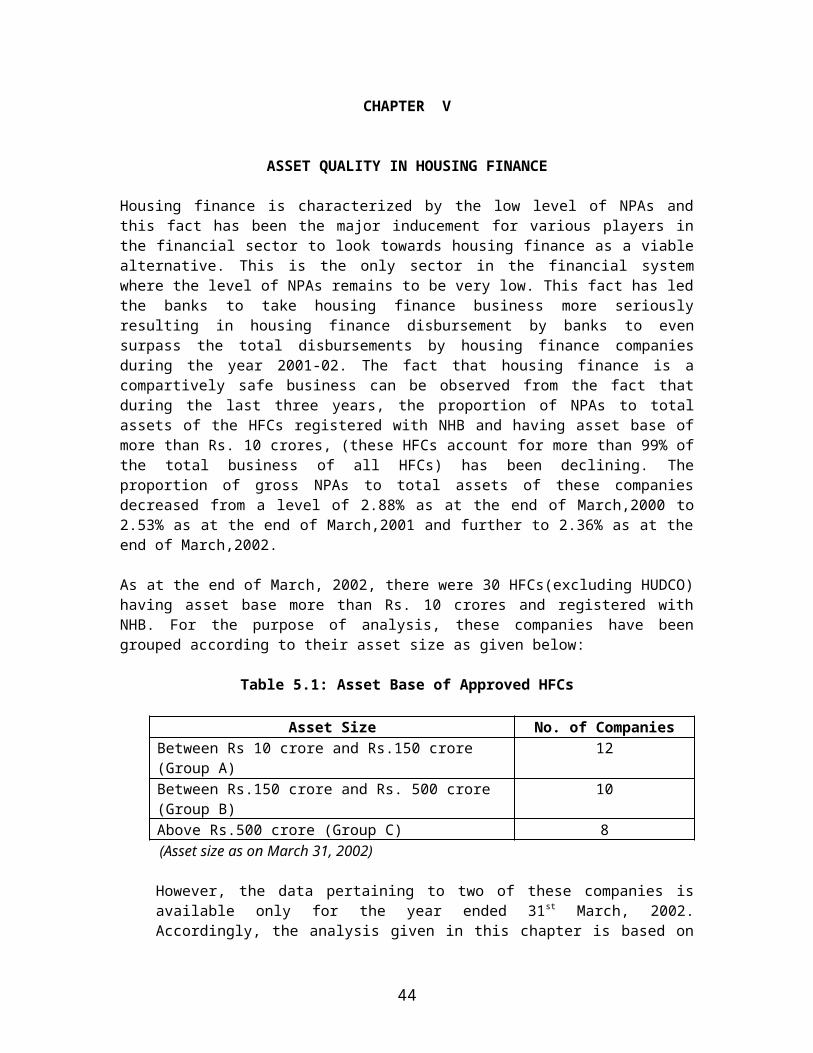
decided to introduce an Asset Liability Management (ALM) system for the HFCs, as part of their overall system for effective risk management. Guidelines for ALM system in HFCs have been issued in June 2002, laying down broad guidelines in respect of systems for management of liquidity and interest rate risks which forms part of the ALM function. To begin with, HFCs meeting the criteria of asset base of Rs. 100 crore or more or holding public deposits of Rs. 20 crore or more as per the audited balance sheet as of March 31, 2002 have been advised to put in place the ALM system, though in due course of time, the system could be implemented in all HFCs. HFCs have been advised to commence trial run during the period ending September 30, 2002, which may continue during the half year beginning October 1, 2002. The guidelines should be fully operational by the year ending March 31, 2003.
HFCs’ investments in units of US 64 – relaxation
In the light of the Government decision to allow the redemption of US 64 units on May, 2003 either at Rs.10 or at Net Asset Value (NAV) as on that date, it has been decided to permit HFCs, which desire to do so to carry their investments in the said units as long term at book value, subject to the conditions :i) HFCs would be required to amortize the premium over the face value over
a period upto May 23, 2003ii) HFCs would not be allowed, for any reason, to sell/shift these units before
the redemption date, i.e. May 31, 2003 either in part or full.
HFCs under the Regulatory Ambit of NHB
The total number of HFCs on the mailing of NHB stood at 386 as on June 30, 2002. There have been 46 additions to the list and 2 deletions during the year. The additions include companies that applied for registration under NHB Act and were found to be housing finance institutions in terms of the definition given under the said Act.
In terms of section 29A of NHB Act, every HFC is required to obtain a certificate of registration from NHB for commencing or carrying on the business. Of the above 386, 257 HFCs have not applied for registration as required in terms of NHB Act and consequently are not eligible to carry on the business of housing finance institution. A large number of these companies are not traceable at their last known addresses and may have vanished. As per the last information available with NHB, many of these companies held public deposits. Of these 257 HFCs, as many as 30 HFCs stand prohibited from acceptance of deposits. Appropriate follow-up action in co-ordination with other regulatory authorities is being initiated in these cases to ensure that these ineligible HFCs do not carry on the business of a housing finance institution, in contravention of the provisions of the NHB Act. Excluding these ineligible HFCs, there are 129 HFCs on the mailing list, of which 50 are known to be holding public deposits.
Activities of the HFCs are monitored through a system of off-site surveillance and on-site inspections so as to ensure their compliance with the regulatory
44
discipline and to assess the financial health. As a part of the off-site surveillance system, the prescribed returns and statements are obtained from the HFCs and scrutinised/analysed. Returns have been received from 85 HFCs during the year. 25 HFCs were inspected during the year. These included different categories of companies, viz. those prohibited from acceptance of deposits (to verify compliance with the prohibitory order), those accepting/holding public deposits (to verify compliance with provisions of the Directions) and those where inspection was undertaken to facilitate a decision on the application for registration or for financial assistance from NHB. Based on the on-site and off-site feedback about a company’s affairs, appropriate interventions are made wherever warranted. During the year, two HFCs were prohibited from acceptance of deposits and alienation of assets. The total number of HFCs which have been prohibited from accepting/renewing deposits stood at 35 as on June 30, 2002.
Under section 29A of the NHB Act, certificates of registration have so far been issued to 32 HFCs, including 5 cases where certificates not valid for acceptance of public deposits have been issued. Applications for certificate of registration have been declined / rejected in 5 cases, while in one case, the application has been withdrawn.
Supervision of HFCs: Coordination with other Regulatory Authorities A close and continuous co-ordination among the various agencies and authorities is essential for effective enforcement of the legal and regulatory framework. Towards this end, the Reserve Bank of India has been organising State Level Co-ordination Committee meetings, where NHB has begun participating as the regulator of HFCs. The meetings bring together various regulatory authorities concerned with protection of depositors’ interest and provide a platform for exchange of information and views. Besides deliberations on issues of concern from a policy perspective, specific/individual cases are also discussed at these meetings with a view to evolving a coordinated approach.
C. Refinance
Changes in the Refinance Policy
Changes in the Interest Rate Structure
The interest rate structure on refinance was revised four times during the year July 2001–June 2002 keeping in tune with the falling interest rate regime. The last revision came into force with effect from June 10, 2002. The interest rate range was 7.25%-9.50% in rural areas for construction or acquisition of new dwelling units whereas the range was 8.25%-9.50% in urban areas. The interest rate range was 7.75%-9.50% for repairs / up gradation in rural areas and 8.75%-9.50% in urban areas. The refinance eligibility in case of HFCs and scheduled commercial banks was enhanced
45
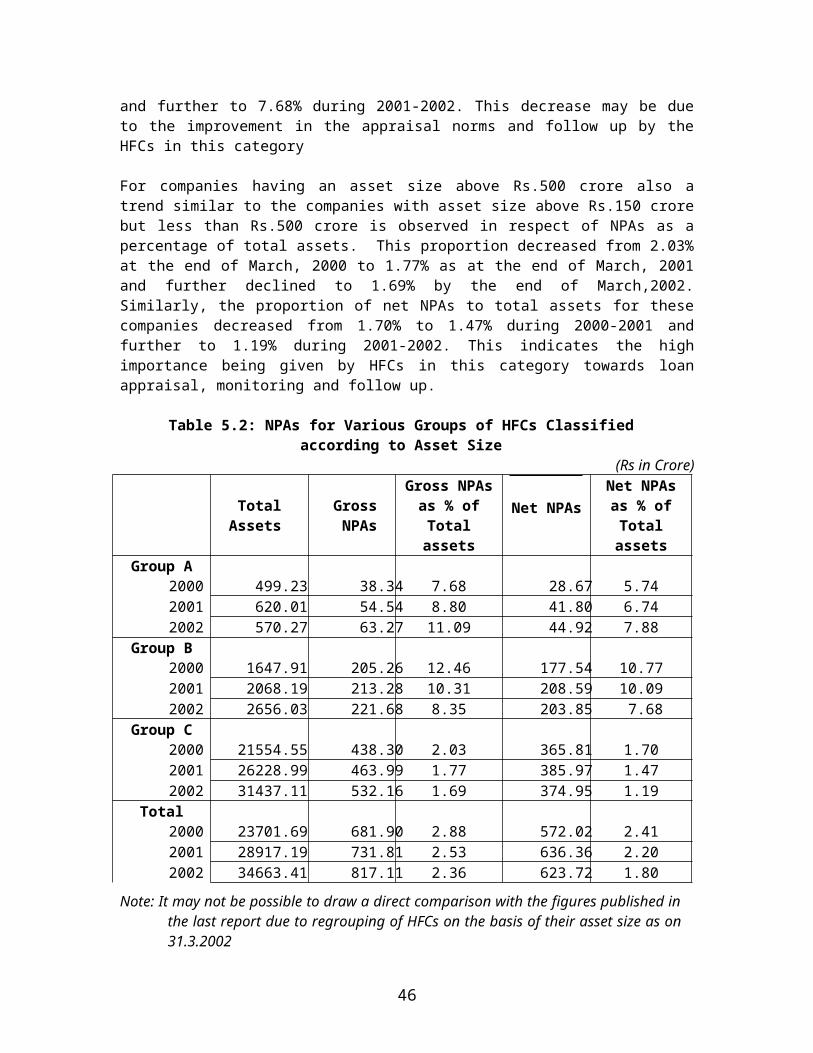
from Rs.15.00 lakhs to Rs.20.00 lakhs and further to Rs.50.00 lakhs during the year.
In the month of June 2002 NHB introduced the option of flexible repayment period between 5 to 7 years for all primary lending institutions (PLIs), with interest rate incentive of another 25 basis points across all loan slabs for PLIs desirous of exercising this option. This move was aimed at easing out the pressure on demand for medium term funds by borrowing institutions.
As the housing finance market became fiercely competitive, NHB decided to reduce the interest rate being charged from HFCs and cooperative sector institutions on the refinance availed in the past. It was decided to convert loans availed at rates of interest above 13% to 11.50% subject to payment of one time conversion fee equivalent to 1% (for loans at interest rate above 13% and upto 14%) and 2% (for loans at interest rate above 14%) of the outstanding refinance amount on which the interest rate was reduced. However, refinance given for project loans was not eligible for the above benefit. The conversion scheme received excellent response from the primary lending institutions.
Modification in the Gujarat Earthquake Scheme:
Under the captioned scheme, the owner of a house/flat against G4 category of damage (G4: Severe structural damage. Diagonal and torsional cracks including relative movement in parts of column and floor; Building either to be demolished or extensive restoration and strengthening to be carried out before reoccupation) was made eligible to avail housing loan for construction/purchase of new house/flat. It was decided that in respect of such category of houses if the owner demolished the house for reconstruction, the tenant of the said house could also avail loans under the captioned scheme for purchase/construction of new house/flat. However, the primary lender would have to satisfy itself with the proof of tenancy of borrower seeking loan against such affected unit, which is inhabitable.
However, under the G5 category of damage, i.e. totally collapsed houses, the owner as well as the tenant shall continue to be eligible for housing loan for purchase/construction of new dwelling unit.
In other categories of damage, i.e. G1 to G3 (G1: Fine cracks in columns, Seismic strengthening required, G2: Wider visible cracks in columns, Seismic strengthening required and G3: Moderate structure damage with larger cracks in column, Structural restoration and seismic strengthening required), owners are eligible to avail loan for repairs of damaged units. The categories of damage, i.e. G1 to G5, are notified by the local revenue authorities for the purpose of compensation, etc. The refinance scheme for victims of Gujarat earthquake, which was earlier valid till 30-06-2002, was further extended till 30-06-2003.Extension of Gujarat Earthquake Scheme to the victims of Riots
46
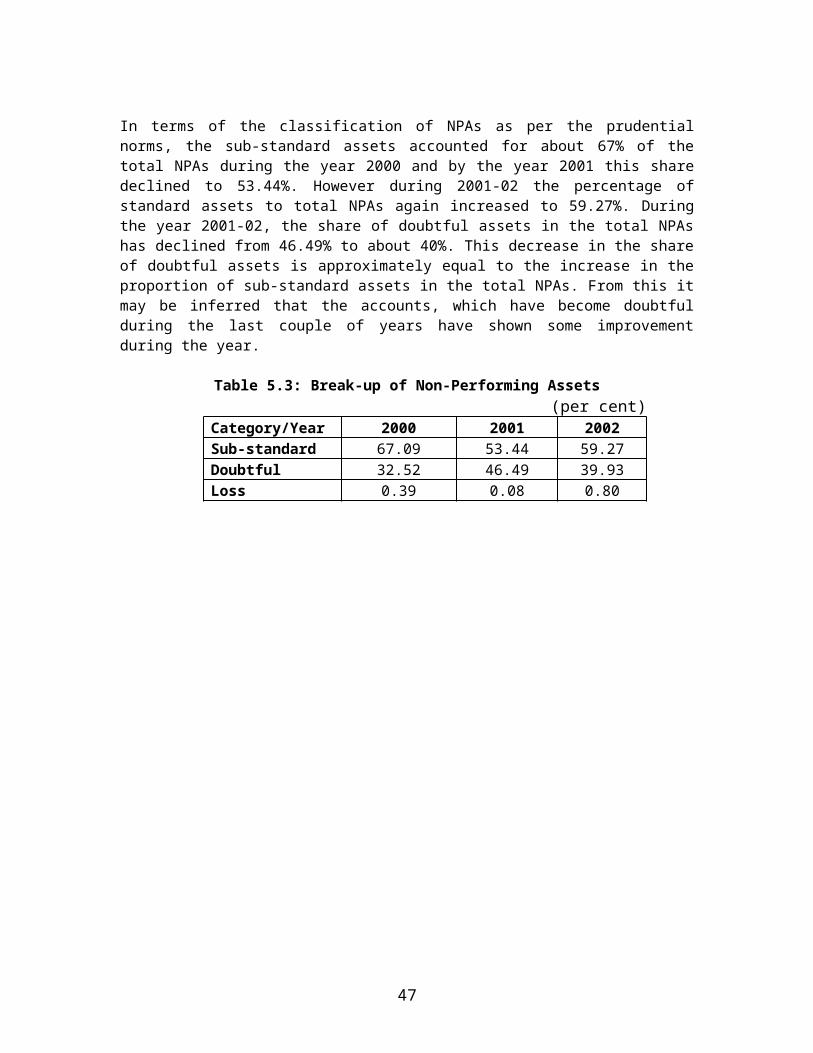
In the aftermath of recent riots in Gujarat, NHB, on approval from RBI, has decided to extend refinance assistance to HFCs and SCBs in respect of their lending for housing to the riot victims. Refinance up to Rs. 10.00 lakhs will be available for construction/acquisition of houses/flats and up to Rs.5.00 lakhs upgradation (including major repairs) of the houses affected in the riots. The rate of interest and other terms and conditions would be the same as under the scheme introduced earlier for earthquake victims in the state.
Interest rate concession to riot victims
On the lines of the relief package announced by the RBI for riot victims, NHB extended interest rate concession to HFCs in respect of housing loans of affected person where repayment capacity of the borrower has been impaired by the riots.
Refinance Disbursal in 2001-02(Rs. in crore)
Institutions Disbursements during 2001-02
Disbursements during 2000-01
Cumulative disbursements
upto June 30, 2002Scheduled Banks 86.35 105.67 434.66Cooperative Sector Institutions
219.15 140.57 1285.89
Housing Finance Companies
719.30 761.98 5530.81
Total 1024.80* 1008.22 * 7251.36** inclusive of financial assistance provided under Orissa Cyclone Scheme and Gujarat Earthquake Scheme
Out of this Rs.1024.80 crore, Rs.222.20 was disbursed under the Golden Jubilee Rural housing Refinance Scheme.
D. Project Finance
Changes in Project Finance Guidelines
The guidelines pertaining to financial assistance under project finance are reviewed and amended from time to time to incorporate the emerging needs and expectations of various public agencies. During the year 2001-02 a revision was made pertaining to area parameters viz. size of plots and dwelling units etc. contained in the guidelines for financing Land Development and Shelter Projects (LDSP) for Public Agencies. The guidelines have been amended to limit the average area of plots to 250 m2. (from the earlier limit of 150 m2), the maximum size being limited to 500 m2 (from the earlier limit of 300 m2). Further, amendments were incorporated to limit the average Built-up Accommodation (BUA) of dwelling units to 150 m2 (from the earlier limit of 90 m2), the maximum BUA of any dwelling unit being limited to 300 m2 (from the earlier limit of 130 m2)
Revision in Interest Rates
In keeping with the general interest rate scenario in the country, the interest rates applicable to the different project financing schemes both under
47
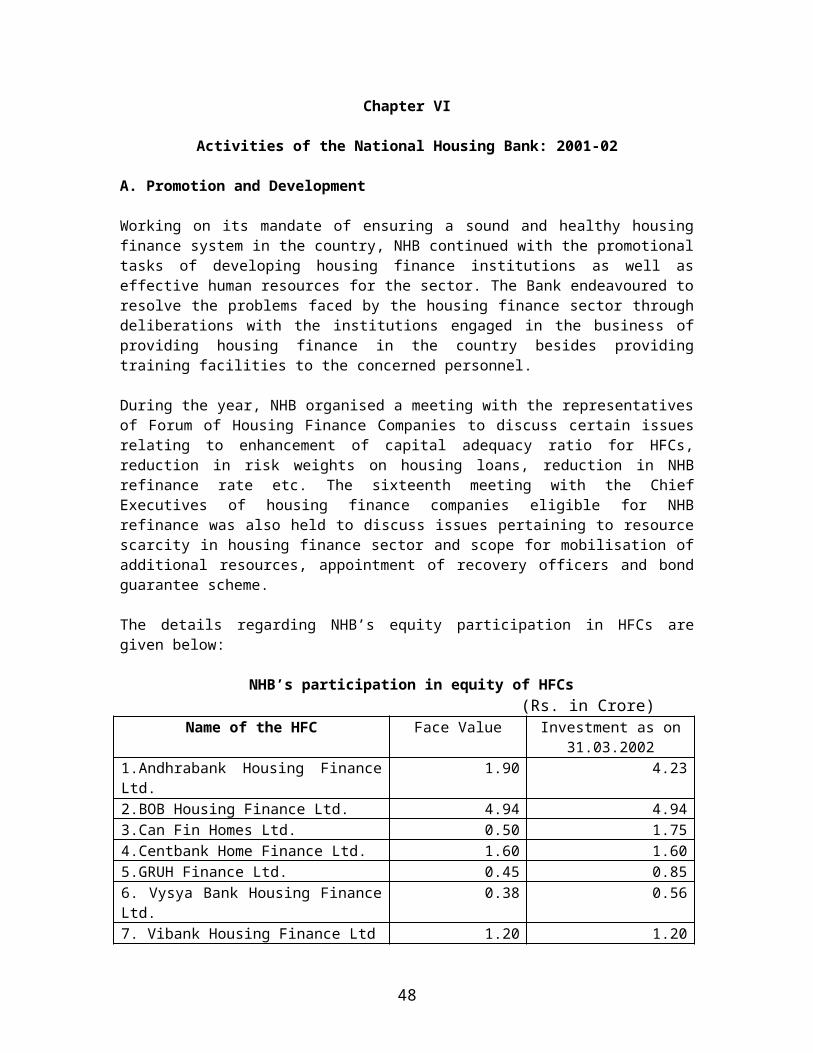
refinance and direct lending windows, were revised downwards during the year. The revised rates are as under:
Direct Finance: The interest rate for Land Development and Shelter projects and Housing Infrastructure projects has been fixed at 11.50% for loans secured by Govt./Bank guarantees (from earlier level of 12.25%) and at 12.00% for other acceptable securities (from earlier level of 12.50%). The interest rates for Slum Redevelopment projects have not been changed.
Refinance: For refinance in respect of Land Development & Shelter projects and Housing Infrastructure projects by public agencies, the interest rate has been fixed at 11.25% per annum (from earlier level of 12.00%).
Project Finance Disbursals 2001-02
The Bank provided direct financial assistance to the tune of Rs.111.25 crore during the year 2001-02. Out of this, Rs. 41.04 was extended from the General Fund, Rs.19.04 crore from the Special Fund and Rs.51.17 crore under the Gujarat earthquake scheme. Cumulatively, till the end of June, 2002, NHB has disbursed Rs.513.59 crore under its project financing window.
Besides, the Bank sanctioned 6 Land Development & Shelter Projects (LDSP) under the General Fund during 2001-02 having a cost component of Rs. 92.39 crore and loan amount of Rs.54.08 crore. Under the Special Fund, 21 Projects were sanctioned during 2001-02 having project cost of Rs. 122.63 crore and loan amount of Rs. 73.71 crore.
E. Training
During the year, NHB conducted six training programmes all over the country involving participation from HFCs, state housing boards and development authorities. The programmes addressed various specialised topics such as regulatory framework, securitisation, project finance etc. In one programme, officials from leading housing finance institutions in Bangladesh also participated.
NHB also extended financial and design support to NCHF for conducting four training programmes for the personnel of housing co-operatives. NCMDARDB was also provided financial assistance for training programmes for officials of co-operative institutions and banks operating in the rural areas. NHB also provided design and faculty support to banks, HFCs and Human Settlement Management Institute (HSMI).
F. Golden Jubilee Rural Housing Finance Scheme
The targets under Golden Jubilee Rural Housing Finance Scheme (GJRHFS) were successfully achieved for the fifth consecutive year during 2001-02 by
48
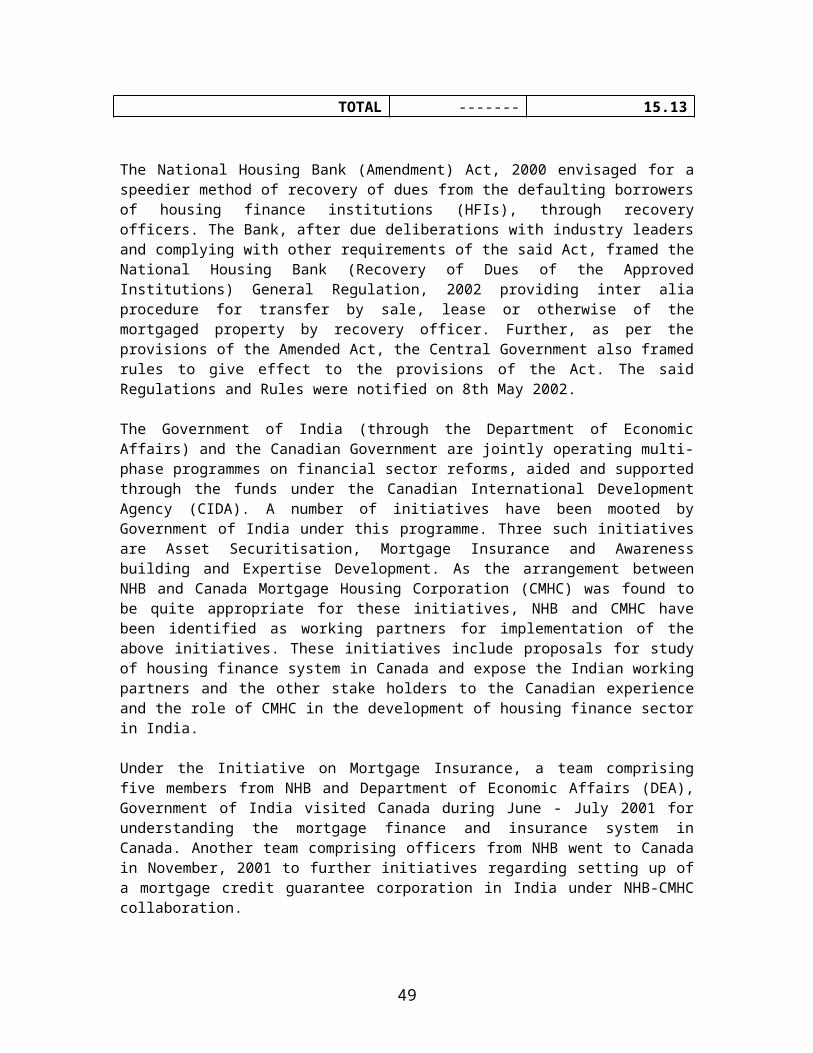
the various implementing agencies. The achievement figures for the year 2001-02 are detailed below:
(number of dwelling units)
InstitutionTarget 2001-02 Achievement 2001-02 Target 2002-03
Approved HFCs 88800 65754 (74.05) 102400Public Sector Banks 83100 106584 (128.26) 106300Cooperative Sector 3100 14930 (481.61) 16300TOTAL 175000 187268 (107.01) 225000Figures in parenthesis indicate percentage achieved
NHB has extended training assistance to implementing agencies and awareness building programmes to ensure effective implementation of the Scheme. The State Level Bankers’ Committee (SLBC) forum has also been successfully utilised by NHB to monitor the progress of the Scheme. The Golden Jubilee Rural Housing Refinance Scheme was launched to provide refinance to eligible primary lending institutions in respect of their lending to individuals for construction/acquisition of new dwelling units and repair / up-gradation of existing dwelling units in rural areas as per the terms and conditions specified by the Refinance Scheme of NHB time to time. Under the scheme, NHB has disbursed Rs.229.50 crore, Rs.239.59 crore, Rs.261.50 crore and Rs.222.20 crore during the years 1998-99, 1999-2000, 2000-01 and 2001-02 respectively.
G. Mortgage Backed Securitisation (MBS)NHB introduced the MBS transactions in the industry under their provisions of the National Housing Bank (Amendment) Act, 2000 and has been floating MBS issues from time to time as part of its Charter. NHB launched its fifth issue of MBS in June 2002 comprising of a pool of 4526 mortgages involving Rs. 85.35 crores originated by Canfin Homes Limited. The issue witnessed an overwhelming response from the investors’ community. The issue was subscribed by 7 institutional investors at a coupon of 8.90%. The subscription of this issue signifies growing investors’ interest in the MBS paper. With this issue, NHB completed securitization of 5 pools of housing loan assets aggregating Rs. 360 crores.
Recognizing the role of mortgage backed securitization (MBS) in linking the housing sector with the capital market and pursuant to the credit policy announcements of April 2002, the Reserve Bank of India issued guidelines in May 2002 for investments by banks in MBS. In terms of the RBI guidelines, investments by banks in MBS backed by the mortgages of housing finance companies recognized and supervised by National Housing Bank, will carry risk weightage of 50% for the purpose of capital adequacy and shall qualify for inclusion in the annual housing finance allocation stipulated for the banks by the RBI.
H. Scheme for Guaranting Bonds of HFCs
The refinance assistance by NHB to HFCs at times get constrained by various factors like NHB’s own NOF, HFCs’ borrowing power etc. In addition, in the
49
present liberalized environment, the HFCs prefer to raise resources directly from market in order to eliminate the cost of intermediation. Besides NHB refinance, HFCs mainly depend upon term loans from banks and public deposits. Of late, the maturity profile of public deposits has been shortening leading to asset liability mismatches for HFCs. One way to overcome this problem is floatation of bonds/debentures having a longer maturity period of say five to seven years. To attract the investors at competitively low rates, such bonds/debentures should have sufficiently high rating. Many of the HFCs have not been able to float bonds/debentures because of the lower credit rating from the rating agencies for various reasons including the inherent mismatch between assets and liabilities. NHB’s intervention in this area was considered critical and accordingly a scheme was introduced to extend guarantee to the bonds/ debentures to be floated by HFCs meeting certain laid down criteria. Under the scheme, NHB will provide top ended guarantee relating to the repayment of principal and interest which will provide necessary credit enhancement and will enable HFCs to acquire higher credit rating leading to competitive pricing of these instruments. The salient features of the scheme are as under:
Scope of the Scheme
The Scheme envisages provision of guarantee by NHB to the investors regarding repayment of principal and interest during the top end (say last two years) irrespective of the repayment schedule fixed by the HFC and the guarantee shall not exceed 67% of the total amount to be raised and the interest thereof.
1. Terms and Conditions for Guarantee
The HFC desirous of availing the guarantee from NHB shall comply with the following terms and conditions: (i) The bond issue shall carry at least a rating of “AA-” from an approved rating agency. However, the Bank may consider providing the guarantee in the case of an instrument being rated 'A‘ subject to the HFC meeting the following requirements:
a) NOF shall be Rs.30 crores or moreb) Net NPA shall be less than 2%c) The HFC shall have earned profit during the last three years or since its inception if it is in existence for less than 3 yearsd) The overdue for more than 3 months should not exceed 10% of the aggregate demand for the yeare) The promoters and the management of the HFC are found to be satisfactoryf) The HFC shall have complied with all the provisions of the Housing Finance Companies (NHB) Directions, 1989 as amended from time to time and all the provisions of the Guidelines on prudential norms.
50
(ii) The maturity of the bonds/debentures shall be for a period of five years to begin with. (iii) The market shall determine the coupon rate.
2. Exposure Norms For the purpose of extending guarantee to the HFCs, exposure limits will be fixed by NHB along with the annual refinance limit. The aggregate amount of the guarantee in a year can be maximum up to the actual amount of the bond to be floated at a time or the annual refinance limit provided in a particular year, whichever is less. The overall borrowing including the amount to be mobilised through the bond/debenture issue shall not be more than 7 times the NOF of the company.
3. Minimum Size of Each Issue The minimum size for each issue should be Rs.10 crores and it will be subject to the overall borrowing powers fixed under the Housing Finance Companies (NHB) Directions, 1989, as amended from time to time.
4. Security The HFCs desirous of availing the guarantee will have to create a floating charge on the assets equivalent to 125% of the principal amount in favour of NHB. In case the HFC offers any other security in addition to a floating charge for its existing borrowing or is in a position to provide further security, the same shall also be asked for. In case of the HFCs, where personal or corporate guarantee has been obtained, the same shall be extended to cover the guarantee for the bonds/debentures.
5. Guarantee Fee For extending the guarantee, the HFCs shall be charged 75 basis points per year of the amount to be floated as guarantee commission and this shall be payable upfront.
6. Creation of Reserves The HFC shall create appropriate bond/debenture redemption reserves as may be laid down under the Companies Act from time to time
7. Returns The HFC shall furnish such returns/information as may be laid down from time to time for the purpose of availing refinance.
51
Chapter –VII
Government Housing Initiatives
The National Housing Policy(NHP) was first formulated in 1988. The long term goal of NHP was to provide housing and minimum level of related amenities and services to the masses and to improve the housing conditions of the inadequately housed. It recognized that housing sector needs concerted efforts from both channels i.e. from formal and informal channels.
The National Housing and Habitat Policy, 1998 evolved after thorough review. It focused on the issues of sustainable development, infrastructure development and advocated for public private partnerships to achieve the objective of Shelter to All. It aims at facilitating construction of 20 lakh additional housing units (13 lakh in Rural Areas and 7 lakh in Urban Areas) annually with an emphasis on extending benefits to the poor and the deprived. Government is committed to the goal of ending all shelterlessness by the end of the 10th Plan Period. For achieving these objectives various action plans under the Ministry of Urban Development and Poverty Alleviation and Ministry of Rural Development have gone on-stream.
Urban Housing
Urbanisation is one of characteristic phenomenon related with the ongoing industrial development and expanding population. India is going through this transition phase and the process of urbanisation is picking up fast. According to Census of India, 2001 the urban population constituted 27.8% of total population of India on 1st March, 2001. There was net addition of 68 million people in the population of urban areas in last decade. The factors like ongoing industrialization in urban areas, population pressure on the agricultural land and dearth of employment opportunities in rural areas forced the emigration of rural population into the urban areas. This influx of human population to urban areas created an acute problem in the Housing and related sectors. The Government has come up with several schemes and initiatives to redress the problems related to Housing and basic infrastructure especially being faced by urban poor.
Valmiki Ambedkar Awas Yojana (VAMBAY)
Prime Minister of India announced a Centrally Sponsored Scheme called Valmiki Ambedkar Awas Yojana (VAMBAY) on the 15th August, 2001 to provide shelter and upgrade the existing shelter for the urban slum dwellers living below poverty line. The Scheme was formally launched by the Hon’ble Prime Minister on December 2, 2001 at Hyderabad. The Scheme was first of its kind in India exclusively meant for slum dwellers with a Government of India subsidy of 50%. The balance 50% is expected to be arranged by the State Governments with funds from any source in the form of subsidy or loan from HUDCO or any other agency. Reputed NGOs can also be associated with
52
Scheme, especially in regard to the National City Sanitation Project viz., Nirmal Bharat Abhiyan, which is an integral part of VAMBAY.
The response from the State / UT Governments to the Scheme has been overwhelming. Against the Government of India’s allocation of Rs.69 crore during 2001-02, huge demands from 16 States/ UTs necessitated release of additional amount of Rs.4.56 crore, with the final figure reaching Rs.73.56 crore.
Urban Reforms Incentives Fund (URIF)
An Urban Reforms Incentive Fund (URIF) has been set up with an initial outlay of Rs. 500 crore to provide reforms linked assistance to States in the housing and real estate sector.
Building Centres and Technology Extension
The National Network of Nirman Kendras (Building Centres) has been established to impart training to artisans in low cost construction skills and produce building materials and components by utilizing agro-industrial wastes. As on 07.12.2001, under this scheme, 572 centres have been sanctioned out of which 436 centres have become functional. These centres have imparted training to more than 2.10 construction workers and artisans. Government of India has provided grant amounting to Rs. 15.12 crore to such centres.
Night shelter and Sanitation facility for Urban Footpath Dwellers
The objective of this Centrally sponsored scheme is to provide adequate shelter to the footpath dwellers in all the urban areas. It has per capita cost of Rs. 20,000/- with 50% coming as subsidy from Central Government and rest 50% flowing in from implementing agencies or through HUDCO. Since April, 1991, out of total 115 schemes sanctioned by HUDCO, 23 schemes have been completed with 8,340 beds, 3,937 WC, 435 baths and 313 urinals. The 115 schemes, when completed, would provide 16,959 beds, 28,980 WC, 2,147 baths and 1,928 urinals.
Housing Scheme for Economically Weaker Sections (EWS)This programme was launched to provide housing to the economically weaker segment of the urban populace. Apart from investments made by State and UT Governments, this programme is supported by Institutional finance. Refinance is also provided by National Housing Bank to the States, Co-operatives and other oraganisations involved in EWS housing. The annual target for the year 2002-03 is 96,571 dwelling units.
Yearly performance under EWS Housing Scheme
Year Target Achievement1996-97 1,16,950 92,0001997-98 1,68,075 81,592
53
1998-99 1,18,000 1,17,0001999-00 69,000 1,02,0002000-01 1,96,000 2,39,0002001-02 2,48,000 19,000*
*Till August 2001; Source : Ministry of Urban Development & Poverty Alleviation
Housing Scheme for Low Income Group (LIG)
This is primarily a long-term scheme which is being executed by the State Governments/UTs through Housing Boards and Housing Departments. The Budget provisions are supplemented by Institutional finance. The income eligibility which was Rs.701-1500 during 7th FYP was raised to Rs.1250 under 8th FYP. For HUDCO schemes month income limit is Rs.2501-5500 per month and loan component is Rs.125000 for construction and Rs.62500 for repairs/ upgradation. The performance of the Scheme against the target allocated during the last five years is given below:
Yearly performances under LIG Housing Scheme
Year Target Achievement1997-98 37,541 16,9671998-99 57,828 41,2441999-00 44,000 27,000
2000-01 27,000 17,000 2001-02 44630 2277*
* Till August, 2001; Source: Ministry of Urban Development & Poverty Alleviation
The annual target for the year 2002-03 is 27,443 housing units.
Environmental Improvement of Urban Slums (EIUS)
This scheme was formulated with a objective to ameliorate the degrading environmental conditions of and around the urban slum areas. The aim of this scheme is to provide and improve the infrastructural amenities, viz., water supply, sewerage and other drains, community baths & latrines, street lighting, pathways etc. for slum dwellers. The performance of the Scheme against the target allocated during the last five years is given below:
Yearly performance under EIUS Scheme
Year Target Achievement1997-98 11,89,898 8,84,8221998-99 43,30,000 33,44,0001999-00 47,05,000 55,73,0002000-01 50,97,000 60,88,0002001-02 60,83,000 12,92,000*
* Till August 2001; Source: Ministry of Urban Development & Poverty Alleviation
The target number of individuals to be covered by this scheme in the year 2002-03 is 5,428,332.
54
Besides above programmes, various other initiatives are being undertaken by government solely or with international assistance for development of slums and housing and urban infrastructure.
55
Rural Housing
According to the Census, 2001 rural population in India is 741,660,293 which is around 72% of total population of India. Thus, without the upliftment and development of rural masses and rural areas, India can not march ahead in the global competition for economic and human development. To meet this need, Government of India has accorded high priority status to Agriculture and Rural development in its various plans and programmes.
Housing is the basic need for sustenance, security and development of a human being. But still, after 5 decades of independence, the condition of housing and related amenities needs much attention and improvement. Government of India has come up with various rural housing schemes to cater the housing needs of rural masses. The Ministry of Rural Development is executing the following programmes to provide shelter for all in the rural expanse.
The Elements of Action Plan for Rural Housing Provision for upgradation of unserviceable kutcha houses in the Indira
Awaas Yojana (IAY) in addition to the new construction. Credit-cum- Subsidy Scheme for Rural Housing. Innovative Stream for Rural Housing & Habitat Development. Rural Building Centres. Samagra Awaas Yojana. Enhancement of equity contribution by Ministry of Rural Development to HUDCO. National Mission for Rural Housing & Habitat.
Indira Awas Yojana (IAY)
This scheme is being implemented by the Government of India since the year 1985-86. The basic objective of the scheme is to provide assistance primarily to the below poverty line (BPL) rural households concentrating more on the Scheduled Castes, Scheduled Tribes and freed bonded labour categories. Subject to the condition that benefits to non SC/STs shall not exceed more than 40%, benefits of the scheme have also been extended to non-categorised rural poor and to the families of the ex-servicemen of the armed and paramilitary forces killed in action. 3% of the houses are reserved for the BPL physically and mentally challenged persons living in rural areas. One of the allotees, under the scheme, should necessarily be female member of the beneficiary household. Further, under the IAY, Gram Sabha is empowered to select the beneficiaries. Allocation of funds under Indira Awaas Yojana to the States/UTs is made based on the poverty ratios as approved by the Planning Commission and the rural housing shortage as per the Census 1991. Both parameters are given equal weightage.
Physical and Financial Achievements under Indira Awas Yojana
Year(For last 5 years)
No. of Houses Built Expenditure (Rs. in Crores)
56
1997-98 770936 1591.481998-99 835770 1803. 88
1999-2000 925679 1907.632000-2001 1170926 2185.802001-2002* 1171081 2149.55
* Provisional; Source: Ministry of Rural Development
Innovative Stream for Rural Housing and Habitat Development
This programme was launched in 1999-2000 with a goal of promoting and propagating the cost effective and environmental friendly construction technologies, materials, designs, etc. for suitable rural human settlements consistent with agro-climatic variation and natural disaster proneness. It is being implemented through both, informal and formal agencies on project basis. The maximum permissible assistance in case of an NGO/autonomous society is Rs. 20.00 lakh and for Government Agencies is Rs. 50.00 lakh.
Setting up of Rural Building Centres
It is a project based demand driven Scheme. The Rural Building Centres are established to attain following goals: (a) Technology transfer and information dissemination (b) Skill upgradation through training (c)Production of cost effective & environment friendly materials/components.
For setting up a Building Centre, a one time grant of Rs.15 lakh is provided by HUDCO.
Samagra Awaas Yojana
Samagra Awaas Yojana is a comprehensive housing Scheme launched in 1999-2000. It was rolled-out with a view to ensuring integrated provision of shelter, sanitation and drinking water. During the first phase of implementation of the Samagra Awaas Yojana, it has been decided to employ the scheme in one block each of 25 districts of 24 States and one Union Territory which have been identified for implementing participatory approach under the Accelerated Rural Water Supply Programme. Apart from housing, drinking water and sanitation, which follow the normal funding pattern, a special central assistance of Rs.25 lakhs is provided to each block for undertaking the overall habitat development and Information, Education and Communication (IEC) activities with 10% contribution coming from the people.
Pradhan Mantri Gramodaya Yojana (Gramin Awaas)
Pradhan Mantri Gramodaya Yojana : Gramin Awaas (PMGY:GA) was launched in the year 2000-2001 to achieve the objective of sustainable
57
human development in rural sector. During 2001-02, an amount of Rs. 280 crore was earmarked for this component of PMGY.
Equity Support to HUDCO
To fulfill the housing needs of EWS and LIG segments in rural areas and to improve the outreach of housing finance in rural areas, equity support to HUDCO has been hiked from Rs. 5 crore to Rs. 355 crore during the Ninth Five Year Plan period. The entire added amount of Rs. 350 crore has been released.
National Mission for Rural Housing and HabitatThe Ministry of Rural Development has constituted a National Mission for Rural Housing and Habitat to facilitate a constant flow of science and technology inputs into the housing sector. It will work towards convergence of technology, habitat and energy-related issues in order to provide affordable shelter for all in the rural areas, within a specified time-frame, and through community participation. To meet this objective, an Executive Council under the Chairmanship of the Minister of Rural Development and an Empowered Committee under the Chairmanship of Secretary (Rural Development) has been constituted. The Action Plan prepared by its Working Group is under consideration.
NABARD’s refinance for rural housing
During the year 2001-02, the National Housing Bank for Agriculture and Rural Development (NABARD) decided to include rural housing as an eligible activity for extension of refinance against loans extended by all eligible banks. Individuals, cooperative housing societies, public bodies, housing boards, housing development authorities, improvement trusts, local bodies, voluntary agencies and non-government organizations registered with the National Housing Bank would be eligible for borrowing for construction of new as well as renovation of existing houses in rural areas.
Other Initiatives
National Agenda for Governance- 2 Million Housing Programme
The National Agenda for Governance has taken up Housing as priority area. The Agenda envisages to give major thrust on housing for vulnerable and deprived sections. In order to meet this objective Government has launched the 2 Million Housing Programme (2 MHP) in 1998. Under this programme, target taken up is of 20 lakh additional housing units every year with a focus on EWS & LIG housing. Out of this 20 lakh units, 7 lakh are reserved for Urban areas and 13 lakh units are to be constructed in Rural areas.
Yearly Performance under NAG-2MHP(Amount in Rs. crore)
1999-2000 2000-2001 2001-2002
58
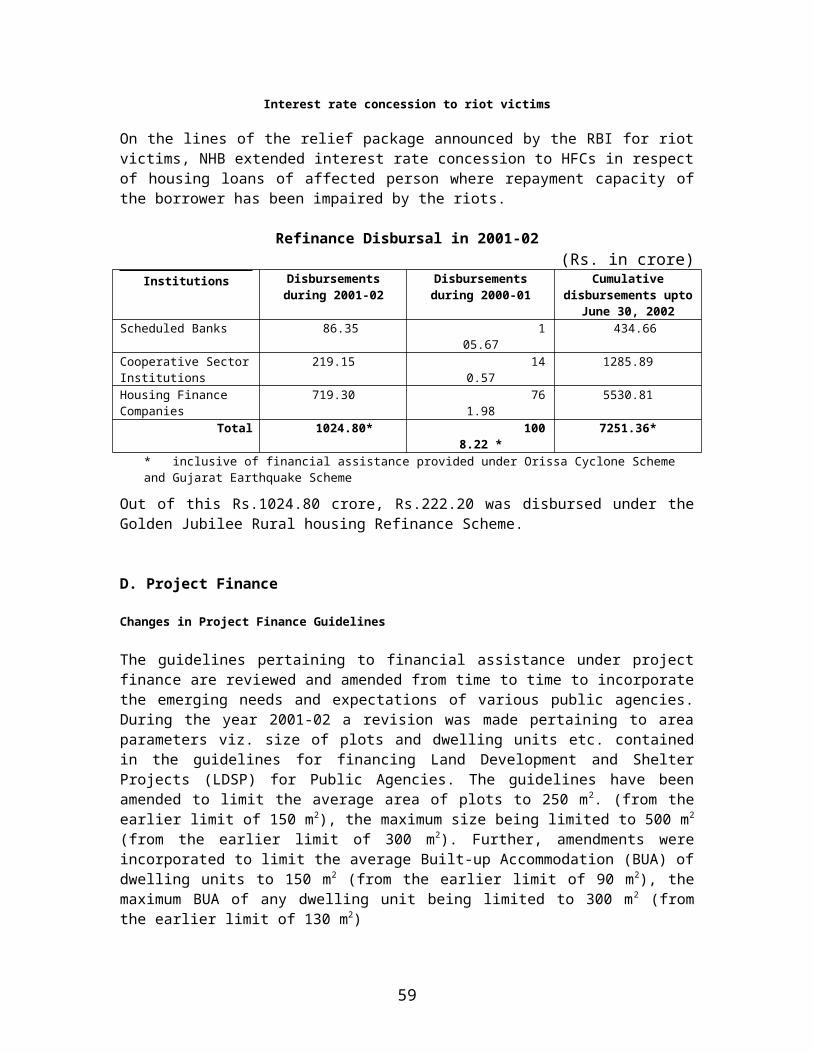
Units Amount Units Amount Units AmountPublic Sector Banks 128080 5603.04 225205 5202.79 263314 6548.56HFCs* 182424 4382.93 224370 5586.35 323242 8646.59TOTAL 310504 9985.97 449575 10789.1
4586556 15195.1
5* excluding HUDCO
59
Chapter VIII
Assessment & Prospect
The housing finance disbursement continued to grow at a steady pace during the year 2001-02. However, the presence of formal financial mechanism continued to be felt mainly in the urban and metropolitan areas. The rural areas still remained relatively underserved by the specialised housing finance institutions. While the keen interest evinced by the banking fraternity for housing finance might go a long way in addressing the problem of rural housing shortage by virtue of considerable presence of commercial banks, specially those in the public sector in rural India, the problem for the formal sector institutions to lend in the rural areas still persists due to lack of suitable security. Usually, the formal sector financing institutions insist on mortgage of the property as security for the loan. But in most cases, due to non availability of land records, it is not possible to verify the title to the land on which the house has been constructed. There is thus an urgent need to have these records created, preferably a computerised one for easy retrieval. The Government of India had introduced a scheme for the purpose. While some of the states have done well in computerising the land records in the rural areas, some other states are yet to do so. Early implementation of this scheme in all the states would lead to a better flow of institutional credit for housing in the rural areas where the shortage of housing is more.
With a view to addressing the twin problems of ‘affordability” and “accessibility” that thwart the progress of housing in the country, NHB is contemplating to introduce mortgage insurance in India. Significant advancement towards this objective has been made during the current year. Besides the Canada Mortgage and Housing Corporation, the Asian Development Bank, the International Finance Corporation and the United Guarantee Mortgage Indemnity Company, a member of the American International Group Incorporated have expressed their interest to participate in this venture. With the introduction of mortgage credit guarantee, it is expected that the housing finance market will expand and the section of the population which hitherto could not access credit from an institution in the formal sector will be in a position to do so through the scheme, making the dream of “housing for all” a reality.
With the commercial banks entering the housing finance market with renewed vigour which is partly attributable to factors like low level of NPAs in this sector and partly the lack of demand for funds from the other sectors of the economy, the ultimate borrower is benefited because of wider choice. Further, the cost of funds for the commercial banks being lower than that of the HFCs, the borrowers are also given the benefit of lower rate of interest. In addition, banks have also waived some other charges like the processing fee and done away with certain other requirements like the guarantor etc. This has triggered a price war among the institutions extending housing loans and quite a good number of loans have been refinanced. In a highly fragmented and segmented market, the profit margins could be driven down to survival levels when volume drops precipitously. Fortunately, the volume of new loans
60
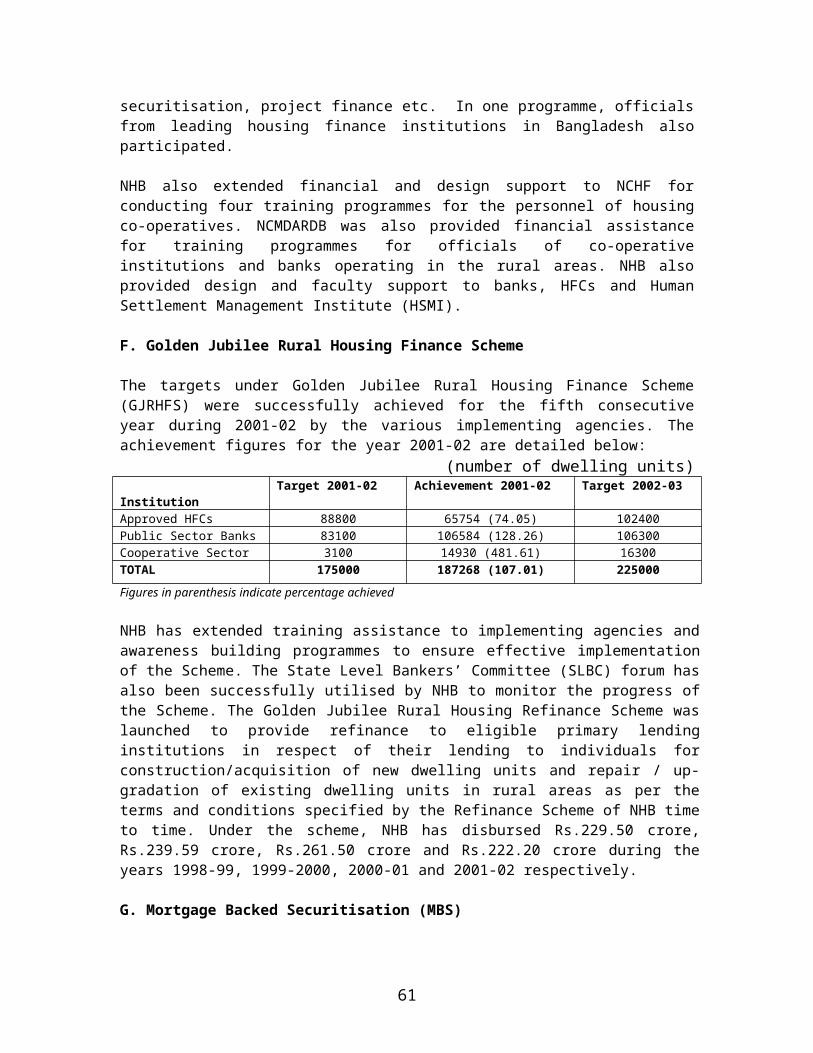
disbursed especially to the individual segment has maintained a steady growth during the year. The number of refinanced loans is expected to come down in the coming year as the rate differential among the institutions would be narrowed down owing to intense competition and more efficient functioning of the market in terms of information symmetry etc. and there would be more number of loans being originated at the new low level with less chance of being refinanced.
Any economic activity undertaken is beset with risk and the business of extending housing loans is no exception. It is in this context, the National Housing Bank has introduced the Asset Liability Management guidelines for the housing finance companies which are more or less on the similar lines issued by the Reserve Bank of India to the commercial banks and the non-banking financial companies. Asset Liability Management is an effective tool for the overall risk management and the HFCs are expected to implement this during the year 2002-2003.
The next year could also see a series of mortgage backed securities issue in view of the significant concessions extended to the banking system by the Reserve Bank of India regarding their investment in such securities. Further the notification of the rules and procedures for recovery of housing loans as envisaged under the National Housing Bank (Amendment) Act, 2002 should also strengthen the confidence of the investors.
Thus, with the introduction of a mortgage credit guarantee scheme and the scheme for recovering the loans from wilful defaulters being made easy, the housing finance sector is expected to witness further growth during the coming years. With the mortgage backed securitisation picking up, the much needed long term resources should also be available for the sector.
61