Embed Size (px)
Citation preview

First Conference on Rail Industry Structure, Competition and Investment
New Rail Passenger Structures in the U.S.
Louis S. ThompsonThompson, Galenson and Associates, LLC
Rail Passenger History in the U.S.
Downhill slide after WWIIFreight railways were heavily burdenedOptions in 1969:
Do nothingPay the freightsCreate separate company
Federally owned, “as if for profit” company (Amtrak)Has not succeeded, but hard to change

Rail Passenger-Miles in the U.S.
010,00020,00030,00040,00050,00060,00070,00080,00090,000
100,000
19251930
19351940
19451950
19551960
19651970
19751980
19851990
19952000
Commuter rail Freight EraAmtrakIntercity total

Financial Performance of U.S. Railroads:Net Railway Operating Income (NROI) and Solely Related Passenger Losses (SRL) (constant 2002 $ millions)
-6000-4000-2000
02000400060008000
10000120001400016000
1940 1945 1950 1955 1960 1965 1970
Pass. "NROI"Pass. SRLClass I total NROI

Financial Performance of U.S. Railroads:Net Railway Operating Income and Solely Related Passenger Losses(constant 2002 $ millions)
Figure 3
-6000-4000-2000
02000400060008000
10000120001400016000
1940 1950 1960 1970 1980 1990 2000
Pass. "NROI"AmtrakClass I total NROIPoly. (Class I total NROI)
DeregulationAmtrak

Amtrak funding by yearin constant 2002 dollars
0
500
1000
1500
2000
2500
3000
1971 1976 1981 1986 1991 1996 2001
OrdinaryNECIPTRAOtherTotal
Total through FY2003: $38,273 million
$ millions
Note: in addition, Amtrak’s debt increased by over$3 billion between FY96 and FY2002.

Amtrak’s Role
Long haul trains not major carrierShort haul trains have some share of the marketNEC is significant (I/S and Operator)Relatively small by international stdsInteresting interaction with State rail passenger operators (FTAA/FRA)

Amtrak System Map
NEC

Empire Builder
Coast Starlight
Calif Zephyr
Southwest Chief City ofNew Orleans
Sunset Limited
Texas Eagle Crescent
Cardinal
CapitolThree Rivers
Lakeshore
“Silver” Trains (3)
Pennsylvanian
Autotrain
Amtrak’s Long Haul Network

Amtrak’s Short Haul Routes
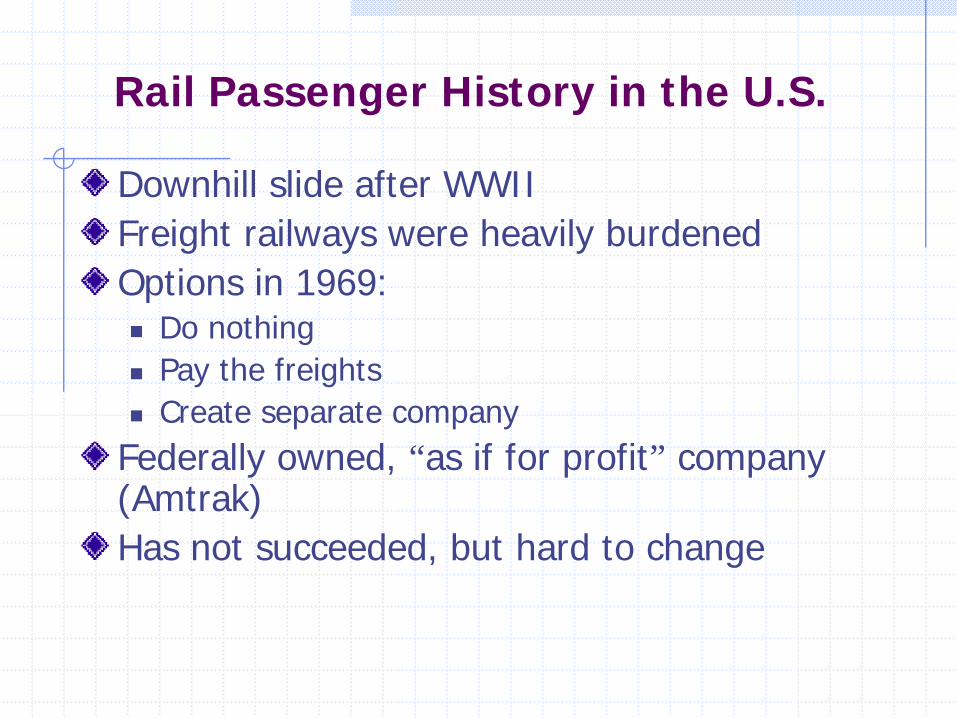
Proposals on the Table
Amtrak Reform Council (ARC)The Administration BillCBO studyAmerican Rail Equity Act (AREA)American Railroad Revitalization, Investment and Enhancement Act (ARRIVE)

Change Issues
Better interface: Congress/DOT/AmtrakStable fundingTransition short haul to State/LocalAmtrak/DOT grant agreementAmtrak as contract commuter operatorBetter public informationChange in private roleImpact on laborSins of the past
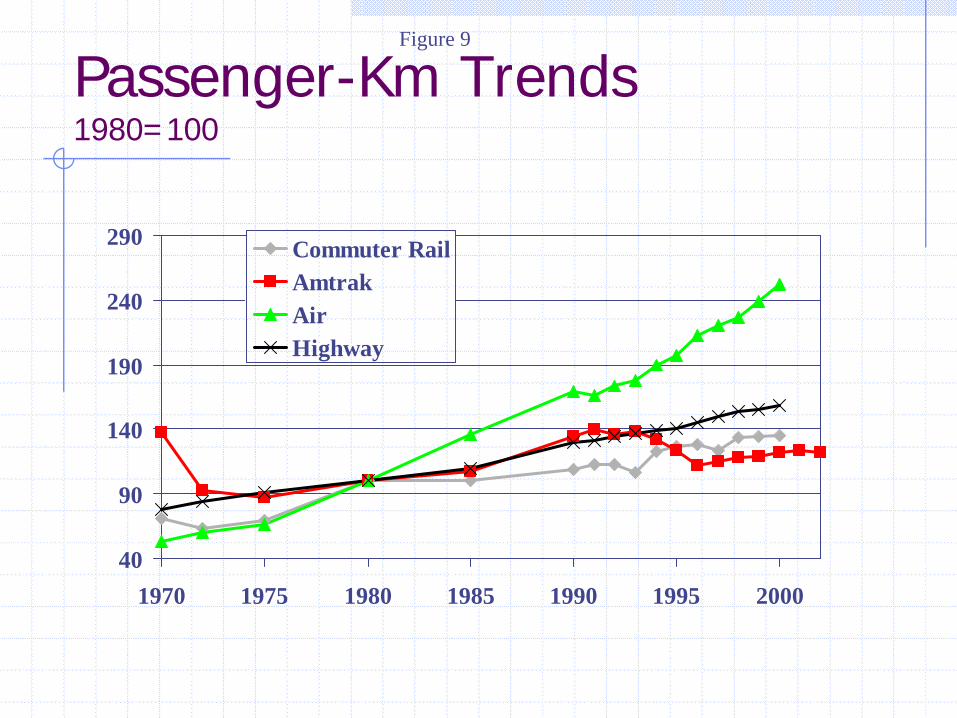
Passenger-Km Trends1980=100
40
90
140
190
240
290
1970 1975 1980 1985 1990 1995 2000
Commuter RailAmtrakAirHighway
Figure 9

Labor Productivity Trends (pm/employee or ton-mile/employee) 1980=100
050
100150200250300350400450500
1970 1975 1980 1985 1990 1995 2000
Air Bus, Class IFreight RailroadsTrucking Amtrak
Source: National Transportation Statistics 2002, Table 3-24 and AAR, Statistics of Class I railroads

Passenger-Miles/Employee (000)(2000)
277
973
222
0
200
400
600
800
1000
1200Amtrak only
Amtrak (adj forcommuters)Airlines
Amtrak adjustment for commuters uses average 22 mi/commuter trip.Probably overstates productivity slightly.
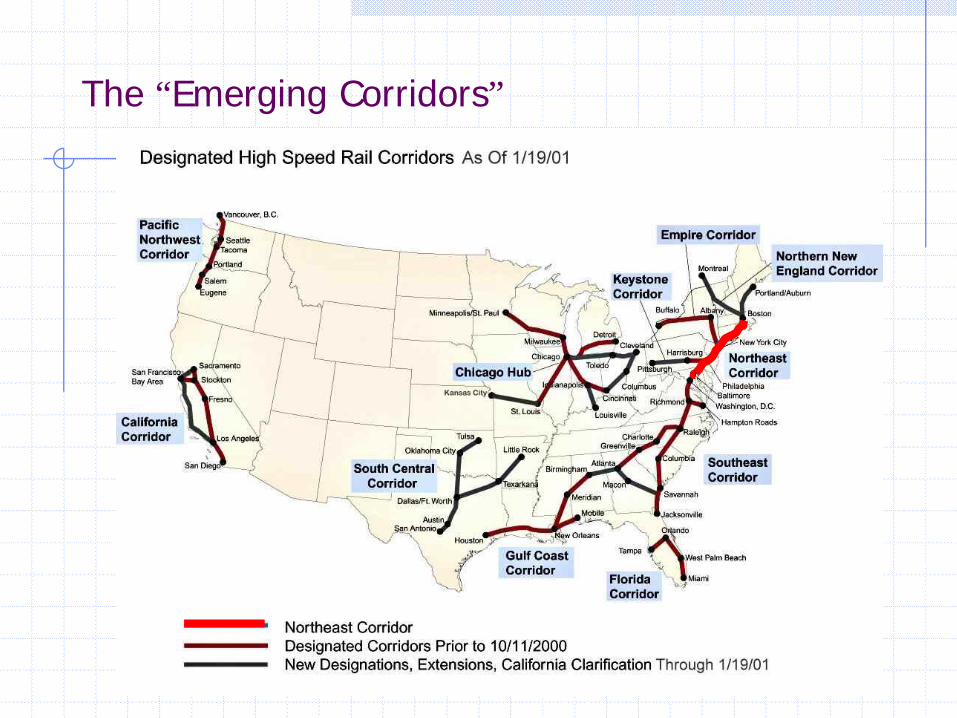
The “Emerging Corridors”