Embed Size (px)
Citation preview
First Capital Research Analyst: First Capital Research he
Earnings Update
SRI LANKA
P a g e | 1
Disclosure on Shareholding: First Capital Group and its affiliates does not hold shares of CTC and will not trade in this share for the three trading days following the issue of this document
Jan 2018 Current Price – LKR 1,030.0 Fair value – LKR 958 [2018E] Buy Below Price - LKR 911.87 3Q2017 Earnings 12%YoY
11212112%YoY
CEYLON TOBACCO COMPANY PLC CSE: CTC.N0000 Bloomberg: CTC SL Maintain SELL
“Persistent challenges from the regulatory environment leads to a difficult road ahead”
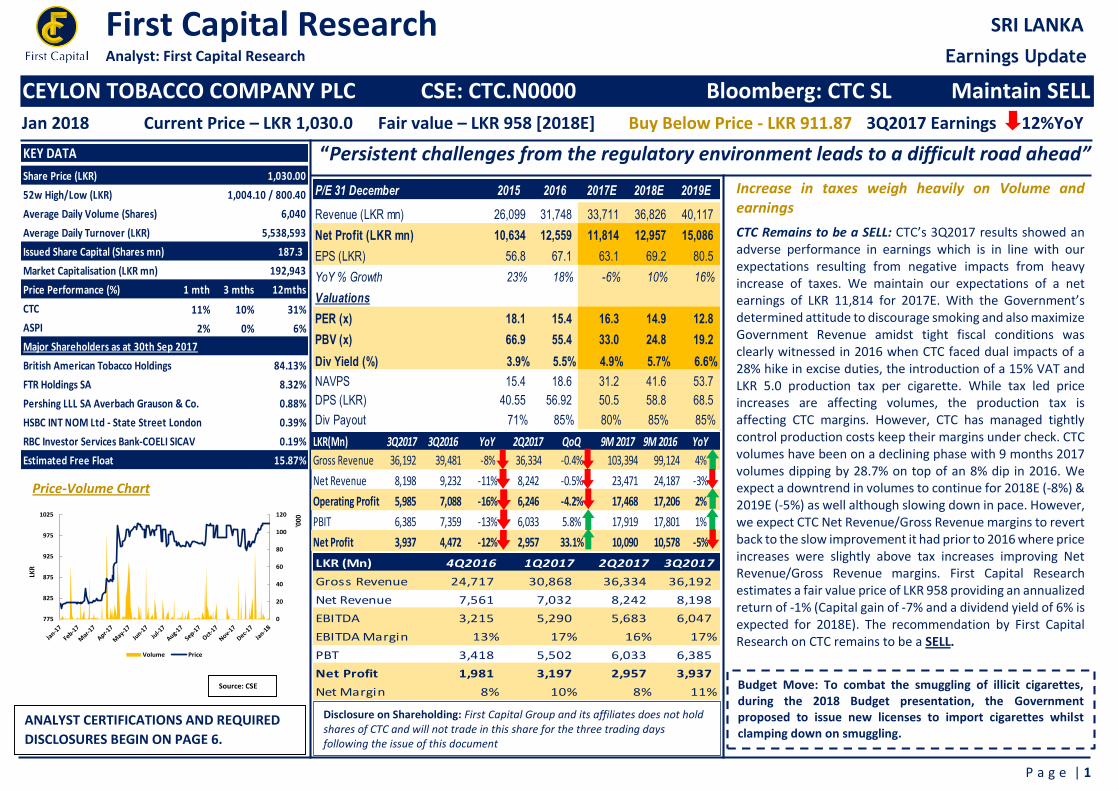
Price-Volume Chart
Increase in taxes weigh heavily on Volume and earnings
CTC Remains to be a SELL: CTC’s 3Q2017 results showed an adverse performance in earnings which is in line with our expectations resulting from negative impacts from heavy increase of taxes. We maintain our expectations of a net earnings of LKR 11,814 for 2017E. With the Government’s determined attitude to discourage smoking and also maximize Government Revenue amidst tight fiscal conditions was clearly witnessed in 2016 when CTC faced dual impacts of a 28% hike in excise duties, the introduction of a 15% VAT and LKR 5.0 production tax per cigarette. While tax led price increases are affecting volumes, the production tax is affecting CTC margins. However, CTC has managed tightly control production costs keep their margins under check. CTC volumes have been on a declining phase with 9 months 2017 volumes dipping by 28.7% on top of an 8% dip in 2016. We expect a downtrend in volumes to continue for 2018E (-8%) & 2019E (-5%) as well although slowing down in pace. However, we expect CTC Net Revenue/Gross Revenue margins to revert back to the slow improvement it had prior to 2016 where price increases were slightly above tax increases improving Net Revenue/Gross Revenue margins. First Capital Research estimates a fair value price of LKR 958 providing an annualized return of -1% (Capital gain of -7% and a dividend yield of 6% is expected for 2018E). The recommendation by First Capital Research on CTC remains to be a SELL.
Budget Move: To combat the smuggling of illicit cigarettes, during the 2018 Budget presentation, the Government proposed to issue new licenses to import cigarettes whilst clamping down on smuggling.
1
2
0
20
40
60
80
100
120
775
825
875
925
975
1025
'000
LKR
Volume Price
ANALYST CERTIFICATIONS AND REQUIRED
DISCLOSURES BEGIN ON PAGE 6.
Source: CSE
KEY DATA
Share Price (LKR)
52w High/Low (LKR)
Average Daily Volume (Shares)
Average Daily Turnover (LKR)
187.3
Price Performance (%) 1 mth 3 mths 12mths
CTC 11% 10% 31%
ASPI 2% 0% 6%
84.13%
8.32%
0.88%
0.39%
0.19%RBC Investor Services Bank-COELI SICAV
Estimated Free Float 15.87%
HSBC INT NOM Ltd - State Street London
Issued Share Capital (Shares mn)
Market Capitalisation (LKR mn) 192,943
Major Shareholders as at 30th Sep 2017
British American Tobacco Holdings
FTR Holdings SA
Pershing LLL SA Averbach Grauson & Co.
5,538,593
1,030.00
6,040
1,004.10 / 800.40 P/E 31 December 2015 2016 2017E 2018E 2019E
Revenue (LKR mn) 26,099 31,748 33,711 36,826 40,117
Net Profit (LKR mn) 10,634 12,559 11,814 12,957 15,086
EPS (LKR) 56.8 67.1 63.1 69.2 80.5
YoY % Growth 23% 18% -6% 10% 16%
Valuations
PER (x) 18.1 15.4 16.3 14.9 12.8
PBV (x) 66.9 55.4 33.0 24.8 19.2
Div Yield (%) 3.9% 5.5% 4.9% 5.7% 6.6%
NAVPS 15.4 18.6 31.2 41.6 53.7
DPS (LKR) 40.55 56.92 50.5 58.8 68.5
Div Payout 71% 85% 80% 85% 85%
LKR(Mn) 3Q2017 3Q2016 YoY 2Q2017 QoQ 9M 2017 9M 2016 YoY
Gross Revenue 36,192 39,481 -8% 36,334 -0.4% 103,394 99,124 4%
Net Revenue 8,198 9,232 -11% 8,242 -0.5% 23,471 24,187 -3%
Operating Profit 5,985 7,088 -16% 6,246 -4.2% 17,468 17,206 2%
PBIT 6,385 7,359 -13% 6,033 5.8% 17,919 17,801 1%
Net Profit 3,937 4,472 -12% 2,957 33.1% 10,090 10,578 -5%
LKR (Mn) 4Q2016 1Q2017 2Q2017 3Q2017
Gross Revenue 24,717 30,868 36,334 36,192
Net Revenue 7,561 7,032 8,242 8,198
EBITDA 3,215 5,290 5,683 6,047
EBITDA Margin 13% 17% 16% 17%
PBT 3,418 5,502 6,033 6,385
Net Profit 1,981 3,197 2,957 3,937
Net Margin 8% 10% 8% 11%
First Capital Research Analyst: First Capital Research he
Earnings Update
SRI LANKA
P a g e | 2
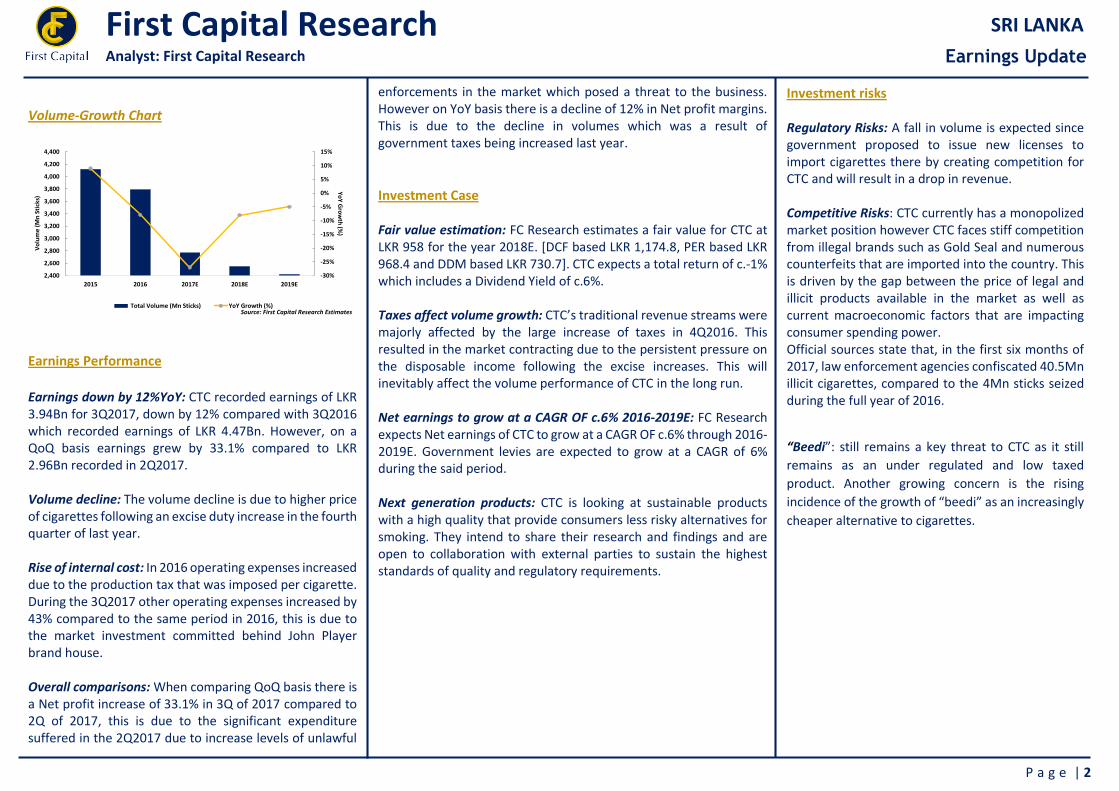
Volume-Growth Chart
Earnings Performance
Earnings down by 12%YoY: CTC recorded earnings of LKR 3.94Bn for 3Q2017, down by 12% compared with 3Q2016 which recorded earnings of LKR 4.47Bn. However, on a QoQ basis earnings grew by 33.1% compared to LKR 2.96Bn recorded in 2Q2017. Volume decline: The volume decline is due to higher price of cigarettes following an excise duty increase in the fourth quarter of last year. Rise of internal cost: In 2016 operating expenses increased due to the production tax that was imposed per cigarette. During the 3Q2017 other operating expenses increased by 43% compared to the same period in 2016, this is due to the market investment committed behind John Player brand house. Overall comparisons: When comparing QoQ basis there is a Net profit increase of 33.1% in 3Q of 2017 compared to 2Q of 2017, this is due to the significant expenditure suffered in the 2Q2017 due to increase levels of unlawful
-30%
-25%
-20%
-15%
-10%
-5%
0%
5%
10%
15%
2,400
2,600
2,800
3,000
3,200
3,400
3,600
3,800
4,000
4,200
4,400
2015 2016 2017E 2018E 2019E
Yo
Y G
row
th (%
)
Vo
lum
e (
Mn
Sti
cks)
Total Volume (Mn Sticks) YoY Growth (%)Source: First Capital Research Estimates
enforcements in the market which posed a threat to the business. However on YoY basis there is a decline of 12% in Net profit margins. This is due to the decline in volumes which was a result of government taxes being increased last year.
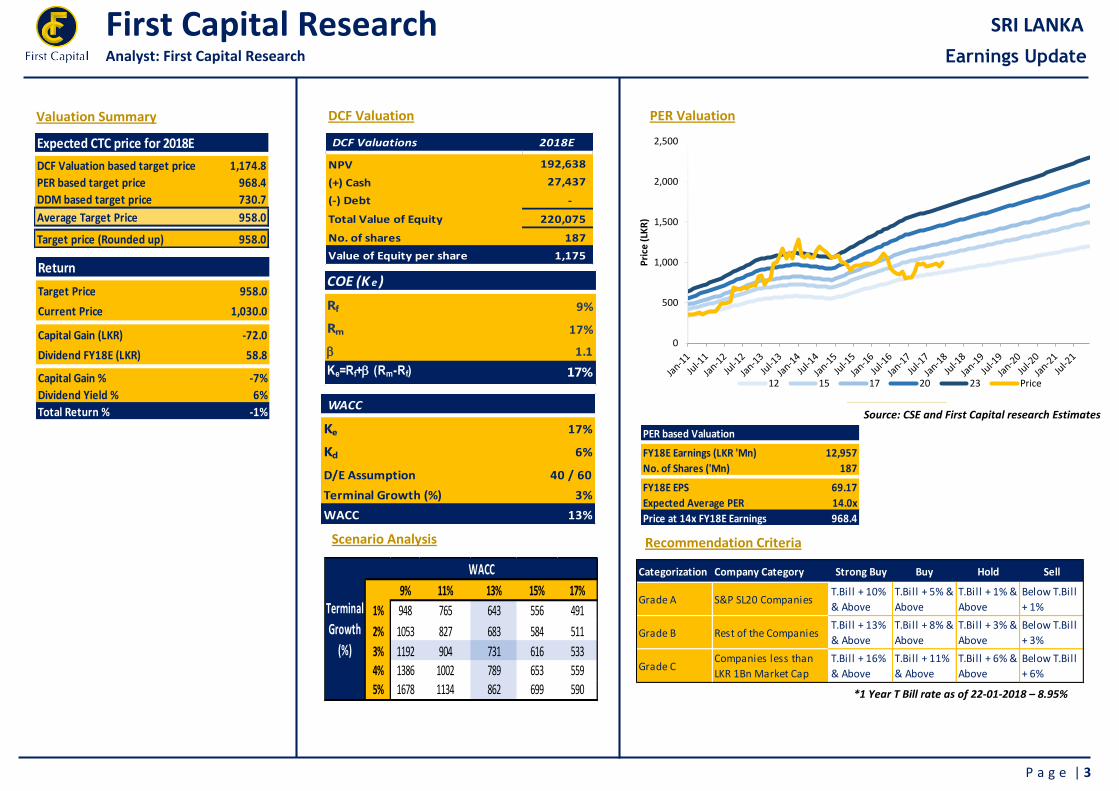
Investment Case Fair value estimation: FC Research estimates a fair value for CTC at LKR 958 for the year 2018E. [DCF based LKR 1,174.8, PER based LKR 968.4 and DDM based LKR 730.7]. CTC expects a total return of c.-1% which includes a Dividend Yield of c.6%. Taxes affect volume growth: CTC’s traditional revenue streams were majorly affected by the large increase of taxes in 4Q2016. This resulted in the market contracting due to the persistent pressure on the disposable income following the excise increases. This will inevitably affect the volume performance of CTC in the long run. Net earnings to grow at a CAGR OF c.6% 2016-2019E: FC Research expects Net earnings of CTC to grow at a CAGR OF c.6% through 2016-2019E. Government levies are expected to grow at a CAGR of 6% during the said period. Next generation products: CTC is looking at sustainable products with a high quality that provide consumers less risky alternatives for smoking. They intend to share their research and findings and are open to collaboration with external parties to sustain the highest standards of quality and regulatory requirements.
Investment risks Regulatory Risks: A fall in volume is expected since government proposed to issue new licenses to import cigarettes there by creating competition for CTC and will result in a drop in revenue. Competitive Risks: CTC currently has a monopolized market position however CTC faces stiff competition from illegal brands such as Gold Seal and numerous counterfeits that are imported into the country. This is driven by the gap between the price of legal and illicit products available in the market as well as current macroeconomic factors that are impacting consumer spending power. Official sources state that, in the first six months of 2017, law enforcement agencies confiscated 40.5Mn illicit cigarettes, compared to the 4Mn sticks seized during the full year of 2016.
“Beedi”: still remains a key threat to CTC as it still
remains as an under regulated and low taxed
product. Another growing concern is the rising
incidence of the growth of “beedi” as an increasingly
cheaper alternative to cigarettes.
First Capital Research Analyst: First Capital Research he
Earnings Update
SRI LANKA
P a g e | 3
PER Valuation
Source: CSE and First Capital research Estimates
DCF Valuation
Recommendation Criteria
Categorization Company Category Strong Buy Buy Hold Sell
Grade A S&P SL20 CompaniesT.Bill + 10%
& Above
T.Bill + 5% &
Above
T.Bill + 1% &
Above
Below T.Bill
+ 1%
Grade B Rest of the CompaniesT.Bill + 13%
& Above
T.Bill + 8% &
Above
T.Bill + 3% &
Above
Below T.Bill
+ 3%
Grade CCompanies less than
LKR 1Bn Market Cap
T.Bill + 16%
& Above
T.Bill + 11%
& Above
T.Bill + 6% &
Above
Below T.Bill
+ 6%
Valuation Summary
*1 Year T Bill rate as of 22-01-2018 – 8.95%
Investment risks Regulatory Risks: A fall in volume is expected since government proposed to issue new licenses to import cigarettes there by creating competition for CTC and will result in a drop in revenue.
Competitive Risks: CTC currently has a monopolized market position however CTC faces stiff competition from illegal brands such as Gold Seal and numerous counterfeits that are imported into the country. This is driven by the gap between the price of legal and illicit products available in the market as well as current macroeconomic factors that are impacting consumer spending power.
Official sources state that, in the first six months of 2017, law enforcement agencies confiscated 40.5Mn illicit cigarettes, compared to the 4Mn sticks seized during the full year of 2016.
Scenario Analysis
COE (K e )
Rf 9%
Rm 17%
1.1
Ke=Rf+ (Rm-Rf) 17%
WACC
Ke 17%
Kd 6%
D/E Assumption 40 / 60
Terminal Growth (%) 3%
WACC 13%
0
500
1,000
1,500
2,000
2,500
Pri
ce (
LKR
)
12 15 17 20 23 Price
Expected CTC price for 2018E
DCF Valuation based target price 1,174.8
PER based target price 968.4
DDM based target price 730.7
Average Target Price 958.0
Target price (Rounded up) 958.0
Return
Target Price 958.0
Current Price 1,030.0
Capital Gain (LKR) -72.0
Dividend FY18E (LKR) 58.8
Capital Gain % -7%
Dividend Yield % 6%
Total Return % -1%
DCF Valuations 2018E
NPV 192,638
(+) Cash 27,437
(-) Debt -
Total Value of Equity 220,075
No. of shares 187
Value of Equity per share 1,175
731 9% 11% 13% 15% 17%
1% 948 765 643 556 491
2% 1053 827 683 584 511
3% 1192 904 731 616 533
4% 1386 1002 789 653 559
5% 1678 1134 862 699 590
Terminal
Growth
(%)
WACC
PER based Valuation
FY18E Earnings (LKR 'Mn) 12,957
No. of Shares ('Mn) 187
FY18E EPS 69.17
Expected Average PER 14.0x
Price at 14x FY18E Earnings 968.4
First Capital Research Analyst: First Capital Research he
Earnings Update
SRI LANKA
P a g e | 4
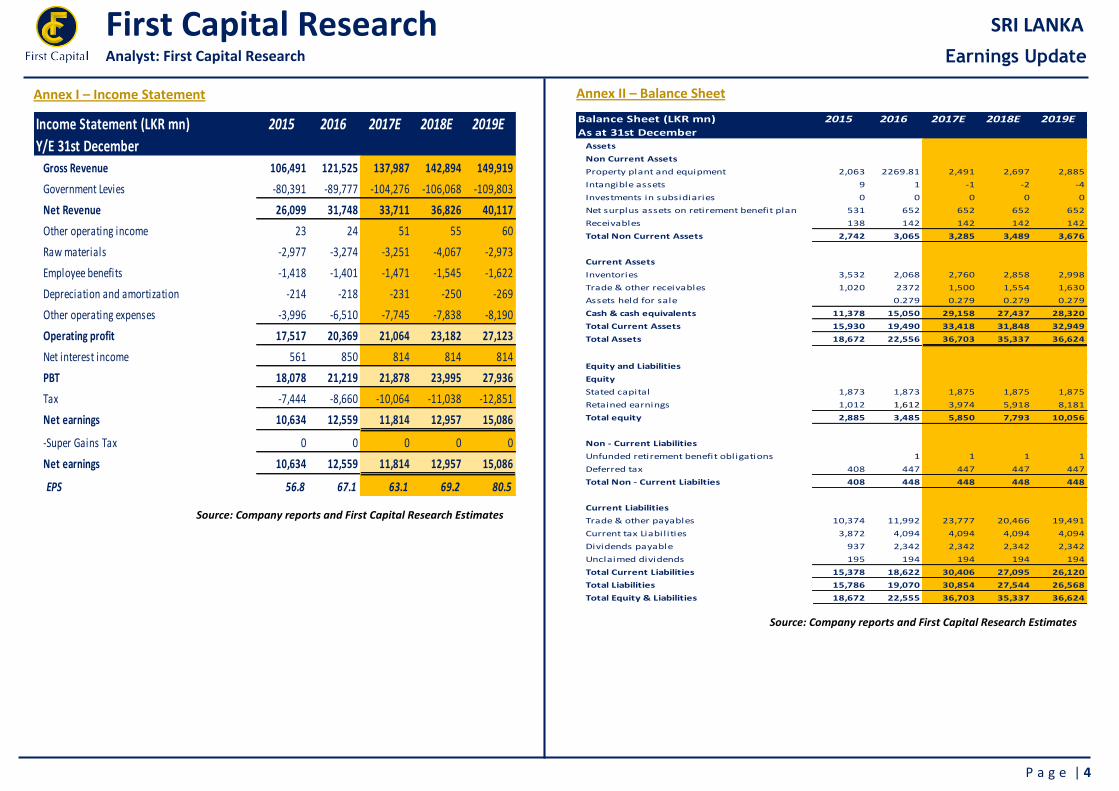
Annex II – Balance Sheet Annex I – Income Statement
Source: Company reports and First Capital Research Estimates
Source: Company reports and First Capital Research Estimates
Income Statement (LKR mn) 2015 2016 2017E 2018E 2019E
Y/E 31st December
Gross Revenue 106,491 121,525 137,987 142,894 149,919
Government Levies -80,391 -89,777 -104,276 -106,068 -109,803
Net Revenue 26,099 31,748 33,711 36,826 40,117
Other operating income 23 24 51 55 60
Raw materials -2,977 -3,274 -3,251 -4,067 -2,973
Employee benefits -1,418 -1,401 -1,471 -1,545 -1,622
Depreciation and amortization -214 -218 -231 -250 -269
Other operating expenses -3,996 -6,510 -7,745 -7,838 -8,190
Operating profit 17,517 20,369 21,064 23,182 27,123
Net interest income 561 850 814 814 814
PBT 18,078 21,219 21,878 23,995 27,936
Tax -7,444 -8,660 -10,064 -11,038 -12,851
Net earnings 10,634 12,559 11,814 12,957 15,086
-Super Gains Tax 0 0 0 0 0
Net earnings 10,634 12,559 11,814 12,957 15,086
EPS 56.8 67.1 63.1 69.2 80.5
Balance Sheet (LKR mn) 2015 2016 2017E 2018E 2019E
As at 31st DecemberAssets
Non Current Assets
Property plant and equipment 2,063 2269.81 2,491 2,697 2,885
Intangible assets 9 1 -1 -2 -4
Investments in subsidiaries 0 0 0 0 0
Net surplus assets on retirement benefit plan 531 652 652 652 652
Receivables 138 142 142 142 142
Total Non Current Assets 2,742 3,065 3,285 3,489 3,676
Current Assets
Inventories 3,532 2,068 2,760 2,858 2,998
Trade & other receivables 1,020 2372 1,500 1,554 1,630
Assets held for sale 0.279 0.279 0.279 0.279
Cash & cash equivalents 11,378 15,050 29,158 27,437 28,320
Total Current Assets 15,930 19,490 33,418 31,848 32,949
Total Assets 18,672 22,556 36,703 35,337 36,624
Equity and Liabilities
Equity
Stated capital 1,873 1,873 1,875 1,875 1,875
Retained earnings 1,012 1,612 3,974 5,918 8,181
Total equity 2,885 3,485 5,850 7,793 10,056
Non - Current Liabilities
Unfunded retirement benefit obligations 1 1 1 1
Deferred tax 408 447 447 447 447
Total Non - Current Liabilties 408 448 448 448 448
Current Liabilities
Trade & other payables 10,374 11,992 23,777 20,466 19,491
Current tax Liabilities 3,872 4,094 4,094 4,094 4,094
Dividends payable 937 2,342 2,342 2,342 2,342
Unclaimed dividends 195 194 194 194 194
Total Current Liabilities 15,378 18,622 30,406 27,095 26,120
Total Liabilities 15,786 19,070 30,854 27,544 26,568
Total Equity & Liabilities 18,672 22,555 36,703 35,337 36,624
First Capital Research Analyst: First Capital Research he
Earnings Update
SRI LANKA
P a g e | 5
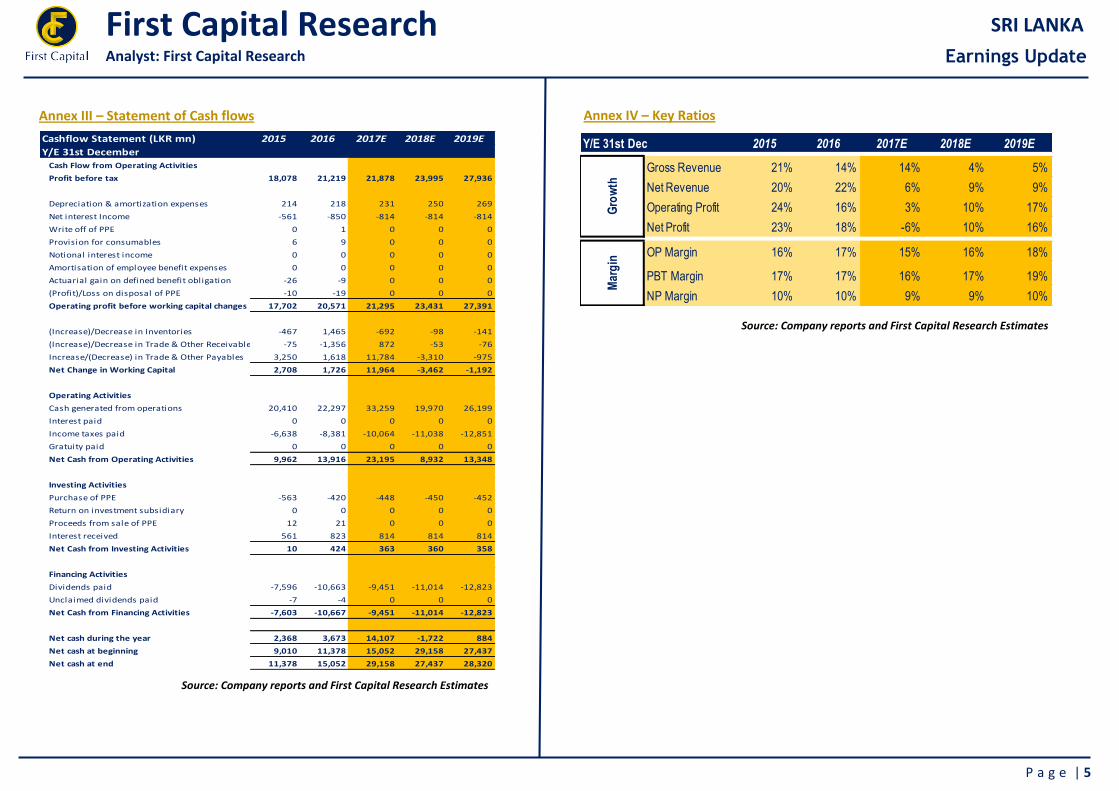
Annex IV – Key Ratios
Source: Company reports and First Capital Research Estimates
Annex III – Statement of Cash flows
Source: Company reports and First Capital Research Estimates
Cashflow Statement (LKR mn) 2015 2016 2017E 2018E 2019E
Y/E 31st DecemberCash Flow from Operating Activities
Profit before tax 18,078 21,219 21,878 23,995 27,936
Depreciation & amortization expenses 214 218 231 250 269
Net interest Income -561 -850 -814 -814 -814
Write off of PPE 0 1 0 0 0
Provision for consumables 6 9 0 0 0
Notional interest income 0 0 0 0 0
Amortisation of employee benefit expenses 0 0 0 0 0
Actuarial gain on defined benefit obligation -26 -9 0 0 0
(Profit)/Loss on disposal of PPE -10 -19 0 0 0
Operating profit before working capital changes 17,702 20,571 21,295 23,431 27,391
(Increase)/Decrease in Inventories -467 1,465 -692 -98 -141
(Increase)/Decrease in Trade & Other Receivables -75 -1,356 872 -53 -76
Increase/(Decrease) in Trade & Other Payables 3,250 1,618 11,784 -3,310 -975
Net Change in Working Capital 2,708 1,726 11,964 -3,462 -1,192
Operating Activities
Cash generated from operations 20,410 22,297 33,259 19,970 26,199
Interest paid 0 0 0 0 0
Income taxes paid -6,638 -8,381 -10,064 -11,038 -12,851
Gratuity paid 0 0 0 0 0
Net Cash from Operating Activities 9,962 13,916 23,195 8,932 13,348
Investing Activities
Purchase of PPE -563 -420 -448 -450 -452
Return on investment subsidiary 0 0 0 0 0
Proceeds from sale of PPE 12 21 0 0 0
Interest received 561 823 814 814 814
Net Cash from Investing Activities 10 424 363 360 358
Financing Activities
Dividends paid -7,596 -10,663 -9,451 -11,014 -12,823
Unclaimed dividends paid -7 -4 0 0 0
Net Cash from Financing Activities -7,603 -10,667 -9,451 -11,014 -12,823
Net cash during the year 2,368 3,673 14,107 -1,722 884
Net cash at beginning 9,010 11,378 15,052 29,158 27,437
Net cash at end 11,378 15,052 29,158 27,437 28,320
2015 2016 2017E 2018E 2019E
Gross Revenue 21% 14% 14% 4% 5%
Net Revenue 20% 22% 6% 9% 9%
Operating Profit 24% 16% 3% 10% 17%
Net Profit 23% 18% -6% 10% 16%
OP Margin 16% 17% 15% 16% 18%
PBT Margin 17% 17% 16% 17% 19%
NP Margin 10% 10% 9% 9% 10%
Y/E 31st Dec
Gro
wth
Mar
gin
First Capital Research Analyst: First Capital Research he
Earnings Update
SRI LANKA
P a g e | 6
Research Disclosure
NOTICE TO US INVESTORS
This report was prepared, approved, published and distributed by First Capital Equities (Pvt) Ltd, company located outside of the United States (a “non-US Group Company”). This report is distributed in the U.S. by LXM LLP USA, a U.S. registered broker dealer, on behalf of First Capital Equities (Pvt) Ltd only to major U.S. institutional investors (as defined in Rule 15a-6 under the U.S. Securities Exchange Act of 1934 (the “Exchange Act”)) pursuant to the exemption in Rule 15a-6 and any transaction effected by a U.S. customer in the securities described in this report must be effected through LXM LLP USA.
Neither the report nor any analyst who prepared or approved the report is subject to U.S. legal requirements or the Financial Industry Regulatory Authority, Inc. (“FINRA”) or other regulatory requirements pertaining to research reports or research analysts. No non-US Group Company is registered as a broker-dealer under the Exchange Act or is a member of the Financial Industry Regulatory Authority, Inc. or any other U.S. self-regulatory organization.
Analyst Certification. Each of the analysts identified in this report certifies, with respect to the companies or securities that the individual analyses, that (1) the views expressed in this report reflect his or her personal views about all of the subject companies and securities and (2) no part of his or her compensation was, is or will be directly or indirectly dependent on the specific recommendations or views expressed in this report. Please bear in mind that (i) First Capital Equities (Pvt) Ltd is the employer of the research analyst(s) responsible for the content of this report and (ii) research analysts preparing this report are resident outside the United States and are not associated persons of any US regulated broker-dealer and that therefore the analyst(s) is/are not subject to supervision by a US broker-dealer, and are not required to satisfy the regulatory licensing requirements of FINRA or required to otherwise comply with US rules or regulations regarding, among other things, communications with a subject company, public appearances and trading securities held by a research analyst account.
Important US Regulatory Disclosures on Subject Companies. This material was produced by Analysis First Capital Equities (Pvt) Ltd solely for information purposes and for the use of the recipient. It is not to be reproduced under any circumstances and is not to be copied or made available to any person other than the recipient. It is distributed in the United States of America by LXM LLP USA and elsewhere in the world by First Capital Equities (Pvt) Ltd or an authorized affiliate of First Capital Equities (Pvt) Ltd. This document does not constitute an offer of, or an invitation by or on behalf of First Capital Equities (Pvt) Ltd or its affiliates or any other company to any person, to buy or sell any security. The information contained herein has been obtained from published information and other sources, which First Capital Equities (Pvt) Ltd or its Affiliates consider to be reliable. None of First Capital Equities (Pvt) Ltd accepts any liability or responsibility whatsoever for the accuracy or completeness of any such information. All estimates, expressions of opinion and other subjective judgments contained herein are made as of the date of this document. Emerging securities markets may be subject to risks significantly higher than more established markets. In particular, the political and economic environment, company practices and market prices and volumes may be subject to significant variations. The ability to assess such risks may also be limited due to significantly lower information quantity and quality. By accepting this document, you agree to be bound by all the foregoing provisions.
LXM LLP USA assumes responsibility for the research reports content in regards to research distributed in the U.S. LXM LLP USA or its affiliates has not managed or co-managed a public offering of securities for the subject company in the past 12 months, has not received compensation for investment banking services from the subject company in the past 12 months, does not expect to receive and does not intend to seek compensation for investment banking services from the subject company in the next 3 months. LXM LLP USA has never owned any class of equity securities of the subject company. There are not any other actual, material conflicts of interest of LXM LLP USA at the time of the publication of this research report. As of the publication of this report LXM LLP USA, does not make a market in the subject securities.
No. 02, Deal Place, General: +94 11 2639 898
Colombo 03. Fax: +94 11 5736 264
Dimantha Mathew +94 11 2639 853 Amanda Lokugamage +94 11 2639 868 Kandy Kurunegala
Atchuthan Srirangan +94 11 2639 863 CSE - Kandy Branch, CSE - Kurunegala Branch,
Hansinee Beddage +94 11 2639 864 "Ceybank House", 1st Floor, Union Assurance Building,
No: 88, Sri Dalada Veediya, No 06, Rajapihilla Mawatha,
Kandy 20000. Kurunegala 60000.
Roshana Samarakoon +94 77 3363 820 Anjelo Simmons +94 77 3031 636 Manager: Salinda Samarakoon Manager: Menaka Wavegedara
Anushka Dissanayake +94 77 2220 021 Arun Kandasamy +94 75 4861 506 Tel: +94 81 2236 010 Tel: +94 37 2222 930
Anushi Ranawaka +94 77 3876 819
Matara Negombo
2nd Floor, E.H. Cooray Building No: 163B,
No: 24, 1/3, Colombo Road,
Sewwandi Kathriarachchi +94 77 3461 734 Naveen Samarasekera +94 77 0073 684 Anagarika Dharmapala Mawatha, Negombo 11500
Nethalie De Mel +94 11 2639 854 Kemith De Zoysa +94 77 2390 691 Matara 81000. Negombo 11500.
Manager: Rohana Jayakody Manager: Buddhika Edirisinghe
CEO Jaliya Wijeratne +94 70 2910 042 Negombo Tel: +94 41 2222 988 Tel: +94 31 4937 072
Priyanka Anuruddha +94 70 2910 035
Colombo Priyantha Wijesiri +94 70 2910 036
Damian Le Grand +94 70 2910 032
Nishantha Mudalige +94 70 2910 041
Isuru Jayawardana +94 70 2910 034
Ifadh Marikar +94 70 2910 033
Thushara Pathiraja +94 70 2910 037
Anushka Buddhika +94 70 2910 030
Gamini Hettiarachchi +94 70 2910 039
Kosala Liyanagedara +94 77 7230 788 Poorni Fernando +94 77 2440 531
Disclamer
First Capital Holdings PLC
RESEARCH
GOVERNMENT SECURITIES SALES
CORPORATE DEBT SALES
EQUITY SALES
BRANCHES
This Review is prepared and issued by First Capital Equities (Pvt) Ltd. based on information in the public domain, internally developed and other sources, believed to be correct. Although all reasonable care has been taken to ensure the contents of the Review are accurate, First Capital Equities (Pvt) Ltd and/or its
Directors, employees, are not responsible for the correctness, usefulness, reliability of same. First Capital Equities (Pvt) Ltd may act as a Broker in the investments which are the subject of this document or related investments and may have acted on or used the information contained in this document, or the
research or analysis on which it is based, before its publication. First Capital Equities (Pvt) Ltd and/or its principal, their respective Directors, or Employees may also have a position or be otherwise interested in the investments referred to in this document. This is not an offer to sell or buy the investments
referred to in this document. This Review may contain data which are inaccurate and unreliable. You hereby waive irrevocably any rights or remedies in law or equity you have or may have against First Capital Equities (Pvt) Ltd with respect to the Review and agree to indemnify and hold First Capital Equities (Pvt)
Ltd and/or its principal, their respective directors and employees harmless to the fullest extent allowed by law regarding all matters related to your use of this Review. No part of this document may be reproduced, distributed or published in whole or in part by any means to any other person for any purpose
without prior permission.
About us
UNIT TRUST SALES
This report providing a snapshot of fixed income, equity and unit trust is composed and
circulated by First Capital Holdings PLC an investment bank in Sri Lanka. The company
operates in the capital market of Sri Lanka with operations in government securities -
treasury bills and bonds, stock brokering and share market investments, asset
management, private wealth management, retirement planning, personal financial
planning, unit trust, margin trading, capital market research, trustee services, corporate
finance advisory services including corporate debt structuring (debentures, trust
certificates, commercial papers), valuations, restructuring, mergers and acquisitions, initial
public offerings (IPOs) and project advisory. The First Capital Group consists of First
Capital Treasuries PLC, First Capital Limited, First Capital Markets Limited, First Capital
Asset Management Limited and First Capital Equities (Private) Limited covering Colombo,
Negombo, Matara, Kandy and Kurunegala.
FIRST CAPITAL RESEARCH