Embed Size (px)
Citation preview

First bloom record of toxic dinoflagellateProrocentrum lima and climate changeinteractions in the Dardanelles (TurkishStraits Sistem)
Muhammet Turkoglu (PhD)Çanakkale Onsekiz Mart University, Marine Science
and Technology Faculty, Terzioglu Campus 17100
Çanakkale, Turkey

Main Scope of the Study
The main target of this study
is to exhibit the bloom
circumstances and the
reasons of toxic and
tycoplanktonic dinoflagellate
P. lima along with
environmental characteristics,
hydrographic structure,
inorganic nutrients, and
chlorophyll a in summer
period in the Dardanelles.
Black Sea
Aegean Sea
19 July 2013
19 July 2013

Main Scope of the Study
This study reports the first bloom of P. lima and interactions of this species with other phytoplankton species in response to environmental parameters for the first time in the Dardanelles .
Black Sea
Aegean Sea
Marmara Sea
20 July 2013
20 July 2013

Description of phytoplankton and HABs
Black Sea
Observations of HABs have been increasing intricate
phenomena which cause serious environmental and
economic troubles on a global scale, as are fall in with in
Mediterranean, frequently in coastal waters, in relation
to anthropogenic inputs and hereby habitat changes
occurred during the past a few decades (Turkoglu, 2008;
Collos et al., 2009; Nincevic Gladan et al., 2009; Garces
and Camp, 2012; Turkoglu, 2013).
Therefore, habitats most affected by HABs include bays,
harbours, estuaries and lagoons affected by eutrophication.
Phytoplankton species are single-celled microscopic
plants (Domain: Protista) that are the base of aquatic life.
Harmful algal or phytoplankton blooms (HABs) develop
in the marine or freshwater environment when there is an
excess of growth of these organisms because of
eutrophication in that environment (Anderson, 1994;
Hallegraeff, 1995).

Description of phytoplankton and HABs
Black Sea
An important factor for the
formation and toxicity of HABs is
more availability of nutrients, such
as nitrogen and phosphate than
their background levels (Graneli et
al., 1998).
Over the past three decades, the
occurrence of harmful algal blooms
has increased in many marine
aquatic ecosystems of the world,
both in frequency and in geographic
distribution (Anderson, 1989;
Smayda, 1990; Hallegraeff, 1993). 20 July 2013
June 2003

Description of target species (P.lima)
Black Sea
The dinoflagellate Prorocentrum lima (Ehrenberg) F.Stein, 1878 is a
marine photosynthetic species which contains two chloroplasts, a
central pyrenoid and a large posterior nucleus and an armor plate.
This species lives in benthic, epiphytic and tycoplanktonic with world
wide distribution.
This species varies considerably in size as well as shape: 31-
57µm in length; 20-46 µm wide. World-wide distribution, neritic
and estuarine, benthic/epiphytic (Faust et al. 1999), sand
dwelling, can be tychoplanktonic (Steidinger & Tangen 1996),
attached to the surface of red and brown algae and floating
mangrove detritus.
P. lima is a toxic species. The primary toxins are okadaic acid (OA)
and dinophysistoxin (DTX) and their derivatives. These toxins are
responsible for diarrhetic shellfish poisoning (DSP) in humans.
Unfortunately, a small cell density of this species produce such
vigorous neurotoxins which can be transfered through the food
web where they affect and even kill the higher life forms such as
zooplankton, shellfish, fish, birds, marine mammals, and even
humans via food web.

Identification of the study Area (Dardanelles)
The Dardanelles is a part of the TurkishStrait System and located between theAegean Sea and the Sea of Marmara.
It has two flow system reverse to oneanother; one of the currents derivesfrom the Aegean Sea, where the waterdensity is high (38-39 ppt), and thesecond one comes from the Sea ofMarmara, characteristically low indensity (22-26 ppt).
The width of the Strait varies from 1.35 to7.73 km (average: 2.5 km).
The average depth of the Strait isapproximately 60 m with the deepestpart reaching more than 100 m (Unsal etal. 2003; Turkoglu et al. 2004a, 2006;Baba et al. 2007).

Identification of the study Area (Dardanelles)
Its NE/SW trend is interrupted by anorth-south bend between Eceabatand Canakkale. This bend is also thenarrowest part of the Dardanelles.
In addition to the first bend, there is asecond bend called “Nara Cape”.
The narrowing of the Dardanelles leadsto different surface temperature andsalinity values in the northeast andsouthwest of the Nara Cape.
The surface waters in the southernpart of the Dardanelles were alsomore saline especially in the springand winter seasons compared toother seasons (Unsal et al., 2003;Turkoglu et al., 2004, 2006).
Nara Cape

Material and Method (Sampling Station)
This study was planned in the period of 09 July 2013 and 06 August 2013 coincided with excessive blooms of phytoplankton in view of both dinoflagellates and diatoms in the Dardanelles at sampling station in Fig. 1.
The location of the sampling station (40o06ı50ıı N–26o24ı10ıı E) is given in Fig. 1.
The sampling station is an topographical upwelling area due to the narrowing and ridge between Çanakkale and Kilitbahir.
The depth of the study area in the Dardanelles is about 5.00 m.
Sampling Station
Fig. 1. Study area and sampling station

Material and Method (Collection of Water Samples)
In order to collect
phytoplankton, nutrient
and chlorophyll-a
samples, etc., Hydrobios
Niskin Sampling Bottle
was used.
Hydrobios
Niskin Sampling Bottle

Material and Method (In situ Measurements – CTD)
CTD parameters
such as temperature,
salinity, pH, and
dissolved oxygen
(DO) were measured
in situ using an YSI
556 Model Multiple
Probe System.
YSI 556 Model MPS

Material and Method (Nutrient Analysis)
Nutrients (NO-2+NO-
3,PO-3
4 and SiO4) wereanalysed by a techniconmodel auto-analyzeraccording to Strickland &Parsons (1972).
Auto-analyzer
Material and Method (Chlorophyll a Analysis)
Chlorophyll a was analyzed spectrophotometrically after extraction by 90% acetone (Strickland & Parsons 1972).
Spectrophotometer

Material and Method (Quantitative analysis of phytoplankton)
For quantitative analysis ofphytoplankton, samples werepreserved with 2% lugolfixative and microscopicanalysis was conductedwithin a week of thecollection.
Sampling Glass, SedimentationChambers, Neubauer andSedgwick Rafter CountingSlides were used in combinationfor enumeration of thephytoplankton speciesdepending on the dimensionsand concentrations of theorganisms (Guillard 1978; Hasle1978; Venrick 1978).

RESULTS AND DISCUSSION Species Description
Cells of P. lima arephotosynthetic approximatelyoval, with the anteriornarrower than the posterior,thus often egg-shaped.
The cell sizes of P. lima arenearly 40-45 µm long and 25-28 µm wide. The cells arelaterally compressed andcomposed of two valves witha small cluster of eightperiflagellar plates.
Chloroplasts
in live cell

RESULTS AND DISCUSSION Species Description
During the HAB period,morphological structure ofP. lima in the Dardanelleswas substantially similar tothe morphological structurein other marine systems(Morton & Tindall, 1995;Maranda et al., 2007;Nagahama et al., 2011).
However, the cell sizes of P.lima in the study area weregenerally bigger (nearly 40-45 µm long and 25-28 µmwide) than in any othermarine system as averagevalues (Nagahama et al.,2011).
Fig.2. Morphological characters of the toxic
dinoflagellate P. lima in the HAB period in the
Dardanelles

RESULTS AND DISCUSSION Succession of P. lima and other
phytoplankton groups
During the study,although thecontribution of P.lima to totalphytoplankton waslower (6.61%) due tothe high diatomcontribution (min-max: 82.2-100; mean:91.9 ± 5.47), it’scontribution to bothProrocentrum spp.(min-max: 0-100%;mean: 56.8 ± 34.7%)and dinoflagellateswere higher (min-max: 0-100%; mean:35.4 ± 24.8%) (Table1).
Phytoplankton Cell Density (Cell L-1) N Minimum Maximum Mean SD
Prorocentrum lima 21 0.00E+00 2.40E+06 5.02E+05 5.72E+05
Prorocentrum spp. 21 0.00E+00 2.40E+06 7.63E+05 5.82E+05
Dinoflagellates 21 0.00E+00 6.16E+06 1.34E+06 1.40E+06
Diatoms 21 4.67E+06 6.24E+07 2.10E+07 1.38E+07
Other Groups 21 0.00E+00 3.67E+06 5.85E+05 1.01E+06
Total Phytoplankton 21 4.67E+06 7.17E+07 2.29E+07 1.54E+07
Ratios (%) N Minimum Maximum Mean SD
Contribution of P.lima to Prorocentrum spp. 21 0.00 100 56.8 34.7
Contribution of P.lima to dinoflagellates 21 0.00 100 35.4 24.8
Contribution of P.lima to total phyto. 21 0.00 6.61 2.14 2.05
Contribution of dinoflagellates to total phyto. 21 0.00 16.1 5.92 4.39
Contribution of diatoms to total phyto. 21 82.2 100 91.9 5.47
Contribution of other groups to total phyto. 21 0.00 14.1 2.11 3.26
Table 1. Descriptive statistics of phytoplankton cell densities and
their ratios to each other in the HAB period of the toxic
dinoflagellate Prorocentrum lima in the Dardanelles

RESULTS AND DISCUSSION Succession of P. lima and other
phytoplankton groups
Fig. 3. Daily variations of toxic dinoflagellate Prorocentrum
lima and it’s rational contributions to Prorocentrum spp.,
dinoflagellates, diatoms, other groups except for
dinoflagellates and diatoms and total phytoplankton in the
HAB period of the toxic dinoflagellate Prorocentrum lima in
the Dardanelles
During the study the cell density of P.
lima reached to 2.40 x 10⁶ cells L-1 at 19
July 2013 and this species, in total,
formed four excessive blooms in
different time frames of summer season
in excess of 1.00 x 10⁶ cells L-1.
In the intensive bloom periods the
contribution of P.lima to both
Prorocentrum spp. and dinoflagellates
reached to 100% which was attested by
regression (R2=0.70-0.80) (Fig. 4),
correlation findings (R=0.80-0.90) and
similarity index results (>70-80%).
However, phytoplankton abundance
was more similar to diatoms (95.6%)
than dinoflagellates (11.1%) due to the
excessive diatom during the study.

RESULTS AND DISCUSSION Succession of P. lima and other
phytoplankton groups
Fig. 4. Relationships between cell densities of Prorocentrum lima and
Prorocentrum spp. (A), dinoflagellates (B), Bacillariophyceae (C) and
total phytoplankton (D) in the HAB period of the toxic dinoflagellate
Prorocentrum lima in the Dardanelles. The coefficients of
determination (R2) and the equating process (y) are shown for each
regression.
Fig. 5. Bray–Curtis Cluster analysis results between Prorocentrum
lima, Prorocentrum spp., dinoflagellates, diatoms, other groups out of
dinoflagellates and diatoms and total phytoplankton cell density in the
HAB period of the toxic dinoflagellate Prorocentrum lima in the
Dardanelles

RESULTS AND DISCUSSION CTD variations in the P. limabloom period
Table 2 and Fig. 6 indicated that during the HAB period, studyarea was generally stable in view of all environmentalcharacters except for DO. There was a variation in DOconcentrations probably due to the various algal bloomssourced from P.lima and others, especially diatoms (Fig. 6).
Spatiotemporal distributions in the world and this studyindicated that P. lima were more eurythermal and euryhalinesimilar to other species of Prorocentrum spp. than the otherdinoflagellates.
For instance, in summer period while the average temperaturevalue in the study area was 24.7 ± 0.44 oC in the surfacewaters of the study area, the average salinity value was 22.9 ±0.49 ppt was less saline than other marine systems (35-39 ppt).
In suchc an environment, phytoplankton was highly abundant(2.29 x 10⁷ ± 1.54 x 10⁷ cell L-1).
CTD Parameters N
Minimu
m
Maxim
um Mean SD
Physical
Parameters
Temperature (oC) 21 24.0 25.0 24.7 0.44
Salinity (ppt) 21 21.4 23.5 22.9 0.49
pH 21 8.01 8.54 8.23 0.15
DO (mg L-1) 21 6.05 8.62 7.35 0.60
Table 2. Descriptive statistics of CTD parameters in the HAB
period of the toxic dinoflagellate Prorocentrum lima in the
Dardanelles
Fig. 6. Daily variations of temperature, salinity, pH and
dissolved oxygen (DO) in the HAB period of the toxic
dinoflagellate Prorocentrum lima in the Dardanelles

RESULTS AND DISCUSSION Nutrient and chlorophyll avariations in the P.lima bloom period
Nutrient concentrations in the study were lower thanprevious concentrations (Unsal et al., 2003; Turkoglu,2008, 2013) probably due to the excessive utilizationsof nutrients by P.lima blooms and other phytoplanktonblooms, especially diatoms during the HAB period.
High nutrient levels during the HAB period indicatedthat primary productivity in the study area was affectedby more nitrogen than phosphate due to theeutrophication in the Dardanelles.
Due to the comprehensive blooms, there were highchlorophyll a levels (min-max:1.57-8.52, average: 4.82µg L-1) during the study in the Dardanelles (Fig. 7).
Table 3. Descriptive statistics of nutrient and chlorophyll a
concentrations in the HAB period of the toxic dinoflagellate
Prorocentrum lima in the Dardanelles
Fig. 7. Daily variations of nutrient (NO-2+NO-
3, PO-34
and SiO4) concentrations in the HAB period of the
toxic dinoflagellate Prorocentrum lima in the
Dardanelles
Environmental
Factors N
Minimu
m
Maxim
um Mean SD
Nutrients (µM)
NO-2+NO-
3 21 0.20 0.78 0.44 0.17
PO-34 21 0.08 0.18 0.12 0.03
SiO4 21 0.25 0.65 0.41 0.09
Chlorophyll Chla (µg L-1) 21 1.57 8.52 4.82 2.29

RESULTS AND DISCUSSION Nutrient and chlorophyll avariations in the P.lima bloom period
Nutrient ratios, especially N:P and Si:P werelower than Redfield ratios (N:P=6:1;Si:P=15:1; Si:N=15:16). The ratios indicatedthat primary productivity in the study area wasaffected by more nitrogen than phosphate dueto the eutrophication in the Turkish StraitsSystem (Fig. 8).
In the other words, the system was exposedto hypereutrophication and so nitrate was morelimiting nutrient than phosphate.
Table 4. Descriptive statistics of nutrient ratios in the HAB
period of the toxic dinoflagellate Prorocentrum lima in the
Dardanelles
Fig. 8. Temporal distribution of nutrient ratios (N:P,
Si:P and Si:N) in the HAB period of the toxic
dinoflagellate Prorocentrum lima in the Dardanelles
Environmental
Factors N
Minim
um
Maxim
um Mean SD
Nutrient Ratios
N:P 21 1.57 7.50 4.04 1.74
Si:P 21 1.67 6.50 3.79 1.24
Si:N 21 0.51 1.95 1.04 0.36

RESULTS AND DISCUSSION Succession of P. lima and other
phytoplankton groups
In light of the nutrient concentrations,nutrient ratios, chla, and harmfullphytoplankton blooms (HABs), the Seaof Marmara and thereby theDardanelles are underneath all theheavy pollution due to the urban wastewaters of Istanbul and polluted NorthWest Black Sea surface waters comingthrough the Bosphorus (Istanbul Strait).
The study calls attention to a possibleintensification of DSP events in theDardanelles in light of excessiveProrocentrum blooms in theDardanelles.
19 July 2013
19 July 2013

Although there was animportant development ofthe P. lima and otherphytoplankton bloom inthe Dardanelles, therewasn’t any apparently colorchange in the system insummer (09 July and 06August, 2013) in visiblemanner.
However, satallite imagesfrom NASA confirms thephytoplankton bloms in theTSS in July, 2013.
20 July 2013
RESULTS AND DISCUSSION HABs and Satellite images in real HAB time in the TSS

RESULTS AND DISCUSSION HABs and Satellite images in real HAB time in the TSS
13 July 2013

RESULTS AND DISCUSSION HABs and Satellite images in real HAB time in the TSS
15 July 2013

RESULTS AND DISCUSSION HABs and Satellite images in real HAB time in the TSS
15 July 2013

RESULTS AND DISCUSSION HABs and Satellite images in real HAB time in the TSS
19 July 2013

RESULTS AND DISCUSSION HABs and Satellite images in real HAB time in the TSS
20 July 2013

RESULTS AND DISCUSSION HABs and Satellite images in real HAB time in the TSS
20 July 2013

RESULTS AND DISCUSSION HABs and Satellite images in real HAB time in the TSS
05 August 2013

RESULTS AND DISCUSSION HABs and Satellite images in real HAB time in the TSS
Chla minimum period (July 25, 2013) in
the Dardanelles
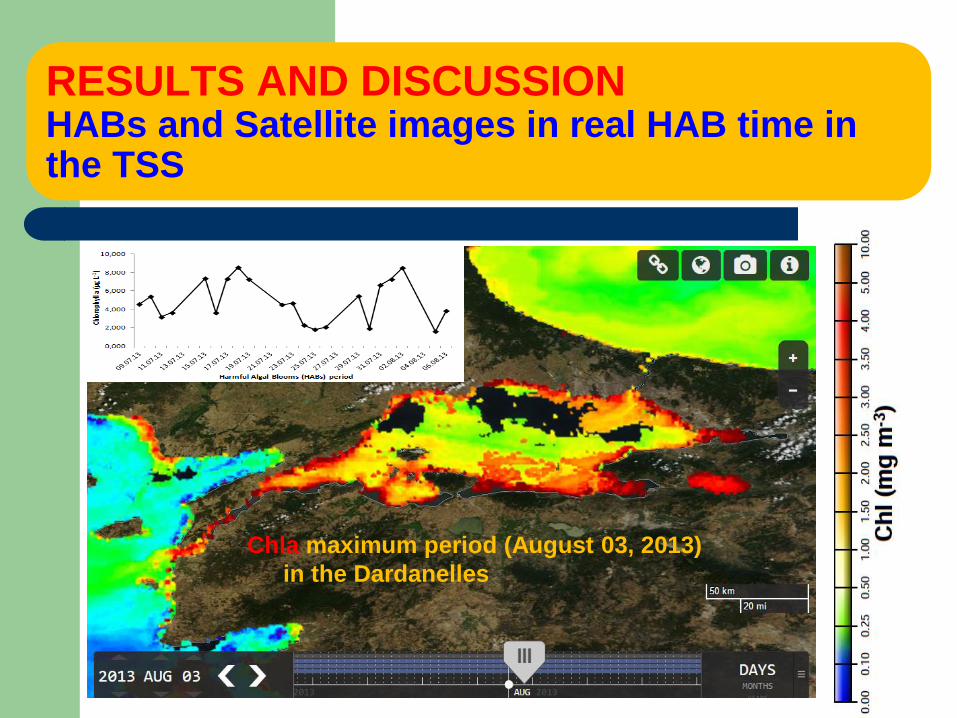
RESULTS AND DISCUSSION HABs and Satellite images in real HAB time in the TSS
Chla maximum period (August 03, 2013)
in the Dardanelles

CONCLUSIONS
This study may also indicate advancing of this species from the Black Sea region through the Sea ofMarmara and the Dardanelles under favorable conditions. This may be due to the climate changes inaddition to the dramatic eutrophication of the system since 1980s.
The findings indicated that during the HAB period the system was generally stable in view of temperature,salinity, and light duration.
P.lima bloom was reported for the first time in the Turkish Straits System and the bloom concentrationreached to 2.40 x 10⁶ cells L-1 in summer season. Unfortunately, this species seems be able to createmore extensive algal blooms in the near future.
In the intensive bloom periods, the contribution of P.lima to both Prorocentrum spp. and dinoflagellatesreached to 100%.
The strong bloom potential of P. lima and other phytoplankton in summer period in end of the this studyand in other periods (Turkoglu, 2004a, 2008, 2013; Turkoglu & Tugrul, 2013) has revealed that theDardanelles is under the hyper-eutrophication due to the fact that it is a part of the Turkish Strait Systemaffected by the Black Sea.
Both high nutrient concentrations (NO-2+NO-
3: 0.44 ± 0.17 µM, PO-34: 0.12 ± 0.03 µM and SiO4: 0.41 ± 0.09
µM) and lower average values of nutrient ratios (N/P: 4.04 ± 1.74, Si/P: 3.79 ± 1.24, and Si/N: 1.04 ± 0.36)according to Redfield ratios (N:P=16:1; Si:P=15:1; Si:N=15:16) during the HAB period indicated thatprimary productivity in the study area was affected by more nitrogen than phosphate due to theeutrophication in the Dardanelles.
Further monitoring of the system in terms of anomalies in the temperature, salinity, and nutrient changesas well as the phytoplankton species composition is needed for a better understanding of the ecologicalsignificance of this species in this system and its neighbor systems, the Black Sea and Northern AegeanSea.
The study calls attention to a possible intensification of DSP events in the Dardanelles in light ofexcessive Prorocentrum blooms in the Dardanelles.

THANKS FOR YOUR INTEREST