Embed Size (px)
Citation preview

FIRST 5 Sacramento Commission
EVALUATION COMMITTEE – SPECIAL MEETING
2750 Gateway Oaks Drive, Suite 330 Sacramento, CA 95833
AGENDA
MONDAY April 13, 2015 1:00 P.M. Members: Christina Elliott, David Gordon, Vice-Chair, Scott Moak, Steve Wirtz, Chair Advisory Committee Member: Cid Van Koersel, Walter Wyniarczuk Staff: Toni Moore, Carmen Garcia-Gomez Consultants: Lisa Colvig-Amir, Casey Coneway, Applied Survey Research Lynne Cannady, Tracey Kranhold Weld, Shannon Williams, LPC Consulting Clerk: Cheryl Rookwood
1. Call to order and Roll Call (5 minutes)
2. Approve March 16, 2015 Draft Action Summary (5 minutes)
3. Commission Staff Update (5 minutes)
4. School Readiness Report Presentation: Applied Survey Research (ASR) (60 minutes)
5. Evaluation Planning Update: LPC Consulting (45 minutes)
6. Committee Member Comments (5 minutes)
a. Miscellaneous b. Future Agenda Items/Presentations: May: Evaluation Planning: Applied Survey Research Effective Parenting Evaluation Plan Outline: LPC Consulting
7. Public Comments on Non-Agenda Matters (5 minutes)
The meeting is voice recorded in its entirety. A CD will be available for check-out from the First 5 Sacramento Commission offices at 2750 Gateway Oaks Dr., Suite 330, Sacramento, the day after the meeting.
The on-line version of the agenda and associated materials are posted for your convenience at
http://www.first5sacramento.net/default.htm. Some documents may not have been posted on-line because of their size and/or format. As they become available, hard copies of all documents are available from the Clerk of the Commission
at the First 5 Sacramento Commission offices. Page 1 of 1

www.AppliedSurveyResearch.org
Casey Coneway
Christina Branom
Lisa Colvig
FIRST 5 SACRAMENTO
REPORT ON THE 2014 SCHOOL READINESS
ASSESSMENT

Overview
Purpose of the study
Study design
Readiness study results from 2014
Readiness trends across years
Discussion questions and next steps
2

Purpose
SCHOOL READINESS ASSESSMENT (SRA)
- Year 3 of a 3-year study to assess the state of kindergarten
readiness across the First 5 Sacramento network – including
children and families
- Identify the major “predictors” of readiness, e.g.,…
• DEMOGRAPHIC/SOCIOECONOMIC CRITERIA
• HEALTH AND WELL-BEING
• PRE-K EXPERIENCES
• FIRST 5 PROGRAMS AND SERVICES
• FAMILY SUPPORT
- Not designed to be generalizable to the county at large, or individual
districts or schools

Sample: First 5 Sacramento Network
NINE DISTRICTS:
Sac. City, Twin Rivers, Elk Grove, Natomas, River Delta, Folsom Cordova,
Galt, Robla, San Juan
35 SCHOOLS
79 Classrooms
1,849
Kindergarten Student Assessments (KOF)
1,287
Parent Surveys (PIF)

Methodology & Interpretation
“Snapshot” of new kindergarten students’ and families’ readiness
Results have at least 3% (+/-) margin of error
Examined relationship between children’s backgrounds and early
experiences and school readiness
Compared results from three years of study to identify general trends
5

2014 Demographics
English Learners – 39%
Special Needs – 5%
Avg. Age (at time of assessment):
5.5 yrs
Roughly the same as prior years… Ethnically Diverse, Low
Income
37%
18% 15%
11% 9%
6%
Race/Ethnicity
Latino African American
Multiple race/ethn. White
Other Asian Hmong/Mien
25%
33%
28%
14%
Mother’s Education
Less than HS HS
Some College College Graduate
41% 37%
22%
Family Income
Under $15K $15K-$34,999
Over $35K
Source: KOF, PIF (2014).

Other Child Background Factors
7
13%
66%
73%
84%
90%
97%
99%
0% 20% 40% 60% 80% 100%
Transitional Kindergarten (in prior year)
Child attended preschool
Bedtime no later than 9:00 pm
Child had a dental exam in last year
Child has a regular dentist
Child has a regular doctor
Child has health insurance
Source: KOF, PIF (2014).
Similar to findings from previous years

Number of Readiness Activities and Community Resources,
By Income Level
8
Source: PIF 2014. N=1167-1192. Differences are statistically significant (p<.01)
3.5
2.5
3.9
3.2
0.0
1.0
2.0
3.0
4.0
5.0
6.0
7.0
Readiness Activities (out of 10) Community Resources (out of 7)
Under $35,000 $35,000 and above
• Across all 3 years, engagement in readiness activities and use of local resources
depended on Family SES

Number of Family Activities/Week, By Mother’s Education
9
Source: PIF 2014. N=1142-1157. Differences are statistically significant (p<.05)
4.3
5.0 4.9
5.6
0.0
1.0
2.0
3.0
4.0
5.0
6.0
7.0
Read for 5+ min. Tell stories/sing songs
Tim
es
pe
r w
ee
k
High School or LessSome College or More
*Number represents average times per week that parent(s) and child did these things together.
• Across all 3 years, engagement in family activities depended on Family SES

Child Health and Well-Being
10
Source: KOF 2014. N=1,540
10-12 percent of children showed up for school tired or hungry at least occasionally. Fewer were sick, complained of toothaches or were absent or tardy.
9% 11%
4% <1%
7% 6%
0%
5%
10%
15%
Hungry Appearedtired
Sick or ill Toothache Absent Tardy
Occasionally Almost Always

School Readiness Findings
11
Motor Skills Uses pencil with proper grip
Catches a ball
Social Expression Expresses needs/wants verbally
Expresses empathy
Tells about a story
Demonstrates eagerness for learning
K
Academics Writes own first name
Recognizes rhyming words
Counts 20 objects
Recognizes letters of alphabet
Recognizes basic colors
Recognizes primary shapes
Answers quest. about key details in lit.
Understands structure of books
Self-Regulation
Stays focused
Follows rules
Works/plays cooperatively
Participates succ. In large grp.
Handles frustration well
Four Basic Building Blocks of Readiness
20 individual readiness skills

Readiness by Basic Building Block (2014)
12
Proficient
In Progress
Beginning
Not Yet
Across all 3 years, Motor Skills scores have been highest, while
Kindergarten Academics scores have been lowest
Source: KOF 2014. N=1721-1846
Note: Motor Skills is composed of 2 items
3.20 3.38
3.28 3.19
3.07
1.0
2.0
3.0
4.0
OverallReadiness
Motor Skills Self-Regulation SocialExpression
KindergartenAcademics
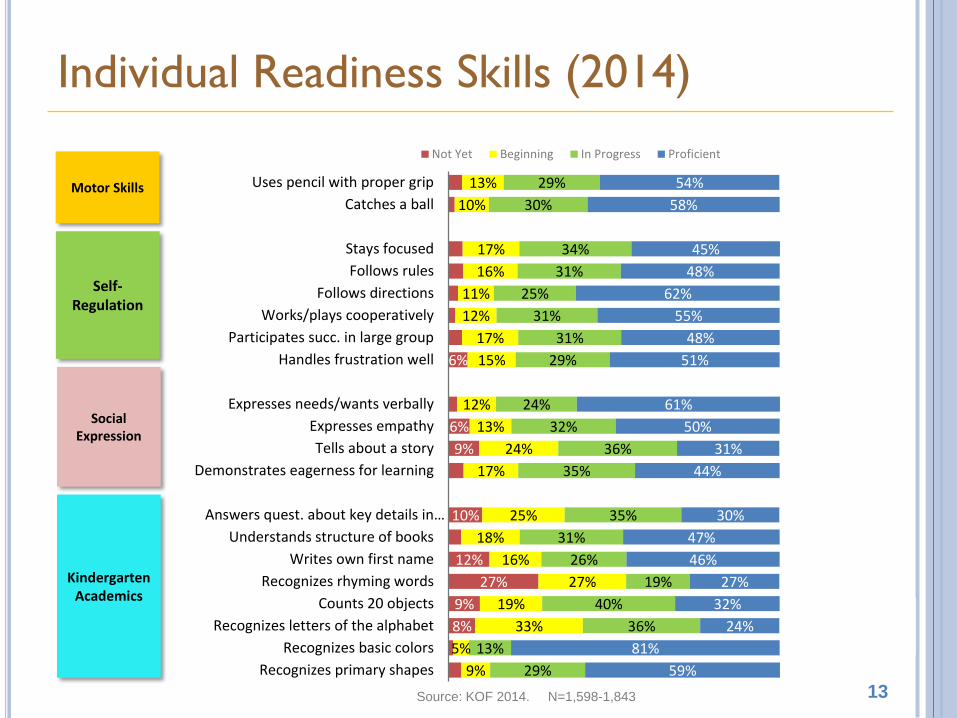
Individual Readiness Skills (2014)
13
Motor Skills
Self-Regulation
Social Expression
Kindergarten Academics
Source: KOF 2014. N=1,598-1,843
8%
9%
27%
12%
10%
9%
6%
6%
9%
5%
33%
19%
27%
16%
18%
25%
17%
24%
13%
12%
15%
17%
12%
11%
16%
17%
10%
13%
29%
13%
36%
40%
19%
26%
31%
35%
35%
36%
32%
24%
29%
31%
31%
25%
31%
34%
30%
29%
59%
81%
24%
32%
27%
46%
47%
30%
44%
31%
50%
61%
51%
48%
55%
62%
48%
45%
58%
54%
Recognizes primary shapes
Recognizes basic colors
Recognizes letters of the alphabet
Counts 20 objects
Recognizes rhyming words
Writes own first name
Understands structure of books
Answers quest. about key details in…
Demonstrates eagerness for learning
Tells about a story
Expresses empathy
Expresses needs/wants verbally
Handles frustration well
Participates succ. in large group
Works/plays cooperatively
Follows directions
Follows rules
Stays focused
Catches a ball
Uses pencil with proper grip
Not Yet Beginning In Progress Proficient

Common Strengths and Needs 2012-2014
14
27%
24%
81%
72%
19%
26%
77%
65%
20%
27%
75%
60%
Recognizing rhyming words*
Recognizing all letters
Recognizing basic colors
Counts 10 objects
Percent Proficient
2012 2013 2014
*Note: This item was revised in 2014, likely accounting for observed differences in
proficiency across years

Readiness on 13 Common Skills 2012-2014
15
3.20 3.16 3.21 3.25 3.23 3.19 3.32 3.27 3.23 3.28 3.30 3.23
1.0
2.0
3.0
4.0
Overall Readiness Self-Regulation Social Expression KindergartenAcademics
2012 2013 2014Proficient
In Progress
Beginning
Not Yet
N=1711-1744 for 2012, 1429-1540 for 2013, 1712-1846 for 2014.
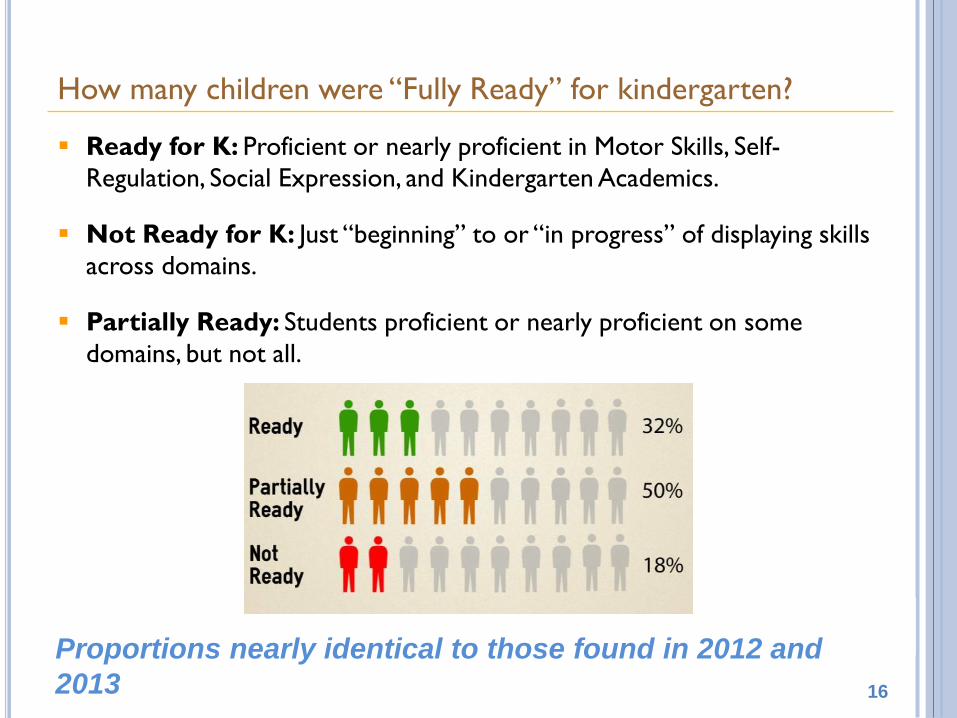
How many children were “Fully Ready” for kindergarten?
Ready for K: Proficient or nearly proficient in Motor Skills, Self-
Regulation, Social Expression, and Kindergarten Academics.
Not Ready for K: Just “beginning” to or “in progress” of displaying skills
across domains.
Partially Ready: Students proficient or nearly proficient on some
domains, but not all.
16
Proportions nearly identical to those found in 2012 and
2013

0 0.02 0.04 0.06 0.08 0.1 0.12 0.14 0.16
Parent has support and coping skills
Mother education (Higher)
Attended TK in prior year
Child was born full-term
Parent engaged in readiness activities
Child is a girl
Does not have special needs
First 5 preschool
Child's age (Older)
Attended other (not F5) preschool
Child did not come to school hungry or tired
Predictive Weight (Standardized)
Predictors of Readiness in First 5 Network, 2014
17 Source: KOF, PIF, First 5 Records 2014. N=912.
Note: All predictors are statistically significant (p<.05). R2=.219
Predicted readiness in all 3 studies
(2012, 2013, and 2014)

Readiness Scores, by F5 Preschool Experience (Adjusted for Other Child/Family Factors)
18
[VALUE]***
[VALUE]**
[VALUE]**
[VALUE]***
3.21
3.32
3.19
3.09
3.00
3.10
3.20
3.30
3.40
3.50
Overall Self-Regulation Social Expression KindergartenAcademics
F5 Preschool No F5 Preschool
Source: KOF, PIF, First 5 Records 2014. N=912.
**Significant at p<.01; ***Significant at p<.001.

Attending First 5 School Readiness Pre-K Programs was significantly associated with higher overall readiness in all 3 years of study
Combining the three years of data and controlling for other factors, we found - Receiving a First 5 developmental screen significantly predicted higher scores in
Kindergarten Academics
- Attending a First 5 summer pre-K program also significantly predicted higher scores in Kindergarten Academics
In 2014, we found… - Receiving a First 5 vision screen significantly predicted being Ready for kindergarten
In 2013, we found… - Receiving First 5 literacy services was significantly related to higher overall readiness
- Receiving First 5 home visiting services was significantly related to higher levels of Self-Regulation
In 2012, we found… - Number of First 5 transition services received significantly predicted higher levels of
Kindergarten Academics
What types of participation in First 5 services
predicted greater readiness across years?
19

Summary
Samples each year had high percentage of socioeconomically disadvantaged children
- 78% of families earned under $35,000; 58% of mothers had no more than a high school education
- SES is a key predictor of family engagement in school readiness activities and child readiness skills
Readiness levels consistently highest in Motor Skills and lowest in Kindergarten Academics
Across years, children strongest in counting and knowing their colors; greatest needs in rhyming and knowing their letters
About one-third of students each year entered kindergarten fully prepared for school
Readiness factors in 2014 included… - Common predictors: Age, special needs, well-being, SES, gender, preschool
- Parenting support and coping skills
- Parent engagement in readiness activities
- First 5 support: Preschools, vision screening
20

21
- Poverty - Special Needs - Hunger - English Learner…
- Preschool - Screenings - Parent Engagement…

Discussion
Based on the findings shown today…
What other types of questions do you have about school readiness across
the First 5 network over the past few years?
What other information would be helpful for the First 5 Commission to
understand through our report and presentation?
Thinking about upcoming assessments, in 2015 and beyond…
Are there possible changes in First 5 services or areas of focus over the
next few years that might be made to impact readiness?
Are there other kinds of issues or questions related to readiness that we
should consider in future assessments?
22

Further Questions?
Contact:
- Casey Coneway & Christina Branom
- Phone: 408/247-8319
- www.appliedsurveyresearch.org
23