Embed Size (px)
Citation preview

Klaus Abberger, Matthias Banner, Andreas Dibiasi
15. November 2013
Firms’ Perception of
Business Tendency Surveys Results from a meta survey in the services sector
2
Outline
Introduction
Survey details
The questionnaire
Selected results
Who and how?
Business situation
Capacity utilization
Shortage of qualified labour
Perception of business tendency surveys
Summary
Outline
3
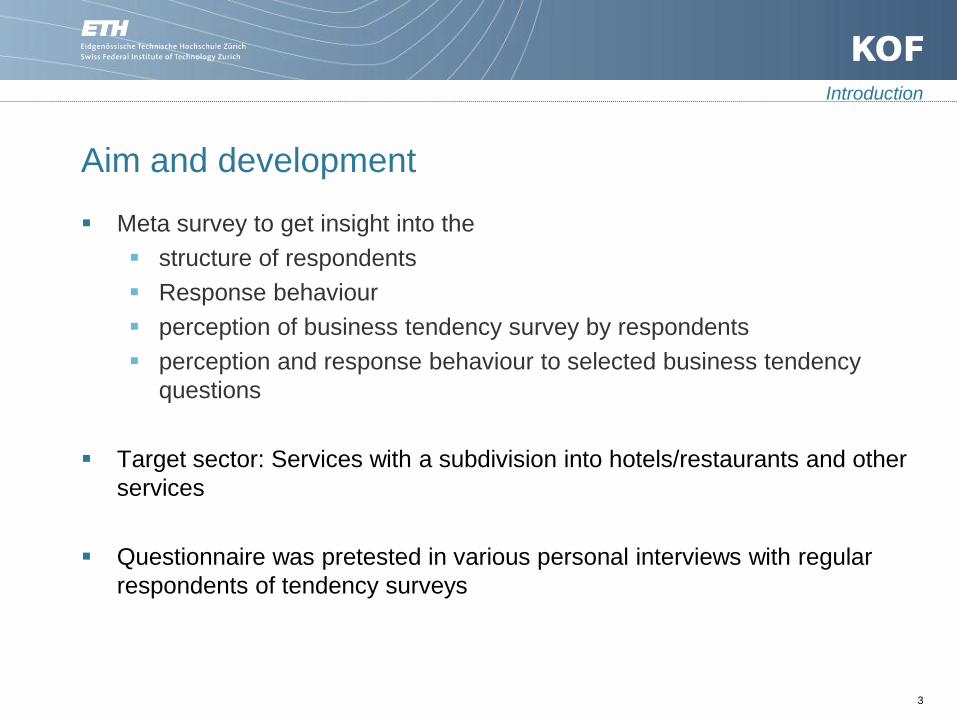
Aim and development
Meta survey to get insight into the
structure of respondents
Response behaviour
perception of business tendency survey by respondents
perception and response behaviour to selected business tendency
questions
Target sector: Services with a subdivision into hotels/restaurants and other
services
Questionnaire was pretested in various personal interviews with regular
respondents of tendency surveys
Introduction

4
Survey details
Field period: between 10. June and 31. August 2013
Responses: 1726
Response rate: 64%
Introduction

5 5
Questionnaire

6 6
Selected results

7 7
Who and how?
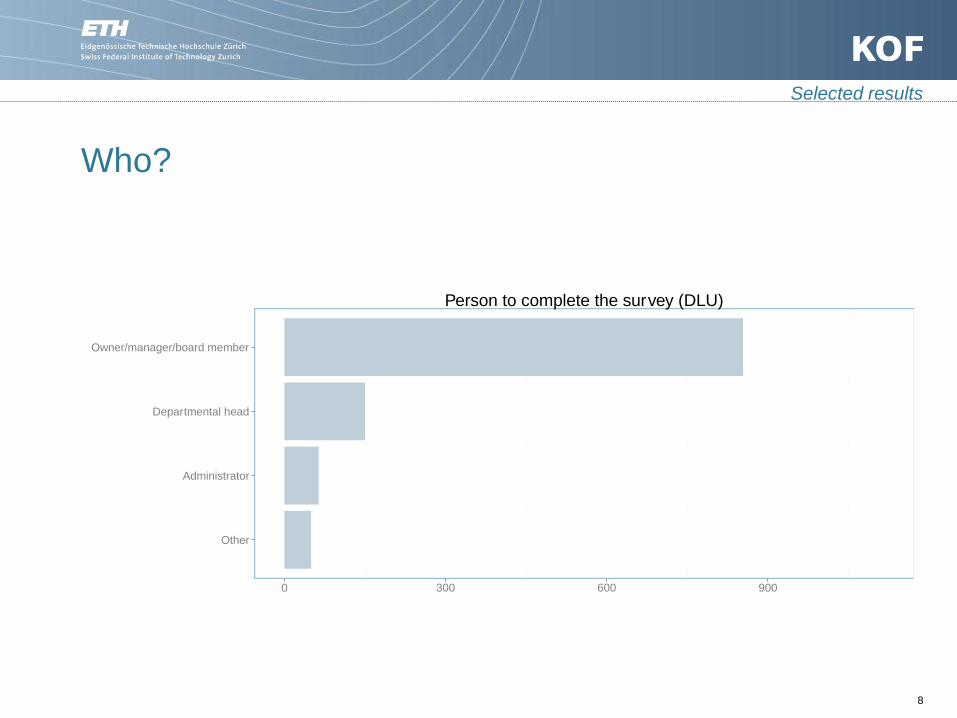
Who?
8
Selected results
Other
Administrator
Departmental head
Owner/manager/board member
0 300 600 900
Person to complete the survey (DLU)

Who?
9
Selected results
Other
Administrator
Departmental head
Owner/manager/board member
0 100 200 300 400
Person to complete the survey (GGU)

Who?
10
Selected results
Procurement
Sales
Statistics
Marketing
Other
Staff Position
Controlling
Accounts
Management
0 300 600 900
Department responsible for KOF− Surveys (DLU)

Who?
11
Selected results
Procurement
Marketing
Controlling
Other
Staff Position
Sales
Statistics
Accounts
Management
0 100 200 300 400
Department responsible for KOF− Surveys (GGU)

How?
12
Selected results
no Answer
...answered when a reminder is received
...answered just before the deadline for submission
...answered when time permits
...answerd immediatly after receiving
0 200 400 600
KOF Business Tendency Surveys are usually.... (DLU)

How?
13
Selected results
no Answer
...answered when a reminder is received
...answered just before the deadline for submission
...answered when time permits
...answerd immediatly after receiving
0 50 100 150 200
KOF Business Tendency Surveys are usually.... (GGU)

How?
14
Selected results
no Answer
more than three
three
two
one
0 250 500 750 1000
Number of people involved (DLU)
How?
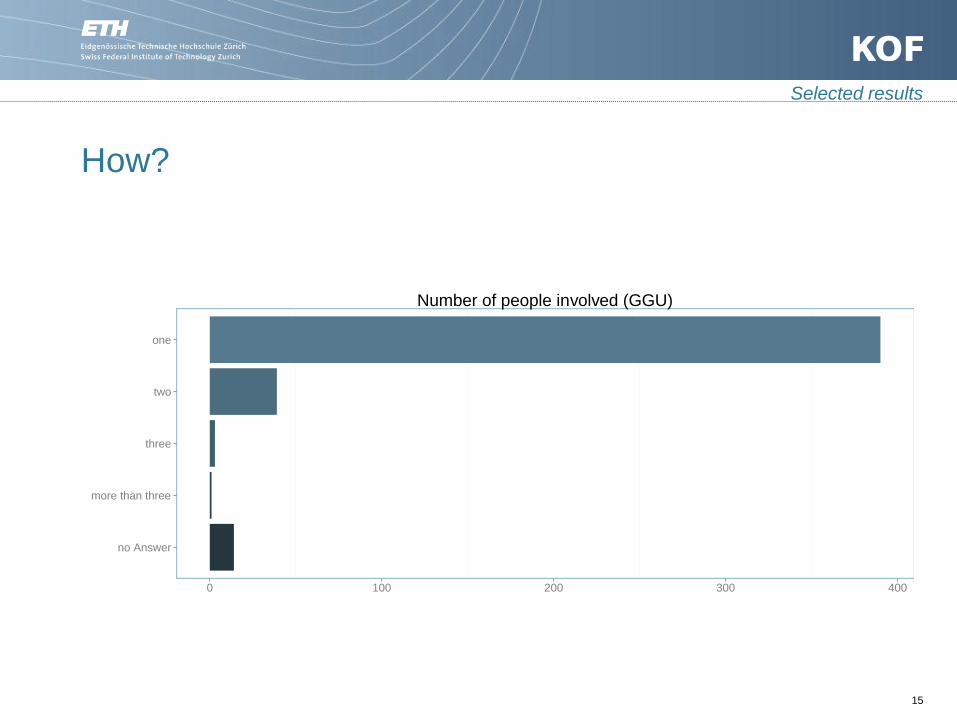
15
Selected results
no Answer
more than three
three
two
one
0 100 200 300 400
Number of people involved (GGU)

How?
16
Selected results
no Answer
>60
<60
<45
<30
<20
<15
<10
<5
0 100 200 300 400
no Answer >60 <60 <45 <30 <20 <15 <10 <5
Average Time spent on Survey DLU (in minutes)
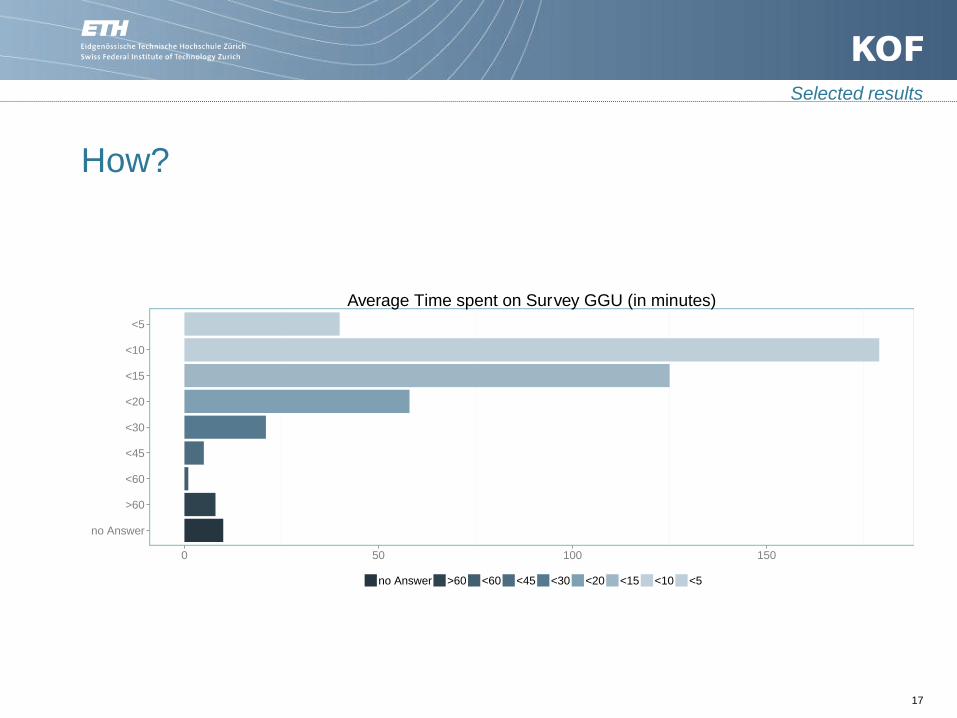
How?
17
Selected results
no Answer
>60
<60
<45
<30
<20
<15
<10
<5
0 50 100 150
no Answer >60 <60 <45 <30 <20 <15 <10 <5
Average Time spent on Survey GGU (in minutes)

18 18
Business situation
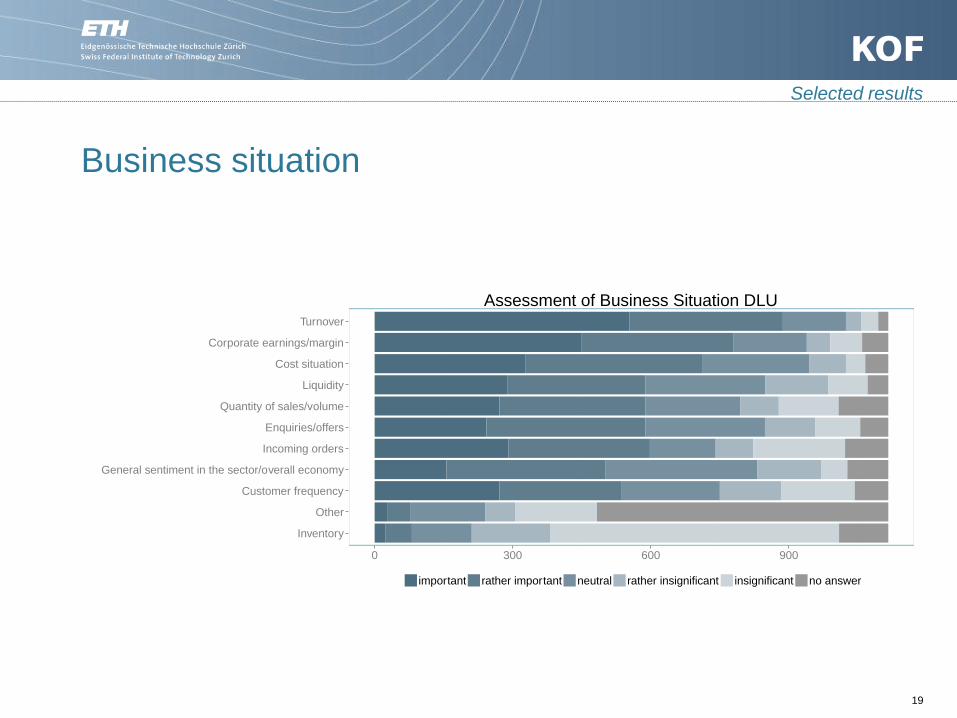
Business situation
19
Selected results
Inventory
Other
Customer frequency
General sentiment in the sector/overall economy
Incoming orders
Enquiries/offers
Quantity of sales/volume
Liquidity
Cost situation
Corporate earnings/margin
Turnover
0 300 600 900
important rather important neutral rather insignificant insignificant no answer
Assessment of Business Situation DLU
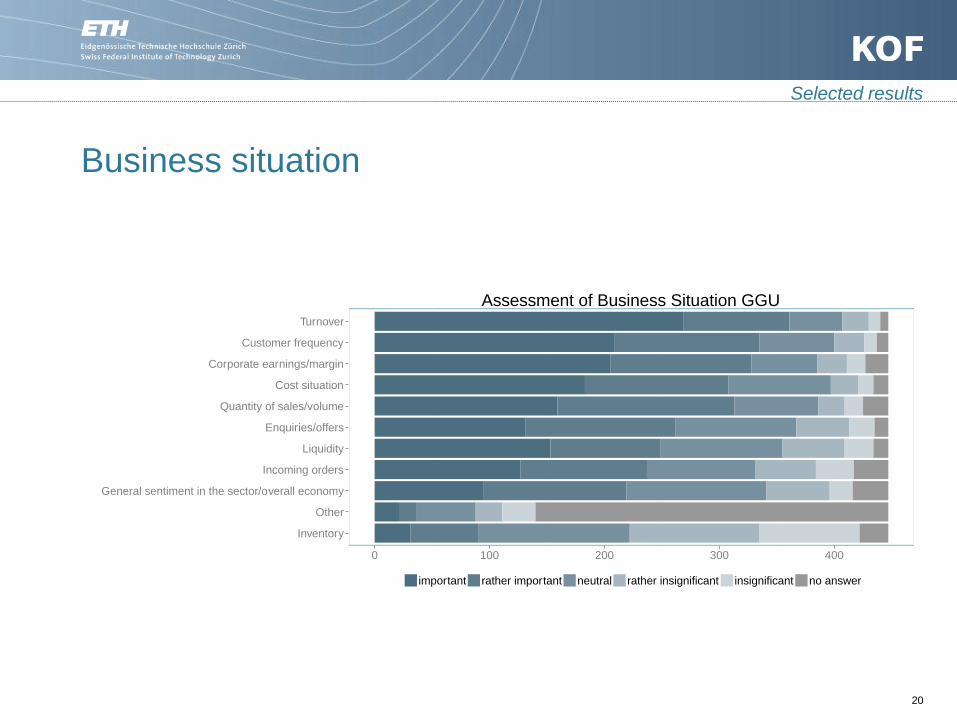
Business situation
20
Selected results
Inventory
Other
General sentiment in the sector/overall economy
Incoming orders
Liquidity
Enquiries/offers
Quantity of sales/volume
Cost situation
Corporate earnings/margin
Customer frequency
Turnover
0 100 200 300 400
important rather important neutral rather insignificant insignificant no answer
Assessment of Business Situation GGU
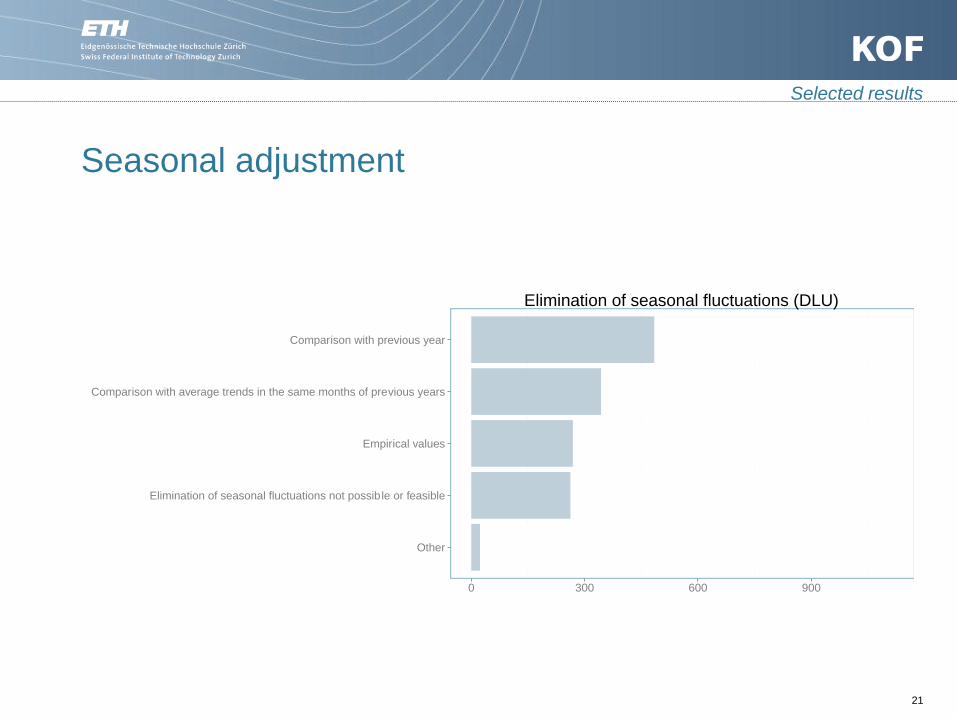
Seasonal adjustment
21
Selected results
Other
Elimination of seasonal fluctuations not possible or feasible
Empirical values
Comparison with average trends in the same months of previous years
Comparison with previous year
0 300 600 900
Elimination of seasonal fluctuations (DLU)
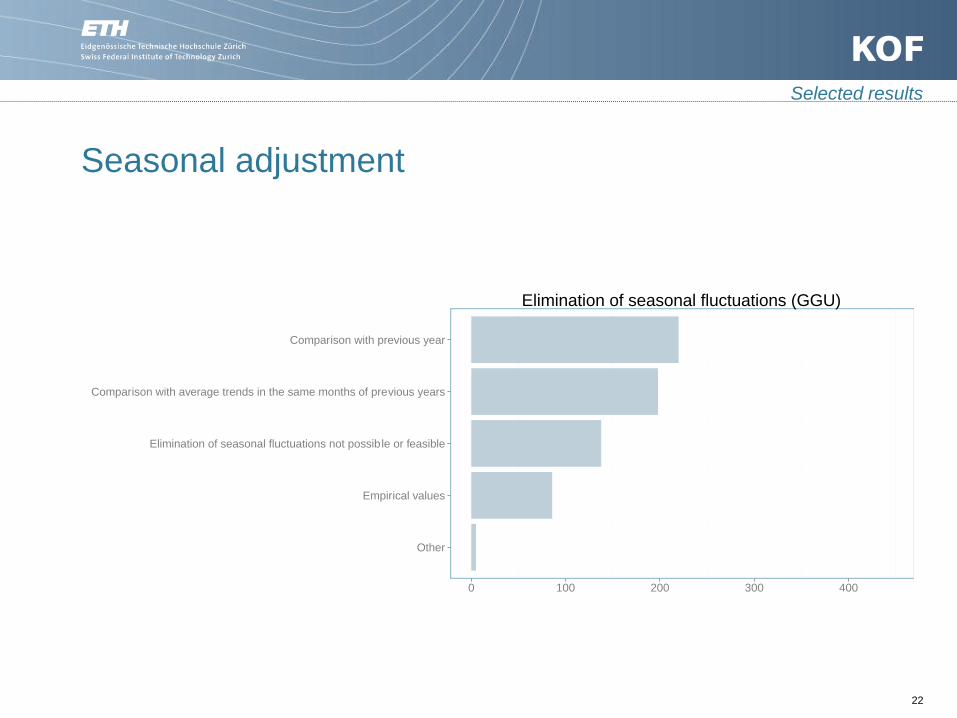
Seasonal adjustment
22
Selected results
Other
Empirical values
Elimination of seasonal fluctuations not possible or feasible
Comparison with average trends in the same months of previous years
Comparison with previous year
0 100 200 300 400
Elimination of seasonal fluctuations (GGU)
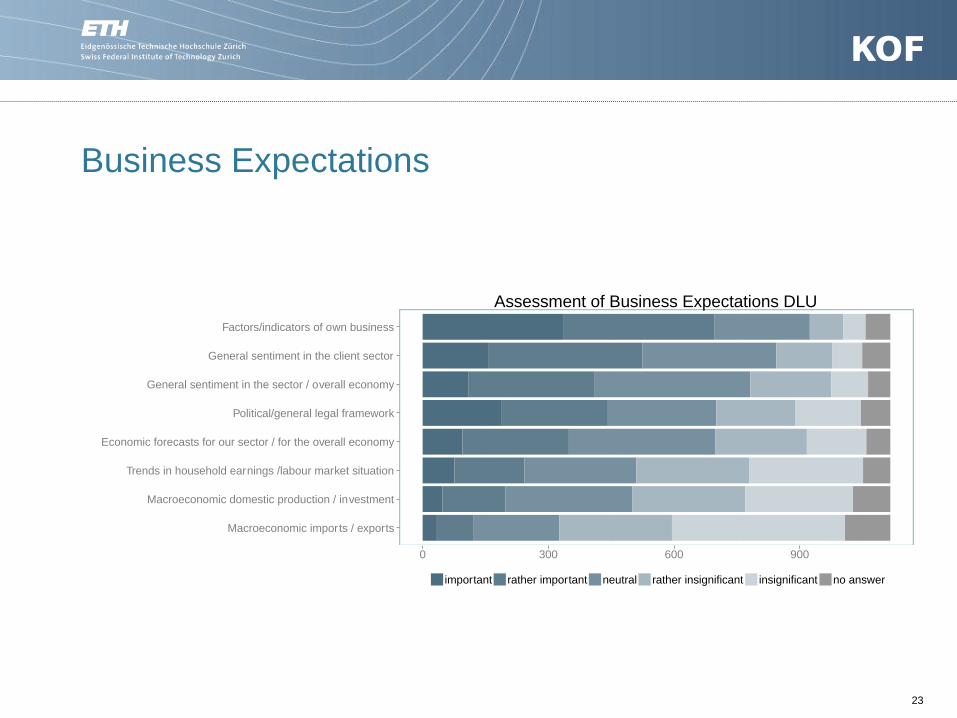
Business Expectations
Macroeconomic imports / exports
Macroeconomic domestic production / investment
Trends in household earnings /labour market situation
Economic forecasts for our sector / for the overall economy
Political/general legal framework
General sentiment in the sector / overall economy
General sentiment in the client sector
Factors/indicators of own business
0 300 600 900
important rather important neutral rather insignificant insignificant no answer
Assessment of Business Expectations DLU
23
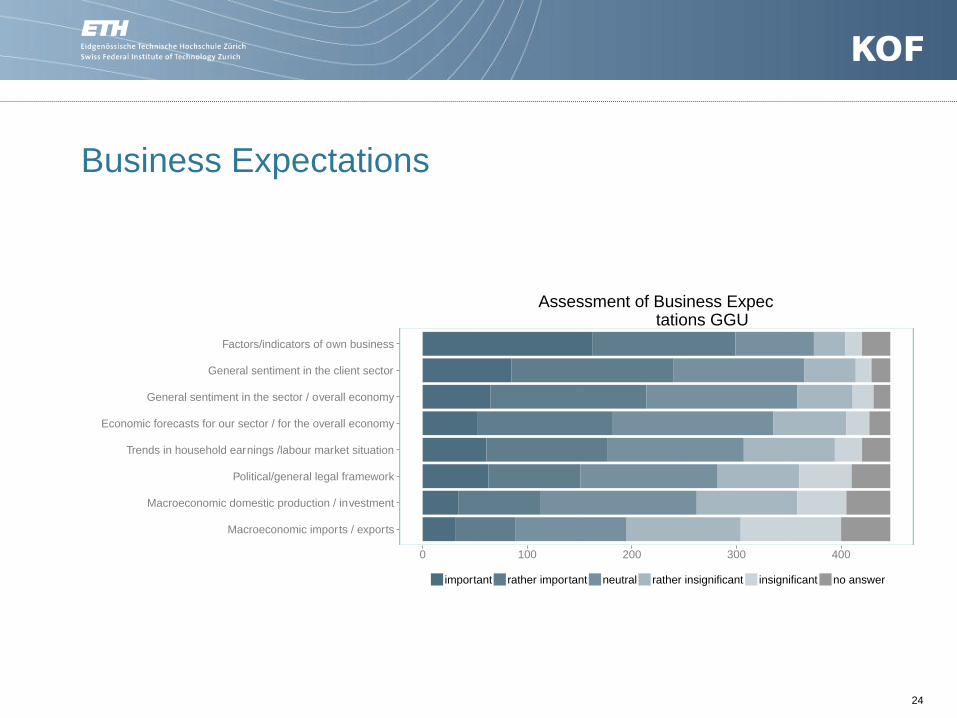
Business Expectations
24
Macroeconomic imports / exports
Macroeconomic domestic production / investment
Political/general legal framework
Trends in household earnings /labour market situation
Economic forecasts for our sector / for the overall economy
General sentiment in the sector / overall economy
General sentiment in the client sector
Factors/indicators of own business
0 100 200 300 400
important rather important neutral rather insignificant insignificant no answer
Assessment of Business Expec tations GGU
25 25
Capacity utilization

Factors for assessing capacity utilization
26
Selected results
licenses
other
material consump.
area
capital
tech. capacity
customer freq.
prod. per employee
employees
working hours
0 300 600 900
important rather important neutral rather insignificant insignificant no answer
Capacity Utilisation DLU
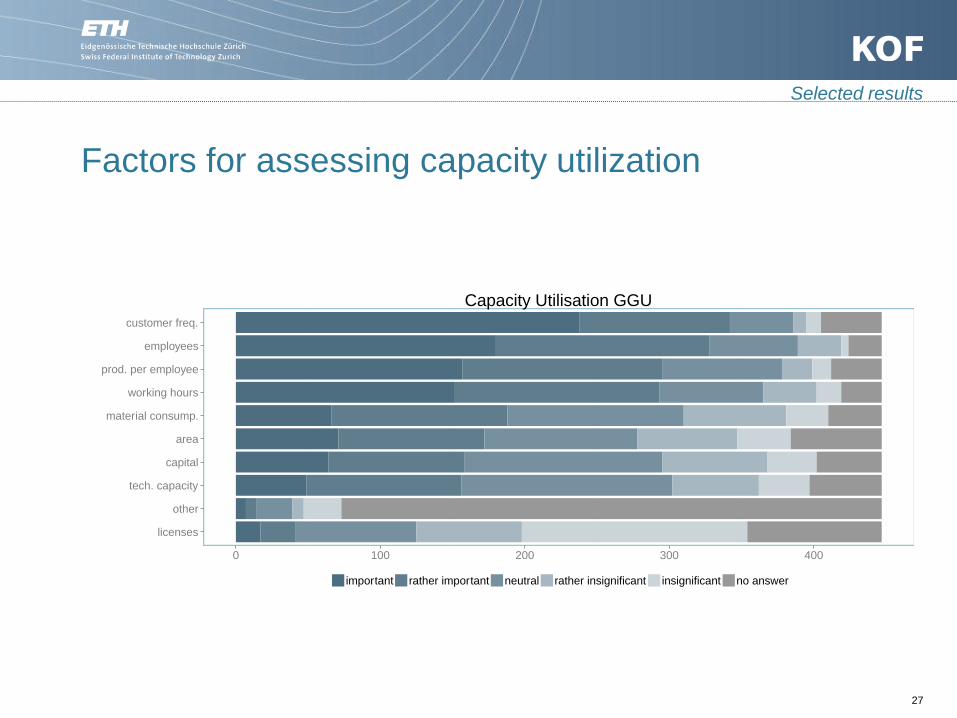
Factors for assessing capacity utilization
27
Selected results
licenses
other
tech. capacity
capital
area
material consump.
working hours
prod. per employee
employees
customer freq.
0 100 200 300 400
important rather important neutral rather insignificant insignificant no answer
Capacity Utilisation GGU

Relevance continuous
17494216%84%
0
300
600
900
Irrelevant Relevant
Question is irrelevant for our company Continuous Capacity Utilization DLU
Klaus Abberger 28
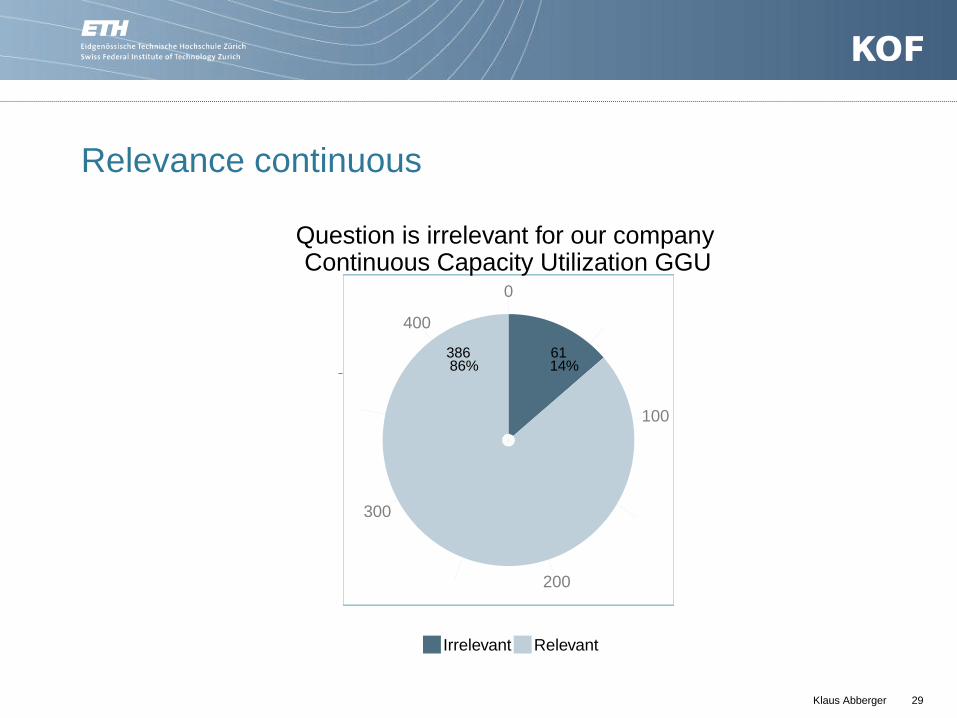
Relevance continuous
Klaus Abberger 29
6138614%86%
0
100
200
300
400
Irrelevant Relevant
Question is irrelevant for our company Continuous Capacity Utilization GGU

Relevance categorical (personnel and technical)
Klaus Abberger 30
12199411%89%
0
300
600
900
Irrelevant Relevant
Question is irrelevant for our company Categorial Capacity Utilization DLU
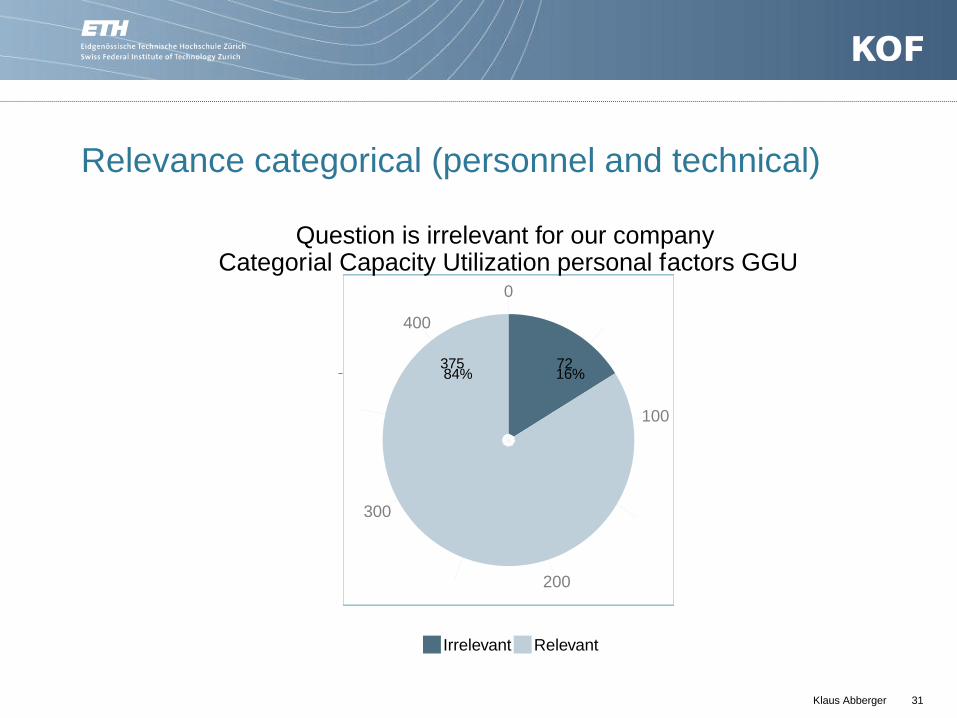
Relevance categorical (personnel and technical)
Klaus Abberger 31
7237516%84%
0
100
200
300
400
Irrelevant Relevant
Question is irrelevant for our company Categorial Capacity Utilization personal factors GGU

Relevance categorical (personnel)
Klaus Abberger 32
13897712%88%
0
300
600
900
Irrelevant Relevant
Question is irrelevant for our company Categorial Capacity Utilization personal factors DLU

Relevance categorical (personnel)
Klaus Abberger 33
7836917%83%
0
100
200
300
400
Irrelevant Relevant
Question is irrelevant for our company Categor ial Capacity Utilization personal factors GGU

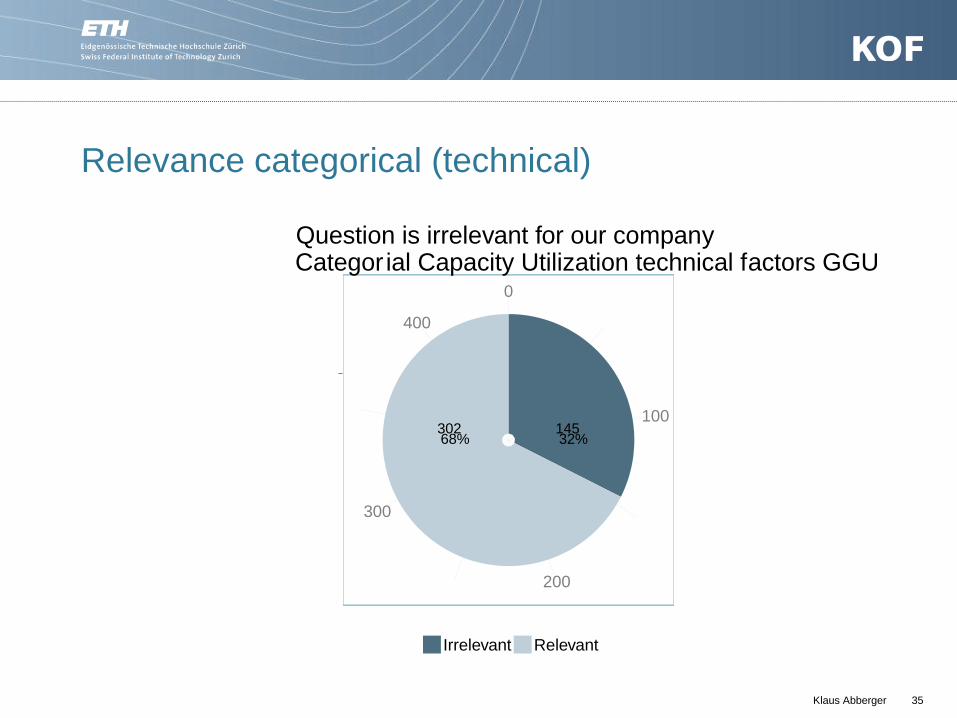
Relevance categorical (technical)
Klaus Abberger 34
44567040%60%
0
300
600
900
Irrelevant Relevant
Question is irrelevant for our company Categor ial Capacity Utilization technical factors DLU
Relevance categorical (technical)
Klaus Abberger 35
14530232%68%
0
100
200
300
400
Irrelevant Relevant
Question is irrelevant for our company Categor ial Capacity Utilization technical factors GGU
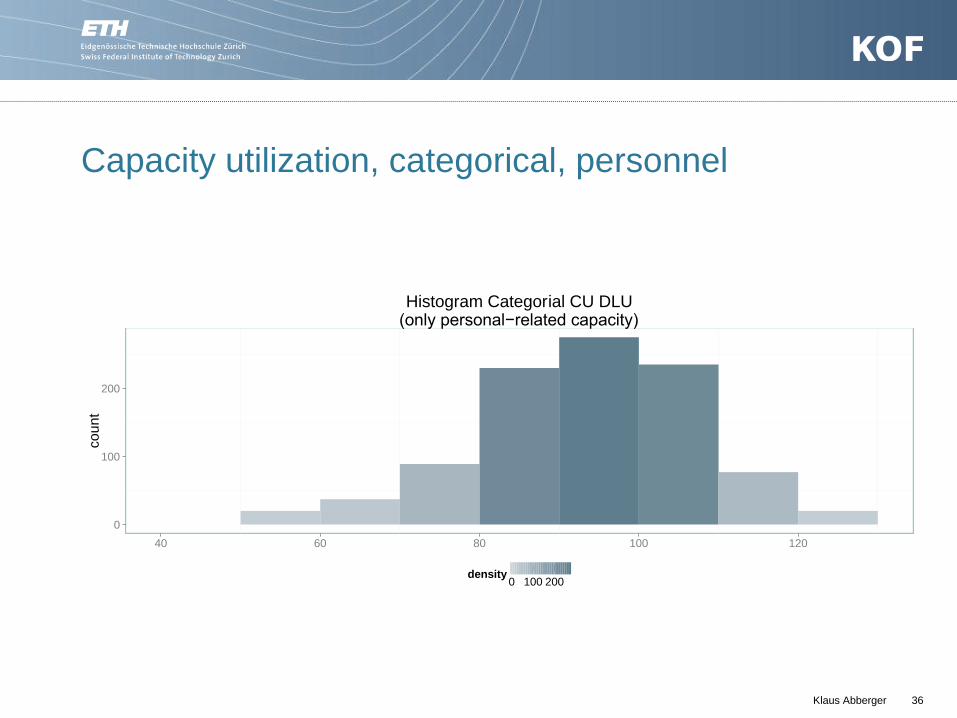
Capacity utilization, categorical, personnel
0
100
200
40 60 80 100 120
co
un
t
0 100 200density
Histogram Categorial CU DLU(only personal−related capacity)
Klaus Abberger 36

Capacity utilization, categorical, technical
Klaus Abberger 37
0
50
100
150
40 60 80 100 120
co
un
t
0 4080120160density
Histogram Categorial CU DLU(only non−personnel−related, technical capacity)

Capacity utilization, categorical, personnel
Klaus Abberger 38
0
25
50
75
100
40 60 80 100 120
co
un
t
0 255075100density
Histogram Categorial CU GGU(only personal−related capacity)

Capacity utilization, categorical, technical
Klaus Abberger 39
0
20
40
60
40 60 80 100 120
co
un
t
0 20 40 60density
Histogram Categorial CU GGU(only non−personnel−related, technical capacity)
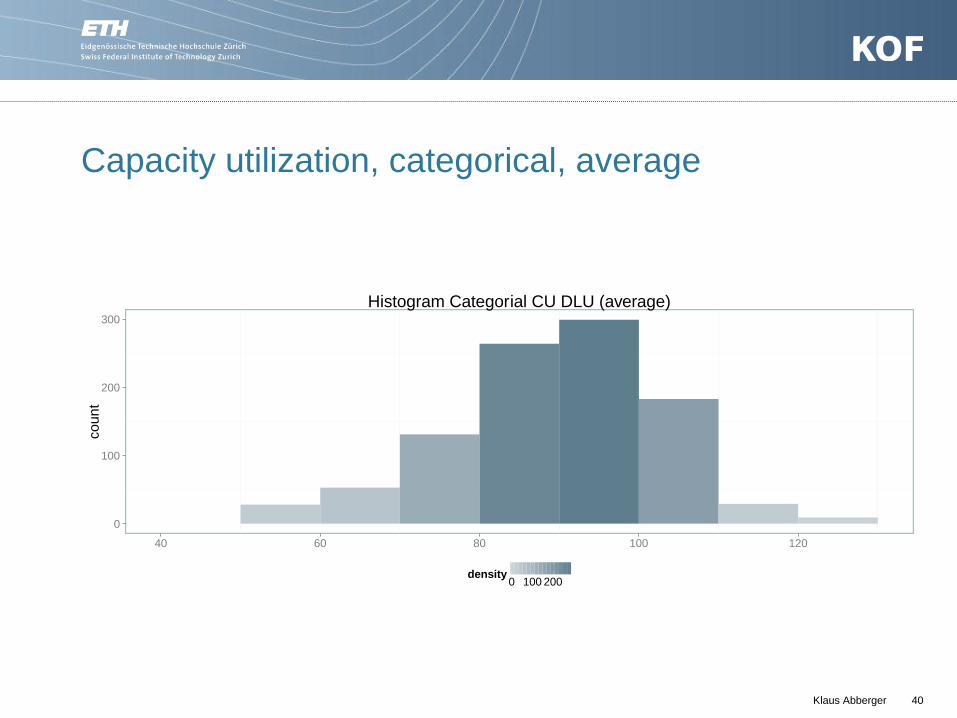
Capacity utilization, categorical, average
Klaus Abberger 40
0
100
200
300
40 60 80 100 120
co
un
t
0 100 200density
Histogram Categorial CU DLU (average)
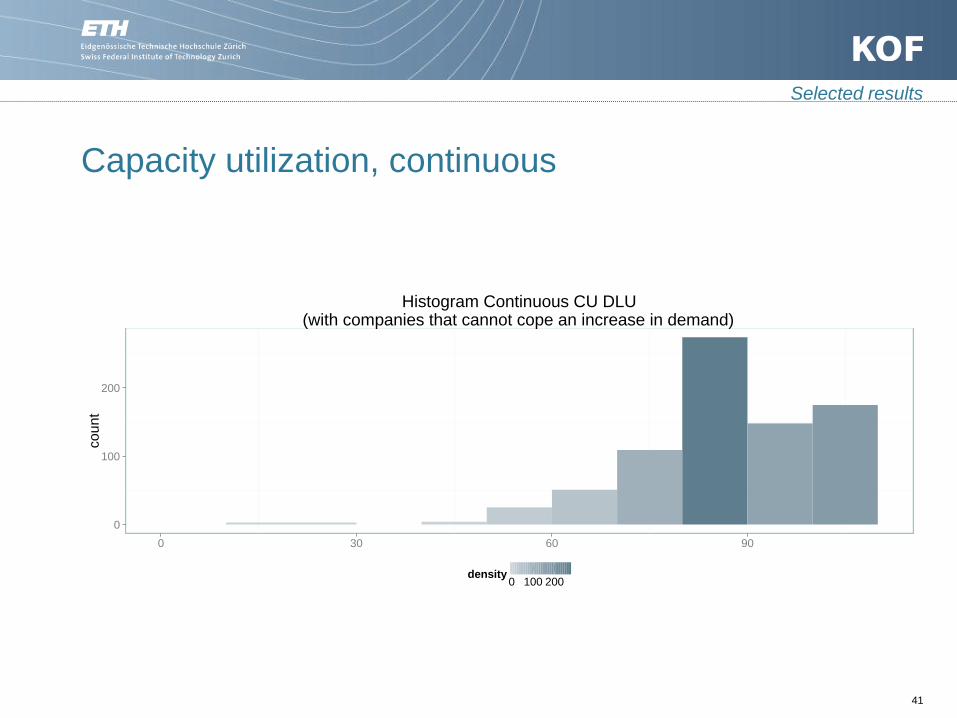
Capacity utilization, continuous
41
Selected results
0
100
200
0 30 60 90
co
un
t
0 100 200density
Histogram Continuous CU DLU(with companies that cannot cope an increase in demand)

Capacity utilization, difference
0
30
60
90
0 50
co
un
t
0 30 60 90density
Diffrence in Capacity UtilizationCategorial and Continous questioning DLU
Klaus Abberger 42

Capacity utilization, categorical, average
Klaus Abberger 43
0
25
50
75
100
40 60 80 100 120
co
un
t
0 25 50 75100density
Histogram Categorial CU GGU (average)

Capacity utilization, continuous
44
Selected results
0
50
100
40 60 80 100
co
un
t
0 255075100125density
Histogram Continuous CU GGU(with companies that cannot cope an increase in demand)

Capacity utlizitaion, difference
Klaus Abberger 45
0
10
20
30
40
−20 0 20 40
co
un
t
0 10203040density
Diffrence in Capacity UtilizationCategorial and Continous questioning GGU
46 46
Shortage of qualified labour

A problem?
47
Selected results
455638
23
41%57%
2%
0
300
600
900
Yes No no Answer
Staff Shortage DLU

A problem?
48
Selected results
114322
11
26%72%
2%
0
100
200
300
400
Yes No no Answer
Staff Shortage GGU
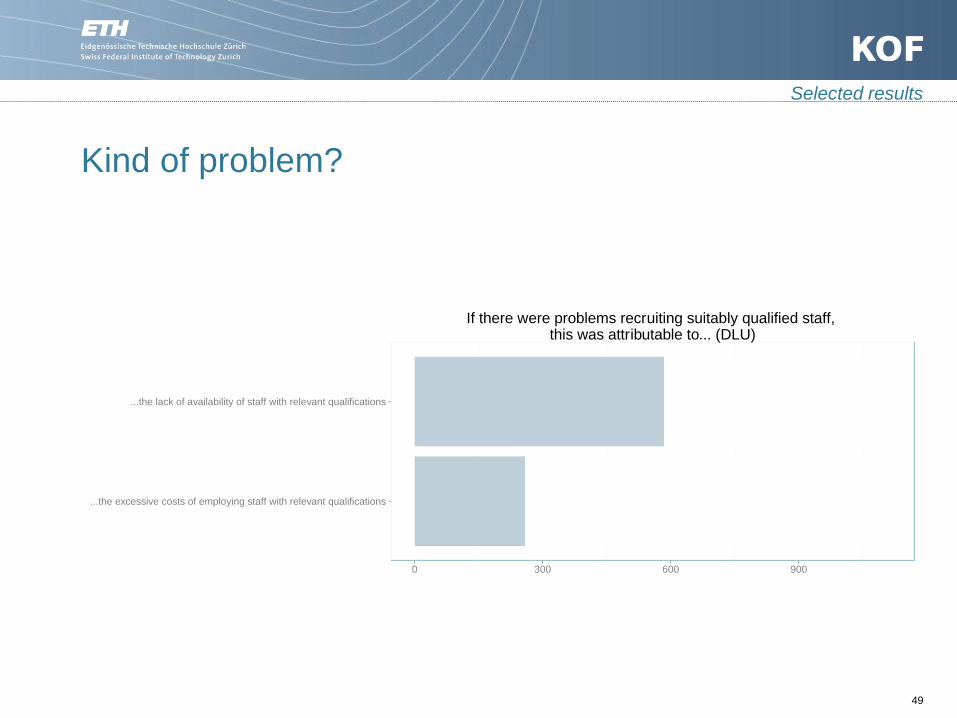
Kind of problem?
49
Selected results
...the excessive costs of employing staff with relevant qualifications
...the lack of availability of staff with relevant qualifications
0 300 600 900
If there were problems recruiting suitably qualified staff, this was attributable to... (DLU)

Kind of problem?
50
Selected results
...the excessive costs of employing staff with relevant qualifications
...the lack of availability of staff with relevant qualifications
0 100 200 300 400
If there were problems recruiting suitably qualified staff, this was attributable to... (GGU)

51 51
Perception of business tendency surveys
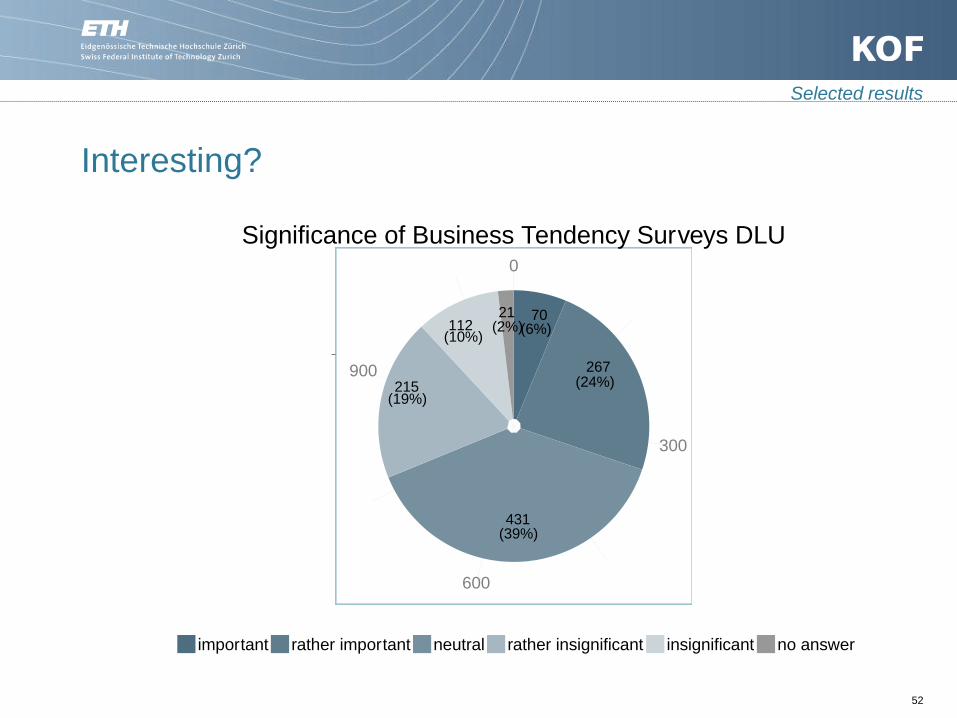
Interesting?
52
Selected results
70
267
431
215
11221
(6%)
(24%)
(39%)
(19%)
(10%)(2%)
0
300
600
900
important rather important neutral rather insignificant insignificant no answer
Significance of Business Tendency Surveys DLU

Interesting?
53
Selected results
55
135
161
53
349
(12%)
(30%)
(36%)
(12%)
(8%)(2%)
0
100
200
300
400
important rather important neutral rather insignificant insignificant no answer
Significance of Business Tendency Surveys GGU

54 54
Summary

55
Summary
Often survey respondents are managers and they need mostly not more than 15 minutes for the questionnaire
Turnover and profits are important factors for the assessment of the business situation
Factor within the own business are most important for the assessment of the business expectations
Capacity utilization in the services sector is strongly connected to personnel factors
Summary


![COVID-19 IMPACT SURVEYS...[op1] Percent of firms confirmed permanently closed since COVID-19 outbreak.....10 [op17] Percent of firms likely permanently closed since COVID-19 outbreak.....11](https://img.pdfslide.us/doc/110x75/60c3ed3c25377e5a4e2d292c/covid-19-impact-surveys-op1-percent-of-firms-confirmed-permanently-closed.jpg)


![ENTERPRISE SURVEYS...[reg4] Percent of firms identifying tax rates as major constraint..... 18 [reg5] Percent of firms identifying tax administration as major [bus2] Days to obtain](https://img.pdfslide.us/doc/110x75/5f0282517e708231d4049d19/enterprise-surveys-reg4-percent-of-firms-identifying-tax-rates-as-major-constraint.jpg)