Embed Size (px)
Citation preview
181
International Academic Research Journal of Business and Technology 1(2) 2015 Page 181-193
Firms Compliance Behaviour With Environmental Regulations In Malaysia
Nawawi, Mohd Nasir1
, Yacob, Ridzuan2
1
School of Social and Economic Development, Universiti Malaysia Terengganu, 21030, Kuala Terengganu,
Malaysia 2
Center for Foundation and Liberal Education, Universiti Malaysia Terengganu, 21030 Kuala Terengganu,
Malaysia
1
Article Information
Abstract
Keywords Environmental Crime, Compliance Behaviour, Industrial Effluent.
Malaysia has not been exempted from facing environmental pollution
problems as a result of the rapid development of the manufacturing
sector.The manufacturing sector is the main driver of the economic growth
of this country but it is also the second biggest contributor to the pollution of
the rivers in the country. As the operations within the manufacturing sector
compete hard to maximise their profits they must also give due
consideration to the costs of waste treatment in the production process. This
consideration will influence their behaviour to comply or otherwise with the
regulations. The behaviour is similar to the criminal acts explained by
Becker (1968). The purpose of this study is to identify the factors that
influence the industry’s compliance to the effluent treatment regulations for
manufacturing industries in the states of Pulau Pinang, Kedah and Perlis. A
modified Becker’s criminal behaviour model was used to estimate the
dichotomous compliance results. The approach taken in conducting the
study was utilisation of a structured questionnaire followed by non-
parametric statistical test analyses to analyse the feedback from the 42
factories involved. Findings from the study show that the level of
compliance is influenced by the probability of being fined and the number
of inspections. Besides that, the enforcement authorities in Pulau Pinang had
managed to create an enforcement reputation amongst the factories
compared to those in Kedah and Perlis. Results of the analysis suggest that
the environmental protection policy must ensure a reputation for
enforcement, a systematic inspection strategy and informal control
mechanisms such as pressure from the public and NGOs must be
empowered.
International Academic Research Journal of Business and Technology 1(2) 2015, Page 181-193
182
INTRODUCTION
The manufacturing sector is the largest contributor to Malaysia’s economic growth but it is also the second
biggest contributor to river pollution. Over the last decade, Malaysia’s economic growth has been driven by the
manufacturing sector which accounted for 30.8% of the GDP , 82.4% of total value of exports and 27.6% of
labor force (8th Malaysia Plan).The manufacturing industry is projected to grow at the average rate of 5.7% for
the period 2010 – 2015 which makes it as one of the sectors that will be given attention in the 10th Malaysia
Plan. On the other hand, the Department of Environment (DOE) annual report of 2010 showed that the
manufacturing sector was responsible for 44.57% of the total sources of water pollution; second only to
domestic sewage. The situation has not shown much changes since 2007 when the manufacturing sector was the
leading source of water pollution then, ahead of agriculture and livestock.
In the effort to manage pollution issues, many countries use a multitude of approaches, from command-and-
control systems to market based incentives. In Malaysia, the Environment Quality Act 1974 is seen as adequate
and sufficiently comprehensive to control industry behaviour. However, the effectiveness of regulations is
dependent on the firms decision to comply; which in turn is based on cost and benefit considerations. To be
more specific, compliance to environmental regulations is driven by enforcement activites in order to effect a
change in the behaviour of firms. Cohan (1999) mentioned that understanding a firm’s actions is the key to the
development of an effective enviromental policy. Individual and organizational behaviour towards the decision
to comply to regulations was first developed using the Becker (1998) criminal act model. The Becker model,
also known as the optimal fines theory, is build on the premise that potential commitment of a crime is linked to
the probability of being caught and subsequently penalised if found guilty. In the literature, amongst the earliest
to use this model is Downing and Watson (1974), Harford (1978) and Storey and McCabe (1980).
THE INDUSTRIAL DEVELOPMENT AND ENVIRONMENTAL QUALITY CONFLICT
Developing nations, especially those in Asia, experienced rapid development in the practice of industrial
pollution control standards, similar to that of the developed nations (Hettige et al., 1996). This is following the
industrialzation process taking over the role of the agriculture sector as the engine for economic growth in most
countries. Eventhough the drop in the quality of the river water is also attributable to agro-based industrial
activities (oil palm and rubber), livestock farms and land clearing activities, industrial waste and chemicals
became the main source of river pollutants as of the mid-1980s (Jamalunlaili, 1997).
As an effort to control pollution, the government drafted the very comprehensive Environmental Control Act
1974 and the Department of Environment (DOE) was entrusted with its enforcement. Control of effluent
discharge was enforced under the Environmental Quality Regulations (Sewage and industrial effluents) 1979 on
1 January 1981. The regulation placed effluent waste and sewage together when in reality, they have different
standard characteristics. Following that, the enforcement of industrial effluent standards were separated from
that of sewage through the gazzeting of the Environmental Quality Regulations (Industrial Effluents) 2009 on 10
December 2009.
Despite the various enforcement measures taken by the DOE, the level of compliance has not changed much in
the past ten years. The annual DOE report shows that some indusries consistently had low compliance average
for the period 2000 – 2009. Included among them were the food and beverage industry, electroplating and metal
finishing, animal feeds, and textile. These industries were identified as having difficulties complying with the
regulations and their compliance level were consistently below the overall average for the nine year period 2000
– 2009.
LITERATURE REVIEW
The effects of enforcement on the level of compliance to environmental regulations were the focus of studies by
researchers such as Magat and Viscusi (1990), Gray and Deily (1996), Laplante and Rilstone (1996), Earnhardt
(2004) and Shimshack and Ward (2008).
Magat and Viscusi (1990) were amongst the early researchers to look at the effect of inspection on effluent
discharge by the paper and pulp industry in the United States of America. They discovered that inspection could
International Academic Research Journal of Business and Technology 1(2) 2015, Page 181-193
183
result in the reduction of BOD load by almost 20%. This study led to other similar studies, one of which was by
Laplante and Rilstone (1996) who carried out further analysis on the same industry in Canada. In their studies
they took into consideration the effect of the threat of inspection not only on the level of compliance but also on
the level of discharge which exceed standards. According to the requirements, each factory is required to submit
a monthly report on the released BOD load and the TSS, including the level of permitted effluent discharged by
every factory per month. The data collected had the advantage of enabling an analysis on the effects of the
current rate of discharge but also on the relative effects compared to the permitted discharge rates. The results
showed that inspection and the threat of inspection showed a significance negative relationship to the discharge
of pollutants. Besides that there was also evidence that inspection contributes to the increase in the frequency of
reports on the releases made by the factory.
The study by Gray and Deily (1996) attempted to identify if enforcement actions had an influence on the
compliance behaviour of the factory and vice-versa, if a factory’s compliance level has an effect on
enforcement. Three main models were analysed using air pollution data from 41 steel factories in the USA for
the period 1980 -1989 by utilising logit and tobit regression models. The findings showed that the compliance
results were influenced by the enforcement or in other words the greater the enforcement, the higher the level of
compliance. The big factories though, tend to be less compliant to the air pollution regulations. The compliance
behaviour was also found to influence enforcement with less enforcement being carried out for factories with
higher level of compliance.
Most of the studies involved environmental regulation compliance by factories or the private sector. However,
government-owned entities with utility maximization motives such as public treatment plants also take into
account costs and benefits in the effort to improve the quality of the environment (Earnhardt 2004). Despite the
entities having different motives, any behaviour towards compliance to the quality of the environment would
have to look at the costs and benefits. Shimshack et al. (2005) noted that the enforcement body must not only be
efficient in conducting preventive and enforcement activities, its reputation is also important in influencing
compliance behaviour. The researchers tried to find the relationship between the effects of imposing fines and
other previous enforcement actions. Fines were found to be capable of acting as a deterrent towards future non-
compliance, and it also gives a signal to the other factories on the readiness of the enforcement body to fine
errant factories. The results of these studies show that the imposition of fines managed to reduce the number of
non-compliance cases by two-thirds. It also had an influence on the other factories.
Compliance behaviour is not only influenced by formal regulation but also informal regulations (IR). Pargal and
Wheeler (1996) defined IR as implicit imposition of fines or shadow price for pollution offenses. Kathuria
(2007) mentioned about IR as a potential medium for industrial pollution control through the mechanism of
‘information disclosure’ and ‘ranking’. The effectiveness of IR in changing the behaviour of industry is more
prominent in situations where formal regulation is weak or non-existent, especially in the developing countries
(Pargal et al; 1997a, Pargal et al; 1997b, Hettige et al; 1996). Pargal and Wheeler (1996) pioneered the studies
on the effect of IR in Indonesia where formal regulation did not exist, through a regulations model based on the
modified market. It makes use of the premise that the society must apply pressure in situations where the
information on industrial pollution is weak and difficult to obtain. They must put pressure on the employees, the
factory owner, use publicity to bring down the image of the offender, issue threats or use of violence, civil laws,
and pressure from politicians, local administrators and religious leaders.
A lot of studies on the effect of IR and its ability to change the industry compliance have been carried out in the
developed countries (see Hamilton 1995, Lanoie et al; 1998) and also the developing countries (see
Gangadharan, 2006; Pargal and Wheeler, 1996; Pargal et al.; 1997a). IR through the use of the stock and capital
markets, and links with media coverage have been seen to be effective in the developed countries, where as
pollution control in the developing nations tend to be more through community pressure.
METHODOLOGY
Becker’s basic model states that individual utility from actities that contravene the law, EU depends on the
financial returns from going against the law Y, the probability of being arrested P, and the forecast financial
penalty F.
International Academic Research Journal of Business and Technology 1(2) 2015, Page 181-193
184
EU = (1 – p) U (Y) + pU(Y –F) ..........................(1)
An individual will be inclined to break the law when returns from the illegal activity (Y) exceeds the expected
financial penalty for breaking the law. The individual will comply with the regulation when EU is negative. EU
is negative if the expected financial penalaty is bigger than the expected financial returns from the criminal
activity (F>Y).
Brown and Reynolds (1973) took into account the individual’s wealth as a factor so that the equation becomes
as follows:
EU = (1-p)U(W+G)+Pu(W-L)
Where;
W= the individual’s current wealth
G= the potential gain from the criminal activity
L = the loss if arrested
p = the probability of being arrested
The individuals current wealth is more rational. This due to the reason that if an individual is arrested and
penalised due to the illegal activity, the individual is still inclined to carry out the criminal activity if L<W.
Dowell, Goldfard and Griffith (1998) and Hatcher (2000) included social norm values (M). They expanded the
utility forecast model to:
EU= m(M)[(1-p)]U(W+Y)+Pu(W-F)]
m( ) is the reduced social norm function (1≥m(0)≥0) which represents the effect of social norms to compliance
with the index M. A small M value refers to weak moral values (for example a wrongdoing is considered as not
really that bad). A high M value indicates strong moral values. This enables the informal regulation (IR)
influencer index to be included as a compliance determinant in this study.
Industry Compliance Behaviour Model
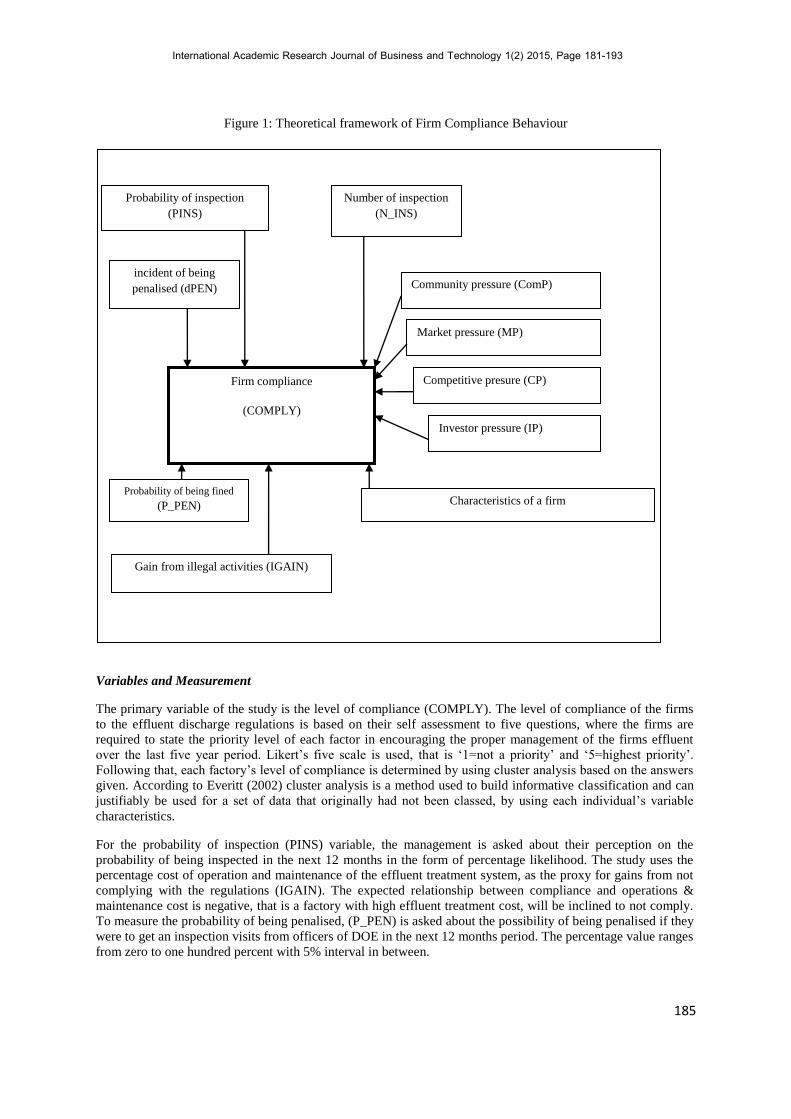
The factors that influences a factory’s compliance to effluent regulation is simplified as in Figure 1. The
industry’s compliance is not only influenced by the probability of inspection (PINS) and gains from the illegal
activities (IGAIN) but is also influenced by the incident of being penalised (dPEN), the probability of being
penalised (P_PEN), the number of inspections (N_INS), the informal regulations pressure (I_IR) and industry
characteristics variables. As such, Becker’s model in equation (1) is modified to include additional variables as
shown in figure 1
Data Collection and Scope of Study
The primary source of data is through the use of a structured questionaire. The study looked at compliance
behaviour of three industries (food and drinks, textile, and paper) which are subjected to the Environmental
Quality Regulations (Industrial Effluents) 2009 in three states of Malaysia namely Pulau Pinang,Kedah and
Perlis. The basis of choosing these three types of industries is the annual Department of Environment (DOE)
report which shows that these three industries have difficulties in complying with the effluent regulations.
International Academic Research Journal of Business and Technology 1(2) 2015, Page 181-193
185
Figure 1: Theoretical framework of Firm Compliance Behaviour
Variables and Measurement
The primary variable of the study is the level of compliance (COMPLY). The level of compliance of the firms
to the effluent discharge regulations is based on their self assessment to five questions, where the firms are
required to state the priority level of each factor in encouraging the proper management of the firms effluent
over the last five year period. Likert’s five scale is used, that is ‘1=not a priority’ and ‘5=highest priority’.
Following that, each factory’s level of compliance is determined by using cluster analysis based on the answers
given. According to Everitt (2002) cluster analysis is a method used to build informative classification and can
justifiably be used for a set of data that originally had not been classed, by using each individual’s variable
characteristics.
For the probability of inspection (PINS) variable, the management is asked about their perception on the
probability of being inspected in the next 12 months in the form of percentage likelihood. The study uses the
percentage cost of operation and maintenance of the effluent treatment system, as the proxy for gains from not
complying with the regulations (IGAIN). The expected relationship between compliance and operations &
maintenance cost is negative, that is a factory with high effluent treatment cost, will be inclined to not comply.
To measure the probability of being penalised, (P_PEN) is asked about the possibility of being penalised if they
were to get an inspection visits from officers of DOE in the next 12 months period. The percentage value ranges
from zero to one hundred percent with 5% interval in between.
Probability of inspection
(PINS)
Number of inspection
(N_INS)
Characteristics of a firm
Firm compliance
(COMPLY)
Community pressure (ComP)
Market pressure (MP)
Competitive presure (CP)
Investor pressure (IP)
Probability of being fined
(P_PEN)
Gain from illegal activities (IGAIN)
incident of being
penalised (dPEN)
International Academic Research Journal of Business and Technology 1(2) 2015, Page 181-193
186
Wu (2009) provided clear information on how to form the index for informal regulation influence variable
(I_IR). The I_IR variable is formed based on four pressures, these being community pressure (ComP),
competitive pressure (CP), investors pressure (IP) and market pressure (MP). In the questionaire the factory,
was asked to determine the level of influence of each factor had in managing the environment during the
immediate 5 year period. Likert’s 5 point scale was used to give an indication of the level of influence of each
factor. (1=does not influence; 5=highly influential). Multi-type question was asked to determine the influence
each factor had. Since a lot of questions were asked for each of the factor, it is impossible to use each of them as
a seperate variable. To overcome this problem, an average value is calculated for each informal regulation
component, and these for were then averaged again to arrive at the informal regulation variable. The premise
was then asked a direct question on the penalty incident or the issuing of a notice or being taken to court by the
DOE for the failure to comply to the effluent discharge regulation in the year 2010. The dummy variable is
coded for dPEN variable with a binary value ‘1’ for yes (penalised) and ‘0’ representing no.
Analysis Method
Hypothesis testing in this study is carried out by looking at the difference between two independent samples. In
general, there are two methods of testing, that is parametric test or non-parametric test. Parametric test requires
the assumption that the variable is normally distributed and if this condition is not satisfied, then a non-
parametric test is more suitable (De Vaus 2002). To determine the proper analytical tool to be used, the
normality test using Shapiro-Wilks statistic was carried out to determine the nature of distribution of the
variable. A method for testing is then decided.
THE RESULTS
Sample size
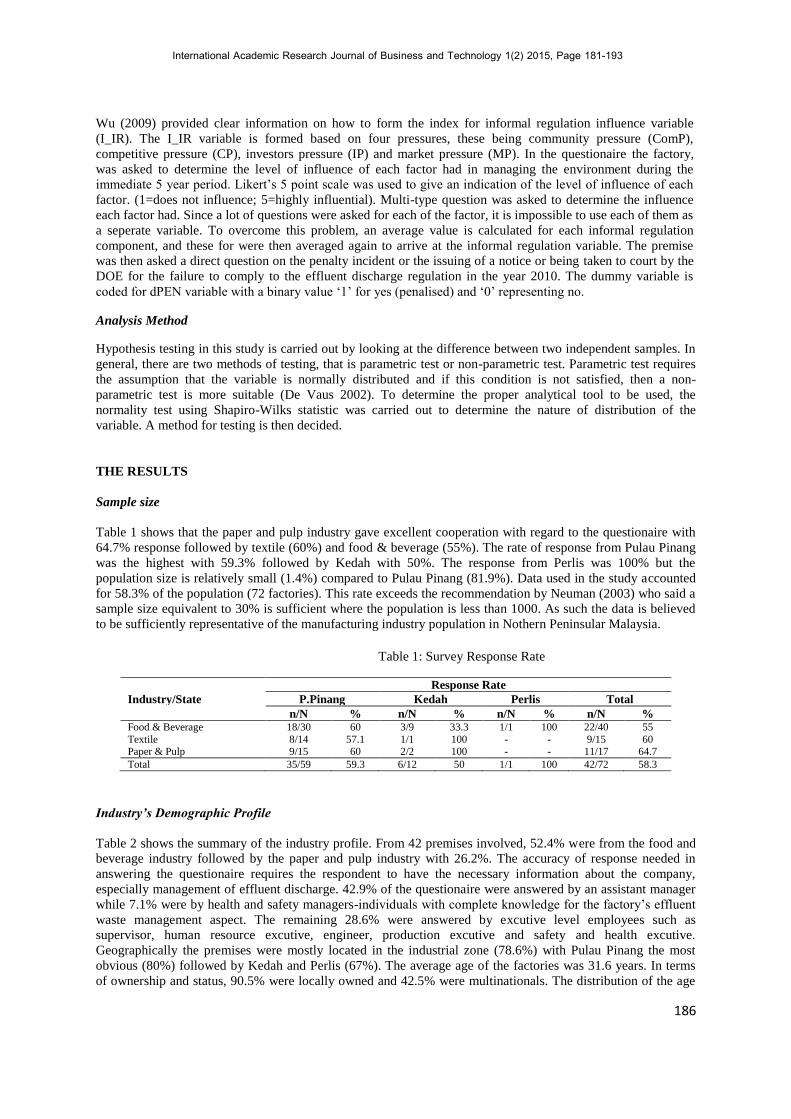
Table 1 shows that the paper and pulp industry gave excellent cooperation with regard to the questionaire with
64.7% response followed by textile (60%) and food & beverage (55%). The rate of response from Pulau Pinang
was the highest with 59.3% followed by Kedah with 50%. The response from Perlis was 100% but the
population size is relatively small (1.4%) compared to Pulau Pinang (81.9%). Data used in the study accounted
for 58.3% of the population (72 factories). This rate exceeds the recommendation by Neuman (2003) who said a
sample size equivalent to 30% is sufficient where the population is less than 1000. As such the data is believed
to be sufficiently representative of the manufacturing industry population in Nothern Peninsular Malaysia.
Table 1: Survey Response Rate
Response Rate
Industry/State P.Pinang Kedah Perlis Total
n/N % n/N % n/N % n/N % Food & Beverage 18/30 60 3/9 33.3 1/1 100 22/40 55
Textile 8/14 57.1 1/1 100 - - 9/15 60 Paper & Pulp 9/15 60 2/2 100 - - 11/17 64.7
Total 35/59 59.3 6/12 50 1/1 100 42/72 58.3
Industry’s Demographic Profile
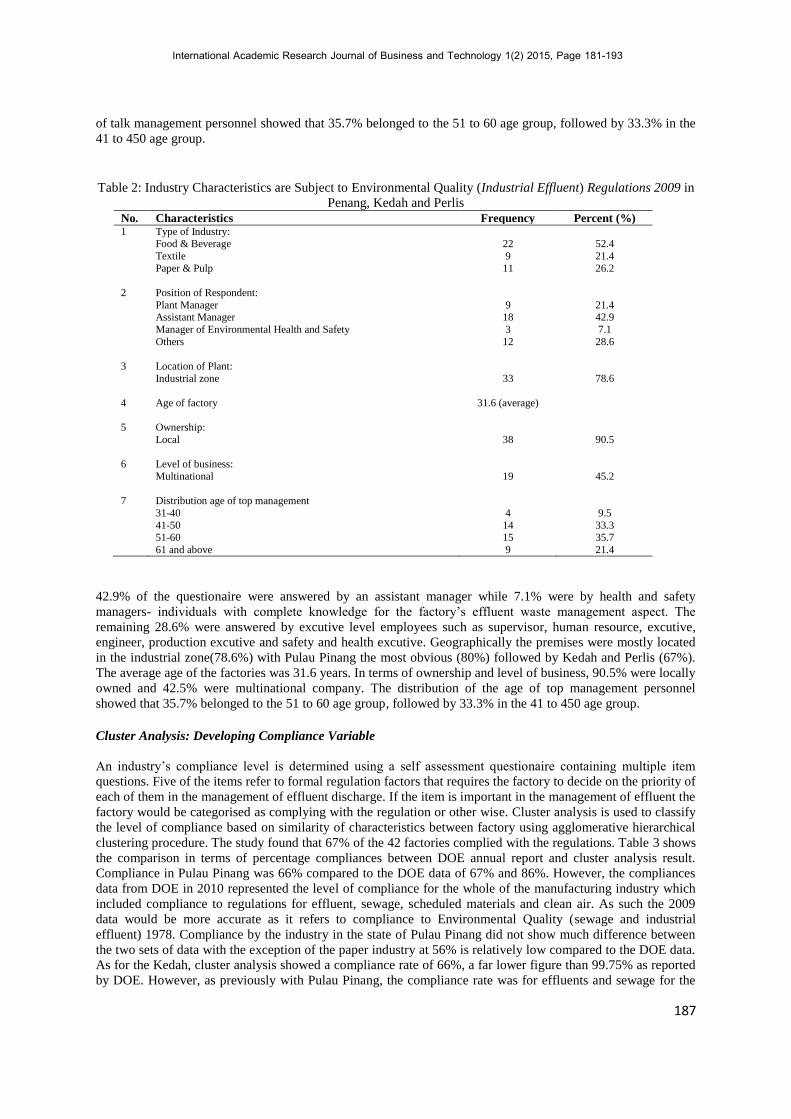
Table 2 shows the summary of the industry profile. From 42 premises involved, 52.4% were from the food and
beverage industry followed by the paper and pulp industry with 26.2%. The accuracy of response needed in
answering the questionaire requires the respondent to have the necessary information about the company,
especially management of effluent discharge. 42.9% of the questionaire were answered by an assistant manager
while 7.1% were by health and safety managers-individuals with complete knowledge for the factory’s effluent
waste management aspect. The remaining 28.6% were answered by excutive level employees such as
supervisor, human resource excutive, engineer, production excutive and safety and health excutive.
Geographically the premises were mostly located in the industrial zone (78.6%) with Pulau Pinang the most
obvious (80%) followed by Kedah and Perlis (67%). The average age of the factories was 31.6 years. In terms
of ownership and status, 90.5% were locally owned and 42.5% were multinationals. The distribution of the age
International Academic Research Journal of Business and Technology 1(2) 2015, Page 181-193
187
of talk management personnel showed that 35.7% belonged to the 51 to 60 age group, followed by 33.3% in the
41 to 450 age group.
Table 2: Industry Characteristics are Subject to Environmental Quality (Industrial Effluent) Regulations 2009 in
Penang, Kedah and Perlis No. Characteristics Frequency Percent (%) 1
Type of Industry: Food & Beverage
Textile
Paper & Pulp
22
9
11
52.4
21.4
26.2
2 Position of Respondent:
Plant Manager Assistant Manager
Manager of Environmental Health and Safety
Others
9 18
3
12
21.4 42.9
7.1
28.6
3 Location of Plant:
Industrial zone
33
78.6
4 Age of factory
31.6 (average)
5 Ownership:
Local
38
90.5
6 Level of business:
Multinational
19
45.2
7 Distribution age of top management
31-40
41-50 51-60
61 and above
4
14 15
9
9.5
33.3 35.7
21.4
42.9% of the questionaire were answered by an assistant manager while 7.1% were by health and safety
managers- individuals with complete knowledge for the factory’s effluent waste management aspect. The
remaining 28.6% were answered by excutive level employees such as supervisor, human resource, excutive,
engineer, production excutive and safety and health excutive. Geographically the premises were mostly located
in the industrial zone(78.6%) with Pulau Pinang the most obvious (80%) followed by Kedah and Perlis (67%).
The average age of the factories was 31.6 years. In terms of ownership and level of business, 90.5% were locally
owned and 42.5% were multinational company. The distribution of the age of top management personnel
showed that 35.7% belonged to the 51 to 60 age group, followed by 33.3% in the 41 to 450 age group.
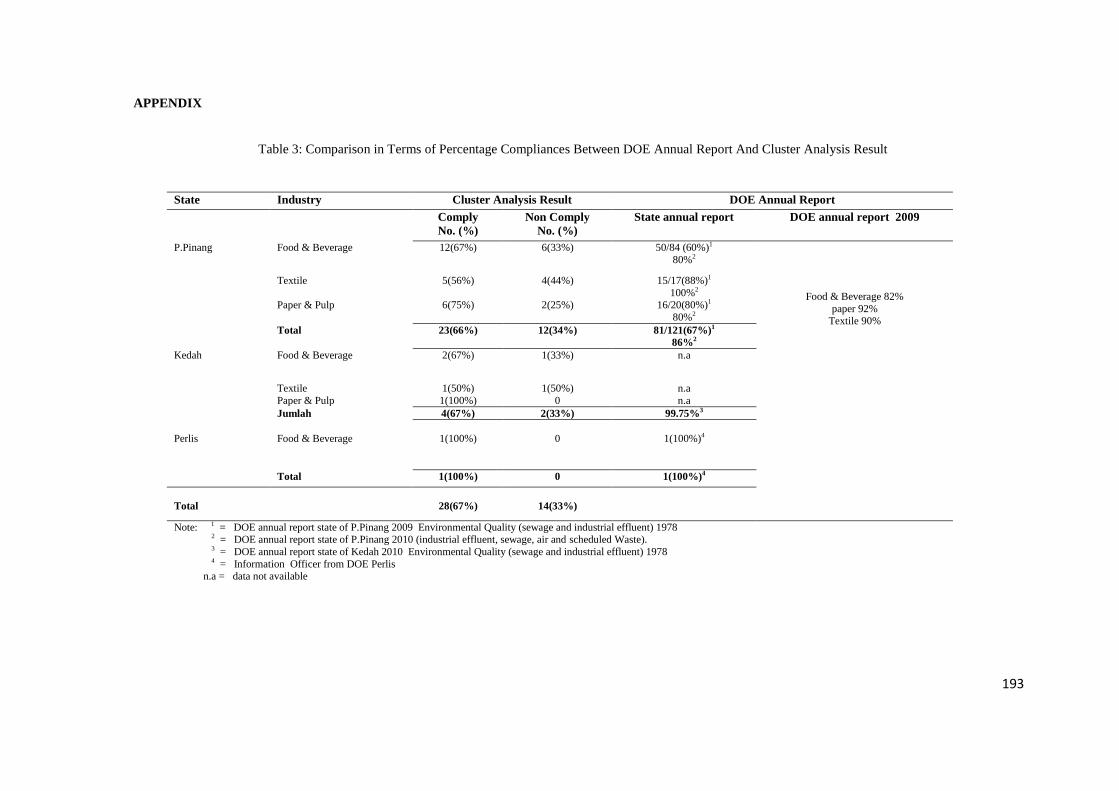
Cluster Analysis: Developing Compliance Variable
An industry’s compliance level is determined using a self assessment questionaire containing multiple item
questions. Five of the items refer to formal regulation factors that requires the factory to decide on the priority of
each of them in the management of effluent discharge. If the item is important in the management of effluent the
factory would be categorised as complying with the regulation or other wise. Cluster analysis is used to classify
the level of compliance based on similarity of characteristics between factory using agglomerative hierarchical
clustering procedure. The study found that 67% of the 42 factories complied with the regulations. Table 3 shows
the comparison in terms of percentage compliances between DOE annual report and cluster analysis result.
Compliance in Pulau Pinang was 66% compared to the DOE data of 67% and 86%. However, the compliances
data from DOE in 2010 represented the level of compliance for the whole of the manufacturing industry which
included compliance to regulations for effluent, sewage, scheduled materials and clean air. As such the 2009
data would be more accurate as it refers to compliance to Environmental Quality (sewage and industrial
effluent) 1978. Compliance by the industry in the state of Pulau Pinang did not show much difference between
the two sets of data with the exception of the paper industry at 56% is relatively low compared to the DOE data.
As for the Kedah, cluster analysis showed a compliance rate of 66%, a far lower figure than 99.75% as reported
by DOE. However, as previously with Pulau Pinang, the compliance rate was for effluents and sewage for the
International Academic Research Journal of Business and Technology 1(2) 2015, Page 181-193
188
year 2010. The difference in percentage compliance between the two data sources is realistic based on several
factors:
(a) The method of measuring the compliance level are different (b) The compliance data from the DOE is from a
mixture of regulations (c) The study sample covered only three industries from three states whilst the DOE data
covered all industries. As such the level of industry compliance obtained in the study through the use of several
questions is realistic and the difference with the DOE is not obvious.
Hypothesis 1
The first hypothesis is on whether the effect of formal regulations is different in influencing the level of industry
compliance and what is the form of relationship between formal regulation and compliance. Two conventional
enforcement tools are inspection and imposition of fines which have been proven in the list of literature to be
capable of influencing the level of compliance. As the testing the hypothesis requires interval or ratio data form,
the probability of inspection variable (PINS) and the probability of fines (P_PEN) are most suitable because it
can potray the industry’s perception towards enforcement. Other than that, the actual inspection count
experienced by the industry variable (N_INS) is also chosen to look at the effect of inforcement.
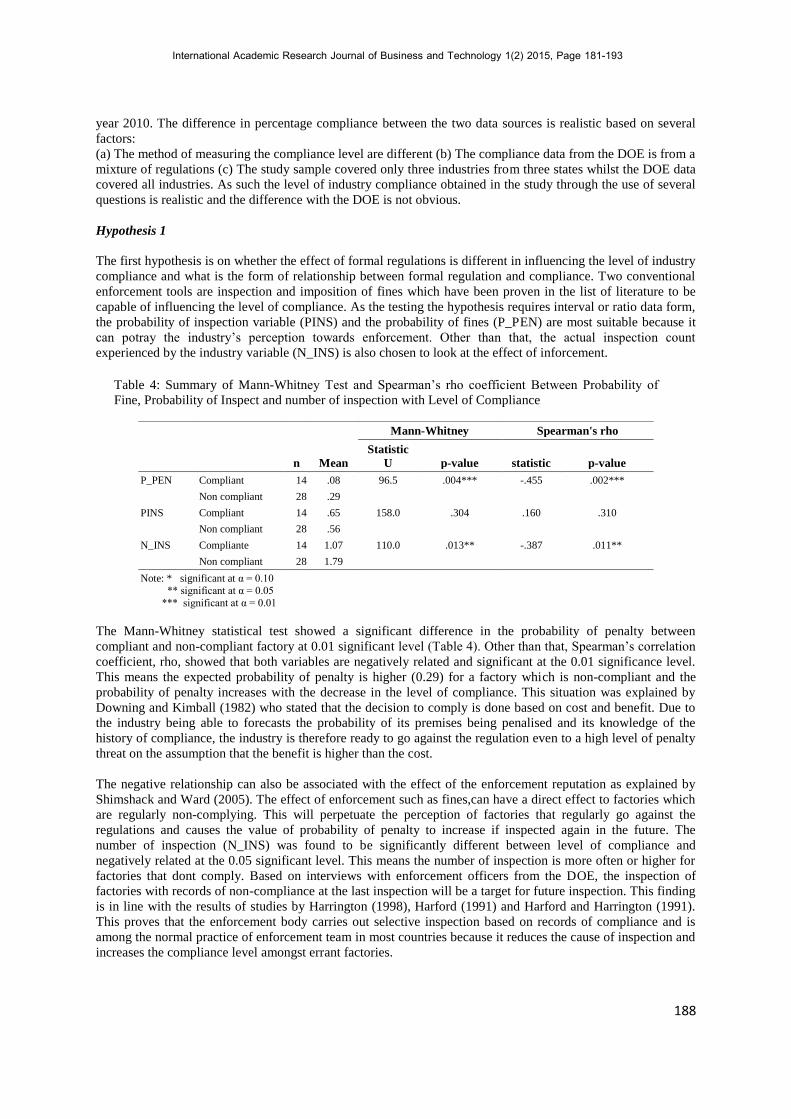
Table 4: Summary of Mann-Whitney Test and Spearman’s rho coefficient Between Probability of
Fine, Probability of Inspect and number of inspection with Level of Compliance
The Mann-Whitney statistical test showed a significant difference in the probability of penalty between
compliant and non-compliant factory at 0.01 significant level (Table 4). Other than that, Spearman’s correlation
coefficient, rho, showed that both variables are negatively related and significant at the 0.01 significance level.
This means the expected probability of penalty is higher (0.29) for a factory which is non-compliant and the
probability of penalty increases with the decrease in the level of compliance. This situation was explained by
Downing and Kimball (1982) who stated that the decision to comply is done based on cost and benefit. Due to
the industry being able to forecasts the probability of its premises being penalised and its knowledge of the
history of compliance, the industry is therefore ready to go against the regulation even to a high level of penalty
threat on the assumption that the benefit is higher than the cost.
The negative relationship can also be associated with the effect of the enforcement reputation as explained by
Shimshack and Ward (2005). The effect of enforcement such as fines,can have a direct effect to factories which
are regularly non-complying. This will perpetuate the perception of factories that regularly go against the
regulations and causes the value of probability of penalty to increase if inspected again in the future. The
number of inspection (N_INS) was found to be significantly different between level of compliance and
negatively related at the 0.05 significant level. This means the number of inspection is more often or higher for
factories that dont comply. Based on interviews with enforcement officers from the DOE, the inspection of
factories with records of non-compliance at the last inspection will be a target for future inspection. This finding
is in line with the results of studies by Harrington (1998), Harford (1991) and Harford and Harrington (1991).
This proves that the enforcement body carries out selective inspection based on records of compliance and is
among the normal practice of enforcement team in most countries because it reduces the cause of inspection and
increases the compliance level amongst errant factories.
n Mean
Mann-Whitney Spearman's rho
Statistic
U p-value
statistic
p-value
P_PEN Compliant 14 .08 96.5 .004*** -.455 .002***
Non compliant 28 .29
PINS Compliant 14 .65 158.0 .304 .160 .310
Non compliant 28 .56
N_INS Compliante 14 1.07 110.0 .013** -.387 .011**
Non compliant 28 1.79
Note: * significant at α = 0.10
** significant at α = 0.05
*** significant at α = 0.01
International Academic Research Journal of Business and Technology 1(2) 2015, Page 181-193
189
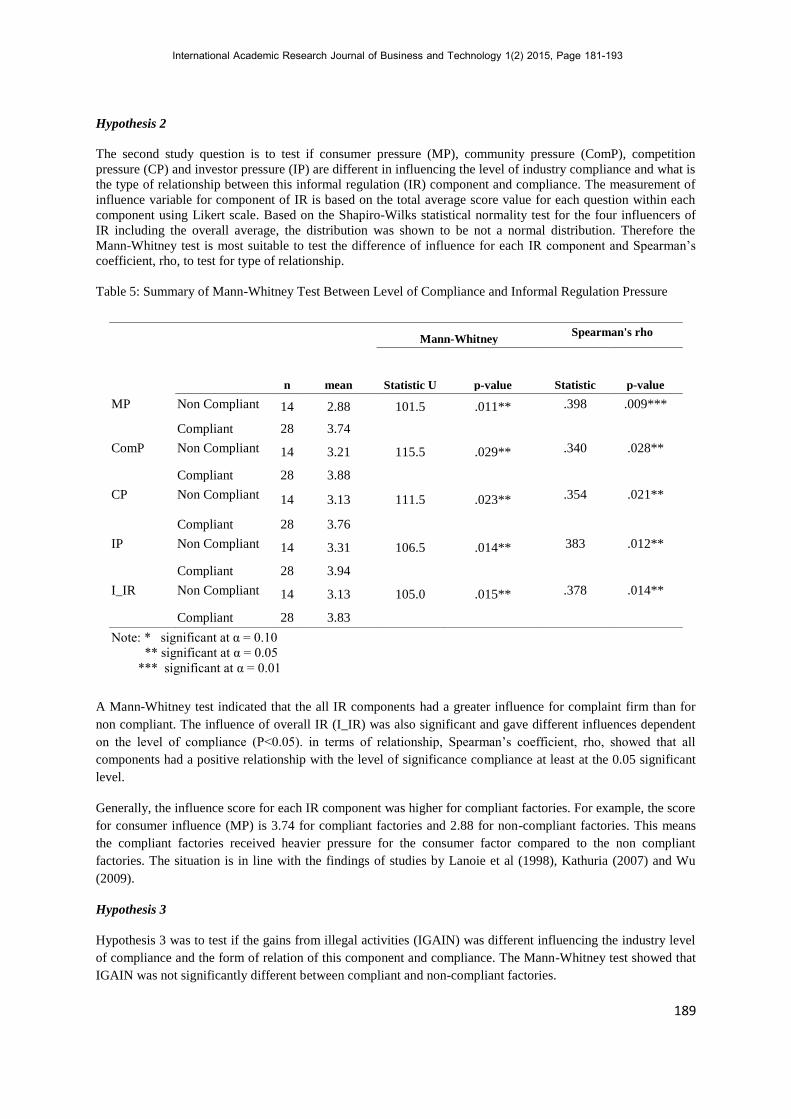
Hypothesis 2
The second study question is to test if consumer pressure (MP), community pressure (ComP), competition
pressure (CP) and investor pressure (IP) are different in influencing the level of industry compliance and what is
the type of relationship between this informal regulation (IR) component and compliance. The measurement of
influence variable for component of IR is based on the total average score value for each question within each
component using Likert scale. Based on the Shapiro-Wilks statistical normality test for the four influencers of
IR including the overall average, the distribution was shown to be not a normal distribution. Therefore the
Mann-Whitney test is most suitable to test the difference of influence for each IR component and Spearman’s
coefficient, rho, to test for type of relationship.
Table 5: Summary of Mann-Whitney Test Between Level of Compliance and Informal Regulation Pressure
A Mann-Whitney test indicated that the all IR components had a greater influence for complaint firm than for
non compliant. The influence of overall IR (I_IR) was also significant and gave different influences dependent
on the level of compliance (P<0.05). in terms of relationship, Spearman’s coefficient, rho, showed that all
components had a positive relationship with the level of significance compliance at least at the 0.05 significant
level.
Generally, the influence score for each IR component was higher for compliant factories. For example, the score
for consumer influence (MP) is 3.74 for compliant factories and 2.88 for non-compliant factories. This means
the compliant factories received heavier pressure for the consumer factor compared to the non compliant
factories. The situation is in line with the findings of studies by Lanoie et al (1998), Kathuria (2007) and Wu
(2009).
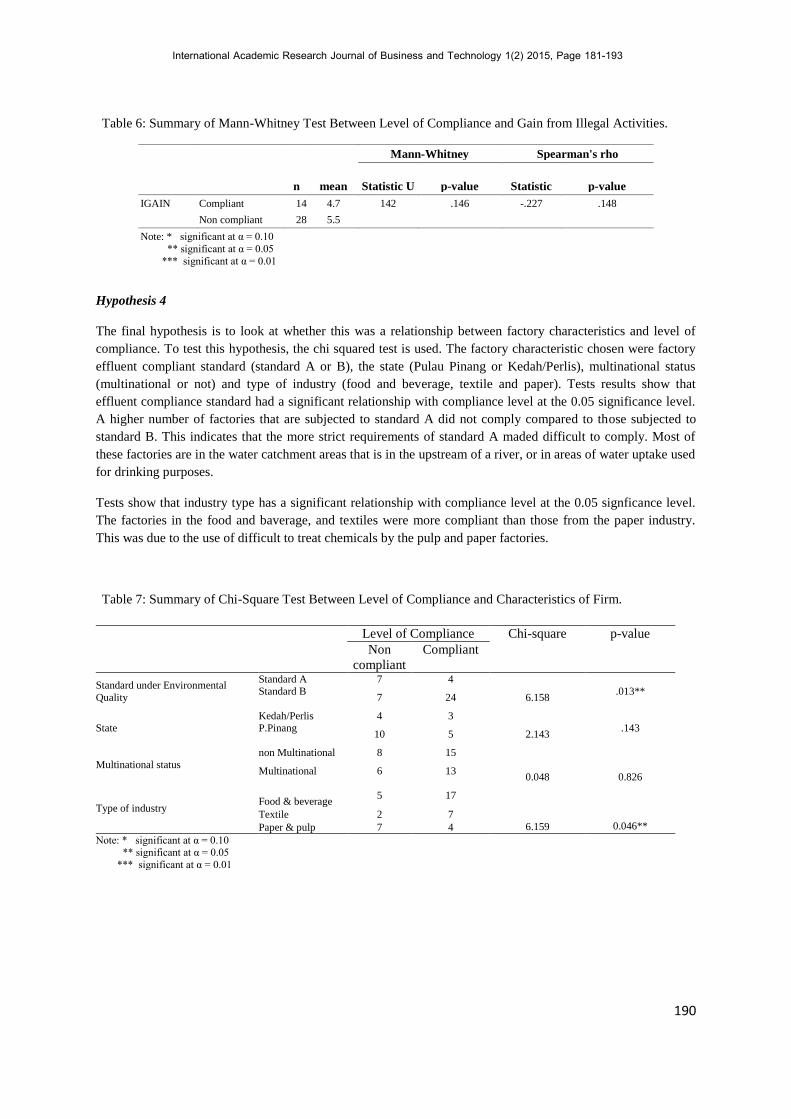
Hypothesis 3
Hypothesis 3 was to test if the gains from illegal activities (IGAIN) was different influencing the industry level
of compliance and the form of relation of this component and compliance. The Mann-Whitney test showed that
IGAIN was not significantly different between compliant and non-compliant factories.
Mann-Whitney
Spearman's rho
n
mean Statistic U p-value
Statistic
p-value
MP Non Compliant 14 2.88 101.5 .011** .398 .009***
Compliant 28 3.74
ComP Non Compliant 14 3.21 115.5 .029** .340 .028**
Compliant 28 3.88
CP Non Compliant 14 3.13 111.5 .023** .354 .021**
Compliant 28 3.76
IP Non Compliant 14 3.31 106.5 .014** 383 .012**
Compliant 28 3.94
I_IR Non Compliant 14 3.13 105.0 .015** .378 .014**
Compliant 28 3.83
Note: * significant at α = 0.10
** significant at α = 0.05
*** significant at α = 0.01
International Academic Research Journal of Business and Technology 1(2) 2015, Page 181-193
190
Table 6: Summary of Mann-Whitney Test Between Level of Compliance and Gain from Illegal Activities.
Hypothesis 4
The final hypothesis is to look at whether this was a relationship between factory characteristics and level of
compliance. To test this hypothesis, the chi squared test is used. The factory characteristic chosen were factory
effluent compliant standard (standard A or B), the state (Pulau Pinang or Kedah/Perlis), multinational status
(multinational or not) and type of industry (food and beverage, textile and paper). Tests results show that
effluent compliance standard had a significant relationship with compliance level at the 0.05 significance level.
A higher number of factories that are subjected to standard A did not comply compared to those subjected to
standard B. This indicates that the more strict requirements of standard A maded difficult to comply. Most of
these factories are in the water catchment areas that is in the upstream of a river, or in areas of water uptake used
for drinking purposes.
Tests show that industry type has a significant relationship with compliance level at the 0.05 signficance level.
The factories in the food and baverage, and textiles were more compliant than those from the paper industry.
This was due to the use of difficult to treat chemicals by the pulp and paper factories.
Table 7: Summary of Chi-Square Test Between Level of Compliance and Characteristics of Firm.
Level of Compliance Chi-square p-value
Non
compliant
Compliant
Standard under Environmental
Quality
Standard A 7 4
6.158
.013** Standard B
7 24
State Kedah/Perlis 4 3
2.143
.143 P.Pinang
10 5
Multinational status non Multinational 8 15
0.048
0.826 Multinational 6 13
Type of industry
Food & beverage
5 17
6.159
0.046** Textile 2 7
Paper & pulp 7 4
Note: * significant at α = 0.10 ** significant at α = 0.05
*** significant at α = 0.01
n mean
Mann-Whitney Spearman's rho
Statistic U p-value
Statistic
p-value
IGAIN Compliant 14 4.7 142 .146 -.227 .148
Non compliant 28 5.5
Note: * significant at α = 0.10
** significant at α = 0.05
*** significant at α = 0.01

International Academic Research Journal of Business and Technology 1(2) 2015, Page 181-193
191
DISCUSSION AND CONCLUSION
Premise inspection is amongst the conventional tools of enforcement to influence compliance. The number of
inspection received by a factory can have a preventive effect and subsequently influence the level of
compliance. The study shows the number of inspection was significantly different between compliant and non-
compliant factories. The findings of this study showed a similarity with findings of Harrington (1988), Harford
(1991) and Harford and Harrington (1991) on tax compliance. The study also shows the probability of
inspection did not influence compliance, while the effect of actual inspection (number of inspection) had a
significant relationship with compliance. It can be concluded that actual inspection influences level of
compliance but the reputation of inspection failed to influence the level of compliance.
Tests also showed that probability for penalty (P_PEN) were significantly different (P<0.05) between level of
compliance. Factories compliant to regulations had a lower perception of propability for penalty compared to
the non-compliant factories. This negative relationship is contrast with the other studies but the situation has
been explained by Downing and Kimball (1982). Factories have certain expectation towards probability for
penalty and if the probability for penalty is high, the factory is more inclined to go against the regulation after
weighing that the cost is lower to go against the regulations.
Tests were carried out to look at the difference in influence of components of IR that is consumer influence
(MP), community influence (ComP), competitive influence (CP) and investor influence (IP) and the informal
regulation influence index (I_IR) for level of compliance.
Each component differently influence the level of compliance and had a positive relationship with the level of
compliance. This means that the higher the pressure of the informal regulation component, the more incline the
industry is to comply. The findings are similar to past studies done by Pargal et al (1997b), Kathuria (2006) and
Lanoie et al (1998). This instrument has the potential to complement or be an effective replacement tool in
influencing industry behaviour and will reduce dependenceon government financial provisions.
In summary, the studies on compliance and inspection has been done quite regularly in both developed and
developing countries. However, there is potential for this type of studies to be expanded further in order to
evaluate. The current situation with regard to the involvement level of private citizens in the enforcement
activities and thus develop a mechanism as to how private citizen involvement can be incorporated formally in
the enforcement process.
REFERENCES
Becker, G. S., (1968). Crime and punishment: An economic approach. Journal of Political
Economy,76(2), 169-217.
Cohan, M. A. (1999). Monitoring and enforcement of environmental policy. In H. Folmer, & T. Tietenberg,
(Ed.), The international yearbook of environmental and resource economics 1999/2000 a survey of
current issues (pp. 44-79). Edward Elgar Publishing, UK.
De Vaus, D. (1996). Surveys in Social Research. 4th edition. London: UCL Press Limited.
De Vaus, D. (2002). Analyzing social science data. Sage Publication.
De Vaus, D. (2002). Surveys in social research. 5th edition. Allen & Unwin.
Dowell, R. S, Goldfarb, R. S & Griffith, W. B. (1998). Economic man as a moral individual. Economic Inquiry,
36, 645-653.
Downing, P., & Kimball, J. (1982). Enforcing pollution control laws in the United States. Policy Studied
Journal, 11(1), 55-65.
Downing, P., & Watson, W. D. (1974). The economics of enforcing air pollution controls. Journal of
Environmental Economics and Management, 1, 219-236.
Earnhart, D. (2004). Regulatory factors shaping environmental performance at publicly- owned treatment
plants. Journal of Environmental Economics and Management, 48, 655-681.
Everitt, B. S., (2002). The cambridge dictionary of statistics. Cambridge University Press.
International Academic Research Journal of Business and Technology 1(2) 2015, Page 181-193
192
Gangadharan, L. (2006). Environmental compliance by firm in the manufacturing sector in Mexico. Ecological
Economics, 59, 477-486.
Goldar, B., & Banerjee, N. (2004). Impact of informal regulation of pollution on water quality in river in
India. Journal of Environmental Management, 73, 117-130.
Gray, W. B., & Deily, M. E. (1996). Compliance and enforcement: Air pollution regulation in the U.S. steel
industry. Journal of Environmental Economics and Management, 31, 96-111.
Hamilton, J. T. (1995). Pollution as news: Media and stock market reactions to the toxics release inventory data.
Journal of Environmental Economics and Management, 28, 98- 113.
Harford, J. D. (1978). Firm behaviour under imperfectly enforceable pollution standards and taxes. Journal of
Environmental Economics and Management, 5, 26-43.
Harford, J. D. (1991). Measurement error and state-dependent pollution control enforcement. Journal of
Environmental Economics and Management, 21, 67-81.
Harford, J. D. (1997). Firm ownership patterns and motives for voluntary pollution control. Managerial and
Decision Economics, 18(6), 421-432.
Harford, J. D., & Harrington, W. (1991). A reconsideration of enforcement leverage when penalties are
restricted. Journal of Public Economics, 45(3), 391-395.
Harrington, W. (1988). Enforcement leverage when penalties are restricted. Journal of Public Economics, 37,
29-53.
Hatcher, A., Jaffry, S., Thebaud, O., & Bennett, E. (2000). Normative and social influences affecting
compliance with fishery regulations. Land Economics, 76(3), 448-461.
Hettige, H., Huq, M., Pargal, S., & Wheeler, D. (1996). Determinants of pollution abatement in developing
countries: Evidence from South and Southeast Asia. World Development, 24 (12), 1891-1904.
Jamalunlaili Abdullah. (1997). Urban Environment Health in Developing Countries: A Case Study of Penang
Island, Malaysia. Retrieved from ProQuest Digital Dissertations. (AAT 9727879)
Kathuria, V. (2007). Controlling water pollution in developing and transition countries- lessons from three
successful cases. Journal of Environmental Management, 78, 405-426.
Lanoie, P., Laplante, B,. & Roy, M. (1998). Can capital markets create incentives for pollution control?
Ecological Economics, 26, 31-41.
Laplante, B., & Rilstone P. (1996). Environmental inspections and emissions of the pulp and paper industry in
Quebec. Journal of Environmental Economics and Management, 31, 19-36.
Magat, W. A., & Viscusi, W. K. (1990). Effectiveness of the EPA’s regulatory enforcement: The case of
industrial effluent standards. Journal of Law and Economics, 33, 331- 360.
Malaysia, Akta Kualiti Alam Sekeliling (AKAS) 1974.
Malaysia, Rancangan Malaysia (pelbagai tahun).
Malaysia. 1974. Akta Kualiti Alam Sekeliling (Pindaan) 2001.
Nueman, W. L. (2003). Social research methods: Qualitative and quantitative approaches. 5th edition. Alan &
Bacon.
Pargal, S., Hettige, H., Singh, M. & Wheeler, D., (1997a). Formal and informal regulation of industrial
pollution: comparative evidence from Indonesia and the United States. World Bank Economic Review,
11(5), 433–450.
Pargal, S., Mani, M., & Huq, M., (1997b). Inspections and Emissions in India: Puzzling Survey Evidence on
Industrial Water Pollution. PRD Working Paper no. 1810. Development Research Group, World Bank,
Washington, DC.
Pargal, S., & Wheeler, D. (1996). Informal regulation of industrial pollution in developing countries: evidence
from Indonesia. Journal of Political Economy, 104(6), 1314-1327.
Shimshack, J. P., & Ward, M. B. (2005). Regulator reputation, enforcement and environmental compliance.
Journal of Environmental Economics and Management, 50, 519-540.
Shimshack, J. P. & Ward, M. B. (2008). Enforcement and over-compliance. Journal of Environmental
Economics and Management, 55, 90-105.
Storey, D. J., & McCabe, P. J. (1980). The criminal waste discharge. Scottish Journal of Political Economy,
27(1), 30-40.
Wang, H., Bi, J., Wheeler, D., Wang, J., Cao, D., Lu, G. & Wang, Y. (2004). Environmental performance rating
and disclosure: China’s green watch program. Journal of Environmental Management, 71(2), 123-133.
Wu, J. (2009). Environmental compliance: The good, the bad, and the super green. Journal of Environmental
Management, 90(11), 3363-3381.
193
APPENDIX
Table 3: Comparison in Terms of Percentage Compliances Between DOE Annual Report And Cluster Analysis Result
State Industry Cluster Analysis Result DOE Annual Report
Comply
No. (%)
Non Comply
No. (%)
State annual report DOE annual report 2009
P.Pinang Food & Beverage 12(67%) 6(33%) 50/84 (60%)1
80%2
Food & Beverage 82%
paper 92% Textile 90%
Textile 5(56%) 4(44%) 15/17(88%)1
100%2
Paper & Pulp 6(75%) 2(25%) 16/20(80%)1
80%2
Total 23(66%) 12(34%) 81/121(67%)1
86%2
Kedah Food & Beverage 2(67%) 1(33%) n.a
Textile 1(50%) 1(50%) n.a
Paper & Pulp 1(100%) 0 n.a
Jumlah 4(67%) 2(33%) 99.75%3
Perlis
Food & Beverage
1(100%)
0
1(100%)4
Total 1(100%) 0 1(100%)4
Total
28(67%)
14(33%)
Note: 1 = DOE annual report state of P.Pinang 2009 Environmental Quality (sewage and industrial effluent) 1978 2 = DOE annual report state of P.Pinang 2010 (industrial effluent, sewage, air and scheduled Waste).
3 = DOE annual report state of Kedah 2010 Environmental Quality (sewage and industrial effluent) 1978
4 = Information Officer from DOE Perlis n.a = data not available