Embed Size (px)
Citation preview
Jurnal Dinamika Akuntansi dan Bisnis Vol. 6(2), 2019, pp 171-182
171
Firm Size, Market Risk, and Stock Return: Evidence from Indonesian Blue
Chip Companies
Meutia Handayani1, Talbani Farlian
2*, Ardian
3
1,3Accounting Department, Politeknik Aceh, Banda Aceh – Indonesia
2Economic Development Department, Faculty of Economics and Business, Universitas Syiah Kuala - Indonesia
*Corresponding author: [email protected]
1. Introduction
Indonesia is a country with progressive
economic development and growing private
investment. The capital market in Indonesia,
known as the Indonesia Stock Exchange (IDX),
has been serving as a platform for investors to
engage in investment activities and source of
funding for businesses. The IDX offers various
investment products and features to help investors
in making the best investment decisions. In the
IDX, stocks are classified into 24 indexes to
provide better information for investors. One of
the indexes is the LQ45. The LQ45 is one of the
most referred indexes and it has a major influence
A R T I C L E I N F O R M A T I O N A B S T R A C T
Article history:
Received date: 16 February 2019
Received in revised form: 22 August 2019
Accepted: 25 August 2019
Available online: 07 October2019
Keywords:
Firm size, Market risk, Stock return, Blue
chip, LQ 45
Citation:
Farlian, T., Handayani, M., & Ardian. (2019). Firm Size, Market Risk, and Stock Return: Evidence from Indonesian Blue Chip Companies. Jurnal Dinamika Akuntansi dan Bisnis, 6(2), 171-182.
Kata Kunci:
Ukuran perusahaan, Risiko pasar, Stock
return, Blue chip, LQ 45
This study examines the influence of firm size and market risk on the stock return
of Indonesian high reliable companies. The samples are companies listed on the
LQ45 between 2015 and 2017. There are 45 companies have been selected or 196
observations. The data was obtained from the financial reports and analysed by
using regression for panel data method, namely the common effect model and the
Chow test. The results of this study demonstrated that firm size has an effect on
the stocks return, while market risk does not have effect on the stocks return of the
blue chip companies. The results of this study are expected to help investors in
making proper investment decisions toward bluechip Indonesian companies.
Ukuran Perusahaan, Risiko Pasar, dan Tingkat Pengembalian
Saham: Penelitian pada Perusahaan Blue Chip di Indonesia
ABSTRAK
Penelitian ini bertujuan untuk menguji pengaruh ukuran perusahaan dan risiko
pasar terhadap return saham perusahaan blue chip di Indonesia. Sampel yang
diambil terdiri dari 196 observasi dari perusahaan LQ45 yang terus bertahan dari
periode 2015 sampai dengan 2017. Data penelitian didapatkan dari laporan
keuangan perusahaan sampel yang telah dipilih. Penelitian ini menggunakan
metode regresi data panel, yaitu model common effect dan uji Chow. Hasil dari
penelitian ini menunjukkan bahwa ukuran perusahaan berpengaruh terhadap
return saham, sedangkan risiko pasar tidak berpengaruh negatif terhadap return
saham. Hasil penelitian ini diharapkan dapat membantu para investor dalam
membuat keputusan investasi yang lebih baik terkait perusahaan blue chip di
Indonesia.
https://dx.doi.org/10.24815/jdab.v6i2.13082
172 Handayani, Farlian & Ardian/Jurnal Dinamika Akuntansi dan Bisnis Vol. 6(2), 2019, pp 171-182
in IDX (Antou & Tasik, 2017). The movement of
LQ45 stocks can lead to the change of other
indexes, for example, the IDX composite index.
The reason could be that most of the LQ45
companies are well-established companies and
considered as the Indonesian blue chip companies
(Antou & Tasik, 2017). The LQ45 comprises of
the most liquid and high market capitalization
companies. There are 45 companies included in
the index. The LQ45 companies earn good profit
and consistently pay a dividend to investors
(Darmaji & Fakhruddin, 2011).
Several factors that should be considered
when investors making investment decisions
(Sudiyatno & Irsad, 2011), including the size of
the company and risk (Al-Mwalla & Karasneh,
2011). According to Koluku, Pangemanan, &
Tumewu (2015), investors expect a higher return
from companies which have sound financial
performance. Another factor is a market risk
which is likened with company size like two sides
of a coin (Wijaya & Djajadikerta, 2017).
The firm size is an element that should be
considered by investors to make a decision
whether a company is small, medium, or large
company. The criteria of firm size can be
examined through its sale, the number of product,
capital resources, and total asset (Jogiyanto, 2003).
The firm size can affect the value of company to
aid them in acquiring a funding investment. Large
companies are very likely to have sufficient fund
to support all their activities in making optimal
profit. The size of the company in LQ45 is more
preferably by investors (Koluku et al., 2015),
considering that the LQ45 companies is
companies with the best financial performance and
good growth prospects so that it can provide more
complete information to investors and has a low
risk for their investment interest (Wijaya &
Djajadikerta, 2017).
Several previous studies regarding the impact
of firm size on stock return. The proxies used are
divergent. Sudarsono & Sudiyatno (2014) found
that firm size has positive significant influence
toward stocks return of real estate and property
companies listed at the IDX. Similarly, the study
of Acheampong, Agalega, & Shibu (2014)
unveiled firm size affects positively stock return of
manufacturing companies listed in Ghana Stock
Exchange. On the contrary, Duy & Phuoc (2016)
discovered negative effect of firm size on the stock
return of services Companies in Ho Chi Minh
Stock Exchange. Other studies also unveil that
firm size does not infliemce the stock returns. See
for example, (Abdullahi, Lawal, & Muhtar, 2011;
Shafana, Rimziya, & Jariya, 2013; Yani &
Emrinaldi, 2014).
The next variable needed to be considered by
investor is the risk. One of the risks that should be
well considered is market risk. Market risk reflects
a condition where a company deals with changes
on market condition and control which is
unpredictable toward the changes of stock price
(Mosey, Tommy, & Untu, 2016).
Market risk is the risk of loss in liquid
portfolio arising from the movements in market
prices and consisting of interest rate, currency,
equity, and commodity risk (Ekinci, 2016).There
have been many previous studies on the impact of
risk towards stock return relationship that show
divergent findings. For example, (Pamane &
Vikpossi, 2014) and (Buana & Haryanto, 2016)
reported on their researches that market risk does
not have influence on stock return. While
Mwaurah, Muturi, & Waititu (2017) on the other
hand, claimed in his research that market risk has a
influence on stock return.
This research is aimed to examine the
influence of firrm size and market risk on stock
return. The results would assist investors to
evaluate and predict stock return of the LQ45
companies. Along with this research, mitigation
risk of this research would be in-depth oversee
whether the more liquidity of LQ45 stocks of
companies has potential higher return facing either
larger or smaller risk. Likewise, the LQ 45
companies are the most liquid of its shares and LQ
45 have a safe stock because the fundamental
173 Handayani, Farlian & Ardian/Jurnal Dinamika Akuntansi dan Bisnis Vol. 6(2), 2019, pp 171-182
performance of the stock is good so that the risk is
low which will be as a reference in future time for
investors on obtaining the return (Sambelay, Rate,
& Baramuli, 2017).
Even though LQ45 companies have good
standing listed companies in stocks exchange, it
would not merely be qualified and always be
profitable in terms of avoiding of market risk and
stocks return achievement. Therefore, LQ45
stocks could not assure and guarantee of higher
return in short run if the investors are doing buy
and sell trading of LQ45 more frequent in high
turnover stocks trading. It tends to be less profit
and downgrading of return. It would be less
beneficial for investor if the LQ45 companies to
do such high turnover activity in stocks exchange.
2. Theoretical Framework and Hypothesis
Development
Stock Return
Profit serves as the main motivation for
investor (Dwialesi & Darmayanti, 2016). The
expected profit rate is right in line with the risk
faced by the investor. The return can be classified
into yield and capital gain (loss). Yield is part of
stock return that indicates the income gained,
while capital gain (loss) is part of return that its
rise and fall depend on stock’s value which
makes investor to gain profit or loss (Tandelilin,
2001). The types of return can be distinguished
into two types, namely realized return and
expected return. The realized return is a gained
return that calculated through documented data. It
is used to measure performance of company. The
value of historical data is used to calculate matrix
measurement of expected return and future risk
(Arista & Astohar, 2012). The expected return is
a return that is expected to be gained in the
future. Thus, expected return and risk are two
crucial information used by investor in making
investment decision (Jogiyanto, 2003).
LQ 45 Index
Indonesia Stock Exchange is an official trade
facilitator for investor to invest in Indonesia. The
Indonesia Trade Exchange offers various
products for investors in performing investment
activities. Besides the financial instrument for
investment such as stocks and bonds, the
Indonesia Trade Exchange also provides stock
index called LQ45.
The LQ45 Index provides an additional
option for investor in doing investment activities.
It consists of 45 companies that have a high
market liquidity and capitalization. The 45
companies have been joined the Indonesia Stock
Exchange for at least three months and have
maximum performance in regular market
(Sambelay et al., 2017). The LQ45 applies a basic
calculation concept that is the Aggregate Market
Value of the total listed stocks on 13 July 1994
(Antou & Tasik, 2017). A company that shows a
decline in performance will be replaced with a
well performed stocks (Antou & Tasik, 2017).
The Influence of Firm Size on Stock Return
In making investment decision, each investor
is required to consider firm size of the targeted
company. The firm size can be categorized into
three groups, they are large scale company,
medium scale company, and small scale company.
There are various measures used to specify the
firm size. For example,, it can be categorized
based on total of asset, total of sales, stock market
value, and many other measures which can affect
investor judgment in doing investment
(Rahmawati, Topowijono, & Sulasmiyati, 2015).
The firm size reflects the ability of company
in dealing with the risk that lies ahead of it. A
large scale company should have myriad resources
in pushing up its value. The bigger company, the
more competence to take it on controlling and
competing in global market and economic
competition. It made them look stronger in
dealing with changes or economic development
and becomes more popular among investors
(Prasetyorini, 2013). This condition is caused by
the high growth of large scale company, thus it
174 Handayani, Farlian & Ardian/Jurnal Dinamika Akuntansi dan Bisnis Vol. 6(2), 2019, pp 171-182
can affect the value and scale of company with
possibility to gain benefit from its positive trend
(Prasetia, Tommy, & Saerang, 2014). The bigger
company the more popular it is in community.
This condition makes the work to find investors
for the company much easier. Investors are more
interested in large companies because they are
more stable and have more access to funding both
from internal and external source (Hendra,
Koesharjono, & Priantono, 2018).
The maximum income is expected to boost
company’s profit. The huge profit gained by a
company is expected to provide a higher profit
return for its investor. Thus, it can be concluded
that a company listed in large scale company can
provide a higher profit return for the investor
because of its better ability in funding and
choosing investment sector compared to a
relatively small scale company.
There are some measurements in categorizing
firm size. One of the proxies used is the total asset
owned by the company as the value of total asset
normally is higher than its other accounts
(Rahmawati et al., 2015). Firm size can be also
represented by total asset, sale, and market
capitalization. A large total asset owned by
company may invite more capital to come, while
a high sale profile speeds up cash flow in the
company. A high market capitalization makes the
company to gain reputation and popularity among
people, it also shows that the company has good
performance. Thus, the three variables can be
used to measure scale of company.
Investment decisions are defined as a
combination of assets in place and future
investment options with a positive net present
value. So companies with large total assets
indicate a good cash flow and long term
prospects (Hassan Al-Tamimi & Anood Bin
Kalli, 2009).
Therefore, investors will be more speculated
to choose large companies with the hope of
obtaining high returns. Based on the signal
theory, companies provide signals to investors in
the form of financial statements with total assets
so that investors are interested in investing in the
company. The size of the company raises a
positive signal to investors (Connelly, Certo,
Ireland, & Reutzel, 2011). It can be concluded
that the size of the company has a positive
influence on stock returns which have been
confirmed by several prior studies for example,
(Acheampong et al., 2014; Ayuba, Bambale,
Ibrahim, Sulaiman, & Abdulwahab, 2019; Duy &
Phuoc, 2016; Hidayat, 2016; Sudarsono &
Sudiyatno, 2014).
Based on the signal theory and the results of
previous studies, the following hypothesis is
proposed:
H1: Firm size has influence on stock return.
The Influence of Market Risk on Stock Return
Significant changes in market conditions
may affect sustainability and profitability of
companies. The effect can be minimized if the
problem is controllable by management. But, if
the problem or situation is caused by external
parties, the market situations can affect the
financial situation of companies.
Market risk is a condition experienced by a
company caused by changes in market conditions
and external situations (Fahmi, 2017). Investors
invest for anticipated future returns, but the
returns can rarely be predicted precisely as the
returns and investment are associated with risk
(Acheampong et al., 2014). In making investment
decision, an investor should not merely focus on
profit, but also the risk factor. In each level of
profit return expected by investor, there is a risk.
The uncertainty of cash flow in the future can be
linked to investment risk, whether it is systematic
risk or unsystematic risk (Paramitasari, 2014).
The market risk can be measured using the
beta coefficient (β), a variance of stock price
toward uncertainty of market condition. An
increase in market risk makes investors less
interested in the stock. A greater beta stimulate a
higher expectation toward the profit, and thus
175 Handayani, Farlian & Ardian/Jurnal Dinamika Akuntansi dan Bisnis Vol. 6(2), 2019, pp 171-182
increase the level of investment risk (as shown by
its Beta coefficient). On the contrary, a low stock
price also has effect toward future stock return,
reduces the risk into a lower level.
There are several different results found by
researchers, for instances (Al-Qudah & Laham,
2013; Chiang & Zhang, 2018; Koluku et al.,
2015; Syahrin & Darmawan, 2018). They
uncovered that market risk have influnce on
stocks return.
H2: Market risk has influence on stock return.
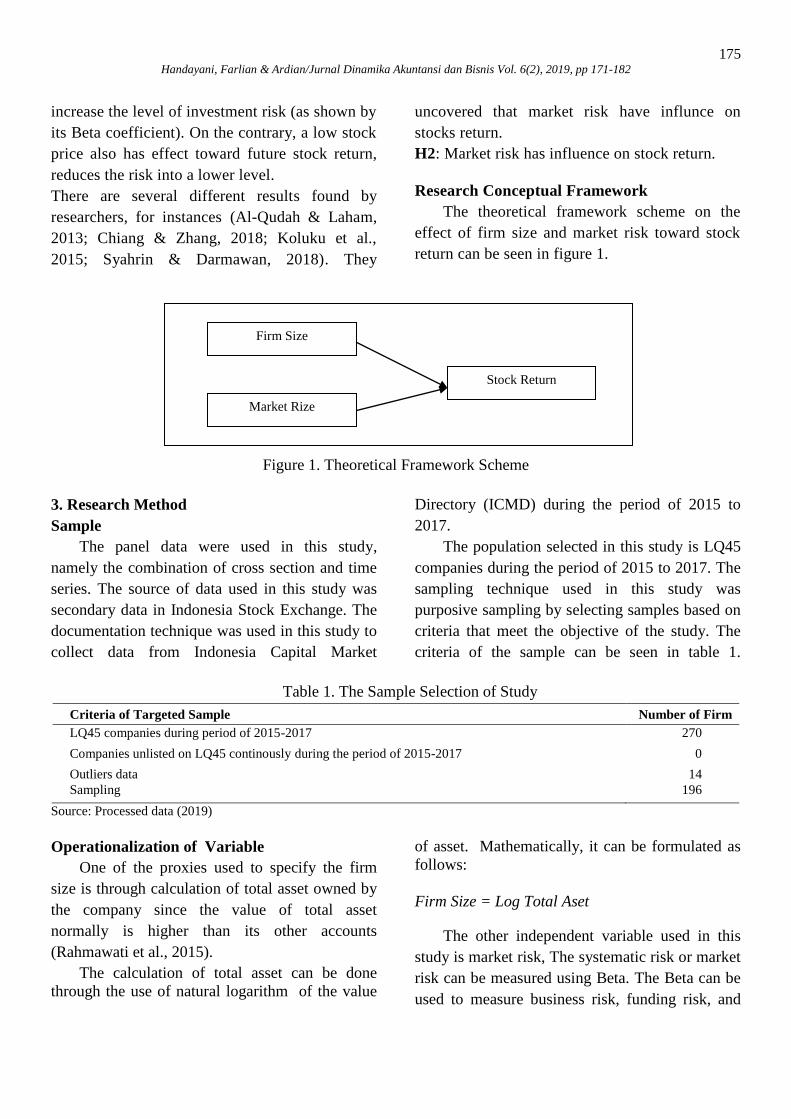
Research Conceptual Framework
The theoretical framework scheme on the
effect of firm size and market risk toward stock
return can be seen in figure 1.
Figure 1. Theoretical Framework Scheme
3. Research Method
Sample
The panel data were used in this study,
namely the combination of cross section and time
series. The source of data used in this study was
secondary data in Indonesia Stock Exchange. The
documentation technique was used in this study to
collect data from Indonesia Capital Market
Directory (ICMD) during the period of 2015 to
2017.
The population selected in this study is LQ45
companies during the period of 2015 to 2017. The
sampling technique used in this study was
purposive sampling by selecting samples based on
criteria that meet the objective of the study. The
criteria of the sample can be seen in table 1.
Table 1. The Sample Selection of Study
Criteria of Targeted Sample Number of Firm
LQ45 companies during period of 2015-2017 270
Companies unlisted on LQ45 continously during the period of 2015-2017 0
Outliers data 14
Sampling 196
Source: Processed data (2019)
Operationalization of Variable
One of the proxies used to specify the firm
size is through calculation of total asset owned by
the company since the value of total asset
normally is higher than its other accounts
(Rahmawati et al., 2015).
The calculation of total asset can be done
through the use of natural logarithm of the value
of asset. Mathematically, it can be formulated as
follows:
Firm Size = Log Total Aset
The other independent variable used in this
study is market risk, The systematic risk or market
risk can be measured using Beta. The Beta can be
used to measure business risk, funding risk, and
Stock Return
Market Rize
Firm Size
176 Handayani, Farlian & Ardian/Jurnal Dinamika Akuntansi dan Bisnis Vol. 6(2), 2019, pp 171-182
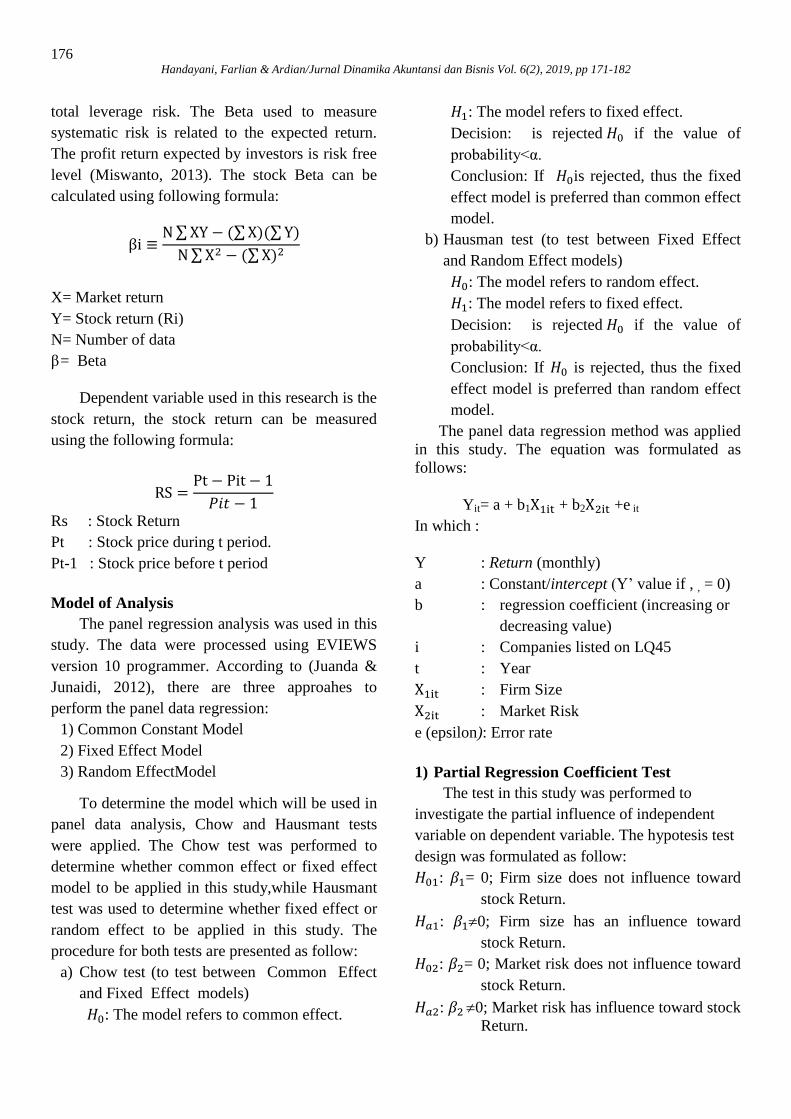
total leverage risk. The Beta used to measure
systematic risk is related to the expected return.
The profit return expected by investors is risk free
level (Miswanto, 2013). The stock Beta can be
calculated using following formula:
X= Market return
Y= Stock return (Ri)
N= Number of data
β = Beta
Dependent variable used in this research is the
stock return, the stock return can be measured
using the following formula:
Rs : Stock Return
Pt : Stock price during t period.
Pt-1 : Stock price before t period
Model of Analysis
The panel regression analysis was used in this
study. The data were processed using EVIEWS
version 10 programmer. According to (Juanda &
Junaidi, 2012), there are three approahes to
perform the panel data regression:
1) Common Constant Model
2) Fixed Effect Model
3) Random EffectModel
To determine the model which will be used in
panel data analysis, Chow and Hausmant tests
were applied. The Chow test was performed to
determine whether common effect or fixed effect
model to be applied in this study,while Hausmant
test was used to determine whether fixed effect or
random effect to be applied in this study. The
procedure for both tests are presented as follow:
a) Chow test (to test between Common Effect
and Fixed Effect models)
: The model refers to common effect.
: The model refers to fixed effect.
Decision: is rejected if the value of
probability<α.
Conclusion: If is rejected, thus the fixed
effect model is preferred than common effect
model.
b) Hausman test (to test between Fixed Effect
and Random Effect models)
: The model refers to random effect.
: The model refers to fixed effect.
Decision: is rejected if the value of
probability<α.
Conclusion: If is rejected, thus the fixed
effect model is preferred than random effect
model.
The panel data regression method was applied
in this study. The equation was formulated as
follows:
Yit= a + b1 + b2 +e it
In which :
Y : Return (monthly)
a : Constant/intercept (Y’ value if , , = 0)
b : regression coefficient (increasing or
decreasing value)
i : Companies listed on LQ45
t : Year
: Firm Size
: Market Risk
e (epsilon): Error rate
1) Partial Regression Coefficient Test
The test in this study was performed to
investigate the partial influence of independent
variable on dependent variable. The hypotesis test
design was formulated as follow:
: = 0; Firm size does not influence toward
stock Return.
: 0; Firm size has an influence toward
stock Return.
: = 0; Market risk does not influence toward
stock Return.
: 0; Market risk has influence toward stock
Return.

177 Handayani, Farlian & Ardian/Jurnal Dinamika Akuntansi dan Bisnis Vol. 6(2), 2019, pp 171-182
2) Test of Simultaneous Regression Coefficient
The test was performed to determine the effect of
independent variable simultaneously toward the
dependent variable. The hypothesis design was
formulated as follow:
: , = 0;=
The firm size and market risk simultaneously
do not influence the stocks return.
Ha: At least, one of βi ≠ 0 (i = 1, 2)
The firm size and market risk simultaneously
influence the stocks return.
The determination coefficient test ( ) was
used to determine to what extent the value of
dependent variable can be explained by
independent variable simultaneously. The value of
coefficient determinant is between 0 and 1. A
small value of ( ) indicates a very limited ability
of variables to explain dependent variable
variation. The value which close to 1 indicates that
independent variables provide almost all
information needed to predict dependent variable.
4. Results and Discussions
This study was conducted to investigate the
result of test and to analyze the influence of firm
size and market risk on stock return of LQ45
companies. The firm size can be measured using
natural logarithm of company total asset. The
market risk can be measured using Beta. Stock
return can be measured through comparison of
stock price during t period and t-1 period.
The population in this study is LQ45
companies during the period of 2015 to 2017. The
purposive population was selected using criteria
that the companies were listed continually during
the observation period and submitted a
comprehensive financial report. Hence, this study
consisted of 14 data outliers, therefore the outliers
had been taken out of the samples. In addition to
that, the samples of this study became 196
observation, the descriptive statistics in this study
is shown in Table 2.
Table 2. Descriptive Statistic (N=196)
Variabel Mean Std. Dev. Min. Max.
Stock Return 0.0031 0.0785 -0.7081 0.6792
Firm Size 7.6036 0.5790 6.5325 9.0283
Market Risk -0.1236 1.0562 -2.9859 2.8552 Source: Processed Data (2019)
Based on data shown in Table 2, the mean
value of return stock of LQ45 companies during
the observed years is 0.0031, the stocks price
increased 0.31% hence value of LQ45 stocks
return increased. The lowest value of stock return
is -0.708, while the highest value of stock return is
0.1102. The spread out of variables is like the
standard deviation of stock return variable is
0.0785 or 7.85% out of 196 observations. The
mean score of firm size is 7.6036. It can be
inferred that the averages companies observed
having big size companies and also having good
corporate performance. Thus, these companies are
sustained in the sequence level of LQ45 in longer
term during periods of observation. The lowest
value is 6.533 owned. while the maximum value is
9.028. The standard deviation of firm size variable
is 0.5790. The mean value of market risk value is -
0.1236 meaning that standard value of market risk
tends to be a negative point, turning over of
decreasing and increasing value market risk
relatively depended on market fluctuation.
The smallest market risk value was -2.9859
during February 2017- July 20117 while the
maximum value of market risk during Augustus
2016-January 2017 as much as 2.8552 with market
risk data distribution as much as 1.0652. The
analysis model used in this study was the
regression panel data and can be done through
three approaches, namely common effect model,
1
178 Handayani, Farlian & Ardian/Jurnal Dinamika Akuntansi dan Bisnis Vol. 6(2), 2019, pp 171-182
fixed effect model, and random effect model.
Thus, to determine which model used to analyze
panel data, the Chow and Hausman tests were
performed. The Chow test was used to determine
between common effect and fixed effect models.
While the Hausman test was used to determine
between fixed effect and random effect models.
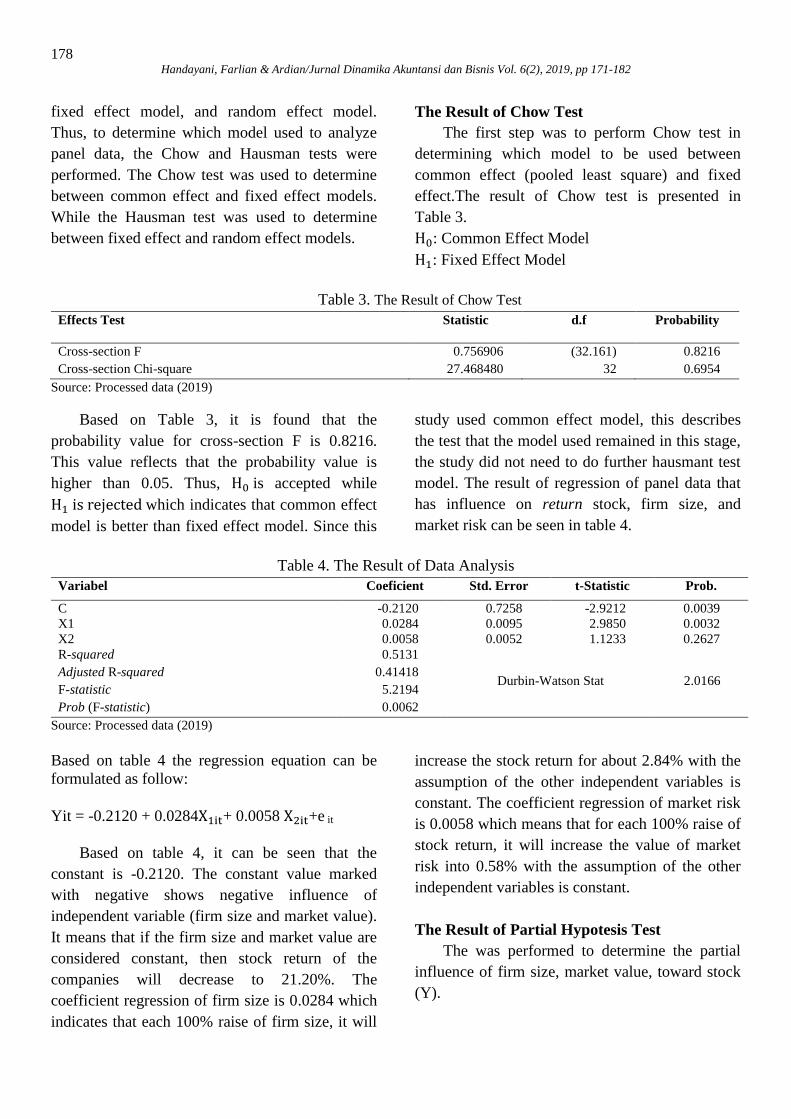
The Result of Chow Test
The first step was to perform Chow test in
determining which model to be used between
common effect (pooled least square) and fixed
effect.The result of Chow test is presented in
Table 3.
: Common Effect Model
: Fixed Effect Model
Table 3. The Result of Chow Test
Effects Test Statistic d.f Probability
Cross-section F 0.756906 (32.161) 0.8216
Cross-section Chi-square 27.468480 32 0.6954
Source: Processed data (2019)
Based on Table 3, it is found that the
probability value for cross-section F is 0.8216.
This value reflects that the probability value is
higher than 0.05. Thus, is accepted while
which indicates that common effect
model is better than fixed effect model. Since this
study used common effect model, this describes
the test that the model used remained in this stage,
the study did not need to do further hausmant test
model. The result of regression of panel data that
has influence on return stock, firm size, and
market risk can be seen in table 4.
Table 4. The Result of Data Analysis
Variabel Coeficient Std. Error t-Statistic Prob.
C -0.2120 0.7258 -2.9212 0.0039
X1 0.0284 0.0095 2.9850 0.0032
X2 0.0058 0.0052 1.1233 0.2627
R-squared 0.5131
Durbin-Watson Stat 2.0166 Adjusted R-squared 0.41418
F-statistic 5.2194
Prob (F-statistic) 0.0062
Source: Processed data (2019)
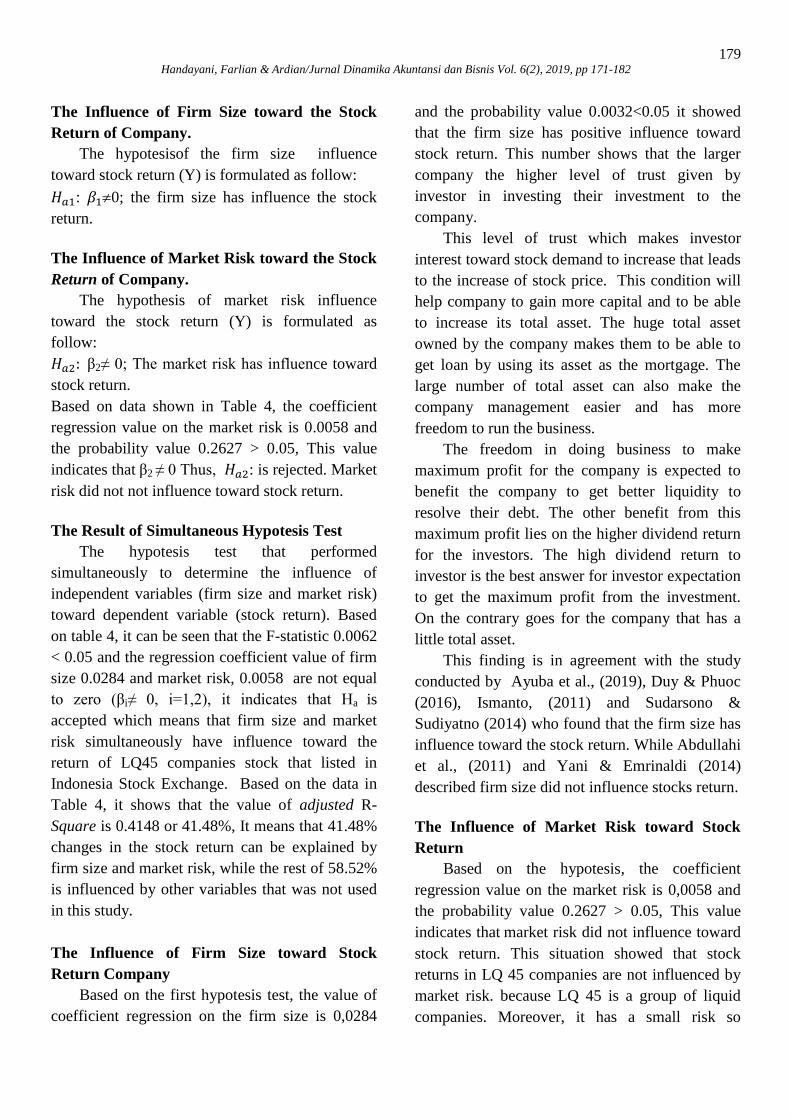
Based on table 4 the regression equation can be
formulated as follow:
Yit = -0.2120 + 0.0284 + 0.0058 +e it
Based on table 4, it can be seen that the
constant is -0.2120. The constant value marked
with negative shows negative influence of
independent variable (firm size and market value).
It means that if the firm size and market value are
considered constant, then stock return of the
companies will decrease to 21.20%. The
coefficient regression of firm size is 0.0284 which
indicates that each 100% raise of firm size, it will
increase the stock return for about 2.84% with the
assumption of the other independent variables is
constant. The coefficient regression of market risk
is 0.0058 which means that for each 100% raise of
stock return, it will increase the value of market
risk into 0.58% with the assumption of the other
independent variables is constant.
The Result of Partial Hypotesis Test
The was performed to determine the partial
influence of firm size, market value, toward stock
(Y).
179 Handayani, Farlian & Ardian/Jurnal Dinamika Akuntansi dan Bisnis Vol. 6(2), 2019, pp 171-182
The Influence of Firm Size toward the Stock
Return of Company.
The hypotesisof the firm size influence
toward stock return (Y) is formulated as follow:
: 0; the firm size has influence the stock
return.
The Influence of Market Risk toward the Stock
Return of Company.
The hypothesis of market risk influence
toward the stock return (Y) is formulated as
follow:
β2≠ 0; The market risk has influence toward
stock return.
Based on data shown in Table 4, the coefficient
regression value on the market risk is 0.0058 and
the probability value 0.2627 > 0.05, This value
indicates that β2 ≠ 0 Thus, : is rejected. Market
risk did not not influence toward stock return.
The Result of Simultaneous Hypotesis Test
The hypotesis test that performed
simultaneously to determine the influence of
independent variables (firm size and market risk)
toward dependent variable (stock return). Based
on table 4, it can be seen that the F-statistic 0.0062
< 0.05 and the regression coefficient value of firm
size 0.0284 and market risk, 0.0058 are not equal
to zero (βi≠ 0, i=1,2), it indicates that Ha is
accepted which means that firm size and market
risk simultaneously have influence toward the
return of LQ45 companies stock that listed in
Indonesia Stock Exchange. Based on the data in
Table 4, it shows that the value of adjusted R-
Square is 0.4148 or 41.48%, It means that 41.48%
changes in the stock return can be explained by
firm size and market risk, while the rest of 58.52%
is influenced by other variables that was not used
in this study.
The Influence of Firm Size toward Stock
Return Company
Based on the first hypotesis test, the value of
coefficient regression on the firm size is 0,0284
and the probability value 0.0032<0.05 it showed
that the firm size has positive influence toward
stock return. This number shows that the larger
company the higher level of trust given by
investor in investing their investment to the
company.
This level of trust which makes investor
interest toward stock demand to increase that leads
to the increase of stock price. This condition will
help company to gain more capital and to be able
to increase its total asset. The huge total asset
owned by the company makes them to be able to
get loan by using its asset as the mortgage. The
large number of total asset can also make the
company management easier and has more
freedom to run the business.
The freedom in doing business to make
maximum profit for the company is expected to
benefit the company to get better liquidity to
resolve their debt. The other benefit from this
maximum profit lies on the higher dividend return
for the investors. The high dividend return to
investor is the best answer for investor expectation
to get the maximum profit from the investment.
On the contrary goes for the company that has a
little total asset.
This finding is in agreement with the study
conducted by Ayuba et al., (2019), Duy & Phuoc
(2016), Ismanto, (2011) and Sudarsono &
Sudiyatno (2014) who found that the firm size has
influence toward the stock return. While Abdullahi
et al., (2011) and Yani & Emrinaldi (2014)
described firm size did not influence stocks return.
The Influence of Market Risk toward Stock
Return
Based on the hypotesis, the coefficient
regression value on the market risk is 0,0058 and
the probability value 0.2627 > 0.05, This value
indicates that market risk did not influence toward
stock return. This situation showed that stock
returns in LQ 45 companies are not influenced by
market risk. because LQ 45 is a group of liquid
companies. Moreover, it has a small risk so
180 Handayani, Farlian & Ardian/Jurnal Dinamika Akuntansi dan Bisnis Vol. 6(2), 2019, pp 171-182
investors do not consider market risk in expecting
stock returns. This study is in line with the
research conducted by Pamane & Vikpossi (2014)
and Wijaya & Djajadikerta (2017) described
market risk did not influence stocks return, but
different with researchs by Koluku et al., (2015)
Nugroho & Sukhemi (2015) and Syahrin &
Darmawan (2018) who claimed that Beta stock
variable partially has influence toward stock
return.
The Influence of Firm Size and Market Risk
toward Stock Return of Company
The simultaneous test (F statistic) was
performed to determine the influence of firm size
and market risk toward return stock. Based on
Table 5, it can be seen that significant level is less
than 0.05 which F- statistic indicated 0.0062
(0.0063<0.05).
This means that Ha is accepted. Each
independent variable has influence toward
dependent variable, that is the decision of
company investment with coefficient regression
value + 0.0284 - 0.0058 The firm size and market
risk have coefficient regression value which is not
equal to 0 (bi≠0; bi= 1,2).
Thus, it can be concluded that both the firm
size and market risk simultaneously has influence
toward stock return. It means that the firm size and
market risk elements in this study are able to
ensure investor that before to make investment, it
is required to consider the scale of company and
risk ratio to earn the level of stock return as what
they have expected. To test the simultaneous
influence, the adjustment coefficient determination
test ( ). Was performed. If ) then the
firm size and market risk has simultenous
influence toward stock return. Based on Table 5,
the value of 0.05137. atau 5.14%.
This finding is in line with the result of study
conducted by (Koluku et al., 2015) that showed
firm size and market risk factors have influence
toward stock return. But, Ismanto (2011) in his
study claimed a different result that showed the
firm size and market risk do not have
simultaneous influence toward stock return.
5. Conclusion
This study is intended to investigate the
influence of firm size and market risk toward stock
return in LQ45 companies during the period of
2015 to 2017. Based on the hypotesis test and
discussion, can be concluded that, the firm size
has influence toward stock return of the companies
listed on LQ 45 during the period of 2015-2017 in
positive way toward stock return. While the
market risk did not influence toward stock return
of the companies listed on LQ 45 during the
period of 2015-2017. Firm size and market risk
has simultaneous influence toward stock return of
the companies listed on LQ 45 during the period
of 2015-2017.
The Limitation of research the subject of
this study was limited on companies listed on LQ
45 with the limited period of research. The
variable being tested in this research regarding its
influence toward stock return are only two
variable i.e. firm size and market risk. Thevariable
chosen in this study only used one proxy in its
measurement. In this study, there are some
suggestions, which can be stated,for investors or
anyone who are willing to be investor in capital
market, it is suggested to consider this research
finding as an additional reference in selecting
investment option to earn maximum profit (stock
return). For further researcher, it is suggested that
to use different objects and to include more
observation during a longer period of time. For
further research, it is suggested to use different
proxy to measure the firm size and market risk
which is likely to produce a different result.
Acknowledgment
Thanks to DRPM of DIKTI that granted a
funding aid for the researchers. This article is a
product of the research sponsored by a grant
scheme ‘Penelitian Pemula’ with contract number
002/LPPM/KP/04/01/02.18, 2018.
181 Handayani, Farlian & Ardian/Jurnal Dinamika Akuntansi dan Bisnis Vol. 6(2), 2019, pp 171-182
References
Abdullahi, Lawal, W., & Muhtar, E. (2011). The
effects of firm size on risk and return in the
nigerian stock market: A sectoral analysis.
British Journal of Economics, Finance and
Management Sciences, 1(2), 1–10.
Acheampong, P., Agalega, E., & Shibu, A. K.
(2014). The effect of financial leverage and
market size on stock returns on the ghana
stock exchange: evidence from selected
stocks in the manufacturing sector.
Internation Journal of Financial Research,
5(1), 125–134.
https://doi.org/10.5430/ijfr.v5n1p125
Al-Mwalla, M., & Karasneh, M. (2011). Fama &
French three factor model: Evidence from
emerging market. European Journal of
Economics, Finance and Administrative
Sciences, (41), 132–140.
Al-Qudah, An., & Laham, M. (2013). The effect
of financial leverage & systematic risk on
stock returns in the amman stock exchange
(Analytical study–industrial sector). Research
Journal of Finance and Accounting, 4(6),
136–145.
Antou, R. R., & Tasik, H. H. D. (2017). Analisis
spillover pada saham yang masuk di indeks
lq45 dan non lq45. Jurnal EMBA, 5(2),
2713–2720.
Arista, D., & Astohar. (2012). Analisis faktor-
faktor yang mempengaruhi return saham
(kasus pada perusahaan manufaktur yang go
public di BEI periode tahun 2005-2009).
Jurnal Ilmu Manajemen Dan Akuntansi
Terapan, 3(1), 1–15.
Ayuba, H., Bambale, A. J., Ibrahim, M. A.,
Sulaiman, & Abdulwahab, S. (2019). Effects
of financial performance, capital structure
and firm size on firms’ value of insurance
companies in Nigeria. Journal of Finance,
Accounting and Management, 10(1), 57–74.
Buana, G., & Haryanto, M. (2016). Pengaruh
risiko pasar, nilai tukar, suku bunga dan
volume perdagangan terhadap return saham
(Studi kasus pada perusahaan yang terdaftar
dalam indeks LQ45). Diponegoro Journal of
Management, 5(2), 1–14.
Chiang, T. C., & Zhang, Y. (2018). An empirical
investigation of risk-return relations in
chinese equity markets: Evidence from
aggregate and sectoral data. International
Journal of Finance Studies, 6(35), 1–22.
https://doi.org/10.3390/ijfs6020035
Connelly, B. L., Certo, S. T., Ireland, R. D., &
Reutzel, C. R. (2011). Signaling theory: A
review and assessment. Journal of
Management, 37(1), 39–67.
https://doi.org/10.1177/0149206310388419
Darmaji, T., & Fakhruddin, H. M. (2011). Pasar
modal di indonesia. Jakarta: Salemba Empat.
Duy, N. T., & Phuoc, N. P. H. (2016). The
relationship between firm sizes and stock
returns of service sector in ho chi minh city
stock exchange. Review of European Studies,
8(4), 210–219.
https://doi.org/10.5539/res.v8n4p210
Dwialesi, J. B., & Darmayanti, N. P. A. (2016).
Pengaruh faktor-faktor fundamental terhadap
return saham indesks kompas 100. E-Jurnal
Manajemen Unud, 5(9), 5369–5397.
Ekinci, A. (2016). The effect of credit and market
risk on bank performance: Evidence from
Turkey. International Journal of Economics
and Financial Issues, 6(2), 427–434.
Fahmi, I. (2017). Analisis laporan keuangan.
Bandung: Alfabeta Bandung.
Hassan Al-Tamimi, H. A., & Anood Bin Kalli, A.
(2009). Financial literacy and investment
decisions of UAE investors. Journal of Risk
Finance, 10(5), 500–516.
https://doi.org/10.1108/15265940911001402
Hendra, J., Koesharjono, H., & Priantono, S.
(2018). Implication of good corporate
governance and leverage on earnings
management. International Journal of Social
Science and Business, 2(1), 1–9.
Hidayat, S. N. (2016). Pengaruh karakteristik
keuangan, ukuran perusahaan, dan inflasi
terhadap return. Jurnal Profita, 6, 1–11.
Ismanto, H. (2011). Analisis pengaruh ukuran
perusahaan, book-to-market value, dan beta
terhadap return saham di BEI. Jurnal
Ekonomi & Pendidikan, 8(2), 186–205.
Jogiyanto, H. M. (2003). Teori portofolio dan
analisis investasi. Yogyakarta: BPFE.
Juanda, B., & Junaidi. (2012). Ekonometrika deret
waktu : Teori dan aplikasi.
https://doi.org/10.1002/9781119040293.ch7
Koluku, R. F., Pangemanan, S. S., & Tumewu, F.
(2015). Analysis of market risk, financial
182 Handayani, Farlian & Ardian/Jurnal Dinamika Akuntansi dan Bisnis Vol. 6(2), 2019, pp 171-182
leverage, and firm size toward stock return on
non-banking companies listed in LQ45 index
of IDX. Jurnal EMBA, 3(2), 528–536.
Miswanto. (2013). Pengukuran risiko bisnis dan
risiko pendanaan dalam perusahaan. Jurnal
Economia, 9(1).
Mosey, A. C., Tommy, P., & Untu, V. (2016).
Pengaruh risiko pasar dan risiko kredit
terhadap profitabilitas pada bank umum yang
terdaftar di BEI periode 2012-2016. Jurnal
EMBA, 6(3), 1338–1347.
Mwaurah, I., Muturi, W., & Waititu, A. (2017).
The influence of financial risk on stock
returns. International Journal of Scientific
and Research Publications, 7(5), 418–430.
Nugroho, I., & Sukhemi. (2015). Pengaruh risiko
sistematis an likuiditas terhadap return saham
pada perusahaan manufaktur yang terdaftar di
BEI. Jurnal Akuntansi, 3(2), 63–74.
Pamane, K., & Vikpossi, A. E. (2014). An analysis
of the relationship between risk and expected
return in the brvm stock exchange : Test of
the CAPM. Research in World Economy,
5(1), 13–28.
https://doi.org/10.5430/rwe.v5n1p13
Paramitasari, R. (2014). Pengaruh risiko sistematis
dan risiko tidak sistematis terhadap expected
return portofolio saham perusahaan
manufaktur yang terdaftar di bursa efek
indonesia. Jurnal Organisasi Dan
Manajemen, 10(1).
Prasetia, T. E., Tommy, P., & Saerang, I. S.
(2014). Struktur modal, ukuran perusahaan
dan risiko perusahaan terhadap nilai
perusahaan otomotif yang terdaftar di BEI.
Jurnal EMBA, 2(2), 879–889.
Prasetyorini, B. F. (2013). Pengaruh ukuran
perusahaan, leverage, price earning ratio dan
profitabilitas terhadap nilai perusahaan.
Jurnal Ilmu Manajemen, 1(1), 183–196.
Rahmawati, A. D., Topowijono, & Sulasmiyati, S.
(2015). Pengaruh ukuran perusahaan,
profitabilitas, struktur modal, dan keputusan
investasi terhadap nilai perusahaan (studi
pada perusahaan sektor properti, real estate,
dan building construction yang terdaftar di
bursa efek indonesia (BEI) Periode 2010-
2013. Jurnal Adminstrasi Bisnis (JAB), 23(2),
1–7.
Sambelay, J. J., Rate, P. Van, & Baramuli, D. N.
(2017). Analisis pengaruh profitabilitas
terhadap harga saham pada perusahaan yang
terdaftar di LQ45 periode 2012-2016. Jurnal
EMBA, 5(2), 753–761.
Shafana, M., Rimziya, A. F., & Jariya, A. I.
(2013). Relationship between stock returns
and firm size, and book-to- market equity:
Empirical evidence from selected companies
listed on milanka price index in colombo
stock exchange. Journal of Emerging Trends
in Economics and Management Sciences
(JETEMS), 4(2), 217–225.
Sudarsono, B., & Sudiyatno, B. (2014). Faktor-
faktor yang mempengaruhi return saham pada
perusahaan property dan real estate yang
terdaftar pada bursa efek indonesia tahun
2009 s/d 2014. Ekonomi Jurnal Bisnis Dan,
2(1), 30–51.
Sudiyatno, B., & Irsad, M. (2011). Menguji model
tiga faktor fama dan french dalam
mempengaruhi return saham studi pada
saham lq45 di bursa efek indonesia. Jurnal
Bisnis Dan Ekonomi (JBE), 18(2), 126–137.
Syahrin, R. A., & Darmawan, A. (2018). Pengaruh
risiko inflasi, risiko suku bunga, risiko valuta
asing, risiko pasar terhadap return saham.
Jurnal Administrasi Bisnis (JAB), 61(3), 10–
19.
Tandelilin, E. (2001). Analisis investasi dan
manajemen portofolio. Yogyakarta: BPFE.
Wijaya, C. F., & Djajadikerta, H. (2017).
Pengaruh risiko sistematis, leverage dan
likuiditas terhadap return saham LQ45 yang
terdaftar pada Bursa Efek Indonesia. Ultima
Management, 9(2), 62–76.
Yani, H., & Emrinaldi. (2014). Analisis pengaruh
rasio keuangan dan ukuran perusahaan
terhadap return saham pada perusahaan jasa
konstruksi di bursa efek indonesia. Jurnal
Tepak Manajemen Bisnis, VI(1), 31–39.