Embed Size (px)
Citation preview

1
Firm Imitation and Performance: A Simulation Study
Michael Shayne Gary Australian Graduate School of Management
UNSW Sydney NSW 2052 Australia
Phone: +61 2 9931 0247 Fax: +61 2 9313 7279
Email: [email protected]
Erik Larsen University of Lugano
Via Buffi 13 CH-6904 Lugano
Switzerland E-mail: [email protected]
Constantinos C. Markides* London Business School
Regent’s Park London NW1 4SA
England Phone: +44-20-7262-5050 Fax: +44-20-7724-7875
E-mail: [email protected]
* Corresponding author. All authors have contributed equally to this paper.
2
Firm Imitation and Performance: A Simulation Study
ABSTRACT Imitation has both benefits and costs. By imitating, a firm gains legitimacy and access to resources but it also loses its differentiation and resorts to profit-eroding price competition. Firms should, therefore, imitate only when the benefits of imitation outweigh its costs. But when is that the case? We use a simulation model to identify several contingencies that influence the relative value of the benefits and costs of imitation. Our results show that under certain circumstances, imitation improves firm-specific returns. Specifically, the fraction of imitating firms in an industry is an important variable that could make imitation a desirable strategy. Similarly, the speed at which other firms imitate influences the attractiveness of imitation. Key Words: imitation, profitability and performance, strategic innovation, simulation.

3
Firm Imitation and Performance: A Simulation Study
Imitative behavior appears to be common in competitive interactions between firms across a broad range of industries. Evidence of imitative behavior has been identified in a number of studies examining a diverse set of organizational outcomes such as the hiring practices of global firms (Williamson and Cable, 2003), the evolution of hospital structure (Starr, 1982), the spread of the multidivisional corporate form (Fligstein, 1985), the diffusion of diversification strategies (Fligstein, 1991), the adoption of matrix management programs by hospitals (Burns and Wholey, 1993), the selection of asset strategies by Californian savings and loans (Haveman, 1993), the adoption of civil-service reform by municipal governments (Knoke, 1982; Tolbert and Zucker, 1983), form changes by heath-maintenance organizations (Wholey and Burns, 1993), the choice of advisers in acquisitions (Haunschild and Miner, 1997), the selection of new strategies in the UK insurance industry (Webb and Pettigrew, 1999), the acquisition activities of large firms (Haunschild, 1993), the curricular change in liberal arts colleges (Kraatz, 1998), the adoption of strikes (Connell and Cohn, 1995), the choice of charitable recipients of corporate philanthropy (Galaskiewicz and Wasserman, 1989), the ordaining of women (Chaves, 1996) and the adoption of financial restructuring programs by large firms (Fligstein, 1990). Research also shows that imitation of certain practices could be rather fast and that information about new products and processes leaks out to rivals within about one year (Mansfield, 1985).
Not surprisingly, several theories have been proposed to explain why firms engage in imitation. For example, institutional theory argues that organizations imitate each other in an effort to acquire legitimacy (e.g. DiMaggio and Powell, 1983; Suchman, 1995). Economic theory suggests that under uncertainty, rational agents will imitate the practices of successful rivals in a type of herd behavior, each assuming that their rival knows something that they do not (e.g. Banerjee, 1992; Eaton and Lipsey, 1975; Hotelling, 1929; Schumpeter, 1934). Theories of strategic behavior suggest that imitation can be a strategic response by organizations that do not want to bear the risk or costs associated with experimentation and moving first (e.g. Dutton and Freedman, 1985; Levitt and March, 1988; Lieberman and Montgomery, 1988). Theories of herd behavior suggest that economic decision-makers act, in part, based on others’ actions, especially in situations of imperfect information (e.g. Becker, 1991; Brandenburger and Polack, 1996).
A huge literature has also explored the performance consequences of firm-level imitation. It is generally accepted that firm-level imitation has both benefits and costs. By imitating, firms demonstrate their legitimacy and gain access to resources (e.g. DiMaggio and Powell, 1983; Suchman, 1995). On the other hand, imitation leads to strategy convergence and a shift to price competition that is profit-eroding. As argued by Porter (1996: 64): “…as rivals imitate one another’s improvements in quality, cycle times or supplier partnerships, strategies converge and competition becomes a series of races down identical paths that no one can win. Competition based on operational effectiveness alone is mutually destructive, leading to wars of attrition that can be arrested only by limiting competition…” Research by Ferrier, Smith and Grimm (1999) and by Gimeno and Woo (1996) has shown that strategic similarity among rivals increases the intensity of rivalry between them.

4
It is this tension between the need for a firm to be different and the need for a firm to be the same that has prompted several academics to argue that firms should strive for “strategic balance”—that is, intermediate levels of strategic similarity where they balance the pressures of competition and legitimization (Deephouse, 1999; Porac, Thomas and Baden-Fuller, 1989). Empirical research by Deephouse (1999) found that a curvilinear relationship between differentiation and performance received stronger support than either the differentiation or conformity hypotheses.
This body of research has argued that the tension between the need to be different and
the need to be the same would determine how much a firm ought to imitate. But this same tension would also determine when a firm ought to imitate and when not to. In other words, another way to look at this tension is by recognizing that the size of the benefits to imitation relative to its costs will depend on the specific circumstances that a firm is facing. Under certain circumstances, the benefits would outweigh the costs, in which case it makes sense for the firm to imitate. Under a different set of circumstances, the costs of imitation would outweigh its benefits, in which case the firm is better off to avoid imitation. The challenge for academic research, therefore, is to identify the contingencies that influence the relative value of the benefits and costs of imitation.
Our paper aims to explore this issue by identifying circumstances under which firm-
level imitation could actually improve firm-specific returns. In the next section of the paper, we build the theoretical arguments for our thesis. We then use a formal simulation model to explore competitive interactions over time, and assess the effect of firm-level imitation on profitability. The use of a formal simulation model has the added benefit of allowing us to explore the role that firm-level imitation might have on the evolution of overall industry profitability. Thus, the contribution of our paper is theory development and generation of new propositions to help unravel the role that imitation plays in eroding or enhancing firm and industry profitability.
THE PERFORMANCE CONSEQUENCES OF IMITATION
According to economic theory, a firm that selects a distinct (i.e. differentiated) strategic position in its industry will face less competition and will therefore earn higher rents (Baum and Mezias, 1992; Baum and Singh, 1994; Porter, 1980, 1991, 1996). Underlying the distinct position of a successful company are firm-specific assets that are rare, inimitable and difficult to substitute (e.g. Barney, 1991). As long as a firm maintains such a differentiated position (or strategy), it should earn excess profits.
However, economic theory also postulates that such differentiated positions cannot be sustained forever. Rents attract imitators who move into previously unique positions, eager to partake in the good fortunes of the existing firms. As argued by Huff, Huff and Thomas (1994: 40): “…the performance of other firms in an industry provides particularly important evidence of the potential rewards of alternative options…the probability of a change in strategy increases to the extent that firms with higher performance exist within the industry…”

5
Of course, imitation cannot be taken for granted. Whether a strategy will be imitated or not depends on numerous factors and in fact, the empirical evidence shows that convergence takes place much more slowly than expected (Geroski, 1988; Geroski, Gilbert and Jacquemin, 1990; Mueller, 1986). There is now a vast literature on the factors that might hinder or facilitate imitation.
Research in the economics and strategy fields has focused primarily on the factors that might hinder imitation. The list of factors is huge (see for example, Barney, 1991; Dierickx and Cool, 1989; Lippman and Rumelt, 1982; and Rivkin, 2000) but we could constructively classify these factors into four broad categories:
(i) structural or industry-specific factors such as concentration levels (Stigler, 1963) and entry barriers (Qualls, 1974);
(ii) strategic, or firm-specific factors such as initial market share (Gale & Branch, 1982; Jacobsen, 1988; Ravenscraft, 1983), initial profitability (Mueller, 1977), vertical integration (Aaker & Mascarenhas, 1984), marketing expenditures (Farris & Albion, 1980; Jacobsen, 1988), lack of absorptive or retentive capacity (Cohen and Levinthal, 1990; Szulanski, 1996; Teece, 1977) and the complexity of a firm’s strategy (Rivkin, 2000);
(iii) resource-specific factors, such as lack of complementary assets (Teece, 1986), causal ambiguity (Lippman and Rumelt, 1982), tacit nature of required knowledge (Winter, 1987), poor codifiability and poor teachability (Zander and Kogut, 1995), and possession of resources that are rare, imperfectly imitable and non-substitutable (Barney, 1991; Dierickx and Cool, 1989);
(iv) game-theoretic factors such as capacity pre-emption (Dixit, 1980), spatial preemption (Schmalensee, 1978), and switching costs (Aghion and Bolton, 1987).
On the other hand, research in organization theory has focused primarily on the factors
that might facilitate imitation and has also identified several variables that affect imitative behavior. For example, several studies have shown that the number of prior adopters affects chances of later adoption (e.g. Burns and Wholey, 1993; Chaves, 1996; Conell and Cohn, 1995; and Fligstein, 1985, 1990). Similarly, Galaskiewicz and Wasserman (1989) found that intercorporate networks facilitate imitation while Haunschild (1993, 1994) found that interlock partners act as a mechanism for the transfer of practices among firms. Other factors that have been shown to influence imitation include social proof (e.g. Rao, Greve and Davis, 2001); shared interfirm network ties (Williamson and Cable, 2003); the social status and credibility of early adopters (Burns and Wholey, 1993; Haunschild, 1993; Haveman, 1993); and noninterlock relationships (Haunschild, 1994; Mizruchi, 1992).
Other factors that have been shown to influence whether a firm will be able to imitate another firm’s successful strategy include uncertainty about a strategy’s profitability (e.g. Lippman and Rumelt, 1982; Nelson and Winter, 1982); the complexity of the successful strategy (e.g. Rivkin, 2000); and organizational rigidities such as emotional attachment to previous strategies (Staw, 1981), cognitive sunk costs (Oliver, 1997) and political expediency (Simon, 1945).
Assuming that some firms are able to overcome the barriers that protect the position of a successful firm, economic theory has argued that imitation of lucrative strategic positions in an industry could lead to the deterioration of firm profitability. This could happen for two

6
reasons. First, by jumping into the same lucrative strategic positions, firms inevitably adopt similar strategies and, therefore, begin to engage in direct rivalry. Similar strategic positions imply convergence of strategies and a shift towards price competition. Lower prices inevitably drive profits down to a level at which no firm makes “excess” profits. According to Porter (1996: 64 and 75), this type of rivalry will eventually: “...result [in] zero-sum competition, static or declining prices, and pressures on costs that compromise companies’ ability to invest in the business in the long term...[This is because] companies imitate one another in a type of herd behavior, each assuming rivals know something they do not. As rivals imitate one another’s improvements in quality, cycle times, or supplier partnerships, strategies converge and competition becomes a series of races down identical paths that no one can win. Competition based on operational effectiveness alone is mutually destructive, leading to wars of attrition that can be arrested only by limiting competition.”
Second, by being pre-occupied with each other and focusing on imitating successful competitors so that these competitors do not get too far ahead of them, imitating companies may miss or ignore positions in the industry that the other competitors (whom they are now trying to imitate) either ignored or missed themselves. Thus, viable pockets of profitability within industries may be left unexploited while companies fight it out over increasingly smaller and smaller industry positions. Over time, companies will find it increasingly harder to take these unexploited positions seriously and exploit them. This is because firms that select strategies outside the range of acceptability are subject to questions and actions challenging their legitimacy, reliability and rationality (Ashforth and Gibbs, 1990; Deephouse, 1999; DiMaggio and Powell, 1983; Hambrick and D'Aveni, 1992; Meyer and Rowan, 1977; Suchman, 1995). Legitimacy challenges diminish the ability of firms to acquire resources (DiMaggio and Powell, 1983) and act as a powerful disincentive for companies to deviate from the industry norm or reject the conventional wisdom which is incorporated in the industry consensus (Miller and Chen, 1995). Thus, what starts out as simple imitation of a successful rival may grow into gross resource allocation inefficiencies across the whole industry.
Counterbalancing the profit-eroding effects of imitation are several benefits associated with imitation. Perhaps the most prominent of the theoretical rationales for imitation stems from new institutional theories (e.g. Cyert and March, 1963; DiMaggio and Powell, 1983; Haveman, 1993; Scott, 1995). The basic argument is that a firm will strive to adopt a strategy that is similar to the strategies of other competitors so as to avoid legitimacy challenges that hinder resource acquisition. Firms that select strategies outside the range of acceptability are subject to questions and actions that diminish their ability to acquire resources (e.g. Ashforth and Gibbs, 1990; DiMaggio and Powell, 1983; Deephouse, 1999; Hambrick and D’Aveni, 1992; Meyer and Rowan, 1977; Suchman, 1995). On the other hand, firms that adopt strategies that are similar to the strategies of other competitors in the industry, gain in legitimacy and find it easier to hire people, acquire customers and deal with suppliers. Empirical research has been indirectly supportive of this proposition (Deephouse, 1999). For example, Abrahamson and Hegeman (1994) as well as Chen and Hambrick (1995) found a positive correlation between strategic conformity and performance. Similarly, Deephouse (1996) found a positive relationship between strategic conformity and

7
endorsements while Baum and Oliver (1991, 1992) reported a positive correlation between endorsements and survival rates. Strategic group and oligopoly theories also predict a positive relationship between similarity and performance. This is because similar firms recognize their interdependence and collude (e.g. Caves and Porter, 1977). Several studies have demonstrated that collusion does take place under certain circumstances (e.g. Cool and Dierickx, 1993; Fershtman and Pakes, 2000; Green and Porter, 1984; Hatten and Hatten, 1987; Nair and Filer, 2003) and that collusion can lead to higher profitability (Bagwell and Staiger, 1997; Schmalensee, 1987). Given this tension between the need to imitate (so as to gain legitimacy) and the need to avoid imitation (so as to reduce competition), it is not immediately obvious what a firm should do. Some researchers have proposed that the firm must find a “strategic balance” whereby it differentiates itself from competitors but not by much (e.g. Deephouse, 1999). But another way to look at this tension is to recognize that imitation is associated with both benefits and costs and that their relative size will depend on the specific circumstances facing the firm.
For example, consider again the case of an oligopolistic industry where established firms engage in collusion. In the face of new entry that has the potential to destroy their “club” and erode their profitability, incumbent firms could slow down the erosion of their profitability as long as they are able to maintain their pre-entry collusive behaviors even after entry. One way they could do this is by ensuring that new entrants remain minor, fringe players, with little power to influence how incumbents behave. By imitating quickly the entrants’ strategies, incumbents could limit the growth of new entrants and so keep them as fringe players in the industry. Nattermann’s (1999) examination of how incumbent firms in the German mobile phone industry responded to the entry of new players during the period 1986-1998 shows exactly such an outcome: incumbents imitated quickly any innovations introduced by new entrants, thereby limiting the growth of these new players and maintaining industry profits above competitive levels, presumably through collusion.
This is just one instance where the benefits of imitation outweigh its costs, something that makes imitation a profit-enhancing strategy. But could we identify other circumstances when such an outcome emerges? For the rest of this paper, we utilize a simulation model to explore situations when imitation might be a profit-enhancing strategy for a firm.
Simulation modeling has become increasingly popular in strategic management and
organization theory and simulation experiments have been used to test and refine established theories (Carley and Lin, 1997; Lant and Mezias, 1990; Levinthal and Warglien, 1999; Lomi and Larsen, 1996), build new theory (Adner, 2002), conceive novel theoretical propositions (Lee, Lee, and Rho, 2002; Lin and Carley, 1997; Zott, 2003), and provide new explanations for empirical results about complex organizational phenomena. In our case, a formal model enables a tractable exploration of the dynamics of interorganizational imitation and allows us to design controlled experiments about this complex organizational issue. It has proven difficult to get robust empirical findings on the relationship between firm-level imitation and profitability, and only a few empirical studies have even explored these links (Gort and Klepper, 1982; Kessides, 1990; Levy, 1987). Mathematical modeling and simulation can help us build and refine our theories until we understand the phenomenon enough to design new empirical tests. Formal mathematical modeling also forces us to make our assumptions

8
about causal relationships between variables explicit, and simulation experiments provide a test of the internal validity, or consistency, of these assumptions.
MODELING IMITATION AND STRATEGIC INNOVATION
We constructed a Cellular Automata (CA) agent-based simulation model, overlaid with a two-dimensional strategy landscape (Epstein and Axtell, 1996; Lomi and Larsen, 1996; Packard and Wolfram, 1985; Wolfram, 1983). There are n firms that move over the landscape each time period competing for resources that are distributed throughout the landscape. Firm performance is a function of resource munificence per firm in the proximal region of the landscape, and the pay-offs change dynamically in response to the actions of firms competing on the landscape. Each firm’s movements over the landscape are guided by a search heuristic for either imitation or innovation.
To initialize our model, 1600 firms are placed on a lattice of size (40 x 40) such that each firm corresponds to a node in the lattice. Each company, jic , , is identified by their index numbers (i, j) on the lattice where 401 ≤≤ i and 401 ≤≤ j . On this lattice, each firm is assigned a fixed number of neighboring firms that will serve as the firm’s reference group. This reference group remains constant throughout the time horizon. In the course of the simulation, each firm compares its performance to the performance of every other firm in its reference group. This is consistent with empirical findings indicating that companies compare themselves to and monitor similar companies (Porac, Thomas, F, Paton, and Kanfer, 1995). Such similarity could be in terms of size, geographical area covered, product lines offered, managerial style, or any other meaningful firm characteristics.
The size of each firm’s reference group, or neighborhood, determines the number of firms in the industry that each company can potentially imitate. The size of the neighborhood is determined by a parameter K which determines the number of adjacent rows of firms in the lattice to include in the neighborhood. When K = 1, the nearest 8 neighbors on the lattice will be used as comparison each time the firm benchmarks its performance relative to all other firms in its reference group. When K = 2, each firm compares its performance to its 24 nearest neighbors. When K = 3 and K = 4, each firm compares its performance to 48 and 80 neighboring companies, respectively. In this way, the lattice determines the number of total competing firms- as in an industry- and the reference groups or neighborhoods for each firm.
Overlaid on top of the lattice is a two-dimensional strategy landscape. Each company has a strategy characterized by a set of coordinates ),( yx where 1000 ≤≤ x and 1000 ≤≤ y . For the purpose of notation we will describe a company’s ( jic , ) strategy as ),( ,, jiji yx . These coordinates could represent a firm’s strategy on the two dimensions of price and quality, or market segment and advertising intensity, or they could proxy for a composite strategy characterized along two strategic dimensions. For the purposes of the analysis presented here, we do not need to specify exactly what these two dimensions represent; it is sufficient to assume that they represent a company’s strategy and that we can meaningfully map the strategies of different firms in an industry on this two-dimensional landscape. To start with, each firm, jic , , is randomly assigned an initial strategy ),( ,, jiji yx .
In this simplified competitive industry, firm performance depends on appropriating
9
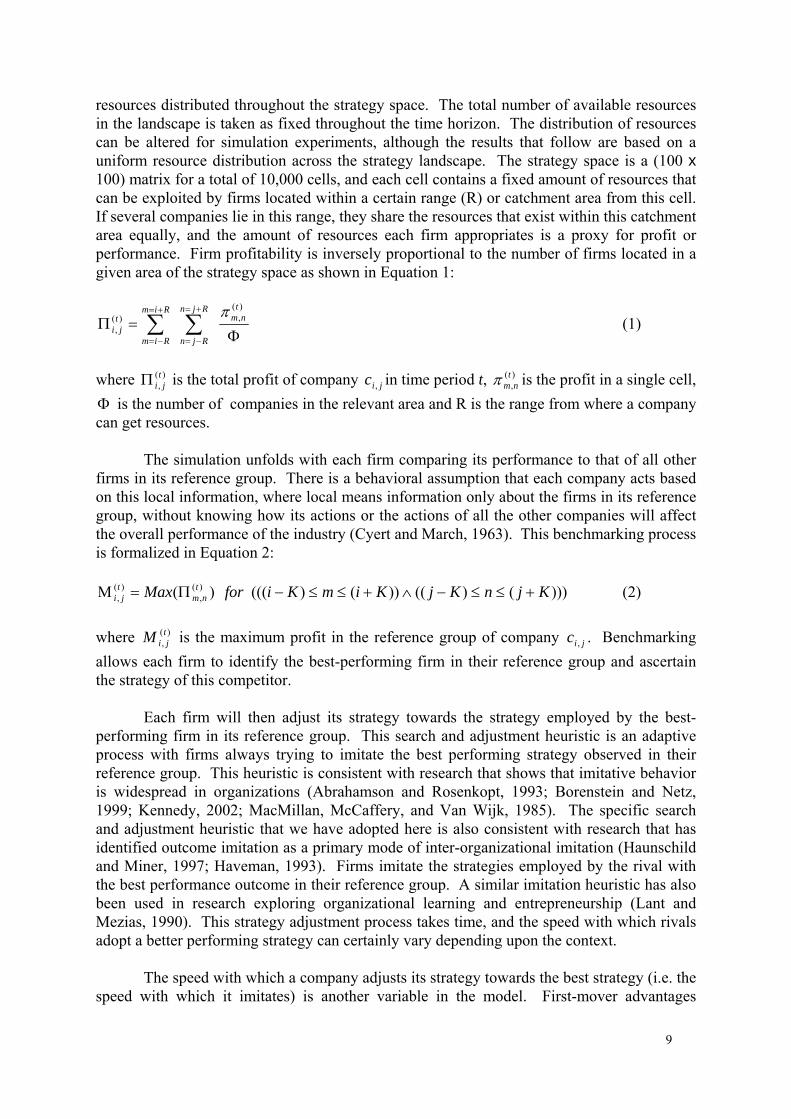
resources distributed throughout the strategy space. The total number of available resources in the landscape is taken as fixed throughout the time horizon. The distribution of resources can be altered for simulation experiments, although the results that follow are based on a uniform resource distribution across the strategy landscape. The strategy space is a (100 x 100) matrix for a total of 10,000 cells, and each cell contains a fixed amount of resources that can be exploited by firms located within a certain range (R) or catchment area from this cell. If several companies lie in this range, they share the resources that exist within this catchment area equally, and the amount of resources each firm appropriates is a proxy for profit or performance. Firm profitability is inversely proportional to the number of firms located in a given area of the strategy space as shown in Equation 1:
∑ ∑+=
−=
+=
−= Φ=Π
Rim
Rim
Rjn
Rjn
tnmt
ji
)(,)(
, π
(1)
where )(
,tjiΠ is the total profit of company jic , in time period t, )(
,t
nmπ is the profit in a single cell, Φ is the number of companies in the relevant area and R is the range from where a company can get resources.
The simulation unfolds with each firm comparing its performance to that of all other firms in its reference group. There is a behavioral assumption that each company acts based on this local information, where local means information only about the firms in its reference group, without knowing how its actions or the actions of all the other companies will affect the overall performance of the industry (Cyert and March, 1963). This benchmarking process is formalized in Equation 2:
)))()(( ))()((( )( )(,
)(, KjnKjKimKiforMax t
nmtji +≤≤−∧+≤≤−Π=Μ (2)
where )(
,tjiM is the maximum profit in the reference group of company jic , . Benchmarking
allows each firm to identify the best-performing firm in their reference group and ascertain the strategy of this competitor.
Each firm will then adjust its strategy towards the strategy employed by the best-performing firm in its reference group. This search and adjustment heuristic is an adaptive process with firms always trying to imitate the best performing strategy observed in their reference group. This heuristic is consistent with research that shows that imitative behavior is widespread in organizations (Abrahamson and Rosenkopt, 1993; Borenstein and Netz, 1999; Kennedy, 2002; MacMillan, McCaffery, and Van Wijk, 1985). The specific search and adjustment heuristic that we have adopted here is also consistent with research that has identified outcome imitation as a primary mode of inter-organizational imitation (Haunschild and Miner, 1997; Haveman, 1993). Firms imitate the strategies employed by the rival with the best performance outcome in their reference group. A similar imitation heuristic has also been used in research exploring organizational learning and entrepreneurship (Lant and Mezias, 1990). This strategy adjustment process takes time, and the speed with which rivals adopt a better performing strategy can certainly vary depending upon the context.
The speed with which a company adjusts its strategy towards the best strategy (i.e. the speed with which it imitates) is another variable in the model. First-mover advantages

10
associated with the underlying structure of the industry create imitation barriers that slow down imitation (Lieberman and Montgomery, 1988). Under this heading, one could classify factors such as economies of scale, learning, industry concentration, buyer switching costs and control of scarce resources. Other factors that slow down imitation are patents, branding, managerial innovations, partnerships and R&D investments. In addition, resource-specific isolating mechanisms result in resources that are difficult to imitate or substitute (Barney, 1995). These resources may be causally ambiguous or socially complex and can have a large impact on the speed with which rivals can imitate these strategies (Lippman and Rumelt, 1982). In our model, the speed of adjustment is denoted by the parameters (α,β), and movement along the strategy x-axis equals 1/α while the movement towards the y-axis equals 1/β as shown in Equation 3.
⎪⎪⎩
⎪⎪⎨
⎧
+−Θ
=
+−Θ
=
+
+
)(,
)(,
)()1(
,
)(,
)(,
)()1(
,
tji
tji
tyt
ji
tji
tji
txt
ji
yy
y
xx
x
β
α (3)
where jiji yandx ,, are the two strategy parameters for company jic , , yx and ΘΘ are coordinates for the strategy of the best performing company in the neighborhood of jic , , i.e.
the company with that generated the maximum profit )(,tjiM for the reference group. When the
adjustment process is (α,β) = (1,1), the imitating company will adopt the exact same strategy as the best performing competitor in the next time period. Similarly, if (α,β) = (2,2), the imitating company will move halfway towards the best performing competitor in the next time period. Parameters α and β can take on very large values up to ∞, to represent strategies that are increasingly difficult to imitate and therefore slow down imitation by rival firms. In this way, our model can represent cases in which imitation barriers cannot be surmounted such as very complex strategies (Rivken, 2000).
In some simulation experiments, not all 1600 firms will imitate. Instead, a small fraction of firms will change their strategy each period by adopting a strategy drawn from a uniform random distribution over the strategy space. We call these firms strategic innovators and explore the impact these innovators have on industry profitability over time. We also compare the performance of this group of strategic innovators versus the rest of the firms in the industry following the standard imitation strategy.
In summary, firms are randomly assigned a strategy that determines their initial position in the strategy space. Their position in the strategy space determines how many resources are available for appropriation in their neighbourhood given the number of firms located in that neighbourhood also competing for these resources. Resources are shared equally among competing firms in the neighbourhood and the amount of resources each firm appropriates is a proxy for firm profit or performance. Each firm benchmarks continuously to determine if any of its competitors are performing better than itself. If a firm identifies a better-performing competitor, it tries to imitate its strategy by adjusting towards the better performing strategy. In some simulation experiments, a small fraction of firms strategically innovate rather than imitate by randomly choosing a strategy in the landscape. Since every company in the model tries to adjust its strategy every period, the number of total competitors within a given range R can change substantially from period to period. As a result, the
11
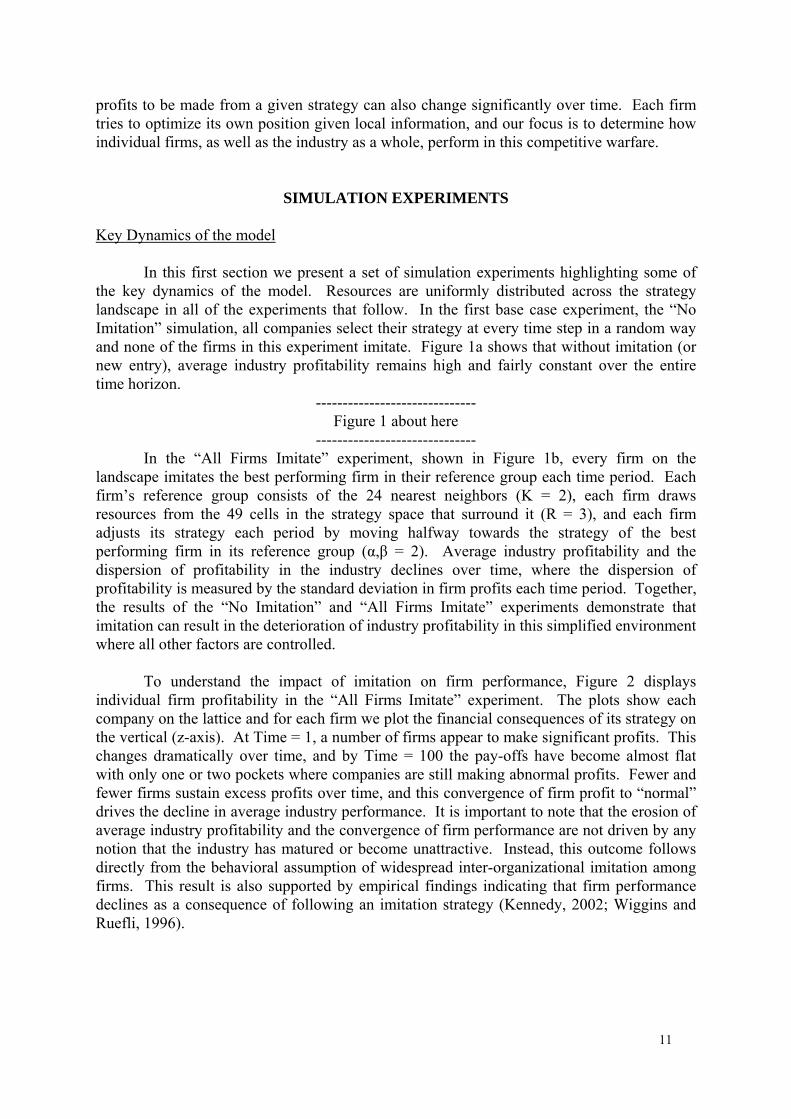
profits to be made from a given strategy can also change significantly over time. Each firm tries to optimize its own position given local information, and our focus is to determine how individual firms, as well as the industry as a whole, perform in this competitive warfare.
SIMULATION EXPERIMENTS Key Dynamics of the model
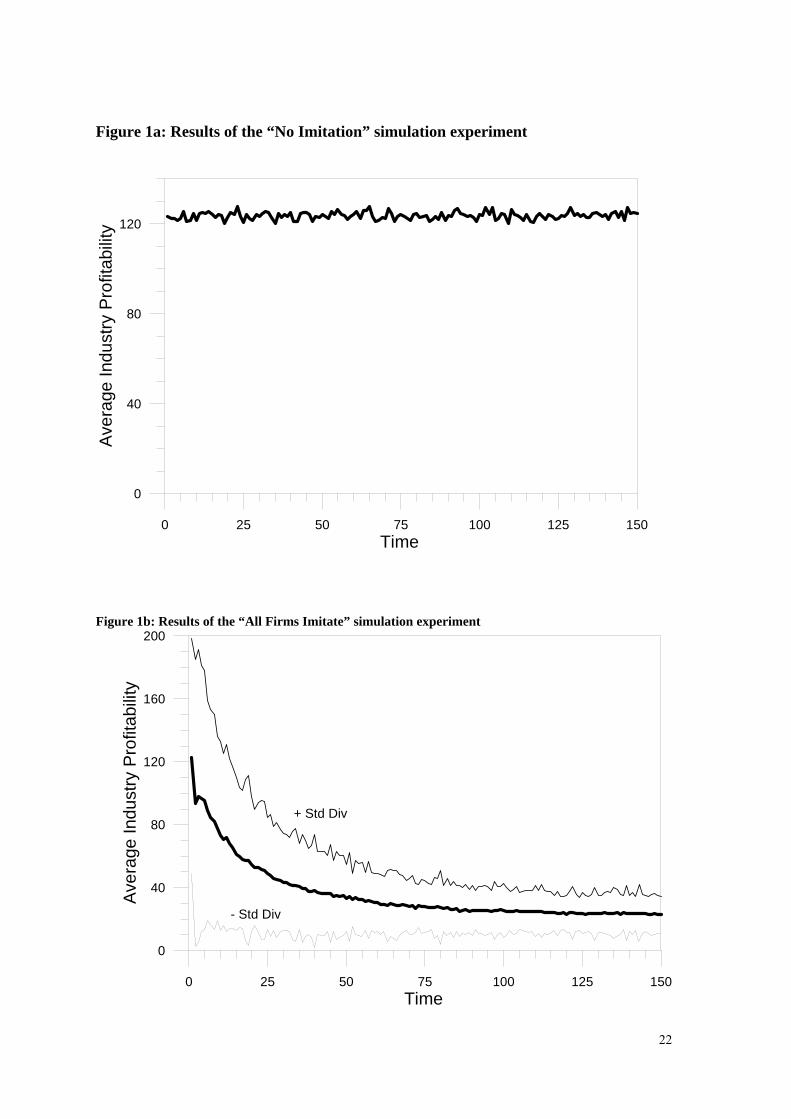
In this first section we present a set of simulation experiments highlighting some of the key dynamics of the model. Resources are uniformly distributed across the strategy landscape in all of the experiments that follow. In the first base case experiment, the “No Imitation” simulation, all companies select their strategy at every time step in a random way and none of the firms in this experiment imitate. Figure 1a shows that without imitation (or new entry), average industry profitability remains high and fairly constant over the entire time horizon.
------------------------------ Figure 1 about here
------------------------------ In the “All Firms Imitate” experiment, shown in Figure 1b, every firm on the
landscape imitates the best performing firm in their reference group each time period. Each firm’s reference group consists of the 24 nearest neighbors (K = 2), each firm draws resources from the 49 cells in the strategy space that surround it (R = 3), and each firm adjusts its strategy each period by moving halfway towards the strategy of the best performing firm in its reference group (α,β = 2). Average industry profitability and the dispersion of profitability in the industry declines over time, where the dispersion of profitability is measured by the standard deviation in firm profits each time period. Together, the results of the “No Imitation” and “All Firms Imitate” experiments demonstrate that imitation can result in the deterioration of industry profitability in this simplified environment where all other factors are controlled.
To understand the impact of imitation on firm performance, Figure 2 displays individual firm profitability in the “All Firms Imitate” experiment. The plots show each company on the lattice and for each firm we plot the financial consequences of its strategy on the vertical (z-axis). At Time = 1, a number of firms appear to make significant profits. This changes dramatically over time, and by Time = 100 the pay-offs have become almost flat with only one or two pockets where companies are still making abnormal profits. Fewer and fewer firms sustain excess profits over time, and this convergence of firm profit to “normal” drives the decline in average industry performance. It is important to note that the erosion of average industry profitability and the convergence of firm performance are not driven by any notion that the industry has matured or become unattractive. Instead, this outcome follows directly from the behavioral assumption of widespread inter-organizational imitation among firms. This result is also supported by empirical findings indicating that firm performance declines as a consequence of following an imitation strategy (Kennedy, 2002; Wiggins and Ruefli, 1996).

12
------------------------------ Figure 2 about here
------------------------------ The consequences of widespread imitation in the “All Firms Imitate” experiment is
also shown in Figure 3, where we can see that imitation over time results in a clustering of firms in a very small area of the strategy space. The clustering of firms in a small area of the strategy space is pronounced by Time = 100. Since the strategy space has a fixed level of resources across the landscape, as more companies come to inhabit a small area, the less profit each firm appropriates. As a result, industry profitability drops not because of a lack of potential opportunities or profits in the industry, but primarily because, in their desire to imitate each other, firms miss other potentially profitable opportunities in the industry. As a result, average industry profitability declines even though the industry itself may be inherently profitable: it still contains several “pockets” of profitability that are not exploited. Sensitivity analyses indicate this result is robust to variations in the distribution of resources across the landscape, including cone-shaped distributions with most of the resources concentrated in the center of the landscape.
This is an interesting finding because it suggests a process of profit erosion which is
very different from the one that standard economic theory proposes. It allows us to propose the first theoretical proposition to emerge from our simulation experiments. Future empirical studies ought to explore the validity of the following:
P1: Inter-organizational imitation of successful strategies results in the formation of firm clusters focused around narrow strategic positions.
------------------------------ Figure 3 about here
------------------------------
There is some empirical evidence that firms tend to cluster around narrow strategic positions from research on departure times in the airline industry (Borenstein and Netz, 1999), research on strategic groups (McGee and Thomas, 1986), and research on herd behavior (Scharfstein and Stein, 1990). There is also increasing evidence that companies are competing with more and more intensity around narrower and narrower strategic positions. For example, Stalk and Webber (1993) argued that companies are now caught in a destructive downward spiral competing head to head “...to bring out more and more varieties of products, without any prospects of achieving competitive advantage, higher margins, or more attractive profits…” (Stalk and Webber, 1993, p.94). Our simulation suggests that this “imitation trap” is an unintended consequence of boundedly rational decisions but more research is needed to unpack the causal links between imitation and industry profitability.
To determine if our simulation provides the expected theoretical outcomes, we first undertake a number of “sensitivity” experiments. We first explore the impact of reference group size (K) and speed of imitation on the evolution of industry profitability. Figure 4a presents the evolution of average industry profitability as the number of competitors to whom a given firm compares itself at the end of every period, or conversely it shows the number of competitors that can potentially imitate any given firm. It is clear from Figure 4a that as K moves from 1 (8 neighbours) to 2 (24 neighbours) to 3 (48 neighbours) to 4 (80 neighbours), industry profitability declines at a faster rate. The counter-intuitive implication is that the
13
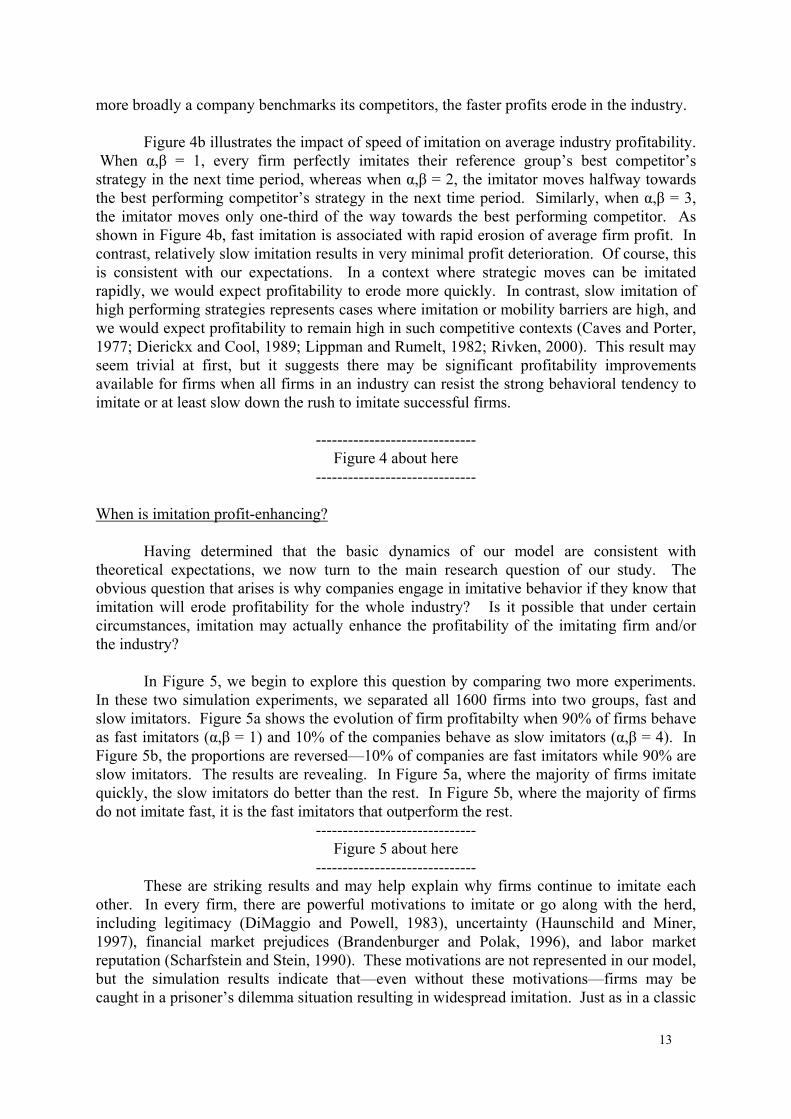
more broadly a company benchmarks its competitors, the faster profits erode in the industry.
Figure 4b illustrates the impact of speed of imitation on average industry profitability. When α,β = 1, every firm perfectly imitates their reference group’s best competitor’s strategy in the next time period, whereas when α,β = 2, the imitator moves halfway towards the best performing competitor’s strategy in the next time period. Similarly, when α,β = 3, the imitator moves only one-third of the way towards the best performing competitor. As shown in Figure 4b, fast imitation is associated with rapid erosion of average firm profit. In contrast, relatively slow imitation results in very minimal profit deterioration. Of course, this is consistent with our expectations. In a context where strategic moves can be imitated rapidly, we would expect profitability to erode more quickly. In contrast, slow imitation of high performing strategies represents cases where imitation or mobility barriers are high, and we would expect profitability to remain high in such competitive contexts (Caves and Porter, 1977; Dierickx and Cool, 1989; Lippman and Rumelt, 1982; Rivken, 2000). This result may seem trivial at first, but it suggests there may be significant profitability improvements available for firms when all firms in an industry can resist the strong behavioral tendency to imitate or at least slow down the rush to imitate successful firms.
------------------------------
Figure 4 about here ------------------------------
When is imitation profit-enhancing?
Having determined that the basic dynamics of our model are consistent with
theoretical expectations, we now turn to the main research question of our study. The obvious question that arises is why companies engage in imitative behavior if they know that imitation will erode profitability for the whole industry? Is it possible that under certain circumstances, imitation may actually enhance the profitability of the imitating firm and/or the industry?
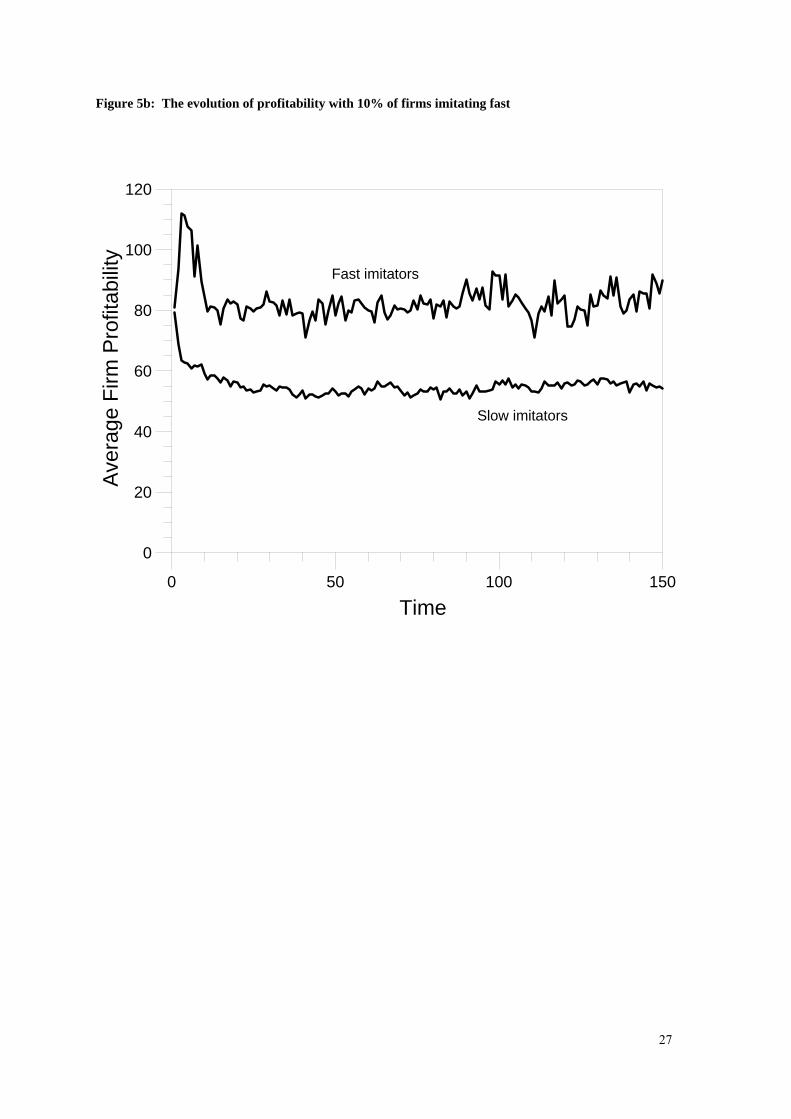
In Figure 5, we begin to explore this question by comparing two more experiments.
In these two simulation experiments, we separated all 1600 firms into two groups, fast and slow imitators. Figure 5a shows the evolution of firm profitabilty when 90% of firms behave as fast imitators (α,β = 1) and 10% of the companies behave as slow imitators (α,β = 4). In Figure 5b, the proportions are reversed—10% of companies are fast imitators while 90% are slow imitators. The results are revealing. In Figure 5a, where the majority of firms imitate quickly, the slow imitators do better than the rest. In Figure 5b, where the majority of firms do not imitate fast, it is the fast imitators that outperform the rest.
------------------------------ Figure 5 about here
------------------------------ These are striking results and may help explain why firms continue to imitate each
other. In every firm, there are powerful motivations to imitate or go along with the herd, including legitimacy (DiMaggio and Powell, 1983), uncertainty (Haunschild and Miner, 1997), financial market prejudices (Brandenburger and Polak, 1996), and labor market reputation (Scharfstein and Stein, 1990). These motivations are not represented in our model, but the simulation results indicate that—even without these motivations—firms may be caught in a prisoner’s dilemma situation resulting in widespread imitation. Just as in a classic

14
prisoner’s dilemma, firms know that if they all imitate, they all lose out. However, if they decide not to imitate and one of them cheats (i.e. imitates), then the cheat will outperform all the others. Even though the collective good is not to imitate, the individual best strategy is to cheat and imitate. The end result is that all firms imitate and industry profitability erodes. The results also point to a straightforward set of propositions that require empirical testing:
P2: In industries in which there is widespread, rapid imitation, firms that do not imitate or that imitate quite slowly outperform the industry average. P3: In industries in which there is very little imitation or imitation occurs very slowly, firms that imitate rapidly will outperform the industry average. The choice that firms make in deciding upon a strategy is whether they will imitate a
rivals’ strategy or differentiate themselves from competitors by innovating. We explore the implications of this choice in the next set of experiments, where a small fraction of the 1600 firms act as strategic innovators instead of imitators. Instead of imitating the best performing firms in their reference groups, these innovators adopt a randomly drawn strategy from a uniform distribution over the strategy landscape each time period. The results of these experiments on average firm profitability are shown in Figure 6.
Strategic innovation appears to limit the deterioration of average industry profitability but
does not prevent it altogether. As the fraction of strategic innovators in the industry increases, average industry profitability also increases. To understand what is driving these results, Figure 7 presents an image of how firms are distributed over the strategy space in the case of 1% strategic innovators. When we compare the distribution of firms in Figure 7 with the distribution of firms in Figure 3, it becomes obvious that the presence of strategic innovators helps limit the clustering of firms in a narrow strategy space. As a result, the resources of the whole industry are better utilized and this limits the erosion of average industry profitability. These results suggest to us that future empirical studies ought to explore the validity of the following propositions:
P4: Firm-level strategic innovation limits the erosion of average industry profitability and the convergence of firm profits. As the number of innovating firms increases in an industry, average industry profitability also increases. P5: Firm-level strategic innovation attenuates the formation of clusters around narrow strategic positions.
------------------------------ Figure 6 about here
------------------------------ ------------------------------
Figure 7 about here ------------------------------
These results suggest that average industry profitability can improve when a large
enough percentage of companies in the industry innovate. However, it is still unclear whether an individual firm is better off by imitating or innovating. The experiments discussed previously in connection with the speed of imitation, highlighted an instance where imitation

15
is harmful for the industry as a whole but may be beneficial for an individual firm. To explore this issue further, we separated the performance of imitating firms from those that strategically innovate and ran three experiments. In the following simulation experiments, a small fraction of the 1600 firms continue to act as strategic innovators instead of imitators. In Figure 8(a), we allow 1% of the firms to strategically innovate; in Figure 8(b) we allow 5% strategic innovators and in Figure 8(c) we allow 25% strategic innovators.
The experiments show that strategic innovators outperform imitators in the first two
simulations, but in the third simulation where 25% of firms strategically innovate, the group of imitating companies has the same level of average firm profit as the group of innovating companies. Since our model does not take into consideration the added costs and risks of innovation, we could argue that in the third simulation, imitation is the superior strategy for firms. In other words, the more companies innovate in an industry, the better imitation is as a strategy for individual firms. These results suggest the following propositions:
P6: In industries in which there is widespread imitation, firms that strategically innovate will outperform the industry average. P7: As the number of firms that strategically innovate in an industry increases, the performance difference between innovators and imitators converges to zero.
------------------------------ Figure 8 about here
------------------------------
In the final set of simulation experiments, we first allow an industry to “mature” by enabling all firms to imitate each other for the first half of the simulation time horizon. As shown in Figure 9, this has the expected result of eroding industry profitability consistent with the “All Firms Imitate” experiment from Figure 1b. For the second half of the simulation time horizon, we allow a fraction of the firms to start strategically innovating (i.e. start selecting random strategies). As seen in Figure 9, industry profitability improves substantially as a result of strategic innovation. This result is consistent with the empirical evidence provided by Baden-Fuller and Stopford (1994) and Hamel (1996).
------------------------------
Figure 9 about here ------------------------------
CONCLUSION AND DISCUSSION
In this paper, we sought to understand the circumstances under which imitation improves firm specific returns. We chose to study this topic using a simulation model to enable a tractable analysis of a complex organizational issue that has proven difficult to study empirically. We believe that despite the relative simplicity of our model, the simulations generated a number of interesting testable propositions regarding the role of imitation in the erosion of profitability.
Our main finding is that under certain circumstances, firm imitation could be profit
enhancing for the imitating firm. Specifically, our simulations suggest that in industries in

16
which there is little imitation or imitation occurs slowly, firms that imitate quickly will outperform the industry average. Thus, the speed at which other firms imitate influences the attractiveness of imitation. In addition, our simulations suggest that as the number of firms that strategically innovate in an industry increases, the performance differences between innovators and imitators converges to zero, implying that imitation is a superior strategy.
Several other insights have emerged from our simulations, all of which deserve further study and empirical testing. Perhaps the most important of these insights is that firm-level imitation leads to industry profit deterioration via a mechanism which is different from what the economics literature emphasizes. We found that one reason why industry profitability erodes is because firms form clusters in narrow strategic positions within the industry. In their efforts to imitate each other, companies focus their attention on “narrow” strategy spaces and neglect other strategic positioning options that could lead them to unexploited “pockets” of profitability in the industry. This result is supported by empirical evidence (Stalk and Webber, 1993; Wiggins and Ruefli, 2002) and could help explain not only why industry profitability declines over time but also why strategic innovators are able to suddenly “discover” new industry positions that they could exploit to industry dominance.
If, as our model suggests is possible, industries contain pockets of unexploited profitability, then companies that identify these unexploited territories—new consumer segments/new consumer needs/new delivery methods—and take the risk to explore them (i.e. strategically innovate), will achieve significant profits and will rejuvenate an industry that looked mature and uninteresting. Certainly, Hamel and Prahalad’s (1994) urging for companies to search and exploit “white spaces” in their industries supports the notion that whole “pockets” of unexploited potential may exist in every industry.
Markides (1997) shows that companies that successfully attack industry incumbents without the benefit of a technological innovation, do so by identifying gaps in the industry positioning map and exploiting these gaps to industry dominance. These gaps are unexploited consumer segments or poorly served consumer needs. It is not that these new segments or new needs just emerge all of a sudden—they always existed but nobody took advantage of them. Strategic innovators tend to be the first to identify these gaps and go after them. Similarly, Baden-Fuller and Stopford (1994) show how industries that appeared unprofitable and mature, can be rejuvenated when specific firms in these industries innovate by discovering new ways of competing. Again, these new ways of competing (strategic positions in our terminology) existed in the industries but nobody seemed to notice them or take them seriously. When entrepreneurial firms “discover” these new positions and decide—despite the risk to their legitimacy—to go after them, they set in motion a process that could rejuvenate mature industries. Finally, Hamel (2000) and Hamel and Prahalad (1994) describe several cases where mature companies transform themselves and their industries by becoming industry revolutionaries—in effect, developing strategies that allowed them to break the rules of the game in their mature industries.
Another important insight to emerge from our model is the finding that companies imitate each other not only because they seek legitimacy or because they don’t recognize the value of innovation, but also because they are caught in a classic prisoner’s dilemma situation. Firms may well know that widespread, rapid imitation is destructive for the industry overall, but they may imitate nevertheless because if they are the only firm that imitates, then they stand to benefit. Therefore, the incentive is for individual firms to “cheat”

17
and imitate. Therefore, all firms imitate and all firms in the industry lose out.
This suggests that it is not enough to proclaim the virtues of strategic innovation or to criticize firms for imitating. As long as the structure and payoffs in an industry remain the way they are, firms will continue to imitate. Just like in the real prisoner’s game, the solution to this problem—apart from collusion—is to change the payoffs associated with imitation and innovation. Another solution may be to “teach” firms how to develop capabilities to learn more or better from benchmarking and therefore imitate in a more creative way. Stalk and Webber (1993) provide an example of a company from Japan that escaped the “downward spiral” of imitation by benchmarking creatively. Our attitude towards collusion may also need some re-thinking. If through collusion, firms can agree not to “cheat” and put their energy and resources into innovation, then collusion provides an important benefit to society that has been neglected so far.
Our results also suggest that no firm can hope to sustain above normal profits indefinitely unless it can successfully and continuously strategically innovate or migrate into new industries. For example, Mitchell and Singh (1993) found that industry incumbents that did not expand into new technical subfields tended to fare poorly in their established businesses, even if the market for the established products continued to exist. On the other hand, firms that expanded from their established businesses—though a much riskier strategy—survived longer and achieved greater subsequent market share than competitors that did not expand. This result should not be surprising. Even casual observation of long-surviving companies quickly suggests that these companies have successfully changed their business mix over time. Motorola transitioned from consumer electronics to semiconductors, 3M shifted from mining to sandpaper to adhesives, and the world’s oldest company, the Swedish Stora Kopparberget, has moved from mining to forestry products. It should not be surprising, and yet strategy research on the topic of sustaining competitive advantage is preoccupied with advising firms how to erect barriers to imitation rather than help them make the necessary migration to other markets.
All models are simplifications of reality, and our model has a number of limitations that need to be addressed in future research. In our model, there is no entry or exit from the industry- i.e. entry barriers to the industry are insurmountable and companies cannot go bankrupt. Firms do not accumulate resources or capabilities that could serve as imitation or mobility barriers. In fact, all companies are represented as homogenous apart from the choice of strategic positioning. A company’s strategy in the model is represented by a two-dimensional vector (x,y) that is simply a proxy for a more sophisticated representation. Future research may relax all or some of these assumptions to further our understanding. This paper is simply a start towards understanding better the impact of firm-level imitation on firm and industry profitability and numerous questions still remain to be addressed in future research. For example, are there other conditions when imitation is a superior strategy to innovation or differentiation? How does imitation interact with new entry and price competition to determine the evolution of industry and firm performance? What is the impact of costs of innovation or uncertainty on imitation’s effect on industry profits? These are all questions that future research projects must try to answer.

18
REFERENCES Abrahamson E, Rosenkopt L. 1993. Institutional and competitive bandwagons. Academy of Management Review 18: 487-517
Adner R. 2002. When are technologies disruptive? A demand-based view of the emergence of competition. Strategic Management Journal 23: 667-688.
Ashforth BE, Gibbs BW. 1990. The double-edge of organizational legitimation. 1: 177-194
Baden-Fuller C, Stopford J. 1994. Rejuvenating the mature business. HBS Press: Boston, MA
Barney J. 1991. Firm Resources and Sustained Competitive Advantage. Journal of Management 17(1): 99-120
Barney J. 1995. Looking Inside for Competitive Advantage. Academy of Management Executive IX(4): . 49-61
Borenstein S, Netz J. 1999. Why do all flights leave at 8am?: Competition and departure-time differentiation in airline markets. International Journal of Industrial Organization 17: 611-640
Branch B. 1980. The Laws of the Marketplace and ROI Dynamics. Financial Management 9(Summer): 58-65
Brandenburger A, Polak B. 1996. When managers cover their posteriors: making the decision the market want to see. Rand Journal of Economics 27: 523-541
Carley K, Lin Z. 1997. A theoretical study of organizational performance under information distortion. Management Science 43: 976-997
Caves RE, Porter ME. 1977. From entry barriers to mobility barriers: Conjectural decisions and contrived deterrence to new competition. Quarterly Journal of Economics 91: 241-262
Cool KO, Schendel DE. 1987. Strategic Group formation and performance: The case of the US pharmaceutical industry, 1963-1982. Management Science 33(9): 1102-1124
Cyert RM, March JG. 1963. A Behavioral Theory of the Firm (2nd ed.). Blackwell Publishers Inc.: Cambridge, MA. 1992.
Daems H, Thomas H (Eds.). Strategic Groups, Strategic Moves and Performance. Pergamon Press: Oxford
Deephouse DL. 1999. To be different or to be the same? Strategic Management Journal 20(2 February): 147-166
Dierickx I, Cool K. 1989. Asset Stock Accumulation and Sustainability of Competitive Advantage. Management Science 35(12): 1504-1511
DiMaggio PJ, Powell WW. 1983. The iron cage revisited: Institutional isomorphism and collective rationality in organizational fields. American Sociological Review 48: 147-160

19
Epstein JM, Axtell RL. 1996. Growing Artifical Societies: Social science from the bottom up. MIT Press: Cambridge, MA
Ferrier W, Smith K, Grimm C. 1999. The role of competitive action in market erosion and industry dethronement: A study of industry leaders and challengers. Academy of Management Journal 42
Geroski P, Gilbert RJ, Jacquemin A. 1990. Barriers to entry and strategic competition. Harwood Academic Publishers: Chur, Switzerland
Geroski P, Jacquemin A. 1988. The Persistence of Profits: A European Comparison. The Economic Journal 98(June): 375-389
Ghoshal S, Westney ED. 1991. Organizing Competitor Analysis Systems. Strategic Management Journal 12(1): 17-32
Gimeno J, Woo C. 1996. Hypercompetition in a multimarket environment: the role of strategic similarity and multimarket contact in competitive de-escalation. Organization Science 7: 322-341
Gort M, Klepper S. 1982. Time Paths in the Diffusion of Product Innovations. The Economic Journal 92: 630-653
Hambrick DC, D'Aveni RA. 1992. Top management team deterioration as part of the downward spiral of bankruptcies. Management Science 38: 1445-1466
Hamel G. 1996. Strategy as Revolution. Harvard Business Review July: 69-82
Hamel G. 2000. Leading the Revolution. Harvard Business School Press: Boston, MA
Hamel G, Prahalad CK. 1994. Competing for the future. HBS Press: Boston
Haunschild, Miner. 1997. Modes of Interorganizational Imitation: The Effects of Outcome Salience and Uncertainty. Administrative Science Quarterly: 472-500
Haveman HA. 1993. Follow the leader: mimetic isomorphism and entry into new markets. Administrative Science Quarterly 38: 593-627
Huff AS, Huff JO, Thomas H. 1994. The Dynamics of strategic change. In H Daems, H Thomas (Eds.), Strategic Groups, Strategic Moves and Performance: 31-62. Pergamon Press: Oxford
Kennedy RE. 2002. Strategy fads and competitive convergence: an empirical test for herd behavior in prime-tv programming. Journal of Industrial Economics L: 57-84
Kessides I. 1990. The Persistence of Profits in U.S. Manufacturing Industries, in D.C.
Lant TK, Mezias SJ. 1990. Managing discontinuous change: a simulation study of organizational learning and entrepreneurship. Strategic Management Journal 11: 147-179
Lee J, Lee K, Rho S. 2002. An evolutionary perspective on strategic group emergence: a genetic algorithm-based model. Strategic Management Journal 23: 727-746

20
Levinthal D, Warglien M. 1999. Landscape Design: Designing for Local Action in Complex Worlds. Organization Science 10: 342-357
Levy D. 1987. The Speed of the Invisible Hand. International Journal of Industrial Organization 5(1): 79-92
Lieberman M, Montgomery DB. 1988. First-Mover Advantages. Strategic Management Journal 9: 41-58
Lin Z, Carley K. 1997. Organizational response: the cost performance trade-off. Management Science 43: 217-234
Lippman S, Rumelt R. 1982. Uncertain Imitability: An Analysis of Interfirm Differences in efficiency under competition. Bell Journal of Economics 12: 418-438
Lomi A, Larsen ER. 1996. Interacting locally and evolving globally: a computational approach to the dynamics of organizational populations. Academy of Management Journal 39(4): 1287-1321
MacMillan IC, McCaffery ML, Van Wijk G. 1985. Competitors Responses to Easily Imitated New Products--Exploring Commercial Banking Product Introductions. Strategic Management Journal 6: 75-86
Markides CC. 1997. Strategic Innovation. Sloan Management Review 38(3 Spring): 9-23
Markides CC. 2000. All the right moves: A guide to crafting breakthrough strategy. Harvard Business School Press: Boston, MA
McGee J, Thomas H. 1986. Strategic Groups: Theory, research and taxonomy. Strategic Management Journal 7: 141-160
McGee J, Thomas H. 1989. Strategic Groups: A further comment. Strategic Management Journal 10: 105-107
Meyer JW, Rowan B. 1977. Institutional organizations: Formal structure as myth and ceremony. American Journal of Sociology 83: 340-363
Miller D, Chen M. 1995. Nonconformity in competitive repertoires. Academy of Management Best Paper Proceedings: 256-260
Mitchell W, Singh K. 1993. Death of the lethargic: Effects of expansion into new technical subfields on performance in a firm's base business. Organization Science 4(2): 152-180
Mueller DC. 1977. The Persistence of Profits above the Norm. Economica 44(176): 369-380
Mueller DC. 1986. Profits in the Long Run. Cambridge University Press: Cambridge
Packard N, Wolfram S. 1985. Two-dimensional cellular automata. Journal of Statistical Physics 38: 901-946
Porac J, Thomas H, F TW, Paton D, Kanfer A. 1995. Rivalry and the industry model of Scottish knitwear production. Administrative Science Quarterly 40(2): 203-230
21
Porter ME. 1980. Competitive Strategy. Free Press: New York
Porter ME. 1996. What is Strategy. Harvard Business Review November-December: 61-78
Rivken JW. 2000. Imitation of Complex Strategies. Management Science 46: 824-844
Rumelt R. 1984. Towards a strategic theory of the firm. In R Lamb (Ed.), Competitive Strategic Management: 556-570. Prentice-Hall: Englewood Cliffs, NJ
Rumelt R. 1987. Theory, Strategy and Entrepreneurship. In D Teece (Ed.), The Competitive Challenge. Ballinger: Cambridge, MA
Scharfstein, Stein. 1990. Herd Behavior and Investment. American Economic Review: 465-479
Schumpeter JA. 1934. The Theory of Economic Development (R Opie, Trans.). Harvard University Press: Cambridge, MA
Stalk G, Webber AM. 1993. Japan's dark side of Time. Harvard Business Review July-August: 93-102
Stigler GJ. 1963. Capital and Rates of Return in Manufacturing Industries. Princeton University Press: Princeton, NJ
Suchman MC. 1995. Managing legitimacy: Strategic and institutional approaches. Academy of Management Review 20: 571-610
Tang M, Thomas H. 1992. The concept of strategic groups: Theoretical construct or analytical convenience. Managerial and Decision Economics 13: 323-329
Thomas H, Venkatraman. 1988. Research on strategic groups: progress and prognosis. Journal of Management Studies 25: 537-555
Waring GF. 1996. Industry Differences in the persistence of firm-specific returns. American Economic Review 86 December: 1253-1265
Wiggins RR, Ruefli TW. 2002. Competitive Advantage: Temporal Dynamics and the Incidence and Persistence of Superior Economic Performance. Organizational Science 13: 82-105
Williams JR. 1992. How sustainable is your competitive advantage? California Management Review 34(3): 1-23
Wolfram S. 1983. Statistical mechanics of cellular automata. Review of Modern Physics 55: 601-644
Zott C. 2003. Dynamic capabilities and the emergence of intraindustry differential firm performance: insights from a simulation study. Strategic Management Journal 24: 97-125
22
Figure 1a: Results of the “No Imitation” simulation experiment
0 25 50 75 100 125 150Time
0
40
80
120
Ave
rage
Indu
stry
Pro
fitab
ility
Figure 1b: Results of the “All Firms Imitate” simulation experiment
0 25 50 75 100 125 150Time
0
40
80
120
160
200
Ave
rage
Indu
stry
Pro
fitab
ility
+ Std Div
- Std Div

23
Time = 1 Time = 10
Time = 25 Time = 50
Time = 75 Time = 100
Figure 2: Profit for each firm over time in “All Firms Imitate” simulation experiment (z-axis indicates profit)

24
Time = 1 (initial distribution) Time = 10
Time = 25 Time = 50
Time = 75 Time = 100
Figure 3: Distribution of firms in the strategy space for “All Firms Imitate” experiment

25
Figure 4a: Sensitivity of industry profitability to size of the reference group
0 30 60 90 120 150Time
0
40
80
120
Aver
age
Firm
Pro
fit
k = 1
k = 2
k = 3k = 4
Figure 4b: Sensitivity of industry profitability to speed of imitation
0 30 60 90 120 150Time
0
40
80
120
Aver
age
Firm
Pro
fit
α= β=1
α=β=2
α=β=3
α=β=4
α=β=5
Ave
rage
Indu
stry
Pro
fitab
ility
Ave
rage
Indu
stry
Pro
fitab
ility

26
Figure 7: The evolution of profitability with 90% of firms imitating fast
0 50 100 150Time
0
20
40
60
80
100
120
Average company revenue
Slow imitators
Fast imitators
Ave
rage
Firm
Pro
fitab
ility
Time
Figure 5a: The evolution of profitability with 90% of firms imitating fast
27
Figure 5b: The evolution of profitability with 10% of firms imitating fast
0 50 100 150Time
0
20
40
60
80
100
120Average company revenue
Slow imitators
Fast imitators
Time
Ave
rage
Firm
Pro
fitab
ility

28
Figure 6: Strategic Innovation experiments
0 25 50 75 100 125 150
Time
0
40
80
120
Ave
rage
Indu
stry
Pro
fitab
ility
No Innovators (Base Case)
1 % Innovators
5% Innovators
25% Innovators

29
Figure 7: Distribution of firms on the strategy landscape in 1% Strategic Innovation
Time = 1 Time = 20
Time = 40 Time = 100

30
Figure 8: Performance of innovating and imitating firms in a) 1% innovators, b) 5% innovators, and c) 25% innovators
0 30 60 90 120 150Time
0
30
60
90
120
150
180Ave
rage
Firm
Pro
fit Innovating Firms
Imitating Firms
0 30 60 90 120 150Time
0
30
60
90
120
150
180
Aver
age
Firm
Pro
fit
Innovating Firms
Imitating Firms
0 30 60 90 120 150Time
0
30
60
90
120
150
180
Aver
age
Firm
Pro
fit
Innovating Firms
Imitating Firms
(a)
(c)
(b)

31
Figure 9: Strategic Innovation in mature industries. The percentage indicate
0 50 100 150 200Time
0
40
80
120
Ave
rage
Firm
Pro
fit
Firms begin to innovate
1%
5%
10%
25%
Ave
rage
Indu
stry
Pro
fitab
ility