Embed Size (px)
Citation preview
1
Firm Dynamics and Productivity Growth in Indian Manufacturing:
Evidence from Plant Level Panel Dataset
Aradhna Aggarwal and Takahiro Sato
Abstract
This paper examines the effects of firms’ dynamics on industry level productivity growth in
India during the period 2000-01 to 2005-06 using plant level panel data of 22
manufacturing industries. The empirical analysis is based on decomposition techniques of
aggregate productivity growth. The analysis is confined to large sector plants. Results
suggest that the contribution of entry of new plants to aggregate productivity growth is
positive in most industries. While newly established plants have rather small entry effect,
small plants that grow and enter the large size class have substantial effects on industry
level productivity growth. In low tech matured industries entry effects are supported by the
productivity growth of the continuing firms. In medium tech industries entry effects are
modest; productivity growth of the continuing firms is supported by reallocation effects. In
high tech industries all the three effects seem to reinforce productivity growth.
JEL Classification: O14, O33, O53
We gratefully acknowledge financial supports from the collaborative research project
``Long-Term Trends of India Villages'' sponsored by Grant-in-Aid for Scientific Research (S). We
thank Professor Tsukasa Mizushima, Professor Hideki Esho and Professor Etsuro Ishigami for their
constant encouragements, and Ms. Suling Chien and Ms. Atsuko Kamiike for their research
assistances.
RIEB, Kobe University, Rokkodai, Nada, Kobe 657-8501 JAPAN, and the National Council of
Applied Economic Research, New Delhi 110002, INDIA.
Email: [email protected].
RIEB, Kobe University, Rokkodai, Nada, Kobe 657-8501 JAPAN.
Email: [email protected].
2
1. Introduction
Recently there has been a surge in the literature on industry dynamics allowing for firm
heterogeneities and/or idiosyncratic shocks. Though the origin of this literature can be
traced back to Schumpeter (1934, 1942) where he proposed the process of ‘creative
destruction’ to explain the dynamics of industry evolution, recent developments in this
literature are inspired by the theory of firm selection and industry evolution proposed in the
seminal works of Jovanovic (1982), Hopenhayn (1992), and Ericson and Pakes (1995).
What is new in the emerging literature is that empirical findings have been developed in
parallel with emerging theoretical literature due to the growing availability of longitudinal
plant-level data that permits the analysis of industry dynamics (Foster et al 2001). One
strand of this emerging literature emphasises the potential role of entry and exit in
heterogeneity across plants and seeks to explore the impact of such micro heterogeneity on
aggregate productivity growth. Following the pioneer works of Baily et al (1992) and
Griliches and Regev (1995), this literature examines the contribution of new and exiting
firms by decomposing exercises of aggregate productivity growth (inter alia, Baldwin and
Gu 2006, Cantner and Krüger 2008, Carreira and Teixeira 2009, Disney et al. 2003, and
Foster et al. 2001). The common premise across these studies is that productivity growth is
not only due to internal restructuring within established firms, but also to productivity of
entry and exit of firms. The present study is embedded in this literature. Its objective is to
examine the effects of firms’ dynamics on industry level productivity growth in the Indian
context, using the hitherto unexplored plant level data on Indian manufacturing for the
period 2000-01 to 2005-06. In particular, we focus on productivity differences between
continuing, entering and exiting firms. Our hypothesis is that firms’ entry and exit generate
positive and significant productivity effects at the industry level. The empirical analysis is
based on the decomposition methodology of aggregate productivity growth pioneered by
3
Baily et al (1992) and subsequently developed by important contributions of several
scholars (Griliches and Regev 1995, Foster et al 2001, Balwin and Gu 2003, Olley Pakes
1996, and Melitz and Polanec 2009). It uses three different methodologies for the analysis:
Foster et al (2001), Griliches and Regev (1995) and Melitz and Polanec (2009). Given the
data constraints, the analysis focuses on the large corporate sector; small sector is out of the
purview of the study. This provides us an opportunity to make a distinction between two
forms of entry: one, direct entry of newly established plants, and two, entry of existing
small sector plants in the relatively larger factory sector by way of expansion. The analysis
thus makes an important contribution to the existing empirical literature by distinguishing
between the productivity effects of two types of entrants: newly established plants and the
existing survivors that have been learning about investment and innovation opportunities
passively (Javonvic 1982) or actively (Pakes and Ericson 1989) and expanding to enter the
large corporate sector. There is a plethora of studies on productivity growth in Indian
manufacturing (e.g. Ahluwalia 1991) but to the best of our knowledge, this is the first study
on the effects of firms’ dynamics on productivity dynamics.
India makes a good case study for the productivity effects of entry and exit as it is an
emerging economy that has substantially relaxed policy-erected barriers to business and
trade over the past two decades. Indian initiated the process of economic reforms rather
cautiously in the mid 1980s. In 1991, however the pace of reforms was accelerated and the
country drifted away from an import substituting regime towards export oriented strategy
for growth. Since then comprehensive reforms have been introduced in industry, trade,
financial and fiscal sectors to improve efficiency, productivity and international
competitiveness of the industry and to impart dynamism to the overall growth process.
Evidence suggests that economic reforms have had a significant impact on business
dynamics in the industrial sector (Mody et al 2010, Aghion et al. 2005). This provides a
4
perfect setting for the analysis.
The rest of the study is organised into 8 sections. Section 2 provides an overview of the
economic reforms introduced in India and their effects on firms’ entry and exit. Section 3
describes a theoretical framework relating to firm turnover and productivity levels. Section
4 provides an overview of decomposition methodologies. Section 5 presents a brief review
of the background literature. Section 6 focuses describes the modeling and the data. Section
7 describes plant dynamics using the data. Section 8 evaluates the entry and exit effects on
productivity growth. Section 9 offers some concluding remarks.
2. Economic reforms and business dynamics in India: An overview
After independence, India embarked on a strategy of state-led industrialization based on
import substitution. An elaborate set of controls were devised to direct the process of
industrialization to suit the path of development envisaged in the various 5-year Plans. The
key policy instrument of industrial controls was the industrial licensing policy, 1951 which
regulated entry, exit and expansion of industrial units rather tightly. Private sector
participation was excluded from a number of sectors by reserving them only for the public
sector companies. Manoeuvrability of private firms was regulated even in those sectors
where their entry was allowed. They needed a license to open a new factory, change
location, produce a new product or expand capacity by more than a specified margin. Such
licenses were given in accordance with the macro-economic plan targets. Over the years,
the government added more tools to this basic instrument of industrial policy, further
tightening the entry and movement of industrial units. For example, in 1969, the MRTP act
came into force under which all applications for a license from companies belonging to a
5
list of big business houses and subsidiaries of foreign companies were to be referred
to a ‘MRTP Commission’ which invited objections and held public hearings before
granting a license for production. Further, a 1973 resolution reserved certain sectors for
small scale producers. The number of sectors was subsequently expanded during the 1970s.
In 1973, the FERA act was enforced, which restricted the entry of foreign companies only
to high-tech core sectors and required them to reduce their share in equity capital to below
40% in other sectors. These policy initiatives were complemented by restrictions on foreign
technology imports, and high tariff and non-tariff barriers on imports stifling all efforts to
start new businesses and /or expand the existing ones by both, foreign and domestic
entrepreneurs.
While entry was tightly regulated, exit was discouraged at any cost. Closure of an industrial
unit was considered to be a social loss due to loss of employment and, hence, this outcome
was avoided wherever possible. In order to facilitate operation of the sick industrial units,
government owned banks and financial institutions were directed to provide them credit at
subsidized interest rates. In 1971, through an amendment in the Licensing Act, the central
government was empowered to take over industrial undertaking with special emphasis to
sick units. In 1977, a merger policy was announced which offered fiscal incentives to
healthy industrial units to merge sick units with them. Several concessions were also
announced by the RBI from time to time to encourage banks to bail these units out.
The first tentative moves towards deregulation were made during the early 1980s, but the
pace of deregulation accelerated with the unveiling of the “new economic policies” in 1985.
A series of piecemeal reforms were introduced with the objective of improving productivity
in existing units. Under certain conditions, business houses were allowed to operate outside
their permitted list of sectors. They were allowed to expand in related areas without seeking
6
fresh licence under the facility of broad banding. Some sectors were delicensed. Existing
companies could set up new production units, without restriction on size, provided the
latter were 100 per cent export oriented. Access to foreign technology, hitherto severely
restricted, was relaxed across the board and duties on project related imports were reduced
along with those on all other capital goods. The upper limit of investment in the small scale
sector was also revised to allow them to expand. Notably, all these reforms were favourable
to existing companies; they did not facilitate the entry of new firms. Further, status quo was
maintained with respect to the licensing procedure which was heavily loaded in favour of
incumbents (Bhagwati, 1982, 1988). Meanwhile, the exit policy was further tightened. In
1981 the government announced a new strategy under which large sick units employing
more than 1000 employees and having investment worth Rs 90 million or more could be
nationalized. In 1982, the state governments were empowered under the ‘Relief
Undertaking Act’ to declare sick units owned by them or those that borrowed from them or
state financial institutions, as relief units. All dues and payables of these units were frozen.
In 1985, the Companies (Special Provisions) Act, or SICA was promulgated. To enforce the
Act, the Board for Industrial and Financial Reconstruction (BIFR) was set up in 1987.
Under the SICA, any company that has been registered for more than 7 years and whose
worth has been completely eroded must apply to BIFR for permission for closure. Filing
with BIFR automatically suspends all legal proceedings and creditors can not attach and
liquidate assets of the defaulting companies. While the BIFR has been given powers to
approve winding up of a unit, the process is very time consuming. Furthermore, winding up
of companies is not under its jurisdiction. It is the jurisdiction of the high court. Thus the
winding up can take upto a decade after reference has been made to BIFR under SICA. In
general, sick units are encouraged to merge with healthy units. Since the managers of sick
companies do not face any cost of bankruptcy, there are strong incentives to overlook
impending financial distress (Gangopadhyay and Knopf, 1998). As of December 31, 1980
7
the number of sick units was 24,550 with Rs. 18086.6 million locked in them; by
December 1990, it increased to 212,097 and Rs. 93,830 million, respectively. The Act thus
facilitated the creation of non-performing assets on the balance sheets of the banks
(Bhaumik and Mukherjee, 2002) and skewed the playing field against potential entrants. In
the process, capital was tied up in loss-making industrial units instead of being delivered to
new units of production.
The process of reforms was accelerated in 1991 and marked a departure from the earlier
development strategy. These reforms laid a strong emphasis on enabling markets and
globalization. Licensing was abolished for all industries except those that were related to
defence or were potentially environment-damaging. The number of industries reserved
for the public sector was cut down from 17 to 3. Both FERA and MRTP acts were repealed.
By the end of the 1990s, most manufacturing units were allowed 100 per cent FDI under
automatic approval. Procedures for the procurement of technology from abroad were also
simplified. Until the end of the eighties, prices of most infrastructure and basic
intermediates were controlled by the government on a cost-plus basis, under the aegis of
the administered price regime (APR). In the nineties, the APR was also abandoned. Further,
trade barriers were considerably relaxed and non tariff barriers were completely removed,
intensifying import competition in the economy (Das, 2003).
While entry barriers are considerably relaxed, exit policy is still tightly regulated. Since
1991, government companies have also been under the purview of SICA. To expedite the
clearance of cases some reforms were introduced in the internal functioning of BIFR in the
early 1990s. By 1996, the average time in the first hearing reduced to 30 days against 160
days in first five years and the number of hearings increased to 1560 against 61 in 1988.
But the long delays in the final judgment (including high court rulings) continue to favour

8
sick units. In view of high levels of non performing assets, the ‘Securitisation and
Reconstruction of Financial Assets and enforcement of Security Interest Act’ (SARFESI)
was introduced in 2002. Under the Act, sweeping powers have been granted to secured
creditors for the recovery of the dues. They can simply seize the assets of the company and
sell them to the highest bidder, irrespective of the fact that the case is registered with SICA.
It is no longer necessary for them to take any legal course. In the same year, the
‘Companies Act (second amendment) Act’ was passed. In the Act, the Board for Industrial
and Financial Reconstruction (BIFR) and Appellate Authority for Industrial and Financial
Reconstruction (AAIFR) are proposed to be dissolved, and replaced by National Company
Law Tribunals (NCLT) and National Law Appellate Tribunal (NCLAT) respectively. It
proposes to give the NCLT the jurisdiction and power relating to winding up of companies
presently vested in the High Court. However, the act could not be enforced till date.
Notably, the SARFESI Act, 2002 has also been facing legal wrangles. A ‘New Companies
Bill’ is in the Parliament for consideration. This has a provision for a viable, time-bound
exit policy. Meanwhile, SICA continues to be in operation and the problem of industrial
sickness continues to exist with 89,641 sick/weak units reported by the RBI in 2008.
Drawing on the above discussion, we believe that economic liberalization of the early 1990s
is associated with significant entry even while exit rate is still very low. Existing studies agree
that economic liberalization has facilitated business dynamism in terms of the number of
entry, and growth in assets, sales and profits. Opinion however seems to be divided on the
impact of this dynamism. One view is that liberalization fostered business dynamism through
removal of entry barriers (Mody et al 2010, Panagariya 2008, Aghion et al. 2005, Bhaumik et
al. 2009, Bhuamik et al. 2008) and hence is pro-market. The other view considers reforms as
pro-business and argues that the new dynamics are generating incentives to accumulate
excessive market power for economic entrenchment by the large incumbent firms such as
9
state firms and business houses (Alfaro and Chari 2009, Bertrand et al. 2002, Rodrik and
Subramanian 2004, and Kohli 2006). The underlying argument is that the entry of firms has
not been accompanied by the exit of business houses and government owned firms. As a
result, the Indian business sector continues to be dominated by government-owned firms and
conglomerates with influence over market conditions (and government policies and
regulation). Alfaro and Chari (2009) steers the Indian economy clear off the Schumpeter’s
creative destruction paradigm on the basis of the argument that the entrants did not replace
the incumbents who should exit after the new entry. In contrast, advancing the pro-market
view, Mody et al. (2010) claim that there is no robust, and consistent relationship between
increases in firm-level profitability and market shares, which, according to them, is more a
sign of dynamism than entrenchment. They also argue that business houses can also be a
source of dynamism though there is no evidence in their paper to support that.
This debate completely overlooks the ‘productivity dynamics’ which form the core of
business dynamism. The creative destruction paradigm is characterised by the creation of
novelty and the destruction of old products and processes and not necessarily old firms. The
existing firms perish in the evolutionary process if they do not upgrade their competencies.
Even while they are not allowed to wind up their operations they stop functioning or
downsize them. The process of creative destruction is thus a concept that reflects competition
for productivity gains. To the best of our knowledge however there is no study that has
analysed productivity dynamics that arise from entry and exit and their role in enhancing
aggregate productivity growth in the Indian context. Entering firms add to productivity if they
are more productive than the existing firms. Further, increased competition from the entry
threat may stimulate the productivity growth of established firms as well (Aghion et al. 2009
and Falck et al. 2009). Thus, incumbents in industries with a high entry rate have an
10
increasing pressure to improve their performance. We thus argue that business dynamisms are
pro market if the process of creative destruction enhances the macro-level productivity.
3. Firms’ dynamics and productivity growth: A Theoretical framework
According to Schumpeter (1934, 1942), innovative entry by entrepreneurs is the force that
drives industry’s evolution and sustains economic growth, even as it destroys the value of
established companies that have enjoyed some degree of monopoly power derived from
previous technological, organizational, regulatory, and economic paradigms. The implication
is that the productivity growth of an industry is enhanced by the entry of new firms. In his
seminal work, Jovanovic (1982) departs from this line of thinking and suggests an alternative
approach. He postulates that heterogeneous firms enter the industry without knowing what
their true productivity is. Once they enter the market, they learn about the distribution of their
own profitability, based on noisy information from realized profits. By continually updating
such learning, the firm decides to expand, contract, or to exit. Hopenhayn (1992) developed a
model to capture these market dynamics in long rum equilibrium of an industry composed of
a large number of price-taking firms producing a homogeneous output. His model predicts
that surviving members of the entering firms have a higher productivity than those members
that exit. Thus only high productivity entering firms remain in the industry whereas the less
productive ones exit. Another important prediction of the model is that the productivity of
any member of continuing firms at time t is greater than that of the member of entering firms.
This is because as the continuing firms age, more selection takes place and surviving
members concentrate a higher proportion of high productivity units. In both these models,
establishments are basically passive, acting in response to market signals. Pakes and Ericson
(1989) investigate how outcomes from a Jovanovic-style model of ‘passive learning’ would
11
differ from results generated by a model allowing for ‘active exploration’ of
investment/innovation opportunities. They find that both types of models generate similar
results. Success is not guaranteed by investment in active learning. They conclude that new
firms are either passive learners or active explorers. If they survive they grow and enter in
larger classes. One of the main theoretical implications of these models is that new entrants
will, on an average, have lower productivity and a higher probability of exit than the
incumbents. They survive if their productivity is higher than those who exit and if they
survive their productivity grows further through the selection process. The entry effects are
therefore likely to be small.
Melitz (2003) adapted the Hopenhayn (1992) model to monopolistic competition in a general
equilibrium setting under the conditions of uncertainty to analyse productivity effects of firms’
dynamics under international trade. Contrary to the findings of its predecessors, he predicts
that the exposure to trade will induce only the more productive firms to enter the export
market and will simultaneously force the least productive firms to exit. The underlying
assumption is that there are significant costs associated with entry in the export market. Most
of these costs are sunk in nature and are quite relevant for the export decision. Export market
entry decisions therefore occur after the firm gains knowledge of its productivity and that
only the firms with productivity greater than the threshold level can enter the export market.
He calls this export market selection effect. This implies that entry may have significant
positive effect on industry level productivity growth in an open economy. He also shows that
the least productive firms cannot earn positive profit in the new trade equilibrium and hence
exit. This according to him is the domestic market selection effect. The two effects together
reallocate market shares towards more productive firms and contribute to an aggregate
productivity gain. He shows that an increase in the exposure of an economy to trade generates
very similar results. The main claim then is that in an open or transition economy, entry of
12
more productive firms forces the least productive firms to exit which increases aggregate
productivity of the industry. This also induces indirect effects on inter-firm market share
reallocation towards the more productive firms, further affecting the industry productivity.
Thus new entrants are likely to push productivity both directly by being more productive and
indirectly by forcing least productive ones to exit. The model does not however explore the
possibility that more productive entrants can also affect within-plant productivity of
incumbents.
Another strand of literature uses the Schumpeterian creative destruction growth model to
predict the potential role of entry and exit. The central premise of this approach is that a
part of the differences across plants may reflect the vintage of the installed capital. One
form of these models is termed capital vintage approach. It assumes that new technology is
embodied in more recent vintage capital. This is because unlike incumbents, they do not
have to incur the costs of upgrading their capital. Since technology can be better harnessed
by new firms, productivity growth will be dependent upon the entry of new units of
production that displace outpaced establishments. Successful firms in innovation enter the
market and replace firms producing obsolete goods increasing aggregate productivity of the
industry (inter alia, Caballero and Hammour, 1994; Mortensen and Pissarides, 1994;
Campbell, 1998). These models predict large entry effects. However, an alternative view is
that even while new technology is embodied in more recent vintage capital (see e.g. Cooper,
Haltiwanger and Power, 1999) existing firms can adopt new technology by retooling. This
in turn may drive industry level productivity through both within-plant and between
plant-reallocation effects. Note that just as Melitz (2003) this model also emphasizes that
entry will have not only direct effects but also indirect effects on the macro level
productivity. But while Melitz highlights only between-plant reallocation effects, this
model introduces the possibility that entry might affect within-plant productivity as well.
13
Aghion et al. (2009) show that entry effects depend on the technological advancement of
incumbent firms. While building on Aghion et al. (2001) they assume that the potential
entrant enters with a leading-edge technology. If the incumbent is close to the technology
frontier, it will innovate more to escape and survive entry. This is more likely to happen in
technologically laggard industries. But, if the incumbent is farther from the frontier, he
cannot compete with the entrant and will have to exit. Thus, in technological advanced
industries where the incumbent firms cannot survive entry by more productive firms and
exit, entry will have only direct effects but in technologically laggard industries entry will
induce indirect effects. Thus, entry effects may be relatively smaller in laggard industries as
compared with technologically advanced countries.
Finally, product life cycle models (Gort and Klepper 1982, Cohen and Klepper 1996)
suggest that firm creation and innovation depend on the degree of maturity of the industry.
Geroski (1995) argues that a young industry is characterised by high entry rates as new
firms propose a large number of new product designs. As the industry matures, firms stop
competing in terms of product design and start competing in terms of prices and costs.
Entrants may be at a severe disadvantage in the second type of competition and
consequently their impact on industry structure and performance decreases. However,
exogenous shifts in demand or costs, may occur and if the incumbent firms fail to adapt to
these shifts, entry into the industry may again play an important role.
New entrants can thus be considered to be important agents of change. Their direct effect
relates to the generation of new productive capacities while indirect effects relate to the
effects they have on established firms in the industry. They can crowd-out less competitive
incumbent firms through increased competition to reallocate market shares in favour of more
productive firms and /or stimulate incumbent firms to innovate themselves. These prima facie
14
effects are however not decisive since new entry could be of small or follower firms a la
Jovanovic and Hopenhayn, which cannot threaten the incumbents’ power. Further, much
depends on the industry specific and incumbent firm specific factors a la Aghion and Geroski,
among others.
4. Empirical testing of firm dynamics and productivity growth: Productivity
decomposition methodologies
Empirically, the dynamics of productivity growth are captured by productivity decomposition
methodologies. A wide range of decomposition methods are offered in the literature to assess
sources of industry productivity growth. These methodologies decompose productivity
growth between two points in time in an industry into the contribution from four broad
factors: improvement in incumbents’ productivity; reallocation of resources from less
productive to more productive producers; entry of more productive firms; and exit of less
productive firms. These methodologies thus link macro productivity growth with micro firms’
and productivity dynamics. Discussed in what follows are these methodologies.
Baily et al. (1992) was the first study to propose decomposition of productivity into the
contributions of stayers, entrants, and exits (BHC methodology). They defined aggregate
productivity as the output-weighted (θf,t) average of the productivity of individual plants
(Af,t). The linear aggregation of productivity implies a geometric average of productivity
levels:
At = ∑ θf,t
nt
f
Af,t
Using this, they proposed the following methodology (BHC), to decompose aggregate
15
productivity growth:
ΔAtBHC = ∑ θf,t−1
f∈S
ΔAf,t + ∑(θf,t − θf,t−1) Af,t
f∈S
+ ∑ θf,t
f∈N
(Af,t − At−1)
+ ∑ θf,t−1
f∈X
(At−1 − Af,t−1)
In the above equation, the Sets S, N, and X, respectively, represent the set of continuing,
entering, and exiting factories during the periods from t-1 to t. The first term measures the
effect of plant-level productivity changes, weighted by the initial share. The second term
which sums changes in shares using a plant’s productivity as weight captures the
reallocation effect. The last two terms capture reallocation driven by new plants entering
and others exiting.
An alternative is provided by Griliches and Regev (1995). Their methodology is as under.
ΔAtGR = ∑ θf
f∈S
ΔAf,t + ∑ Δθf
f∈S
(Af − A) + ∑ θf,t
f∈N
(Af,t − A)
+ ∑ θf,t−1
f∈X
(Af,t−1 − A)
This methodology will be referred to as GR throughout the text of this study. In this
formula a bar over a variable indicates the average of the variable over the base and end
years. All productivity terms (except for within-effects) are expressed as average
productivity of two years.
Foster et al. (2001) modify the BHC methodology. Just BHC, FHK also expresses all
productivity changes as differences from aggregate productivity in t − 1. In addition, they
decomposed the second term of BHC into a ‘pure between effect’, weighing the change in
shares by the relative productivity in the initial period and a covariance term. The BHC and
GR decompositions amount to lumping the entire covariance term with the between term.
16
ΔAtFHK = ∑ θf,t−1
f∈S
ΔAf,t + ∑ Δθf,t
f∈S
(Af,t−1 − At−1) + ∑ Δθf,t
f∈S
ΔAf,t
+ ∑ θf,t
f∈N
(Af,t − At−1) + ∑ θf,t−1
f∈X
(At−1 − Af,t−1)
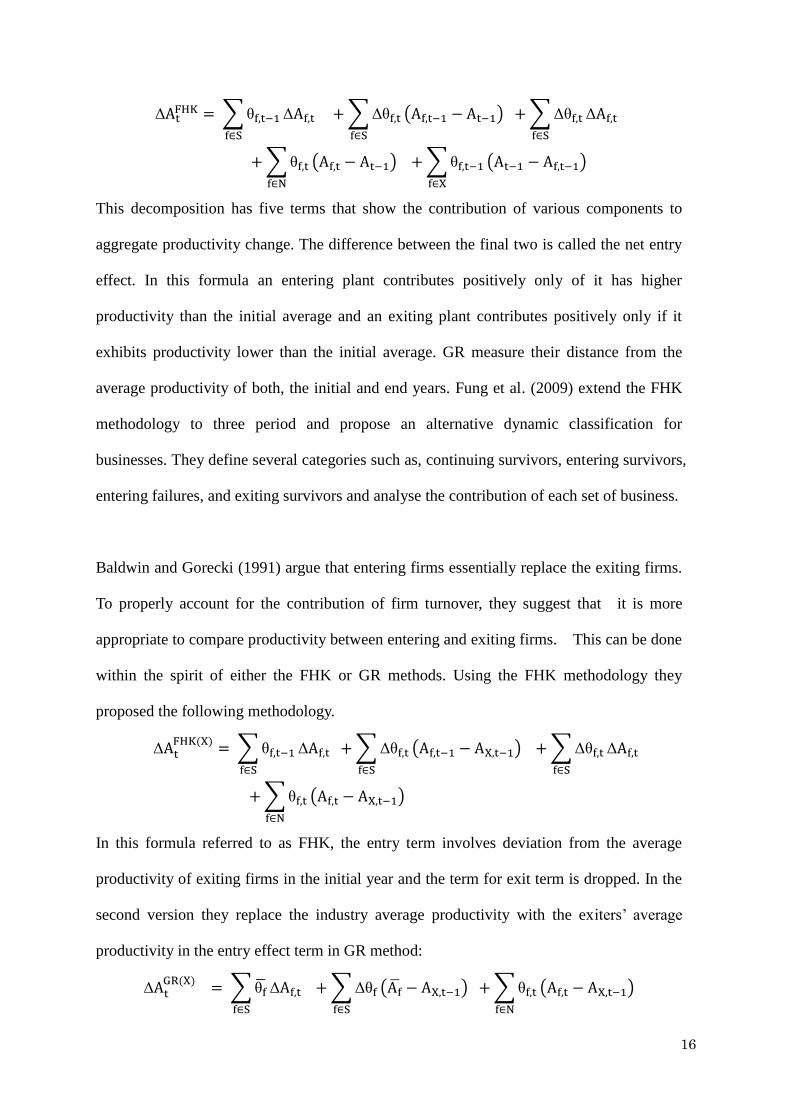
This decomposition has five terms that show the contribution of various components to
aggregate productivity change. The difference between the final two is called the net entry
effect. In this formula an entering plant contributes positively only of it has higher
productivity than the initial average and an exiting plant contributes positively only if it
exhibits productivity lower than the initial average. GR measure their distance from the
average productivity of both, the initial and end years. Fung et al. (2009) extend the FHK
methodology to three period and propose an alternative dynamic classification for
businesses. They define several categories such as, continuing survivors, entering survivors,
entering failures, and exiting survivors and analyse the contribution of each set of business.
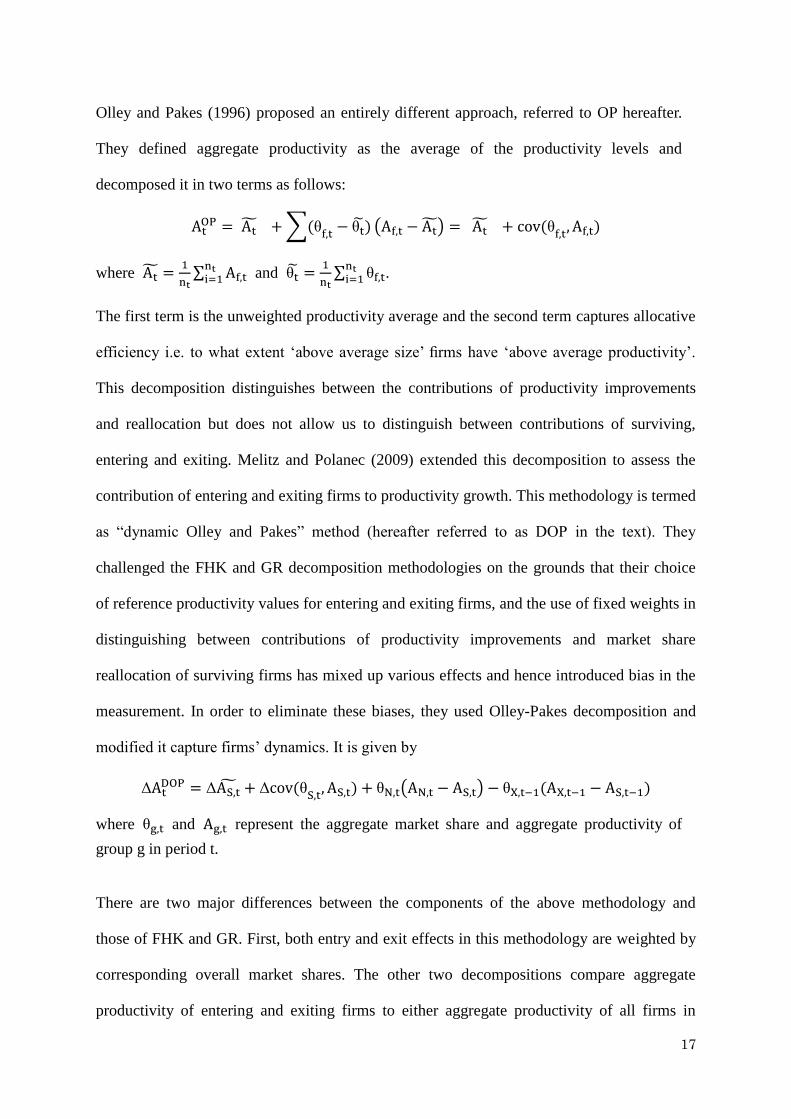
Baldwin and Gorecki (1991) argue that entering firms essentially replace the exiting firms.
To properly account for the contribution of firm turnover, they suggest that it is more
appropriate to compare productivity between entering and exiting firms. This can be done
within the spirit of either the FHK or GR methods. Using the FHK methodology they
proposed the following methodology.
ΔAtFHK(X)
= ∑ θf,t−1
f∈S
ΔAf,t + ∑ Δθf,t
f∈S
(Af,t−1 − AX,t−1) + ∑ Δθf,t
f∈S
ΔAf,t
+ ∑ θf,t
f∈N
(Af,t − AX,t−1)
In this formula referred to as FHK, the entry term involves deviation from the average
productivity of exiting firms in the initial year and the term for exit term is dropped. In the
second version they replace the industry average productivity with the exiters’ average
productivity in the entry effect term in GR method:
ΔAtGR(X)
= ∑ θf
f∈S
ΔAf,t + ∑ Δθf
f∈S
(Af − AX,t−1) + ∑ θf,t
f∈N
(Af,t − AX,t−1)
17
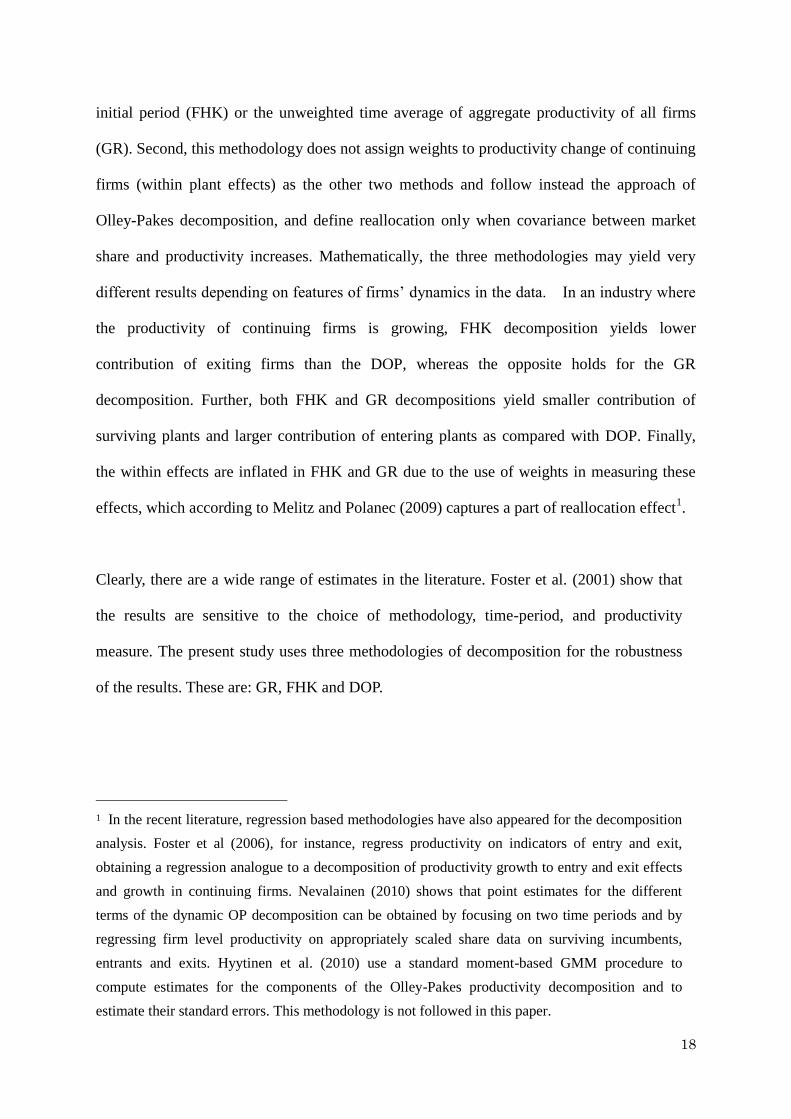
Olley and Pakes (1996) proposed an entirely different approach, referred to OP hereafter.
They defined aggregate productivity as the average of the productivity levels and
decomposed it in two terms as follows:
AtOP = At + ∑(θ
f,t− θt) (Af,t − At) = At + cov(θ
f,t, Af,t)
where At =1
nt∑ Af,t
nti=1 and θt =
1
nt∑ θf,t
nti=1 .
The first term is the unweighted productivity average and the second term captures allocative
efficiency i.e. to what extent ‘above average size’ firms have ‘above average productivity’.
This decomposition distinguishes between the contributions of productivity improvements
and reallocation but does not allow us to distinguish between contributions of surviving,
entering and exiting. Melitz and Polanec (2009) extended this decomposition to assess the
contribution of entering and exiting firms to productivity growth. This methodology is termed
as “dynamic Olley and Pakes” method (hereafter referred to as DOP in the text). They
challenged the FHK and GR decomposition methodologies on the grounds that their choice
of reference productivity values for entering and exiting firms, and the use of fixed weights in
distinguishing between contributions of productivity improvements and market share
reallocation of surviving firms has mixed up various effects and hence introduced bias in the
measurement. In order to eliminate these biases, they used Olley-Pakes decomposition and
modified it capture firms’ dynamics. It is given by
ΔAtDOP = ΔAS,t
+ Δcov(θS,t
, AS,t) + θN,t(AN,t − AS,t) − θX,t−1(AX,t−1 − AS,t−1)
where θg,t and Ag,t represent the aggregate market share and aggregate productivity of
group g in period t.
There are two major differences between the components of the above methodology and
those of FHK and GR. First, both entry and exit effects in this methodology are weighted by
corresponding overall market shares. The other two decompositions compare aggregate
productivity of entering and exiting firms to either aggregate productivity of all firms in
18
initial period (FHK) or the unweighted time average of aggregate productivity of all firms
(GR). Second, this methodology does not assign weights to productivity change of continuing
firms (within plant effects) as the other two methods and follow instead the approach of
Olley-Pakes decomposition, and define reallocation only when covariance between market
share and productivity increases. Mathematically, the three methodologies may yield very
different results depending on features of firms’ dynamics in the data. In an industry where
the productivity of continuing firms is growing, FHK decomposition yields lower
contribution of exiting firms than the DOP, whereas the opposite holds for the GR
decomposition. Further, both FHK and GR decompositions yield smaller contribution of
surviving plants and larger contribution of entering plants as compared with DOP. Finally,
the within effects are inflated in FHK and GR due to the use of weights in measuring these
effects, which according to Melitz and Polanec (2009) captures a part of reallocation effect1.
Clearly, there are a wide range of estimates in the literature. Foster et al. (2001) show that
the results are sensitive to the choice of methodology, time-period, and productivity
measure. The present study uses three methodologies of decomposition for the robustness
of the results. These are: GR, FHK and DOP.
1 In the recent literature, regression based methodologies have also appeared for the decomposition
analysis. Foster et al (2006), for instance, regress productivity on indicators of entry and exit,
obtaining a regression analogue to a decomposition of productivity growth to entry and exit effects
and growth in continuing firms. Nevalainen (2010) shows that point estimates for the different
terms of the dynamic OP decomposition can be obtained by focusing on two time periods and by
regressing firm level productivity on appropriately scaled share data on surviving incumbents,
entrants and exits. Hyytinen et al. (2010) use a standard moment-based GMM procedure to
compute estimates for the components of the Olley-Pakes productivity decomposition and to
estimate their standard errors. This methodology is not followed in this paper.
19
5. Literature review
There has been a proliferation of studies on productivity analysis using decomposition
methodology since the seminal work of Baily et al. (1992). We briefly review here the
findings of the existing studies to examine whether the sources of productivity differ across
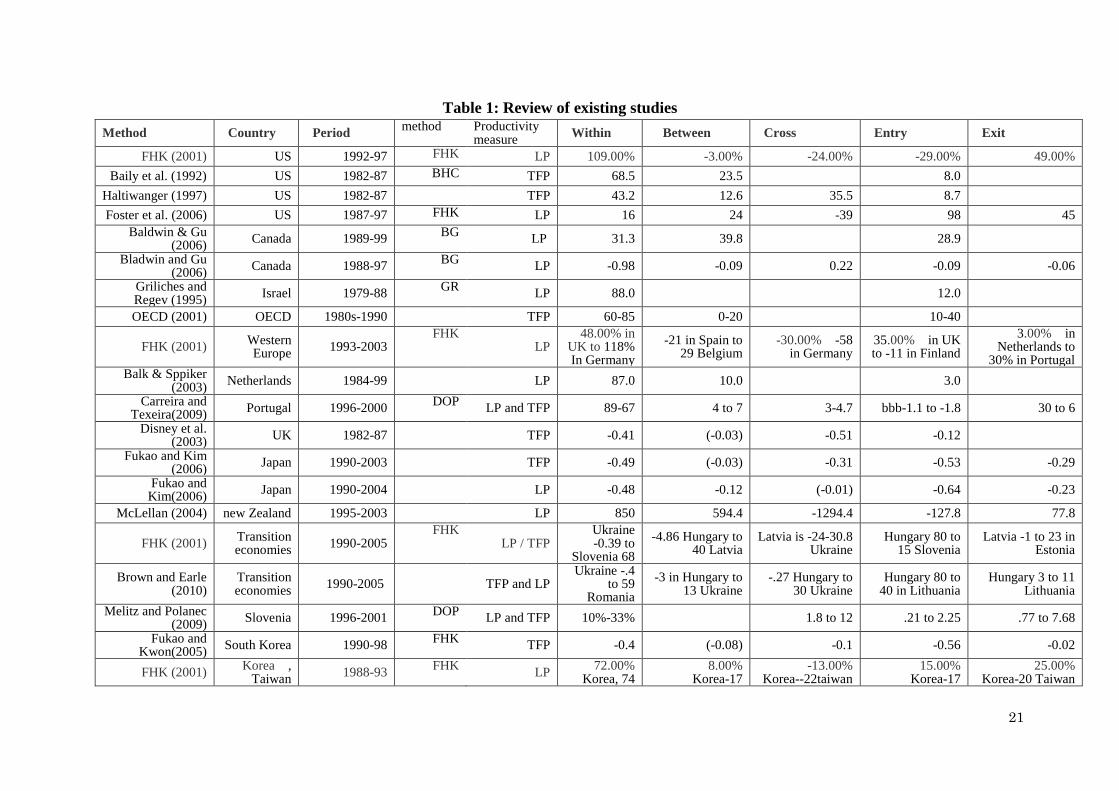
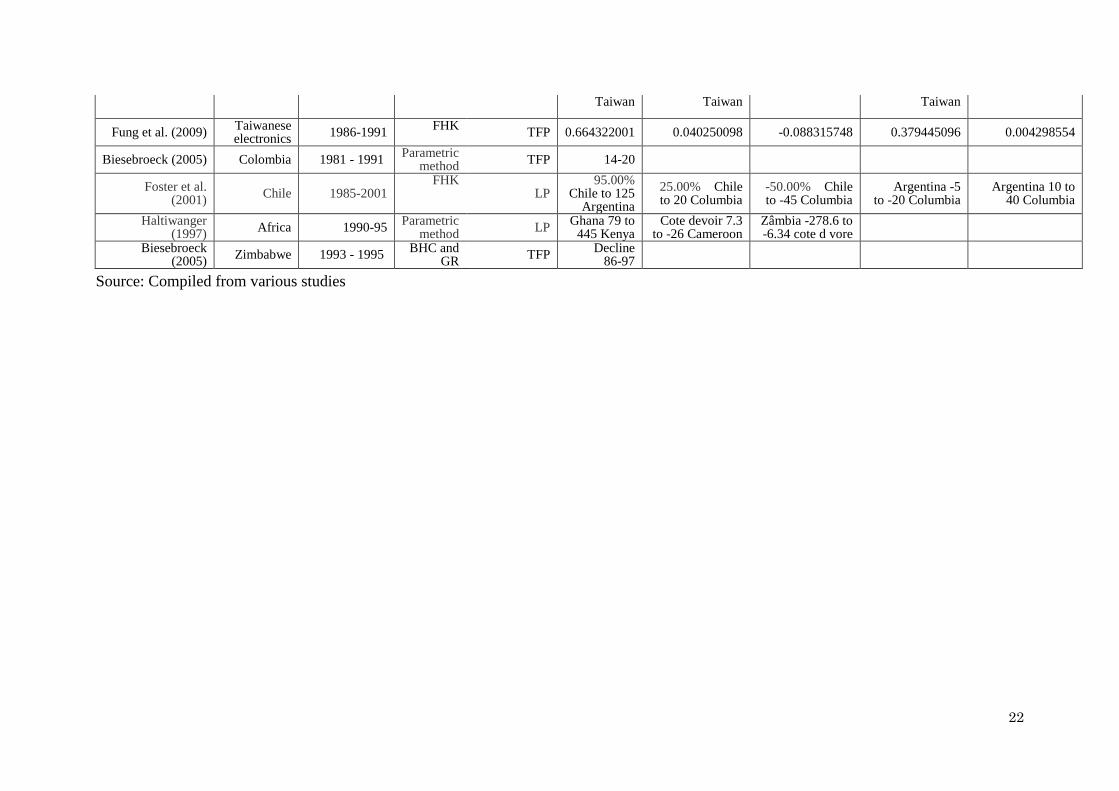
developed and developing countries (see also, Kocsis et al. 2009, UNIDO 2009). Table 1
presents the findings and methodologies adopted by the existing studies. It may be
observed that decomposition analysis is highly affected by the methodology used, weights
assigned and whether labour productivity or TFP is used. The methodology of Foster et al.
(2001) For instance, attributes 0.3447 for surviving firms, 0.0990 to entrants and 0.0596 to
exiting firms in Slovenian productivity growth for 1997-2001. But Melitz and Polanec
(2009) used a dynamic Olley Pakes decomposition and found significantly higher overall
contribution of surviving firms (0.4490) and a negative contribution of entering firms
(-0.0225). Even the same methodology with different weights and different measures of
productivity can produce remarkably different results. For instance, Foster et al. (2001) find
the contribution of reallocation to be -30% in Germany for the period 1993-2003 when they
weight labour productivity by labour. It turns positive and as large as over 58% if they
replace labour by output as weight in the measurement of labour productivity.
Notwithstanding the differences in the actual numbers, some interesting patterns emerged.
Except in a few industries, new entrants do not account for large contribution to
productivity growth in developed countries. Within-firm effects turn out to be rather
large. Since these reflects firms’ own innovation activities one may expect that they
will dominate productivity growth in advanced countries as these countries have a
human capital base and resources for research and development. Another reason for
why this may be the case is that incumbent firms are under a constant threat of entry.
20
They have to adopt the escape entry route to survive the threat. They enjoy the
relative advantage of size and experience and hence manage to keep the entry effects
small. Within effects are rather large in the least developed countries (Haltiwanger
1997) also, but for very different reasons. In these economies other effects are
negative and therefore if productivity growth occurs, it is due to firms’ own
initiatives.
In transition and fast growing economies entry effects become important along with
the with-in effects. Other effects are not very significant. The structural change
process may emerge in the long run in these economies when new firms grow larger.
Fast growing economies of Taiwan and Korea exhibit similar patterns.
21
Table 1: Review of existing studies
Method Country Period method Productivity
measure Within Between Cross Entry Exit
FHK (2001) US 1992-97 FHK LP 109.00% -3.00% -24.00% -29.00% 49.00%
Baily et al. (1992) US 1982-87 BHC TFP 68.5 23.5 8.0
Haltiwanger (1997) US 1982-87 TFP 43.2 12.6 35.5 8.7
Foster et al. (2006) US 1987-97 FHK LP 16 24 -39 98 45
Baldwin & Gu (2006)
Canada 1989-99 BG
LP 31.3 39.8 28.9
Bladwin and Gu (2006)
Canada 1988-97 BG
LP -0.98 -0.09 0.22 -0.09 -0.06
Griliches and Regev (1995)
Israel 1979-88 GR
LP 88.0 12.0
OECD (2001) OECD 1980s-1990 TFP 60-85 0-20 10-40
FHK (2001) Western Europe
1993-2003 FHK
LP 48.00% in
UK to 118% In Germany
-21 in Spain to 29 Belgium
-30.00% -58 in Germany
35.00% in UK to -11 in Finland
3.00% in Netherlands to
30% in Portugal Balk & Sppiker
(2003) Netherlands 1984-99
LP 87.0 10.0 3.0
Carreira and Texeira(2009)
Portugal 1996-2000 DOP
LP and TFP 89-67 4 to 7 3-4.7 bbb-1.1 to -1.8 30 to 6
Disney et al. (2003)
UK 1982-87
TFP -0.41 (-0.03) -0.51 -0.12
Fukao and Kim (2006)
Japan 1990-2003
TFP -0.49 (-0.03) -0.31 -0.53 -0.29
Fukao and Kim(2006)
Japan 1990-2004
LP -0.48 -0.12 (-0.01) -0.64 -0.23
McLellan (2004) new Zealand 1995-2003 LP 850 594.4 -1294.4 -127.8 77.8
FHK (2001) Transition economies
1990-2005 FHK
LP / TFP Ukraine -0.39 to
Slovenia 68
-4.86 Hungary to 40 Latvia
Latvia is -24-30.8 Ukraine
Hungary 80 to 15 Slovenia
Latvia -1 to 23 in Estonia
Brown and Earle (2010)
Transition economies
1990-2005
TFP and LP Ukraine -.4
to 59 Romania
-3 in Hungary to 13 Ukraine
-.27 Hungary to 30 Ukraine
Hungary 80 to 40 in Lithuania
Hungary 3 to 11 Lithuania
Melitz and Polanec (2009)
Slovenia 1996-2001 DOP
LP and TFP 10%-33% 1.8 to 12 .21 to 2.25 .77 to 7.68
Fukao and Kwon(2005)
South Korea 1990-98 FHK
TFP -0.4 (-0.08) -0.1 -0.56 -0.02
FHK (2001) Korea ,
Taiwan 1988-93
FHK LP
72.00% Korea, 74
8.00% Korea-17
-13.00% Korea--22taiwan
15.00% Korea-17
25.00% Korea-20 Taiwan
22
Taiwan Taiwan Taiwan
Fung et al. (2009) Taiwanese electronics
1986-1991 FHK
TFP 0.664322001 0.040250098 -0.088315748 0.379445096 0.004298554
Biesebroeck (2005) Colombia 1981 - 1991 Parametric
method TFP 14-20
Foster et al. (2001)
Chile 1985-2001 FHK
LP 95.00%
Chile to 125 Argentina
25.00% Chile to 20 Columbia
-50.00% Chile to -45 Columbia
Argentina -5 to -20 Columbia
Argentina 10 to 40 Columbia
Haltiwanger (1997)
Africa 1990-95 Parametric
method LP
Ghana 79 to 445 Kenya
Cote devoir 7.3 to -26 Cameroon
Zâmbia -278.6 to -6.34 cote d vore
Biesebroeck (2005)
Zimbabwe 1993 - 1995 BHC and
GR TFP
Decline 86-97
Source: Compiled from various studies
23
6. Methodology and database: The present study
This study aims to analyse the effects of entry on macro productivity growth in Indian
manufacturing for the period 2000-2006. In what follows we discuss the methodology
adopted for the analysis.
Decomposition methodologies: As stated above, the size of different components of
aggregate productivity decompositions depends on the choice of the method of
decomposition. For this reason we use three decomposition methodologies to analyse the
impact of entry ( and exit) on productivity in India during 2000-01 to 2005-06. These are: GR
(1995), FHK (2001), and DOP (2009). The results will be analysed in a comparative
analytical framework to check the robustness of results.
Productivity measure: The most frequently applied measures of productivity are : labour
productivity (LP) and total-factor productivity (TFP). As the latter accounts for the distinct
effects of capital/labour inputs together with technological progress, it is often seen as
favourable. However, due to the lack of proper capital stocks at micro level, it is not possible
sometimes to measure total factor productivity. Therefore, the “second best” measure i.e.
labour productivity is employed in several studies. Haltiwanger (1997) argues that the
measurement of labour productivity (particularly on a gross output basis) is less fraught with
measurement problems than measures of total factor productivity (TFP). Thus the risk of
error measurement is lower in this case. The present study also uses labour productivity for
the analysis. The industry level productivity is measured as a weighted average of plant level
productivity. It is defined as:
At ≡ ∑ θf,t
nt
f
(GVA
L)f,t
24
Weight (𝛉): Different parameters have been used as weights in the existing literature. These
are: share of revenue, output, labour, value added, or costs. Foster et al. (2008) assert that the
choice of weight is “an open question”. The most common choices are either output (or
revenue) weight or employment weight. Following the traditional literature, we have used
‘output’ weight in the present study.
Real Gross Value Added (GVA): We obtain GVA using double-deflation method as follows:
GVA= (gross value of output)/(wholesale price index)-(total input)/(input price index).
Gross value of output (GVO) is deflated by the wholesale price index while inputs are
deflated by the input price index. The input price index is constructed as the weighted
average of fuel price, material price, and other input prices. Fuel price, material price and
other input prices are constructed using wholesale prices, implicit deflator of national account
statistics and weights from input-output tables. The data sources we use for constructing input
price index are: Reserve Bank of India, Handbook of Monetary Statistics of India and
Database on Indian Economy; Central Statistical Organisation, Input-Output Transaction
Table.
Labour Input (L): Two indicators of labour are used to measure labour input: the number of
workers, and man-hours of workers. Since the results are not different, we report here only
man-hours based results to avoid multiplicity of results.
Our empirical application is based on plant or ‘‘factory’’ level data for the period 1998-99 to
2005-06, which is collected by the Central Statistical Office of India in the Annual Survey of
Industries (ASI). The primary unit of enumeration in the survey is a factory in the case of
manufacturing industries, and data are based on returns provided by factories. The schedule
25
canvassed is in two parts. Part I aims to collect data on capital structure by type of assets,
work- force by sex and category of workers, wage bill by type of payments, consumption by
broad categories of inputs, output by type of products and by-products etc. Part II aims to
collect data on different aspects of labour statistics, namely, working days, mandays worked,
absenteeism, labour turnover, man-hours worked, earnings and social security benefits. The
present study uses data on various plant level production parameters such as output, sales,
labor, employees, capital, materials and energy.
The ASI factory frame is classified into 2 sectors: the 'census sector' and the 'sample sector'.
The sample sector consists of small plants employing 20 to 99 workers if not using electricity
and 10 to 99 workers if using electricity. The census sector comprises relatively large plants.
It covers all units having 100 or more workers and also some significant units which although
having less than 100 workers, contribute significantly to the value of manufacturing sector's
output.. While the units in the census sector are approached for data collection on a complete
enumeration basis every year, sample sector units are covered on the basis of a well designed
sampling. The present study focuses only on the census sector data for the decomposition
analysis. This is because the productivity decomposition analysis requires a consistent and
exhaustive database to distinguish between continuing firms, entrants and exiters. A
challenge was however posed by changes in the definition of the census sector in the recent
past. For the year 1997-98, 1998-99 and 1999-2000, the census sector was limited only to
factories employing 200 or more workers. From 2000-01 onwards again the factories
employing 100 or more workers are under the census sector. For consistency in the analysis,
we exclude the years prior to 2000-01 from our analysis and focus on the period 2000-01 to
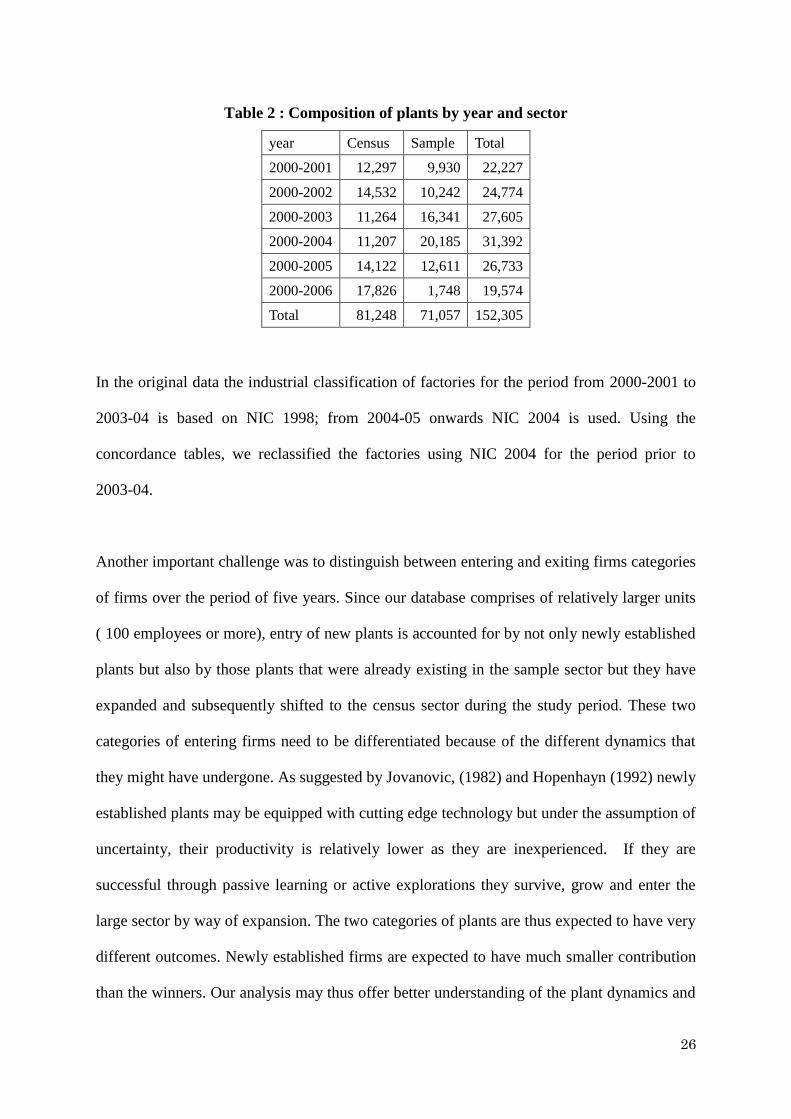
2005-06. The composition and number of plants are summarized in Table 2.
26
Table 2 : Composition of plants by year and sector
year Census Sample Total
2000-2001 12,297 9,930 22,227
2000-2002 14,532 10,242 24,774
2000-2003 11,264 16,341 27,605
2000-2004 11,207 20,185 31,392
2000-2005 14,122 12,611 26,733
2000-2006 17,826 1,748 19,574
Total 81,248 71,057 152,305
In the original data the industrial classification of factories for the period from 2000-2001 to
2003-04 is based on NIC 1998; from 2004-05 onwards NIC 2004 is used. Using the
concordance tables, we reclassified the factories using NIC 2004 for the period prior to
2003-04.
Another important challenge was to distinguish between entering and exiting firms categories
of firms over the period of five years. Since our database comprises of relatively larger units
( 100 employees or more), entry of new plants is accounted for by not only newly established
plants but also by those plants that were already existing in the sample sector but they have
expanded and subsequently shifted to the census sector during the study period. These two
categories of entering firms need to be differentiated because of the different dynamics that
they might have undergone. As suggested by Jovanovic, (1982) and Hopenhayn (1992) newly
established plants may be equipped with cutting edge technology but under the assumption of
uncertainty, their productivity is relatively lower as they are inexperienced. If they are
successful through passive learning or active explorations they survive, grow and enter the
large sector by way of expansion. The two categories of plants are thus expected to have very
different outcomes. Newly established firms are expected to have much smaller contribution
than the winners. Our analysis may thus offer better understanding of the plant dynamics and
27
their effects on productivity. Another form of plant dynamics that we observed in the data
was the phenomenon of switching-in and switching-out of the industrial classification. Some
plants changed their industrial classification during the study period and switched over to
other industrial categories. Separate categories were created for these groups to capture the
effects of their dynamics. Finally, the exiting firm is defined as the firm that stopped
functioning or downsized its operations during the study period. It might not have wound up
it operations due to the tight exit policy but it might have become sick and downsized their
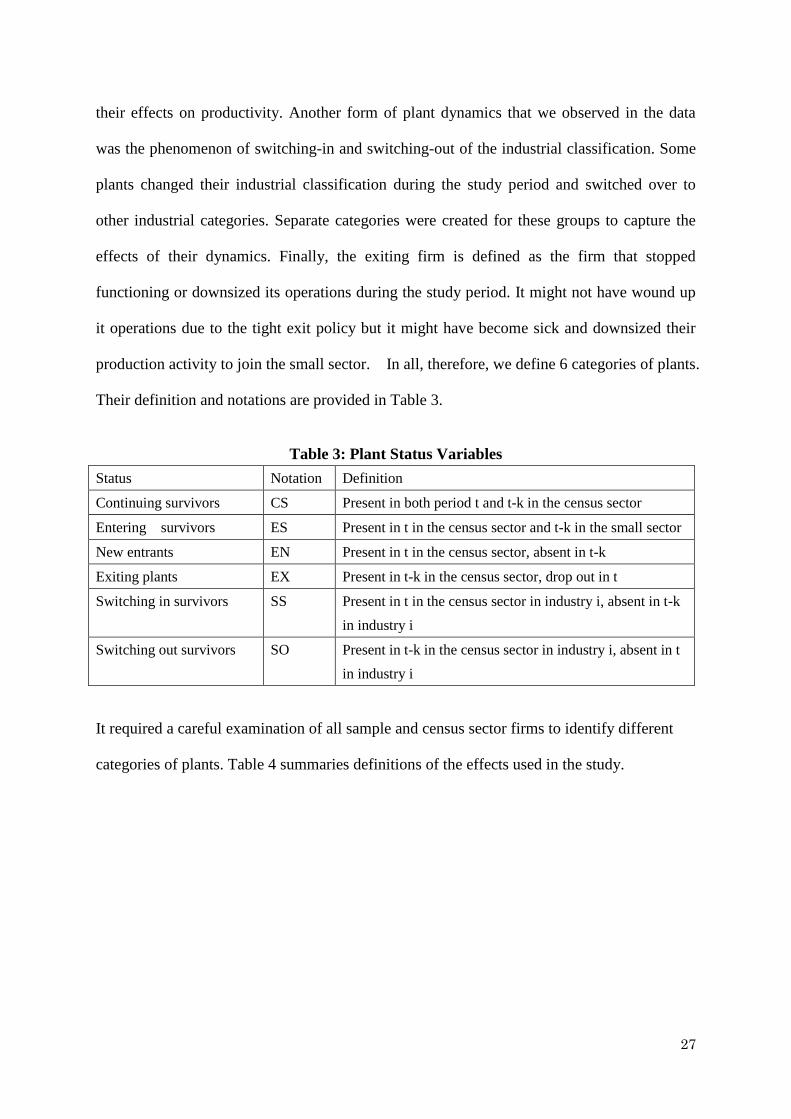
production activity to join the small sector. In all, therefore, we define 6 categories of plants.
Their definition and notations are provided in Table 3.
Table 3: Plant Status Variables
Status Notation Definition
Continuing survivors CS Present in both period t and t-k in the census sector
Entering survivors ES Present in t in the census sector and t-k in the small sector
New entrants EN Present in t in the census sector, absent in t-k
Exiting plants EX Present in t-k in the census sector, drop out in t
Switching in survivors SS Present in t in the census sector in industry i, absent in t-k
in industry i
Switching out survivors SO Present in t-k in the census sector in industry i, absent in t
in industry i
It required a careful examination of all sample and census sector firms to identify different
categories of plants. Table 4 summaries definitions of the effects used in the study.
28
Table 4: Components of productivity decomposition
Effect Definition Clarification
Total entry effect TE= EN+ES+SS Effects of newly entering,
expanding and switching-in firms
Total exit effect TX= EX+SO Effects of exiting, downsizing
and switching-out firms
Net entry effect NE=TE+TX This is the effect of the process
of creative destruction
With-in plant effect Within-effect This signifies the effects of CS
Reallocation effect Between plant effects +
covariance
It shows improvement in
allocative efficiency.
7. Business dynamism in India: 2000-01 to 2005-06
Our data set covers plants in both, the cross-sectional and time series dimensions. We
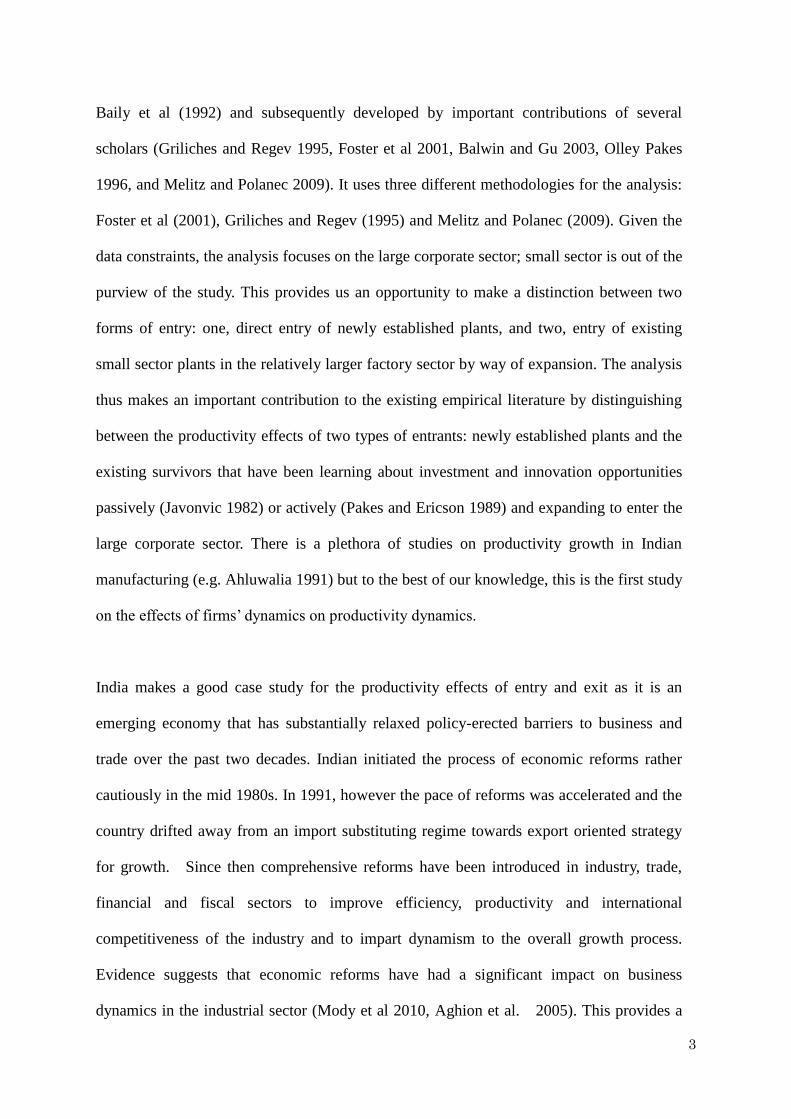
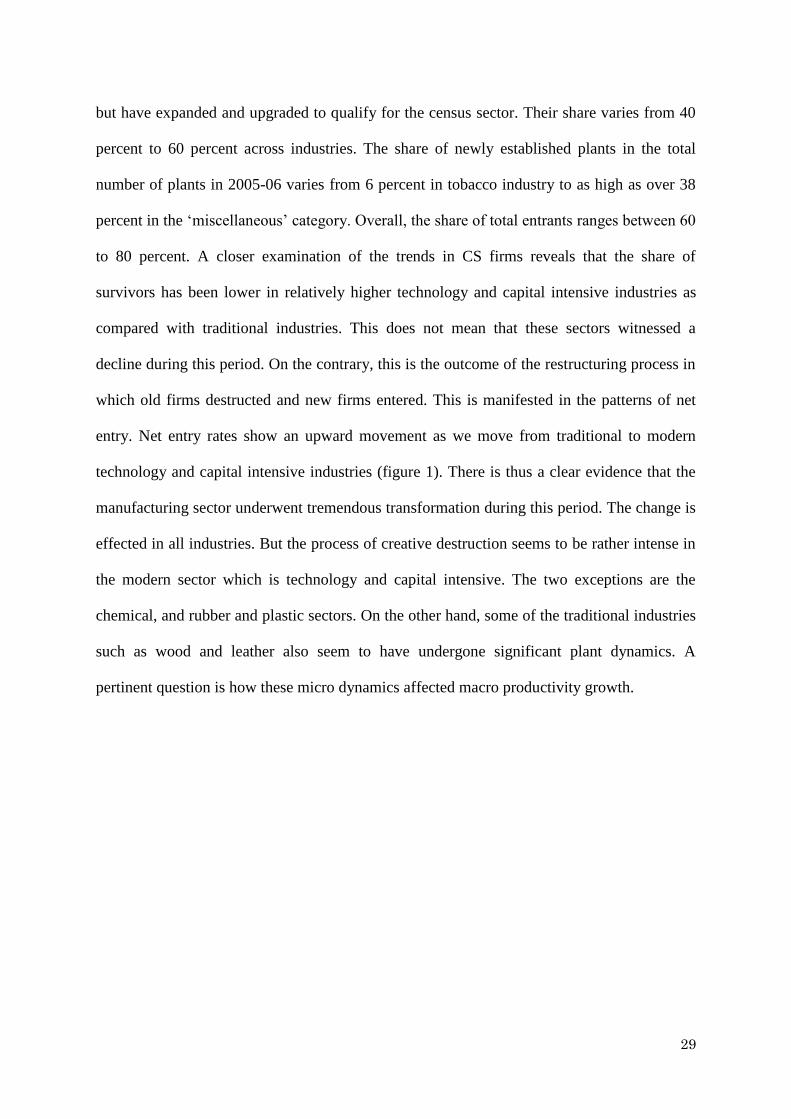
therefore identified firms’ dynamics during 2000-1 to 2005-06. Figure 1 presents a
comprehensive picture of plant dynamics during 2000-01 to 2005-06 at two digit level. It
must be noted that the industry group 15-21 comprises of traditional industries: food, textile,
apparel, wood and paper. These are matured and least technology intensive industries.
Industries ranging from 23 to 28 are chemical and metal based industries which in general are
medium tech industries requiring large investment. Finally, the classification 29 to 35
pertains to high technology intensive industries. Industry 36 is composed of miscellaneous
industries.
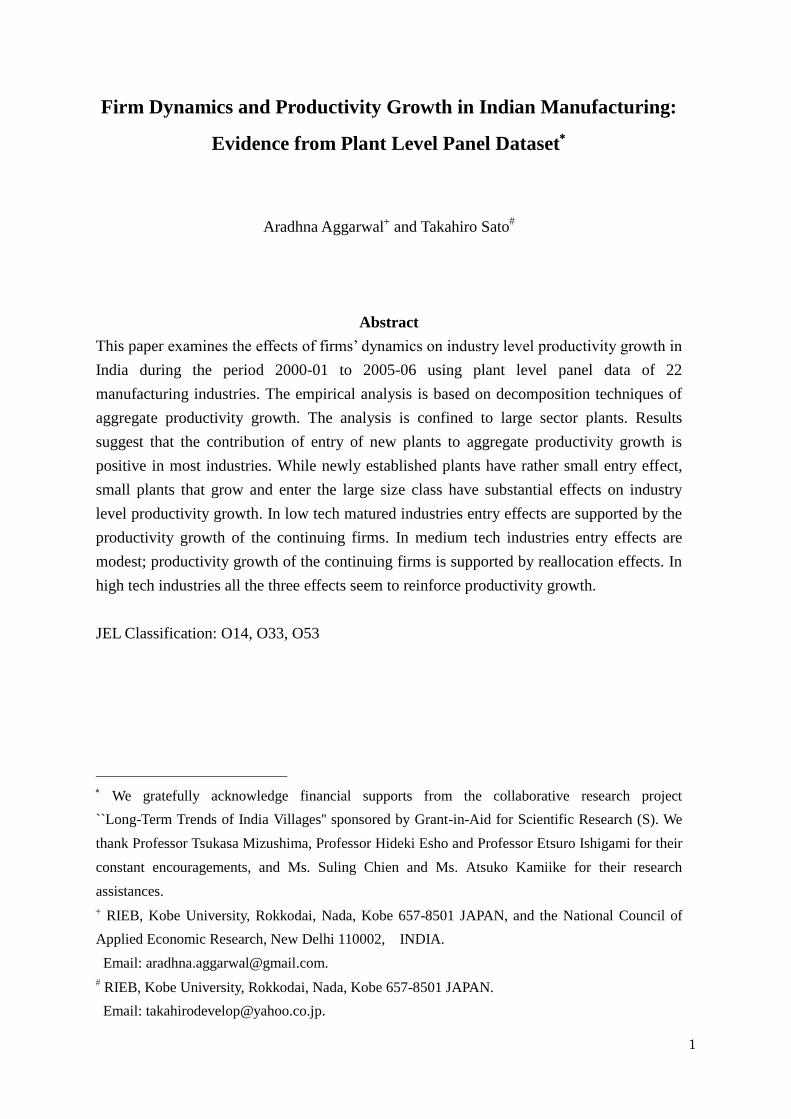
The number of plants increased across all industries without any exception over this period.
Overall, the number of plants in our dataset increased by 45 per cent, from 12,297 in 2000-01
to 17,826 in 20005-06. Of the total 17826 plants, a mere 5802 (32.5 percent) plants are
continuing survivors (CS). The rest are either newly established plants (EN) or entering
survivors (ES). The latter were originally small sized plants classified in the sample sector
29
but have expanded and upgraded to qualify for the census sector. Their share varies from 40
percent to 60 percent across industries. The share of newly established plants in the total
number of plants in 2005-06 varies from 6 percent in tobacco industry to as high as over 38
percent in the ‘miscellaneous’ category. Overall, the share of total entrants ranges between 60
to 80 percent. A closer examination of the trends in CS firms reveals that the share of
survivors has been lower in relatively higher technology and capital intensive industries as
compared with traditional industries. This does not mean that these sectors witnessed a
decline during this period. On the contrary, this is the outcome of the restructuring process in
which old firms destructed and new firms entered. This is manifested in the patterns of net
entry. Net entry rates show an upward movement as we move from traditional to modern
technology and capital intensive industries (figure 1). There is thus a clear evidence that the
manufacturing sector underwent tremendous transformation during this period. The change is
effected in all industries. But the process of creative destruction seems to be rather intense in
the modern sector which is technology and capital intensive. The two exceptions are the
chemical, and rubber and plastic sectors. On the other hand, some of the traditional industries
such as wood and leather also seem to have undergone significant plant dynamics. A
pertinent question is how these micro dynamics affected macro productivity growth.
30
Figure 1: Plant dynamics in Indian manufacturing during 2000-2006 (%)
Note: ``Poly.(net entry)'' represents net entry trend line while ``Ploy.(CS)'' shows the trend line for CS.
0
10
20
30
40
50
60
70
15
16
17
18
19
20
21
22
23
24
25
26
27
28
29
30
31
32
33
34
35
36
Net Entry
CS
EN
ES
Poly.(Net Entry)
Poly.(CS)
31
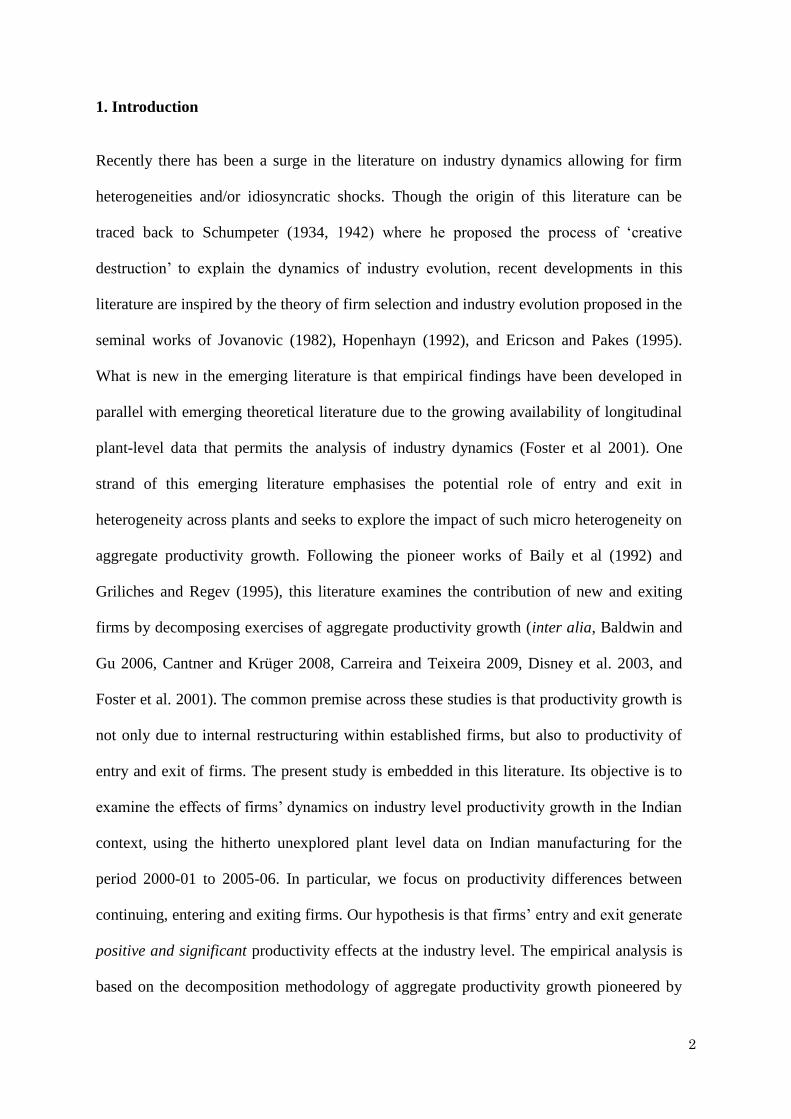
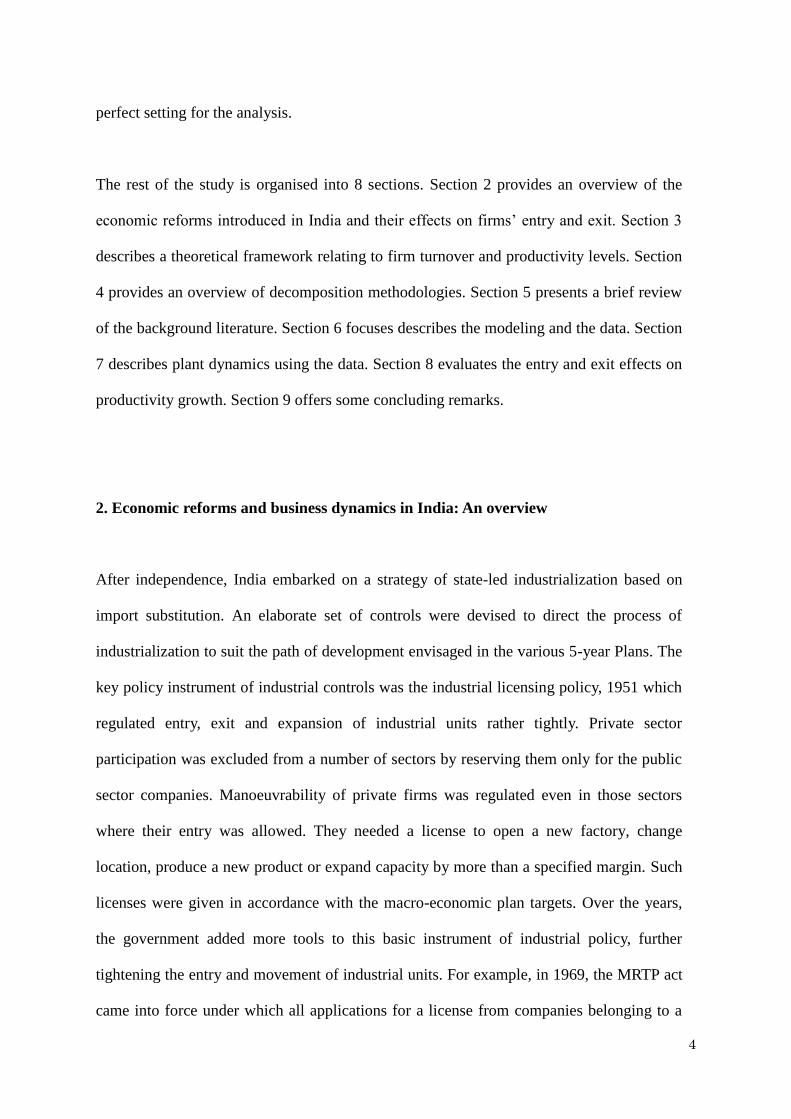
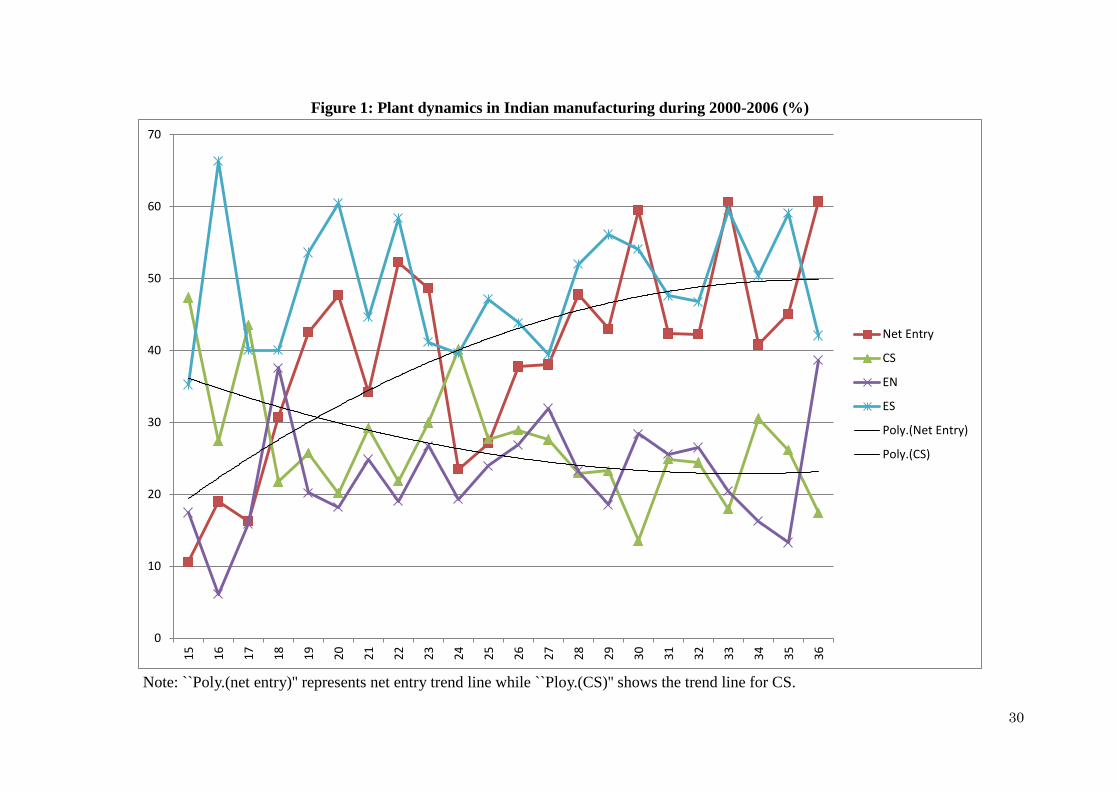
Figure 2 shows the share of plants that exited from our data over this period, by industry. As
stated above, exiting plants either closed their business down or reduced the scale of their
operation such that they were reclassified in the small sector. It shows that 50 to 60 percent of
the plants functional in 2000-01 stopped functioning by 2005-06. Over all, of the 12297
plants operational in 2000-01, only 5982 (48.6 percent) survived by 2005-06 while the rest
6315 (over 51.4 percent) exited. The distribution of these plants is fairly uniform across
industries. However, some of the traditional industries such as tobacco, apparel, leather and
wood industries witnessed a rather high rate of firms’ exit ranging from 60 to 70 percent. On
the other hand, technology intensive electronics machinery, instruments, motor vehicle and
transport equipment industries had an exit rate ranging between 50 to 60 percent. Petroleum
and coke, chemicals and transport (including auto) industries have experienced the lowest
exit rates but it also varied between 40 to 50 percent. Thus there have been significant
business dynamics taking place in the economy, in which the plant casualty rates are rather
high. It is therefore important to have a well designed exit policy to facilitate their exit.
Figure 2: Share of firms exiting plants in the post 2000-01 by industry period (%)
0
10
20
30
40
50
60
70
80
15 16 17 18 19 20 21 22 23 24 25 26 27 28 29 30 31 32 33 34 35 36
32
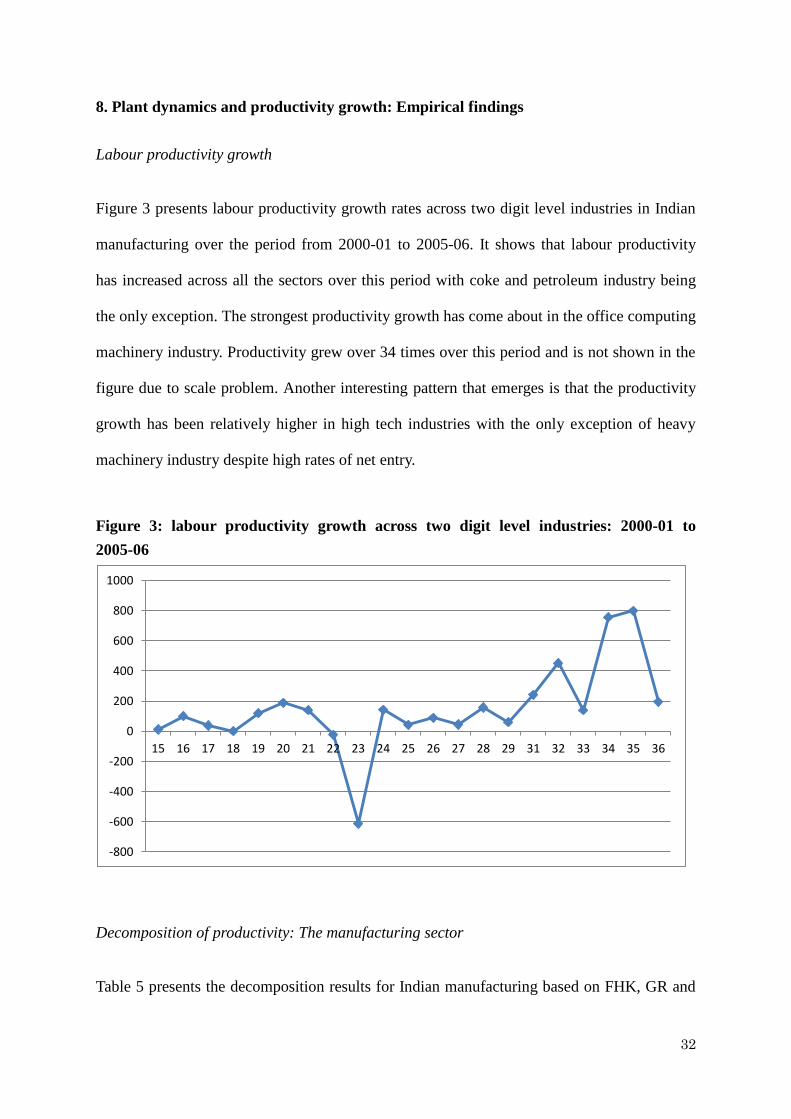
8. Plant dynamics and productivity growth: Empirical findings
Labour productivity growth
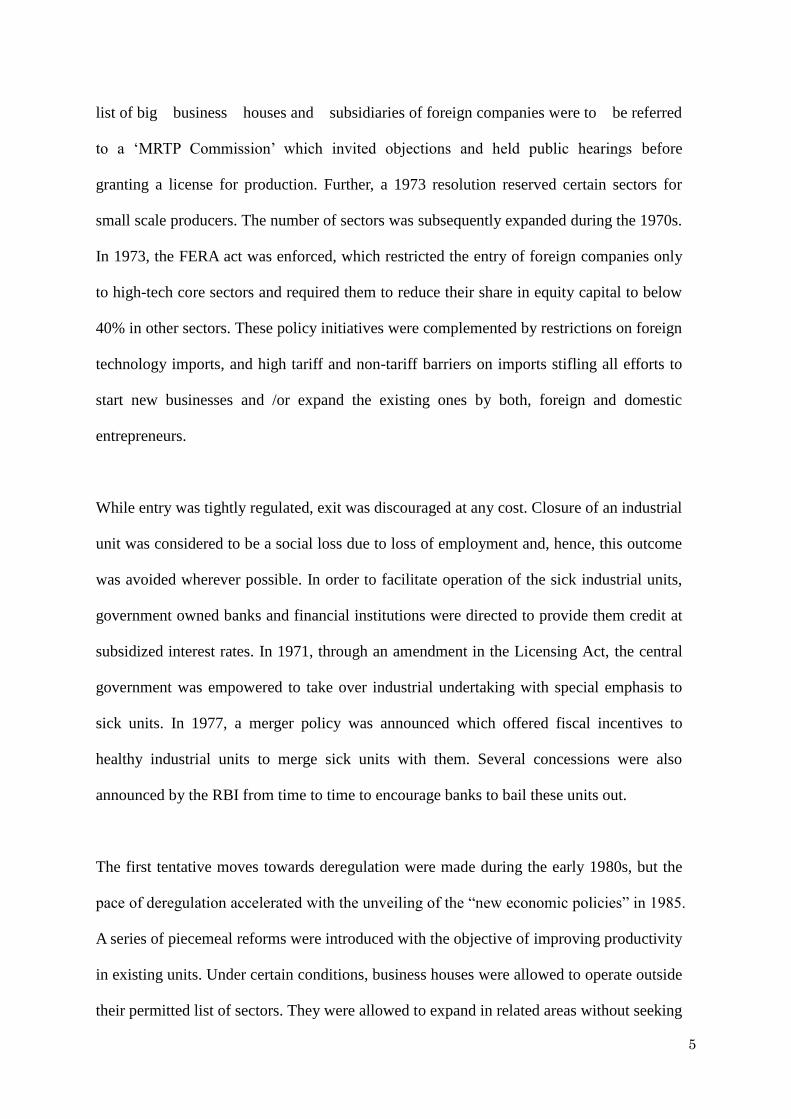
Figure 3 presents labour productivity growth rates across two digit level industries in Indian
manufacturing over the period from 2000-01 to 2005-06. It shows that labour productivity
has increased across all the sectors over this period with coke and petroleum industry being
the only exception. The strongest productivity growth has come about in the office computing
machinery industry. Productivity grew over 34 times over this period and is not shown in the
figure due to scale problem. Another interesting pattern that emerges is that the productivity
growth has been relatively higher in high tech industries with the only exception of heavy
machinery industry despite high rates of net entry.
Figure 3: labour productivity growth across two digit level industries: 2000-01 to
2005-06
Decomposition of productivity: The manufacturing sector
Table 5 presents the decomposition results for Indian manufacturing based on FHK, GR and
-800
-600
-400
-200
0
200
400
600
800
1000
15 16 17 18 19 20 21 22 23 24 25 26 27 28 29 31 32 33 34 35 36
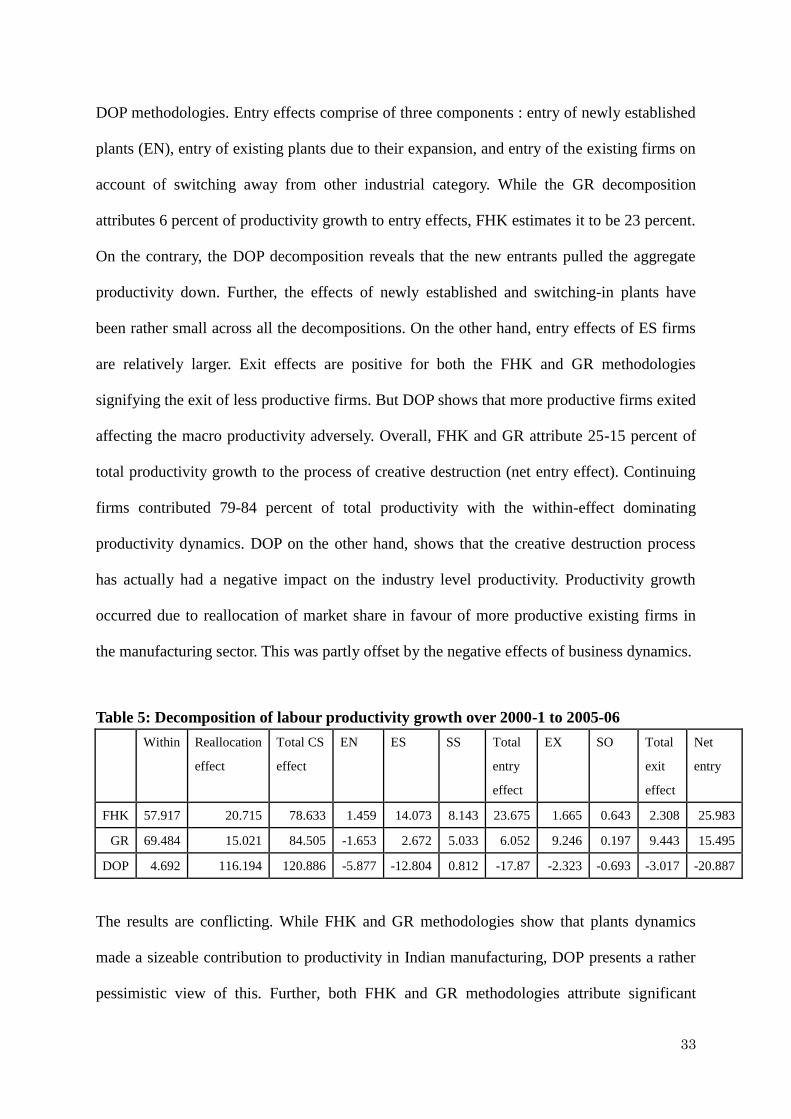
33
DOP methodologies. Entry effects comprise of three components : entry of newly established
plants (EN), entry of existing plants due to their expansion, and entry of the existing firms on
account of switching away from other industrial category. While the GR decomposition
attributes 6 percent of productivity growth to entry effects, FHK estimates it to be 23 percent.
On the contrary, the DOP decomposition reveals that the new entrants pulled the aggregate
productivity down. Further, the effects of newly established and switching-in plants have
been rather small across all the decompositions. On the other hand, entry effects of ES firms
are relatively larger. Exit effects are positive for both the FHK and GR methodologies
signifying the exit of less productive firms. But DOP shows that more productive firms exited
affecting the macro productivity adversely. Overall, FHK and GR attribute 25-15 percent of
total productivity growth to the process of creative destruction (net entry effect). Continuing
firms contributed 79-84 percent of total productivity with the within-effect dominating
productivity dynamics. DOP on the other hand, shows that the creative destruction process
has actually had a negative impact on the industry level productivity. Productivity growth
occurred due to reallocation of market share in favour of more productive existing firms in
the manufacturing sector. This was partly offset by the negative effects of business dynamics.
Table 5: Decomposition of labour productivity growth over 2000-1 to 2005-06
Within Reallocation
effect
Total CS
effect
EN ES SS Total
entry
effect
EX SO Total
exit
effect
Net
entry
FHK 57.917 20.715 78.633 1.459 14.073 8.143 23.675 1.665 0.643 2.308 25.983
GR 69.484 15.021 84.505 -1.653 2.672 5.033 6.052 9.246 0.197 9.443 15.495
DOP 4.692 116.194 120.886 -5.877 -12.804 0.812 -17.87 -2.323 -0.693 -3.017 -20.887
The results are conflicting. While FHK and GR methodologies show that plants dynamics
made a sizeable contribution to productivity in Indian manufacturing, DOP presents a rather
pessimistic view of this. Further, both FHK and GR methodologies attribute significant
34
productivity growth to within-plant efforts. The DOP methodology suggests that this was
due to structural change in manufacturing in which the market share of more productive firms
increased. Melitz and Polanec (2009: 9-10) recognize the possibility of conflicting results and
argue that the gap between DOP and other methodologies increases with the speed of
productivity improvements of surviving plants, the productivity advantage of surviving plants
over entering and exiting plants and the difference between market shares of entering and
exiting plants. In short, productivity growth and industry structure matter. Since these
characteristics vary widely across industries, a more disaggregated analysis is required.
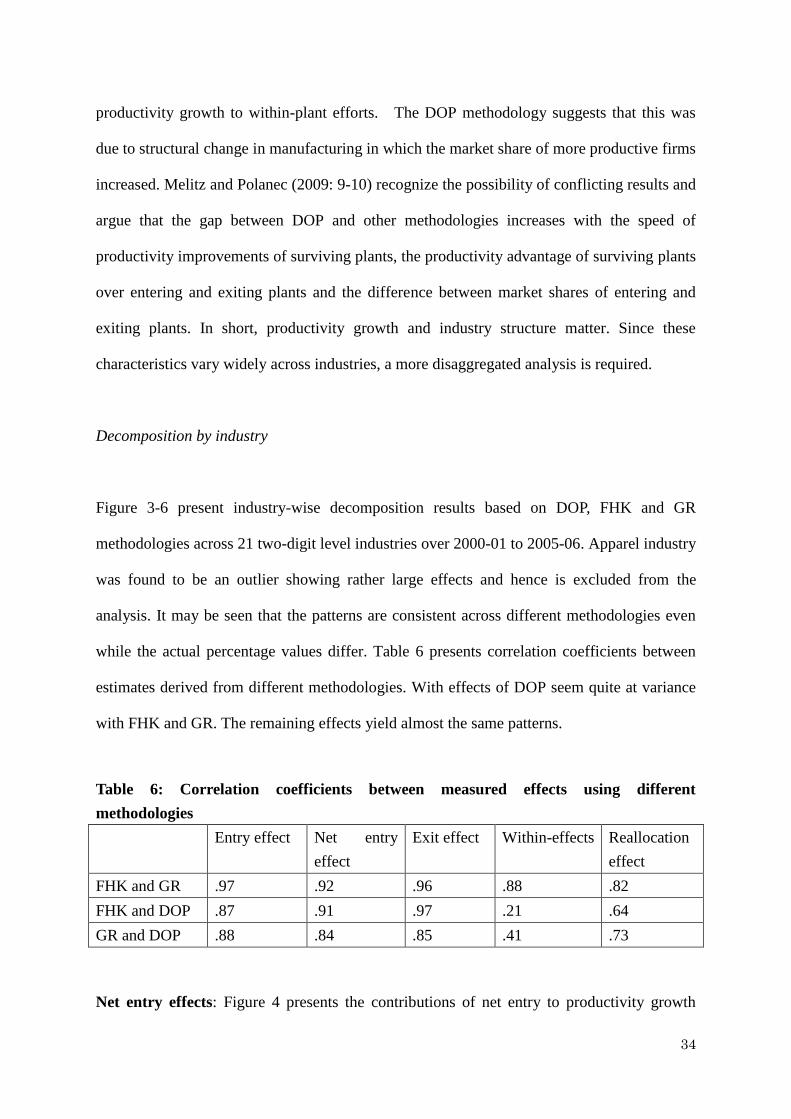
Decomposition by industry
Figure 3-6 present industry-wise decomposition results based on DOP, FHK and GR
methodologies across 21 two-digit level industries over 2000-01 to 2005-06. Apparel industry
was found to be an outlier showing rather large effects and hence is excluded from the
analysis. It may be seen that the patterns are consistent across different methodologies even
while the actual percentage values differ. Table 6 presents correlation coefficients between
estimates derived from different methodologies. With effects of DOP seem quite at variance
with FHK and GR. The remaining effects yield almost the same patterns.
Table 6: Correlation coefficients between measured effects using different
methodologies
Entry effect Net entry
effect
Exit effect Within-effects Reallocation
effect
FHK and GR .97 .92 .96 .88 .82
FHK and DOP .87 .91 .97 .21 .64
GR and DOP .88 .84 .85 .41 .73
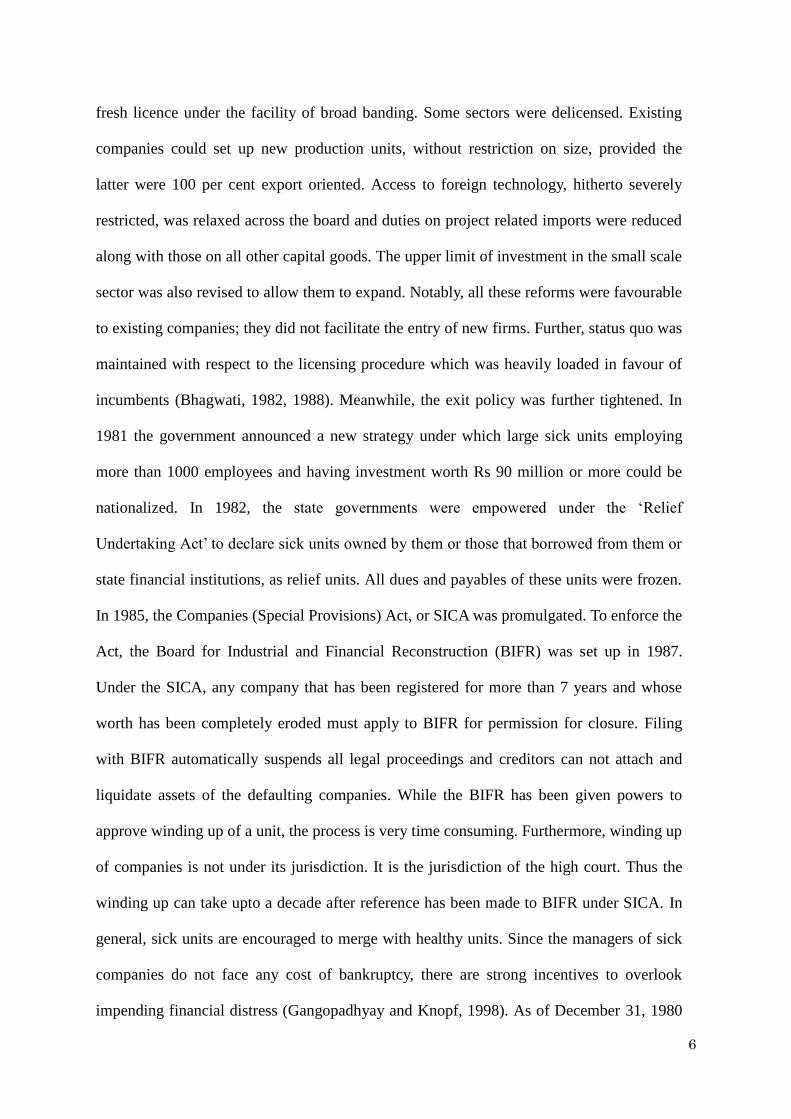
Net entry effects: Figure 4 presents the contributions of net entry to productivity growth

35
based on FHK, GR, and DOP methodologies. It may be observed that DOP methodology
yields consistently smaller net entry effect. Three observations may be made. One, the
contribution of plant dynamics to labour productivity growth has been quite substantial
accounting for between -99 per cent to 250 per cent of productivity growth. Two, in most
cases it is positive.
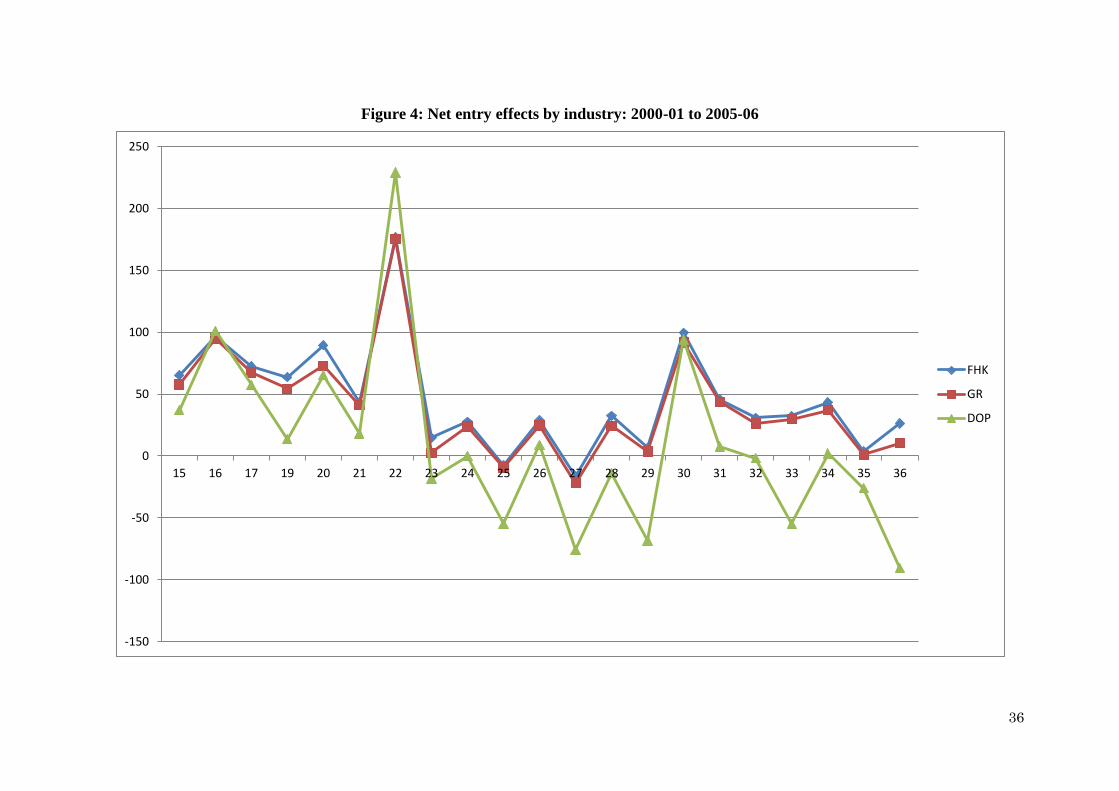
36
Figure 4: Net entry effects by industry: 2000-01 to 2005-06
-150
-100
-50
0
50
100
150
200
250
15 16 17 19 20 21 22 23 24 25 26 27 28 29 30 31 32 33 34 35 36
FHK
GR
DOP

37
Rubber and plastics, and basic metals are the only two industries where it is consistently
negative across all methodologies. Three, the process of creative destruction seems to have
contributed most prominently to labour productivity in traditional industries. This could be
because these industries are not scale, technology or capital intensive. Knowledge is diffused
in the economy. New plants can therefore compete more effectively with incumbents. This is
however in contradiction with the predictions of Aghion et al. (2009) and Geroski (1995).
They predict small entry effects in technologically laggard and matured industries
respectively due to escape entry reaction by incumbents. While the patterns of entry effects
do not conform to the theoretical predictions, they are not quite in line even with the
empirical findings of Bartelsman et al. (2009). In their study of 15 developing and developed
countries, they have found a strong positive effect of new firms in medium high tech
industries; in low tech industries it is modest or even negative. On the contrary our results
show strong positive effects of entry in low and high tech industries. In medium low tech
industries these effects are modest.
But consistent with the theoretical predictions, high tech industry group (29-34) also exhibit
substantial net entry effects. Net entry effects are smaller in this group as compared with the
traditional industries and range between 30 to over 99 percent. In heavy machinery industry
(29) and transport equipments (35) however these effects are rather small. The results for
industry 33 (precision instruments) are somewhat conflicting between FHK and GR on the
one hand and DOP on the other. Finally, the net entry effect is modest in medium technology
intensive industries. While chemical, metal based and non metallic industries seem to have
been benefitted by plant dynamics, other industries remained unaffected or were affected
adversely.
38
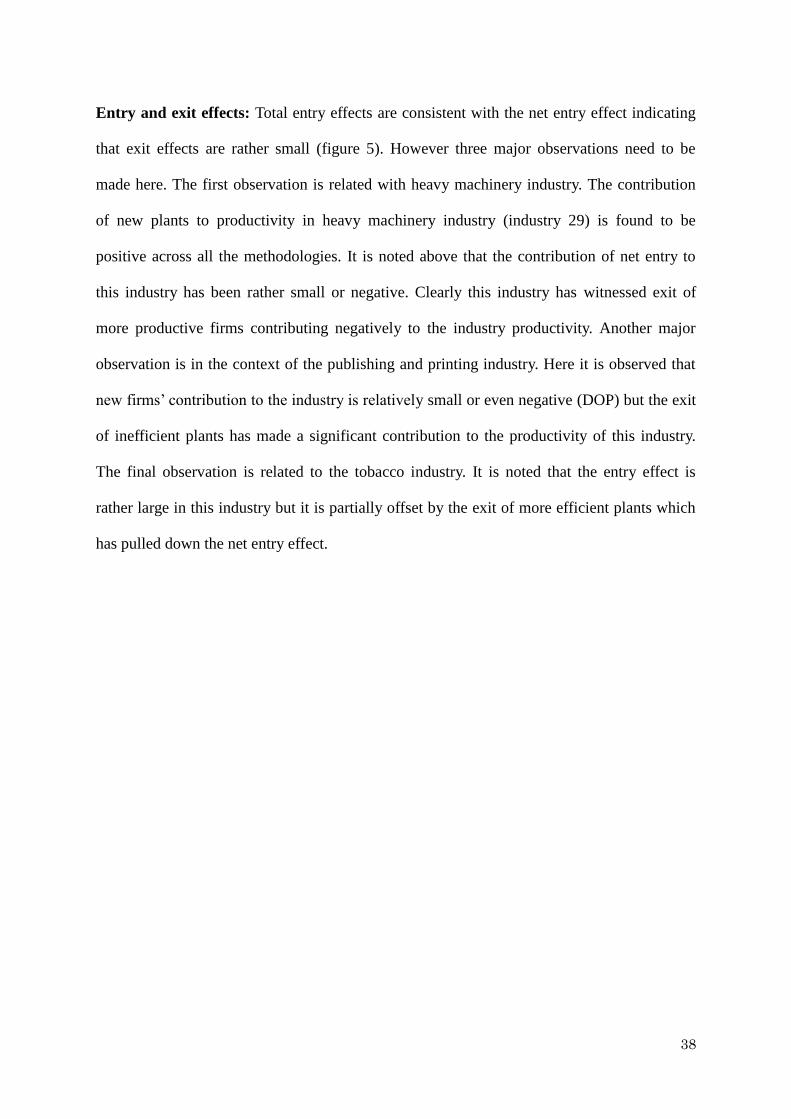
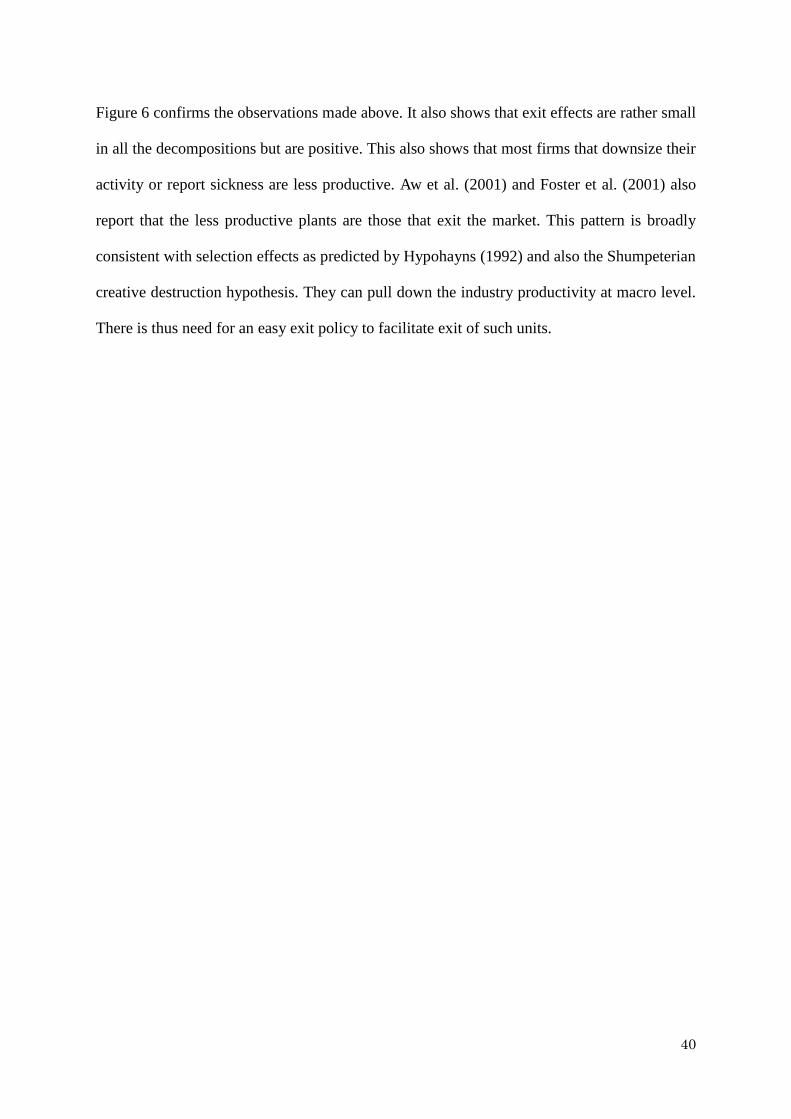
Entry and exit effects: Total entry effects are consistent with the net entry effect indicating
that exit effects are rather small (figure 5). However three major observations need to be
made here. The first observation is related with heavy machinery industry. The contribution
of new plants to productivity in heavy machinery industry (industry 29) is found to be
positive across all the methodologies. It is noted above that the contribution of net entry to
this industry has been rather small or negative. Clearly this industry has witnessed exit of
more productive firms contributing negatively to the industry productivity. Another major
observation is in the context of the publishing and printing industry. Here it is observed that
new firms’ contribution to the industry is relatively small or even negative (DOP) but the exit
of inefficient plants has made a significant contribution to the productivity of this industry.
The final observation is related to the tobacco industry. It is noted that the entry effect is
rather large in this industry but it is partially offset by the exit of more efficient plants which
has pulled down the net entry effect.
39
Figure 5: Total entry effects by industry: 2000-01 to 2005-06
-150
-100
-50
0
50
100
150
200
250
15 16 17 19 20 21 22 23 24 25 26 27 28 29 30 31 32 33 34 35 36
FHK
GR
DOP
40
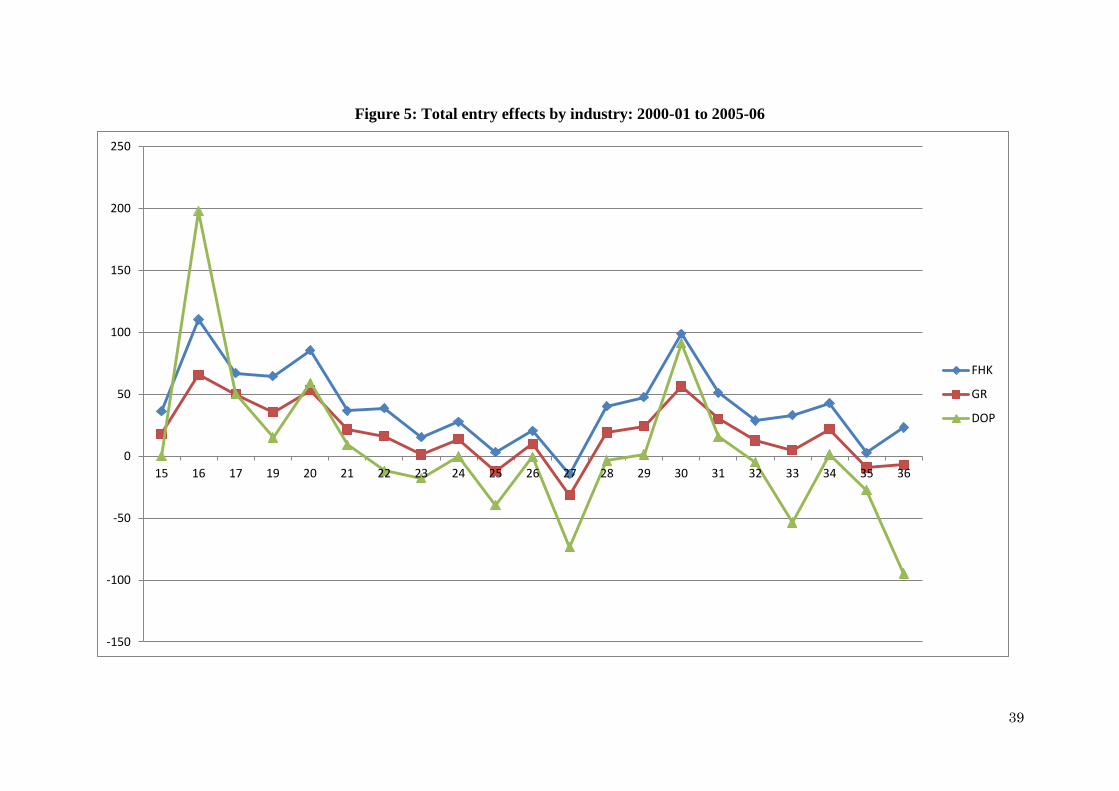
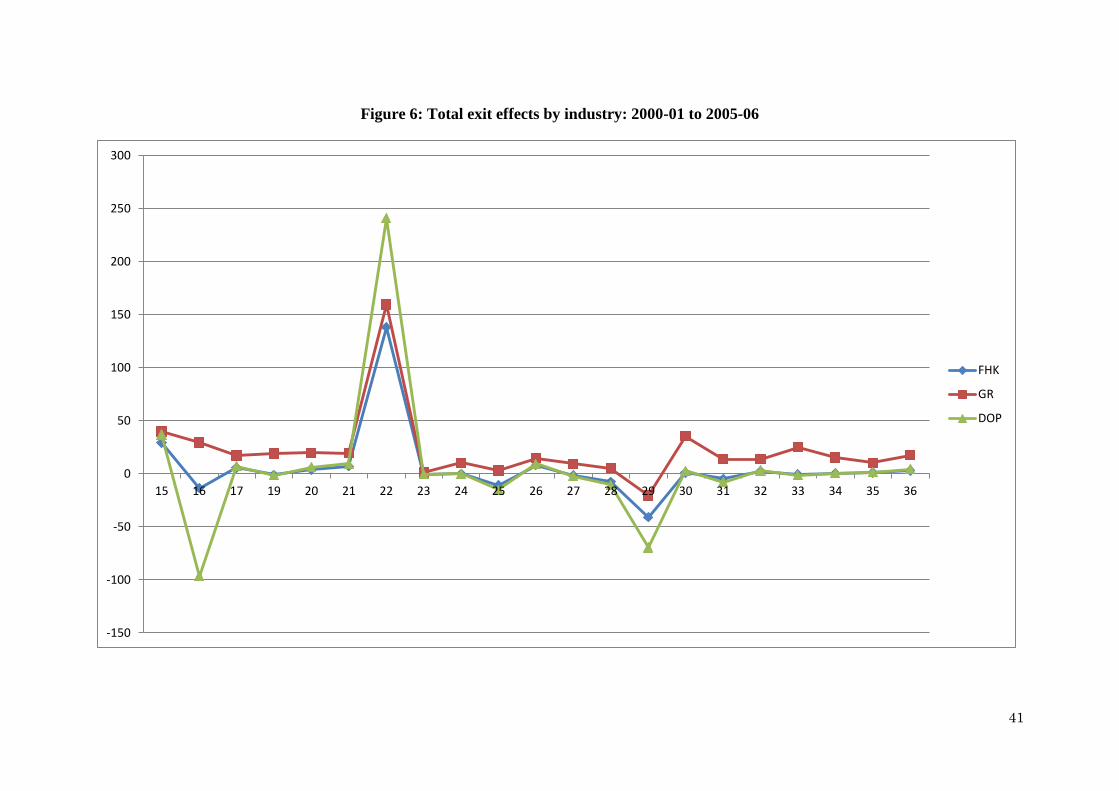
Figure 6 confirms the observations made above. It also shows that exit effects are rather small
in all the decompositions but are positive. This also shows that most firms that downsize their
activity or report sickness are less productive. Aw et al. (2001) and Foster et al. (2001) also
report that the less productive plants are those that exit the market. This pattern is broadly
consistent with selection effects as predicted by Hypohayns (1992) and also the Shumpeterian
creative destruction hypothesis. They can pull down the industry productivity at macro level.
There is thus need for an easy exit policy to facilitate exit of such units.
41
Figure 6: Total exit effects by industry: 2000-01 to 2005-06
-150
-100
-50
0
50
100
150
200
250
300
15 16 17 19 20 21 22 23 24 25 26 27 28 29 30 31 32 33 34 35 36
FHK
GR
DOP

42
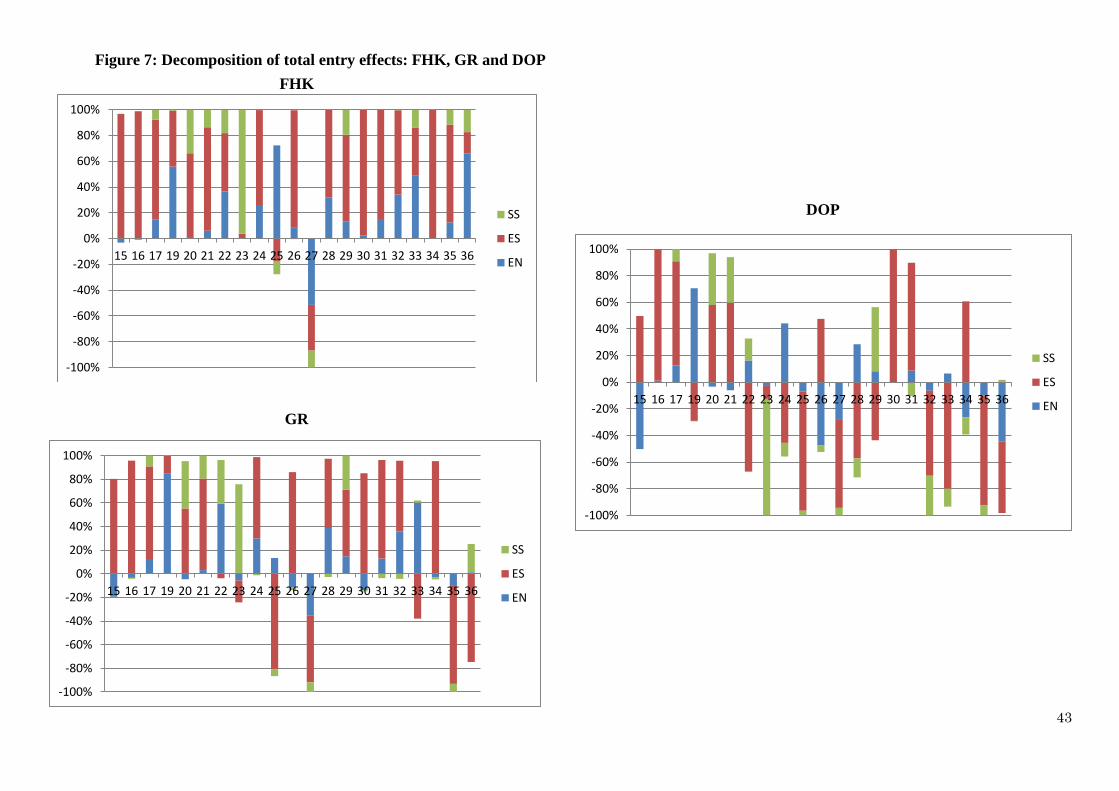
In what follows we present the decomposition of entry effects (figure 7). As expected, the
expanding existing plants (CS) dominate the entry effect in most industries. There are some
exceptions though. For instance, switching-in effects dominate the petroleum and coke
industry. Switching-in effects are also substantial in heavy machinery, wood and paper
industries. There is some evidence of newly established plants making strong effect on
productivity but it remains limited to leather, chemicals and fabricated metals.
43
Figure 7: Decomposition of total entry effects: FHK, GR and DOP
FHK
GR
DOP
-100%
-80%
-60%
-40%
-20%
0%
20%
40%
60%
80%
100%
15 16 17 19 20 21 22 23 24 25 26 27 28 29 30 31 32 33 34 35 36
SS
ES
EN
-100%
-80%
-60%
-40%
-20%
0%
20%
40%
60%
80%
100%
15 16 17 19 20 21 22 23 24 25 26 27 28 29 30 31 32 33 34 35 36
SS
ES
EN
-100%
-80%
-60%
-40%
-20%
0%
20%
40%
60%
80%
100%
15 16 17 19 20 21 22 23 24 25 26 27 28 29 30 31 32 33 34 35 36
SS
ES
EN
44
This provides some support to the passive (or active) learning models which suggest that new
firms are in a learning or exploration phase. Their impact on industry productivity may be
rather small. If they succeed, they survive and grow. Eventually they move to larger size class.
Our results suggest that successful plants make a significant contribution to industry
productivity as they enter the larger size class, even while continuing firms dominate them.
This is further confirmed by Table 7 which shows correlation between entry and different
components of productivity growth. It shows that while new plants have rather small entry
effect, entry of plants that grow and enter the large size class has a large positive correlation
with entry effect. There is thus clear evidence of substantial entry effects of surviving
entering firms in India. But the entry of new plants also seems to pose threat to existing plants
and puts pressure on them to improve productivity. Similarly it also leads to reallocation of
resources in the industry. Similar results have been reported by Bartelsman and Doms (2000),
Aw et al. (2001) and Foster et al. (2001), who have interpreted this result as consistent with
selection and learning forces.
Table 7: Correlation coefficients between firm entry and components of productivity
FHK GR DOP FHK GR DOP FHK GR DOP
Effect Within Within Within Reallocation Reallocation Reallocation Entry Entry Entry
EN 0.30 0.32 0.01 0.17 0.36 0.44 -0.43 -0.5 -0.61
ES -0.23 -0.41 -0.4 -0.36 -0.18 -0.22 0.51 0.42 0.46
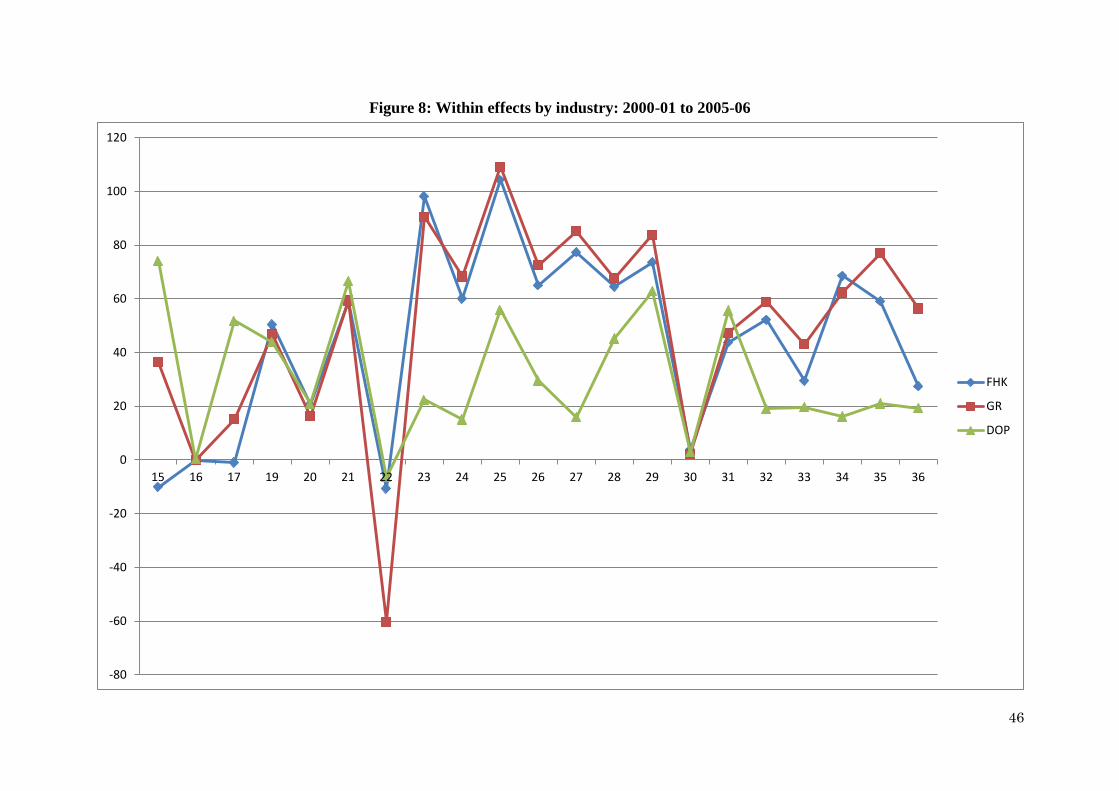
Within effects: As expected, the DOP methodology yields much lower estimates for
within-effects than GR and FHK methodologies. Sometimes they also present conflicting
picture. However, that is by exception than rule in this case. Most results are consistent
(figure 8). Within effects are positive and significant in most cases accounting for upto 100
percent productivity growth (as in rubber and plastic industries). While entry effects are large
in low and high tech industries, within effects are relatively stronger in the medium

45
technology intensive industries.
46
Figure 8: Within effects by industry: 2000-01 to 2005-06
-80
-60
-40
-20
0
20
40
60
80
100
120
15 16 17 19 20 21 22 23 24 25 26 27 28 29 30 31 32 33 34 35 36
FHK
GR
DOP
47
Further, these effects seem to be more modest in the traditional sector than the high tech
sector, if we use FHK and GR methodologies. Theoretically, retooling effects should be larger
in technologically laggard industries where the escape entry should more likely to happen.
Indian manufacturing poses an interesting where within effects are most visible in high tech
industries. In this group however, office computing machinery industry (30) is an exception
case with rather modest within-effect irrespective of the methodology used. This is despite
the fact that it has experienced the highest productivity growth during this period. Over 99
percent of productivity growth in this industry has occurred due to expansion of sample
sector plants which joined the census sector during this period. In publishing and printing
industry also, entry effects are exceptionally large; within effects are therefore insignificant.
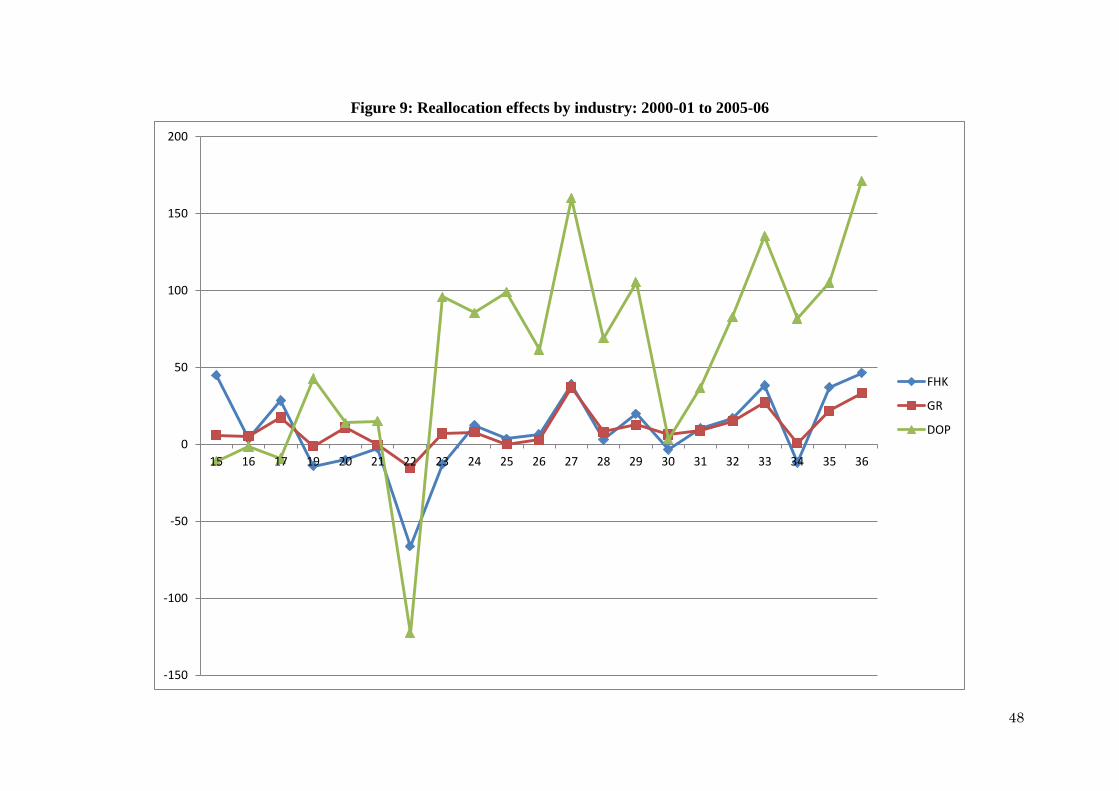
Reallocation effects: Reallocation effects as presented in figure 9 indicate that most
manufacturing industries have been undergoing the process of restructuring from low
productivity to high productivity plants. As expected, reallocation effects are rather large for
the DOP decomposition. There are conflicting results as well. However, one can discern that
reallocation process has initiated in medium and high tech industries but not in low tech
traditional industries. In the last category of industries, entry effects are strong but within
effects are relatively weak. It might take some time for the reallocation process to start taking
shape.
48
Figure 9: Reallocation effects by industry: 2000-01 to 2005-06
-150
-100
-50
0
50
100
150
200
15 16 17 19 20 21 22 23 24 25 26 27 28 29 30 31 32 33 34 35 36
FHK
GR
DOP
49
Apparently, a fast growing economy like India manifests the patterns of both developed
countries as well as transition countries. It also reveals interesting patterns regarding the
impact of firm dynamics in low and high tech industries, which needs to be explored further.
9. Conclusion
In this paper, we use a plant panel data set of Indian manufacturing industries to examine
productivity differences between groups of entering, exiting and continuing plants. To
account for observed heterogeneous productivity, we rely on models of industry dynamics,
which emerged after the seminal works of Jovanvic (1982) and Hopenhayn’s (1992). Our
empirical strategy is to use productivity decomposition methodologies provided in the
literature. Our empirical study reveals some important results that are do not conform to the
theoretical predictions and makes a case for such analyses for fast growing countries like
India. The results can be summarized as follows.
• First, productivity increased substantially across all industries but there are wide
differences in productivity across industries. Second, there is a clear evidence of
creative destruction in the manufacturing sector. Third, the evidence presented
indicates that the productivity growth of incumbent firms dominates the overall
productivity growth. These patterns are consistent to market selection as predicted by
Hopenhayn’s (1992) model. Third, notwithstanding the fact the continuing firms
dominate productivity growth, entry effects are also substantial. This is not quite
consistent with Hopenhayn’s but is more akin to Shumpeterian hypothesis.
Nonetheless, the evidence we find indicates that these effects operate via growing
entrants grows which exhibit high productivity that tends to reach the level of
incumbent firms. This is more in line with Hopenhayn’s theoretical predictions.
50
Fourth, we find entry effects relatively larger in low (and matured) and high tech
industries. These are modest in medium tech industries. These results are not quite in
conformity with the existing literature which predicts entry effects to be significant in
only high tech industries. Fifth, within effects are large in all the industries but they
grow stronger in high tech industries. This is also an interesting pattern which is not
quite expected. Catching up process seems to be faster in high-tech industries. Finally,
there is evidence of reallocation effect taking place in the economy, in particular, in
medium and high tech industries.
In sum, entry effects are supported by within and reallocation effects in Indian
manufacturing. In medium tech industries within effects are supported by reallocation
effects; entry effects are modest. In low tech industries entry and within effects are
relatively strong. In high tech industries all the three effects seem to reinforce
restructuring. Thus the study supports the hypothesis that tremendous business dynamism
is taking place in the economy.
There are two caveats. First, any productivity growth decomposition is only a statistical tool.
It neither provides information about the driving forces behind the contributions of each
component to productivity, nor takes into account the threat of entry. Hence, these tools do
not give clues on the causality between entry/exit and productivity growth and the links in
between (such as innovation). Second, there is a risk of underestimation of the entry effect on
industry productivity growth as the decompositions fail to account for indirect effects of entry
on the productivity of incumbents. As discussed in Section 4, the measured within and
between plant effects could in part be due to entry. But this indirect effect of entry is not
captured in these methodologies. In an analysis of Portugese manufacturing firms for
1996-2000, Carreira and Teixeira (2009) find that the indirect effect of entry is of greater
51
magnitude than the direct one. We plan to explore the indirect effects in the second stage of
this research. However the present analysis provides useful insights on the process of
business dynamism taking place in the economy. This research thus calls for more research in
this area.
References
Aghion, Philippe, Christopher Harris, Peter Howitt, and John Vickers (2001) ``Competition,
Imitation and Growth with Step-by-Step Innovation,'' Review of Economic Studies, Vol. 68,
pp. 467-92.
Aghion, Philippe, Richard Blundell, Rachel Griffith, Peter Howitt, and Susanne Prantl (2009)
``The Effects of Entry on Incumbent Innovation and Productivity,'' Review of Economics and
Statistics, 91(1), pp. 20-32.
Aghion, Philippe, Stephen Redding and Fabrizio Zilibotti (2005) ``Entry Liberalization and
Inequality in Industrial Performance,'' Journal of the European Economic Association, 3(2-3),
pp. 291-302.
Ahluwalia, Isher Judge (1991) Productivity and Growth in Indian Manufacturing, New
Delhi: Oxford University Press.
Alfaro, Laura and Anusha Chari (2009) ``India Transformed? Insights from the Firm Level
1988-2007,'' India Policy Forum, 6.
Aw, Bee Y., Xiaomin Chen, and Mark J. Roberts (2001) ``Firm Level Evidence on
Productivity Differentials and Turnover in Taiwanese Manufacturing,'' Journal of
Development Economics 66, pp. 51–86.
Baily, M. N., C. Hulten and D. Campbell (1992) ``Productivity Dynamics in Manufacturing
Plants,'' Brookings Papers on Economics Activity: Microeconomics, 2, pp. 187-249.
Baldwin John R. and Paul K. Gorecki, (1991) ``Firm Entry and Exit in the Canadian
Manufacturing Sector, 1970-1982,'' Canadian Journal of Economics, 24(2), pp. 300-323.
52
Baldwin John R. and Wulong Gu (2006) ``Plant Turnover and Productivity Growth in
Canadian Manufacturing'' Industrial and Corporate Change, 15 (3), 417-465.
Bartelsman E J, Haltiwanger J C, and Scarpetta S (2009) ``Measuring and Analyzing
Cross-Country Differences in Firm Dynamics,'' in T. Dunne, J.B. Jensen, and M.J. Roberts
(eds.) Producer Dynamics: New Evidence from Micro Data, Chicago: University of Chicago
Press, p. 15-82.
Bartelsman, E. J. and Doms, M. (2000) ``Understanding Productivity: Lessons from
Longitudinal Microdata’, Journal of Economic Literature, 38(3), pp. 569–94.
Bertrand, Mariane, Paras Mehta and Sendhil Mullainathan. 2002. ``Ferreting out Tunneling:
An Application to Indian Business Groups.'' Quarterly Journal of Economics, 117(1), pp.
121-148.
Bhagwati, Jagdish N. (1982) ``Directly Unproductive, Profit-Seeking (DUP) Activities,''
Journal of Political Economy, 90, pp. 988-1002.
Bhagwati, Jagdish N. (1988) ``Export-Promoting Trade Strategies: Issues and Evidence,''
World Bank Research Observer, 3(1), pp. 27-57.
Bhaumik, Sumon K. and Paramita Mukherjee (2002) ``The Indian Banking Sector: A
Commentary,'' in Parthasarathi Banerjee and Frank-Jurgen Richter (eds.) Economic
Institutions in India: Sustainability under Liberalization and Globalization, London:
Palgrave Macmillan.
Bhaumik, Sumon K., Shubhashis Gangopadhyay, and Shagun Krishnan (2009) ``Reforms and
Entry: Some Evidence from the Indian Manufacturing Sector,'' Review of Development
Economics, 13(4), pp. 658–672.
Bhaumik, Sumon K., Shubhashis Gangopadhyay, and Shagun Krishnan (2008) ``Policy,
Economic Federalism, and Product Market Entry: The Indian Experience,'' European Journal
of Development Research, 20, pp. 1-30.
Biesebroec Johannes Van (2005) ``Revisiting Some Productivity Debates'', Paper Presented at
CEPR/IIIS Trinity College Dublin Workshop, on 28 - 29 April 2006.
Brown, J. David, and John S. Earle (2010) ``Startup Growth, Finance, and the Business
53
Environment: Evidence from Universal Firm-Level Data in Eight Economies.'' European
Cooperation in Science and Technology (ECST) Working Paper, January 2010.
Caballero, R. J. and M. L. Hammour (1994) ``The Cleansing Effect of Recessions,'' American
Economic Review, 84, pp. 1350-1368.
Cantner, U., Krüger, J. J. (2008) ``Micro-Heterogeneity and Aggregate Productivity
Development in the German Manufacturing Sector: Results From a Decomposition Exercise,
'' Journal of Evolutionary Economics, 18(2), pp. 119-33.
Carreira and Teixeira (2009) ``Does Schumpeterian Creative Destruction Lead to Higher
Productivity? The Effects of Firms’ Entry,'' Paper presented at the International Schumpeter
Society Conference 2010 on Innovation, Organisation, Sustainability and Crises, Aalborg,
June 21-24, 2010.
Cohen, W. and Klepper, S. (1996) ``A Reprise of Size and R&D,'' Economic Journal, 106, pp.
925-951.
Cooper, Russell, John Haltiwanger and Laura Power (1999), ``Machine Replacement and the
Business Cycle: Lumps and Bumps,'' American Economic Review, 89(4), pp. 921-946.
Das, Deb Kusum (2003) ``Quantifying Trade Barriers: Has Protection Declined Substantially
in Indian Manufacturing?'' ICRIER Working Paper, 105.
Disney, Richard, Jonathan Haskel and Ylva Heden (2003) ``Restructuring and Productivity
Growth in UK Manufacturing,'' Economic Journal, 113(489), pp. 666-694.
Ericson, R., Pakes, A. (1995) ``Markov-Perfect Industry Dynamics: A Framework for
Empirical Work, '' Review of Economic Studies, 62, pp. 53-82.
Falck, O., Heblich, S., Kipar, S. (2009) ``Incumbent Innovation and Domestic Entry,'' Small
Business Economics, DOI: 10.1007/s11187-009-9219-1.
Foster, Lucia, John Haltiwanger and Cornell J Krizan (2001) ``Aggregate Productivity
Growth: Lessons from Microeconomic Evidence’, in C. R. Hulten, E. R. Dean and M. J.
Harper (eds.) New Developments in Productivity Analysis, Chicago: University of Chicago
Press, pp. 303–63.
54
Foster, Lucia, John Haltiwanger, and C.J.Krizan (2006) ``Market Selection, Reallocation, and
Restructuring in the U.S. Retail Trade Sector in the 1990s,'' Review of Economics and
Statistics, 88(4), pp. 748-758.
Fukao, K. and H.U. Kwon (2005) ``Why Did Japan’s TFP Growth Slow Down in the Lost
Decade? An Empirical Analysis Based on Firm-Level Data of Manufacturing Firms,'' RIETI
Discussion Paper Series 05-E-004.
Fukao, Kyoji and Hyeog Ug Kwon (2006), ``Why Did Japan's TFP Growth Slowed Down in
the Lost Decade? An Empirical Analysis Based on Firm-Level Data of Manufacturing Firms,''
Japanese Economic Review, 57(2), pp. 195-228.
Fung, Loretta, Alice Nakamura and Masao Nakamura (2009) ``Business Dynamics and
Productivity Growth with an Application to Taiwanese Electronics Firms,'' Paper Presented at
Comparative Analysis of Enterprise Data 2009 Conference, at Hitotsubashi Memorial Hall,
Tokyo, Japan, October 2-4, 2009.
Gangopadhyay, Shubhashis and John D. Knopf (1998) ``Dividends and Conflicts between
Equityholders and Debtholders with Weak Monitoring: The Case of India,'' in J. Doukas, V.
Murinde and C. Wihlborg (eds.) Financial Sector Reform and Privatization in Transition
Economies, North-Holland, Amsterdam.
Geroski, P. A. (1995). ``What Do We Know about Entry?'' International Journal of Industrial
Organization, 13(4), pp. 421-40.
Gort, M. and Klepper, S. (1982), ``Time Paths in the Diffusion of Product Innovations'',
Economic Journal, 92, pp. 630-653.
Griliches Zvi and Haim Regev (1995) ``Firm productivity in Israeli industry 1979-1988,''
Journal of Econometrics, 65(1), pp. 175-203.
Haltiwanger, John C. (1997) ``Measuring and Analyzing Aggregate Fluctuations: The
Importance of Building from Microeconomic Evidence,'' Review, Federal Reserve Bank of St.
Louis, May, pp. 55-78.
Hopenhayn, H. (1992) ``Entry, Exit, and Firm Dynamics in Long Run Equilibrium,''
Econometrica, 60(5), pp. 1127-50.
55
Jeffrey Campbell, (1998) ``Entry, Exit, Embodied Technology, and Business Cycles,'' Review
of Economic Dynamics, 1(2), pp. 371-408.
Jovanovic, Boyan (1982) ``Selection and the Evolution of Industry,'' Econometrica, 50(3), pp.
649-70.
Kocsis, V., R. Lukach, B. Minne, V. Shestalova, N. Zubanov and H. van der Wiel, (2009)
``Relation between Entry, Exit and Productivity,'' CPB Document No. 180, CPB Netherlands
Bureau for Economic Policy Analysis, The Hague.
Kohli, Atul. 2006. ``Politics of Economic Growth in India, 1980–2005.'' Economic and
Political Weekly, 41 (13), pp. 1251-59, and 41 (14), pp. 1361-70.
McLellan Nathan (2004) ``New Zealand’s Performance Context and Challenges'' Paper
Presented at Workshop on ‘Productivity: Performance, Prospects and Policies’ Wellington,
28-29 July, 2004.
Melitz, M. J. (2003). ``The Impact of Trade on Intra-Industry Reallocations and Aggregate
Industry Productivity,'' Econometrica, 71(6), pp. 1695–725.
Melitz, M. J. and Polanec, S. (2009). ``Dynamic Olley-Pakes Decomposition with Entry and
Exit’, MICRO-DYN Working Paper no. 03/09, September.
Mody, Ashoka, Anusha Nath, and Michael Walton (2010) ``Sources of Corporate Profits in
India: Business Dynamism or Advantages of Entrenchment?'' IMF Working Paper, WP 11/8.
Mortensen Dale T. and Christopher A. Pissarides(1994) ``Job Creation and Job Destruction in
the Theory of Unemployment,'' Review of Economic Studies, 61(3), pp. 397-415.
OECD (2001). ``Productivity and Firm Dynamics: Evidence from Microdata,'' Economic
Outlook, 69, pp. 209-23.
Olley, G. S. and Pakes, A. (1996). ``The Dynamics of Productivity in the
Telecommunications Equipment Industry,'' Econometrica, 64(6), pp. 1263-9.
Pakes, Ariel and Richard Ericson (1989) ``Empirical Implications of Alternative Models of
Firm Dynamics,'' NBER Working Paper, 2893.
56
Panagariya, Arvind. 2008. India: The Emerging Giant. New York and New Delhi: Oxford
University Press.
Rodrik, Dani and Subramanian, Arvind (2004) ``From 'Hindu Growth' to Productivity Surge:
The Mystery of the Indian Growth Transition,'' CEPR Discussion Paper, 4371.
Schumpeter, J. (1934). The Theory of Economic Development, Cambridge: Harvard
University Press.
Schumpeter, J. (1942). Capitalism, Socialism and Democracy, New York: Harper & Row.
UNIDO (2009) ``Structural Change and Productivity Growth: A Review with Implications
for Developing Countries,'' Research and Statistical Branch, Working Paper 08/2009.

57
Appendix: National Industrial Classification 2004
15 Manufacture of food products and beverages
16 Manufacture of tobacco products
17 Manufacture of textiles
18 Manufacture of wearing apparel; dressing and dyeing of fur
19 Tanning and dressing of leather; manufacture of luggage, handbags,
saddlery, harness and footwear
20 Manufacture of wood and of products of wood and cork, except
furniture; manufacture of articles of straw and plaiting materials
21 Manufacture of paper and paper products
22 Publishing, printing and reproduction of recorded media
23 Manufacture of coke, refined petroleum products and nuclear fuel
24 Manufacture of chemicals and chemical products
25 Manufacture of rubber and plastics products
26 Manufacture of other non-metallic mineral products
27 Manufacture of basic metals
28 Manufacture of fabricated metal products, except machinery and
equipment
29 Manufacture of machinery and equipment n.e.c.
30 Manufacture of office, accounting and computing machinery
31 Manufacture of electrical machinery and apparatus n.e.c.
32 Manufacture of radio, television and communication equipment and
apparatus
33 Manufacture of medical, precision and optical instruments, watches and
clocks
34 Manufacture of motor vehicles, trailers and semi-trailers
35 Manufacture of other transport equipment
36 Manufacture of furniture; manufacturing n.e.c.