Embed Size (px)
Citation preview
Cracker Barrel Checkers Pecan Pancakes Candy Made-From-Scratch Travelers & Neighbors
Fireplace Apple Cider Rockers Grand Ole Opry® Front PorchEggs-In-The-Basket
Chicken n’Dumplins Biscuits Golden DeliciousApples ChocolateCobbler Pleasing People
Sweet Whole Baby Carrots Harmonica Good Country Cookin’Sunrise Sampler® Farm Raised Catfish Cracker Jack® Oil Lamp Old-Fashioned Lemonade
Meatloaf Yankee Candle® Smokehouse Breakfast® Corn Muffins Slinky® Raspberry Iced Tea
Jacks Lebanon, Tennessee Coca-Cola® Fried Okra Florida Orange Juice Turkey n’ Dressing
Chicken n’Dumplins Blackberry Cobbler Filling Mashed Potatoes
Homemade Macaroni n’ Cheese Baked Apple Dumplin Chow Chow Relish Turnip Greens
Chicken Pot Pie Grade A Eggs MoonPie® Preserves Fried Apples Antiques Apple Butter
Front Porch John Deere® Good Country Cookin’ Sweet Tea American Music LegendsTM
Thick Sliced Bacon Charles Chips® Highway109Breakfast Roast Beef 1969
Quilts Wild Maine Blueberry Pancakes French Toast Coffee Checkers MoonPie® Licorice
Turnip Greens Sugar Cured Ham Peg Game Hashbrown Casserole
Beans n’ Greens Smoked Sausage Front Porch Buttermilk Biscuits
Meatloaf Peach Cobbler Filling Corn Muffins Grilled Pork Chops
Sourdough Toast Comfort Food KazooQuilts Grits Slinky®
Uncle Herschel’s Favorite® Yankee Candle® Fried Okra Country Fried Steak Highway109
Heritage Music Baked Apple Dumplin Freestone Peach Buttermilk Biscuits Dumplins
Hickory Smoked Country Ham Sourdough Toast Jacks Apple Cider Blackberry Cobbler
Oil Lamp Pancakes Grits Whole Kernel Corn Turnip Greens BLT Sandwich
American Music LegendsTM Meatloaf Sunday Homestyle Chicken Licorice Chicken n’ Rice
Tootsie Roll® Charles Chips® Country Chef Salad 1969 Cracker Jack® Front Porch Puzzles
Eggs-In-The-Basket Country Ham Harmonica Fried Apples Country Store Peanut Brittle
100% Pure Maple Syru Antiques Roast Beef Biscuits Peg Game
Vidalia Onion Rings Raspberry Lemonade Frozen Mug Sundaes Dubble Bubble® Candy
Beans n’ Greens Mashed Potatoes Country Chef Salad Pinto Beans Jacks Books-On-Audio
Good Country Cookin’ Cherry Cobbler Filling Whole Kernel Corn Buttermilk Biscuits
Grade A Eggs Florida Grapefruit Juice Tootsie Roll® Made-From-Scratch Friday Fish Fry
Macaroni n’ Cheese Farm Raised Catfish Antiques Front Porch French Toast
Country Green Beans Grand Ole Opry® Quilts Buttermilk Pancakes Thick Sliced Bacon
Montmorency Cherry John Deere® Sugar Cured Ham Frozen Mug Sundaes Apple Butter
Grits Lodge Logic® Cast Iron Oil Lamp Licorice Slinky® Puzzles Rockers Sourdough Toast
Peanut Brittle Coca-Cola® Meatloaf Raspberry Iced Tea Travelers & Neighbors
Pecan Pancakes Chicken Pot Pie Florida Orange Juice Marion Blackberry Pleasing People
2006 Annual Report
100% Pure Maple Syrup

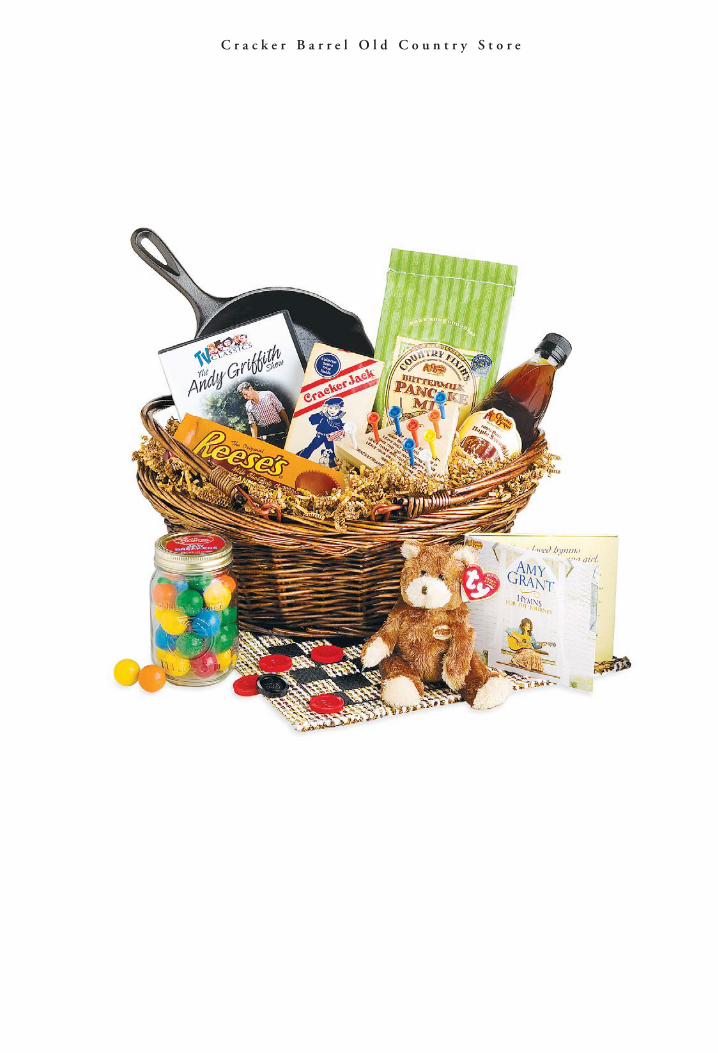
The items you see on the cover of this year’s Annual Report for CBRL Group, Inc.are just a few of the countless authentic goods, nostalgic wares and menufavorites we offer our guests at Cracker Barrel Old Country Store® – along withsome of the many places, histories and ideals that have combined to createthe heritage that we valued in 2006, and during the past 37 years.
1
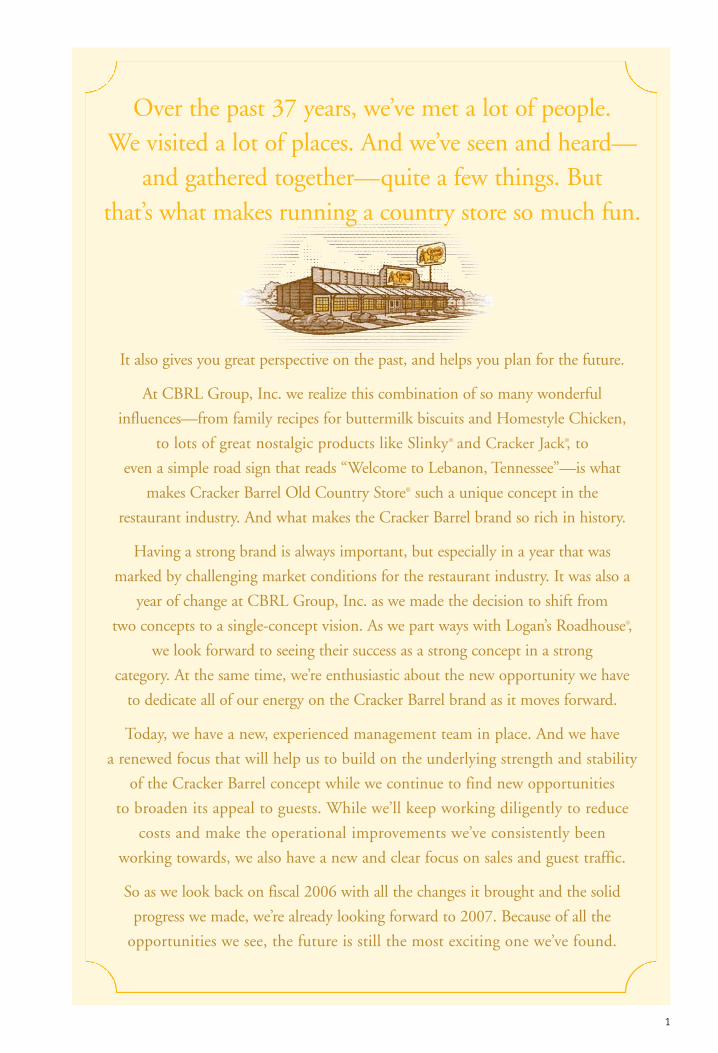
Over the past 37 years, we’ve met a lot of people. We visited a lot of places. And we’ve seen and heard—
and gathered together—quite a few things. But that’s what makes running a country store so much fun.
It also gives you great perspective on the past, and helps you plan for the future.
At CBRL Group, Inc. we realize this combination of so many wonderful
influences—from family recipes for buttermilk biscuits and Homestyle Chicken,
to lots of great nostalgic products like Slinky® and Cracker Jack®, to
even a simple road sign that reads “Welcome to Lebanon, Tennessee”—is what
makes Cracker Barrel Old Country Store® such a unique concept in the
restaurant industry. And what makes the Cracker Barrel brand so rich in history.
Having a strong brand is always important, but especially in a year that was
marked by challenging market conditions for the restaurant industry. It was also a
year of change at CBRL Group, Inc. as we made the decision to shift from
two concepts to a single-concept vision. As we part ways with Logan’s Roadhouse®,
we look forward to seeing their success as a strong concept in a strong
category. At the same time, we’re enthusiastic about the new opportunity we have
to dedicate all of our energy on the Cracker Barrel brand as it moves forward.
Today, we have a new, experienced management team in place. And we have
a renewed focus that will help us to build on the underlying strength and stability
of the Cracker Barrel concept while we continue to find new opportunities
to broaden its appeal to guests. While we’ll keep working diligently to reduce
costs and make the operational improvements we’ve consistently been
working towards, we also have a new and clear focus on sales and guest traffic.
So as we look back on fiscal 2006 with all the changes it brought and the solid
progress we made, we’re already looking forward to 2007. Because of all the
opportunities we see, the future is still the most exciting one we’ve found.
A Chip Off The
Old Barrel.
Over the years, quite a few guests have asked us what the name “Cracker Barrel”
means. The answer isn’t too complicated. But we like to think it’s pretty special.
There was a time when most American towns and communities had just one store for miles and
miles, often called the general store or country store. Horse-drawn wagons would arrive here from
far off, carrying goods and provisions packed in burlap sacks, boxes and—especially for more
perishable items like crackers—big wooden barrels. When they were empty, these sturdy, well-
crafted barrels were often flipped over and used as a place to display the store’s goods.
Country stores were also the unofficial meeting house for many communities; somewhere folks
could catch up on the news, local events, and their neighbors’ lives. So a well-placed cracker
barrel on the front porch became the perfect place to hold a cup of coffee, a deck of playing cards
or perhaps a checker board during a conversation that could last all afternoon.
Cracker barrels and checker boards. Front porches and rocking chairs. Good conversations and
tasty provisions. For us, these are things that typify what was once great about American com-
munities. And we like to think they still do. That’s why we can’t imagine a name more fitting
than Cracker Barrel Old Country Store®.
3
4 19
2532
1
2
44
39
6
4
2
1
11
3
5
22
1516
1127
431
828
1748
1326
854
82349
1330
10 137
4
21
8 14
6
2
5
9
317
6
11
17
1
2101
1
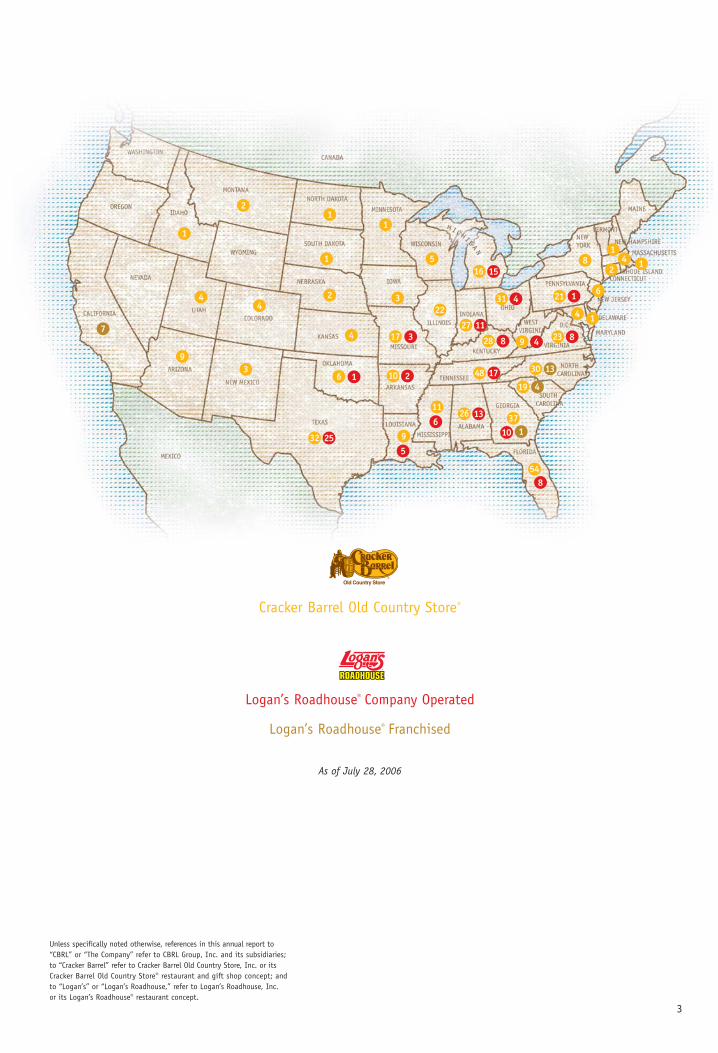
Unless specifically noted otherwise, references in this annual report to“CBRL” or “The Company” refer to CBRL Group, Inc. and its subsidiaries;to “Cracker Barrel” refer to Cracker Barrel Old Country Store, Inc. or itsCracker Barrel Old Country Store® restaurant and gift shop concept; andto “Logan’s” or “Logan’s Roadhouse,” refer to Logan’s Roadhouse, Inc.or its Logan’s Roadhouse® restaurant concept.
Cracker Barrel Old Country Store®
Logan’s Roadhouse® Company Operated
Logan’s Roadhouse® Franchised
As of July 28, 2006
4
To Our Shareholders:
Change is necessary to stay relevant to our guests.
Growth comes from our ability to respond positively
to change. Growth requires learning from the past,
preserving the best, recalibrating and moving forward.
Vision provides focus and guides our growth. We
move forward to our 38th year of operation confident
in our renewed vision.
FISCAL 2006: A YEAR OF CHANGE AND GROWTH
Looking back, fiscal 2006 was definitely a year of
change and growth at CBRL. It was also another
successful year for CBRL. We are pleased to report that
we grew both revenue and diluted net income per
share, returned capital to our shareholders through
increased dividends and a major share repurchase
effected through a modified “Dutch Auction” tender
offer, generated substantial cash flow from operations,
and reinvested in the future growth of the business.
For the past two years, I reported that we had
faced an extraordinary commodity cost environment
and a squeeze on consumers’ discretionary incomes
led by high gasoline and energy prices. This year the
commodity environment moderated, and we actually
benefited from lower chicken, pork and dairy prices.
Modest menu price increases allowed us to manage
this rather benign commodity environment. Land
and development costs, utilities and pressures on
labor costs from new state-mandated minimum wage
increases were the cost challenges that we faced in
fiscal 2006. Our biggest opportunity remains building
top-line sales, especially retail sales.
Fiscal 2006, however, was a year of marked
uncertainty for our guests on many fronts. Consumer
sentiment and discretionary income continued to
be under pressure from high gasoline prices and higher
home heating costs. The added pressures of high
mortgage, credit card and car payments weighed
heavily on consumers, particularly those on tight
budgets. The United States experienced one of the
country’s worst natural disasters with Hurricane
Katrina and its aftermath. The housing market slowed,
interest rates climbed, and gasoline prices rose.
Avian flu and trans fats made headlines as potential
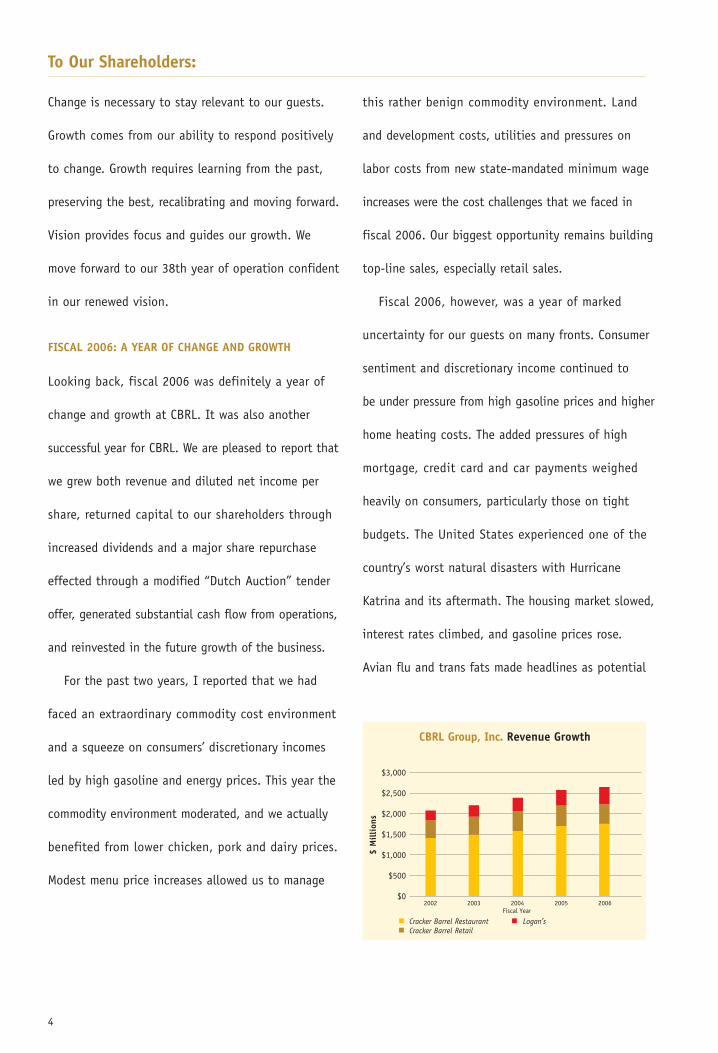
CBRL Group, Inc. Revenue Growth
$3,000
$2,500
$2,000
$1,500
$1,000
$500
$0
$ M
illi
ons
� Cracker Barrel Restaurant � Logan’s� Cracker Barrel Retail
20032002 2004 2005 2006Fiscal Year
5
health issues. Concerns about terrorism continued
to be a part of our daily existence, and the violence
in Iraq escalated.
Consumers responded by reducing their discretionary
spending, including dining out less. Declines in
guest traffic were reported across the industry. The
competitive landscape in the industry changed as
consumers “traded down” to quick-service restaurants
and quick-service restaurants broadened their appeal
and upgraded their product offerings.
We also faced several operational issues. In fiscal
2006 Cracker Barrel introduced complex seasonal
menus that, while popular with our guests, added
cost and created execution issues. Our retail strategy
was not successful. We undertook efforts to address
both, learning from our mistakes. We began to
simplify the seasonal promotions and saw benefits
in reduced food waste and improved labor costs;
and we re-focused our retail strategy on appealing,
high-quality merchandise with a broader array of
price points.
Despite the magnitude of these internal and
external challenges, we still delivered a solid
performance in fiscal 2006:
• Net revenue increased by 2.9% or $75 million,
as we opened 21 new Cracker Barrel Old Country
Store (“Cracker Barrel”) locations and 20 new
company-operated and two franchised Logan’s
Roadhouse (“Logan’s”) restaurants.
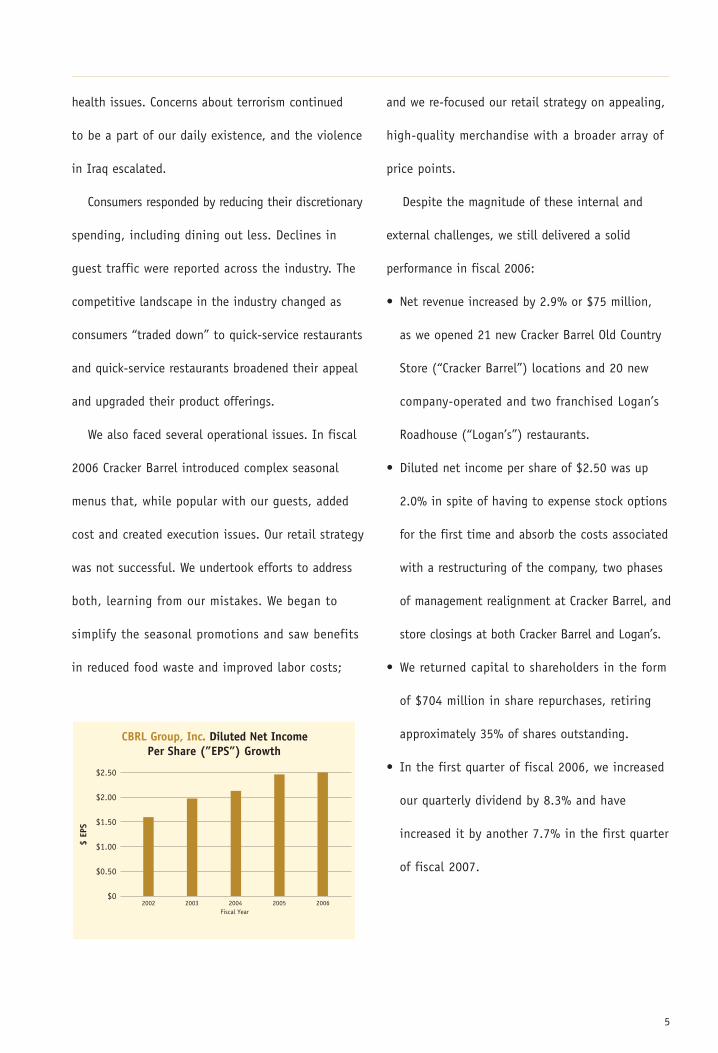
• Diluted net income per share of $2.50 was up
2.0% in spite of having to expense stock options
for the first time and absorb the costs associated
with a restructuring of the company, two phases
of management realignment at Cracker Barrel, and
store closings at both Cracker Barrel and Logan’s.
• We returned capital to shareholders in the form
of $704 million in share repurchases, retiring
approximately 35% of shares outstanding.
• In the first quarter of fiscal 2006, we increased
our quarterly dividend by 8.3% and have
increased it by another 7.7% in the first quarter
of fiscal 2007.
CBRL Group, Inc. Diluted Net IncomePer Share (”EPS”) Growth
$2.50
$2.00
$1.50
$1.00
$0.50
$0
$ EP
S
20032002 2004 2005 2006Fiscal Year
6
• Cracker Barrel was voted “Best in Family Dining”
for the 16th consecutive year by consumers in
Restaurants & Institutions’ Choice in Chains poll
and won the Good Sam Club Welcome Mat Award
for the 5th consecutive year.
Despite the difficulties noted above, comparable
store restaurant sales at Cracker Barrel decreased by
only 1.1% from fiscal 2005. However, retail sales
at Cracker Barrel declined by a disappointing 8.1%
from fiscal 2005. While reduced guest spending is a
factor in this decline, we made several missteps in
our retail strategy. We just didn’t keep it top of mind
that Cracker Barrel represents much more than just a
meal to our guests – it is an experience. Our guests
look forward to stepping through our doors and
being greeted by both friendly faces and a retail shop
where the ambience and decoration takes them to
a different place and time. It is a place for fond
memories, to find something special for oneself or to
pick up a gift for someone special, and a place of
comfort and authentic food and hospitality, all at a
fair price. Last year we simply didn’t meet our retail
guests’ expectations. Our product assortment, our
product price points, the decoration and feel of the
shops, especially during the holidays, did not
deliver on the Cracker Barrel promise.
Consistently successful new store openings are
critical to the profitable operation of Cracker Barrel.
There are three factors that are essential to the
success of our newest restaurants: finding the right
people to ensure that we deliver on our mission
of “Pleasing People”, accepting only the highest quality
in operational execution, and selecting only the
best sites. Our people have been, and always will be,
key to the success of our brand, especially in
new store openings. As the labor market tightens and
competition for good restaurant sites grows, we
know we have to be ever mindful of these factors for
success with new units.
For a number of years, CBRL management has
focused on leveraging operational performance with
the management of capital structure in order to
grow shareholder value. In early fiscal 2006, we real-
ized it was important to review our capital structure
in light of industry developments as well as the
favorable capital market conditions. Working with our
financial advisors, we developed, and with board
approval, began to implement, a major restructuring
of the company. The plan included:
7
• Establishing a new $1.25 billion credit facility,
• Drawing on the facility to repurchase approximately
35% of the company’s outstanding shares, and
• Divesting Logan’s Roadhouse, Inc.
We are pleased to report that we have substantially
completed our plan. We repurchased approximately
35% of the then outstanding shares, secured financing
at favorable market rates, and expect to complete
the divestiture of Logan’s during our second quarter.
We also had a number of unplanned changes. In
July, Cy Taylor, President and Chief Operating Officer
of Cracker Barrel, announced his plan to retire.
As a 28-year veteran, Cy embodied the essence of the
Cracker Barrel brand and contributed invaluably to
the business. Without proper preparation, such a
loss could be devastating to a business. But we were
prepared. With the pending transition to a single-
concept business, we had already begun the process
of restructuring the leadership team.
The members of the new team represent some of
the best individual talent in the industry with a
wide range of experience and expertise, so I was
comfortable in assuming the additional role of
President of Cracker Barrel, confident in the knowledge
that the new team is fully capable of leading Cracker
Barrel to a successful future.
Good stewardship of the brand requires that we
capture our brand essence formally so that those
today who are responsible for delivering on the brand
experience, and those who will have this responsi-
bility in the future, will have a clear guide for
remaining true to the brand. So, we developed a formal,
detailed brand architecture statement. We shared
this brand statement with guests and store employees,
and we knew we had captured the essence of the
brand when we saw the enthusiastic response from all
of our General Managers and Retail Managers at our
recent annual conference.
As I said earlier, fiscal 2006 was indeed a year
of growth and change. Now, let’s look at where we
are headed from here.
MOVING FORWARD: FISCAL 2007 AND BEYOND
Focus is our mantra for fiscal 2007. With the
anticipated completion of the divestiture of Logan’s,
our full attention will be directed to building
restaurant traffic and retail sales at Cracker Barrel.
On the restaurant front, our guests have told us
that our greatest opportunity to improve their
experience is to speed up our service. We do believe
that our service times have slipped over the last
8
few years and, like our restaurant operations, the solu-
tion is complex. We have named a new Vice President
of Innovation, who will lead cross-functional teams
to address our operational initiatives. Speed-of-
service will be addressed in a broad initiative that
includes table configuration, kitchen layout and
systems, delivery and service systems. We will also
have projects that focus on margin improvement.
Our retail store is an integral part of the Cracker
Barrel experience. Retail sales are a very critical
factor in our success, providing a major competitive
advantage and a clear point of differentiation. We
recognize that retail allows us to operate in a truly
unique space within the industry. We are committed
to our goal of increasing the frequency of having our
restaurant guests make a retail purchase and to
growing revenue.
The change in our retail shops is perceptible. Our
retail team has vastly improved our retail assortment
and upgraded the quality of the products. We con-
tinue to introduce products unique to Cracker Barrel,
including our collegiate rockers and a new line of
designer quilts. We have added a Vice President,
General Merchandise Manager and a Vice President of
Retail Planning and Allocation, to ensure that we
have the right merchandise, in the right quantity,
at the right stores, at the right time. We rolled
out a new visual merchandising system to all of the
stores to ensure that we are maximizing visual
appeal and sales per square foot. Our stores once more
feel like the holiday seasons, re-establishing the
emotional attachment of the guest to Cracker Barrel.
We have added products that appeal to the sensory
perceptions of our guests – lots of scents, motion
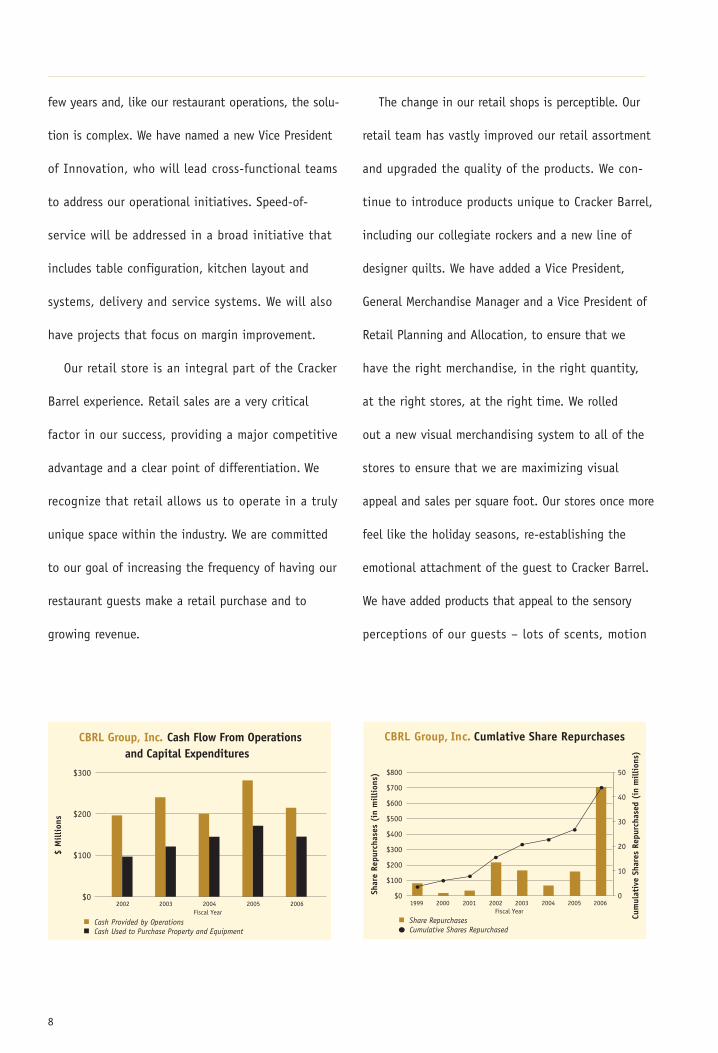
CBRL Group, Inc. Cash Flow From Operations
$300
$200
$100
$0
$ M
illi
ons
2003 2004 2005 2006
� Cash Provided by Operations � Cash Used to Purchase Property and Equipment
and Capital Expenditures
2002Fiscal Year
CBRL Group, Inc. Cumlative Share Repurchases
Shar
e Re
purc
hase
s (i
n m
illi
ons)
$800
$700
$600
$500
$400
$300
$200
$100
$0
Fiscal Year 1999 2000 2001 2002 2003 2004 2005 2006
Cum
ulat
ive
Shar
es R
epur
chas
ed (
in m
illi
ons)
50
40
30
20
10
0
� Share RepurchasesCumulative Shares Repurchased
9
and color. We set out to re-engage our guests and we
believe that we are doing so.
Marketing and advertising are also key strategies
to help drive both restaurant and retail sales. We are
launching a new creative campaign for our billboard
program, beginning at the start of our third quarter.
Radio advertising is back. It also includes new
creative, and will start in December and continue
throughout fiscal 2007. A test of television adver-
tising is also scheduled for select markets in late
fiscal 2007.
Music continues to offer an innovative brand
extension for Cracker Barrel. It features a new
dimension to our brand appeal. Research shows that
a significant percentage of our core customers
are dedicated country music fans. Country music and
Cracker Barrel are a natural fit. Since the beginning,
our guests have enjoyed hearing country songs in our
dining rooms, retail stores and on our front porches.
We’ve been honored on our exclusive music label
to feature Alison Krauss & Union Station, Charlie
Daniels, Sara Evans, Amy Grant and our latest CD,
Songs of the Year.
Our innovation focus does not stop there. We also
have a brand innovation strategy that includes
more off-interstate stores and other creative methods
to grow our brand and our business. Operations
innovation focuses on delivering the Cracker Barrel
experience in a way that combines improving guest
perceptions with more efficient execution. In all of
this, we will remain true to one of the most valuable
brands in the industry.
In closing, we look forward to fiscal 2007 and
beyond with a renewed and re-energized vision and a
continuing commitment to creating shareholder
value. We are more confident than ever that we are
building a promising future for Cracker Barrel.
Sincerely,
Michael A. Woodhouse
Chairman, President and Chief Executive Officer
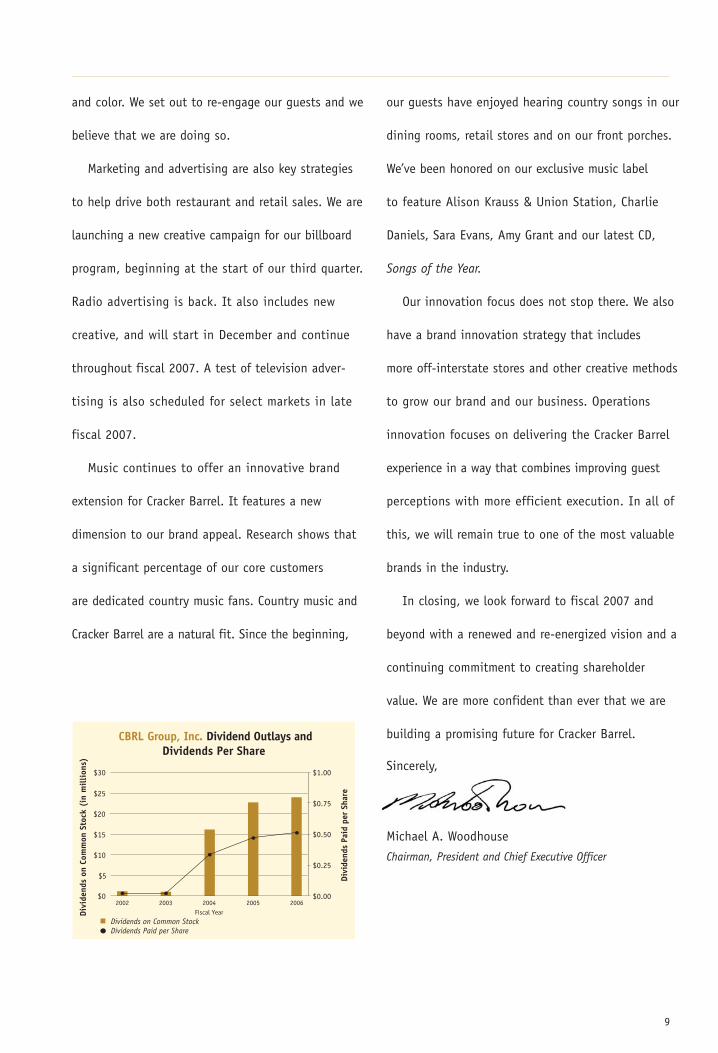
CBRL Group, Inc. Dividend Outlays andDividends Per Share
$30
$25
$15
$10
$5
$0
Divi
dend
s on
Com
mon
Sto
ck (
in m
illi
ons)
20032002 2004 2005 2006Fiscal Year
$20
Divi
dend
s Pa
id p
er S
hare
$1.00
$0.75
$0.50
$0.25
$0.00
� Dividends on Common StockDividends Paid per Share


S u n r i s e S a m p l e r ® B r e a k f a s t
C r a c k e r B a r r e l O l d C o u n t r y S t o r e
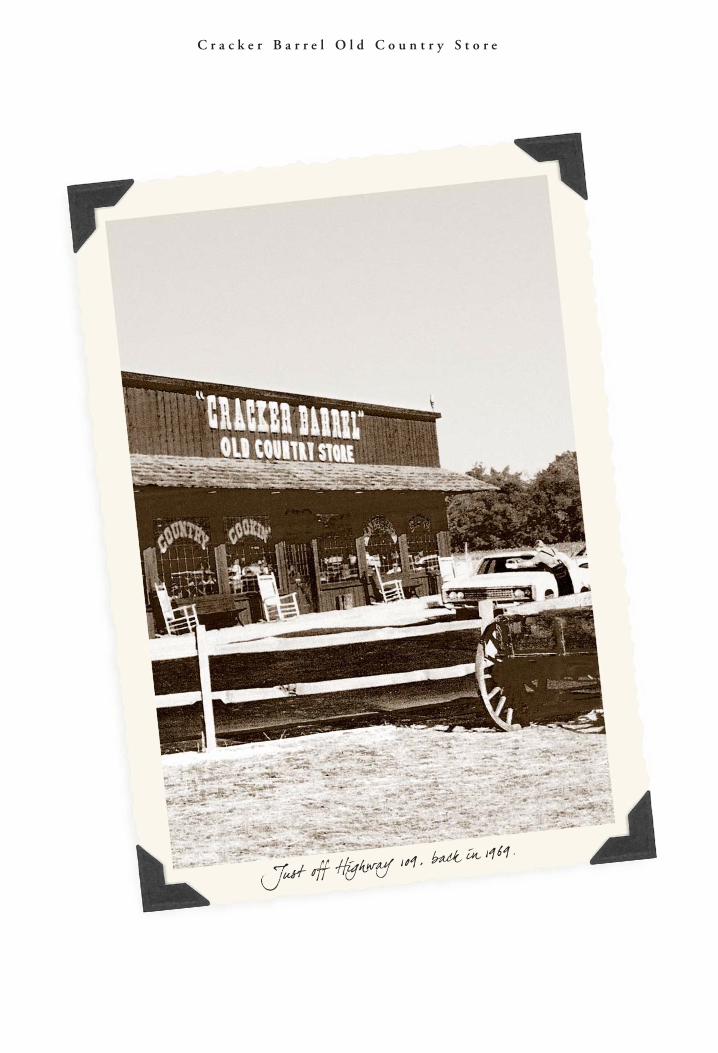
Just off Highwa y 109, back in 1969.
13
G o o d C o u n t r y C o o k i n ’ S i n c e 1 9 6 9 .
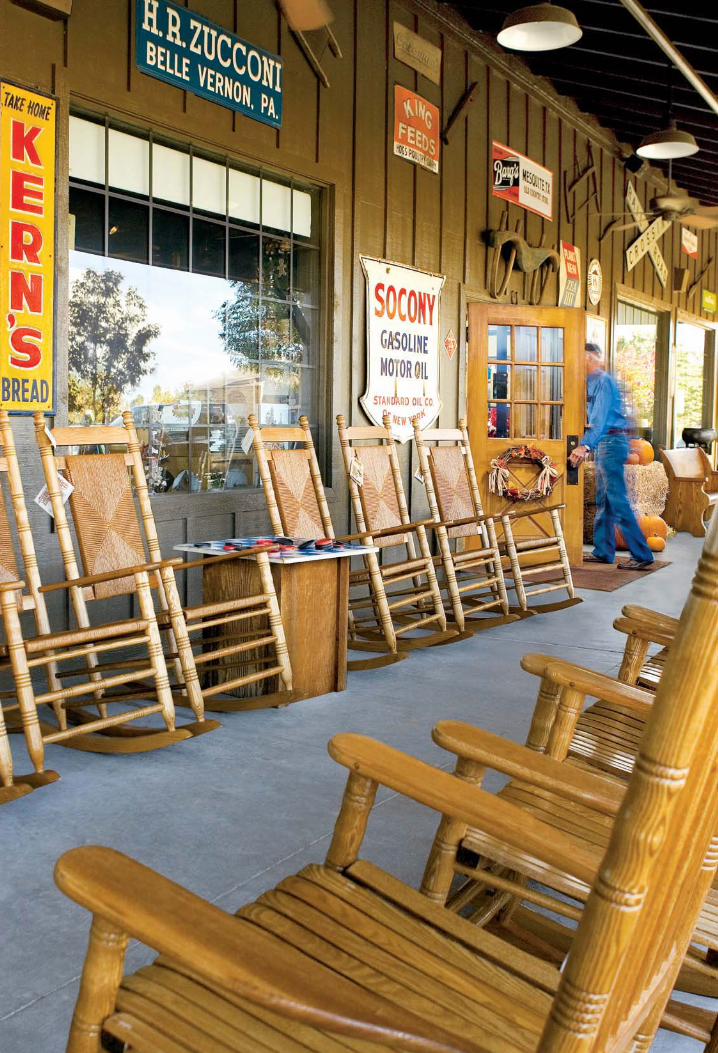
Few experiences compare to stepping inside a country store. The
creak of a board underfoot. The glow of a fireplace in back. Wooden
shelves lined with country recipes, mason jars brimming with
candy, handmade crafts and games, and always a surprise or two.
Back in 1969, we realized this experience was pretty hard to
find in the modern world, especially for folks who might be traveling
on America’s highways. So we got the idea to combine an old time
country store with a true country restaurant—a place where people
could take a break from the everyday hustle and bustle and feel
at home, no matter where they might be. Who would have imagined
this combination of restaurant and retail space would make
Cracker Barrel Old Country Store one of the most differentiated
concepts in the restaurant industry?
In truth, our success has come from a dedication to constantly
re-inventing ourselves to make Cracker Barrel feel timeless yet
completely new every time loyal guests or new friends visit. In 2006,
we highlighted this by exhibiting new Seasonal Store Decorations on
our front porch and interior—to promote the new, brand-appropriate
meals and retail products you’d find at Cracker Barrel each and
every season.
14
S e r v i n g B r e a k f a s t A l l D a y . E v e r y D a y .
At Cracker Barrel, our guiding principle has always been a simple
one: Pleasing People. That means treating folks the way we’d want to
be treated—and serving Good Country Cookin’ prepared the way
we’d make it for our own families, using nothing but the best ingredients
we can find.
Today, we still make buttermilk biscuits from scratch, not a mix,
and slice our homemade meatloaf extra thick. We use only premium
vegetables and the freshest produce available. We even roll dumplins
by hand all day for our Chicken n’ Dumplins, which is some-
thing when you consider that we sell more than 49,300 servings of
it every day.
And, of course, you can’t forget breakfast. After all, we pride
ourselves on making some of the best buttermilk pancakes anywhere,
whether they’re topped with wild Maine blueberries, loaded with
pecans, or served with 100% pure maple syrup. Why do we bother to
go to such lengths, like working with a small, family supplier to
bake traditional sourdough bread for our French toast, or serving only
Florida Valencia orange juice and Florida grapefruit juice? Well,
when you’re known for offering one of the best country breakfasts
around, all day, every day, we think it pays to do it right.
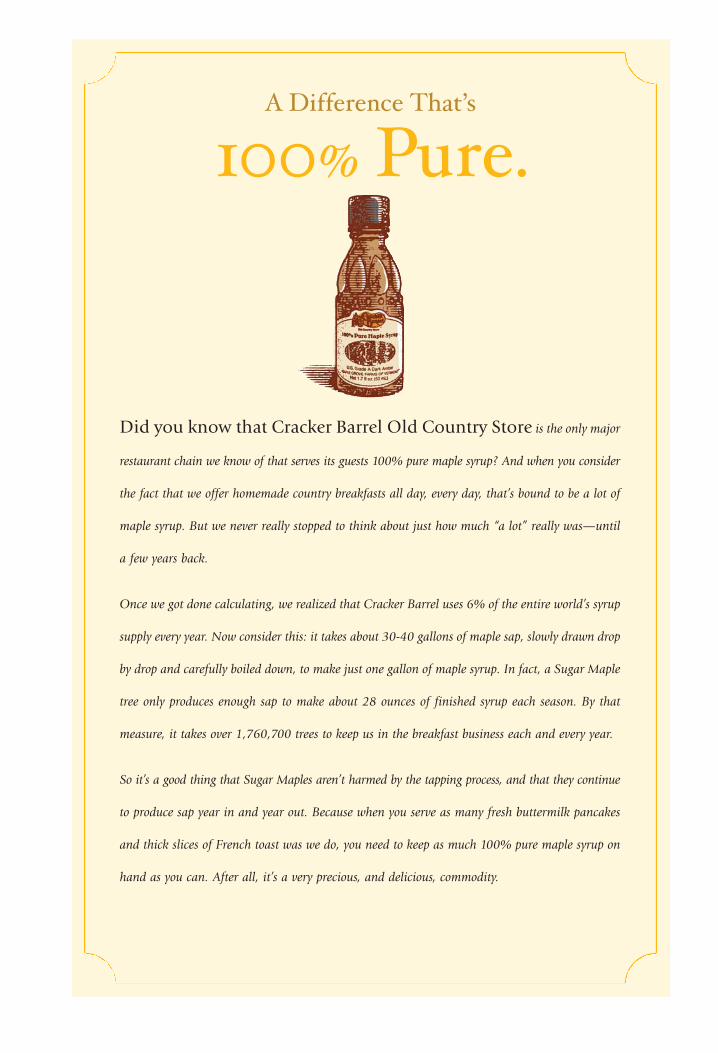
Did you know that Cracker Barrel Old Country Store is the only major
restaurant chain we know of that serves its guests 100% pure maple syrup? And when you consider
the fact that we offer homemade country breakfasts all day, every day, that’s bound to be a lot of
maple syrup. But we never really stopped to think about just how much “a lot” really was—until
a few years back.
Once we got done calculating, we realized that Cracker Barrel uses 6% of the entire world’s syrup
supply every year. Now consider this: it takes about 30-40 gallons of maple sap, slowly drawn drop
by drop and carefully boiled down, to make just one gallon of maple syrup. In fact, a Sugar Maple
tree only produces enough sap to make about 28 ounces of finished syrup each season. By that
measure, it takes over 1,760,700 trees to keep us in the breakfast business each and every year.
So it’s a good thing that Sugar Maples aren’t harmed by the tapping process, and that they continue
to produce sap year in and year out. Because when you serve as many fresh buttermilk pancakes
and thick slices of French toast was we do, you need to keep as much 100% pure maple syrup on
hand as you can. After all, it’s a very precious, and delicious, commodity.
A Difference That’s
100% Pure.
C r a c k e r B a r r e l O l d C o u n t r y S t o r e
In 2006, Cracker Barrel was honored to be named “Best in Family
Dining” by Restaurants & Institutions magazine for a record 16th
straight year. But that didn’t stop us from taking important steps to
improve the quality of our service. In October, we began our
Guest Loyalty Program, using register receipts to invite guests to
participate in Interactive Voice Response phone surveys about
their visit. Today, store managers receive monthly reports to help them
constantly improve guest experiences.
While Cracker Barrel has always been about letting folks relax,
we take the speed of our service very seriously. This year, we
tested a new Kitchen Display System that tracks customers’ food
from order through preparation—and even notifies servers when
food is ready for pick-up. Initial results have shown the system’s value,
and we’re already making plans to include this new technology
in our strategy to improve the speed of our service.
We’re also re-evaluating our restaurant layout and seating by testing
new table set-ups that allow for more two-party seating with
increased privacy. Not only has this added a unique new space for
guests to enjoy, it’s shortened wait-times for smaller parties—
while increasing the number of guests we can serve throughout the day.
17
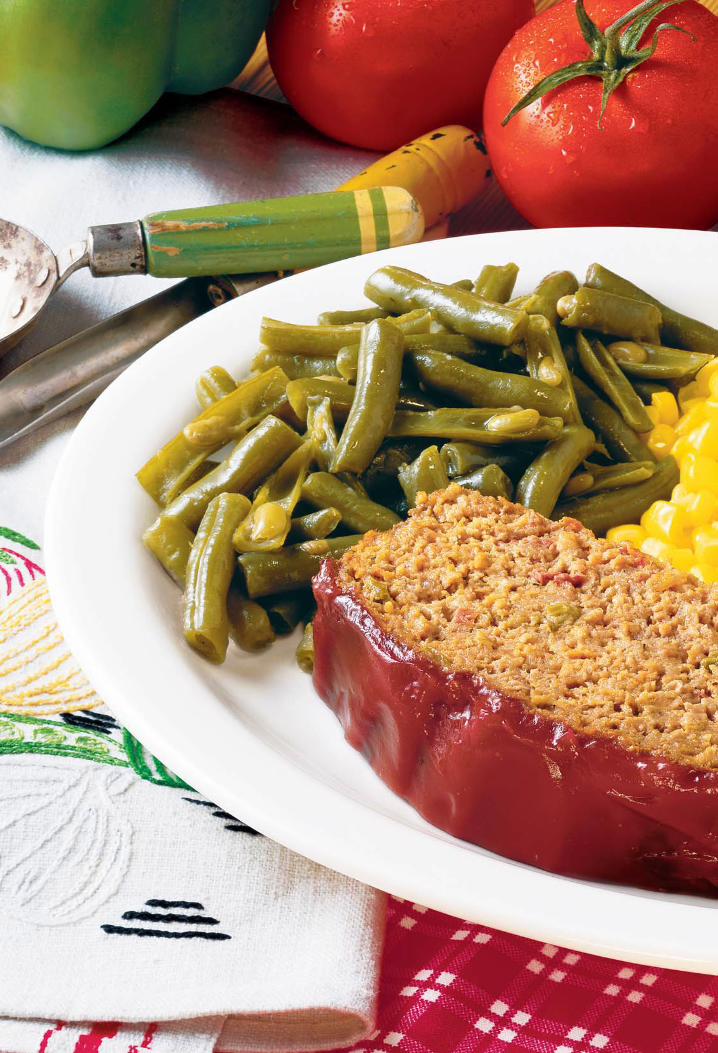
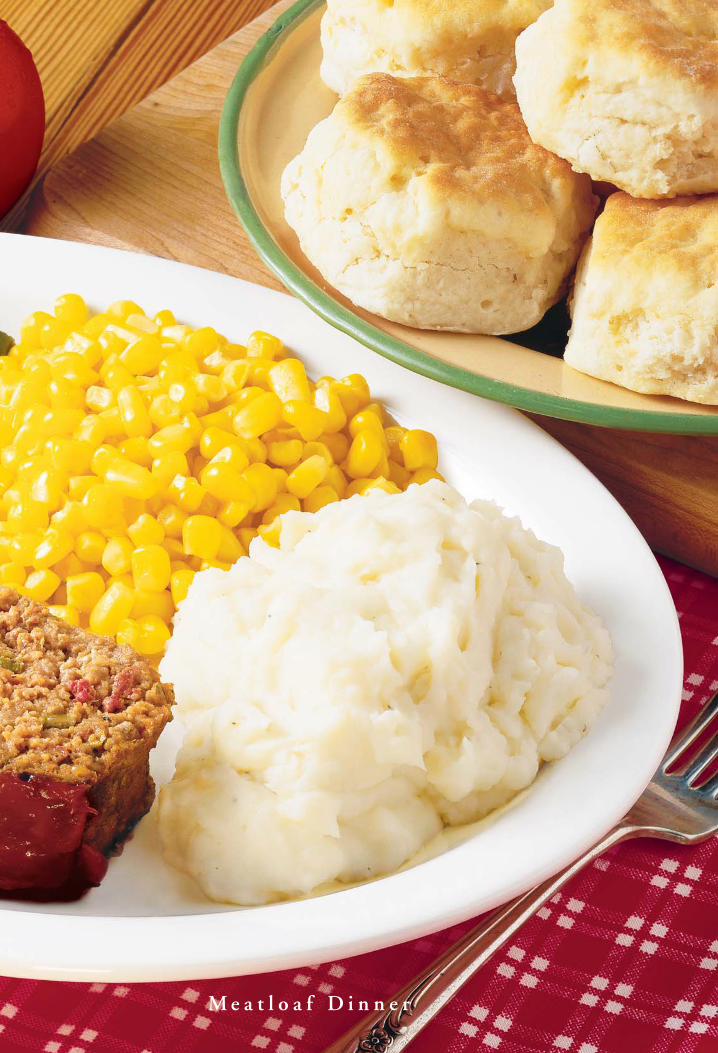
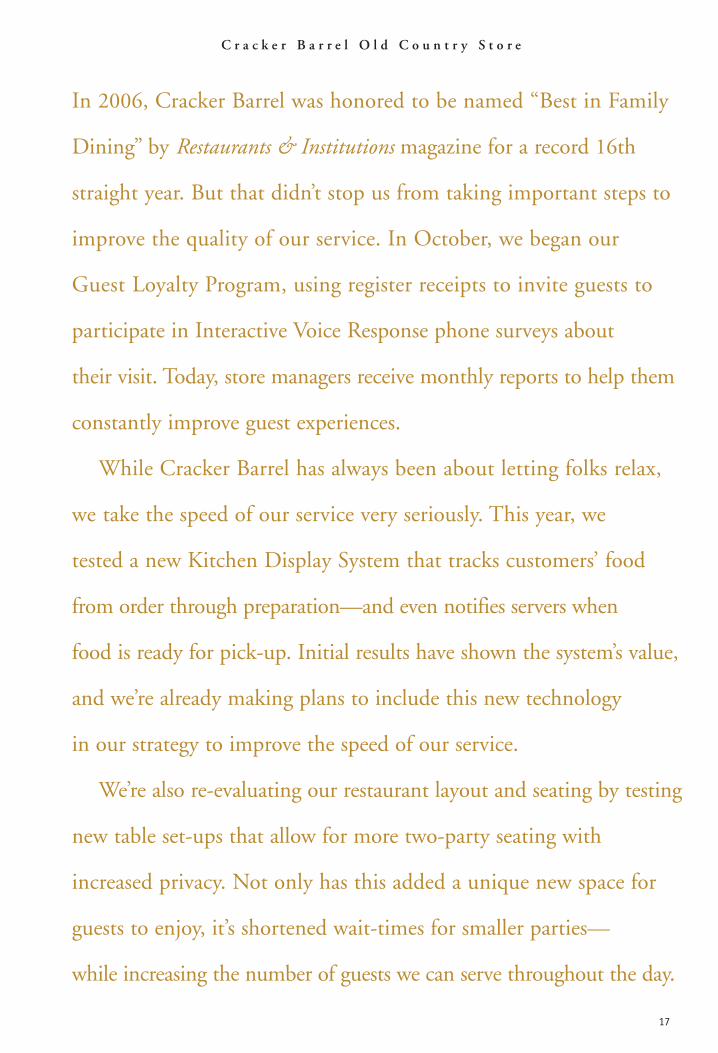
M e a t l o a f D i n n e r
Building A Great Relationship,
Peg By Peg.
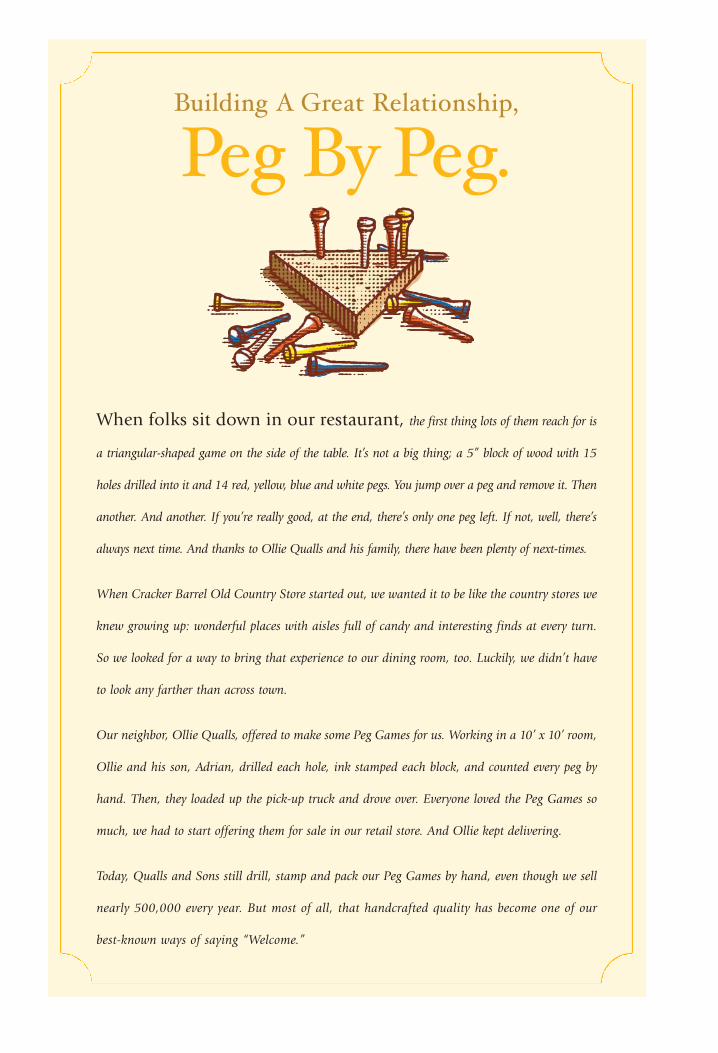
When folks sit down in our restaurant, the first thing lots of them reach for is
a triangular-shaped game on the side of the table. It’s not a big thing; a 5” block of wood with 15
holes drilled into it and 14 red, yellow, blue and white pegs. You jump over a peg and remove it. Then
another. And another. If you’re really good, at the end, there’s only one peg left. If not, well, there’s
always next time. And thanks to Ollie Qualls and his family, there have been plenty of next-times.
When Cracker Barrel Old Country Store started out, we wanted it to be like the country stores we
knew growing up: wonderful places with aisles full of candy and interesting finds at every turn.
So we looked for a way to bring that experience to our dining room, too. Luckily, we didn’t have
to look any farther than across town.
Our neighbor, Ollie Qualls, offered to make some Peg Games for us. Working in a 10’ x 10’ room,
Ollie and his son, Adrian, drilled each hole, ink stamped each block, and counted every peg by
hand. Then, they loaded up the pick-up truck and drove over. Everyone loved the Peg Games so
much, we had to start offering them for sale in our retail store. And Ollie kept delivering.
Today, Qualls and Sons still drill, stamp and pack our Peg Games by hand, even though we sell
nearly 500,000 every year. But most of all, that handcrafted quality has become one of our
best-known ways of saying “Welcome.”
H a l f R e s t a u r a n t . H a l f S t o r e . A l l C o u n t r y .®
Ever since we opened our first location in 1969, folks have seemed to
love visiting our old country store. Whether browsing the aisles
before and after a meal, or just when they’re looking for items that are
reminiscent of a simpler time, when quality craftsmanship and
value mattered.
Because this experience is unique, we’re always on the lookout for
opportunities where the Cracker Barrel Old Country Store brand can
become a valuable private label, like on our very own Pure Maple Syrup,
traditional Corn Muffin Mix or our long-running Books-On-
Audio Program. One of our most popular offerings has always been
the Cracker Barrel Rockers that welcome guests to our store.
In fact, this year our guests brought more than 162,200 of these hand-
crafted rockers from our front porch to theirs.
In 2006, our Music Catalogue continued to grow as we added world-
renowned recording artists to our collection, including Charlie Daniels
and Amy Grant—whose Hymns for the Journey CD has sold more than
97,000 copies to date. We also added compilations, like Cracker
Barrel’s Songs of the Year, featuring classic and current artists performing
songs that have won Song of the Year from the Grammy Awards®
the Country Music AssociationTM or the Academy of Country Music®.
21
22
E a t . S h o p . R e l a x .S M
Over the years, we’ve learned that the key to running a retail store,
just like a restaurant, is keeping things fresh. So, year in and
year out, we work hard to continually evaluate our selection of retail
products and to improve our inventory management process
by identifying Best Practices on the store level and finding ways to
implement them system-wide. This year, we brought on new
senior leadership to our retail business to focus on improving our
retail service, operations and merchandising even more.
In 2006, three initiatives in particular helped us to keep our
inventory moving. We began using special “Manager’s Feature” displays
to highlight individual items and groups of retail products that
were currently on sale around the store. We also worked to better lever-
age our popular Clearance Corner, along with an event that many
guests look forward to, our Porch Sale. Both of these efforts helped us
to efficiently clear our inventory of older or discontinued items so
that we could make way for new merchandise.
By the end of fiscal 2006, retail sales were already showing
improvement as new seasonal items hit the shelves just in time for
the busy holiday season. But that’s just the beginning, as we
expect plenty of exciting ideas for our retail business in the year ahead.
C r a c k e r B a r r e l O l d C o u n t r y S t o r e
24
A r o u n d T h e C o r n e r O r A r o u n d T h e C o u n t r y .T M
From a single store in Lebanon, Tennessee, Cracker Barrel Old
Country Store has grown to include 543 locations around the country.
It’s something that we could not have accomplished without the
dedication and hard work of our Cracker Barrel family—all 62,000
of them—who made every one of our guests feel at home,
whether it was their first time visiting us or their one hundred and first.
Because that is truly what the Cracker Barrel brand is all about.
Today, we look forward to harnessing that brand and building
upon its strength to improve our sales growth and increase guest traffic.
We’ll do this by taking a fresh look at our new unit site selection
process and our store layouts, especially in off-interstate locations.
We’re also re-vamping our marketing efforts to find new ways to
broaden Cracker Barrel’s appeal, while improving the frequency of our
current guests’ visits.
But, most of all, we look forward to finding new opportunities and
ways to innovate the Cracker Barrel brand. We are making clear, steady
progress in our restaurant and our retail store. And staying true to the
things that got us here—the heritage and history of an old
country store that, more than anything else, enjoys Pleasing People
each and every day.
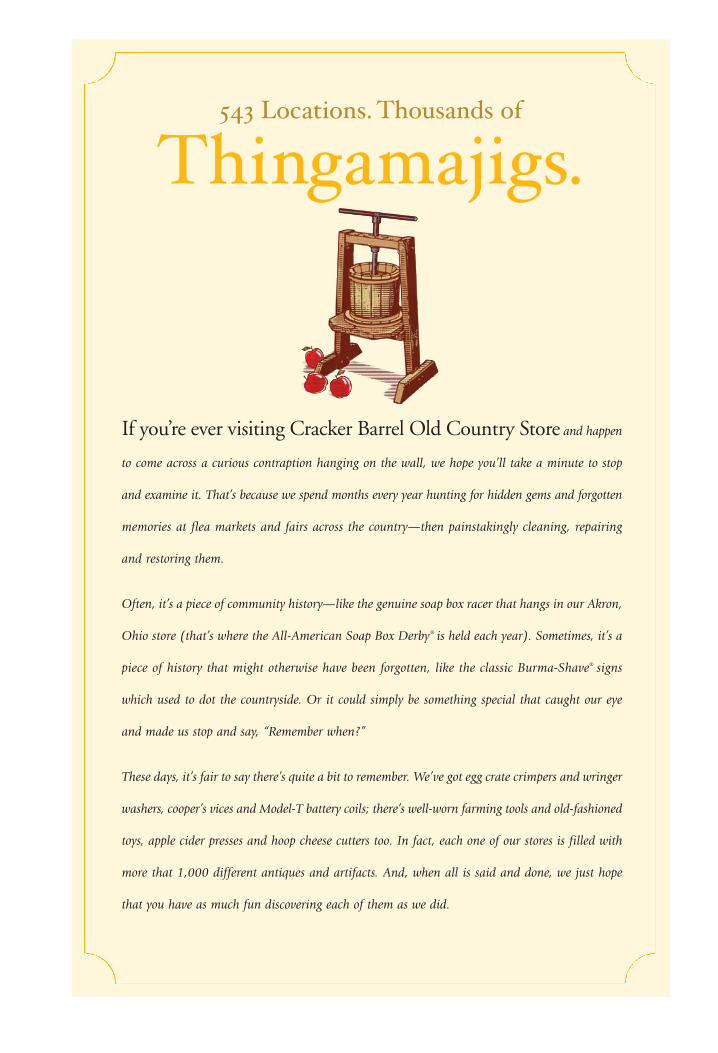
If you’re ever visiting Cracker Barrel Old Country Store and happen
to come across a curious contraption hanging on the wall, we hope you’ll take a minute to stop
and examine it. That’s because we spend months every year hunting for hidden gems and forgotten
memories at flea markets and fairs across the country—then painstakingly cleaning, repairing
and restoring them.
Often, it’s a piece of community history—like the genuine soap box racer that hangs in our Akron,
Ohio store (that’s where the All-American Soap Box Derby® is held each year). Sometimes, it’s a
piece of history that might otherwise have been forgotten, like the classic Burma-Shave® signs
which used to dot the countryside. Or it could simply be something special that caught our eye
and made us stop and say, “Remember when?”
These days, it’s fair to say there’s quite a bit to remember. We’ve got egg crate crimpers and wringer
washers, cooper’s vices and Model-T battery coils; there’s well-worn farming tools and old-fashioned
toys, apple cider presses and hoop cheese cutters too. In fact, each one of our stores is filled with
more that 1,000 different antiques and artifacts. And, when all is said and done, we just hope
that you have as much fun discovering each of them as we did.
543 Locations. Thousands of
Thingamajigs.
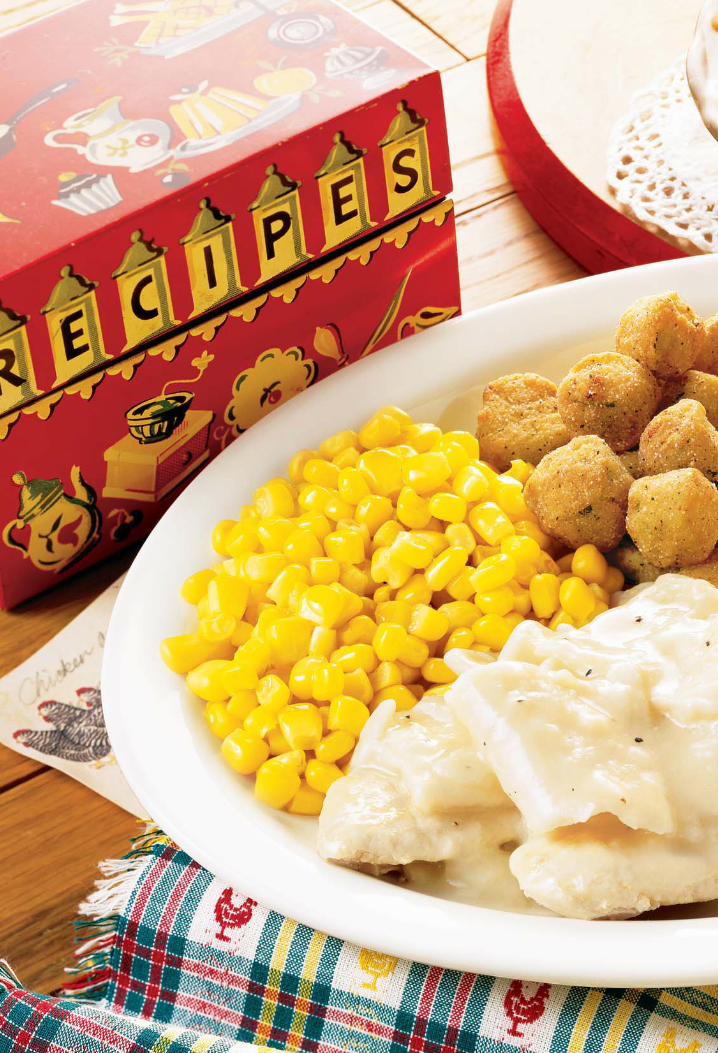
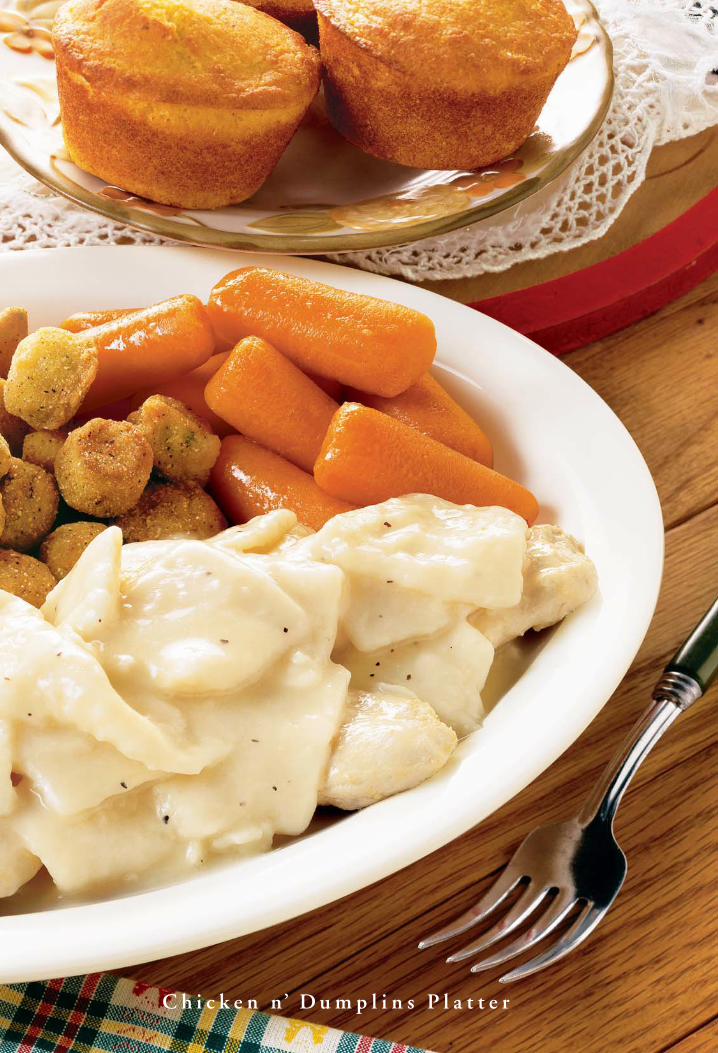
C h i c k e n n’ D u m p l i n s P l a t t e r
28
Except for specific historical information, many of thematters discussed in this Annual Report to Shareholdersmay express or imply projections of revenues orexpenditures, plans and objectives for future operations,growth or initiatives, expected future economicperformance, or the expected outcome or impact ofpending or threatened litigation. These and similarstatements regarding events or results which CBRLGroup, Inc. (the “Company”) expects will or may occurin the future, are forward-looking statements thatinvolve risks, uncertainties and other factors which maycause actual results and performance of the Companyto differ materially from those expressed or implied bythose statements. All forward-looking information isprovided pursuant to the safe harbor established underthe Private Securities Litigation Reform Act of 1995and should be evaluated in the context of these risks,uncertainties and other factors. Forward-lookingstatements generally can be identified by the use offorward-looking terminology such as “trends,”“assumptions,” “target,” “guidance,” “outlook,” “plans,”“goals,” “objectives,” “expectations,” “near-term,”“long-term,” “projection,” “may,” “will,” “would,” “could,”“expect,” “intend,” “estimate,” “anticipate,” “believe,”“potential,” “regular,” or “continue” (or the negativeor other derivatives of each of these terms) or similarterminology. The Company believes the assumptionsunderlying these forward-looking statements arereasonable; however, any of the assumptions could beinaccurate, and therefore, actual results may differmaterially from those projected in or implied by theforward-looking statements. Factors and risks thatmay result in actual results differing from this forward-looking information include, but are not limitedto, those summarized below, as well as other factorsdiscussed throughout this document, including,without limitation, the factors described under “CriticalAccounting Policies and Estimates” on pages 41 to44 of this Annual Report or, from time to time, in theCompany’s filings with the SEC, press releases andother communications.
Readers are cautioned not to place undue relianceon forward-looking statements made in this document,since the statements speak only as of the document’sdate. The Company has no obligation, and doesnot intend, to publicly update or revise any of these
forward-looking statements to reflect events orcircumstances occurring after the date of this documentor to reflect the occurrence of unanticipated events.Readers are advised, however, to consult any furtherdisclosures the Company may make on relatedsubjects in its documents filed with or furnished tothe SEC or in its other public disclosures.
Set forth below is a summary of the material risksassociated with our business and, therefore, anyinvestment in our securities. Our 2006 Annual Reporton Form 10-K, filed with the SEC on October 3,2006 and available at sec.gov, as well as our website,cbrlgroup.com, contains a more comprehensivediscussion of these risks, and you are encouraged toreview that Annual Report on Form 10-K and all ourSEC filings.
RISKS RELATED TO OUR BUSINESS
• Successful divestitures and other strategic transac-tions are important to our future growth andprofitability. These involve risks of, among otherthings, assessing the value of these transactions,achieving projected plans and completing transac-tions on acceptable terms.
• Our credit facility places financial and otherrestrictions on us.
• Certain economic and business factors specific to therestaurant or retail industries and certain generaleconomic factors that are largely out of our controlmay adversely affect our results of operations.
• Our business is affected by changes in consumerpreferences and discretionary spending.
• Our business is seasonal.• We face intense competition, and if we are unable
to continue to compete effectively, our business,financial condition and results of operations wouldbe adversely affected.
• Our plans depend significantly on initiativesdesigned to improve the efficiencies, costs andeffectiveness of our operations, and failure toachieve or sustain these plans could affect ourperformance adversely.
• We are dependent on attracting and retaining quali-fied employees while also controlling labor costs.
CBRL GROUP, INC .
Forward-Looking Statements – Risk Factors
29
• We may not be able to obtain and maintain licensesand permits necessary to operate our restaurants,and failure to comply with laws could adverselyaffect our operating results.
• We are subject to a number of risks relating tofederal, state and local governmental regulationof our business that may increase our costs anddecrease our profit margins.
• We depend on key personnel for our success.• The price and availability of food, ingredients and
utilities used by our restaurants or merchandisesold in our retail shop could adversely affect ourrevenues and results of operations.
• Our heavy reliance on certain vendors and supplierscould adversely affect our business.
• Our current insurance may expose us to unexpectedcosts.
• Health concerns and government regulation relatingto the consumption of beef or other food productscould affect consumer preferences and could nega-tively impact our results of operations.
• Unfavorable publicity could harm our business.• If we fail to execute our growth strategy, which
primarily depends on our ability to opennew restaurants that are profitable, our businesscould suffer.
• Litigation may adversely affect our business,financial condition and results of operations.
• Our annual and quarterly operating results mayfluctuate significantly and could fall below theexpectations of securities analysts and investorsdue to a number of factors, some of which arebeyond our control, resulting in a decline in theprice of our securities.
• Obtaining some of our retail merchandise exposesus to risks associated with foreign imports.
• Individual restaurant locations are affected by localconditions, such as road closures, that couldchange and adversely affect the carrying value ofthose locations.
• We can be affected adversely and unexpectedlyby the implementation of new, or changes in theinterpretation of existing, accounting principlesgenerally accepted in the United States of America.
• Identification of material weakness in internalcontrol may adversely affect our financial results.
• We may need additional capital in the future, andit may not be available on acceptable terms.
• Our failure or inability to enforce our trademarksor other proprietary rights could adversely affectour competitive position or the value of our brand.
• Provisions in our charter, Tennessee law and ourshareholder rights plan may discourage potentialacquirors of our company, which could adverselyaffect the value of our securities.
RISKS PARTICULAR TO OUR LOGAN’S OPERATIONS
So long as we own Logan’s, that business willbe subject to the following additional risks anduncertainties:• Logan’s has developed and tested and is now
implementing an enhanced restaurant prototype forfuture expansion, but the prototype has yet tobe proven from either an investment or operatingstandpoint.
• Failure to comply with alcoholic beverage or foodcontrol regulations could lead to the loss of Logan’sliquor and food service licenses and, thereby, harmLogan’s business.
• “Dram shop” litigation (associated with the sale ofalcoholic beverages) may hurt our Logan’s operations.
• If Logan’s fails to comply with federal and statestatutes, regulations and rules governing our offerand sale of franchises and our relationship withour franchisees, we may be subject to franchisee-initiated litigation and governmental or judicialfines or sanctions.
• Our Logan’s franchisees could take actions thatcould be harmful to our business.
• Our Logan’s development agreements withour franchisees limit our ability to expand incertain markets.
CBRL GROUP, INC .
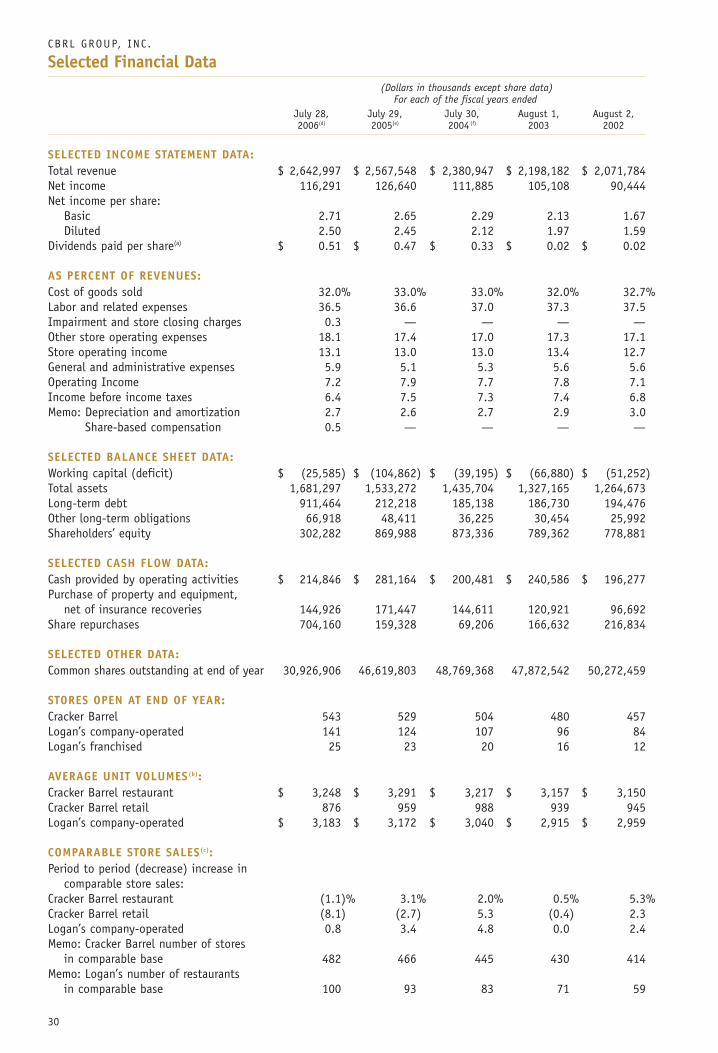
Selected Financial Data(Dollars in thousands except share data)
For each of the fiscal years endedJuly 28, July 29, July 30, August 1, August 2,2006(d) 2005(e) 2004(f) 2003 2002
SELECTED INCOME STATEMENT DATA:Total revenue $ 2,642,997 $ 2,567,548 $ 2,380,947 $ 2,198,182 $ 2,071,784Net income 116,291 126,640 111,885 105,108 90,444Net income per share:
Basic 2.71 2.65 2.29 2.13 1.67Diluted 2.50 2.45 2.12 1.97 1.59
Dividends paid per share(a) $ 0.51 $ 0.47 $ 0.33 $ 0.02 $ 0.02
AS PERCENT OF REVENUES:Cost of goods sold 32.0% 33.0% 33.0% 32.0% 32.7%Labor and related expenses 36.5 36.6 37.0 37.3 37.5Impairment and store closing charges 0.3 — — — —Other store operating expenses 18.1 17.4 17.0 17.3 17.1Store operating income 13.1 13.0 13.0 13.4 12.7General and administrative expenses 5.9 5.1 5.3 5.6 5.6Operating Income 7.2 7.9 7.7 7.8 7.1Income before income taxes 6.4 7.5 7.3 7.4 6.8Memo: Depreciation and amortization 2.7 2.6 2.7 2.9 3.0
Share-based compensation 0.5 — — — —
SELECTED BALANCE SHEET DATA:Working capital (deficit) $ (25,585) $ (104,862) $ (39,195) $ (66,880) $ (51,252)Total assets 1,681,297 1,533,272 1,435,704 1,327,165 1,264,673Long-term debt 911,464 212,218 185,138 186,730 194,476Other long-term obligations 66,918 48,411 36,225 30,454 25,992Shareholders’ equity 302,282 869,988 873,336 789,362 778,881
SELECTED CASH FLOW DATA:Cash provided by operating activities $ 214,846 $ 281,164 $ 200,481 $ 240,586 $ 196,277Purchase of property and equipment,
net of insurance recoveries 144,926 171,447 144,611 120,921 96,692Share repurchases 704,160 159,328 69,206 166,632 216,834
SELECTED OTHER DATA:Common shares outstanding at end of year 30,926,906 46,619,803 48,769,368 47,872,542 50,272,459
STORES OPEN AT END OF YEAR:Cracker Barrel 543 529 504 480 457Logan’s company-operated 141 124 107 96 84Logan’s franchised 25 23 20 16 12
AVERAGE UNIT VOLUMES(b):Cracker Barrel restaurant $ 3,248 $ 3,291 $ 3,217 $ 3,157 $ 3,150Cracker Barrel retail 876 959 988 939 945Logan’s company-operated $ 3,183 $ 3,172 $ 3,040 $ 2,915 $ 2,959
COMPARABLE STORE SALES(c):Period to period (decrease) increase in
comparable store sales:Cracker Barrel restaurant (1.1)% 3.1% 2.0% 0.5% 5.3%Cracker Barrel retail (8.1) (2.7) 5.3 (0.4) 2.3Logan’s company-operated 0.8 3.4 4.8 0.0 2.4Memo: Cracker Barrel number of stores
in comparable base 482 466 445 430 414Memo: Logan’s number of restaurants
in comparable base 100 93 83 71 59
30
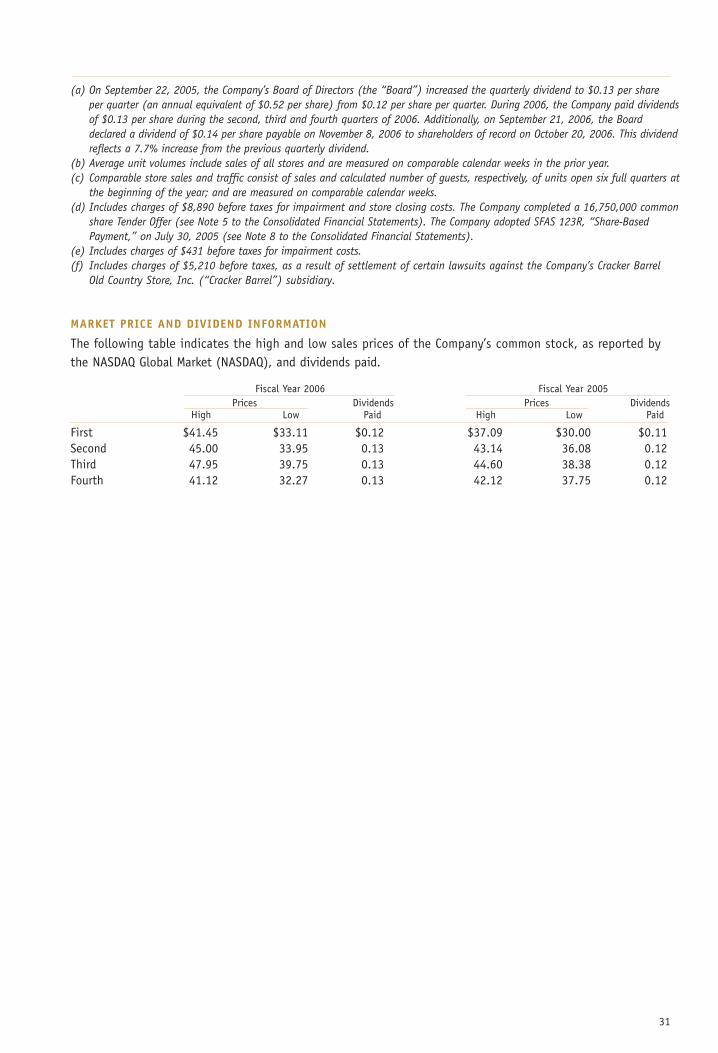
(a) On September 22, 2005, the Company’s Board of Directors (the “Board”) increased the quarterly dividend to $0.13 per shareper quarter (an annual equivalent of $0.52 per share) from $0.12 per share per quarter. During 2006, the Company paid dividendsof $0.13 per share during the second, third and fourth quarters of 2006. Additionally, on September 21, 2006, the Boarddeclared a dividend of $0.14 per share payable on November 8, 2006 to shareholders of record on October 20, 2006. This dividendreflects a 7.7% increase from the previous quarterly dividend.
(b) Average unit volumes include sales of all stores and are measured on comparable calendar weeks in the prior year.(c) Comparable store sales and traffic consist of sales and calculated number of guests, respectively, of units open six full quarters at
the beginning of the year; and are measured on comparable calendar weeks.(d) Includes charges of $8,890 before taxes for impairment and store closing costs. The Company completed a 16,750,000 common
share Tender Offer (see Note 5 to the Consolidated Financial Statements). The Company adopted SFAS 123R, “Share-BasedPayment,” on July 30, 2005 (see Note 8 to the Consolidated Financial Statements).
(e) Includes charges of $431 before taxes for impairment costs.(f) Includes charges of $5,210 before taxes, as a result of settlement of certain lawsuits against the Company’s Cracker Barrel
Old Country Store, Inc. (“Cracker Barrel”) subsidiary.
MARKET PRICE AND DIVIDEND INFORMATION
The following table indicates the high and low sales prices of the Company’s common stock, as reported bythe NASDAQ Global Market (NASDAQ), and dividends paid.
Fiscal Year 2006 Fiscal Year 2005Prices Dividends Prices Dividends
High Low Paid High Low Paid
First $41.45 $33.11 $0.12 $37.09 $30.00 $0.11Second 45.00 33.95 0.13 43.14 36.08 0.12Third 47.95 39.75 0.13 44.60 38.38 0.12Fourth 41.12 32.27 0.13 42.12 37.75 0.12
31
CBRL GROUP, INC .
32
The following discussion and analysis provides infor-mation which management believes is relevant to anassessment and understanding of the Company’sconsolidated results of operations and financial condition.The discussion should be read in conjunction with theConsolidated Financial Statements and notes thereto.All dollar amounts reported or discussed inManagement’s Discussion and Analysis of FinancialCondition and Results of Operations are shown inthousands. References in Management’s Discussion andAnalysis of Financial Condition and Results ofOperations to a year or quarter are to the Company’sfiscal year or quarter unless otherwise noted.
EXECUTIVE OVERVIEW
CBRL Group, Inc. (the “Company,” “our” or “we”) is apublicly traded (Nasdaq: CBRL) holding company that,through certain subsidiaries, is engaged in the opera-tion and development of the Cracker Barrel Old CountryStore® (“Cracker Barrel”) and Logan’s Roadhouse®
(“Logan’s”) restaurant and retail concepts. The Companywas organized under the laws of the state of Tennesseein August 1998 and maintains an Internet website atcbrlgroup.com.
We are in the business of delivering excellent guestdining experiences, and we strive to do that in41 states at more than 684 company-owned and 25franchised units. While each restaurant conceptoffers its own unique atmosphere and an array of distinctmenu items, both are committed to executingoutstanding guest service while focusing on delivery ofhigh quality products at affordable prices.
RESTAURANT INDUSTRY
Our businesses operate in the full-service segment ofthe restaurant industry in the United States. Therestaurant business is highly competitive with respectto quality, variety and price of the food productsoffered. The industry is often affected by changes inthe taste and eating habits of the public, local andnational economic conditions affecting spending habits,population and traffic patterns. There are manysegments within the restaurant industry, which overlapand often provide competition for widely diverserestaurant concepts. Competition also exists in securingprime real estate locations for new restaurants, in
hiring qualified employees, in advertising, in theattractiveness of facilities and among competitors withsimilar menu offerings or convenience.
Additionally, seasonal, economic and weather condi-tions also affect the restaurant business. Historically,interstate tourist traffic and the propensity to dine outhave been much higher during the summer months,thereby attributing to higher profits in our fourthquarter. While retail sales in Cracker Barrel are madesubstantially to restaurant customers, such sales arestrongest in the second quarter, which includesthe Christmas holiday shopping season. Increases ingasoline and energy prices that began in 2004,continued in 2005 and 2006, among other things,appear to have affected consumer discretionary incomeand dining out habits. Severe weather can and hasaffected sales adversely from time to time.
KEY PERFORMANCE INDICATORS
Management uses a number of key performancemeasures to evaluate the Company’s operational andfinancial performance, including the following:
Comparable store sales and traffic consist of salesand calculated number of guests, respectively, of unitsopen six full quarters at the beginning of the year;and are measured on comparable calendar weeks. Thismeasure highlights performance of existing stores asthe impact of new store openings is excluded.
Percentage of retail sales to total sales indicates therelative proportion of spending by guests on retailproduct at Cracker Barrel stores and helps identifyoverall effectiveness of our retail operations and initia-tives. Management uses this measure to analyze astore’s ability to convert restaurant traffic into retailsales since the substantial majority of our retail guestsare also restaurant guests.
Average check per person is an indicator whichmanagement uses to analyze the dollars spent in ourstores per guest. This measure aids management inidentifying trends in guest preferences as well as theeffectiveness of menu price increases and othermenu changes.
Store operating margins are defined as total revenueless cost of goods sold, labor and other related expensesand other store operating expenses, all as a percentof restaurant sales. Management uses this indicator as aprimary measure of operating profitability.
Management’s Discussion and Analysis of Financial Condition and Results of Operations
33
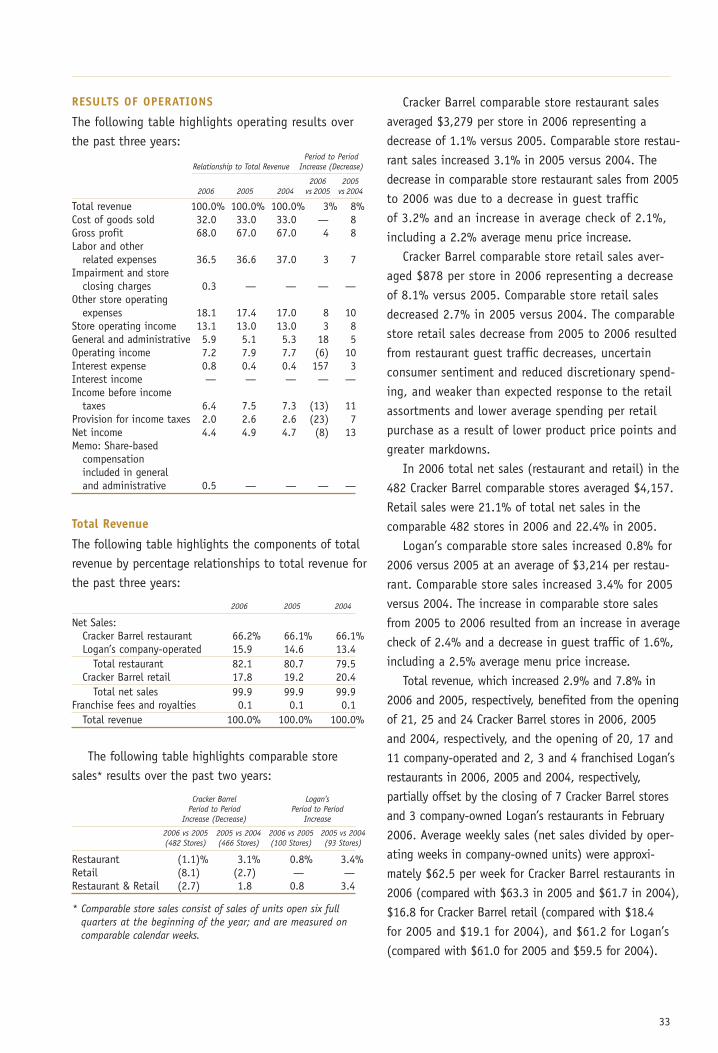
RESULTS OF OPERATIONS
The following table highlights operating results overthe past three years:
Period to PeriodRelationship to Total Revenue Increase (Decrease)
2006 20052006 2005 2004 vs 2005 vs 2004
Total revenue 100.0% 100.0% 100.0% 3% 8%Cost of goods sold 32.0 33.0 33.0 — 8Gross profit 68.0 67.0 67.0 4 8Labor and other
related expenses 36.5 36.6 37.0 3 7Impairment and store
closing charges 0.3 — — — —Other store operating
expenses 18.1 17.4 17.0 8 10Store operating income 13.1 13.0 13.0 3 8General and administrative 5.9 5.1 5.3 18 5Operating income 7.2 7.9 7.7 (6) 10Interest expense 0.8 0.4 0.4 157 3Interest income — — — — —Income before income
taxes 6.4 7.5 7.3 (13) 11Provision for income taxes 2.0 2.6 2.6 (23) 7Net income 4.4 4.9 4.7 (8) 13Memo: Share-based
compensation included in general and administrative 0.5 — — — —
Total Revenue
The following table highlights the components of totalrevenue by percentage relationships to total revenue forthe past three years:
2006 2005 2004
Net Sales:Cracker Barrel restaurant 66.2% 66.1% 66.1%Logan’s company-operated 15.9 14.6 13.4
Total restaurant 82.1 80.7 79.5Cracker Barrel retail 17.8 19.2 20.4
Total net sales 99.9 99.9 99.9Franchise fees and royalties 0.1 0.1 0.1
Total revenue 100.0% 100.0% 100.0%
The following table highlights comparable storesales* results over the past two years:
Cracker Barrel Logan’sPeriod to Period Period to Period
Increase (Decrease) Increase
2006 vs 2005 2005 vs 2004 2006 vs 2005 2005 vs 2004(482 Stores) (466 Stores) (100 Stores) (93 Stores)
Restaurant (1.1)% 3.1% 0.8% 3.4%Retail (8.1) (2.7) — —Restaurant & Retail (2.7) 1.8 0.8 3.4
* Comparable store sales consist of sales of units open six fullquarters at the beginning of the year; and are measured oncomparable calendar weeks.
Cracker Barrel comparable store restaurant salesaveraged $3,279 per store in 2006 representing adecrease of 1.1% versus 2005. Comparable store restau-rant sales increased 3.1% in 2005 versus 2004. Thedecrease in comparable store restaurant sales from 2005to 2006 was due to a decrease in guest trafficof 3.2% and an increase in average check of 2.1%,including a 2.2% average menu price increase.
Cracker Barrel comparable store retail sales aver-aged $878 per store in 2006 representing a decreaseof 8.1% versus 2005. Comparable store retail salesdecreased 2.7% in 2005 versus 2004. The comparablestore retail sales decrease from 2005 to 2006 resultedfrom restaurant guest traffic decreases, uncertainconsumer sentiment and reduced discretionary spend-ing, and weaker than expected response to the retailassortments and lower average spending per retailpurchase as a result of lower product price points andgreater markdowns.
In 2006 total net sales (restaurant and retail) in the482 Cracker Barrel comparable stores averaged $4,157.Retail sales were 21.1% of total net sales in thecomparable 482 stores in 2006 and 22.4% in 2005.
Logan’s comparable store sales increased 0.8% for2006 versus 2005 at an average of $3,214 per restau-rant. Comparable store sales increased 3.4% for 2005versus 2004. The increase in comparable store salesfrom 2005 to 2006 resulted from an increase in averagecheck of 2.4% and a decrease in guest traffic of 1.6%,including a 2.5% average menu price increase.
Total revenue, which increased 2.9% and 7.8% in2006 and 2005, respectively, benefited from the openingof 21, 25 and 24 Cracker Barrel stores in 2006, 2005and 2004, respectively, and the opening of 20, 17 and11 company-operated and 2, 3 and 4 franchised Logan’srestaurants in 2006, 2005 and 2004, respectively,partially offset by the closing of 7 Cracker Barrel storesand 3 company-owned Logan’s restaurants in February2006. Average weekly sales (net sales divided by oper-ating weeks in company-owned units) were approxi-mately $62.5 per week for Cracker Barrel restaurants in2006 (compared with $63.3 in 2005 and $61.7 in 2004),$16.8 for Cracker Barrel retail (compared with $18.4for 2005 and $19.1 for 2004), and $61.2 for Logan’s(compared with $61.0 for 2005 and $59.5 for 2004).
34
Cost of Goods Sold
Cost of goods sold as a percentage of total revenuedecreased to 32.0% in 2006 from 33.0% in 2005. Thiswas due to higher average menu prices versus theprior year, lower commodity costs, higher initial mark-ons of retail merchandise and a lower percentage ofretail sales, which have a higher cost as a percent ofsales than do restaurant sales, partially offset byhigher markdowns on retail merchandise.
Cost of goods sold as a percentage of total revenuein 2005 remained flat compared to 2004 at 33.0%.This was due to higher commodity costs for beef, pork,poultry and produce and higher markdowns on retailmerchandise offset by higher menu pricing and a lowerpercentage of retail sales, which have a higher cost asa percent of sales than do restaurant sales, and higherinitial mark-ons of retail merchandise
Labor and Related Expenses
Labor and other related expenses include all direct andindirect labor and related costs incurred in store opera-tions. Labor expenses as a percentage of total revenuewere 36.5%, 36.6% and 37.0% in 2006, 2005 and2004, respectively. The year to year decrease from 2005to 2006 was due to higher average menu prices versusthe prior year and lower workers’ compensation expenseand group health costs partially offset by higher hourlywages and store management salaries versus theprior year. The year to year decrease from 2004 to 2005was due to lower bonuses under unit-level bonusprograms, partially offset by higher hourly wage ratesand manager wages versus the prior year.
Impairment and Store Closing Costs
During 2006 the Company decided to close sevenCracker Barrel stores and three Logan’s restaurants andrecorded impairment and store closing costs of $8,052.Additionally, during 2006 the Company recorded animpairment of $838 for its management trainee housingfacility. The total impairment and store closing costsrecorded in 2006 were $8,890. Impairment costsrecorded in 2005 were $431.
Other Store Operating Expenses
Other store operating expenses include all unit-leveloperating costs, the major components of which areoperating utilities, supplies, repairs and maintenance,advertising, rent, depreciation and amortization. Other
store operating expenses as a percentage of totalrevenue were 18.1%, 17.4% and 17.0% in 2006, 2005and 2004, respectively. The year to year increase from2005 to 2006 was due to higher utilities and suppliespartially offset by higher average menu prices. Thedecrease from 2004 to 2005 was due to higher utilities,advertising and maintenance expenses offset partiallyby higher menu pricing versus the prior year.
General and Administrative Expenses
General and administrative expenses as a percentage oftotal revenue were 5.9%, 5.1% and 5.3% in 2006, 2005and 2004, respectively. The year to year increase from2005 to 2006 was due to $9,900 of stock optionexpense as a result of the adoption of Statement ofFinancial Accounting Standard (“SFAS”) No. 123(Revised 2004) “Share-Based Payment” (“SFAS No.123R”) in 2006, higher salaries and wages versus theprior year and the non-recurrence of an insurancerecovery in the prior year relative to litigation settle-ments and related expenses incurred in earlier years.The year to year decrease from 2004 to 2005 was dueto lower legal fees compared to prior year, whichincluded a legal settlement and an insurance recoveryrelative to litigation settlements and related expensesincurred in prior years, offset partially by higher salariesversus prior year.
Interest Expense
Interest expense increased to $22,298 in 2006 from$8,693 in 2005 and from $8,444 in 2004. The year toyear increase from 2005 to 2006 was due to higheraverage outstanding debt, higher interest rates andhigher amortization of deferred financing costs.The increase from 2004 to 2005 resulted from higheraverage outstanding debt and higher interest ratesoffset partially by lower amortization of deferredfinancing costs and higher capitalized interest.
Provision for Income Taxes
Provision for income taxes as a percent of income beforeincome taxes was 30.8% for 2006, 34.6% for 2005and 35.9% for 2004. The U.S. Internal Revenue Service(“IRS”) has examined the Company’s consolidatedfederal income tax returns through the year ended July30, 2004. In March 2006, the Company reached asettlement with the IRS for these tax periods. The
35
settlement had no material effect on the Company’sConsolidated Financial Statements for the year endedJuly 28, 2006. The decrease in the effective tax ratefrom 2005 to 2006 reflected lower state and localincome taxes, the reversal of previously accruedreserves and higher employer tax credits as a percentof income before income taxes due to the decreasein income before income taxes from 2005 to 2006. Thereason for the decrease in the tax rate from 2004to 2005 was the enactment of legislation signed onOctober 22, 2004 making the expired Work Opportunityand Welfare to Work federal tax credit retroactive toJanuary 1, 2004.
RECENTLY ADOPTED ACCOUNTINGPRONOUNCEMENTSShare-Based Compensation
Prior to July 30, 2005, the Company accounted forits share-based compensation under the recognitionand measurement principles of Accounting PrinciplesBoard (“APB”) Opinion No. 25, “Accounting for StockIssued to Employees” and related interpretations,the disclosure-only provisions of SFAS No. 123,“Accounting for Stock-Based Compensation” and thedisclosures required by SFAS No. 148, “Accounting forStock-Based Compensation-Transition and Disclosure.”In accordance with APB Opinion No. 25, no share-based compensation cost was reflected in the Company’sprior year net income for grants of stock optionsbecause the Company grants stock options with anexercise price equal to the market value of the stockon the date of grant.
Effective July 30, 2005, the Company adopted thefair value recognition provisions of SFAS No. 123R. TheCompany elected to adopt using the modified prospec-tive method, under which share-based compensationcost includes amortization over the respective vestingperiods for (1) all share-based payments granted priorto, but not vested as of July 29, 2005, based on thegrant date fair value estimated in accordance with theoriginal provisions of SFAS No. 123 and (2) all share-based payments granted subsequent to July 29, 2005,based on the grant date fair value estimated using abinomial lattice-based option valuation model. Share-based compensation under SFAS No. 123R is recordedin general and administrative expenses in the Consoli-dated Statement of Income in 2006.
Before adoption of SFAS No. 123R, pro formadisclosure reflected the fair value of each option grantestimated on the date of grant using the Black-Scholes option-pricing model. Under the Black-Scholesoption-pricing model the Company estimated volatilityusing only its historical share price performance overthe expected life of the option. However, under SFASNo. 123R the expected volatility is estimated using ablend of implied volatility based on market-tradedoptions on the Company’s common stock and historicalvolatility of the Company’s common stock over thecontractual life of the options. Results of prior periodsdo not reflect any restated amounts and the Companyhad no cumulative effect adjustment upon adoption ofSFAS No. 123R under the modified prospectivemethod. The Company’s policy is to recognize compen-sation cost for awards with only service conditionsand a graded vesting schedule on a straight-line basisover the requisite service period for the entire award.Additionally, the Company issues new shares ofcommon stock to satisfy stock option exercises orgrants of restricted shares.
Compensation cost for share-based paymentarrangements recognized in general and administrativeexpenses for 2006 was $9,900 for stock options and$3,539 for restricted stock grants as compared to noexpense for stock options and $1,261 for restrictedstock in 2005. For 2006, the adoption of SFAS No. 123Rdecreased both the Company’s reported operatingincome and income before income taxes by $9,900 anddecreased reported net income by $6,851. The adoptionof SFAS No. 123R decreased both reported basic anddiluted net income per share by $0.16 and $0.15,respectively for 2006. The adoption of SFAS No. 123Rfor 2006 also resulted in a decrease in reported cashflow from operating activities of $6,441 offset by anincrease in reported cash flow from financing activitiesof $6,441. Because the Company did not adopt SFASNo. 123R until July 30, 2005, operating income, incomebefore income taxes, cash flow from operating activi-ties, cash flow from financing activities, net income orbasic and diluted net income per share during the yearended July 29, 2005 were not affected by its adoption.
As of July 28, 2006, there was $17,162 of totalunrecognized compensation cost related to unvested
36
share-based compensation arrangements that is expectedto be recognized over a weighted-average period of2.10 years. No restricted stock grants vested during 2006.
Rental Costs
In October 2005, the Financial Accounting StandardsBoard (the “FASB”) issued Staff Position No. FAS 13-1,“Accounting for Rental Costs Incurred during aConstruction Period” (“FSP No. 13-1”). FSP No. 13-1states that rental costs associated with ground orbuilding operating leases that are incurred during aconstruction period shall be recognized as rentalexpense in income from continuing operations asopposed to capitalizing such rental costs. Although theprovisions of FSP No. 13-1 are effective for the firstreporting period beginning after December 15, 2005, theCompany has chosen to early adopt this guidancein its first quarter of 2006. The early adoption of FSPNo. 13-1 did not affect the Company’s consolidatedresults of operations or financial position since thistreatment did not differ from the Company’s then-existing accounting policy.
Amortization Period of Leasehold Improvements
In September 2005, the FASB issued Emerging IssuesTask Force (“EITF”) No. 05-6, “Determining theAmortization Period for Leasehold ImprovementsPurchased after Lease Inception or Acquired in aBusiness Combination” (“EITF 05-6”). EITF 05-6 statesthat leasehold improvements acquired in a businesscombination should be amortized over the shorter ofthe useful life of the assets or a term that includesrequired lease periods and renewals that are deemed tobe reasonably assured at the date of acquisition.EITF 05-6 further states that leasehold improvementsplaced in service significantly after and not contem-plated at or near the beginning of a lease term shouldbe amortized over the shorter of the useful life of theassets or a term that includes required lease periodsand renewals that are deemed to be reasonably assuredat the date the leasehold improvements are purchased.This consensus does not apply to preexisting leaseholdimprovements. The provisions of EITF 05-6 areeffective for leasehold improvements that are purchasedor acquired in reporting periods beginning afterSeptember 28, 2005, with early adoption permitted.
The Company adopted this guidance in the first quarterof 2006. The early adoption of EITF 05-6 did notaffect the Company’s results of operations or financialposition since this treatment did not differ from theCompany’s then-existing accounting policy.
Taxes Collected from Customers
In June 2006, a consensus was reached by the FASB onEITF Issue No. 06-3, “How Taxes Collected fromCustomers and Remitted to Governmental AuthoritiesShould Be Presented in the Income Statement (That Is,Gross versus Net Presentation)” (“EITF 06-3”). Aspermitted by the provisions of EITF 06-3, the Company’spolicy is to present sales in the income statementon a net presentation basis after deducting sales tax.
Recent Accounting Pronouncements Not Yet Adopted
In June 2006, the FASB issued Interpretation No. 48,“Accounting for Uncertainty in Income Taxes — aninterpretation of FASB Statement No. 109” (“FIN 48”),which clarifies the accounting for uncertainty in incometaxes recognized in financial statements in accordancewith FASB No. 109, “Accounting for Income Taxes”.FIN 48 prescribes a recognition threshold and measure-ment attribute for the financial statement recognitionand measurement of a tax position taken or expectedto be taken in a tax return. The provisions of FIN 48are effective for fiscal years beginning after December15, 2006, with the cumulative effect of the changein accounting principle recorded as an adjustment toopening retained earnings. The Company is currentlyevaluating the impact of adopting FIN 48 and cannotyet determine the impact of its adoption in the firstquarter of 2008.
Quantitative and Qualitative Disclosures about Market Risk
Interest Rate Risk. The Company is subject to marketrisk exposure related to changes in interest rates. As ofOctober 2, 2006, the Company has a $723,000 TermLoan B and has in place a $200,000 Delayed-Draw TermLoan facility, which mature on April 27, 2013 and a$250,000 Revolving Credit Facility, which matures April27, 2011. The Term Loan B and the facilities bear inter-est, at the Company’s election, either at the prime rateor a percentage point spread from LIBOR based oncertain financial ratios set forth in the loan agreement.
37
At July 28, 2006, the Company had $723,000 outstand-ing under the Term Loan B and no amounts outstandingunder the Delayed-Draw or the Revolving Credit facilities.
The Company is exposed to market risk, such aschanges in interest rates and commodity prices. TheCompany does not hold or use derivative financialinstruments for trading purposes. Prior to 2006, theCompany had no derivative financial instruments thatrequired fair value accounting treatment.
The Company’s policy has been to manage interestcost using a mix of fixed and variable rate debt(see Notes 6, 12 and 14). To manage this risk in a costefficient manner, the Company entered into aninterest rate swap on May 4, 2006 in which it agreed toexchange with a counterparty, at specified intervalseffective August 3, 2006, the difference between fixedand variable interest amounts calculated by referenceto an agreed-upon notional principal amount. Interestrate swaps that meet specific conditions under SFASNo. 133 are accounted for as cash flow hedges. Theswapped portion of our Term Loan B will be fixed ata rate of 5.57% plus our then current credit spread, or7.07% based on today’s credit spread, over the 7-yearlife of the term loan and the interest rate swap. Theswapped portion is $525,000 to May 2, 2007, $650,000from May 3, 2007 to May 4, 2008, $625,000 fromMay 5, 2008 to May 3, 2009, $600,000 from May 4, 2009to May 2, 2010, $575,000 from May 3, 2010 to May 2,2011, $550,000 from May 3, 2011 to May 2, 2012, and$525,000 for May 3, 2012 to May 2, 2013. The esti-mated fair value of this interest rate swap liability was$7,220 at July 28, 2006 and is included in otherlong-term obligations. The offset to the interest rateswap liability is in other comprehensive loss, net ofthe deferred tax asset. Any portion of the fair value ofthe swap determined to be ineffective will be recognizedcurrently in earnings.
While changes in the prime rate or LIBOR wouldaffect the cost of funds borrowed in the future, theCompany believes that the effect, if any, of reasonablypossible near-term changes in interest rates on theCompany’s consolidated financial position, results ofoperations or cash flows would not be material.
Commodity Price Risk. Many of the food productspurchased by the Company are affected by commoditypricing and are, therefore, subject to price volatilitycaused by weather, production problems, delivery diffi-culties and other factors which are outside the controlof the Company and which are generally unpredictable.Four food categories (beef, dairy (including eggs),pork and poultry) account for the largest shares of theCompany’s food purchases at approximately 19%, 11%,10% and 9%, respectively. Other categories affected bythe commodities markets, such as produce and seafood,may each account for as much as 6% of the Company’sfood purchases. While the Company has some of itsfood items prepared to its specifications, the Company’sfood items are based on generally available products,and if any existing suppliers fail, or are unable todeliver in quantities required by the Company, theCompany believes that there are sufficient other qualitysuppliers in the marketplace that its sources of supplycan be replaced as necessary. The Company also recog-nizes, however, that commodity pricing is extremelyvolatile and can change unpredictably and over shortperiods of time. Changes in commodity prices wouldaffect the Company and its competitors generally, anddepending on the terms and duration of supplycontracts, sometimes simultaneously. The Company alsoenters into supply contracts for certain of its productsin an effort to minimize volatility of supply andpricing. In many cases, or over the longer term, theCompany believes it will be able to pass through someor much of the increased commodity costs by adjustingits menu pricing. From time to time, competitivecircumstances, or judgments about consumer acceptanceof price increases, may limit menu price flexibility,and in those circumstances increases in commodityprices can result in lower margins for the Company, ashappened in 2005.
Strategic Initiatives
As previously announced in the Current Report on Form8-K filed with the Securities and Exchange Commission(“SEC”) on March 17, 2006, the Company, with theassistance of a financial advisor, undertook a review ofits capital structure and other potential initiativesintended to enhance shareholder value (the “Review”).
38
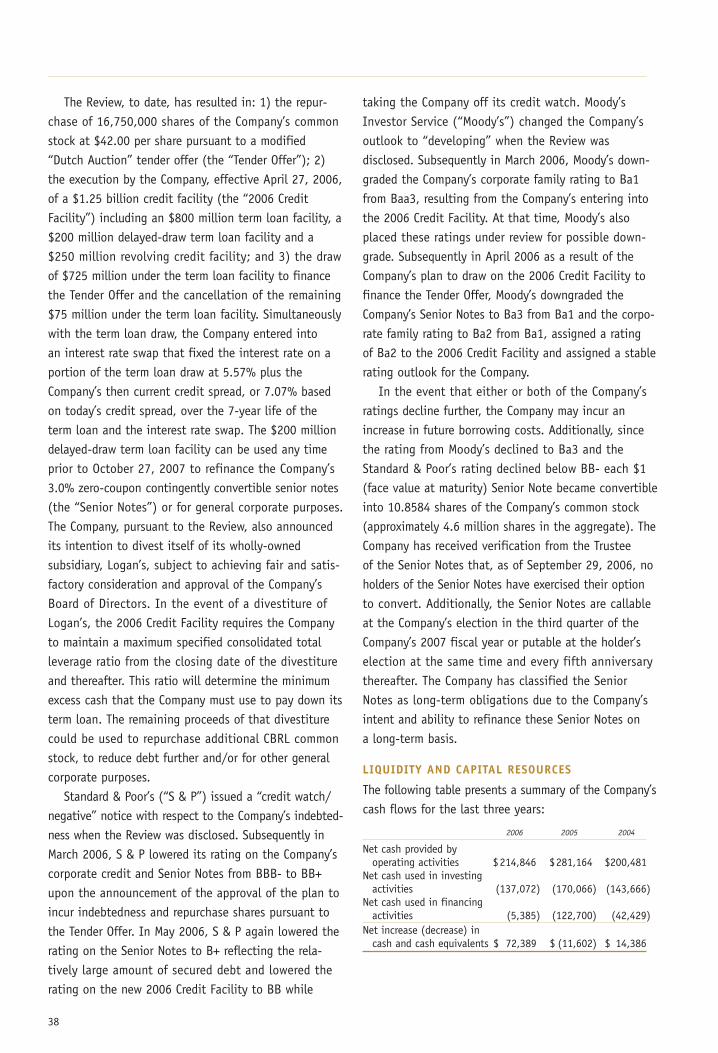
The Review, to date, has resulted in: 1) the repur-chase of 16,750,000 shares of the Company’s commonstock at $42.00 per share pursuant to a modified“Dutch Auction” tender offer (the “Tender Offer”); 2)the execution by the Company, effective April 27, 2006,of a $1.25 billion credit facility (the “2006 CreditFacility”) including an $800 million term loan facility, a$200 million delayed-draw term loan facility and a$250 million revolving credit facility; and 3) the drawof $725 million under the term loan facility to financethe Tender Offer and the cancellation of the remaining$75 million under the term loan facility. Simultaneouslywith the term loan draw, the Company entered intoan interest rate swap that fixed the interest rate on aportion of the term loan draw at 5.57% plus theCompany’s then current credit spread, or 7.07% basedon today’s credit spread, over the 7-year life of theterm loan and the interest rate swap. The $200 milliondelayed-draw term loan facility can be used any timeprior to October 27, 2007 to refinance the Company’s3.0% zero-coupon contingently convertible senior notes(the “Senior Notes”) or for general corporate purposes.The Company, pursuant to the Review, also announcedits intention to divest itself of its wholly-ownedsubsidiary, Logan’s, subject to achieving fair and satis-factory consideration and approval of the Company’sBoard of Directors. In the event of a divestiture ofLogan’s, the 2006 Credit Facility requires the Companyto maintain a maximum specified consolidated totalleverage ratio from the closing date of the divestitureand thereafter. This ratio will determine the minimumexcess cash that the Company must use to pay down itsterm loan. The remaining proceeds of that divestiturecould be used to repurchase additional CBRL commonstock, to reduce debt further and/or for other generalcorporate purposes.
Standard & Poor’s (“S & P”) issued a “credit watch/negative” notice with respect to the Company’s indebted-ness when the Review was disclosed. Subsequently inMarch 2006, S & P lowered its rating on the Company’scorporate credit and Senior Notes from BBB- to BB+upon the announcement of the approval of the plan toincur indebtedness and repurchase shares pursuant tothe Tender Offer. In May 2006, S & P again lowered therating on the Senior Notes to B+ reflecting the rela-tively large amount of secured debt and lowered therating on the new 2006 Credit Facility to BB while
taking the Company off its credit watch. Moody’sInvestor Service (“Moody’s”) changed the Company’soutlook to “developing” when the Review wasdisclosed. Subsequently in March 2006, Moody’s down-graded the Company’s corporate family rating to Ba1from Baa3, resulting from the Company’s entering intothe 2006 Credit Facility. At that time, Moody’s alsoplaced these ratings under review for possible down-grade. Subsequently in April 2006 as a result of theCompany’s plan to draw on the 2006 Credit Facility tofinance the Tender Offer, Moody’s downgraded theCompany’s Senior Notes to Ba3 from Ba1 and the corpo-rate family rating to Ba2 from Ba1, assigned a ratingof Ba2 to the 2006 Credit Facility and assigned a stablerating outlook for the Company.
In the event that either or both of the Company’sratings decline further, the Company may incur anincrease in future borrowing costs. Additionally, sincethe rating from Moody’s declined to Ba3 and theStandard & Poor’s rating declined below BB- each $1(face value at maturity) Senior Note became convertibleinto 10.8584 shares of the Company’s common stock(approximately 4.6 million shares in the aggregate). TheCompany has received verification from the Trusteeof the Senior Notes that, as of September 29, 2006, noholders of the Senior Notes have exercised their optionto convert. Additionally, the Senior Notes are callableat the Company’s election in the third quarter of theCompany’s 2007 fiscal year or putable at the holder’selection at the same time and every fifth anniversarythereafter. The Company has classified the SeniorNotes as long-term obligations due to the Company’sintent and ability to refinance these Senior Notes ona long-term basis.
LIQUIDITY AND CAPITAL RESOURCES
The following table presents a summary of the Company’scash flows for the last three years:
2006 2005 2004
Net cash provided by operating activities $214,846 $281,164 $200,481
Net cash used in investing activities (137,072) (170,066) (143,666)
Net cash used in financing activities (5,385) (122,700) (42,429)
Net increase (decrease) in cash and cash equivalents $ 72,389 $ (11,602) $ 14,386
39
The Company’s cash generated from operatingactivities was $214,846 in 2006. Most of this cash wasprovided by net income adjusted by depreciation andamortization, increases in other long-term obligations,other accrued expenses and income taxes payable,decreases in inventories and other adjustments to netincome from the tax benefit realized upon exerciseof stock options, accretion on zero coupon contingentlyconvertible senior notes, impairment charges and losson disposition of property partially offset by decreasesin deferred income taxes and accrued employeebenefits and increases in other assets.
The Company had negative working capital of $25,585at July 28, 2006 versus negative working capital of$104,862 at July 29, 2005. In the restaurant industry,substantially all sales are either for cash or third-party credit card. Like many other restaurant companies,the Company is able to, and may from time to time,operate with negative working capital. Restaurantinventories purchased through the Company’s principalfood distributor are on terms of net zero days, whilerestaurant inventories purchased locally generally arefinanced from normal trade credit. Retail inventoriespurchased domestically generally are financed fromnormal trade credit, while imported retail inventoriesgenerally are purchased through wire transfers. Thesevarious trade terms are aided by rapid turnover ofthe restaurant inventory. Employees generally are paidon weekly, bi-weekly or semi-monthly schedules inarrears for hours worked, and certain expenses such ascertain taxes and some benefits are deferred for longerperiods of time.
Capital expenditures (purchase of property andequipment) were $144,926, $171,447 and $144,611 in2006, 2005 and 2004, respectively. Costs of new loca-tions accounted for the majority of these expenditures.Capital expenditures in 2006 are net of proceeds frominsurance recoveries of $1,365.
The Company’s new Term Loan B and internallygenerated cash, along with cash at July 29, 2005,proceeds from stock option exercises, the Company’savailable revolver and the Company’s ability to enterinto real estate operating lease arrangements, weresufficient to finance all of its growth, share repurchase,dividend and other cash payment obligations in 2006.
In 2002, the Company issued $422,050 (face valueat maturity) of Senior Notes, maturing on April 2,
2032, and received proceeds totaling approximately$172,756 prior to debt issuance costs. The Senior Notesrequire no cash interest payments and were issued ata discount representing a yield to maturity of 3.00% perannum. The Notes are redeemable at the Company’soption on or after April 3, 2007, and the holders ofthe Notes may require the Company to redeem theNotes on April 3, 2007, 2012, 2017, 2022 or 2027, andin certain other circumstances. In addition, each $1(face value at maturity) Note is convertible into 10.8584shares of the Company’s common stock (approximately4.6 million shares in the aggregate). The Company’sclosing share price, as reported by Nasdaq, on July 28,2006 was $32.41. During the third quarter of 2006,since the rating from Moody’s declined to Ba3 and theStandard & Poor’s rating declined below BB-, eachNote became convertible into 10.8584 shares of theCompany’s common stock. As of September 29, 2006,the Company has received verification from the Trusteethat no holders have exercised their option toconvert. After the adoption of EITF No. 04-08, “TheEffect of Contingently Convertible Instruments onDiluted Earnings per Share,” in the second quarter of2005, the Company was required to include approxi-mately 4.6 million shares in its diluted shares outstand-ing related to its convertible debt. Additionally,diluted consolidated net income per share is calculatedexcluding the after-tax interest and financing expensesassociated with the Senior Notes, since these SeniorNotes are treated as if converted into common stockalthough at the end of 2005 and 2006 the SeniorNotes were not actually converted into stock, nor did therequirements exist that would have allowed themto be converted. Obligations under the Company’s SeniorNotes, which may require short-term repayments in2007, have been classified as long-term debt, reflectingthe Company’s intent and ability to refinance theseborrowings through its existing $200,000 delayed-drawterm loan and its existing credit facilities.
At the beginning of 2006, the Company had 821,081shares remaining under repurchase authorizationspreviously in effect at the end of 2005. During 2006,the Company did not make any share repurchases withthe exception of those made in the Tender Offer. TheCompany has not determined when it expects to repur-chase the remaining 821,081 shares authorized; this
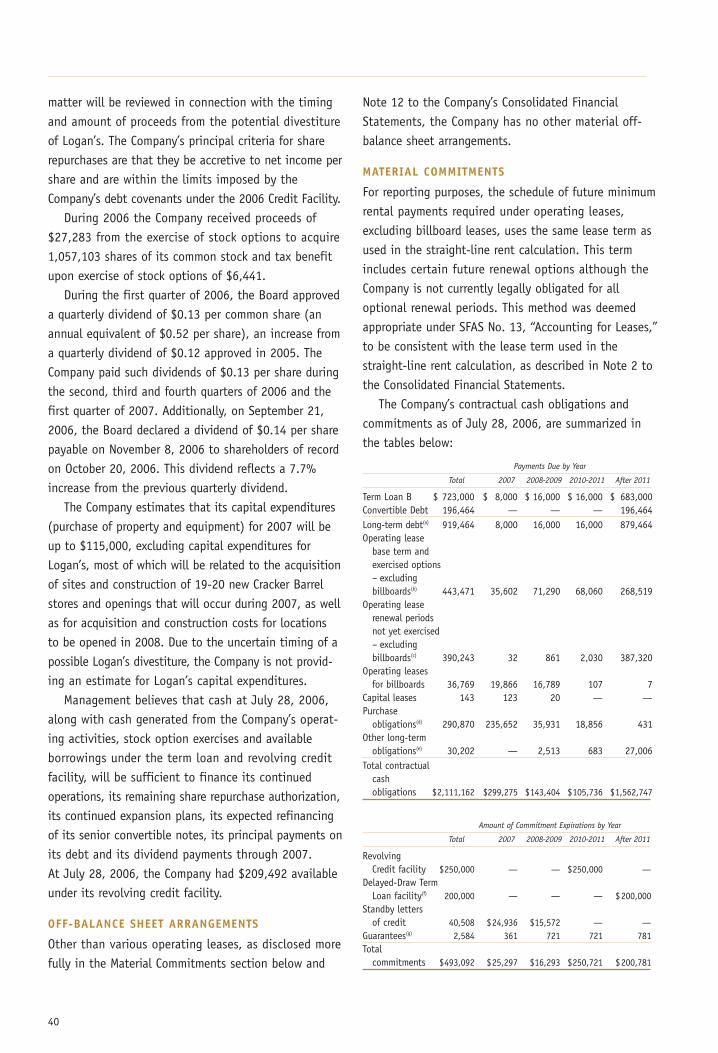
40
matter will be reviewed in connection with the timingand amount of proceeds from the potential divestitureof Logan’s. The Company’s principal criteria for sharerepurchases are that they be accretive to net income pershare and are within the limits imposed by theCompany’s debt covenants under the 2006 Credit Facility.
During 2006 the Company received proceeds of$27,283 from the exercise of stock options to acquire1,057,103 shares of its common stock and tax benefitupon exercise of stock options of $6,441.
During the first quarter of 2006, the Board approveda quarterly dividend of $0.13 per common share (anannual equivalent of $0.52 per share), an increase froma quarterly dividend of $0.12 approved in 2005. TheCompany paid such dividends of $0.13 per share duringthe second, third and fourth quarters of 2006 and thefirst quarter of 2007. Additionally, on September 21,2006, the Board declared a dividend of $0.14 per sharepayable on November 8, 2006 to shareholders of recordon October 20, 2006. This dividend reflects a 7.7%increase from the previous quarterly dividend.
The Company estimates that its capital expenditures(purchase of property and equipment) for 2007 will beup to $115,000, excluding capital expenditures forLogan’s, most of which will be related to the acquisitionof sites and construction of 19-20 new Cracker Barrelstores and openings that will occur during 2007, as wellas for acquisition and construction costs for locationsto be opened in 2008. Due to the uncertain timing of apossible Logan’s divestiture, the Company is not provid-ing an estimate for Logan’s capital expenditures.
Management believes that cash at July 28, 2006,along with cash generated from the Company’s operat-ing activities, stock option exercises and availableborrowings under the term loan and revolving creditfacility, will be sufficient to finance its continuedoperations, its remaining share repurchase authorization,its continued expansion plans, its expected refinancingof its senior convertible notes, its principal payments onits debt and its dividend payments through 2007.At July 28, 2006, the Company had $209,492 availableunder its revolving credit facility.
OFF-BALANCE SHEET ARRANGEMENTS
Other than various operating leases, as disclosed morefully in the Material Commitments section below and
Note 12 to the Company’s Consolidated FinancialStatements, the Company has no other material off-balance sheet arrangements.
MATERIAL COMMITMENTS
For reporting purposes, the schedule of future minimumrental payments required under operating leases,excluding billboard leases, uses the same lease term asused in the straight-line rent calculation. This termincludes certain future renewal options although theCompany is not currently legally obligated for alloptional renewal periods. This method was deemedappropriate under SFAS No. 13, “Accounting for Leases,”to be consistent with the lease term used in thestraight-line rent calculation, as described in Note 2 tothe Consolidated Financial Statements.
The Company’s contractual cash obligations andcommitments as of July 28, 2006, are summarized inthe tables below:
Payments Due by Year
Total 2007 2008-2009 2010-2011 After 2011
Term Loan B $ 723,000 $ 8,000 $ 16,000 $ 16,000 $ 683,000Convertible Debt 196,464 — — — 196,464Long-term debt(a) 919,464 8,000 16,000 16,000 879,464Operating lease
base term and exercised options – excluding billboards(b) 443,471 35,602 71,290 68,060 268,519
Operating lease renewal periods not yet exercised– excluding billboards(c) 390,243 32 861 2,030 387,320
Operating leases for billboards 36,769 19,866 16,789 107 7
Capital leases 143 123 20 — —Purchase
obligations(d) 290,870 235,652 35,931 18,856 431Other long-term
obligations(e) 30,202 — 2,513 683 27,006Total contractual
cashobligations $2,111,162 $299,275 $143,404 $105,736 $1,562,747
Amount of Commitment Expirations by Year
Total 2007 2008-2009 2010-2011 After 2011
Revolving Credit facility $250,000 — — $250,000 —
Delayed-Draw Term Loan facility(f) 200,000 — — — $200,000
Standby letters of credit 40,508 $24,936 $15,572 — —
Guarantees(g) 2,584 361 721 721 781Total
commitments $493,092 $25,297 $16,293 $250,721 $200,781
41
(a) The Convertible Debt was issued at a discount representing ayield to maturity of 3.00% per annum. The $196,464 balance isthe accreted carrying value of the debt at July 28, 2006. TheConvertible Debt will continue to accrete at 3.00% per annumand if held to maturity on April 2, 2032 the obligation willtotal $422,050. The balance on the Term Loan B is $723,000 atJuly 28, 2006. Using the minimum principal payment scheduleon the Term Loan B and a 7.07% interest rate, which is thesame rate as the Company’s fixed rate under its interest rateswap plus its current credit spread of 1.50%, the Company willhave interest payments of $52,310, $100,938, $98,650 and$84,582 in 2007, 2008-2009, 2010-2011 and after 2011,respectively. The Company had no amounts outstanding underits variable rate Revolving Credit facility as of July 28, 2006.The Company paid $1,001 in non-use fees (also known ascommitment fees) on the Revolving Credit facility during 2006.Based on no outstanding revolver balance at July 28, 2006 andthe Company’s current unused commitment fee as defined inthe Revolving Credit Agreement, the Company’s unused commit-ment fees in 2007 would be $2,086; however, the actualamount will differ based on actual usage of the Revolving Creditfacility in 2007.
(b) Includes base lease terms and certain optional renewal periodsthat have been exercised and are included in the lease term inaccordance with SFAS No. 13.
(c) Includes certain optional renewal periods that have not yetbeen exercised, but are included in the lease term for thestraight-line rent calculation, since at the inception of the lease,it is reasonably assured that the Company will exercise thoserenewal options.
(d) Purchase obligations consist of purchase orders for food andretail merchandise; purchase orders for capital expenditures,supplies and other operating needs and other services; andcommitments under contracts for maintenance needs and otherservices. We excluded long-term agreements for services andoperating needs that can be cancelled within 60 days withoutpenalty. We included long-term agreements for services andoperating needs that can be cancelled with more than 60 daysnotice without penalty only through the term of the notice.We included long-term agreements for services and operatingneeds that can be cancelled with a penalty through the entireterm of the contract. Due to the uncertainties of seasonaldemands and promotional calendar changes, our best estimateof usage for food, supplies and other operating needs andservices is ratably over either the notice period or the remaininglife of the contract, as applicable, unless we had betterinformation available at the time related to each contract.
(e) Other long-term obligations include the Company’s Non-Qualified Savings Plan ($24,860, with a corresponding long-term asset to fund the liability; see Note 13 to the ConsolidatedFinancial Statements), Deferred Compensation Plan ($2,573),FY2005 and FY2006 Mid-Term Incentive and Retention Plans($422, cash portion only; see Note 9 to the ConsolidatedFinancial Statements), FY2004, FY2005 and FY2006 Long-TermRetention Incentive Plans ($2,192) and FY2006 SOX RetentionPlan ($155).
(f) The $200,000 Delayed-Draw Term Loan facility can be used anytime prior to October 27, 2007 to refinance the Company’sSenior Notes or for general corporate purposes and any termloans under this facility mature April 27, 2013.
(g) Consists solely of guarantees associated with properties thathave been subleased or assigned. The Company is not aware ofany non-performance under these arrangements that wouldresult in the Company having to perform in accordance with theterms of those guarantees.
CRITICAL ACCOUNTING POLICIES AND ESTIMATES
The Company prepares its Consolidated FinancialStatements in conformity with GAAP. The preparationof these financial statements requires the Companyto make estimates and assumptions that affect thereported amounts of assets and liabilities and disclosureof contingent assets and liabilities at the date ofthe financial statements, and the reported amounts ofrevenues and expenses during the reporting period(see Note 2 to the Company’s Consolidated FinancialStatements). Actual results could differ from thoseestimates. Critical accounting policies are those thatmanagement believes are both most important tothe portrayal of the Company’s financial condition andoperating results, and require management’s mostdifficult, subjective or complex judgments, often as aresult of the need to make estimates about the effectof matters that are inherently uncertain. The Companybases its estimates on historical experience, outsideadvice from parties believed to be experts in suchmatters, and on various other assumptions that arebelieved to be reasonable under the circumstances, theresults of which form the basis for making judgmentsabout the carrying value of assets and liabilities thatare not readily apparent from other sources. Judgmentsand uncertainties affecting the application of thosepolicies may result in materially different amounts beingreported under different conditions or using differentassumptions. The Company considers the followingpolicies to be most critical in understanding the judg-ments that are involved in preparing its ConsolidatedFinancial Statements.
IMPAIRMENT OF LONG-LIVED ASSETS AND PROVISION FOR ASSET DISPOSITIONS
Property and Equipment
The Company assesses the impairment of long-livedassets whenever events or changes in circumstancesindicate that the carrying value may not be recoverable.Recoverability of assets is measured by comparing thecarrying value of the asset to the undiscounted futurecash flows expected to be generated by the asset. Ifthe total expected future cash flows are less than thecarrying amount of the asset, the carrying amount iswritten down to the estimated fair value of an asset tobe held and used or the fair value, net of estimatedcosts of disposal, of an asset to be disposed of, and a
42
loss resulting from impairment is recognized by acharge to income. Judgments and estimates made bythe Company related to the expected useful lives oflong-lived assets are affected by factors such aschanges in economic conditions and changes in oper-ating performance. The accuracy of such provisionscan vary materially from original estimates, andmanagement regularly monitors the adequacy of theprovisions until final disposition occurs.
During 2006, the Company decided to close sevenCracker Barrel stores and three Logan’s restaurants,which resulted in impairment charges and store closingcosts of $8,052. Initially these impairments wererecorded based upon the lower of each unit’s carryingamount or fair value. The units’ fair values were largelydetermined based upon estimates provided by third-party appraisers using market comparables. The impairedlocations were closed in February 2006 and wereclassified at that time as held for sale and were remea-sured at their fair values less the costs to sell. Thelocations were closed due to weak financial performance,an unfavorable outlook, and relatively positiveprospects for proceeds from disposition for certainlocations. Additionally, during 2006 the Companyrecorded an impairment of $838 on its Cracker Barrelmanagement trainee housing facility. As of July 28,2006, the Company had sold three Cracker Barrel storesand one Logan’s restaurant and expects the sale ofthe remaining four owned properties to be completedwithin one year. The store closing charges includedemployee termination benefits, lease termination andother costs and are included in the impairment andstore closing charges line on the accompanyingConsolidated Statement of Income. The Company alsorecorded an impairment loss of $431 in 2005 withrespect to a Cracker Barrel store that was approved torelocate to a stronger site in the same market.
GOODWILL
In addition, at least annually, the Company assessesthe recoverability of goodwill and other intangibleassets. The impairment tests require the Company toestimate fair values of its restaurant concepts bymaking assumptions regarding future cash flows andother factors. This valuation may reflect, among otherthings, such external factors as capital market valuation
for public companies comparable to the operatingunit. If these assumptions change in the future, or ifoperating performance declines, the Company maybe required to record impairment charges for theseassets and such charges could be material.
INSURANCE RESERVES
The Company self-insures a significant portion ofexpected losses under its workers’ compensation, generalliability and health insurance programs. The Companyhas purchased insurance for individual claims thatexceed $500 and $1,000 for certain coverages since2004. Since 2004, the Company has elected not topurchase such insurance for its primary group healthprogram, but its offered benefits are limited to notmore than $1,000 during the lifetime of any employee(including dependents) in the program. The Companyrecords a liability for workers’ compensation andgeneral liability for all unresolved claims and for anactuarially determined estimate of incurred but notreported claims at the anticipated cost to the Companyas of the end of the Company’s third quarter andadjusting it by the actuarially determined losses andactual claims payments for the fourth quarter. Thereserves and losses are determined actuarially from arange of possible outcomes within which no givenestimate is more likely than any other estimate. Inaccordance with SFAS No. 5, “Accounting forContingencies,” the Company records the losses at thelow end of that range and discounts them to presentvalue using a risk-free interest rate based on actuariallyprojected timing of payments. The Company recordsa liability for its group health program for all unpaidclaims based primarily upon a loss developmentanalysis derived from actual group health claimspayment experience provided by the Company’s thirdparty administrator. The Company’s accounting policiesregarding insurance reserves include certain actuarialassumptions or management judgments regardingeconomic conditions, the frequency and severity ofclaims and claim development history and settlementpractices. Changes in these factors in the future mayproduce materially different amounts of expense thanwould be reported under these insurance programs.
43
TAX PROVISION
The Company must make estimates of certain items thatcomprise its income tax provision. These estimatesinclude employer tax credits for items such as FICA taxespaid on employee tip income, Work Opportunity andWelfare to Work credits, as well as estimates related tocertain depreciation and capitalization policies.These estimates are made based on the best availableinformation at the time of the provision and historicalexperience. The Company files its income taxreturns many months after its year end. These returnsare subject to audit by various federal and stategovernments years after the returns are filed and couldbe subject to differing interpretations of the tax laws.The Company then must assess the likelihood ofsuccessful legal proceedings or reach a settlement, eitherof which could result in material adjustments to theCompany’s Consolidated Financial Statements and itsconsolidated financial position.
SHARE-BASED COMPENSATION
In accordance with the adoption of SFAS No. 123R, theCompany recognized share-based compensation expensein 2006. This included expensing stock options asshare-based compensation in 2006, which had not beenrequired or done in previous years. The fair value ofeach option award granted subsequent to July 29, 2005was estimated on the date of grant using a binomiallattice-based option valuation model. This model incor-porates the following ranges of assumptions:• The expected volatility is a blend of implied volatility
based on market-traded options on the Company’sstock and historical volatility of the Company’s stockover the contractual life of the options.
• The Company uses historical data to estimate optionexercise and employee termination behavior withinthe valuation model; separate groups of employeesthat have similar historical exercise behavior areconsidered separately for valuation purposes. Theexpected life of options granted is derived from theoutput of the option valuation model and repre-sents the period of time the options are expectedto be outstanding.
• The risk-free interest rate is based on the U.S.Treasury yield curve in effect at the time of grant forperiods within the contractual life of the option.
• The expected dividend yield is based on theCompany’s current dividend yield as the best estimateof projected dividend yield for periods within thecontractual life of the option.The expected volatility, option exercise and termina-
tion assumptions involve management’s best estimatesat that time, all of which impact the fair value ofthe option calculated by the binomial lattice-basedoption valuation model and, ultimately, the expensethat will be recognized over the life of the option.Management updates the historical and implied compo-nents of the expected volatility assumption quarterly.Management updates option exercise and terminationassumptions quarterly. The expected life is a by-product of the lattice model, and is updated when newgrants are made.
SFAS No. 123R also requires that compensationexpense be recognized for only the portion of optionsthat are expected to vest. Therefore, an estimatedforfeiture rate derived from historical employee termi-nation behavior, grouped by job classification, isapplied against share-based compensation expense. Theforfeiture rate is applied on a straight-line basis overthe service (vesting) period for each separately vestingportion of the award as if the award was, in-substance,multiple awards. Management updates the estimatedforfeiture rate to actual on each of the vesting datesand adjusts compensation expense accordingly, sothat the amount of compensation cost recognized atany date is at least equal to the portion of the grant-date value of the award that is vested at that date.
UNREDEEMED GIFT CARDS AND CERTIFICATES
Unredeemed gift cards and certificates represent aliability of the Company related to deferred revenue andare recorded at their expected redemption value. Forthose states that exempt gift cards and certificatesfrom their escheat laws, the Company makes estimatesof the ultimate unredeemed (“breakage”) gift cards andcertificates in the period of the original sale for thosestates that exempt gift cards and certificates from theirescheat laws and amortizes this breakage over theredemption period that other gift cards and certificateshistorically have been redeemed by reducing its liabilityand recording revenue accordingly. For those statesthat do not exempt gift cards and certificates from
44
their escheat laws, the Company records breakage inthe period that gift cards and certificates are remittedto the state for those states that do not exempt giftcards and certificates from their escheat laws andreduces its liability and records revenue accordingly.Changes in redemption behavior or management’sjudgments regarding redemption trends in the futuremay produce materially different amounts of deferredrevenue to be reported.
LEGAL PROCEEDINGS
The Company and its subsidiaries are parties to variouslegal and regulatory proceedings and claims incidentalto its business. In the opinion of management,however, based upon information currently available,the ultimate liability with respect to these actionswill not materially affect the Company’s consolidatedresults of operations or financial position. TheCompany reviews outstanding claims and proceedingsinternally and with external counsel as necessary toassess probability of loss and for the ability to estimateloss. These assessments are re-evaluated each quarteror as new information becomes available to determinewhether a reserve should be established or if anyexisting reserve should be adjusted. The actual cost ofresolving a claim or proceeding ultimately may besubstantially different than the amount of the recordedreserve. In addition, because it is not permissibleunder GAAP to establish a litigation reserve until theloss is both probable and estimable, in some casesthere may be insufficient time to establish a reserveprior to the actual incurrence of the loss (uponverdict and judgment at trial, for example, or in thecase of a quickly negotiated settlement).
The Company is a member of a class of a settledlawsuit against Visa U.S.A. Inc. (“Visa”) and MasterCardInternational Incorporated (“MasterCard”). The VisaCheck/Mastermoney Antitrust litigation settlementbecame final on June 1, 2005. The settlement provides$3,050,000 in compensatory relief by Visa andMasterCard to be funded over a fixed period of time to
respective Settlement Funds. The Company expects toreceive approximately $1,700 ($900 after taxes andthird party collection fees) as its share of the proceedsfrom the settlement. The Company believes this settle-ment represents an indeterminate mix of loss recoveryand gain contingency and therefore believes theapplication of a gain contingency model is the appro-priate model to use for the entire amount of expectedproceeds. Therefore, the Company decided to exclude theexpected settlement proceeds from recognition inthe consolidated financial statements for the year endedJuly 28, 2006. At the time the settlement is knownbeyond a reasonable doubt, the Company will recordsuch gain contingency.
45
We are responsible for establishing and maintainingadequate internal controls over financial reporting (asdefined in Rules 13a-15(f) and 15d-15(f) under theSecurities and Exchange Act of 1934, as amended).We maintain a system of internal controls that isdesigned to provide reasonable assurance in a cost-effective manner as to the fair and reliable preparationand presentation of the consolidated financial state-ments, as well as to safeguard assets from unauthorizeduse or disposition.
Our control environment is the foundation for oursystem of internal control over financial reporting andis embodied in our Corporate Governance Guidelines,our Financial Code of Ethics, and our Code of BusinessConduct and Ethics, all of which may be viewed onour website. They set the tone for our organization andinclude factors such as integrity and ethical values.Our internal control over financial reporting is supportedby formal policies and procedures, which are reviewed,modified and improved as changes occur in businesscondition and operations. Our disclosure controlsand procedures and our internal controls, however,will not and can not prevent all error and all fraud.A control system, no matter how well conceived andoperated, can provide only reasonable, not absolute,assurance that the objectives of the control systemare met. Further, the design of a control system mustreflect the benefits of controls relative to theircosts. Because of the inherent limitations in allcontrol systems, no evaluation of controls can provideabsolute assurance that all control issues andinstances of fraud, if any, within the Company havebeen detected.
We conducted an evaluation of the effectiveness ofour internal control over financial reporting based onthe framework in Internal Control-Integrated Frameworkissued by the Committee of Sponsoring Organizationsof the Treadway Commission. This evaluation includedreview of the documentation of controls, evaluationof the design effectiveness of controls, testing of theoperating effectiveness of controls and a conclusionon this evaluation. We have concluded that our internalcontrol over financial reporting was effective as ofJuly 28, 2006, based on these criteria.
In addition, Deloitte & Touche LLP, an independentregistered public accounting firm, has issued anattestation report on management’s assessment ofinternal control over financial reporting, which isincluded herein.
Michael A. WoodhouseChairman, President and Chief Executive Officer
Lawrence E. WhiteSenior Vice President, Finance and Chief Financial Officer
CBRL GROUP, INC .
Management’s Report on Internal Control over Financial Reporting
46
TO THE BOARD OF DIRECTORS AND SHAREHOLDERSOF CBRL GROUP, INC.:
We have audited the accompanying consolidatedbalance sheets of CBRL Group, Inc. and subsidiaries(the “Company”) as of July 28, 2006 and July 29,2005, and the related consolidated statements ofincome, changes in shareholders’ equity, and cashflows for each of the three fiscal years in the periodended July 28, 2006. These consolidated financialstatements are the responsibility of the Company’smanagement. Our responsibility is to express anopinion on these consolidated financial statementsbased on our audits.
We conducted our audits in accordance with stan-dards of the Public Company Accounting OversightBoard (United States). Those standards require that weplan and perform the audit to obtain reasonableassurance about whether the financial statements arefree of material misstatement. An audit includesexamining, on a test basis, evidence supporting theamounts and disclosures in the financial statements.An audit also includes assessing the accountingprinciples used and significant estimates made bymanagement, as well as evaluating the overallfinancial statement presentation. We believe that ouraudits provide a reasonable basis for our opinion.
In our opinion, such consolidated financial state-ments present fairly, in all material respects, thefinancial position of CBRL Group, Inc. and subsidiariesas of July 28, 2006 and July 29, 2005, and the resultsof their operations and their cash flows for each ofthe three fiscal years in the period ended July 28,2006, in conformity with accounting principles gener-ally accepted in the United States of America.
As discussed in Note 8 to the consolidated finan-cial statements, the Company adopted the fairvalue recognition provisions of Statement of FinancialAccounting Standards No. 123 (Revised 2004),Share Based Payment effective July 30, 2005, whichresulted in the Company changing the methodin which it accounts for share-based compensation.
We have also audited, in accordance with thestandards of the Public Company Accounting OversightBoard (United States), the effectiveness of theCompany’s internal control over financial reporting asof July 28, 2006, based on the criteria establishedin Internal Control—Integrated Framework issued bythe Committee of Sponsoring Organizations of theTreadway Commission and our report dated October 3,2006 expressed an unqualified opinion on manage-ment’s assessment of the effectiveness of theCompany’s internal control over financial reporting andan unqualified opinion on the effectiveness of theCompany’s internal control over financial reporting.
Nashville, TennesseeOctober 3, 2006
Report of Independent Registered Public Accounting Firm
47
generally accepted accounting principles, and thatreceipts and expenditures of the company are beingmade only in accordance with authorizations ofmanagement and directors of the company; and (3)provide reasonable assurance regarding preventionor timely detection of unauthorized acquisition, use, ordisposition of the company’s assets that could havea material effect on the financial statements.
Because of the inherent limitations of internalcontrol over financial reporting, including the possibil-ity of collusion or improper management override ofcontrols, material misstatements due to error or fraudmay not be prevented or detected on a timely basis.Also, projections of any evaluation of the effective-ness of the internal control over financial reportingto future periods are subject to the risk that thecontrols may become inadequate because of changesin conditions, or that the degree of compliance withthe policies or procedures may deteriorate.
In our opinion, management’s assessment that theCompany maintained effective internal control overfinancial reporting as of July 28, 2006, is fairly stated,in all material respects, based on the criteria estab-lished in Internal Control—Integrated Framework issuedby the Committee of Sponsoring Organizations of theTreadway Commission. Also in our opinion, the Companymaintained, in all material respects, effective internalcontrol over financial reporting as of July 28, 2006,based on the criteria established in Internal Control—Integrated Framework issued by the Committee ofSponsoring Organizations of the Treadway Commission.
We have also audited, in accordance with thestandards of the Public Company Accounting OversightBoard (United States of America), the consolidatedfinancial statements as of and for the year ended July28, 2006, of the Company and our report dated October3, 2006, expressed an unqualified opinion on thoseconsolidated financial statements and included anexplanatory paragraph referring to the Company adopt-ing the fair value recognition provisions of Statement ofFinancial Accounting Standards No. 123 (Revised2004), Share Based Payment effective July 30, 2005.
Nashville, TennesseeOctober 3, 2006
Report of Independent Registered Public Accounting Firm
TO THE BOARD OF DIRECTORS AND SHAREHOLDERSOF CBRL GROUP, INC.:
We have audited management’s assessment, includedin the accompanying Management’s Report on InternalControl over Financial Reporting, that CBRL Group,Inc. and subsidiaries (the “Company”) maintainedeffective internal control over financial reportingas of July 28, 2006, based on criteria established inInternal Control—Integrated Framework issued bythe Committee of Sponsoring Organizations of theTreadway Commission. The Company’s management isresponsible for maintaining effective internal controlover financial reporting and for its assessment of theeffectiveness of internal control over financial report-ing. Our responsibility is to express an opinion onmanagement’s assessment and an opinion on theeffectiveness of the Company’s internal control overfinancial reporting based on our audit.
We conducted our audit in accordance with thestandards of the Public Company Accounting OversightBoard (United States of America). Those standardsrequire that we plan and perform the audit to obtainreasonable assurance about whether effective internalcontrol over financial reporting was maintained in allmaterial respects. Our audit included obtaining anunderstanding of internal control over financial report-ing, evaluating management’s assessment, testingand evaluating the design and operating effectivenessof internal control, and performing such other proce-dures as we considered necessary in the circumstances.We believe that our audit provides a reasonable basisfor our opinions.
A company’s internal control over financial reportingis a process designed by, or under the supervision of,the company’s principal executive and principal finan-cial officers, or persons performing similar functions,and effected by the company’s board of directors,management, and other personnel to provide reasonableassurance regarding the reliability of financial report-ing and the preparation of financial statementsfor external purposes in accordance with generallyaccepted accounting principles. A company’s internalcontrol over financial reporting includes those policiesand procedures that (1) pertain to the maintenance ofrecords that, in reasonable detail, accurately and fairlyreflect the transactions and dispositions of the assetsof the company; (2) provide reasonable assurance thattransactions are recorded as necessary to permitpreparation of financial statements in accordance with
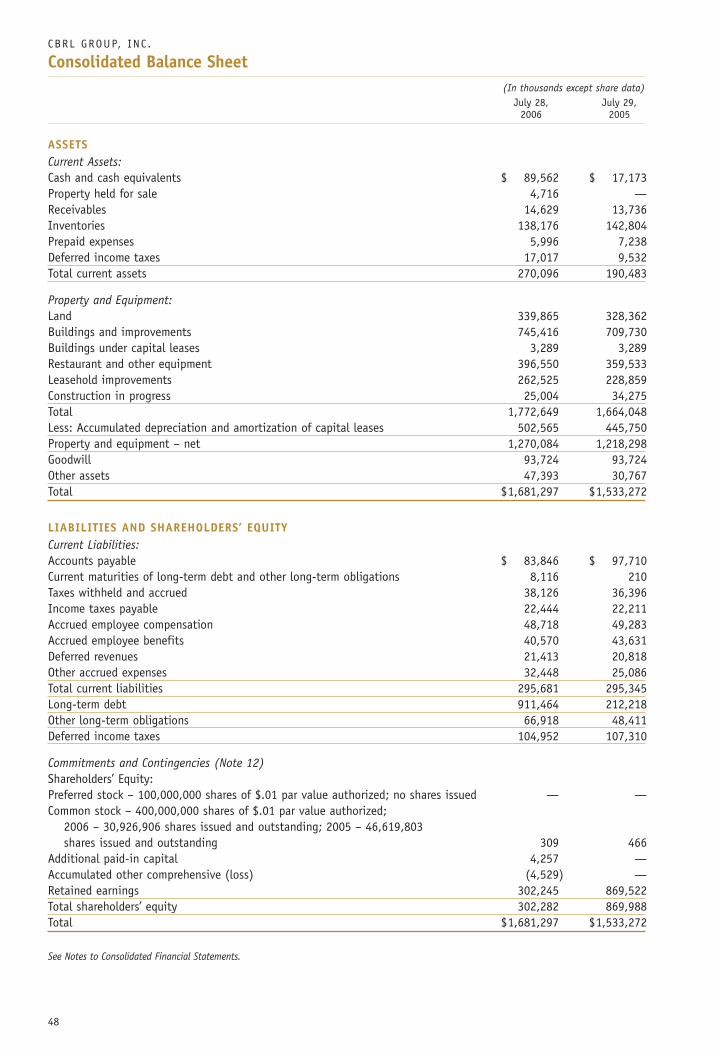
CBRL GROUP, INC .
48
Consolidated Balance Sheet(In thousands except share data)
July 28, July 29,2006 2005
ASSETSCurrent Assets:Cash and cash equivalents $ 89,562 $ 17,173Property held for sale 4,716 —Receivables 14,629 13,736Inventories 138,176 142,804Prepaid expenses 5,996 7,238Deferred income taxes 17,017 9,532Total current assets 270,096 190,483
Property and Equipment:Land 339,865 328,362Buildings and improvements 745,416 709,730Buildings under capital leases 3,289 3,289Restaurant and other equipment 396,550 359,533Leasehold improvements 262,525 228,859Construction in progress 25,004 34,275Total 1,772,649 1,664,048Less: Accumulated depreciation and amortization of capital leases 502,565 445,750Property and equipment – net 1,270,084 1,218,298Goodwill 93,724 93,724Other assets 47,393 30,767Total $1,681,297 $1,533,272
LIABILITIES AND SHAREHOLDERS’ EQUITYCurrent Liabilities:Accounts payable $ 83,846 $ 97,710Current maturities of long-term debt and other long-term obligations 8,116 210Taxes withheld and accrued 38,126 36,396Income taxes payable 22,444 22,211Accrued employee compensation 48,718 49,283Accrued employee benefits 40,570 43,631Deferred revenues 21,413 20,818Other accrued expenses 32,448 25,086Total current liabilities 295,681 295,345Long-term debt 911,464 212,218Other long-term obligations 66,918 48,411Deferred income taxes 104,952 107,310
Commitments and Contingencies (Note 12)Shareholders’ Equity:Preferred stock – 100,000,000 shares of $.01 par value authorized; no shares issued — —Common stock – 400,000,000 shares of $.01 par value authorized;
2006 – 30,926,906 shares issued and outstanding; 2005 – 46,619,803 shares issued and outstanding 309 466
Additional paid-in capital 4,257 —Accumulated other comprehensive (loss) (4,529) —Retained earnings 302,245 869,522Total shareholders’ equity 302,282 869,988Total $1,681,297 $1,533,272
See Notes to Consolidated Financial Statements.
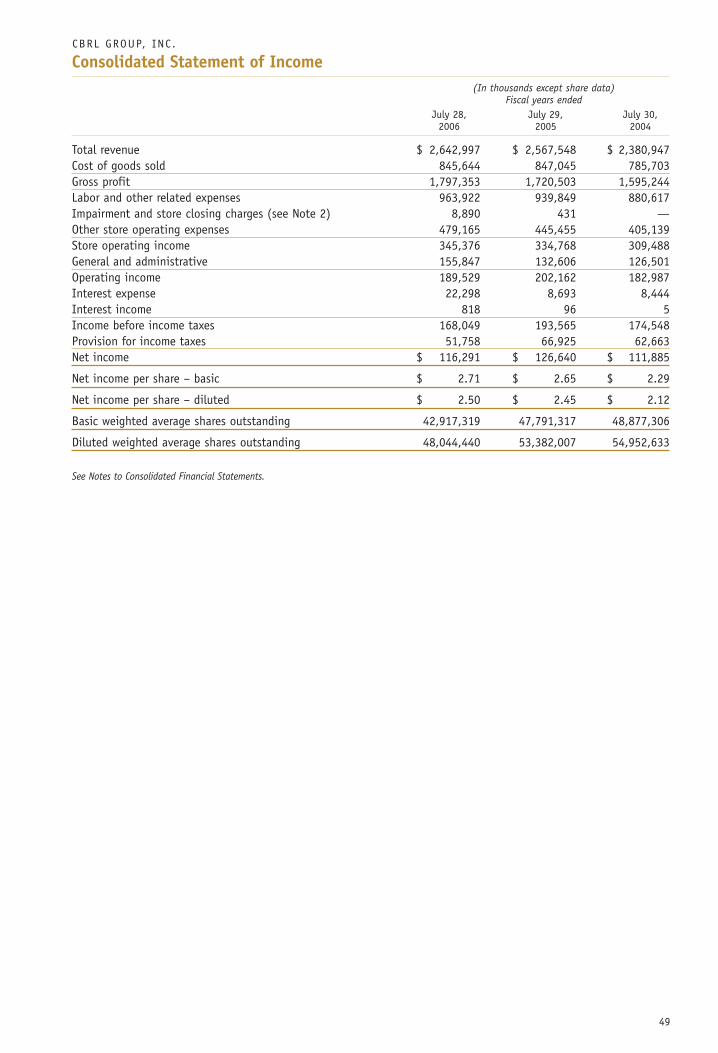
49
CBRL GROUP, INC .
Consolidated Statement of Income(In thousands except share data)
Fiscal years endedJuly 28, July 29, July 30,
2006 2005 2004
Total revenue $ 2,642,997 $ 2,567,548 $ 2,380,947Cost of goods sold 845,644 847,045 785,703Gross profit 1,797,353 1,720,503 1,595,244Labor and other related expenses 963,922 939,849 880,617Impairment and store closing charges (see Note 2) 8,890 431 —Other store operating expenses 479,165 445,455 405,139Store operating income 345,376 334,768 309,488General and administrative 155,847 132,606 126,501Operating income 189,529 202,162 182,987Interest expense 22,298 8,693 8,444Interest income 818 96 5Income before income taxes 168,049 193,565 174,548Provision for income taxes 51,758 66,925 62,663Net income $ 116,291 $ 126,640 $ 111,885
Net income per share – basic $ 2.71 $ 2.65 $ 2.29
Net income per share – diluted $ 2.50 $ 2.45 $ 2.12
Basic weighted average shares outstanding 42,917,319 47,791,317 48,877,306
Diluted weighted average shares outstanding 48,044,440 53,382,007 54,952,633
See Notes to Consolidated Financial Statements.
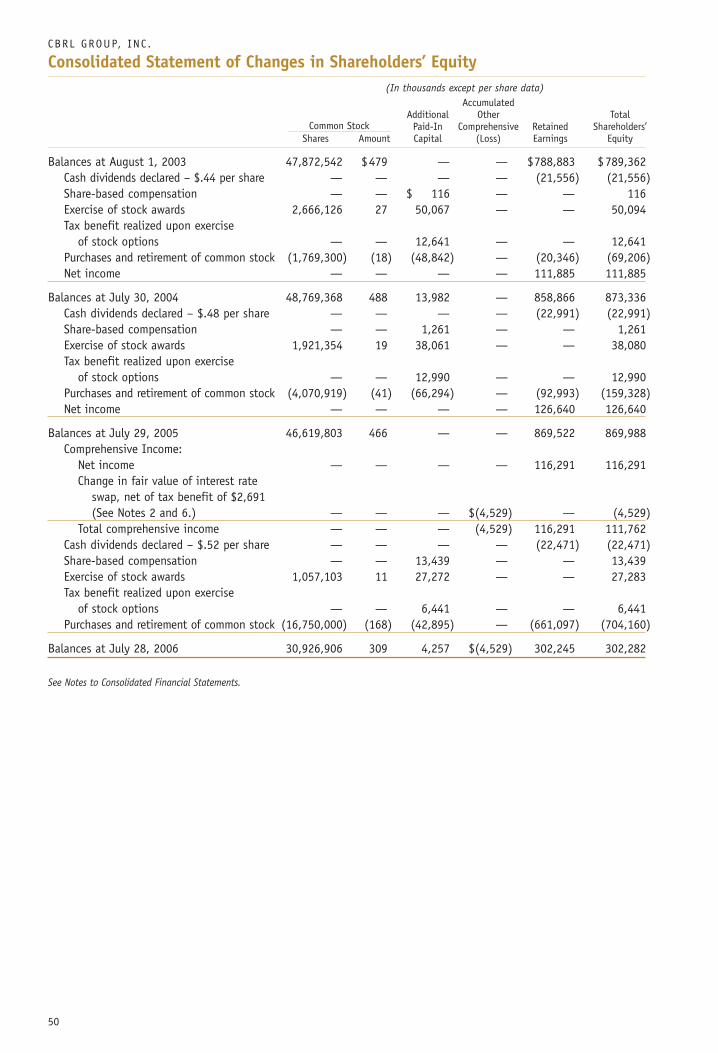
CBRL GROUP, INC .
50
Consolidated Statement of Changes in Shareholders’ Equity(In thousands except per share data)
AccumulatedAdditional Other Total
Common Stock Paid-In Comprehensive Retained Shareholders’Shares Amount Capital (Loss) Earnings Equity
Balances at August 1, 2003 47,872,542 $479 — — $788,883 $789,362Cash dividends declared – $.44 per share — — — — (21,556) (21,556)Share-based compensation — — $ 116 — — 116Exercise of stock awards 2,666,126 27 50,067 — — 50,094Tax benefit realized upon exercise
of stock options — — 12,641 — — 12,641Purchases and retirement of common stock (1,769,300) (18) (48,842) — (20,346) (69,206)Net income — — — — 111,885 111,885
Balances at July 30, 2004 48,769,368 488 13,982 — 858,866 873,336Cash dividends declared – $.48 per share — — — — (22,991) (22,991)Share-based compensation — — 1,261 — — 1,261Exercise of stock awards 1,921,354 19 38,061 — — 38,080Tax benefit realized upon exercise
of stock options — — 12,990 — — 12,990Purchases and retirement of common stock (4,070,919) (41) (66,294) — (92,993) (159,328)Net income — — — — 126,640 126,640
Balances at July 29, 2005 46,619,803 466 — — 869,522 869,988Comprehensive Income:
Net income — — — — 116,291 116,291Change in fair value of interest rate
swap, net of tax benefit of $2,691 (See Notes 2 and 6.) — — — $(4,529) — (4,529)
Total comprehensive income — — — (4,529) 116,291 111,762Cash dividends declared – $.52 per share — — — — (22,471) (22,471)Share-based compensation — — 13,439 — — 13,439Exercise of stock awards 1,057,103 11 27,272 — — 27,283Tax benefit realized upon exercise
of stock options — — 6,441 — — 6,441Purchases and retirement of common stock (16,750,000) (168) (42,895) — (661,097) (704,160)
Balances at July 28, 2006 30,926,906 309 4,257 $(4,529) 302,245 302,282
See Notes to Consolidated Financial Statements.
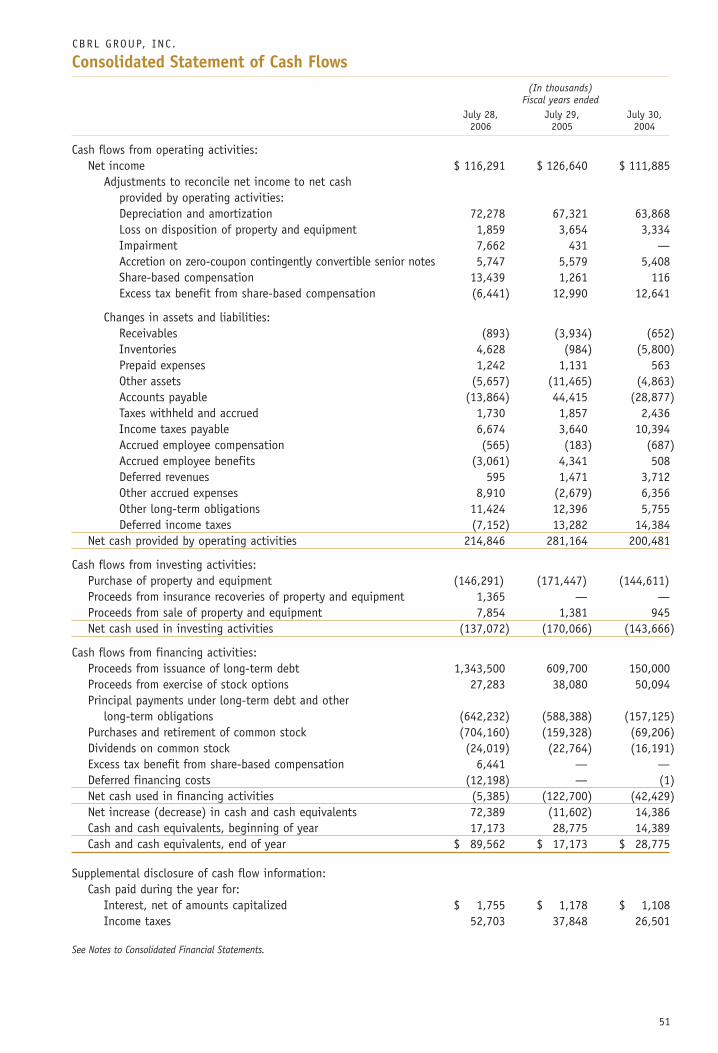
51
CBRL GROUP, INC .
Consolidated Statement of Cash Flows(In thousands)
Fiscal years endedJuly 28, July 29, July 30,
2006 2005 2004
Cash flows from operating activities:Net income $ 116,291 $ 126,640 $ 111,885
Adjustments to reconcile net income to net cash provided by operating activities:Depreciation and amortization 72,278 67,321 63,868Loss on disposition of property and equipment 1,859 3,654 3,334Impairment 7,662 431 —Accretion on zero-coupon contingently convertible senior notes 5,747 5,579 5,408Share-based compensation 13,439 1,261 116Excess tax benefit from share-based compensation (6,441) 12,990 12,641
Changes in assets and liabilities:Receivables (893) (3,934) (652)Inventories 4,628 (984) (5,800)Prepaid expenses 1,242 1,131 563Other assets (5,657) (11,465) (4,863)Accounts payable (13,864) 44,415 (28,877)Taxes withheld and accrued 1,730 1,857 2,436Income taxes payable 6,674 3,640 10,394Accrued employee compensation (565) (183) (687)Accrued employee benefits (3,061) 4,341 508Deferred revenues 595 1,471 3,712Other accrued expenses 8,910 (2,679) 6,356Other long-term obligations 11,424 12,396 5,755Deferred income taxes (7,152) 13,282 14,384
Net cash provided by operating activities 214,846 281,164 200,481
Cash flows from investing activities:Purchase of property and equipment (146,291) (171,447) (144,611)Proceeds from insurance recoveries of property and equipment 1,365 — —Proceeds from sale of property and equipment 7,854 1,381 945Net cash used in investing activities (137,072) (170,066) (143,666)
Cash flows from financing activities:Proceeds from issuance of long-term debt 1,343,500 609,700 150,000Proceeds from exercise of stock options 27,283 38,080 50,094Principal payments under long-term debt and other
long-term obligations (642,232) (588,388) (157,125)Purchases and retirement of common stock (704,160) (159,328) (69,206)Dividends on common stock (24,019) (22,764) (16,191)Excess tax benefit from share-based compensation 6,441 — —Deferred financing costs (12,198) — (1)Net cash used in financing activities (5,385) (122,700) (42,429)Net increase (decrease) in cash and cash equivalents 72,389 (11,602) 14,386Cash and cash equivalents, beginning of year 17,173 28,775 14,389Cash and cash equivalents, end of year $ 89,562 $ 17,173 $ 28,775
Supplemental disclosure of cash flow information:Cash paid during the year for:
Interest, net of amounts capitalized $ 1,755 $ 1,178 $ 1,108Income taxes 52,703 37,848 26,501
See Notes to Consolidated Financial Statements.
52
1 DESCRIPTION OF THE BUSINESS
CBRL Group, Inc. and its affiliates (collectively, in theNotes, the “Company”) are principally engaged inthe operation and development in the United Statesof the Cracker Barrel Old Country Store® (“CrackerBarrel”) restaurant and retail concept and the Logan’sRoadhouse® (“Logan’s”) restaurant concept.
2 SUMMARY OF SIGNIFICANT ACCOUNTING POLICIES
GAAP – The accompanying Consolidated FinancialStatements have been prepared in accordance withgenerally accepted accounting principles in the UnitedStates (“GAAP”).
Fiscal year – The Company’s fiscal year ends on theFriday nearest July 31st and each quarter consists ofthirteen weeks unless noted otherwise. References inthese Notes to a year or quarter are to the Company’sfiscal year or quarter unless noted otherwise.
Principles of consolidation – The Consolidated Finan-cial Statements include the accounts of the Companyand its subsidiaries, all of which are wholly owned. Allsignificant intercompany transactions and balanceshave been eliminated.
Financial instruments – The fair values of cash andcash equivalents, accounts receivable, and accountspayable as of July 28, 2006, approximate their carry-ing amounts due to their short duration. The carryingvalue and fair value of the Company’s zero-couponcontingently convertible senior notes (the “SeniorNotes”) in long-term debt at July 28, 2006 were$196,464 and $195,726, respectively. The fair value ofthe Senior Notes in long-term debt is determinedbased on market prices using the average of the bidand ask prices as of July 28, 2006. The fair value ofthe Company’s variable-rate Term Loan B approximatesits carrying value. The estimated fair value of theCompany’s interest rate swap liability on a portion ofits Term Loan B is included in other long-termobligations (see “Derivative instruments and hedgingactivities” in this Note).
The Company adopted Emerging Issues Task Force(“EITF”) No. 04-8, “The Effect of ContingentlyConvertible Instruments on Diluted Earnings per Share”issued by the Financial Accounting Standards Board(“FASB”), in the second quarter of 2005. EITF 04-8
requires the use of “if-converted” accounting forcontingently convertible debt regardless of whetherthe contingencies allowing debt holders to converthave been met. The adoption of EITF 04-8 resulted inthe Company’s Senior Notes (see Note 4 for the impacton the net income per share calculation and Note 6for a description of these Senior Notes) representing adilutive security and requiring approximately 4.6million shares to be included in diluted weightedaverage shares outstanding for the calculation ofdiluted net income per share. Additionally, dilutedconsolidated net income per share is calculatedexcluding the after-tax interest and financing expensesassociated with the Senior Notes since these SeniorNotes are treated as if converted into common stock.EITF 04-8 affects only the calculation of dilutednet income per share, and has no effect on the finan-cial statements themselves or on the terms of theSenior Notes.
Cash and cash equivalents – The Company’s policy isto consider all highly liquid investments purchasedwith an original maturity of three months or less to becash equivalents.
Inventories – Inventories are stated at the lowerof cost or market. Cost of restaurant inventory isdetermined by the first-in, first-out (FIFO) method.Approximately 70% of retail inventories are valuedusing the retail inventory method and the remaining30% are valued using an average cost method.Valuation provisions are included for retail inventoryobsolescence, returns and amortization of certain items.
Store pre-opening costs – Start-up costs of a newstore are expensed when incurred, with the exceptionof rent expense under operating leases, in whichthe straight-line rent includes the pre-opening periodduring construction, as explained further underthe Operating Leases section of this Note 2 to theConsolidated Financial Statements.
Property and equipment – Property and equipmentare stated at cost. For financial reporting purposes,depreciation and amortization on these assets arecomputed by use of the straight-line and doubledeclining balance methods over the estimated usefullives of the respective assets, as follows:
CBRL GROUP, INC .
Notes to Consolidated Financial Statements(In thousands except share data)
53
Years
Buildings and improvements 30-45Buildings under capital leases 15-25Restaurant and other equipment 2-10Leasehold improvements 1-35
Depreciation expense was $71,049, $66,687 and$62,304 for 2006, 2005 and 2004, respectively.Accelerated depreciation methods are generally usedfor income tax purposes.
Capitalized interest was $756, $870 and $615 for2006, 2005 and 2004, respectively.
Gain or loss is recognized upon disposal of propertyand equipment, and the asset and related accumulateddepreciation and amortization amounts are removedfrom the accounts.
Maintenance and repairs, including the replacementof minor items, are charged to expense, and majoradditions to property and equipment are capitalized.
Impairment of long-lived assets – The Companyassesses the impairment of long-lived assets wheneverevents or changes in circumstances indicate that thecarrying value may not be recoverable. Recoverabilityof assets is measured by comparing the carrying valueof the asset to the undiscounted future cash flowsexpected to be generated by the asset. If the totalexpected future cash flows are less than the carryingamount of the asset, the carrying amount is writtendown to the estimated fair value of an asset to beheld and used or the fair value, net of estimated costsof disposal, of an asset to be disposed of, and a lossresulting from impairment is recognized by a charge toincome. Judgments and estimates made by theCompany related to the expected useful lives of long-lived assets are affected by factors such as changes ineconomic conditions and changes in operatingperformance. The accuracy of such provisions can varymaterially from original estimates, and managementregularly monitors the adequacy of the provisions untilfinal disposition occurs.
During 2006, the Company decided to close sevenCracker Barrel stores and three Logan’s restaurants,which resulted in impairment charges and store closingcosts of $8,052. Initially these impairments wererecorded based upon the lower of unit carrying amountor fair value. The units’ fair values largely weredetermined based upon estimates provided by third-party appraisers using market comparables. The
impaired locations were closed in February 2006 andwere classified at that time as held for sale and wereremeasured at their fair value less cost to sell. Thelocations were closed due to weak financial perform-ance, an unfavorable outlook, and relatively positiveprospects for proceeds from disposition for certainlocations. Additionally, during 2006, the Companyrecorded an impairment of $838 on its Cracker Barrelmanagement trainee housing facility. As of July 28,2006, the Company had sold three Cracker Barrelstores and one Logan’s restaurant and expects the saleof the remaining four owned properties to becompleted within one year. The store closing chargesincluded employee termination benefits, leasetermination and other costs and are included in theimpairment and store closing charges line on theaccompanying Consolidated Statement of Income. Theremaining accrual for store closing costs at July 28,2006 was $494. The Company also recorded an impair-ment loss of $431 in 2005 with respect to a CrackerBarrel store that was approved to relocate to a strongersite in the same market. The results of operations forall restaurants closed in fiscal 2006 and 2005 are notmaterial to our consolidated financial position,results of operations or cash flows, and, therefore, havenot been presented as discontinued operations.
Operating leases – The Company has ground leasesand office space leases that are recorded as operatingleases. Most of the leases have rent escalation clausesand some have rent holiday and contingent rentprovisions. In accordance with FASB Technical Bulletin(“FTB”) No. 85-3, “Accounting for Operating Leaseswith Scheduled Rent Increases,” the liabilities underthese leases are recognized on the straight-line basisover the shorter of the useful life, with a maximum of35 years, or the related lease life. The Company usesa lease life that generally begins on the date that theCompany becomes legally obligated under the lease,including the pre-opening period during construction,when in many cases the Company is not makingrent payments, and generally extends through certainof the renewal periods that can be exercised at theCompany’s option, for which at the inception of thelease, it is reasonably assured that the Company willexercise those renewal options.
54
Certain leases provide for rent holidays, whichare included in the lease life used for the straight-linerent calculation in accordance with FTB No. 88-1,“Issues Relating to Accounting for Leases.” Rentexpense and an accrued rent liability are recordedduring the rent holiday periods, during which theCompany has possession of and access to the property,but is not required or obligated to, and normallydoes not, make rent payments.
Certain leases provide for contingent rent, which isdetermined as a percentage of gross sales in excessof specified levels. The Company records a contingentrent liability and corresponding rent expense whenit is probable sales have been achieved in amounts inexcess of the specified levels.
The same lease life is used for reporting futureminimum lease commitments as is used for thestraight-line rent calculation. The Company uses alease life that extends through certain of the renewalperiods that can be exercised at the Company’s option.
Advertising – The Company expenses the costsof producing advertising the first time the advertisingtakes place. Net advertising expense was $43,336,$44,409 and $38,442 for 2006, 2005 and 2004,respectively.
Insurance – The Company self-insures a significantportion of expected losses under its workers’ compen-sation, general liability and health insuranceprograms. The Company has purchased insurance forindividual claims that exceed $500 and $1,000 forcertain coverages since 2004. Since 2004 the Companyhas elected not to purchase such insurance for itsprimary group health program, but its offered benefitsare limited to not more than $1,000 lifetime for anyemployee (including dependents) in the program. TheCompany records a liability for workers’ compensationand general liability for all unresolved claims and foran actuarially determined estimate of incurred but notreported claims at the anticipated cost to theCompany as of the end of the Company’s third quarterand adjusting it by the actuarially determined lossesand actual claims payments for the fourth quarter. Thereserves and losses are determined actuarially froma range of possible outcomes within which no givenestimate is more likely than any other estimate.In accordance with Statement of Financial Accounting
Standards (“SFAS”) No. 5, “Accounting for Contingen-cies,” the Company records the losses at the lowend of that range and discounts them to present valueusing a risk-free interest rate based on actuariallyprojected timing of payments. The Company records aliability for its group health program for all unpaidclaims based primarily upon a loss development analy-sis derived from actual group health claims paymentexperience provided by the Company’s third partyadministrator. The Company’s accounting policiesregarding insurance reserves include certain actuarialassumptions or management judgments regardingeconomic conditions, the frequency and severity ofclaims and claim development history and settlementpractices. Unanticipated changes in these factorsmay produce materially different amounts of expense.
Goodwill – Goodwill represents the excess of thecost over the net tangible and identifiable intangibleassets from the acquisition of Logan’s in 1999. TheCompany accounts for goodwill and other intangiblesunder SFAS No. 142, “Goodwill and Other IntangibleAssets.” Goodwill and other intangible assets aretested for impairment annually or more frequently ifevents or changes in circumstances indicate that theasset might be impaired. SFAS No. 142 requires a two-step process for testing impairment. First, the fairvalue of each reporting unit is compared to its carryingvalue to determine whether an indication of impair-ment exists. This valuation may reflect, among otherthings, such external factors as capital market valuationfor public companies comparable to the operating unit.If an impairment is indicated, then the implied fairvalue of the reporting unit’s goodwill is determined byallocating the unit’s fair value to its assets and liabili-ties (including any unrecognized intangible assets)as if the reporting unit had been acquired in a businesscombination. The amount of impairment for goodwilland other intangible assets is measured as the excessof its carrying value over its implied fair value.The Company performs its annual assessment during itssecond quarter. There were no indications of impair-ment for 2004, 2005 or 2006. Additionally, an assess-ment is performed between annual assessments if anevent occurs or circumstances change that would morelikely than not reduce the fair value of a reporting unitbelow its carrying amount.
55
Revenue recognition – The Company records revenuefrom the sale of products as they are sold. The Companyprovides for estimated returns based on return historyand sales levels. Initial fees received from a franchiseeto establish a new franchise are recognized as incomewhen the Company has performed all of its obligationsrequired to assist the franchisee in opening a newfranchise restaurant, which is generally upon theopening of that restaurant. Continuing royalties, whichare a percentage of net sales of franchised restaurants,are accrued as income when earned. As permitted bythe provisions of EITF 06-3, “How Taxes Collected fromCustomers and Remitted to Governmental AuthoritiesShould be Presented in the Income Statement (That Is,Gross versus Net Presentation),” the Company’s policyis to present sales in the Consolidated Statement ofIncome on a net presentation basis after deductingsales tax.
Unredeemed gift cards and certificates – Unredeemedgift cards and certificates represent a liability of theCompany related to deferred revenue and are recordedat their expected redemption value. For those statesthat exempt gift cards and certificates from theirescheat laws, the Company makes estimates of theultimate unredeemed gift cards and certificates in theperiod of the original sale and amortizes this break-age over the redemption period that other gift cardsand certificates historically have been redeemed byreducing its liability and recording revenue accord-ingly. For those states that do not exempt gift cardsand certificates from their escheat laws, the Companyrecords breakage in the period that gift cards andcertificates are remitted to the state and reduces itsliability and records revenue accordingly. Changesin redemption behavior or management’s judgmentsregarding redemption trends in the future mayproduce materially different amounts of deferredrevenue to be reported.
Income taxes – Employer tax credits for FICA taxespaid on employee tip income and other employer taxcredits are accounted for by the flow-through method.Deferred income taxes reflect the net tax effects oftemporary differences between the carrying amountsof assets and liabilities for financial reporting purposesand the amounts used for income tax purposes (seeNote 10).
Net income per share – Basic consolidated netincome per share is computed by dividing consolidatednet income by the weighted average number ofcommon shares outstanding for the reporting period.Diluted consolidated net income per share reflectsthe potential dilution that could occur if securities,options or other contracts to issue common stockwere exercised or converted into common stock.Additionally, diluted consolidated net income per shareis calculated excluding the after-tax interest andfinancing expenses associated with the Senior Notessince these Senior Notes are treated as if convertedinto common stock (see Notes 4 and 6). TheCompany’s Senior Notes, outstanding employee anddirector stock options and restricted stock (alsoknown as unvested shares) issued by the Companyrepresent the only dilutive effects on diluted netincome per share.
Share-based compensation – The Company has fourshare-based compensation plans for employees andnon-employee directors, which authorize the grantingof stock options, restricted stock, and other typesof awards consistent with the purpose of the plans(see Note 8). The number of shares authorized forissuance under the Company’s plans as of July 28, 2006totals 26,294,452, of which 2,241,128 shares wereavailable for future issuance. Stock options grantedunder these plans are granted with an exercise priceequal to the market price of the Company’s stock onthe date immediately preceding the date of thegrant (except grants made to employees under theCompany’s 2002 Omnibus Incentive CompensationPlan, whose exercise price is equal to the closing priceon the day of the grant); those option awards gener-ally vest at a cumulative rate of 33% per year beginningon the first anniversary of the grant date and expireten years from the date of grant.
Prior to July 30, 2005, the Company accounted forits share-based compensation under the recognitionand measurement principles of Accounting PrinciplesBoard (“APB”) Opinion No. 25, “Accounting for StockIssued to Employees,” and related interpretations,the disclosure-only provisions of SFAS No. 123,“Accounting for Stock-Based Compensation” and thedisclosures required by SFAS No. 148, “Accounting forStock-Based Compensation-Transition and Disclosure.”
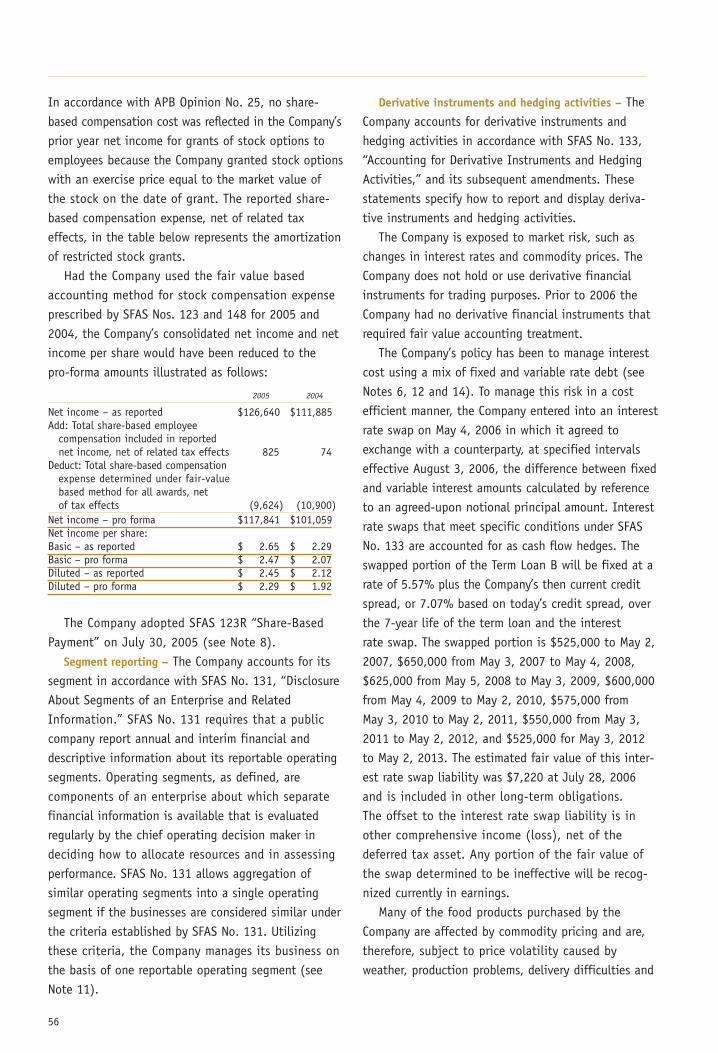
56
In accordance with APB Opinion No. 25, no share-based compensation cost was reflected in the Company’sprior year net income for grants of stock options toemployees because the Company granted stock optionswith an exercise price equal to the market value ofthe stock on the date of grant. The reported share-based compensation expense, net of related taxeffects, in the table below represents the amortizationof restricted stock grants.
Had the Company used the fair value basedaccounting method for stock compensation expenseprescribed by SFAS Nos. 123 and 148 for 2005 and2004, the Company’s consolidated net income and netincome per share would have been reduced to thepro-forma amounts illustrated as follows:
2005 2004
Net income – as reported $126,640 $111,885Add: Total share-based employee
compensation included in reported net income, net of related tax effects 825 74
Deduct: Total share-based compensation expense determined under fair-value based method for all awards, net of tax effects (9,624) (10,900)
Net income – pro forma $117,841 $101,059Net income per share:Basic – as reported $ 2.65 $ 2.29Basic – pro forma $ 2.47 $ 2.07Diluted – as reported $ 2.45 $ 2.12Diluted – pro forma $ 2.29 $ 1.92
The Company adopted SFAS 123R “Share-BasedPayment” on July 30, 2005 (see Note 8).
Segment reporting – The Company accounts for itssegment in accordance with SFAS No. 131, “DisclosureAbout Segments of an Enterprise and RelatedInformation.” SFAS No. 131 requires that a publiccompany report annual and interim financial anddescriptive information about its reportable operatingsegments. Operating segments, as defined, arecomponents of an enterprise about which separatefinancial information is available that is evaluatedregularly by the chief operating decision maker indeciding how to allocate resources and in assessingperformance. SFAS No. 131 allows aggregation ofsimilar operating segments into a single operatingsegment if the businesses are considered similar underthe criteria established by SFAS No. 131. Utilizingthese criteria, the Company manages its business onthe basis of one reportable operating segment (seeNote 11).
Derivative instruments and hedging activities – TheCompany accounts for derivative instruments andhedging activities in accordance with SFAS No. 133,“Accounting for Derivative Instruments and HedgingActivities,” and its subsequent amendments. Thesestatements specify how to report and display deriva-tive instruments and hedging activities.
The Company is exposed to market risk, such aschanges in interest rates and commodity prices. TheCompany does not hold or use derivative financialinstruments for trading purposes. Prior to 2006 theCompany had no derivative financial instruments thatrequired fair value accounting treatment.
The Company’s policy has been to manage interestcost using a mix of fixed and variable rate debt (seeNotes 6, 12 and 14). To manage this risk in a costefficient manner, the Company entered into an interestrate swap on May 4, 2006 in which it agreed toexchange with a counterparty, at specified intervalseffective August 3, 2006, the difference between fixedand variable interest amounts calculated by referenceto an agreed-upon notional principal amount. Interestrate swaps that meet specific conditions under SFASNo. 133 are accounted for as cash flow hedges. Theswapped portion of the Term Loan B will be fixed at arate of 5.57% plus the Company’s then current creditspread, or 7.07% based on today’s credit spread, overthe 7-year life of the term loan and the interestrate swap. The swapped portion is $525,000 to May 2,2007, $650,000 from May 3, 2007 to May 4, 2008,$625,000 from May 5, 2008 to May 3, 2009, $600,000from May 4, 2009 to May 2, 2010, $575,000 fromMay 3, 2010 to May 2, 2011, $550,000 from May 3,2011 to May 2, 2012, and $525,000 for May 3, 2012to May 2, 2013. The estimated fair value of this inter-est rate swap liability was $7,220 at July 28, 2006and is included in other long-term obligations.The offset to the interest rate swap liability is inother comprehensive income (loss), net of thedeferred tax asset. Any portion of the fair value ofthe swap determined to be ineffective will be recog-nized currently in earnings.
Many of the food products purchased by theCompany are affected by commodity pricing and are,therefore, subject to price volatility caused byweather, production problems, delivery difficulties and
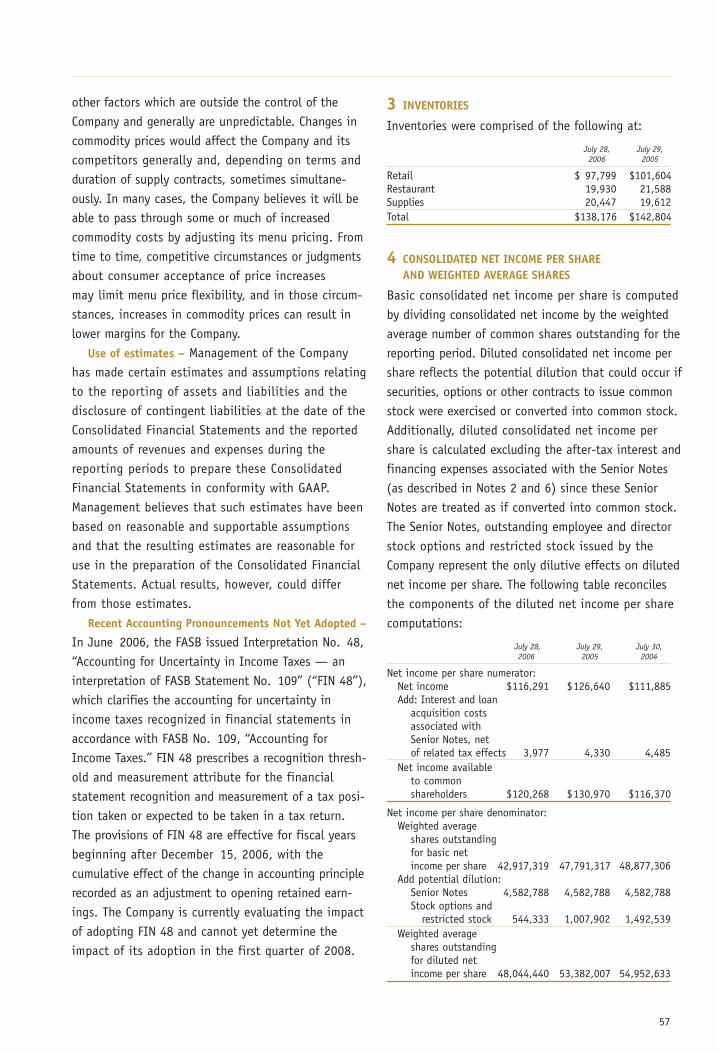
57
other factors which are outside the control of theCompany and generally are unpredictable. Changes incommodity prices would affect the Company and itscompetitors generally and, depending on terms andduration of supply contracts, sometimes simultane-ously. In many cases, the Company believes it will beable to pass through some or much of increasedcommodity costs by adjusting its menu pricing. Fromtime to time, competitive circumstances or judgmentsabout consumer acceptance of price increasesmay limit menu price flexibility, and in those circum-stances, increases in commodity prices can result inlower margins for the Company.
Use of estimates – Management of the Companyhas made certain estimates and assumptions relatingto the reporting of assets and liabilities and thedisclosure of contingent liabilities at the date of theConsolidated Financial Statements and the reportedamounts of revenues and expenses during thereporting periods to prepare these ConsolidatedFinancial Statements in conformity with GAAP.Management believes that such estimates have beenbased on reasonable and supportable assumptionsand that the resulting estimates are reasonable foruse in the preparation of the Consolidated FinancialStatements. Actual results, however, could differfrom those estimates.
Recent Accounting Pronouncements Not Yet Adopted –
In June 2006, the FASB issued Interpretation No. 48,“Accounting for Uncertainty in Income Taxes — aninterpretation of FASB Statement No. 109” (“FIN 48”),which clarifies the accounting for uncertainty inincome taxes recognized in financial statements inaccordance with FASB No. 109, “Accounting forIncome Taxes.” FIN 48 prescribes a recognition thresh-old and measurement attribute for the financialstatement recognition and measurement of a tax posi-tion taken or expected to be taken in a tax return.The provisions of FIN 48 are effective for fiscal yearsbeginning after December 15, 2006, with thecumulative effect of the change in accounting principlerecorded as an adjustment to opening retained earn-ings. The Company is currently evaluating the impactof adopting FIN 48 and cannot yet determine theimpact of its adoption in the first quarter of 2008.
3 INVENTORIES
Inventories were comprised of the following at:
July 28, July 29,2006 2005
Retail $ 97,799 $101,604Restaurant 19,930 21,588Supplies 20,447 19,612Total $138,176 $142,804
4 CONSOLIDATED NET INCOME PER SHARE AND WEIGHTED AVERAGE SHARES
Basic consolidated net income per share is computedby dividing consolidated net income by the weightedaverage number of common shares outstanding for thereporting period. Diluted consolidated net income pershare reflects the potential dilution that could occur ifsecurities, options or other contracts to issue commonstock were exercised or converted into common stock.Additionally, diluted consolidated net income pershare is calculated excluding the after-tax interest andfinancing expenses associated with the Senior Notes(as described in Notes 2 and 6) since these SeniorNotes are treated as if converted into common stock.The Senior Notes, outstanding employee and directorstock options and restricted stock issued by theCompany represent the only dilutive effects on dilutednet income per share. The following table reconcilesthe components of the diluted net income per sharecomputations:
July 28, July 29, July 30,2006 2005 2004
Net income per share numerator:Net income $116,291 $126,640 $111,885Add: Interest and loan
acquisition costsassociated with Senior Notes, net of related tax effects 3,977 4,330 4,485
Net income available to common shareholders $120,268 $130,970 $116,370
Net income per share denominator:Weighted average
shares outstanding for basic net income per share 42,917,319 47,791,317 48,877,306
Add potential dilution:Senior Notes 4,582,788 4,582,788 4,582,788Stock options and
restricted stock 544,333 1,007,902 1,492,539Weighted average
shares outstanding for diluted net income per share 48,044,440 53,382,007 54,952,633
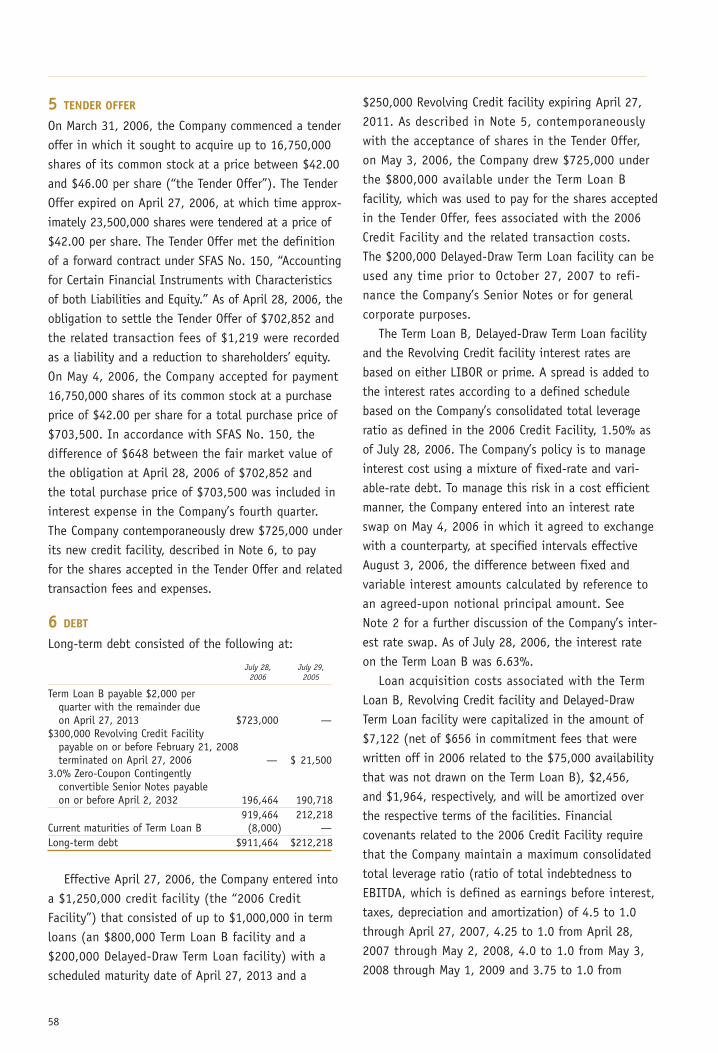
58
5 TENDER OFFER
On March 31, 2006, the Company commenced a tenderoffer in which it sought to acquire up to 16,750,000shares of its common stock at a price between $42.00and $46.00 per share (“the Tender Offer”). The TenderOffer expired on April 27, 2006, at which time approx-imately 23,500,000 shares were tendered at a price of$42.00 per share. The Tender Offer met the definitionof a forward contract under SFAS No. 150, “Accountingfor Certain Financial Instruments with Characteristicsof both Liabilities and Equity.” As of April 28, 2006, theobligation to settle the Tender Offer of $702,852 andthe related transaction fees of $1,219 were recordedas a liability and a reduction to shareholders’ equity.On May 4, 2006, the Company accepted for payment16,750,000 shares of its common stock at a purchaseprice of $42.00 per share for a total purchase price of$703,500. In accordance with SFAS No. 150, thedifference of $648 between the fair market value ofthe obligation at April 28, 2006 of $702,852 andthe total purchase price of $703,500 was included ininterest expense in the Company’s fourth quarter.The Company contemporaneously drew $725,000 underits new credit facility, described in Note 6, to payfor the shares accepted in the Tender Offer and relatedtransaction fees and expenses.
6 DEBT
Long-term debt consisted of the following at:
July 28, July 29,2006 2005
Term Loan B payable $2,000 per quarter with the remainder due on April 27, 2013 $723,000 —
$300,000 Revolving Credit Facility payable on or before February 21, 2008 terminated on April 27, 2006 — $ 21,500
3.0% Zero-Coupon Contingently convertible Senior Notes payable on or before April 2, 2032 196,464 190,718
919,464 212,218Current maturities of Term Loan B (8,000) —Long-term debt $911,464 $212,218
Effective April 27, 2006, the Company entered intoa $1,250,000 credit facility (the “2006 CreditFacility”) that consisted of up to $1,000,000 in termloans (an $800,000 Term Loan B facility and a$200,000 Delayed-Draw Term Loan facility) with ascheduled maturity date of April 27, 2013 and a
$250,000 Revolving Credit facility expiring April 27,2011. As described in Note 5, contemporaneouslywith the acceptance of shares in the Tender Offer,on May 3, 2006, the Company drew $725,000 underthe $800,000 available under the Term Loan Bfacility, which was used to pay for the shares acceptedin the Tender Offer, fees associated with the 2006Credit Facility and the related transaction costs.The $200,000 Delayed-Draw Term Loan facility can beused any time prior to October 27, 2007 to refi-nance the Company’s Senior Notes or for generalcorporate purposes.
The Term Loan B, Delayed-Draw Term Loan facilityand the Revolving Credit facility interest rates arebased on either LIBOR or prime. A spread is added tothe interest rates according to a defined schedulebased on the Company’s consolidated total leverageratio as defined in the 2006 Credit Facility, 1.50% asof July 28, 2006. The Company’s policy is to manageinterest cost using a mixture of fixed-rate and vari-able-rate debt. To manage this risk in a cost efficientmanner, the Company entered into an interest rateswap on May 4, 2006 in which it agreed to exchangewith a counterparty, at specified intervals effectiveAugust 3, 2006, the difference between fixed andvariable interest amounts calculated by reference toan agreed-upon notional principal amount. SeeNote 2 for a further discussion of the Company’s inter-est rate swap. As of July 28, 2006, the interest rateon the Term Loan B was 6.63%.
Loan acquisition costs associated with the TermLoan B, Revolving Credit facility and Delayed-DrawTerm Loan facility were capitalized in the amount of$7,122 (net of $656 in commitment fees that werewritten off in 2006 related to the $75,000 availabilitythat was not drawn on the Term Loan B), $2,456,and $1,964, respectively, and will be amortized overthe respective terms of the facilities. Financialcovenants related to the 2006 Credit Facility requirethat the Company maintain a maximum consolidatedtotal leverage ratio (ratio of total indebtedness toEBITDA, which is defined as earnings before interest,taxes, depreciation and amortization) of 4.5 to 1.0through April 27, 2007, 4.25 to 1.0 from April 28,2007 through May 2, 2008, 4.0 to 1.0 from May 3,2008 through May 1, 2009 and 3.75 to 1.0 from
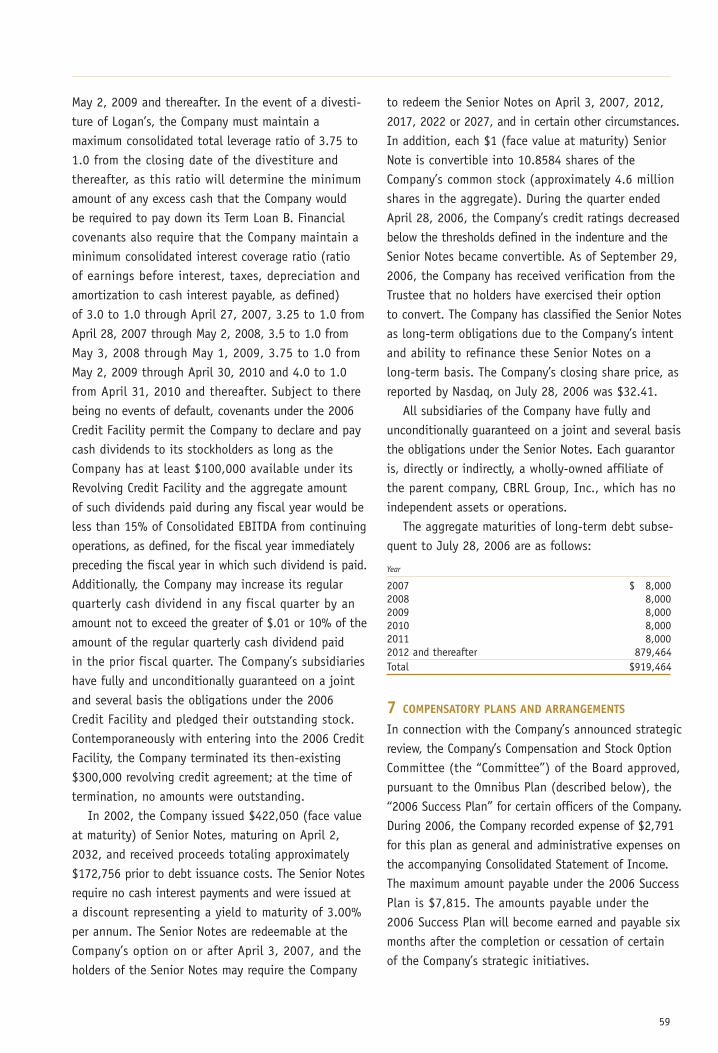
59
May 2, 2009 and thereafter. In the event of a divesti-ture of Logan’s, the Company must maintain amaximum consolidated total leverage ratio of 3.75 to1.0 from the closing date of the divestiture andthereafter, as this ratio will determine the minimumamount of any excess cash that the Company wouldbe required to pay down its Term Loan B. Financialcovenants also require that the Company maintain aminimum consolidated interest coverage ratio (ratioof earnings before interest, taxes, depreciation andamortization to cash interest payable, as defined)of 3.0 to 1.0 through April 27, 2007, 3.25 to 1.0 fromApril 28, 2007 through May 2, 2008, 3.5 to 1.0 fromMay 3, 2008 through May 1, 2009, 3.75 to 1.0 fromMay 2, 2009 through April 30, 2010 and 4.0 to 1.0from April 31, 2010 and thereafter. Subject to therebeing no events of default, covenants under the 2006Credit Facility permit the Company to declare and paycash dividends to its stockholders as long as theCompany has at least $100,000 available under itsRevolving Credit Facility and the aggregate amountof such dividends paid during any fiscal year would beless than 15% of Consolidated EBITDA from continuingoperations, as defined, for the fiscal year immediatelypreceding the fiscal year in which such dividend is paid.Additionally, the Company may increase its regularquarterly cash dividend in any fiscal quarter by anamount not to exceed the greater of $.01 or 10% of theamount of the regular quarterly cash dividend paidin the prior fiscal quarter. The Company’s subsidiarieshave fully and unconditionally guaranteed on a jointand several basis the obligations under the 2006Credit Facility and pledged their outstanding stock.Contemporaneously with entering into the 2006 CreditFacility, the Company terminated its then-existing$300,000 revolving credit agreement; at the time oftermination, no amounts were outstanding.
In 2002, the Company issued $422,050 (face valueat maturity) of Senior Notes, maturing on April 2,2032, and received proceeds totaling approximately$172,756 prior to debt issuance costs. The Senior Notesrequire no cash interest payments and were issued ata discount representing a yield to maturity of 3.00%per annum. The Senior Notes are redeemable at theCompany’s option on or after April 3, 2007, and theholders of the Senior Notes may require the Company
to redeem the Senior Notes on April 3, 2007, 2012,2017, 2022 or 2027, and in certain other circumstances.In addition, each $1 (face value at maturity) SeniorNote is convertible into 10.8584 shares of theCompany’s common stock (approximately 4.6 millionshares in the aggregate). During the quarter endedApril 28, 2006, the Company’s credit ratings decreasedbelow the thresholds defined in the indenture and theSenior Notes became convertible. As of September 29,2006, the Company has received verification from theTrustee that no holders have exercised their optionto convert. The Company has classified the Senior Notesas long-term obligations due to the Company’s intentand ability to refinance these Senior Notes on along-term basis. The Company’s closing share price, asreported by Nasdaq, on July 28, 2006 was $32.41.
All subsidiaries of the Company have fully andunconditionally guaranteed on a joint and several basisthe obligations under the Senior Notes. Each guarantoris, directly or indirectly, a wholly-owned affiliate ofthe parent company, CBRL Group, Inc., which has noindependent assets or operations.
The aggregate maturities of long-term debt subse-quent to July 28, 2006 are as follows:
Year
2007 $ 8,0002008 8,0002009 8,0002010 8,0002011 8,0002012 and thereafter 879,464Total $919,464
7 COMPENSATORY PLANS AND ARRANGEMENTS
In connection with the Company’s announced strategicreview, the Company’s Compensation and Stock OptionCommittee (the “Committee”) of the Board approved,pursuant to the Omnibus Plan (described below), the“2006 Success Plan” for certain officers of the Company.During 2006, the Company recorded expense of $2,791for this plan as general and administrative expenses onthe accompanying Consolidated Statement of Income.The maximum amount payable under the 2006 SuccessPlan is $7,815. The amounts payable under the2006 Success Plan will become earned and payable sixmonths after the completion or cessation of certainof the Company’s strategic initiatives.
60
8 STOCK COMPENSATION PLANS
The Company’s employee compensation plans areadministered by the Compensation and Stock OptionCommittee of the Board of Directors (the “Committee”).The Committee is authorized to determine, at timeperiods within its discretion and subject to the directionof the Board, which employees will be grantedoptions and other awards, the number of sharescovered by any awards granted, and within applicablelimits, the terms and provisions relating to the exer-cise of any awards.
The CBRL Group, Inc. 2002 Omnibus IncentiveCompensation Plan (the “Omnibus Plan”) allows theCommittee to grant awards for an aggregate of2,500,000 shares of the Company’s common stock. TheOmnibus Plan authorizes the following types of awardsto all eligible participants other than non-employeedirectors: stock options, stock appreciation rights, stockawards, restricted stock, performance shares, cashbonuses, qualified performance-based awards or anyother type of award consistent with the OmnibusPlan’s purpose. Except as described below for certainoptions granted to non-employee directors, the optionprice per share of all options granted under theOmnibus Plan are required to be at least 100% of thefair market value of a share of the Company’scommon stock based on the closing price on the daythe option is granted. Under the Omnibus Plan, non-employee directors are granted annually on the day ofthe annual shareholders meeting an option topurchase up to 5,000 shares of the Company’s commonstock, and awards of up to 2,000 shares of restrictedstock or restricted stock units. The option price pershare will be at least 100% of the fair market value ofa share of the Company’s common stock based onthe closing price on the day preceding the daythe option is granted. Additionally, non-employeedirectors newly elected or appointed between anannual shareholders meeting (typically in November)and the following July 31 receive an option onthe day of election or appointment to acquire up to5,000 shares of the Company’s common stock orawards of up to 2,000 shares of restricted stock orrestricted stock units. Options granted to date underthe Omnibus Plan become exercisable each yearat a cumulative rate of 33% per year and expire ten
years from the date of grant. At July 28, 2006, therewere 1,331,530 shares of the Company’s common stockreserved for future issuance under the Omnibus Plan.
The CBRL Group, Inc. 2000 Non-Executive StockOption Plan (“Employee Plan”) covered employees whoare not officers or directors of the Company. The stockoptions were granted with an exercise price of at least100% of the fair market value of a share of theCompany’s common stock based on the closing priceon the day the option was granted and become exer-cisable each year at a cumulative rate of 33% per yearand expire ten years from the date of grant. An aggre-gate of 4,750,000 shares of the Company’s commonstock originally were authorized under this plan whichexpired on July 29, 2005.
The Company also has an Amended and RestatedStock Option Plan (the “Plan”) that allowed theCommittee to grant options to purchase an aggregateof 17,525,702 shares of the Company’s common stock.At July 28, 2006, there were 909,598 shares of theCompany’s common stock reserved for future issuanceunder the Plan. The option price per share under thePlan must be at least 100% of the fair market value ofa share of the Company’s common stock based on theclosing price on the day preceding the day the optionis granted. Options granted to date under the Plangenerally have been exercisable each year at a cumu-lative rate of 33% per year and expire ten years fromthe date of grant.
In 1989, the Board adopted the Cracker Barrel OldCountry Store, Inc. 1989 Stock Option Plan forNon-employee Directors (“Directors Plan”). The stockoptions were granted with an exercise price equal tothe fair market value of the Company’s common stockas of the date of grant and expire one year from theretirement of the director from the Board. An aggre-gate of 1,518,750 shares of the Company’s commonstock was authorized by the Company’s shareholdersunder this plan. Due to the overall plan limit, noshares have been granted under this plan since 1994.
Effective July 30, 2005, the Company adoptedthe fair value recognition provisions of SFAS No. 123Rusing the modified prospective method. Under thismethod, share-based compensation cost for 2006includes the portion vesting in the period for (1) allshare-based payments granted prior to, but not vested
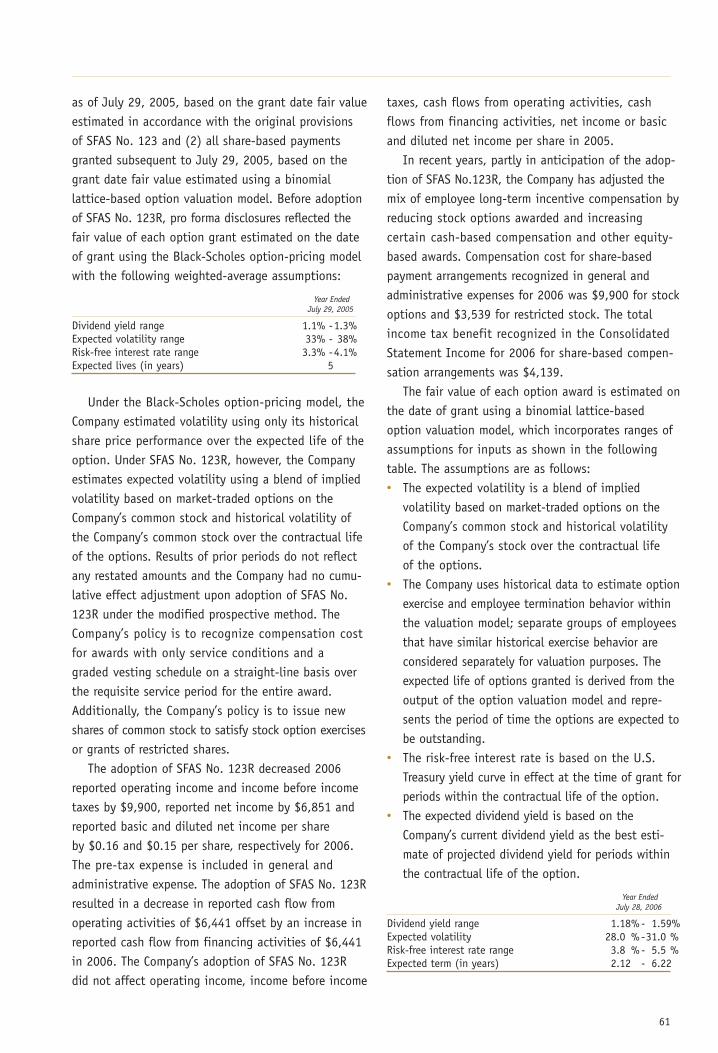
61
as of July 29, 2005, based on the grant date fair valueestimated in accordance with the original provisionsof SFAS No. 123 and (2) all share-based paymentsgranted subsequent to July 29, 2005, based on thegrant date fair value estimated using a binomiallattice-based option valuation model. Before adoptionof SFAS No. 123R, pro forma disclosures reflected thefair value of each option grant estimated on the dateof grant using the Black-Scholes option-pricing modelwith the following weighted-average assumptions:
Year EndedJuly 29, 2005
Dividend yield range 1.1% -1.3%Expected volatility range 33% - 38%Risk-free interest rate range 3.3% -4.1%Expected lives (in years) 5
Under the Black-Scholes option-pricing model, theCompany estimated volatility using only its historicalshare price performance over the expected life of theoption. Under SFAS No. 123R, however, the Companyestimates expected volatility using a blend of impliedvolatility based on market-traded options on theCompany’s common stock and historical volatility ofthe Company’s common stock over the contractual lifeof the options. Results of prior periods do not reflectany restated amounts and the Company had no cumu-lative effect adjustment upon adoption of SFAS No.123R under the modified prospective method. TheCompany’s policy is to recognize compensation costfor awards with only service conditions and agraded vesting schedule on a straight-line basis overthe requisite service period for the entire award.Additionally, the Company’s policy is to issue newshares of common stock to satisfy stock option exercisesor grants of restricted shares.
The adoption of SFAS No. 123R decreased 2006reported operating income and income before incometaxes by $9,900, reported net income by $6,851 andreported basic and diluted net income per shareby $0.16 and $0.15 per share, respectively for 2006.The pre-tax expense is included in general andadministrative expense. The adoption of SFAS No. 123Rresulted in a decrease in reported cash flow fromoperating activities of $6,441 offset by an increase inreported cash flow from financing activities of $6,441in 2006. The Company’s adoption of SFAS No. 123Rdid not affect operating income, income before income
taxes, cash flows from operating activities, cashflows from financing activities, net income or basicand diluted net income per share in 2005.
In recent years, partly in anticipation of the adop-tion of SFAS No.123R, the Company has adjusted themix of employee long-term incentive compensation byreducing stock options awarded and increasingcertain cash-based compensation and other equity-based awards. Compensation cost for share-basedpayment arrangements recognized in general andadministrative expenses for 2006 was $9,900 for stockoptions and $3,539 for restricted stock. The totalincome tax benefit recognized in the ConsolidatedStatement Income for 2006 for share-based compen-sation arrangements was $4,139.
The fair value of each option award is estimated onthe date of grant using a binomial lattice-basedoption valuation model, which incorporates ranges ofassumptions for inputs as shown in the followingtable. The assumptions are as follows:• The expected volatility is a blend of implied
volatility based on market-traded options on theCompany’s common stock and historical volatilityof the Company’s stock over the contractual lifeof the options.
• The Company uses historical data to estimate optionexercise and employee termination behavior withinthe valuation model; separate groups of employeesthat have similar historical exercise behavior areconsidered separately for valuation purposes. Theexpected life of options granted is derived from theoutput of the option valuation model and repre-sents the period of time the options are expected tobe outstanding.
• The risk-free interest rate is based on the U.S.Treasury yield curve in effect at the time of grant forperiods within the contractual life of the option.
• The expected dividend yield is based on theCompany’s current dividend yield as the best esti-mate of projected dividend yield for periods withinthe contractual life of the option.
Year EndedJuly 28, 2006
Dividend yield range 1.18%- 1.59%Expected volatility 28.0 %-31.0 %Risk-free interest rate range 3.8 %- 5.5 %Expected term (in years) 2.12 - 6.22
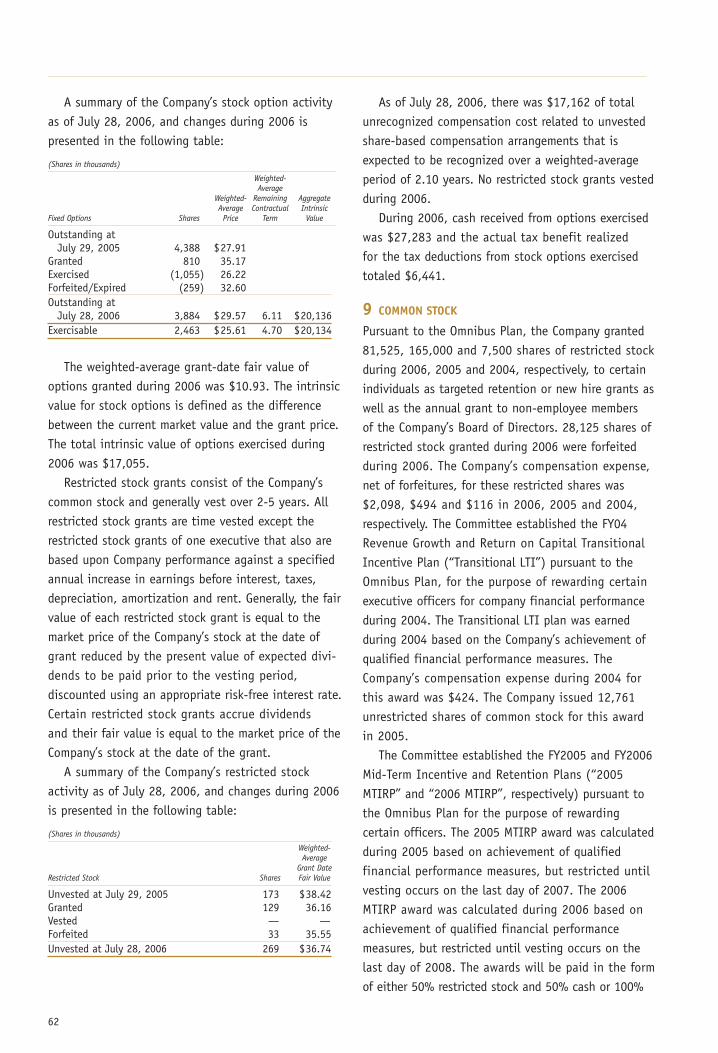
62
A summary of the Company’s stock option activityas of July 28, 2006, and changes during 2006 ispresented in the following table:
(Shares in thousands)
Weighted-Average
Weighted- Remaining AggregateAverage Contractual Intrinsic
Fixed Options Shares Price Term Value
Outstanding at July 29, 2005 4,388 $27.91
Granted 810 35.17Exercised (1,055) 26.22Forfeited/Expired (259) 32.60Outstanding at
July 28, 2006 3,884 $29.57 6.11 $20,136Exercisable 2,463 $25.61 4.70 $20,134
The weighted-average grant-date fair value ofoptions granted during 2006 was $10.93. The intrinsicvalue for stock options is defined as the differencebetween the current market value and the grant price.The total intrinsic value of options exercised during2006 was $17,055.
Restricted stock grants consist of the Company’scommon stock and generally vest over 2-5 years. Allrestricted stock grants are time vested except therestricted stock grants of one executive that also arebased upon Company performance against a specifiedannual increase in earnings before interest, taxes,depreciation, amortization and rent. Generally, the fairvalue of each restricted stock grant is equal to themarket price of the Company’s stock at the date ofgrant reduced by the present value of expected divi-dends to be paid prior to the vesting period,discounted using an appropriate risk-free interest rate.Certain restricted stock grants accrue dividendsand their fair value is equal to the market price of theCompany’s stock at the date of the grant.
A summary of the Company’s restricted stockactivity as of July 28, 2006, and changes during 2006is presented in the following table:
(Shares in thousands)
Weighted-Average
Grant DateRestricted Stock Shares Fair Value
Unvested at July 29, 2005 173 $38.42Granted 129 36.16Vested — —Forfeited 33 35.55Unvested at July 28, 2006 269 $36.74
As of July 28, 2006, there was $17,162 of totalunrecognized compensation cost related to unvestedshare-based compensation arrangements that isexpected to be recognized over a weighted-averageperiod of 2.10 years. No restricted stock grants vestedduring 2006.
During 2006, cash received from options exercisedwas $27,283 and the actual tax benefit realizedfor the tax deductions from stock options exercisedtotaled $6,441.
9 COMMON STOCK
Pursuant to the Omnibus Plan, the Company granted81,525, 165,000 and 7,500 shares of restricted stockduring 2006, 2005 and 2004, respectively, to certainindividuals as targeted retention or new hire grants aswell as the annual grant to non-employee membersof the Company’s Board of Directors. 28,125 shares ofrestricted stock granted during 2006 were forfeitedduring 2006. The Company’s compensation expense,net of forfeitures, for these restricted shares was$2,098, $494 and $116 in 2006, 2005 and 2004,respectively. The Committee established the FY04Revenue Growth and Return on Capital TransitionalIncentive Plan (“Transitional LTI”) pursuant to theOmnibus Plan, for the purpose of rewarding certainexecutive officers for company financial performanceduring 2004. The Transitional LTI plan was earnedduring 2004 based on the Company’s achievement ofqualified financial performance measures. TheCompany’s compensation expense during 2004 forthis award was $424. The Company issued 12,761unrestricted shares of common stock for this awardin 2005.
The Committee established the FY2005 and FY2006Mid-Term Incentive and Retention Plans (“2005MTIRP” and “2006 MTIRP”, respectively) pursuant tothe Omnibus Plan for the purpose of rewardingcertain officers. The 2005 MTIRP award was calculatedduring 2005 based on achievement of qualifiedfinancial performance measures, but restricted untilvesting occurs on the last day of 2007. The 2006MTIRP award was calculated during 2006 based onachievement of qualified financial performancemeasures, but restricted until vesting occurs on thelast day of 2008. The awards will be paid in the formof either 50% restricted stock and 50% cash or 100%
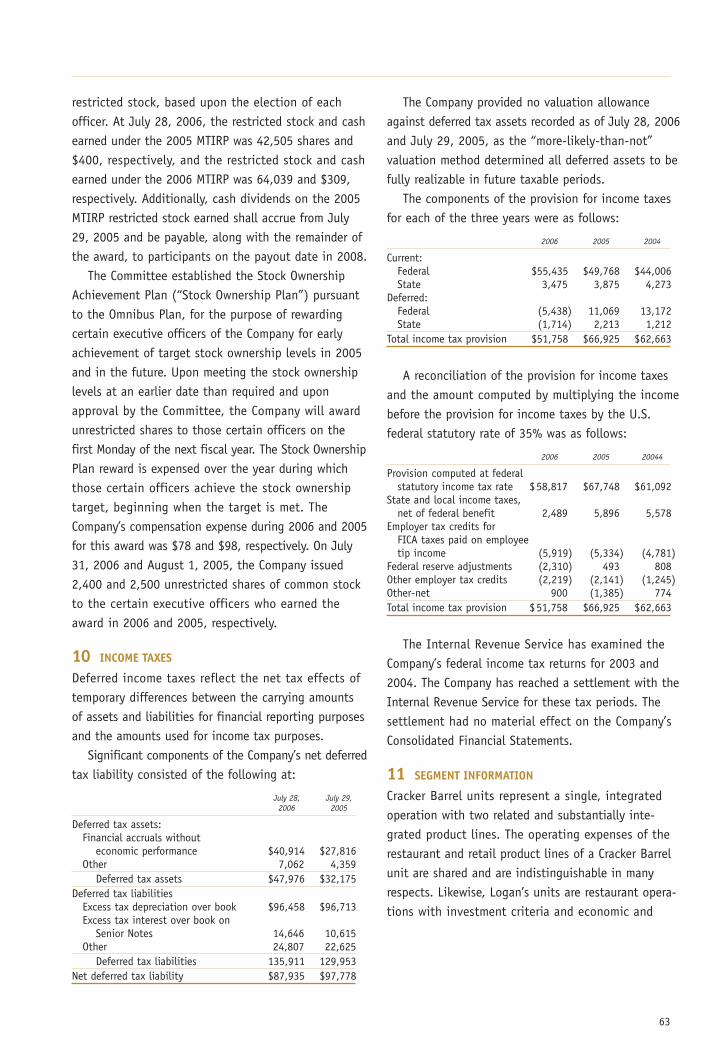
63
restricted stock, based upon the election of eachofficer. At July 28, 2006, the restricted stock and cashearned under the 2005 MTIRP was 42,505 shares and$400, respectively, and the restricted stock and cashearned under the 2006 MTIRP was 64,039 and $309,respectively. Additionally, cash dividends on the 2005MTIRP restricted stock earned shall accrue from July29, 2005 and be payable, along with the remainder ofthe award, to participants on the payout date in 2008.
The Committee established the Stock OwnershipAchievement Plan (“Stock Ownership Plan”) pursuantto the Omnibus Plan, for the purpose of rewardingcertain executive officers of the Company for earlyachievement of target stock ownership levels in 2005and in the future. Upon meeting the stock ownershiplevels at an earlier date than required and uponapproval by the Committee, the Company will awardunrestricted shares to those certain officers on thefirst Monday of the next fiscal year. The Stock OwnershipPlan reward is expensed over the year during whichthose certain officers achieve the stock ownershiptarget, beginning when the target is met. TheCompany’s compensation expense during 2006 and 2005for this award was $78 and $98, respectively. On July31, 2006 and August 1, 2005, the Company issued2,400 and 2,500 unrestricted shares of common stockto the certain executive officers who earned theaward in 2006 and 2005, respectively.
10 INCOME TAXES
Deferred income taxes reflect the net tax effects oftemporary differences between the carrying amountsof assets and liabilities for financial reporting purposesand the amounts used for income tax purposes.
Significant components of the Company’s net deferredtax liability consisted of the following at:
July 28, July 29,2006 2005
Deferred tax assets:Financial accruals without
economic performance $40,914 $27,816Other 7,062 4,359
Deferred tax assets $47,976 $32,175Deferred tax liabilities
Excess tax depreciation over book $96,458 $96,713Excess tax interest over book on
Senior Notes 14,646 10,615Other 24,807 22,625
Deferred tax liabilities 135,911 129,953Net deferred tax liability $87,935 $97,778
The Company provided no valuation allowanceagainst deferred tax assets recorded as of July 28, 2006and July 29, 2005, as the “more-likely-than-not”valuation method determined all deferred assets to befully realizable in future taxable periods.
The components of the provision for income taxesfor each of the three years were as follows:
2006 2005 2004
Current:Federal $55,435 $49,768 $44,006State 3,475 3,875 4,273
Deferred:Federal (5,438) 11,069 13,172State (1,714) 2,213 1,212
Total income tax provision $51,758 $66,925 $62,663
A reconciliation of the provision for income taxesand the amount computed by multiplying the incomebefore the provision for income taxes by the U.S.federal statutory rate of 35% was as follows:
2006 2005 20044
Provision computed at federal statutory income tax rate $58,817 $67,748 $61,092
State and local income taxes, net of federal benefit 2,489 5,896 5,578
Employer tax credits for FICA taxes paid on employee tip income (5,919) (5,334) (4,781)
Federal reserve adjustments (2,310) 493 808Other employer tax credits (2,219) (2,141) (1,245)Other-net 900 (1,385) 774Total income tax provision $51,758 $66,925 $62,663
The Internal Revenue Service has examined theCompany’s federal income tax returns for 2003 and2004. The Company has reached a settlement with theInternal Revenue Service for these tax periods. Thesettlement had no material effect on the Company’sConsolidated Financial Statements.
11 SEGMENT INFORMATION
Cracker Barrel units represent a single, integratedoperation with two related and substantially inte-grated product lines. The operating expenses of therestaurant and retail product lines of a Cracker Barrelunit are shared and are indistinguishable in manyrespects. Likewise, Logan’s units are restaurant opera-tions with investment criteria and economic and
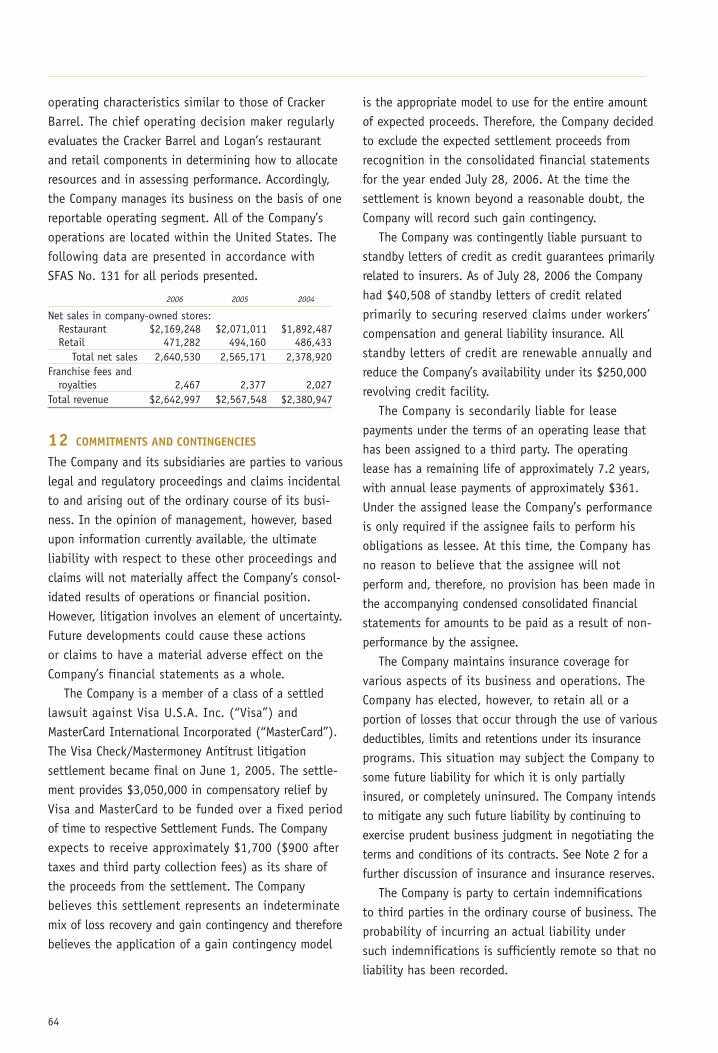
64
operating characteristics similar to those of CrackerBarrel. The chief operating decision maker regularlyevaluates the Cracker Barrel and Logan’s restaurantand retail components in determining how to allocateresources and in assessing performance. Accordingly,the Company manages its business on the basis of onereportable operating segment. All of the Company’soperations are located within the United States. Thefollowing data are presented in accordance withSFAS No. 131 for all periods presented.
2006 2005 2004
Net sales in company-owned stores:Restaurant $2,169,248 $2,071,011 $1,892,487Retail 471,282 494,160 486,433
Total net sales 2,640,530 2,565,171 2,378,920Franchise fees and
royalties 2,467 2,377 2,027Total revenue $2,642,997 $2,567,548 $2,380,947
12 COMMITMENTS AND CONTINGENCIES
The Company and its subsidiaries are parties to variouslegal and regulatory proceedings and claims incidentalto and arising out of the ordinary course of its busi-ness. In the opinion of management, however, basedupon information currently available, the ultimateliability with respect to these other proceedings andclaims will not materially affect the Company’s consol-idated results of operations or financial position.However, litigation involves an element of uncertainty.Future developments could cause these actionsor claims to have a material adverse effect on theCompany’s financial statements as a whole.
The Company is a member of a class of a settledlawsuit against Visa U.S.A. Inc. (“Visa”) andMasterCard International Incorporated (“MasterCard”).The Visa Check/Mastermoney Antitrust litigationsettlement became final on June 1, 2005. The settle-ment provides $3,050,000 in compensatory relief byVisa and MasterCard to be funded over a fixed periodof time to respective Settlement Funds. The Companyexpects to receive approximately $1,700 ($900 aftertaxes and third party collection fees) as its share ofthe proceeds from the settlement. The Companybelieves this settlement represents an indeterminatemix of loss recovery and gain contingency and thereforebelieves the application of a gain contingency model
is the appropriate model to use for the entire amountof expected proceeds. Therefore, the Company decidedto exclude the expected settlement proceeds fromrecognition in the consolidated financial statementsfor the year ended July 28, 2006. At the time thesettlement is known beyond a reasonable doubt, theCompany will record such gain contingency.
The Company was contingently liable pursuant tostandby letters of credit as credit guarantees primarilyrelated to insurers. As of July 28, 2006 the Companyhad $40,508 of standby letters of credit relatedprimarily to securing reserved claims under workers’compensation and general liability insurance. Allstandby letters of credit are renewable annually andreduce the Company’s availability under its $250,000revolving credit facility.
The Company is secondarily liable for leasepayments under the terms of an operating lease thathas been assigned to a third party. The operatinglease has a remaining life of approximately 7.2 years,with annual lease payments of approximately $361.Under the assigned lease the Company’s performanceis only required if the assignee fails to perform hisobligations as lessee. At this time, the Company hasno reason to believe that the assignee will notperform and, therefore, no provision has been made inthe accompanying condensed consolidated financialstatements for amounts to be paid as a result of non-performance by the assignee.
The Company maintains insurance coverage forvarious aspects of its business and operations. TheCompany has elected, however, to retain all or aportion of losses that occur through the use of variousdeductibles, limits and retentions under its insuranceprograms. This situation may subject the Company tosome future liability for which it is only partiallyinsured, or completely uninsured. The Company intendsto mitigate any such future liability by continuing toexercise prudent business judgment in negotiating theterms and conditions of its contracts. See Note 2 for afurther discussion of insurance and insurance reserves.
The Company is party to certain indemnificationsto third parties in the ordinary course of business. Theprobability of incurring an actual liability undersuch indemnifications is sufficiently remote so that noliability has been recorded.
65
As of July 28, 2006, the Company operated 153Cracker Barrel stores and 73 Logan’s Roadhouserestaurants in leased facilities and also leased certainland and advertising billboards (see Note 14). Theseleases have been classified as either capital or operat-ing leases. The interest rates for capital leases varyfrom 5% to 10%. Amortization of capital leases isincluded with depreciation expense. A majority of theCompany’s lease agreements provide for renewaloptions and some of these options contain escalationclauses. Additionally, certain store leases provide forpercentage lease payments based upon sales volumein excess of specified minimum levels.
The following is a schedule by year of futureminimum lease payments under capital leases, togetherwith the present value of the minimum lease paymentsas of July 28, 2006:
Year
2007 $1232008 20Total minimum lease payments 143Less amount representing interest 7Present value of minimum lease payments 136Less current portion 116Long-term portion of capital lease obligations $ 20
The following is a schedule by year of the futureminimum rental payments required under operatingleases, excluding leases for advertising billboards, asof July 28, 2006. Included in the amounts below areoptional renewal periods associated with such leasesthat the Company is currently not legally obligatedto exercise; however, it is reasonably assured that theCompany will exercise these options.
Base Term Renewal and Exercised Periods Not Yet
Year Options* Exercised** Total
2007 $ 35,602 $ 32 $ 35,6342008 35,724 297 36,0212009 35,566 564 36,1302010 34,157 919 35,0762011 33,903 1,111 35,014Later years 268,519 387,320 655,839Total $443,471 $390,243 $833,714
** Includes base terms and certain optional renewal periods that havebeen exercised and are included in the lease term in accordancewith SFAS No. 13 (see Note 2).
** Includes certain optional renewal periods that have not yet beenexercised, but are included in the lease term for the straight-linerent calculation. Such optional renewal periods are includedbecause it is reasonably assured by the Company that it will exercisesuch renewal options (see Note 2).
The following is a schedule by year of the futureminimum rental payments required under operatingleases for advertising billboards as of July 28, 2006:
Year
2007 $19,8662008 11,7172009 5,0722010 972011 10Later years 7Total $36,769
Rent expense under operating leases, excludingleases for advertising billboards are recognized on astraight-line, or average, basis and include anypre-opening periods during construction for which theCompany is legally obligated under the terms of thelease, and any optional renewal periods, for which atthe inception of the lease, it is reasonably assuredthat the Company will exercise those renewal options.This lease period is consistent with the period overwhich leasehold improvements are amortized. Rentexpense for each of the three years was:
Minimum Contingent Total
2006 $38,084 $840 $38,9242005 35,531 913 36,4442004 33,111 852 33,963
Rent expense under operating leases for billboardsfor each of the three years was:
Minimum Contingent Total
2006 $24,938 — $24,9382005 23,374 — 23,3742004 23,042 — 23,042
13 EMPLOYEE SAVINGS PLANS
The Company sponsors a qualified defined contributionretirement plan (“Plan I”) covering salaried andhourly employees who have completed one year ofservice and have attained the age of twenty-one. PlanI allows eligible employees to defer receipt of upto 16% of their compensation, as defined in the plan.
The Company also sponsors a non-qualifieddefined contribution retirement plan (“Plan II”)covering highly compensated employees, as defined inthe plan. Plan II allows eligible employees to deferreceipt of up to 50% of their base compensation and100% of their eligible bonuses, as defined in theplan. Contributions under both Plan I and Plan II may
66
be invested in various investment funds at theemployee’s discretion. Such contributions, includingthe Company matching contribution described below,may not be invested in the Company’s common stock.In 2006, 2005 and 2004, the Company matched25% of employee contributions for each participant ineither Plan I or Plan II up to a total of 6% of theemployee’s compensation. Employee contributions vestimmediately while Company contributions vest 20%annually beginning on the participant’s first anniversaryof employment and are vested 100% on the partici-pant’s fifth anniversary of employment. In 2006, 2005,and 2004, the Company contributed approximately$1,371, $1,250 and $1,321, respectively, under Plan Iand approximately $399, $473 and $345, respectively,under Plan II. At the inception of Plan II, theCompany established a Rabbi Trust to fund Plan IIobligations. The market value of the trust assets of$24,860 is included in other assets and the liabilityto Plan II participants of $24,860 is included inother long-term obligations. Company contributionsunder Plan I and Plan II are recorded as eitherlabor and other related expenses or general andadministrative expenses.
14 SALE-LEASEBACK
On July 31, 2000, Cracker Barrel completed a sale-leaseback transaction involving 65 of its owned units.Under the transaction, the land, buildings and build-ing improvements at the locations were sold for netconsideration of $138,325 and were leased back for aninitial term of 21 years. Equipment was not included.The leases include specified renewal options for up to20 additional years and have certain financialcovenants related to fixed charge coverage for theleased units. At July 28, 2006 and July 29, 2005, theCompany was in compliance with all those covenants.Net rent expense during the initial term is $14,963annually, and the assets sold and leased backpreviously had depreciation expense of approximately$2,707 annually. The gain on the sale is beingamortized over the initial lease term of 21 years.
15 QUARTERLY FINANCIAL DATA (UNAUDITED)
Quarterly financial data for 2006 and 2005 are summa-rized as follows:
1st Quarter 2nd Quarter 3rd Quarter 4th Quarter
2006Total revenue $633,357 $694,356 $644,200 $671,084Gross profit 434,036 458,486 442,383 462,448Income before
income taxes 39,331 46,696 36,115 45,907Net income 25,722 30,797 23,972 35,800Net income per
share – basic $ 0.55 $ 0.66 $ 0.51 $ 1.16Net income per
share – diluted(a) $ 0.51 $ 0.61 $ 0.47 $ 1.032005Total revenue $612,653 $667,189 $627,999 $659,707Gross profit 412,811 430,800 424,297 452,595Income before
income taxes 46,048 49,533 40,625 57,359Net income 29,930 32,578 26,571 37,561Net income per
share – basic $ 0.61 $ 0.68 $ 0.56 $ 0.80Net income per
share – diluted(a) $ 0.57 $ 0.63 $ 0.52 $ 0.74
(a) Diluted net income per share reflects the potential dilutioneffects of the Company’s Senior Notes (as discussed in Notes 2,4 and 6) for all quarters presented for 2006 and 2005.
67
CBRL GROUP, INC .
Corporate Officers
CBRL GROUP, INC.
Michael A. WoodhouseChairman, President and Chief Executive Officer
Edward A. GreeneSenior Vice President/Strategic Initiatives
N.B. Forrest ShoafSenior Vice President/General Counsel andSecretary
Simon A. TurnerSenior Vice President/Marketing andInnovation and Chief Marketing Officer
Lawrence E. WhiteSenior Vice President/Finance and Chief Financial Officer
Diana S. WynneSenior Vice President/Corporate Affairs
Brently G. BaxterVice President/Internal Audit and Loss Prevention
Brian R. EytchisonVice President/Financial Planning and Analysis
Patrick A. ScruggsVice President/Accounting and Tax and Chief Accounting Officer
CRACKER BARREL OLD COUNTRYSTORE, INC.
Michael A. WoodhouseChairman, President and Chief Executive Officer
Douglas E. BarberSenior Vice President/Restaurant Operations
P. Doug CouvillionSenior Vice President/Finance
Robert J. HarigSenior Vice President/Human Resources
Terry A. MaxwellSenior Vice President/Retail Operations
William H. CraytonVice President/Retail Planning and Allocation
Craig R. DavisVice President/General Merchandise Manager
Robert F. DoyleVice President/Product Development andQuality Assurance
Nelson P. GriffinVice President/Diversity and Outreach
Joseph Larry JonesVice President/Innovation
A. George Kingsmill, Jr.Vice President/Stores
Timothy W. MullenVice President/Information Services
Thomas R. PateVice President/Management Training andDevelopment
Michael J. ZylstraVice President/General Counsel and Secretary
Charlie E. AustinRegional Vice President/Restaurant Operations
Lisa P. ChristmanRegional Vice President/Retail Operations
Brenda L. CoolRegional Vice President/Retail Operations
Kathleen A. DilleyRegional Vice President/Restaurant Operations
Alvin M. DozierRegional Vice President/Restaurant Operations
Nicholas V. FlanaganRegional Vice President/Restaurant Operations
Cecilia S. GibsonRegional Vice President/Retail Operations
Anthony P. GuadagnoRegional Vice President/Restaurant Operations
Sandra K. HayesRegional Vice President/Retail Operations
Catherine J. McCarthyRegional Vice President/Retail Operations
H. Stacey MonteleoneRegional Vice President/Retail Operations
Laura E. MurchisonRegional Vice President/Retail Operations
Beth J. QuinnRegional Vice President/Retail Operations
Mark W. RomankoRegional Vice President/Restaurant Operations
Michelle R. Scott-Ramirez Regional Vice President/Retail Operations
David R. SwartlingRegional Vice President/Restaurant Operations
Walter W. TyreeRegional Vice President/Restaurant Operations
Bart F. VigRegional Vice President/Restaurant Operations
Stanley T. WarnerRegional Vice President/Restaurant Operations
LOGAN’S ROADHOUSE, INC.
G. Thomas VogelPresident and Chief Executive Officer
Amy L. BertauskiSenior Vice President/Accounting/Controller/Treasurer
Robert R. EffnerSenior Vice President/Development andOperations Innovation
Christopher J. PlunkettSenior Vice President/Operations
Stephen R. AndersonVice President/Menu and Culinary Innovation
David CavallinVice President/Finance
Lucy A. DanielsVice President/Legal and Secretary
Scott E. DeverVice President/Information Services
Lynn D. WildmanVice President/Purchasing
James B. KuehnholdRegional Vice President/Operations
Joseph P. LandyRegional Vice President/Operations
Paul S. PendletonRegional Vice President/Operations
(a) Member of Executive Committee(b) Member of Audit Committee(c) Member of Compensation and Stock
Option Committee(d) Member of Nominating and Corporate
Governance Committee(e) Member of Public Responsibility
Committee
Directors
James D. Carreker(a)(c)(e)
Retired, Chairman and Chief Executive Officer,The Bombay Company, Inc. (retail company)
Robert V. Dale(a)(b)(c)(d)
Retired, President, Windy Hill Pet FoodCompany
Richard J. Dobkin(b)
Retired, Managing Partner, Ernst & Young,LLP (public accounting firm)
Robert C. Hilton(a)(b)
President, Autumn Capital (private investment firm)
Charles E. Jones, Jr.(a)(c)(d)
President, Corporate Communications,Incorporated (investor relations firm)
B.F. Lowery(a)(e)
Attorney at Law, Chairman and ChiefExecutive Officer, Lo Jac Enterprises, Inc.
Martha M. Mitchell(d)(e)
Retired, Senior Vice President and Partner,Fleishman-Hillard, Inc. (public relations firm)
Erik Vonk(d)
Chairman and Chief Executive Officer, Gevity HR, Inc. (human resources servicesmanagement firm)
Andrea M. Weiss(c)(e)
President and Chief Executive Officer, Retail Consulting, LLC
Jimmie D. White(b)(e)
Retired, Senior Vice President and Chief Financial Officer, Cracker Barrel Old Country Store, Inc.
Michael A. Woodhouse(a)
Chairman, President and Chief ExecutiveOfficer, CBRL Group, Inc.
68
CORPORATE OFFICES
CBRL Group, Inc.P.O. Box 787305 Hartmann DriveLebanon, Tennessee 37088-0787Phone 615-443-9869cbrlgroup.com
TRANSFER AGENT
Computershare Investor Services LLC730 Peachtree StreetSuite 840Atlanta, Georgia 30308
INDEPENDENT REGISTERED PUBLIC ACCOUNTING FIRM
Deloitte & Touche LLP, Nashville, Tennessee
GENERAL COUNSEL
N.B. Forrest Shoaf, Senior Vice President, Secretaryand General Counsel, Corporate Offices
10-K REPORT
A copy of the CBRL Group, Inc. Form 10-K AnnualReport for Fiscal 2006 filed with the Securities andExchange Commission, may be obtained withoutcharge through our Internet website, located atcbrlgroup.com and (without exhibits) by writingto the Company, attention: Investor Relations. Ifrequested in writing, exhibits to the Form 10-KAnnual Report are available for a reasonable fee.
ANNUAL MEETING
The annual meeting of shareholders will be held at10:00 a.m. Tuesday, November 28, 2006, at theCracker Barrel Old Country Store offices on HartmannDrive, Lebanon, Tennessee. There were 12,503shareholders of record as of September 29, 2006.
DIVIDEND REINVESTMENT AND STOCK PURCHASE PLAN
CBRL Group, Inc. offers shareholders a DividendReinvestment and Common Stock Purchase Plan.If you would like to receive a Prospectus,Enrollment Card and Cash Investment TransmittalCard describing the various features of the Planor if you have any questions regarding the Plan,please call Computershare Investor Services LLCat 800-568-3476.
CBRL GROUP, INC .
Corporate Information

©2006 CBOCS Properties, Inc.
Pecan Pancakes Florida Orange Juice Yankee Candle® FrenchToast Coca-Cola® Jawbreakers
Eggs-In-The-Basket Chicken n’ Dumplins Sweet Tea Licorice Harmonica Pleasing People
Heritage Music Antiques Puzzles Comfort Food Cracker Barrel Dinner
Chocolate Cobbler Oil Lamp Homemade Sunrise Sampler® Charles Chips® Grade A Eggs
Apple Cider Cracker Jack® Raspberry Iced Tea Slinky® MoonPie® Lodge Logic® Cast Iron
AmericanMusicLegendsTM Wild Maine Blueberry Pancakes 1969
Macaroni n’ Cheese Pinto Beans Lebanon,Tennessee Peg Game Blackberry Cobbler Filling
Travelers & Neighbors Chicken Pot Pie Sunday Homestyle Chicken Rockers Apple Butter
Breakfast Hickory Smoked Country Ham 100% Pure Maple Syrup Vidalia Onion Rings
Lodge Logic® Cast Iron Roast Beef Farm Raised Catfish Buttermilk Pancakes Pinto Beans
Thick Sliced Bacon Checkers Biscuits American Music LegendsTM Highway 109
French Toast Books-On-Audio Lemonade Meatloaf Grits Comfort Food John Deere®
Candy Grilled Pork Chops Turnip Greens Corn Muffins Country Fried Steak Fried Okra
Sugar Cured Ham Grade A Eggs Sunrise Sampler® Peanut Brittle
Pinto Beans Farm Raised Catfish Heritage Music Smoked Sausage
Comfort Food Mashed Potatoes Apple Butter Blackberry Cobbler
Marion Blackberry Harmonica Thick Sliced Bacon Jawbreakers
Florida Grapefruit Juice Raspberry Lemonade Eggs-In-The-Basket Sawmill Gravy Puzzles
100% Pure Maple Syrup Fireplace Fried Apples Pleasing People Peg Game
Books-On-Audio Licorice Chocolate Cobbler Sugar Cured Ham Florida Grapefruit Juice
Dubble Bubble® Preserves Cracker Jack® Made-From-Scratch Lebanon, Tennessee Jacks
Rockers Sweet Tea Buttermilk Biscuits Hashbrown Casserole Fried Apples Sourdough Toast
Uncle Herschel’s Favorite® CountryChef Salad Front Porch Quilts Peg Game Cracker Barrel
Whole Kernel Corn Sunday Homestyle Chicken Apple Cider
Highway 109 Good Country Cookin’ Golden Delicious Apples Peg Game Jawbreakers
Cherry Cobbler Filling Turkey n’ Dressing Coca-Cola® MoonPie® Vidalia Onion Rings
Frozen Mug Sundaes Beans n’Greens Chow Chow Relish Baked Apple Dumplin Fried Okra
LemonadeCountryVegetables Sweet Whole Baby Carrots Roast Beef
Books-On-Audio Country Fried Steak Turnip Greens Highway 109 Florida Grapefruit Juice
Smoked Sausage Cracker Barrel Blackberry Cobbler John Deere® Buttermilk Biscuits
Country Green Beans Made-From-Scratch Checkers Friday Fish Fry Mashed Potatoes
100% Pure Maple Syrup Vidalia Onion Rings Chicken Pot Pie Sugar Cured Ham Lunch
Meatloaf Chocolate Cobbler Apple Butter Grits Fireplace Country Green Beans
Grilled Pork Chops Macaroni n’ Cheese French Toast Dubble Bubble® Coffee Lemonade
Travelers & Neighbors Fried Okra Grand Ole Opry® Chicken n’ Rice Farm Raised Catfish
PO Box 787, Lebanon, TN 37088-0787