Embed Size (px)
Citation preview

Fire Safety Design of a LargeShopping Mall Using ExtendedQuantitative Risk Analysis
The Swedish Case Study for the 3rd International Conference on Performance-Based Codes and Fire Safety Design Methods, Lund, June 15th-17th, 2000
Malmö, May 1st, 2000SYCON ENERGIKONSULT ABRisk & Fire
Lotta AnderssonFredrik K Olsson
0
0.02
0.04
0.06
0.08
0.1
0.12
0.14
0 20 40 60 80 100 120 140 160
Average number of people exposed to critical conditions
Pro
babi
lity,
giv
en fi
re

Department Type of document Name of document
Risk & Fire Report Lot99045 1(41)Author Date File
Lotta AnderssonFredrik K Olsson
2000-05-01 092 SF
Signature Checked Approved
To För info
3rd International Conference on Performance-basedCodes and Fire Safety Design Methods, Lund, Sweden,June 15th-17th, 2000
Fire Safety Design of a Large Shopping Mall Using ExtendedQuantitative Risk Analysis
The Swedish Case Study for the 3rd International Conference on Performance-Based Codes and Fire Safety Design Methods, Lund, Sweden, June 15th-17th,2000
Contents
1 Introduction ........................................................................ 4
1.1 Background ..........................................................................................41.2 Objectives and applications ..................................................................41.3 General limitations ...............................................................................4
2 Method for Analysis ........................................................... 42.1 The definition of risk ............................................................................42.2 Risk measures.......................................................................................52.3 Fire safety design processes ..................................................................52.4 Extended Quantitative Risk Analysis ....................................................72.5 Model description.................................................................................72.5.1 Event tree construction .........................................................................82.5.2 Collecting relevant model input ............................................................82.5.3 Calculating probabilities .......................................................................82.5.4 Calculating consequences .....................................................................92.5.5 Evaluate risk.........................................................................................9
3 Swedish Building Regulations .......................................... 113.1 General regulations.............................................................................113.1.1 General (5:1) ......................................................................................113.1.2 Fire resistance classes and other conditions (5:2) ................................123.1.3 Escape in the event of fire (5:3) ..........................................................13

2000-05-01 2(41)
3.1.4 Protection against the spread of fire inside a fire compartment (5:5) ...133.1.5 Protection against the spread of fire and fire gases between fire
compartments (5:6).............................................................................143.1.6 Load-bearing capacity in the event of fire (5:8)...................................143.2 Merchandise related regulations (5:371 Places of assembly) ...............153.2.1 Escape alarm (5:3711) ........................................................................153.2.2 Emerg1ency lighting etc. (5:3712)......................................................16
4 Qualitative design review ................................................. 17
4.1 Review of architectural design............................................................174.2 Characterization of building, environment and occupants ...................174.2.1 Building..............................................................................................174.2.2 Occupants...........................................................................................184.2.3 Enclosure and environment.................................................................184.2.4 Fire safety management ......................................................................184.3 Fire safety objectives ..........................................................................194.4 Evacuation strategy.............................................................................194.5 Acceptance criteria .............................................................................194.6 Fire hazards ........................................................................................194.7 Fire scenarios for analysis...................................................................204.8 Critical conditions ..............................................................................204.9 Trial fire safety designs.......................................................................204.9.1 Prescriptive design alternative ............................................................214.9.2 Performance based design alternative .................................................214.10 Method of analysis..............................................................................23
5 Quantitative risk analysis of prescriptive alternative..... 24
5.1 Description of event tree.....................................................................245.1.1 Place of fire start ................................................................................245.1.2 Automatic detection............................................................................245.1.3 Fire is extinguished.............................................................................255.1.4 Automatic escape alarm......................................................................255.1.5 Correct behavior of personnel .............................................................265.1.6 All escape routes available..................................................................265.2 Calculation of consequence.................................................................275.2.1 Detection time ....................................................................................275.2.2 Reaction time......................................................................................275.2.3 Travel time .........................................................................................275.2.4 Time to critical conditions ..................................................................295.3 Results ...............................................................................................29
6 Quantitative risk analysis of the performance baseddesign alternative........................................................................ 316.1 Description of event tree.....................................................................316.1.1 Reversed direction of escalators..........................................................316.1.2 Sprinkler system .................................................................................316.2 Calculation of consequences ...............................................................316.2.1 Detection time ....................................................................................31

2000-05-01 3(41)
6.2.2 Reaction time......................................................................................316.2.3 Travel time .........................................................................................326.2.4 Time to critical conditions ..................................................................326.3 Results ...............................................................................................33
7 Life cycle cost analysis ...................................................... 347.1 Calculation of life cycle cost...............................................................347.1.1 General assumptions...........................................................................347.1.2 Prescriptive design alternative ............................................................347.2 Performance based design alternative .................................................357.3 Result ...............................................................................................35
8 Evaluation of design alternatives ..................................... 36
8.1 Risk to life ..........................................................................................368.1.1 Comparison of individual risk.............................................................368.1.2 Comparison of average risk ................................................................368.1.3 Comparison of societal risk.................................................................378.1.4 Conclusions ........................................................................................388.2 Comparison of life cycle cost..............................................................38
9 Discussion.......................................................................... 39
10 References ......................................................................... 40
AppendixAppendix A Drawings for prescriptive and performance based design
alternativeAppendix B Event trees for prescriptive and performance based design
alternativeAppendix C Regression analysis of FAST

2000-05-01 4(41)
1 Introduction
1.1 BackgroundThe biannual “International Conference on Performance-Based Codes and FireSafety Design Method” held in Lund, Sweden between the 15th and the 17th ofJune 2000 is the third conference on the subject. During the conference aselection of case studies will be presented. This report constitutes theconference contribution from the department of Risk & Fire at Sycon.
1.2 Objectives and applicationsThe objective of this report is to undertake a performance-based fire safetydesign for a shopping mall and to compare the resulting fire safetyrecommendations with those specified by existing prescriptive requirements.The quantitative comparison between solutions shall include life cycle cost andrisk for human life.
An underlying objective with this case study is to try a new method forquantitative analyses where uncertainty analysis is a natural part of the process.This report focuses therefore at the method of quantitative analysis rather thanon finding a unique design solution.
1.3 General limitationsThe methodology has been focused on the analysis method and not on aspecific design solution.
2 Method for Analysis
2.1 The definition of riskIn the CPQRA (1989) risk is defined as a measure of economic loss or humaninjury in terms of both the likelihood and the magnitude of the loss or injury.The IEC (1995) defines risk as a combination of the frequency, or probability,of occurrence and the consequence of a specified hazardous event. Note thatthe concept of risk always has two elements: the frequency or probability withwhich a hazardous event is expected to occur and the consequences of thehazardous event.
Two quantitative risk analysis (QRA) methods can be used to quantify the riskto occupants in for example, a building in which a fire has broken out. Theextended QRA considers the inherent uncertainty in the variables explicitly.The standard QRA does not consider uncertainties in the variables and musttherefore be accompanied by a sensitivity analysis or an uncertainty analysis(Frantzich, 1998). Both methods provide risk measures such as individual riskand FN curves.
2000-05-01 5(41)
2.2 Risk measuresRisk can be expressed as individual risk or as societal risk. These are the twomost frequently used risk measures. Individual risk measures consider the riskto an individual, who may be at any point in the effect zones of incidents, whilesocietal risk measures consider the risk to populations that are in the effectzones of incidents. In this report the effect zone is the analysed shopping mall.
The CPQRA (1989) gives the following illustrative example of the differencebetween individual and societal risk.
An office building is located near a chemical plant and contains 400 peopleduring office hours and one guard at other times. If the likelihood of anincident causing a fatality at the office building is constant throughout the day,each individual in that building is subject to a certain individual risk. Thisindividual risk is independent of the number of people present – it is the samefor each of the 400 people in the building during office hours and for the singleguard at other times. However, the societal risk is significantly higher duringoffice hours, when 400 people are affected, than at other times when a singleperson is affected.
In this report both the individual risk measure and societal risk measure will beused to express the risk. When performing a risk analysis for the case of fire,today’s methods do not provide sufficient information to calculate the numberof fatalities. Instead, a measure of the number of people who will be exposed tocritical, i.e. untenable, conditions will be used. The definition of criticalconditions will be discussed in section 4.8.
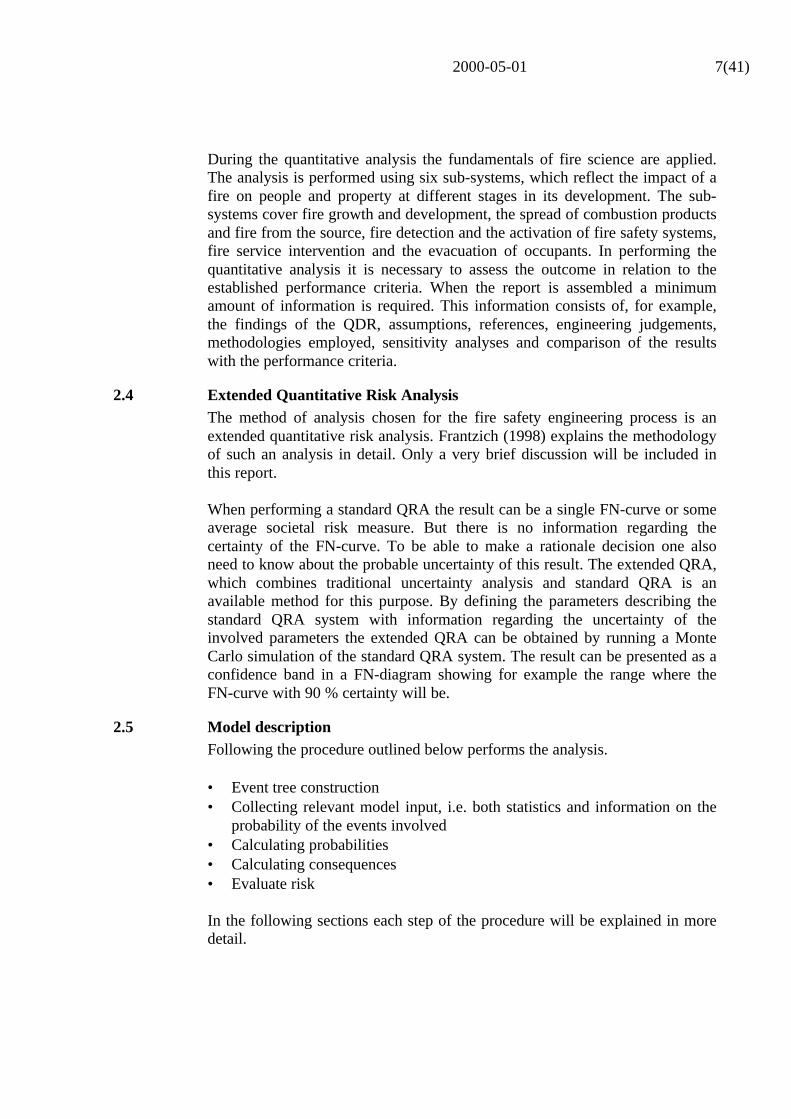
2.3 Fire safety design processesIn their Draft for Development No. 240 (BSI, 1997), the British StandardsInstitution outlines a framework for an engineering approach to fire safety inbuildings. This framework can be used to show that regulatory or insurancerequirements can be satisfied. The basic fire safety design process consists offour main stages.
• A qualitative design review• A quantitative analysis• Assessment against criteria• Reporting and presentation

2000-05-01 6(41)
This basic process is illustrated in Figure 2.1. The BSI (1997) gives guidancein the application of scientific and engineering principles to the protection ofpeople and property against fire. The framework presents an excellentapproach on how to handle fire safety design issues. Because of itscompleteness, this framework is highly recommended as a fire engineeringguideline.
Start
Qualitative design review
(QDR)
Quantitativeanalysis of
design
Reporting andpresentation of
resultsSatisfactory
Unsatisfactory
EndAssessment
against criteria
Figure 2.1 The basic fire safety design process
Fire is a transient process, which affects a building and its occupants indifferent ways at different stages. The process of fire safety design iscomplicated by the fact that time is one of the key design parameters. As statedby the BSI (1997), it is important when carrying out a quantitative analysis, torecognise the role of time and the interaction of parameters within a consistenttime framework. When assessing the number of people exposed to criticalconditions a comparison between two time lines is made. One of these timelines represents the course of the fire, in terms of its size, rate of burning andsmoke or toxic gas concentration. The other time line represents the responseto the fire by the occupants. These time lines and the specific expressions usedare presented in Figure 2.2. Note that the expressions differ between differentcountries.
Ignition Detection
tdetection
tevacuation
treaction
ttravel
Evauation time
Travel time
Evacuationcomplete
Tenabilitylimit
tcritical
Reaction time
Time
Time to reach critical conditions
Detection time
Figure 2.2 Example of a time line comparison of fire development and evacuation
The fire safety design process begins with a qualitative design review (QDR).During the QDR the scope and the objectives of the fire safety design aredefined, performance criteria established and one or more potential designsolutions proposed. Key information to be used as input in the quantitativeanalysis is also gathered.
2000-05-01 7(41)
During the quantitative analysis the fundamentals of fire science are applied.The analysis is performed using six sub-systems, which reflect the impact of afire on people and property at different stages in its development. The sub-systems cover fire growth and development, the spread of combustion productsand fire from the source, fire detection and the activation of fire safety systems,fire service intervention and the evacuation of occupants. In performing thequantitative analysis it is necessary to assess the outcome in relation to theestablished performance criteria. When the report is assembled a minimumamount of information is required. This information consists of, for example,the findings of the QDR, assumptions, references, engineering judgements,methodologies employed, sensitivity analyses and comparison of the resultswith the performance criteria.
2.4 Extended Quantitative Risk AnalysisThe method of analysis chosen for the fire safety engineering process is anextended quantitative risk analysis. Frantzich (1998) explains the methodologyof such an analysis in detail. Only a very brief discussion will be included inthis report.
When performing a standard QRA the result can be a single FN-curve or someaverage societal risk measure. But there is no information regarding thecertainty of the FN-curve. To be able to make a rationale decision one alsoneed to know about the probable uncertainty of this result. The extended QRA,which combines traditional uncertainty analysis and standard QRA is anavailable method for this purpose. By defining the parameters describing thestandard QRA system with information regarding the uncertainty of theinvolved parameters the extended QRA can be obtained by running a MonteCarlo simulation of the standard QRA system. The result can be presented as aconfidence band in a FN-diagram showing for example the range where theFN-curve with 90 % certainty will be.
2.5 Model descriptionFollowing the procedure outlined below performs the analysis.
• Event tree construction• Collecting relevant model input, i.e. both statistics and information on the
probability of the events involved• Calculating probabilities• Calculating consequences• Evaluate risk
In the following sections each step of the procedure will be explained in moredetail.

2000-05-01 8(41)
2.5.1 Event tree constructionThe computer program PRECISION TREE (Decision tools, 1997) is used toconstruct the event tree. The event tree describes what can happen when a firestarts in the building and is constructed by putting together different eventsleading to a specific consequence. Each event is then assigned a specificprobability or distribution of probabilities. Examples of events are theeffectiveness and reliability of the active systems in the building, the behaviourof the personnel, do they extinguish the fire and do they lead the customers tothe evacuation exits etc. The event tree construction is described in Figure 2.3.
Event tree
Active systems
Availability ofevacuation exits
Behavior ofpersonnel
Passive systems
Place of firestart
Figure 2.3 A simple description of event tree construction
2.5.2 Collecting relevant model inputWhen the event tree has been created there is a need to gather informationabout the events included in the tree. This information either relates to theprobability of the event or to the effect that the event has to the scenario.
Literature review and, where no data is available, engineering judgementgather event probabilities. It is also possible to use fault tree technique toestimate the probability of the particular event. An approach that is verycommon in nuclear power plant PSA-studies (Jacobsson, ). When assessingwhat effect the event has to a scenario literature and experience on humanbehavior in fire, etc. is used.
2.5.3 Calculating probabilitiesFor each scenario the probability of occurrence is calculated. For each scenariothis is done 1000 times, each time with different input values chosen randomlyfrom the input distributions. The calculations are done using Monte Carlosimulations within the computer program @RISK (Decision tools, 1997).

2000-05-01 9(41)
2.5.4 Calculating consequencesThe consequence for each scenario is defined as the number of people not ableto evacuate before critical conditions arise. This number is calculated for eachscenario by calculating and comparing time to critical conditions, tcritical, withthe total evacuation time. The total time to evacuation consists of time todetection, tdetection, time to reaction, treaction, and finally the travel time, ttravel. Themarginal between critical conditions and evacuation time can then be describedas:
evacuationreactionectioncritical ttttM −−−= det
How the different times are calculated is described in section 5.2. The numberof people not being able to evacuate, N, is then calculated consistent with thefollowing conditions:
If M > 0 then N = 0If M < -tevac then N = N0
If M > -tevac then N = -M.f.N0.B
WhereN0 = number of people evacuating through the critical exitF = flow through opening [people/s]B = width of opening [m]
This means that:• When the marginal is positive the consequence is zero.• When critical conditions occur before the evacuation has started the
consequence is equal to the total number of people in the building at thetime of the fire
• When critical conditions occur during the evacuation process theconsequence is calculated as a function of the marginal, the number ofpeople evacuating through the critical evacuation exit, and also the widthand flow through this exit.
The consequence for each scenario is calculated 1000 times with differentinput values chosen from the input distributions. This is done using thecomputer program @RISK (Decision tools, 1997).
2.5.5 Evaluate riskThe individual risk, the average risk and the societal risk is evaluated in thefinal step of the analysis. There are no difficulties in comparing the individualrisk as well as the average risk as they represents point values. But for thesocietal risk the situation is more complicated.
The outcome of the simulations, described in section 2.5.3 and 2.5.4, is onethousand probability-consequence pairs for each of the scenarios in the eventtree. This enormous amount of information must be structured in a logical way.By using MATLAB (MATLAB, 1996) routines written by Frantzich (1998) itis possible to evaluate the thousand risk profiles rationally. The routines

2000-05-01 10(41)
calculates the risk profiles of the desired percentile and illustrates themgraphically (see Figure 2.4). The evaluation of societal risk is then donecomparing the profiles representing the 90th percentile for each alternative.
0
0.02
0.04
0.06
0.08
0.1
0 1000 2000 3000 4000 5000
x, Number of people exposed to critical conditions
Pro
babi
lity
of X
>x,
giv
en fi
re
Figure 2.4 Example of risk profiles produced by the MATLAB routines. Instead ofshowing all thousand risk profiles, the routines make it possible to drawprofiles that represents a certain percentile. The figure shows the risk profilesof the 10th, 50th and 90th percentiles.
2000-05-01 11(41)
3 Swedish Building RegulationsThe Swedish Board of Housing, Building and Planning is responsible for thebuilt environment and the management of natural resources, physical planning,building and housing. The board is responsible for public requirements onbuildings. These primarily concern health, safety, accessibility and energymanagement. Section 5 in the Swedish Building Regulations (BBR, 1999)deals with “Safety in Case of Fire”. The regulations consist of mandatoryprovisions and general recommendations. Text recited from the regulations iswritten in italic and the figures between brackets refer to the relevant section inthe regulations.
3.1 General regulations
3.1.1 General (5:1)Since the regulations of 1994, are performance based, it is always possible forthe fire engineer to design the building in other ways than those mentioned inthe regulations. Naturally, an extensive analysis is needed to ensure that thesafety level is sufficiently high.
Alternative design (5:11)Fire protection may be designed in a way different from that specifiedin this section (Section 5) if it is shown by special investigation that thetotal fire protection of the building will not be inferior to that whichwould be obtained if all the requirements specified in the section hadbeen complied with.
Documentation (5:12)Fire protection documentation shall be drawn up. This shall set out theconditions on which fire protection is to be based and the design of thefire protection.
Design by calculations (5:13)If design of fire protection is based on calculations, calculations shallbe based on a carefully selected design fire and shall be performed inaccordance with a model, which gives a satisfactory description of theproblem at hand. The calculation model selected shall be stated.
Control of design for escape (5:14)In buildings where there is a high risk of injury to persons, design forescape by calculation may be used only if the correctness of thecalculation can be demonstrated by design control.

2000-05-01 12(41)
Sometimes it is necessary to design a building with demands higher than thosespecified in the regulations. Higher demands on building safety could berequired if the fire service is unable to launch an attack within normal timelimits. A survey performed at the fire services in the cities of Gävle, Ljusdaland Enköping, Sweden, shows that the emergency force is not able to intervenewithin the first fifteen to twenty minutes (Sirenen, 1998). When studying firescenarios at a hospital, this time could be considered too long and maytherefore motivate higher demands on safety than those given in theregulations.
3.1.2 Fire resistance classes and other conditions (5:2)A building shall be constructed to Class Br1, Br2 or Br3. Classification shalltake account of factors, which affect the possibility of escape and the risk ofinjury to persons in the event that the building collapses. The possibility ofescape shall be assessed with regard to the height and volume of the buildingand the activities carried out in the building, and to the number of persons whoare expected to be in the building at the same time, and the likelihood that thesepersons can reach safety on their own.
A building in which a fire would entail a high risk of injury to persons shall beconstructed to Class Br1. In such buildings the most stringent requirements areimposed on e.g. finishes and on load bearing and separating structures. Abuilding in which a fire may entail a moderate risk of injury to persons shall beconstructed to Class Br2. Other buildings may be constructed to Class Br3.
Buildings, general recommendation (5:21)Buildings of three or more storeys should be constructed to Class Br1.
Depending on their function, structural elements are assigned to the followingclasses:
• R (load bearing capacity),• E (integrity), and• I (insulation).
Digits specifying the time requirement, 15, 30, 45, 60, 90, 120, 180, 240 or 360minutes follow the designations R, RE, E, EI and REI.
The following class designations are also used:
• Non-combustible and combustible material and material of low ignitability(combustible material which complies with certain requirements)
• Ignition retardant cladding• Surface finish of Class I, II or III (of which Class I complies with the most
stringent requirements)

2000-05-01 13(41)
3.1.3 Escape in the event of fire (5:3)General (5:31)Buildings shall be designed so that satisfactory escape can be effectedin the event of fire. Special attention shall be paid to the risk thatpersons may be injured by the fall of elements of structure or due tofalls and congestion and to the risk that persons may be trapped inrecesses or dead ends.
Buildings in which people are present not just temporarily should be designedwith at least two independent escape routes. If the building consists of morethan one storey, there should be at least one escape route from each floor. Thedistance of travel inside a fire compartment to the nearest escape route shall notbe so great that the compartment cannot be evacuated before critical conditionsarise. Along an escape route, the travel distance to the nearest stairway leadingto another storey, or to an exit leading into the street or similar space, shall notbe so great that escape cannot take place rapidly.
In design with respect to the safety of escape, the conditions in the buildingshall not become such that the limiting values for critical conditions areexceeded during the time needed for escape.
Design conditions, general recommendations (5:36)In evaluating critical conditions, consideration should be given tovisibility, thermal radiation, temperature, noxious gases and thecombination of temperature and noxious gases. The following limitingvalues can normally be applied:Visibility: level of fire gases not lower than 1.6+(0.1xH) m, where H isthe height of the room.Thermal: a short-term radiation intensity of maximum 10 kW/m2,radiation: a maximum radiant energy of 60 kJ/m2 in addition to theenergy from a radiation of 1 kW/m2.Temperature: air temperature not higher than 80°C.
3.1.4 Protection against the spread of fire inside a fire compartment (5:5)Surface finishes and claddings in escape routes shall be of materials thatprovide negligible contribution to the spread of fire.
In buildings of Class Br1 or Br2, ceilings and internal walls in escape routesshall have surface finish of Class I. The surface finish shall be applied to non-combustible material or to ignition-retardant cladding. In buildings of ClassBr1 the floor covering in escape routes shall be constructed of a material with amoderate propensity to spread fire and evolve fire gases.

2000-05-01 14(41)
3.1.5 Protection against the spread of fire and fire gases between firecompartments (5:6)Buildings shall be divided into fire compartments separated by structuralelements, which impede the spread of fire and fire gases. Each firecompartment shall comprise a room - or associated groups of rooms - in whichthe activity has no immediate connection with other activities in the building.A fire compartment shall not - with the exception of dwellings, stairways, liftwells and open garages - comprise spaces on more than two storeys unless anautomatic water sprinkler installation or other arrangements protect the spaces.
Each fire compartment shall be separated from other spaces in the building bystructural elements (including service penetrations, necessary supports,connections and similar structures) constructed to not less than the fireresistance class commensurate with the requirements in the regulations.
Elements of structure shall be constructed to not less than the fire resistanceclass set out in Table 5.1 below. The fire resistance class in Column 1 (f < 200)may be applied to dwellings and offices, schools, hotels, garages for cars,shops for the sale of food, residents' store rooms and comparable firecompartments. This class may also be applied to fire load intensities higherthan 200 MJ/m2 for buildings protected by automatic water sprinklerinstallation.
Table 3.1 Fire resistance classes for different structural elements.
Element of structure Fire resistance class for a fire load intensity,f (MJ/m2)f ≤ 200 f ≤ 400 f > 400
Elements of structureseparating fire compart-ments in general, and afloor above a basement
EI 60 EI 120 EI 240
Doors, shutters and access panels in elements of structure separatingcompartments shall normally be constructed to the same fire resistance class asthat which applies for the element of structure in question.
3.1.6 Load-bearing capacity in the event of fire (5:8)Load-bearing structures shall be designed and sized so that in the event of firethere is adequate structural safety with respect to material failure and instabilityin the form of local, overall and lateral torsional buckling and similar effects.Parts of the load-bearing structure, including supports, joints, connections andsimilar structures, shall be designed so that collapse does not occur - during aspecified period of time in accordance with the fire resistance classes forelements of structure.
Since the collapse of load-bearing structures is most unlikely to occur withinthe time frame relevant for escape, the issue is not further discussed.

2000-05-01 15(41)
3.2 Merchandise related regulations (5:371 Places of assembly)Escape routes from places of assembly shall be designed for the number ofpersons who are permitted to be present in the premises. Escape from places ofassembly shall not take place through other places of assembly.
General recommendation (5:371)If the number of persons is not known, the following assumptions maybe made:
−If the premises shall be used by seated persons and the seats areplaced in rows, the escape routes should be designed for 1.7 persons/m
2
net area. The gangways in the premises which are intended for theseated audience should be counted as part of this area, but the stage ordais should not.
-If the premises shall be used for both standing and seated persons, theescape routes should be designed for 2.5 persons/m
2 net area.
The escape routes in a department store or similar installation for retailtrade should be designed for 0.5 persons/m
2 net area for those spaces to
which the public has access.In places of assembly or in the anterooms of these there should be signsstating the maximum number of persons who are permitted to be in thepremises at the same time.
Places of assembly should have not less than three escape routes if theyare intended for more than 600 persons, and not less than four if theyare intended for more than 1000 persons.
Escape routes from places of assembly may be in communication withone another through intermediate foyers or similar spaces which areseparated from the escape routes by construction to not less than ClassEI-C30.
3.2.1 Escape alarm (5:3711)Places of assembly shall be provided with an escape alarm which is activatedautomatically or from a staffed position when a fire is indicated.
General recommendationThe escape alarm should give those who are present in the place ofassembly spoken information regarding appropriate action to be takenfor escape.

2000-05-01 16(41)
3.2.2 Emerg1ency lighting etc. (5:3712)Places of assembly shall be provided with general lighting and emergencylighting. Stairs in places of assembly shall be provided with emergencylighting. Emergency lighting shall be provided immediately before exits to theexternal air. It shall be possible for the lighting needed in places of assembly inthe event of escape to be switched on from one position in the premises.External escape routes from places of assembly shall be lit and provided withemergency lighting along their entire length.
2000-05-01 17(41)
4 Qualitative design review
4.1 Review of architectural designAt the first stage in the QDR, the project is described by reference to schematicdrawings, models etc. Special requirements that may be significant in thedevelopment of a fire safety strategy are highlighted.
All the relevant information about the building, its contents, is collected.Information on combustible materials, ventilation, and management regimes isprovided. The number of people, their distribution and mobility is clarified.
4.2 Characterization of building, environment and occupants
4.2.1 BuildingThe building is a four-floor building and shall be used as a shopping mallcontaining parking areas, restaurants and stores. Floor number 2 and 3 areconnected by atria and are included in the same fire cell. Toilets and evacuationstairs are made as separated fire cells. Floors number 1 and 4 are connected tothe open air.
Table 4.1 Description of the activity in the building.
Floor Contents1 Parking area2&3 Four large size shops, twenty medium size shops
and twenty small size shops.4 Parking area
Each floor is having an area of 21 400 m2. The opening hours for the shoppingmall is 10 a.m. to 7 p.m. every day. The main entrances to the building are thecorner entrance at the second floor and the entrances from the parking areas.
The building is assumed to have enough separation distance to the closestneighboring building. According to the fire load in the building the structuralelements separating fire compartment shall have a fire resistance class of EI120if the building is without sprinkler system and EI60 if there is a sprinklersystem installed.
The height of the roof is four (4) meters between 1st and 2nd floor and between2nd and 3rd floor. Between 3rd and 4th floor the height is four (4) meters exceptin the atria were the height is 8 meters.
There is a fire safety airlock between the 1st and the 2nd floor and also betweenthe atria and the 4th floor. In the atria and at the top of each staircase there isfire ventilation that can be opened automatically.
An automatic fire alarm system and an evacuation alarm system is installed.Fixed fire fighting appliances are placed with a maximum distance of 100 mfrom each other.
2000-05-01 18(41)
General lightning, lightning of guiding marks and emergency lightning lastingfor at least 30 minutes, when without electrical current, is installed in theescape routes. General lightning and emergency lightning are also installed inthe stores and walkways.
4.2.2 OccupantsMaximum number of occupants is 10400. This maximum number of occupantshas been calculated using following assumptions:• 0,5 persons per effective area are assumed to be evenly distributed within
second and third floor• In the shopping areas 40% of the total area are supposed to be effective• In the walkways the effective area is assumed to be 100 % of the total area• At each floor, 250 persons are supposed to be seated in different restaurant.
The customers of the shopping mall are assumed to be mainly families andcouples. The occupants are supposed to have medium mobility and the state ofwakefulness are probably good. Most occupants are assumed not to be familiarwith the building. The responsiveness is predicted to be high in the case ofrecognized fire and medium if the fire can not immediately be recognized.
4.2.3 Enclosure and environmentThe ambient noise level is supposed to be high during hours of commerce. Aventilation room is placed at the fourth floor. From the ventilation room air isdistributed to the second and third floor. The ventilation system is an HVAC-system. Possible fire and smoke spread routes are the atria, the walkways andopenings between the shops.
An average value of the fire load in shopping areas can be derived from theCIB W14 workshop report (CIB W14, 1983). According to this the average fireload per square meter floor area is 600 MJ/m2 (BSI, 1997). In the Swedishregulation the fire resistant classes are connected to fire load per square meterenclosure area. A translation to fire load per square meter enclosure area givesa specific fire load of between 200 and 400 MJ/m2 which means that fireresistance class EI120 is required if sprinkler system are not installed, seesection 3.1.6.
In escape routes inner wall linings and ceiling linings are having fire resistanceClass I, attached upon noncombustible material. The floor is noncombustible orin Class G. Outer wall linings is of Class II. Ceilings in other areas have a fireresistance of linings in Class I attached upon noncombustible material orignition retarded material. Walls have linings at least in Class II. Assembly-halls are having all linings in Class I.
The width and number of escape routes are depending on fire safetyalternative, see section 4.9.1 and 4.9.2.
4.2.4 Fire safety managementA plan for fire safety system test, inspection and maintenance requirements androutines shall be established according to BFS 1995:17. The influence on the

2000-05-01 19(41)
fire safety objectives from new occupancies shall be evaluated. Education andtraining shall be performed regularly.
4.3 Fire safety objectivesAccording to the Case Study building specification the fire safety goals are:1) Safeguard occupants (permanent and transient) from injury due
to fire until such time as they reach a safe place. (This mayinclude self-relocating to a safe place within the building, self-evacuation to a safe place outside the building, evacuation withassistance from the fire service, or any combination of theabove.)
2) Safeguard fire fighters while attacking the fire. (This includesprotection from falling building parts, the minimisation ofdistance from safe place to the fire, measures for finding andfighting the fire.)
3) Limit flame spread and thermal damage to floor of origin, andlimit non-thermal damage to fire floor and the one above.
4) Provide sufficient structural stability to meet goals 1, 2 and 3above.
4.4 Evacuation strategyThe evacuation strategy is to simultaneously evacuate all people from thebuilding.
4.5 Acceptance criteriaThe acceptance criteria for the alternative solution is that the risk should beequal or better compared to the prescriptive solution. This criteria is given inthe building regulations (see section 3.1.1) making it possible for the engineerto optimize the design towards societal and client demands.
4.6 Fire hazardsPotential ignition sources in the building are:• Arson• Oven, kitchen range• Electric-light fittings• Electronic devices (TV, stereos etc)• Smoking/cigarettes• Electrical installations
Combustible contents are:• Textiles• Wood• Liquors• PlasticsFlammable liquids

2000-05-01 20(41)
4.7 Fire scenarios for analysisWhen reviewing fire statistics from shopping-related incidents there are anumber of possible fire scenarios to consider. The fire scenarios presented hereare chosen because they represent some kind of worst credible case. The firescenarios that are supposed to be the largest contributors to the risk are asfollows:
• Fire in a large shop selling electronics caused by an electrical fault. Theshop is located close to the atria at the third floor. Fire and smoke canspread into the atria and throughout the whole floor through the walkwayand openings to respective shops. The smoke will probably make theescalators in the atria impossible to use quite fast.
• Fire in a provisions-dealer shop at the third floor at the opposite side of theelectronic shop. The fire is caused by electric-light fittings and thecombustible material ignited is plastic. Fire and smoke can spread out inthe walkway and then continue spreading to the nearby shops. The fire canblock a lot of escape routs.
• Arson fire using flammable liquids in a shop at the second floor sellingbeds and bedclothes. The shop is located very close to the main entranceand is supposed to block this exit.
4.8 Critical conditionsThe goal is to compare the risk to life why the definition of critical conditionsstated in BBR can be used. Analysis shows (Frantzich, Olsson, 1999) that thecritical parameter is the height of the smoke layer. According to the BBR theheight of the smoke layer is causing critical conditions when it is placed equalor lower than 1,80 meter plus 10 % of the ceiling height.
4.9 Trial fire safety designsAs stated before two trial fire safety designs are being evaluated, one accordingto prescriptive regulation and the other according to performance-basedregulation. Possible fire safety measures above the fire safety measurespresented in section 4.9.1 is:
• Dividing the floors into fire cells with fire shutters that close when the firealarm activates.
• Fire ventilation systems (shutters that open when the fire alarm activates)• Sprinkler systems• Escape alarm system with higher reliability than standard systems• Smoke detectors and fire alarm with higher reliability than standard
systems and maybe also higher sensitivity• Smoke separating windows• Reversing the direction of the escalators in case of fire• Organizational measures
The chosen combination of fire safety measures chosen for the performance-based alternative is presented in section 4.9.2.

2000-05-01 21(41)
4.9.1 Prescriptive design alternativeThe fire safety design of this alternative is based upon the prescriptive rulesstated as advice in BBR (1999). The alternative is therefor generating aminimum safety level according to the building regulations. The following firesafety measures are included in the prescriptive fire safety design:• An automatic fire alarm• An automatic escape alarm with a spoken message connected to the fire
alarm• All fire resistance structures separating fire cells have a fire resistance
rating of EI120• A maximum distance to closest emergency exit of 30 meters
Where the last measure results in 29 evacuation exits/stairs according to thebuilding plan presented in Appendix A, and width of each evacuation exitpresented in Table 4.2.
Table 4.2 Width of evacuation exits/stairs.
Staircase number WidthT1, T3, T13-T15, T24-T29 1,2T5 2,0T6-T12, T16-T23 2,5T2 2,85T4 3,25
4.9.2 Performance based design alternativeThe performance-based solution contains the installation of a sprinkler system.The following fire safety measures are included in the alternative:• An automatic fire alarm• An automatic escape alarm with a spoken message connected to the fire
alarm• All fire resistance structures separating fire cells have a fire resistance
rating of EI60• A sprinkler system at the 2nd and 3rd floor of the building according to RUS
120:4 (RUS, 1993)• An automatic reversing of the direction of the escalators going up
connected to the fire alarm
The main deviation compared to the prescriptive alternative is that the numbersof evacuation exits are less (20 emergency stairs instead of 29), resulting in alonger distance to the closest exit. Placing of evacuation exits is presented inAppendix A. Width of each evacuation staircase is presented in

2000-05-01 22(41)
Table 4.3.
2000-05-01 23(41)
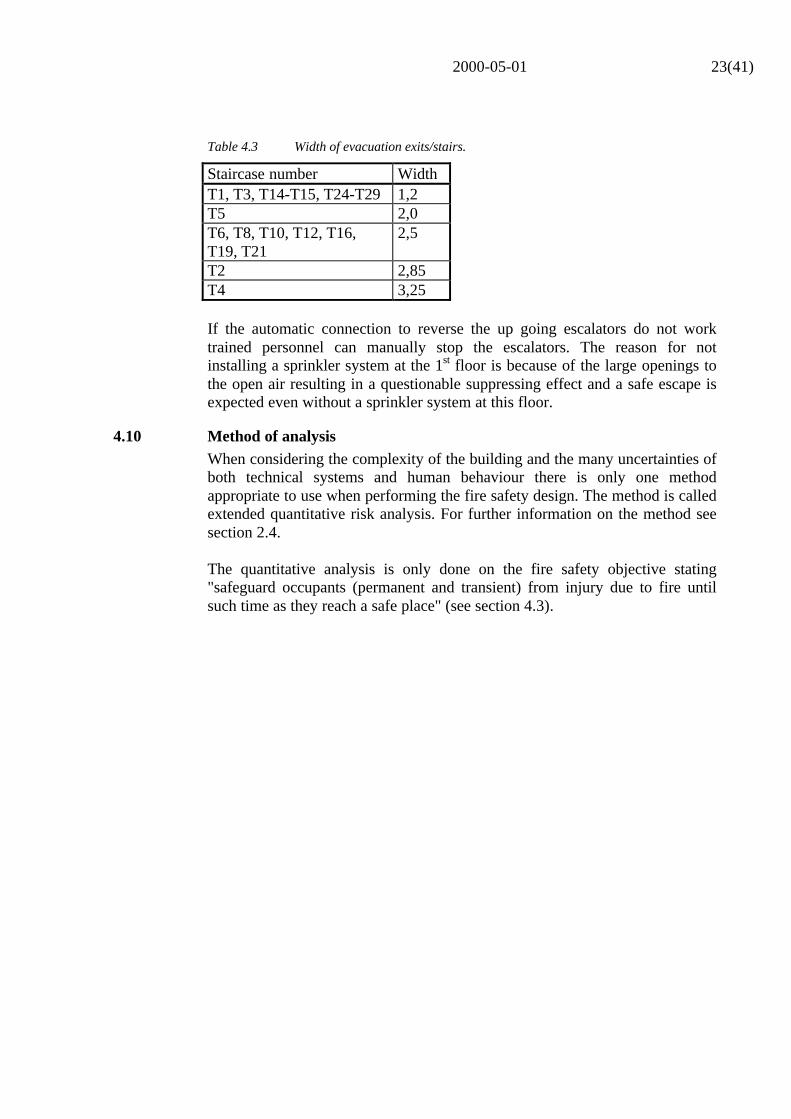
Table 4.3 Width of evacuation exits/stairs.
Staircase number WidthT1, T3, T14-T15, T24-T29 1,2T5 2,0T6, T8, T10, T12, T16,T19, T21
2,5
T2 2,85T4 3,25
If the automatic connection to reverse the up going escalators do not worktrained personnel can manually stop the escalators. The reason for notinstalling a sprinkler system at the 1st floor is because of the large openings tothe open air resulting in a questionable suppressing effect and a safe escape isexpected even without a sprinkler system at this floor.
4.10 Method of analysisWhen considering the complexity of the building and the many uncertainties ofboth technical systems and human behaviour there is only one methodappropriate to use when performing the fire safety design. The method is calledextended quantitative risk analysis. For further information on the method seesection 2.4.
The quantitative analysis is only done on the fire safety objective stating"safeguard occupants (permanent and transient) from injury due to fire untilsuch time as they reach a safe place" (see section 4.3).

2000-05-01 24(41)
5 Quantitative risk analysis of prescriptive alternative
5.1 Description of event treeThe risk analysis is done using event trees. Following events are considered inthe risk analysis:• Place of fire start• Automatic detection• Fire is extinguished• Automatic escape alarm• Correct behavior of personnel• All escape routes available
In the following chapters assumptions regarding probabilities, times andconsequences will be described for each of these events. The event tree for theprescriptive alternative is presented in Appendix B.
5.1.1 Place of fire startAccording to the QDR three different places of fire start shall be considered inthe analysis. These are; fire in an electronic shop at the third floor near theescalators, fire in a provisions-dealer shop at the third floor at the opposite sideof the electronic shop and fire in a bed-clothes shop at the second floor near themain entrance.
This event influences the fire growth rate and thereby the time to criticalconditions, tcritical, see section 5.2.4. The event also influence on the maximumnumber of people that have to be evacuated. If the fire is on the 2nd floor thenumber of people evacuating through a certain exit will be dependent on howmany people evacuating from the 3rd floor. The number of people is used asinput to the calculations of evacuation time, see section 5.2.3.
The probabilities can be decided comparing the floor area of each store. Theelectronic shop has a floor area of 1400 m2. The provisions-dealer shop has afloor area of 600 m2 and the bedclothes shop has an area of 150 m2. This givesa relative probability as follows:
• P(fire in electronic shop) = 0,651• P(fire in provisions-dealer shop) = 0,279• P(fire in bedclothes shop) = 0,070
5.1.2 Automatic detectionAutomatic detection occurs when the detectors are functioning correctly.Without automatic detection the fire is detected manually. The automaticdetection is connected to the escape alarm and if there is no automaticdetection there will be no escape alarm either. The probability of automaticdetection is defined as a uniform distribution between 0,9 and 0,95.

2000-05-01 25(41)
The respective detection times given with automatic detection are decidedusing an analytical expression given by a regression analysis of DETACT-T2(Evans et.al., 1985) according to Olsson and Frantzich (1999).
If there is no automatic detection the fire will be detected manually. This isassumed to happen when the smoke has reached the ceiling level and started tospread out in the room. The time from automatic detection to manual detectionis than dependent on the fire growth rate and the manual detection times aretherefore assumed to be 10% longer than the respective automatic detectiontimes.
5.1.3 Fire is extinguishedThe fire can be selfextinguished or be extinguished by personnel or visitorsusing fire hoses or hand extinguishers. Fire extinguishing by personnel orvisitors is only a possibility after automatic detection. If the fire is extinguishedno critical conditions can occur and therefore no time to critical conditions canbe decided resulting in zero consequence.
With an automatic detection the probability of the event can be described as anormal distribution with an expected value of 0,486 and a standard deviation of0,0367 (Johansson, 1999). With no automatic detection the only way the firecan be extinguished is by it self. The probability of this can be described with anormal distribution with an expected value of 0,308 and a standard deviation of0,0339 (Johansson, 1999).
5.1.4 Automatic escape alarmThe escape alarm is started automatically after fire detection. If there is noautomatic fire detection than there is no escape alarm either. The mean value ofthe probability of automatic escape alarm is 0,85 (Boverket, 1997). Atriangular distribution between 0,8 and 0,9 with a mean value of 0,85 is used asinput to the calculations.
When the automatic escape alarm is working as planned the time to reaction,treaction, will be faster than if no escape alarm sounds. According to anAustralian fire code reform (FCR, 1998) the reaction times are also dependenton the actual threat that the fire generates. The fire code reform (FCR, 1998)states that the main evacuation will not start until there is some kind of threatfrom the fire.
With escape alarm the reaction times for the shop of fire origin are assumed asfollows. When the place of fire start is in the electronic shop or in theprovisions-dealer shop the reaction times are assumed to vary between 15 and60 and a triangular distribution with a median value of 30 seconds is used asinput to the calculations. When the place of fire origin is in the smallbedclothes shop the reaction times are assumed to vary between 10 and 30 anda triangular distribution with a median value of 20 seconds is used as input tothe calculations.

2000-05-01 26(41)
With escape alarm the reaction time in the walkway is assumed to varybetween 60 and 120 seconds. A triangular distribution with a median value of90 seconds is used as input to the calculations.
Without escape alarm the reaction times for all areas are decided as 1/3 of thetime to critical conditions in respective area.
In the event tree, the escape alarm do not influence the choice of evacuationexit directly. Instead the number of people choosing the main entrances aredescribed as distributions.
5.1.5 Correct behavior of personnelWhen the personnel behaves as planned they guide the customers in the shopof fire origin to the closest exits. An incorrect behavior will therefore increasethe evacuation time. The probability of correct behavior is assumed to varybetween 0,5 and 0,7. A uniform distribution of the probability between thesevalues is used as input to the calculations.
A correct behavior of the personnel in the room of fire origin results in anoptimal evacuation strategy from the room. This means that equally manypeople evacuate through each exit of the room. When the personnel do not actcorrectly the visitors choose the exits themselves and the main exit willprobably be a frequently chosen exit. When there are more than two (2)evacuation exits from the shop an incorrect behavior of the personnel areassumed to generate that 50% of the customers choose the main entranceotherwise for evacuating. When there are less than two (2) evacuation exits75% of the customers are assumed to choose the main entrance. When thepersonnel behaves incorrect in the same scenario as an evacuation exit isblocked the number of people evacuating through the main entrance willincrease further more, see section 5.2.3.
5.1.6 All escape routes availableEscape routes can be blocked by the fire, by inventory or because the door islocked. In this analyses only the event of fire blocking the door will beconsidered. When an escape route is blocked the number of people escapingthrough the narrowest exit will increase and therefor also the evacuation timewill increase.
The probability of fire blocking an escape route can be decided by dividing theprobable area of the fire with the total floor area of the shop divided with thenumber of escape routes from the shop i.e.
exitfloor
fireblocked NA
AP
/=

2000-05-01 27(41)
If the fire is assumed to occupy an area of a circle with a uniform distributionof a radius between 2,5 to 4,5 meters this gives the following medium values:
• Electronic shop: 0,16• Provisions-dealer shop: 0,13• Bedclothes shop: 0,26
When all evacuation exits are available the number of people evacuatingthrough each exit is calculated as the total number of people in the storedivided by the number of evacuation exits.
When one of the evacuation exits are blocked the number of people evacuatingthrough the other exits increase. The new number of people evacuating throughan exit is calculated as the total number of people in the store divided by thenumber of exits minus one. That is the number of people normally evacuatingthrough the blocked exit is distributed uniformly between the reminding exits.
If an evacuation exit is blocked and the personnel behaves incorrect thenumber of people choosing the main entrance is calculated as 50% of thepeople plus the reminding 50% of the people divided by the number ofevacuation exits i.e.
( )
−+⋅=
exit
peoplepeople N
NNN
5,015,0
This means that the number of people is increased with 100% of thoseoriginally assumed to evacuate through the blocked exit.
5.2 Calculation of consequence
5.2.1 Detection timeWith automatic detection the detection time is decided using the followinganalytical expression:
34,031,0det 8,21 Ht ection ⋅⋅= −α
This analytical expression is based on a regression analysis done according tosection 5.1.2. Time to manual detection is 10% longer than the respectiveautomatic detection time, see section 5.1.2.
5.2.2 Reaction timeThe reaction times are dependent on the activation of the escape alarm and aredecided according to section 5.1.4.
5.2.3 Travel timeThe travel time is calculated both for the evacuation from the fire room and forthe evacuation from the affected walkway. The travel time is depending on thenumber of people evacuating through a certain exit. The travel time iscalculated with the following analytical expression.
WF
Nt
stravel ⋅
=
2000-05-01 28(41)
Where N is the number of people, Fs is the flow through the opening and W isthe width of the exit. This expression calculates the time for a group of peopleto pass a door opening. Usually the parameter Fs has a value of between 1,0and 1,5 people/second. Using available literature and calculations with thecomputer program SIMULEX, this parameter is decided to 1,3 people/second.
The exit width is decided by the exit that is assumed to be the last exit to beevacuated through, i.e. the critical exit. From the store of fire origin the criticalexit is assumed to be equal to the narrowest exit from the store. From thewalkway the critical exit is assumed to be equal to the escalators in the atria.The narrowest exit from the shops is assumed to be 1,2 meters and theescalators in the atria are assumed to be 1,2 meters respectively resulting in atotal width of 2.4 meters.
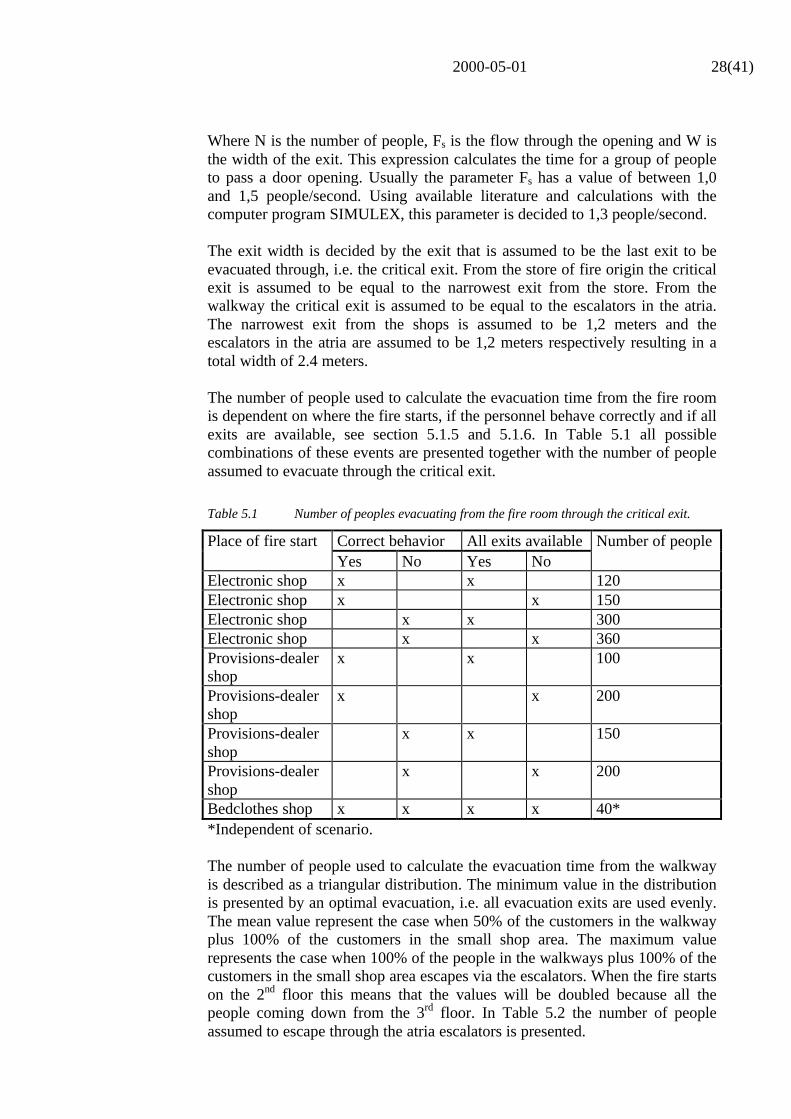
The number of people used to calculate the evacuation time from the fire roomis dependent on where the fire starts, if the personnel behave correctly and if allexits are available, see section 5.1.5 and 5.1.6. In Table 5.1 all possiblecombinations of these events are presented together with the number of peopleassumed to evacuate through the critical exit.
Table 5.1 Number of peoples evacuating from the fire room through the critical exit.
Correct behavior All exits availablePlace of fire startYes No Yes No
Number of people
Electronic shop x x 120Electronic shop x x 150Electronic shop x x 300Electronic shop x x 360Provisions-dealershop
x x 100
Provisions-dealershop
x x 200
Provisions-dealershop
x x 150
Provisions-dealershop
x x 200
Bedclothes shop x x x x 40**Independent of scenario.
The number of people used to calculate the evacuation time from the walkwayis described as a triangular distribution. The minimum value in the distributionis presented by an optimal evacuation, i.e. all evacuation exits are used evenly.The mean value represent the case when 50% of the customers in the walkwayplus 100% of the customers in the small shop area. The maximum valuerepresents the case when 100% of the people in the walkways plus 100% of thecustomers in the small shop area escapes via the escalators. When the fire startson the 2nd floor this means that the values will be doubled because all thepeople coming down from the 3rd floor. In Table 5.2 the number of peopleassumed to escape through the atria escalators is presented.

2000-05-01 29(41)
Table 5.2 Input to a triangular distribution representing the number of peopleevacuating through the atria escalators.
Number of peoplePlace of fire startMin Mean Max
Electronic shop, 3rd floor 650 1200 2000Provisions-dealer shop, 3rd floor 650 1200 2000Bedclothes shop, 2nd floor 1300 2400 4000
5.2.4 Time to critical conditionsTime to critical conditions is decided both for the room of fire origin and forthe walkway outside this room. A regression analysis of each roomconfiguration is done with FAST (Peacock et.al., 1998), the roomconfigurations and other assumptions used in this analysis are described inAppendix C. This results in three different analytical expressions for the fireroom and another three for the walkway. These are as follows:1. Electronic shop: 28,0
, 148 −⋅= αroomcritt ; 17,0, 543 α⋅=corridorcritt
2. Provisions-dealer shop: 26,0, 97 −⋅= αroomcritt ; 17,0
, 342 α⋅=corridorcritt
3. Bedclothes shop: 21,0, 48 −⋅= αroomcritt ; 18,0
, 343 α⋅=corridorcritt
Time to critical conditions is depending on the rate of fire growth. This isdifferent for each place of fire start. A log normal distribution is used todescribe the variance in fire growth rate. The input to respective distribution ispresented in Table 5.3 below.
Table 5.3 Input to log normal distribution of rate of fire growth.
Place of fire start Mean value[kW/m2s]
Variance [%] Standard deviation[kW/m2s]
Electronic shop 0,047 20 0,0094Provisions-dealershop
0,012 30 0,0036
Bedclothes shop 0,19 10 0,019
5.3 ResultsRisk profiles for the 10th, 50th and 90th percentile could be derived by thefollowing the procedure outlined by Frantzich (1998). These risk profiles arebased upon a statistical analysis of the 1000 iterations of probabilities andconsequences in one simulation. The risk profiles are shown in Figure 5.1.

2000-05-01 30(41)
0
0.05
0.1
0.15
0.2
0.25
0 500 1000 1500 2000
x, Number of people exposed to critical conditions
Pro
babi
lity
of X
>x,
giv
en fi
re
Figure 5.1 Risk profiles representing the 10th, 50th and 90th percentile.
From Figure 5.1 it is possible to withdraw information on the level ofindividual risk in the building. The individual risk (50th percentile) that one ormore individuals are exposed to critical conditions is 0.18 given fire. Thevalues for the 10th and the 90th percentiles are 0.13 and 0.22 respectively.Furthermore it is possible to express the risk by using the average riskmeasures. The average risk is represented by a distribution, illustrated in Figure5.2.
0
0.02
0.04
0.06
0.08
0.1
0.12
0.14
0 20 40 60 80 100 120 140 160
Average number of people exposed to critical conditions
Pro
babi
lity,
giv
en fi
re
Figure 5.2 The distribution of the average risk measure

2000-05-01 31(41)
6 Quantitative risk analysis of the performance based designalternativeThe analysis is done in the same way for this alternative as for the prescriptivealternative. Only the differences between the alternatives will be presented inthis chapter.
6.1 Description of event treeFollowing events are considered in risk analysis of the performance-basedalternative and not in the prescriptive alternative:• Reversed direction of escalators• Sprinkler system
In the following chapters assumptions regarding probabilities, times andconsequences will be described for each of these events. Events alsoconsidered in the prescriptive alternative are described in section 5.1.
6.1.1 Reversed direction of escalatorsIn this design alternative the automatic detection is connected with a signal tothe up going escalators reversing their direction and the personnel are trained tostop the up going escalators if their direction are not reversed. This willincrease the width of the exit used in the evacuation time calculations. Theprobability for this event is assumed to be 1,0 if the detection system worksand 0,0 if it does not work. This event is therefore not presented in the eventtree.
6.1.2 Sprinkler systemThe sprinkler system activates automatically at the time of automatic detection.Without automatic detection the sprinkler system do not activate. Aftersprinkler activation the rate of heat release is assumed to be constant. Themaximum rate of heat release is therefore equal to the rate of heat release at thetime of automatic detection.
The probability of sprinkler activation is assumed to have a mean value of 0,95and to vary between 0,92 and 0,96. A triangular distribution with these inputvalues is used in the calculations.
6.2 Calculation of consequences
6.2.1 Detection timeSee section 5.2.1.
6.2.2 Reaction timeSee section 5.2.2

2000-05-01 32(41)
6.2.3 Travel timeBecause this alternative design contains less number of evacuation exits thenumber of people evacuating through the remaining exits will rise and thetravel time will increase. It is though assumed that this does not affect theevacuation exits inside the shops but only the exits from the walkway. Thenumber of people evacuating from the fire room is therefore the same as in theprescriptive alternative while the number of people evacuating through the atriaescalators will rise.
As in the prescriptive alternative the number of people evacuating through theescalators is described as a triangular distribution. The minimum value in thedistribution is calculated in the same way as before i.e. the total number ofpeople divided by the total number of exits. Compared to the prescriptivealternative the mean value is increased with a factor representing the number ofpeople that with the original assumptions should have evacuated through thereduced number of exits. The maximum value is increased with 100 people perreduced number of evacuation exits compared to the maximum value in theprescriptive alternative. These assumptions give the number of peopleevacuating through the escalators presented in Table 6.1.
Table 6.1 Input to a triangular distribution representing the number of peopleevacuating through the atria escalators
Number of peoplePlace of fire startMin Mean Max
Electronic shop,3rd floor
800 1360 2300
Provisions-dealershop, 3rd floor
1040 1720 2600
Bedclothes shop,2nd floor
1486 2080 2900
The width of the evacuation exit from the walkway is changed in thosescenarios where the direction of the escalator is reversed/stopped. Eachescalator having a width of 1,2 meters gives a total exit width of 4,8 meters.
6.2.4 Time to critical conditionsAs for the prescriptive alternative the time to critical conditions when thesprinklers activate is decided with analytical expression created from aregression analysis with FAST (Peacock et.al., 1998), see Appendix C. Thedifference between the regression analysis compared to the one describedearlier is that the heat release rate is maximized by the sprinkler systemactivation. When the sprinkler system activates the rate of heat release stopsgrowing and is then assumed to be constant throughout the fire. The regressionanalysis showed that no critical conditions were obtained in the walkway whenthe sprinkler activated as planned.

2000-05-01 33(41)
The analytical expressions for the sprinkled fire are as follows.1. Electronic shop: 11,0
, 689 −⋅= αroomcritt
2. Provisions-dealer shop: 14,0, 252 −⋅= αroomcritt
3. Bedclothes-shop: 18,0, 64 −⋅= αroomcritt
In those scenarios were the sprinkler system do not activate the expressions isthe same as presented in section 5.2.4.
6.3 ResultsRisk profiles for the 10th, 50th and 90th percentile are derived from thesimulation output and shown in Figure 6.1.
0
0.02
0.04
0.06
0.08
0.1
0 1000 2000 3000 4000 5000
x, Number of people exposed to critical conditions
Pro
babi
lity
of X
>x,
giv
en fi
re
Figure 6.1 Risk profiles for the 10th, 50th and 90th percentile.
The individual risk is assessed to 0.09 (50th percentile). Corresponding valuesfor the 10th and 90th percentiles are 0.07 and 0,10. The distribution of theaverage risk is shown in Figure 6.2.
0
0.02
0.04
0.06
0.08
0.1
0.12
0.14
0 10 20 30 40 50 60 70 80
The average number of people exposed to critical conditions
Pro
babi
lity,
giv
en fi
re
Figure 6.2 Distribution of the average risk measure
2000-05-01 34(41)
7 Life cycle cost analysis
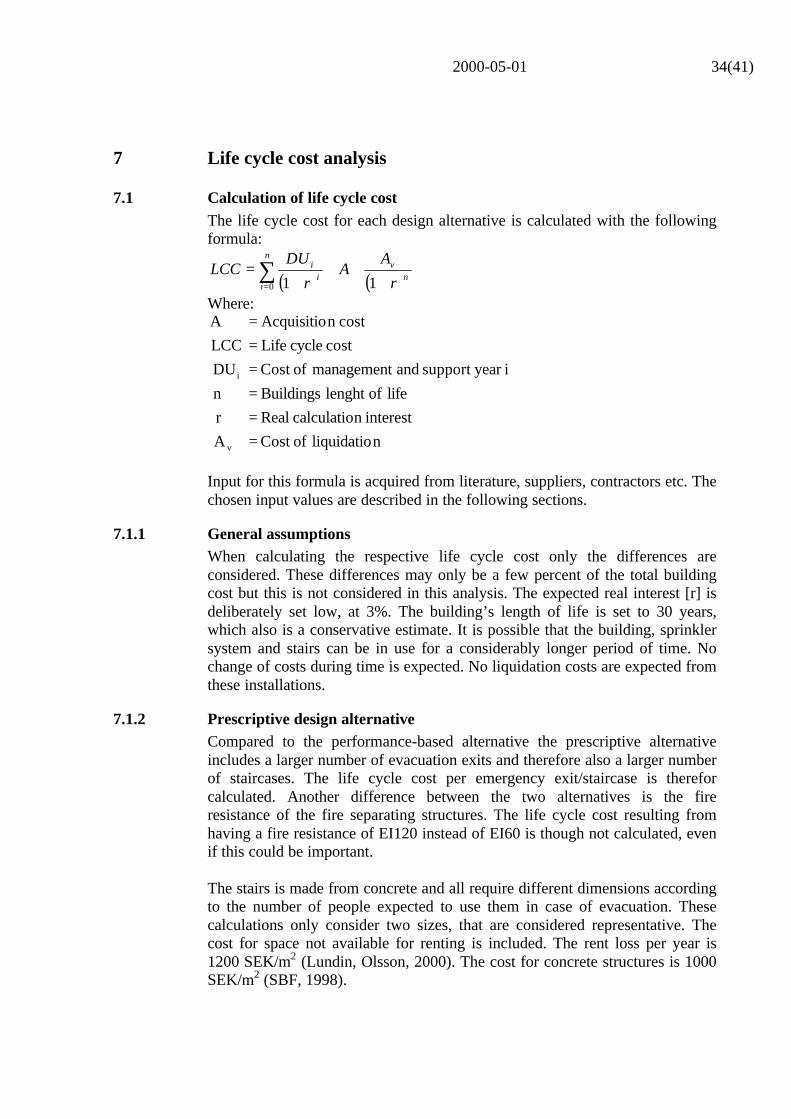
7.1 Calculation of life cycle costThe life cycle cost for each design alternative is calculated with the followingformula:
( ) ( )nv
n
ii
i
r
AA
r
DULCC
+++
+= ∑
= 110
Where:
nliquidatio ofCost A
interestn calculatio Real r
life oflenght Buildings n
iyear support and management ofCost DU
cost cycle Life LCC
costn AcquisitioA
v
i
======
Input for this formula is acquired from literature, suppliers, contractors etc. Thechosen input values are described in the following sections.
7.1.1 General assumptionsWhen calculating the respective life cycle cost only the differences areconsidered. These differences may only be a few percent of the total buildingcost but this is not considered in this analysis. The expected real interest [r] isdeliberately set low, at 3%. The building’s length of life is set to 30 years,which also is a conservative estimate. It is possible that the building, sprinklersystem and stairs can be in use for a considerably longer period of time. Nochange of costs during time is expected. No liquidation costs are expected fromthese installations.
7.1.2 Prescriptive design alternativeCompared to the performance-based alternative the prescriptive alternativeincludes a larger number of evacuation exits and therefore also a larger numberof staircases. The life cycle cost per emergency exit/staircase is thereforcalculated. Another difference between the two alternatives is the fireresistance of the fire separating structures. The life cycle cost resulting fromhaving a fire resistance of EI120 instead of EI60 is though not calculated, evenif this could be important.
The stairs is made from concrete and all require different dimensions accordingto the number of people expected to use them in case of evacuation. Thesecalculations only consider two sizes, that are considered representative. Thecost for space not available for renting is included. The rent loss per year is1200 SEK/m2 (Lundin, Olsson, 2000). The cost for concrete structures is 1000SEK/m2 (SBF, 1998).

2000-05-01 35(41)
Cost for size 1 (T1, T3, T13-15 and T24-29)Required width is 1,2 m. The area is 24 m2. Doors 16 800 SEK, walls 168 000SEK, and stairs 64 646 SEK. A maintenance cost is expected in the end ofevery 5-year period, 5000 SEK/5years and an extra 10000 SEK/10years. Thisresults in a total cost of 780 000 SEK/stair.
Cost for size 2 (T2, T4-12, and T16-23)Required width is 2,85 m. The area is 48 m2. The costs dominating installationof emergency stairs are acquisition and rent loss. Doors 33 600 SEK, walls240 000 SEK and staircases 153 535 SEK. A maintenance cost of 8000SEK/5years and an extra 12 000/10 years. Which results in a total cost ofapproximately 1 470 000 SEK/staircase.
7.2 Performance based design alternativeThe performance-based alternative requires installation of sprinkler systems inthe 1st and 2nd floor. The life cycle cost of this system is calculated here. Thelife cycle cost for the automatic reversing of escalators is assumed to benegligent compared to the cost for the sprinkler system. The life cycle cost forthis installation is therefore assumed to be zero.
The total cost for sprinklers for an area of 42 400 m2 (2 floors) is calculated toapproximately 7 300 000 SEK. This includes an installation cost of 150SEK/m2, pump station 250 000 SEK and water container cost lays between 250000 SEK and 500 000 SEK depending on water flow to the container.(SpraysAB, 2000). The estimated cost used here is 375 000 SEK. A yearly cost of 20000 SEK for testing and maintenance is also included. A condition for the lowinstallation cost per square meter is that there are no constructions that requirespecial solutions. A conclusion that can be drawn from the calculations is thatwhen installing a sprinkler system the figure of the real interest is not verysignificant since the dominating cost is in acquisition.
7.3 ResultCompared to the performance-based alternative the prescriptive alternativeincludes nine (9) emergency staircases more. Eight (8) of these staircases are ofsize 2 according to section 7.1.2 and one (1) of size 1. These extra staircasesare equivalent to a life cycle cost of 12 540 000 SEK.
The life cycle cost for the sprinkler system is calculated 7 300 000 SEK. Thedifferences in life cycle cost between the two alternatives is then 5 240 000SEK.

2000-05-01 36(41)
8 Evaluation of design alternatives
8.1 Risk to lifeThe risk to life is evaluated by the use of three different risk measures. Theserisk measures are
• Individual risk• Average risk• Societal risk
Using the information that represents the 90th percentile of the result, whereapplicable performs the comparison. Using this information tells us that it willonly get worse in 1 of 10 cases. Since fire is a rather rare occasion, thisapproach could be accepted.
8.1.1 Comparison of individual riskThe individual risk expresses the probability that one or more people areexposed to critical conditions. Results from section 5.3 and 6.3 are repeated inTable 8.1 below.
Table 8.1 Individual risk for the both design alternatives
Alternative Individual risk (90th percentile)Prescriptive design alternative 0.22Performance-based design alternative 0.10
The individual risk is reduced by 55 % when comparing the performance-basedalternative towards the prescriptive. This result fulfils the acceptance criteria insection 4.5.
8.1.2 Comparison of average riskThe distributions for average risk are given in Figure 8.1 below.
0
0.02
0.04
0.06
0.08
0.1
0.12
0.14
0 20 40 60 80 100 120 140 160
Average number of people exposed to critical conditions
Pro
babi
lity,
giv
en fi
re
Figure 8.1 Comparison of average risk. The black line represents the performance-basedalternative and the gray line the prescriptive.

2000-05-01 37(41)
One could clearly tell that the performance-based alternative provides a muchsafer building in case of fire, compared to the prescriptive alternative. Themean value of the average risk is 45 and 75 people exposed to criticalconditions for the performance-based and the prescriptive alternative,respectively. The average risk for the performance-based alternative does alsohave a much less deviation, which gives us a more reliable result. Theprobability that the average risk of the performance based alternative is lowerthan the prescriptive is 0.92.
8.1.3 Comparison of societal riskThe societal risk i.e the risk profiles of the design alternatives is compared inFigure 8.2 below.
0
0,05
0,1
0,15
0,2
0,25
0 1000 2000 3000 4000 5000 6000
x, Number of people exposed to critical conditions
Pro
babi
lity
of X
>x,
giv
en fi
re
Figure 8.2 Comparison of societal risk. The black line represents the prescriptivealternative and the gray the performance-based.
The societal risk for the performance-based alternative is lower than theprescriptive alternative, until the consequence reaches app. 1800 people. Themaximum consequence is larger for the performance-based alternative, whichis illustrated by the tail reaching to app. 5100 people exposed to criticalconditions.
By strict means this is enough to reject the performance-based solution. But, itis necessary to discuss the information given in Figure 8.2 from another pointof view. When risk is evaluated the most common way is to compare theprobability for a given consequence. The performance-based alternative is thebest choice for a consequence of 1, 10, 100 and 1000 people exposed to criticalconditions. Does it really matter there is a larger probability of a consequencebetween 2000 and 4000 people. Considering the risk evaluation principle ofavoiding catastrophes which says that catastrophes should by all means beavoided, signals that there already is a large ongoing consequence. It is thereforrecommended that fire risk is evaluated by fixed values saying 1, 10, 100 and1000 people exposed to critical conditions. This statement is of coursenecessary to discuss in a broader forum.

2000-05-01 38(41)
8.1.4 ConclusionsWith the comparison of individual risk, average risk and societal risk it isconcluded that the performance-based alternative meets the acceptance criteriaestablished in section 4.5. It is stated that the risk is reduced by choosing theperformance-based alternative, despite the exceeding tails of the risk profilegiven in Figure 8.2.
The four fire safety objectives stated in section 4.3 are all met with theperformance-based alternative. The first objective to safeguard occupants hasbeen analyzed with quantitative methods in the study. The three otherobjectives are meet be following the recommendations given in the buildingregulations. The performance-based alternative does not mean any change instructural safety or surface linings.
8.2 Comparison of life cycle costAccording to section 7.3 the difference in life cycle cost between the twoalternatives is 5 240 000 SEK in favor for the performance-based alternative.A large contribute to this difference is the rent of the area used by the staircasesin the prescriptive alternative but not in the performance-based alternative. Therent is therefore an important uncertainty factor. When comparing the life cyclecosts one should also note that these are only extracts from the total life cyclecost for the building. If the difference is very small compared to the totalbuilding cost the difference may be of very little importance when making adecision.

2000-05-01 39(41)
9 DiscussionTraditional risk analyses use point estimates to present the risk. There aremainly two problems associated with this approach. First, it is highly desirablefor decision-makers to be aware of the full range of possible risks in order tomake balanced decisions. Second, point risk estimates frequently are veryconservative as a result of the accumulation of the effects of variousconservative assumptions made at intermediate steps in the analysis. Theconsideration and treatment of uncertainties in risk analysis adds considerablyto the credibility of the results. This is the main advantage of using extendedQRA in fire safety design.
When performing the QDR it is easy to notice that the building in hand is verycomplex from a fire safety point of view. The number of occupant exceeds10000 people and there are very large open areas. Despite these facts theSwedish building regulations do not require any other fire safety measure intheir general recommendations, i.e. deemed to satisfy solutions, than thoserequired for assembly building with a maximum number of one thousandpeople. There are no requirements on automatic fire extinguish systems likesprinkler and there are no requirement concerning a more extensive firecompartment division. Reviewing results from previous Swedish building firerisk analyses provides the same information. The recommendations are notsuitable for all kind of building. The more complex building the moreinappropriate are the regulations.
One way to deal with the problem of inappropriate building regulations is todefine probabilistic acceptance criteria. These criteria would state the society’sacceptance on individual as well as on societal risk. The authorities should alsodemand that the fire safety design in buildings where the consequence isassumed to be large should be based upon a fire risk analysis. In order for asolution to be accepted the risk must fulfil the acceptance criteria, no matterwhat the general recommendations of the building code says. It is of greatimportance that future research focuses on which situations where the firesafety design can be performed by the use of general recommendations. Thelimitations of the deemed to satisfy solutions must be made fully understood.

2000-05-01 40(41)
10 ReferencesBBR, Boverkets Byggregler BFS 1993:57 med ändringar BFS 1998:38,Boverket, Karlskrona, 1999 (in Swedish)
Boverket, Utvärdering av ändringar i byggregleringen: Brand. Rapport 1997:9,Boverket, Karlskrona, Sweden, 1997 (in Swedish).
BSI Draft for Development DD240: Fire safety engineering in buildings. Part1: Guide to the application of fire engineering principles. British StandardsInstitution, London, 1997.
CIB W14, A Conceptual Approach towards a Probability Based Design Guideon Structural Fire Safety, CIB W14 Workshop Report, 1983
CPQRA, Guidelines for Chemical Process Quantitative Risk Analysis. Centerfor Chemical Process Safety of American Institute of Chemical Engineers,New York, 1989.
Decision tools, Palisade Corporation, Newfield, 1997.
Evans D.D., Stroup D.W. Methods of Calculating the Response Time of Heatand Smoke Detectors Installed Below Large Unobstructed Ceilings. NBSIR85-3167, National Bureau of Standards, Gaithersburg, 1985
FCR, Fire Code Reform, Fire Safety in Shopping Centres, Final ResearchReport Project 6 Fire Code Research Program, 1998.
Frantzich, H., Uncertainty and Risk Analysis in Fire Safety Engineering.Report 1016, Department of Fire Safety Engineering, Lund university, Lund,1998.
IEC, International Electrotechnical Commission: International Standard60300-3-9, Dependability management – Part 3: Application guide – Section9: Risk analysis of technological systems, Geneva, 1995.
Johansson H. Osäkerheter i variabler vid riskanalyser och brandtekniskdimensionering, Report 3105, Department of Fire Safety Engineering, Lunduniversity, 1999 (in Swedish).
Lundin, J., Olsson, F, Kostnadseffektiv utformning av brandskydd, Rapport3110, Department of Fire Safety Engineering, Lund university, 2000.
MATLAB, version 5, The Math Work Inc., 1996
Olsson F., Frantzich, H., Riskbaserade ekvationer för brandtekniskdimensionering, Report 3107, Department of Fire Safety Engineering, Lunduniversity, 1999 (in Swedish).

2000-05-01 41(41)
Peacock R.D., Jones W.W., Forney G.G., Portier R.W., Reneke P.A.,Bukowski R.W., Klote J.H. An Update Guide for HAZARD I Version 1.2,NISTIR 5410, National Institute of Standards and Technology, Gaithersburg,1994.
RUS 120:4, Standard for automatic water-sprinkler-systems. The SwedishAssociation of Insurance Companies, Stockholm, 1993.
SBF, Brandskyddsguiden, Flik 4, Brandförsvarsföreningen Service AB,Stockholm, 1998 (in Swedish).
Sirenen, Offical Journal, Swedish Rescue Services Agency, No 5, Karlstad,1998 (in Swedish).

Department Type of document Name of document
Risk & Fire Report Lot99045Appendix A
1(5)
Author Date File
Lotta AnderssonFredrik K Olsson
2000-05-01 092 SF
Signature Checked Approved
To För info
3rd International Conference on Performance-basedCodes and Fire Safety Design Methods, Lund, Sweden,June 15th-17th, 2000
Appendix A – Drawings
In the following pages one will find sketches and drawings which explain thegeometry, construction and some fire safety measures of the building in design.

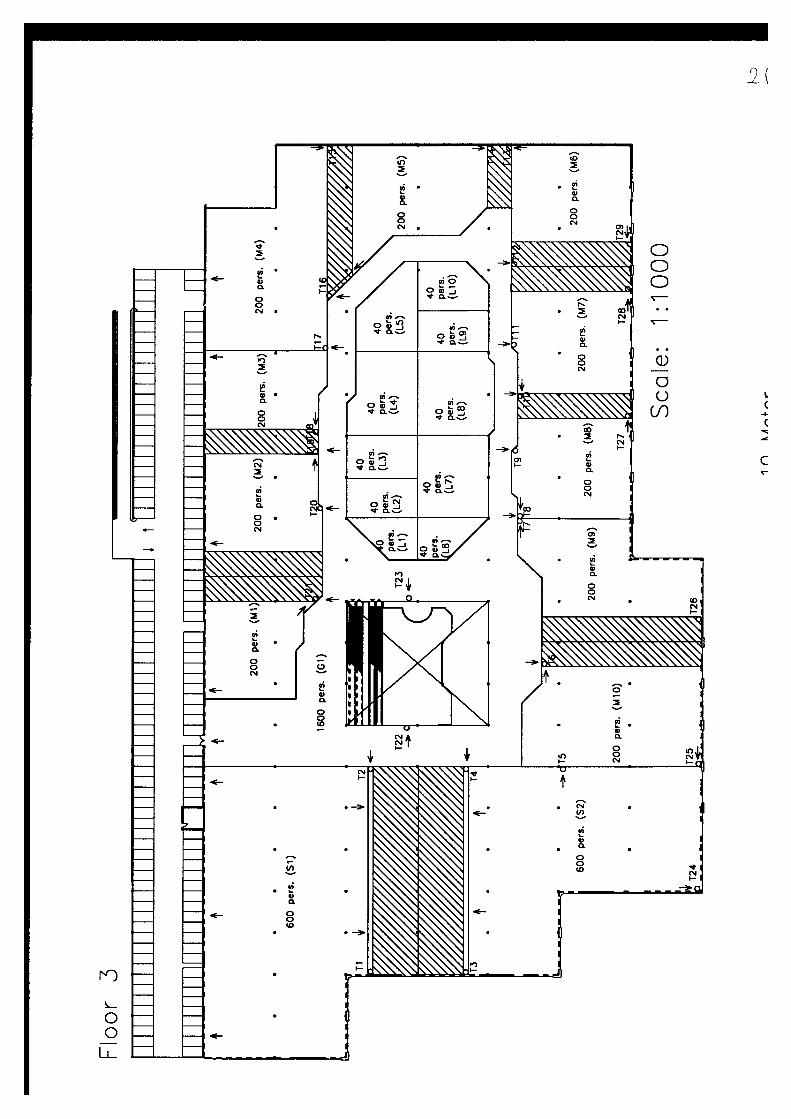
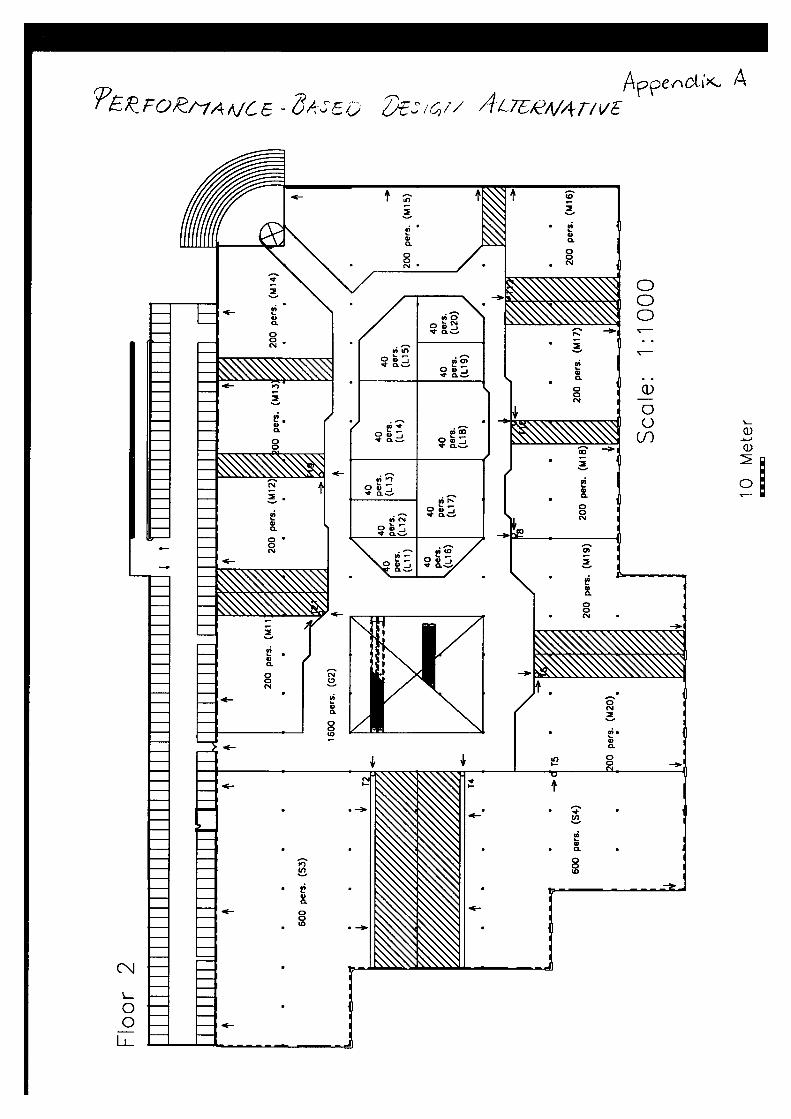
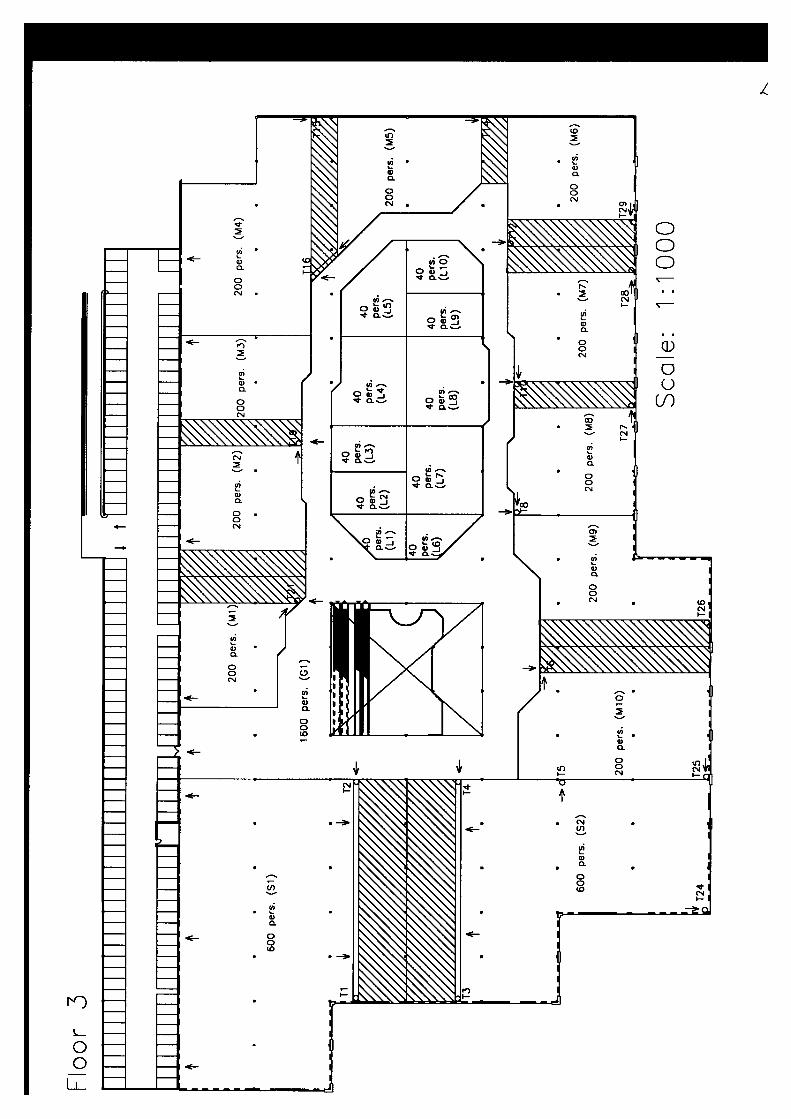
Department Type of document Name of document
Risk & Fire Report Lot99045Appendix B
1(3)
Author Date File
Lotta AnderssonFredrik K Olsson
2000-05-01 092 SF
Signature Checked Approved
To För info
3rd International Conference on Performance-basedCodes and Fire Safety Design Methods, Lund, Sweden,June 15th-17th, 2000
Appendix B – Event trees
This appendix contains event trees for the prescriptive and the performance-based design alternative. It is only the structure of the event trees that areshown. Please refer to the main report to fins details on probabilities, etc.

Prescriptive DesignAlternative
Fire is extinguished
Escape routes OK
Correct behaviour
Escape routes OK
Escape alarm
Escape routes OK
Correct behaviour
Escape routes OK
Automatic detection
Fire is extinguished
Escape routes OK
Correct behaviour
Escape routes OK
Place of fire startFire
1
3
yes
no
yes
no
yes
no
yes
no
yes
no
yes
no
yes
no
yes
no
yes
no
yes
no
yes
no
yes
no
yes
no
2The same event tree as "1"

Performance-baseddesign alternative
Fire is extinguished
Escape routes OK
Correct behaviour
Escape routes OK
Escape alarm
Escape routes OK
Correct behaviour
Escape routes OK
Sprinkler
Escape routes OK
Correct behaviour
Escape routes OK
Escape alarm
Escape routes OK
Correct behaviour
Escape routes OK
Automatic detection
Fire is extinguished
Escape routes OK
Correct behaviour
Escape routes OK
Place of fire startFire
1
2
3
yes
no
yes
no
yes
no
yes
no
yes
no
yes
no
yes
no
yes
no
yes
no
yes
no
yes
no
yes
no
yes
no
yes
no
yes
no
yes
no
yes
no
yes
no
yes
no
yes
no
yes
no
The same event tree as "1"

Department Type of document Name of document
Risk & Fire Report Lot99045Appendix C
1(2)
Author Date File
Lotta AnderssonFredrik K Olsson
2000-05-01 092 SF
Signature Checked Approved
To För info
3rd International Conference on Performance-basedCodes and Fire Safety Design Methods, Lund, Sweden,June 15th-17th, 2000
Appendix C – Regression Analysis of FAST
An analytical expression for calculating available time for evacuation or timeto critical conditions is decided making a regression analysis of with FASTcalculated times. Time to critical conditions can then be described with thefollowing generic expression:
4321
CCCcrit HeightAreaCt α=
In this case an analytical expression is decided for each room configurationwhy the only parameter changed in the analysis is the α-value.
65
Ccrit Ct α=
Were C5 and C6 will be the results from the regression analysis.
The definition of critical conditions used in the regression analysis is a smokelayer height of 1,6 meters + 0,1. room height.
The α-values 0,1, 0,2, 0,3, 0,4, 0,5, 0,6, 0,7 were used in the analysis. Themaximum heat release with the prescriptive design solution is decided by theventilation control. The maximum heat release with the performance-basedalternative is decided as the heat release at the time of automatic detection.After detection the heat release is supposed to be constant throughout the firescenario.
Assumed room configurations for each place of fire start will be describedbelow.
Electronic-shopThe walkway outside the electronic shop is defined as a room with a depth of10 meters and a width of 45 meters. The atria outside the shop is defined as aroom connected to the walkway with a 20*4 meter large opening. The area ofthe atria room is 40*20 meters. The height of the atria is 8 meters.

Lotta AnderssonFredrik K Olsson
2000-05-01 2(2)
Provisions-dealer shopThe walkway is defined as a room with a depth of 40 meters and a width of 3,3meters. The room of fire origin is connected to the walkway with an openingwith a width of 1,2 meters and height of 2,0 meters. An opening with a widthof 2 meters and height of 4 meters is connecting the walkway to the rest of theshopping centre.
Bedclothes shopThe walkway outside the shop is defined as a room with a depth of 40 metersand a width of 3,3 meters. The room of fire origin is connected to the walkwaywith an opening with a width of 1,2 meters and height of 2,0 meters. Anopening with a width of 2 meters and height of 4 meters is connecting thewalkway to the rest of the shopping centre.