Embed Size (px)
Citation preview
Journal of Asian Concrete Federation
Vol. 2, No. 2, Dec. 2016, pp. 95-101
ISSN 2465-7964 / eISSN 2465-7972
http://dx.doi.org/10.18702/acf.2016.12.2.2.95
Fire resistance calculation of existing concrete structures using
modified Tabulated Data Method
Duinkherjav Yagaanbuyant
*and Khishgee Radnaabazar
(Received: March 21, 2016; Accepted: October 24, 2016; Published online: December 31, 2016)
Abstract: During its service operation, a gradual reduction of the material strength and the load bearing ca-
pacity of a concrete structure is expected and the same is also true for its fire resistance capacity. Although it
is needed to estimate the remaining service life of the structure considering this reduction of fire resisting
capacity for the design for the building renovation or expansion, the proper calculation guidance or the
methodology still doesn’t exist in Mongolian national building code. This paper discusses the assessment of
the actual fire resistance capacity of the existing pre-cast concrete industrial/residential buildings that were
built during 1962-1999 in Ulaanbaatar, Mongolia. Modifications to the Tabulated data method are offered
based on the findings of the study. The estimated values of the actual fire resistance limit of PC walls and
slabs are proposed in tables and graphical forms that can be used in the calculation of the actual fire re-
sistance of the existing buildings in use to determine renovation requirements.
Keywords: pre-cast concrete, reinforcement, fire severity, inspection, Tabulated data method.
1. Background
During its service life of a concrete structure, a
gradual deterioration of structural performance in-
cluding a reduction of its fire resistance perfor-
mance is expected. When the deterioration is signif-
icant, the fire resistance capacity assessment of an
existing structure becomes one of the requirements
for further renovation and expansion. Roitman has
studied the fire resistance of existing buildings in
terms of effects of the reinforcement corrosion and
the damages to concrete, but the service life of the
structure has not been considered [1]. In this paper,
the operational condition and the service life of
structures are taken into account in the assessment
of the fire resistance capacity of concrete structures
for their further occupation.
In general the deterioration of the industrial
buildings can be often of major concern. But from
recent studies by the authors for the residential
buildings, even though their operational conditions
are not as severely reduced as those of the industrial
buildings, the accumulated deterioration in the
structures through years can have significant ad-
verse effects on its fire resistance capacity and
therefore should be included in the design of the
building expansion and/or the renovation. In recent
years such consideration of structural deterioration
reducing its fire resisting capacity has become even
more important due to the increased demand of
building expansion through addition of stories and
re-planning in urban areas in Ulaanbaatar. As the
currently used Mongolian national building code
doesn’t include a proper guideline to estimate this,
the authors offer a modification to currently used
Tabulated data method of the fire resistance based
on the actual service condition and the service life
of the existing concrete structures.
2. Fire resistance assessment methods
The fire resistance of reinforced concrete struc-
tures can be assessed experimentally through fire
tests of the actual structures or analytically by engi-
neering calculations [1~3]. A brief summary is giv-
en below.
2.1 Experimental Method
The results of the fire tests on the actual struc-
tures are most reliable and accurate for the assess-
ment of the fire resistance capacity. Usually the fire
tests are carried out using a fire chamber equipped
with the load testing machine and the furnace. Cal-
culation tables or tabulated data as developed from
Corresponding author Duinkherjav Yagaanbuyant is a Profes-
sor of the School of Civil Engineering and Architecture, The
Mongolian University of Science and Technology, Ulaanbaatar,
Mongolia.
Khishgee Radnaabazar is an Associate Professor of the School
of Civil Engineering and Architecture, The Mongolian Universi-
ty of Science and Technology, Ulaanbaatar, Mongolia.
95

the multiple test data to be used for the structural
assessment based on the structure’s geometry, ma-
terial type, and loading and boundary conditions.
The disadvantages of the fire test are time, cost,
energy consumption, and a need of special facility
and specialists which make the analytical methods
more favorable. The fire tests better be pursued for
selective structural elements or assemblages, a new
type of material or design of structural elements.
2.2 Analytical Methods
The analytical method of the fire resistance ca-
pacity determination of a structure can be carried
out in two steps: thermal analysis and static analysis.
The thermal analysis determines the developed
temperature field across the cross section of the
structure and the static analysis determines the load
bearing capacity of the structure under loading tak-
ing into account the effects of the changes of the
material properties due to elevated temperatures. In
general, the fire resistance capacity estimation is
carried out by incremental iteration method from
the initial ignition of the fire through thermal and
static analysis steps. In Fig. 1, the strength reduc-
tion over time is shown as an example of static
analysis result. The fire resistance limit , is con-
sidered as the time period of the ultimate load bear-
ing capacity reduction of the structure to its critical
state . In Fig. 2, a typical thermo-mechanical
scheme of a RC structure during fire exposure is
shown.
In BS EN 1992-2, three fire resistance
assessment methods are suggested: (1)Tabulated
data method, (2) Simplified calculation method, and
(3) Advanced methods. It is also specified that the
Tabulated data method can be used as an appendix
to the national standards.
In Russian and Mongolian practice, the
experimental method and above mentioned three
analytical methods are both used for assessment of
Fig. 1 – Typical scheme for the assessment of fire
resistance by strength reduction criterion at elevated
temperature [2]
Fig. 2 – Typical thermo-technical scheme:
1-fire, 2-concrete, 3-reinforcement, d-member
width, a-concrete cover depth, -critical temp.,
-fire temp., -temp. profile [2]
the structural fire resistance and, for this purpose,
the guidelines and procedures of ref. [7~9] are
followed. Currently, in Mongolia, the most
frequently used method for the fire design of a new
building is the Tabulated data method. But it cannot
be used for the design for the building expansion,
addition of stories in an existing building, re-
planning of the existing building. In the Tabulated
data method, the resistance limit of reinforced
concrete slabs and walls is given based on element
thickness and concrete cover depth of reinforcement,
but in the case of an existing building in use, actual
values of concrete cover and thickness could be
reduced due to defects in concrete cover and
reinforcement corrosion. Therefore certain
modifications are required in the use of the
tabulated method for the actual fire resistance
estimation of the existing buildings in use.
The Simplified calculation method is based on
applying the strength reduction factors at elevated
temperatures to simplified cross-sections for which
the thermal gradient through the structural member
is known or, alternatively, by utilizing a reduced
cross-section whereby a damaged zone is ignored in
the calculation and only the residual undamaged
part is included in the calculation of the resistance
[13]. The relevant parameters for the Simplified
calculation method are taken from the information
supplied on the material properties of the structural
component.
Generally the Advanced method includes the
numerical models for heat transfer from the fire into
the structural member and the mechanical response
models to determine the structural response of the
member or members to the effects of both
mechanical and thermal actions. General guidance
is available in the European Standard on the use of
the Advanced calculation models for the design of
concrete structures. Unlike the Tabulated data
96
Journal of Asian Concrete Federation, Vol. 2, No. 2, Dec. 2016

Table 1 – Fire resistance limit of reinforced concrete slabs [7]
Concrete type and slab characteristics Slab thickness t and concrete cover depth
of rebar a, mm
Fire resistance limit, min
15 30 60 90 120 150 180
Normal
Slab thickness t 30 50 80 100 120 140 155 One way or two way,
ly/lx≥1.5 a 10 15 25 35 45 60 70
Two way,ly/lx<1.5 a 10 10 10 15 20 30 40
NOTE: Normal weight concrete (2,000-2,600 kg/m3)
Table 2 – Fire resistance limit of load bearing walls [7]
Concrete type
Wall thickness tc and concrete cover depth of rebar a, mm
Fire resistance limit, min
30 60 90 120 150 180
Normal tc
a 100 10
120 15
140 20
160 30
200 30
240 30
method, the Advanced method is suitable for any
type of fire exposure. However, knowledge on the
degradation of the material properties for the
particular fire exposure condition is required.
2.3 Tabulated Data Method
From the guidelines of ref. [7,8], the fire re-
sistance of reinforced concrete slabs and walls
based on concrete type, element thickness, and con-
crete cover depth of reinforcement are shown in
Table 1 and Table 2. It must be noted that, in the
Tabulated data method, the resistance limit of rein-
forced concrete slabs and walls is given based on
element thickness and concrete cover depth of rein-
forcement, but in the field, other effects such as de-
fects in concrete cover, reinforcement corrosion,
and concrete strength actually play important roles
too [1,10].
3. Actual fire resistance of existing PC res-
idential buildings
From the tabulated data, the design limit of fire
resistance can be determined. But for the exist-
ing building in use, the actual fire resistance of the
structure is lower than this design value due to
the deteriorated state of the structures. The actual
fire resistance of the structure can be determined
by Eq. (1), where С1 is the reduction factor of the
service life and С2 is the reduction factor of the ac-
tual service conditions [1].
= С1 С2, (1)
The reduction factor С2 that accounts the service
conditions can be expanded further as С2,1;С2,2;...С2n
taking into account specific characteristics of the
condition such as concrete strength, corrosion,
Fig. 3 – Fire resistance limit of reinforced concrete
walls of pre-cast residential buildings based on ser-
vice condition and service life
Fig. 4 – Fire resistance limit of reinforced concrete
slabs of pre-cast residential buildings based on ser-
vice condition and service life (ly/lx ≥ 1.5)
Fig. 5 – Fire resistance limit of reinforced concrete
slabs of pre-cast residential buildings based on ser-
vice condition and service life (ly/lx< 1.5)
97
Journal of Asian Concrete Federation, Vol. 2, No. 2, Dec. 2016

Table 3 – Fire resistance limit of reinforced concrete walls based on service condition and service life
Thickness tc and concrete
cover depth of rebar a, mm Fire resistance limit, hrs
0.5 1 1.5 2 2.5 3
tc, mm 100 120 140 160 200 240
a, mm 10 15 20 30 30 30
Ser
vic
e li
fe,
yea
rs
10 0.49 0.99 1.48 1.98 2.47 2.97
15 0.49 0.98 1.46 1.95 2.44 2.93
20 0.48 0.96 1.44 1.92 2.40 2.88
25 0.47 0.94 1.41 1.88 2.35 2.82
30 0.46 0.92 1.38 1.84 2.30 2.76
35 0.45 0.89 1.34 1.79 2.24 2.68
40 0.43 0.87 1.30 1.73 2.17 2.60
45 0.42 0.84 1.25 1.67 2.09 2.51
50 0.40 0.80 1.20 1.61 2.01 2.41
Table 4 – Fire resistance limit of reinforced concrete slabs based on service condition and service life
(boundary condition, ly/lx ≥ 1.5)
Thickness tc and concrete cov-
er depth of rebar a, mm
Fire resistance limit, hrs
0.25 0.5 1 1.5 2 2.5 3
tc, mm 30 50 80 100 120 140 155
a, mm 10 15 25 35 45 60 70
Ser
vic
e li
fe,
yea
rs
10 0.25 0.49 0.98 1.47 1.97 2.46 2.95
15 0.24 0.48 0.96 1.44 1.92 2.40 2.88
20 0.23 0.47 0.93 1.40 1.87 2.34 2.80
25 0.23 0.45 0.90 1.35 1.80 2.25 2.70
30 0.22 0.43 0.86 1.29 1.72 2.15 2.58
35 0.20 0.41 0.81 1.22 1.63 2.04 2.44
40 0.19 0.38 0.76 1.14 1.52 1.90 2.28
45 0.18 0.35 0.70 1.05 1.40 1.75 2.10
50 0.16 0.32 0.64 0.95 1.27 1.59 1.91
Table 5 – Fire resistance limit of reinforced concrete slabs based on service condition and service life
(boundary condition, ly/lx < 1.5)
Thickness tc and concrete cov-
er depth of rebar a, mm
Fire resistance limit, hrs
0.25 0.5 1 1.5 2 2.5 3
tc, mm 30 50 80 100 120 140 155
a, mm 10 10 10 15 20 30 40
Ser
vic
e li
fe,
yea
rs
10 0.25 0.49 0.98 1.47 1.97 2.46 2.95
15 0.24 0.48 0.96 1.44 1.92 2.40 2.88
20 0.23 0.47 0.93 1.40 1.87 2.34 2.80
25 0.23 0.45 0.90 1.35 1.80 2.25 2.70
30 0.22 0.43 0.86 1.29 1.72 2.15 2.58
35 0.20 0.41 0.81 1.22 1.63 2.04 2.44
40 0.19 0.38 0.76 1.14 1.52 1.90 2.28
45 0.18 0.35 0.70 1.05 1.40 1.75 2.10
50 0.16 0.32 0.64 0.95 1.27 1.59 1.91
98
Journal of Asian Concrete Federation, Vol. 2, No. 2, Dec. 2016

freeze-thaw action etc. as shown in Eq. (2). In this
study, the concrete strength and the rebar corrosion
reduction factors are taken in the example calcula-
tion.
= ∙С1∙С2,1∙ С2,2∙ ..∙С2n (2)
To determine the reduction factor of the ser-
vice life С1, the damage state of structures should be
determined first through a detailed inspection of
each structure in terms of important characteristics
of structure for its technical serviceability such as
section dimension, strength, and cracking etc.
A total of 1,077 pre-cast concrete buildings
had been built in 1962-1999 in ten districts of
Ulaanbaatar. Buildings have 5 to 12 stories with the
structural pre-cast reinforced concrete wall and slab
panel system without framing. The inspections of
more than 60 buildings from these pre-cast concrete
buildings in 2001-2015 to assess the structural state
of the buildings have been carried out by the au-
thors. The structural deterioration in these buildings
was mainly caused by damaged concrete cover, re-
inforcement corrosion, and multiple freeze-thaw
action resulting in the reduced fire resistance. In
this paper, test results of 30 buildings located in 10th
Micro-district of Ulaanbaatar have been used. From
the study, it is observed that external walls, base-
ment floor slabs and walls, and roof slabs are more
damaged than the other structural elements due to
the reinforcement corrosions. These damage condi-
tions not only deteriorate the load bearing capacity
of the structures but also the fire resistance.
The damages of each structural element are reg-
istered and a damage degree is determined as a
ratio of the number of the damaged element to the
total number of elements in each structural type.
From the data, the correlation between the damage
degree and the service life of the structure t is
observed and the following relations are established
through regression equations:
External wall
(3)
Internal wall
ω = 0.0829 + 0.0019t+0.00001t2 (4)
Roof slab
(5)
Floor slab
(6)
Based on Eq. (4), Eq. (6), and Table 1 and Table 2,
the actual reduction of fire resistance of PC slabs and
walls can be determined. Results are shown in Figs. 3
through 5 and Tables 3 through 5.
4. Examples of calculation
4.1 Calculation of fire resistance of reinforced
concrete slab of 5-story residential building
Data: Basement floor reinforcement concrete slab,
5-story residential building located in the 15th
ho-
roolol, Ulaanbaatar. Slab dimension l = 5.4 m; b =
3.6 m; h = 0.12 m. Number of tensile rebars – 18
Class Вр-I, ds= 5 mm. Concrete class B15, concrete
cover depth from the rebar centroid δ = 0.02 m, ly/lx
= 5.4 / 3.6 =1.5
4-1-a Geometric characteristics required for the cal-
culation
By load bearing reduction “R”: а = δ + 0.5ds =
0.02 + 0.0025 = 0.0225 m
By insulation capacity “I”: h = 0.12 m
4-1-b Design fire resistance value for floor slab, 5
story pre-cast panel reinforced concrete building
By load bearing reduction “R”, Table 1: if a =
0.015 m then ( ) = 0.5 hr; if a = 0.025 m
then ( ) = 1.0 hr; а = 0.0225 then ( ) =
0.875 hr = 52.5 min
By insulation capacity “I”, Table 8 [7]: h =
0.12 m, (I)= 2 hr = 120 min
4-1-c Actual fire resistance based on service condi-
tion and life
Service life = 34 years
By load bearing reduction “R”, Table 3 or Fig
2: if a = 0.015 m then (R) = 0.41 hr; if a =
0.025 m then (R) = 0.91 hr; if а = 0.0225 m
then = 0.785 hr = 47.1 min
Actual fire resistance based on service condi-
tion and life: = 47.1∙0.92∙0.91 = 39.4 min
It is calculated that the actual fire resistance of
the floor slab is reduced by 25 percent based on the
service condition and service life.
4.2 Calculation of fire resistance of reinforced
concrete wall of 5-story residential building
Data: Reinforcement concrete partition wall, l = 5.4
m; b = 2.8 m; h = 0.14 m. Number of tensile rebars
– 18 Class A400, ds = 12 mm. Concrete class B15,
concrete cover depth δ = 0.015 m
4-2-a Wall shall be exposed to the fire from one
side. It is very rare for walls to experience fire from
both sides. If the wall is exposed to fire from both
sides then no deflection takes place and wall still be
working under compression [7].
4-2-b Design fire resistance limit of the wall is tak-
en from Table 2.
99
Journal of Asian Concrete Federation, Vol. 2, No. 2, Dec. 2016

4-2-c Calculation of geometric characteristics re-
quired for the calculation
By load bearing capacity reduction “R”: а = δ
+ 0.5ds = 0.015 + 0.006 = 0.021 m
By insulation capacity “I”: h = 0.14 m
4-2-d Calculation of fire resistance of reinforced
concrete partition wall, 5-story pre-cast reinforced
concrete panel building
By load bearing capacity reduction “R”: Table
2 fire resistance limit: if a = 0.02 m then =
1.5 hr; if a = 0.03 m then = 2.0 hr; if а =
0.021 m then = 1.55 hr = 93 min
By insulation capacity“I”: Table.2. if h = 0.14
m, then (I)= 1.5 hr = 90 min
4-2-e Calculation of the actual fire resistance of
reinforced concrete partition wall based on service
condition and service life
Service life = 34 years
By load bearing capacity reduction “R”: Table
4 [7] if a = 0.02 m then = 1.1 hr; if a =
0.03 m then = 1.5 hr; if а = 0.021 m then
= 1.14 hr = 68.4 min. Considering reduc-
tion of service condition (reduction of concrete
strength and rebar corrosion), = 68.4
∙0.92∙0.91 = 57.2 min
It is calculated that the actual fire resistance of
the partition wall is reduced by 38 percent from the
design value based on the service condition and
service life.
5. Conclusions
During renovation and expansion of the exist-
ing buildings in use, not only the structural load
bearing capacity, and stability requirements but also
fire resistance requirements should be considered
and satisfied to provide safe living condition to oc-
cupants. The Tabulated data method is the most
widely used method for practicing engineers today
but its application for the calculation of the fire re-
sistance of structures of the existing buildings needs
certain modification that accounts the deteriorated
state of the structures due to the actual service con-
ditions. From this study, up to 25 to 38 percent re-
duction in the fire resistance of structures depend-
ing on the actual service condition and the service
life is observed. Based on the findings of the field
study of 30 pre-cast concrete buildings, the empiri-
cal regression equations that establish relations be-
tween damage degree of structural members and
their service life are proposed. Based on these equa-
tions, the estimated values of the actual fire re-
sistance limit of PC walls and slabs are suggested in
tables and graphical forms that can be used in the
calculation of the actual fire resistance of structures
of the existing buildings in use for their further ren-
ovation. Example calculations are also included.
References
1. Roitman, В.М., (2001) Engineering solution
for the assessment of fire resistance in the de-
sign of new building and building renovation,
Fire Safety and Science Publishing. (in Rus-
sian)
2. Federor, V.S., Levitskii, V.E., Molchadskii,
I.S., and Aleksandrov, A.V., (2004) Fire Re-
sistance and Fire safety of structures, ASV
Publishing. (in Russian)
3. Lennon, T., Moore, D.B., Wang, Y.C., and
Bailey, C.G., (2006) Designers’ guide to
EN1991-1-2, 1992-1-2, 1993-1-2 and 1994-1-2,
Handbook for the fire design of steel, compo-
site and concrete structures to the Eurocodes,
Thomas Telford.
4. Beeby, A.W. and Narayanan, R.S., (2005) De-
signers’ Guide to Eurocode 2: Design of con-
crete structures, Thomas Telford.
5. BS EN 1991-1-2 (2002) Eurocode 1: Actions
on structures - Part 1-2: General actions, Ac-
tions on structures exposed to fire, British
Standards Institution.
6. BS EN 1992-1-2 (2004) Eurocode 2: Design of
concrete structures - Part 1-2: General rules,
Structures fire design, British Standards Insti-
tution.
7. Guideline for the calculation of fire resistance
limit of structures, fire distribution limit by
structures and material fire ratings, SNiPII-2-
80 (1988), TsNIISK imeni V.V. Kucherinko,
Stroiizdat Publishing. (in Russian)
8. Guideline for the calculation of fire resistance
and fire safety of reinforced concrete structure,
STO 36554501-006-2006 (2008). (in Russian)
9. Rules for fire safety assurance of reinforced
concrete structures, STO36554501-006-2006
(2006) FGUP, NITs, Stroitelistvo Publishing.
(in Russian)
10. Reports submitted to Ulaanbaatar city gover-
nor’s office: Inspection of Residential Build-
ings (2014) Mongolian Univ. of Science and
Technologies, Ulaanbaatar. (in Mongolian)
11. Recommendations for the inspection and as-
sessment of technical state of large panel pre-
100
Journal of Asian Concrete Federation, Vol. 2, No. 2, Dec. 2016

cast and masonry buildings (1988) TsNIISK
imeni V.V. Kucherinko. (in Russian)
12. Duinkherjav, Ya., (2016) The accumulation of
defects and damage of concrete structures of
existing pre-cast buildings, XIV Concrete
Structures Conference, Novosivirsk, Russia.
pp.18-22
13. Lennon, T., Rupasinghe, R., Canisius, G.,
Waleed, N., and Matthews S., (2007) Concrete
structures in fire, Performance, design and
analysis, Garston, Watford, Bre press.
101
Journal of Asian Concrete Federation, Vol. 2, No. 2, Dec. 2016

Journal of Asian Concrete Federation
Vol. 2, No. 2, Dec. 2016, pp. 102-109
ISSN 2465-7964 / eISSN 2465-7972
http://dx.doi.org/10.18702/acf.2016.12.2.2.102
Effectiveness of recycled nylon fibers as reinforcing material
in mortar
ORASUTTHIKUL Shanya*; UNNO Daiki; YOKOTA Hiroshi; and HASHIMOTO Katsufumi
(Received: July 21, 2016; Accepted: November 9, 2016; Published online: December 31, 2016)
Abstract: Disposing of waste fishing nets has been a major issue in the sea environment. Although the stor-
age of such nets has not caused a serious safety hazard to date, it is important to find suitable recycling solu-
tions. In this study, the authors investigate the utilization of recycled waste fishing nets in fiber-reinforced
mortar and compare the mechanical properties of such mortar made with recycled waste fishing nets to those
of mortar made with PVA (polyvinyl alcohol) short fibers. Two types of recycled nylon fiber were investi-
gated: straight fiber and fiber with a knot at each end. The straight recycled nylon fibers were obtained by
manually cutting waste fishing nets to the lengths of 20 mm, 30 mm, and 40 mm, and adding them to mortar
at the volume ratios of 1.0%, 1.5%, and 2.0%. The 40-mm-long knotted fibers were added to mortar at the
volume ratios of 0.5%, 0.75%, and 1.0%. The mechanical test results showed improvements in first-crack
strength, toughness, and ductility for mortar reinforced with recycled nylon fibers. The addition of recycled
nylon fibers improves first-crack strength more than that PVA fibers do. However, the compressive strength
decreases with increase in fiber fraction, and decreases with increase in fiber aspect ratio.
Keywords: recycled nylon fiber, waste fishing net, recycled materials, fiber reinforced mortar.
1. Introduction
In recent decades, the world has been suffering
from the dumping of wastes, especially plastics left
in seas and oceans. Waste fishing nets account for
some of these wastes: 640,000 tons of fishing nets
are disposed of in the ocean annually [1]. As the
nets become totally entangled, separating them for
disposal is impractical. These nets can be harmful
to marine life, such as turtles, seals, and other ma-
rine mammals, which can become entangled and
suffer injury or drowning [2]. In addition, the ma-
rine food web could be disrupted. As abandoned
nets and plastic garbage tend to gather at or near the
surface of seas and oceans, they keep sunlight from
reaching small creatures such as planktons and al-
gae. Therefore, the animals that feed on these small
creatures are also directly affected
Most fishing nets are made of nylon and are
non-biodegradable. Even though their storage is not
hazardous, it is very important to find suitable ways
of recycling these nets. Spadea et al. [3] investigated
the use of waste fishing nets as recycled nylon fiber
for reinforced cement mortar. They found that add-
ing the fibers to mortar significantly improves me-
chanical properties, such as increased first-crack
strength (i.e., the modulus of rupture, MOR),
toughness, and ductility. Two decades later, many
researchers are studying the use of fiber reinforced
mortar (FRM) as a way of achieving higher MOR,
fracture toughness, impact resistance, and of con-
trolling shrinkage. The use of synthetic fibers such
as polyvinyl alcohol (PVA) and polypropylene was
found to be successful in significantly improving
the mechanical properties of the base material [4-7].
In recent years, many researchers have become in-
terested in using recycled materials [8-15]. Not only
are they interested in improving the mechanical
properties, but they are also concerned with achiev-
ing favorable environmental outcomes and realizing
economical products. Additionally, durability under
alkaline conditions is very important for the fibers,
if they are to enhance mortar composites. There is
some evidence in the literature that recycled nylon
fibers have excellent alkali resistance [3]. However,
a test by Ochi et al. [16] found that the tensile
strength of PVA fibers decreases by 44% from al-
kali exposure.
This study aims to investigate the effectiveness
of recycled nylon (R-nylon) fibers retrieved from
Corresponding author Shanya ORASUTTHIKUL is a Ph.D.
candidate at Hokkaido University, Hokkaido, Japan.
Daiki UNNO is a Master Student at Hokkaido University, Hok-
kaido, Japan.
Hiroshi YOKOTA is a Professor at Hokkaido University, Hok-
kaido, Japan.
Katsufumi HASHIMOTO is a Lecturer of Kyoto University,
Kyoto, Japan.
102

(a) Waste fishing net (b) Straight R-nylon fibers
(c) Knotted R-nylon fibers (d) PVA fibers
Fig. 1 – Types of fibers
Table 1 – Mechanical properties of fibers
Fiber
type
Diameter
(μm)
Tensile
strength
(MPa)
Young’s
modulus
(GPa)
Density
(g/cm3)
R-nylon
fiber 350 440 3.0 1.13
PVA 200 975 27 1.30
waste fishing nets to improve certain mechanical
properties of mortar. The authors address the prepa-
ration of R-nylon FRM and the identification of its
mechanical properties (e.g., compressive strength,
MOR, toughness, and residual strength) in compari-
son to those of PVA FRM. The effects of using dif-
ferent fiber volume ratios and lengths are analyzed.
2. Outline of Experimental Test
The waste fishing nets used in this study were
collected by fishermen in Hokkaido, Japan. The
fibers were manually cut in three different lengths
of 20 mm, 30 mm, and 40 mm, and were mixed in
mortar at several different volume fractions.
The volume fractions of the knotted R-nylon
fibers (1.0%, 1.5% and 2.0%) were lower than
those of the straight fibers (0.5%, 0.75%, and 1.0%),
because knotted R-nylon fibers tend to form tena-
cious clumps. The PVA fibers were included in the
mix at 1.0 vol.% and 1.5 vol.%. In the case of the
recycled nylon fiber, the authors carried out uniaxi-
al tensile tests according to ASTM C1557-03 stand-
ard [17] in order to determine the tensile strength
and Young’s modulus. The fiber types and the me-
chanical properties are given in Fig. 1 and Table 1,
respectively. Before the fibers were added, cement
and sand were mixed in a small mixer. Then, the
fibers were gently added to prevent the formation of
fiber balls, and all the dry components were mixed
by hand in order to obtain a uniform distribution of
fibers. Water was gradually added, and a mixing
machine was used at low speed for 2 minutes until a
homogeneous mixture was achieved. The mortar
was cast in prism molds of 40 mm 40 mm 160
mm for the bending test and in cylinders of 50 mm
diameter 100 mm in height for the compressive
strength test. The specimens were cured in water at
20˚C for 28 days and then tested. For the mortar
mixes, various combinations of fiber volume and
fiber aspect ratio were used as summarized in Table
2. The unreinforced mortar is notated as UR, and
the FRM specimens are notated as SRny (straight
recycled nylon fiber), KRny (knotted recycled ny-
lon fiber), and PVA (PVA fiber), followed by “fiber
length-volume fraction.”
3. Results and Discussions
3.1 Flowability
The flowability test was conducted in compli-
ance with ASTM C 1437 [18]. The flow diameters
were measured and are listed in Table 2. It can be
seen that flowability tends to decrease with increase
in fiber length and amount. A comparison of KRny
and SRny40 at 1.0 vol.%, shows that the FRMs
mixed with knotted fibers have greater flow diame-
ters, due to the balling of fibers, which leads to fi-
ber–mortar separation. Moreover, a comparison of
PVA and SRny30, which have similar aspect ratios,
shows fresh FRM containing PVA fibers to have a
smaller flow diameter than SRny30 FRMs has, at a
103
Journal of Asian Concrete Federation, Vol. 2, No. 2, Dec. 2016

Table 2 – Test results of fresh mortar properties
Specimen type
Fiber fraction by volume (%)
Fiber length, L (mm)
Diameter, D (mm)
Aspect ratio (L/D)
Flow diameter (mm)
UR - - - - 262
KRny-0.5 0.5 40 0.35 114 247
KRny-0.75 0.75 40 0.35 114 233
KRny-1.0 1.0 40 0.35 114 227
SRny20-1.0 1.0 20 0.35 57 231
SRny20-1.5 1.5 20 0.35 57 226
SRny20-2.0 2.0 20 0.35 57 207
SRny30-1.0 1.0 30 0.35 86 229
SRny30-1.5 1.5 30 0.35 86 216
SRny30-2.0 2.0 30 0.35 86 195
SRny40-1.0 1.0 40 0.35 114 217
SRny40-1.5 1.5 40 0.35 114 207
SRny40-2.0 2.0 40 0.35 114 183
PVA-1.0 1.0 18 0.2 90 213
PVA-1.5 1.5 18 0.2 90 169
given volume fraction, due to greater number
of fibers.
3.2 Compressive strength
The compressive strengths of the FRMs are
presented in Table 3. The compressive test was
conducted in compliance with ASTM C 39 [19].
Table 3 indicates that the addition of the R-nylon
fibers causes a reduction in compressive strength of
the examined mortars up to 48%. Moreover, it can
be clearly seen that the compressive strength de-
creases with decrease in fiber length, and decreases
with increase in R-nylon fiber amount. An explana-
tion is that nylon fibers have a much lower modulus
of elasticity than mortar has, and therefore, the in-
clusion of fibers creates voids in the mortar [20].
Also, the addition of fibers, especially long fibers,
leads to increases in the volume of the interfacial
transition zone (ITZ), which results in the reduction
of strength and stiffness of FRM [21]. This might
suggest that the lower compressive strength of the
KRny FRM is the result of a greater reduction in
the modulus of elasticity of the FRM from the in-
clusion of knots as shown in Table 3. When the
specimens are subjected to compressive load, lateral
tensile strain in the mortar occurs due to the Pois-
son’s effect. As the load increases, the longer fibers
play a more important role in the mortar’s lateral
tensile strength than the shorter fibers play. These
longer fibers postpone crack enlargement by in-
creasing the mortar’s lateral tensile strength [13]. In
the case of the PVA fibers, the addition of fibers
results in a decrease in compressive strength of the
mortar, especially at greater amounts of addition.
An explanation is that the modulus of elasticity of
PVA fibers and mortar are almost the same, but the
fibers are much less dense. Therefore, the mortar
was filled with a high amount of fibers, which re-
sulted in reductions in the elastic modulus of the
mortar [22].
3.3 Flexural strength
After 28 days of curing, flexural strength tests
were conducted in accordance with ASTM C 293
[23]. The authors performed three-point bending
tests, and the peak load (Pcr), the first-crack strength
(i.e., MOR), and other results are listed in Table 3.
The results show that the addition of KR-nylon, SR-
nylon, and PVA fibers increases the MOR by up to
22%, 41%, and 22%, respectively. Spadea et al. [3]
and Orasutthikul et al. [24] proposed that using R-
nylon fibers from waste fishing nets is very effec-
tive at reinforcing mortar, with the MOR found to
be improved by up to 35% and 42% in the respec-
tive reports.
The first-crack strength can be calculated as
follows:
M = 3Pcrl/2bd2 (1)
where, M = modulus of rupture (MOR) or first-
crack strength; Pcr = maximum applied load;
104
Journal of Asian Concrete Federation, Vol. 2, No. 2, Dec. 2016

Table 3 – Test results of compressive and flexural strength at 28 days
Specimen
type
Compressive strength test Flexural strength test
No. of specimens
f’c
(MPa)
SD
CV %△f’c
No. of specimens
Pcr
(kN)
MOR
(MPa)
SD CV %△MOR
UR 3 65.67 1.53 2.33 - 2 1.71 4.81 0.06 3.44 -
KRny-0.5 3 56.61 6.86 12.12 -13.80 2 2.08 5.86 0.12 5.66 21.95
KRny-0.75 3 55.96 11.43 20.42 -14.79 2 1.79 5.04 0.06 3.28 4.86
KRny-1.0 3 36.77 5.97 16.24 -44.00 2 1.58 4.45 0.00 0.00 -7.35
SRny20-1.0 3 52.56 1.18 2.24 -19.96 2 2.17 6.09 0.12 5.45 26.84
SRny20-1.5 3 48.66 2.05 4.21 -25.89 2 2.42 6.80 0.24 9.72 41.44
SRny20-2.0 3 34.14 1.70 4.99 -48.01 2 1.58 4.81 0.06 3.43 -0.09
SRny30-1.0 3 53.61 0.57 1.05 -18.36 2 2.04 5.74 0.18 8.66 19.42
SRny30-1.5 3 46.84 1.02 2.19 -28.67 2 2.00 5.63 0.12 5.85 17.06
SRny30-2.0 3 35.06 3.32 9.47 -46.61 2 1.54 4.34 0.18 11.46 -9.75
SRny40-1.0 3 55.54 2.84 5.12 -15.43 2 2.13 5.98 0.18 8.32 24.38
SRny40-1.5 3 48.24 0.57 1.19 -26.54 2 2.29 6.44 0.06 2.47 34.04
SRny40-2.0 3 35.27 1.07 3.02 -46.28 2 1.83 5.16 0.12 6.44 7.32
PVA-1.0 3 61.70 0.52 0.85 -5.87 2 2.04 5.74 0.06 2.87 19.49
PVA-1.5 3 59.57 5.61 9.41 -6.81 2 2.08 5.86 0.12 5.67 21.95
Note: f’c - compressive strength, SD - standard deviation, CV - coefficient of variation, %△fc - percent differ-
ence in compressive strength between control specimens (UR) and FRMs, △R - percent difference in modu-
lus of rupture between control specimens (UR) and FRMs.
b = specimen width; d = specimen depth; and l =
span length.
From Fig. 2(a) to (e), it can be clearly seen that
R-nylon FRM shows a significant reduction in load
after the first crack. This is because the R-nylon
fibers used in this study have a smooth surface, so
the friction interlocking between the fiber surface
and the mortar is poor, which results in low fric-
tional resistance to slippage. When PVA FRMs
were subjected to external load, the PVA fibers
tended to rupture before the fiber and the matrix
debonded from each other. This caused abrupt re-
ductions in the post-peak load of PVA FRMs to
nearly the same or slightly lower than that of
SRny40 FRM with a 2.0% fiber fraction when mid-
span deflection was increasing. After the bending
test, the fiber surface was examined to analyze the
frictional resistance and interfacial bond between
the fiber and the matrix. The R-nylon surface seen
in Fig. 3(a) shows the fiber had no serious change
in scratching as a result of low frictional resistance
between the fiber and the matrix. For the PVA fiber,
due to the stronger bond between the fiber and the
matrix, some cement paste is seen on the fiber sur-
face as shown in Fig. 3(b).
3.4 Toughness and residual strength
Toughness is an important mechanical charac-
teristic of FRM. In accordance with ASTM C 1018
[25], toughness indices I5, I10, and I20 were ob-
tained by dividing the area under the load-
deflection curve up to 3.0, 5.5, and 10.5 times the
first-crack deflection, respectively, by the area un-
der the curve up to the first-crack deflection (see
Fig. 4). Table 4 summarizes the toughness indices
and residual strength factors of FRMs at 28 days.
The addition of the fibers to the mortar appears to
afford outstanding improvements in toughness, es-
pecially for higher fiber fractions and greater fiber
lengths (see Fig. 5). The toughness and residual
strength of FRMs are dependent on fiber character-
istics, such as geometric shape, tensile strength, and
modulus of elasticity, as well as on the bond
strength between the fiber and the surrounding mor-
tar. SRny30 fiber and PVA fiber have similar aspect
ratios, but SRny30 FRMs have lower toughness
indices and residual strength factors than PVA
FRMs have. However, the fracture toughnesses of
105
Journal of Asian Concrete Federation, Vol. 2, No. 2, Dec. 2016

0.0
0.5
1.0
1.5
2.0
2.5
0.0 0.5 1.0 1.5 2.0
0.50%
0.75%
1.00%
Lo
ad
(K
N)
Deflection (mm)
(a) Knotted R-nylon fiber
0.0
0.5
1.0
1.5
2.0
2.5
0.0 0.5 1.0 1.5 2.0
20mm
30mm
40mm
Lo
ad
(K
N)
Deflection (mm)
(b) Straight R-nylon fiber with 1.0% fiber fraction
0.0
0.5
1.0
1.5
2.0
2.5
3.0
0.0 0.5 1.0 1.5 2.0
20mm
30mm
40mm
Lo
ad
(K
N)
Deflection (mm)
(c) Straight R-nylon fiber with 1.5% fiber fraction
0.0
0.5
1.0
1.5
2.0
2.5
0.0 0.5 1.0 1.5 2.0
20mm
30mm
40mm
Lo
ad
(K
N)
Deflection (mm)
(d) Straight R-nylon fiber with 2.0% fiber fraction
0.0
0.5
1.0
1.5
2.0
2.5
0.0 0.5 1.0 1.5 2.0
PV18-1.0%
PV18-1.5%
Lo
ad
(K
N)
Deflection (mm)
(e) PVA fiber
Fig. 2 – Load-midspan deflection curves of fiber-
reinforced mortar specimens
(a) before & after
(b) before & after
Fig. 3 – Fiber surface before and after the flexural
test: (a) R-nylon fiber, (b) PVA18 fiber
the SRny40 FRMs with a 2.0% fiber fraction
(SRny40-2.0) fall between those of the PVA FRMs
with a 1.0% fiber fraction (PVA-1.0) and the PVA
FRMs with a 1.5% fiber fraction (PVA-1.5). In this
study, the fiber fractions of the KRny fiber are low,
and therefore the toughness and residual strength of
the FRMs are not effectively improved. The PVA
fibers generally have a stronger bond to the sur-
rounding cementitious matrix because it is hydro-
philic. Redon et al. [26] found that small-diameter
PVA fibers ruptured before achieving their full
pullout length. Therefore, when the PVA FRMs
were loaded, the PVA fibers broke from tension
rather than from pullout.
4. Conclusions
In this study, the effectiveness and potential of
using waste fishing nets as recycled nylon fiber to
106
Journal of Asian Concrete Federation, Vol. 2, No. 2, Dec. 2016

Table 4 – Toughness indices and residual strength factors at 28 days
Specimen
type
Toughness indices Residual strength factors
I5 I10 I20 R5,10 R10,20
KRny-0.5 1.61 1.82 2.42 4.20 6.02
KRny-0.75 1.56 2.20 4.00 12.80 18.01
KRny-1.0 1.91 3.27 6.21 27.20 29.43
SRny20-1.0 1.95 2.41 3.45 9.18 10.40
SRny20-1.5 2.40 3.38 5.23 19.60 18.50
SRny20-2.0 2.80 4.17 6.71 27.40 25.40
SRny30-1.0 1.97 2.91 4.79 18.80 18.80
SRny30-1.5 2.86 4.17 6.49 26.20 23.20
SRny30-2.0 3.05 4.23 7.29 23.60 30.61
SRny40-1.0 2.88 4.47 7.71 31.80 32.44
SRny40-1.5 2.49 4.25 7.80 35.18 35.50
SRny40-2.0 3.37 6.02 13.38 53.00 73.60
PVA-1.0 2.77 4.62 8.74 37.00 41.21
PVA-1.5 3.72 7.50 15.74 75.60 82.40
Fig. 4 – Toughness as defined by ASTM 1018
Fig. 5 – Toughness indices of FRMs
reinforce mortar were experimentally tested and
discussed. Compressive and three-point bending
tests were performed to investigate compressive
strength, peak load, modulus of rupture, toughness
indices, and residual strength factors. This study
found the effects of adding R-nylon fibers to mortar
to be as follows.
(1) The addition of R-nylon short fibers recycled
from waste fishing nets to mortar improves the
mechanical properties of the mortar, except for
compressive strength, which decreases as a re-
sult of that addition.
(2) The addition of R-nylon fibers, whether straight
or knotted, results in a reduction in mortar work-
ability. Mortar flowability tends to decrease with
increase in the fiber fraction. Mixes that incor-
porate longer fibers demonstrate smaller flow
diameters than those with shorter fibers.
(3) The addition of R-nylon fibers to mortar affords
a more ductile mode of failure than the addition
of plain mortar affords. Post-cracking ductility is
enhanced, which results in an increase in the
load carrying capacity of FRM in bending. The
post-peak loads are observed to be higher with
higher fiber fractions and longer fibers.
(4) Mechanical analyses show that the addition of
fibers leads to reductions in compressive
strength of 14-44% for KR-nylon fiber and 20-
48% for SR-nylon fiber. The MOR increased by
up to 22% for KRny FRM and by up to 41% for
SRny FRM.
(5) The addition of PVA fibers to mortar causes a
greater reduction in flow diameter than the addi-
tion of R-nylon fibers at a similar fiber aspect ra-
tio and the same fiber fraction.
(6) Post-peak load, toughness indices, and residual
strength factors differ significantly according to
fiber characteristics such as geometric shape,
tensile strength, and modulus of elasticity, as
well as according to the bond between the fiber
and the cementitious matrix. As evidenced by
107
Journal of Asian Concrete Federation, Vol. 2, No. 2, Dec. 2016

the flexural test, R-nylon fiber shows a signifi-
cantly lower post-peak load than PVA fiber af-
fords, due to the smooth surface of R-nylon fi-
ber. Despite the stronger chemical bond between
the PVA fiber and the matrix, the PVA fibers
tended to rupture instead of pulling out. This
caused the post-peak load of the PVA FRM to
dramatically drop after the peak, due to breaking
of the fiber. However, R-nylon fiber shows
greater MOR improvement than PVA fiber af-
fords.
(7) For every type of fiber, its addition to the mortar
results in a decrease in compressive strength, es-
pecially the addition of fibers with a low modu-
lus of elasticity, such as R-nylon fiber.
It must be noted, however, that the R-nylon
FRMs analyzed in this study have been proven ben-
eficial in terms of mechanical properties as PVA
fiber, even if a higher amount of fibers may be re-
quired to match the performance. Moreover, the use
of waste fishing nets as recycled nylon fibers results
in an environmental benefit.
Acknowledgements
This study was supported by JSPS KAKENHI
Grant #26630208.
References
1. Sea Around Us. http://www.seaaroundus.org
(accessed Apr. 4, 2016)
2. One Green Planet.
http://www.onegreenplanet.org (accessed May
30, 2016)
3. Spadea, S., Farina, I., Carrafiello, A., and Fra-
ternali, F. (2015) “Recycled nylon fibers as
cement mortar reinforcement,” Construction
and Building Material, 80, pp. 200-209.
4. Wang, Y., Li, V. C., and Backer, S., (1990)
“Tensile properties of synthetic fiber rein-
forced mortar,” Cement and Concrete Compo-
sites, 12(1), pp. 29-40.
5. Song, P. S., Hwang, S., and Sheu, B. C., (2005)
“Strength properties of nylon and polypropyl-
ene-fiber-reinforced concretes,” Cement and
Concrete Research, 35(8), pp. 1546-1550.
6. Kwon, M. H., Jung, W. Y., and Seo, H. S.,
(2014) “The flexural strength of fiber rein-
forced polymer cement mortars using UM res-
in,” International Journal of Civil, Environ-
mental, Structural, Construction and Architec-
tural Engineering, 8(2), pp. 127-130.
7. Khan, U. S. and Ayub, T., (2016) “Modelling
of the pre and post-cracking response of the
PVA fibre reinforced concrete subjected to di-
rect tension,” Construction and Building Mate-
rials, 120, pp. 540-557.
8. Wang, Y., Wu, H. C., and Li, V. C., (2000)
“Concrete reinforcement with recycled fibers,”
Journal of Materials in Civil Engineering,
12(4), pp. 314-319.
9. Silva, D. A., Betioli, A. M., Gleize, P. J. P.,
Roman, H. R., Gomez, L. A., and Ribeiro, J. L.
D., (2005) “Degradation of recycled PET fi-
bers in Portland cement-based materials,” Ce-
ment and Concrete Research, 35(8), pp. 1741-
1746.
10. Foti, D., (2011) “Preliminary analysis of con-
crete reinforced with waste bottles PET fi-
bers,” Construction and Building Material, 25,
pp. 1906-1915.
11. Pereira de Oliveira, L. A. and Castro-Gomes,
J. P., (2011) “Physical and mechanical behav-
ior of recycled PET fibre reinforced mortar,”
Construction and Building Materials, 25, pp.
1712-1717.
12. Fraternali, F., Farina, I., Polzone, C.; Pagliuca,
E., and Feo, L,. (2013) “On the use of R-PET
strips for reinforcement of cement mortars,”
Composites B. 46, pp. 207-210.
13. Ozger, O. B., Girardi, F., Giannuzzi, G. M.,
Salomoni, V. A., Majorana, C. E., Fambri, L.,
Baldassino, N., and Maggio, R. D., (2013) “Ef-
fect of nylon fibers on mechanical and thermal
properties of hardened concrete for energy
storage systems,” Materials and Design, 51,
pp. 989-997.
14. Pesic, N., Zivanovic, S., Garcia, R., and Pa-
pastergiou, P., (2016) “Mechanical properties
of concrete reinforced with recycled HDPE
plastic fibres,” Construction and Building Ma-
terials, 115, pp. 362-370.
15. Yin, W., Tuladhar, R., Riella, J., Chung, D.,
Collister, T., and Combe, M., (2016) “Com-
parative evaluation of virgin and recycled pol-
ypropylene fibre reinforced concrete,” Con-
struction and Building Materials, 114, pp. 134-
141.
16. Ochi, T., Okubo, S., and Fukui, K., (2007)
“Development of recycled PET fiber and its
application as concrete-reinforcing fiber,” Ce-
ment and Concrete Composites, 29, pp. 448-
455.
17. ASTM C 1557-03. “Standard test method for
tensile strength and Young’s modulus of fi-
bers,” ASTM International, PA.
18. ASTM C 1437. “Standard test method for
flow of hydraulic cement mortar,” ASTM In-
ternational, PA.
19. ASTM C 39. “Standard test method for com-
pressive strength of cylindrical concrete spec-
imens,” ASTM International, PA.
20. Karahan, O. and Atis, C. D., (2011) “The du-
rability properties of polypropylene fiber rein-
108
Journal of Asian Concrete Federation, Vol. 2, No. 2, Dec. 2016
forced fly ash concrete,” Materials and Design,
32(2), pp. 1044-1049.
21. Palmquist, S. M., Kintzel, E., and Andrew, K.,
(2011) “Scanning electron microscopy to ex-
amine concrete with carbon nanofibers,” 5th
Pan American Conference for NDT, Cancun,
Mexico.
22. Hu, W., Yang, X., Zhou, J., Xing, H., and
Xiang, J., (2013) “Experimental research on
the mechanical properties of PVA fiber rein-
forced concrete,” Research Journal of Applied
Science, Engineering and Technology, 5(18),
pp. 4563-4567.
23. ASTM C 293. “Standard test method for flex-
ural strength of concrete (Using simple beam
with center point loading),” ASTM Interna-
tional, PA.
24. Orasutthikul, S., Yokota, H., Hashimoto, K.,
and Unno, D., (2016) “Effectiveness of recy-
cled nylon fibers as a mortar strengthening ma-
terial,” International Symposium on Concrete
and Structures for Next Generation: Ikeda &
Otsuki Symposium (IOS2016), Tokyo, Japan.
25. ASTM C 1018. “Standard test method for
flexural toughness and first-crack strength of
fiber reinforced concrete,” ASTM Internation-
al, PA.
26. Redon, C. and Li, V. C., (2001) “Measuring
and modifying interface properties of PVA fi-
bers in ECC matrix,” Journal of Materials in
Civil Engineering, ASCE, 13(6), pp. 399-406.
109
Journal of Asian Concrete Federation, Vol. 2, No. 2, Dec. 2016

Journal of Asian Concrete Federation
Vol. 2, No. 2, Dec. 2016, pp. 110-116
ISSN 2465-7964 / eISSN 2465-7972
http://dx.doi.org/10.18702/acf.2016.12.2.2.110
Relative evaluation of performance of limestone calcined clay
cement compared with Portland pozzolana cement
Ashok Kumar Tiwari* and Subrato Chowdhury
(Received: August 4, 2016; Accepted: November 6, 2016; Published online: December 31, 2016)
Abstract: Cement is most widely used binder to produce concrete and the most common construction mate-
rial today. Though concrete is a material with the lowest greenhouse emission, cement has the highest. With
the carbon footprint of cement accounting for over 7% of total world emissions, it becomes single most im-
portant material of environmental concern around the world. This concern has led to a search for lower car-
bon emitting binders and use of blended cements, incorporating large number of natural and industrial by-
products. This paper describes the performance of a composite cement binder consisting of calcined clay,
limestone, and Portland cement clinker as compared to a traditionally used fly ash based Portland pozzolana
cement. This study reports behavior of the two cement binders with respect to strength development, hydra-
tion, porosity of hydrated pastes, normal consistency, and admixture response with ageing. This study finds
that, though the clay based cement attains higher early age strength, the later age strength in mortar is lower
as compared to commercial fly ash based cement. Further the clay based cement has higher water demand,
but lower porosity compared to composite cement binder.
Keywords: binder, calcined clay, limestone, microstructure, hydration, porosity, water demand.
1. Introduction
Concrete is most widely used construction ma-
terial in the world today with over 25 billion tons
placed every year [1]. It is made from graded ag-
gregate system, cemented together by a binder,
normally called Portland cement. Often this con-
crete also includes various industrial by-products,
which may have either pozzolanic or self-cementing
properties. Modern concrete also has superplasti-
cizers to make the concrete workable and pumpable
for various applications. In spite of various devel-
opments, cement remains the only binder in con-
crete. The cement is highly energy intensive to pro-
duce and is responsible for about 7% of greenhouse
emissions in the world today [2]. Even though car-
bon footprint of concrete is lowest among building
materials used in construction (see Fig. 1), the same
is highest due to sheer volume of concrete being
used today. Researchers in academia and industry
have been working on reducing the carbon foot-
prints of cement and have been successful in reduc-
ing the same by about 20% in last one decade as
reported in World Cement Sustainability Initiative
Report published in 2012.
Cement production has been progressively in-
creasing and currently over 4 billion tonnes of ce-
ment is being produced annually across the world.
Realising the problems of greenhouse gases, the
cement industry has undergone a lot of changes.
The changes are in process engineering as well as in
variety of cements being produced. Today, utiliza-
tion of blended cements is usually preferred due to
their economic and technical benefits and indirect
advantages such as lower level of CO2 emissions by
reducing clinker production in plants. While the
emerging family of cementitious materials has been
expanding to a larger number, namely fly ash, silica
fume, calcined clay, metakaolin etc., materials like
fly ash (FA) and ground granulated blast furnace
slag (GGBS) are being widely used for cement pro-
duction.
The primary objective of usage of wide range
of cementitious materials, both natural and artificial
is to reduce the CO2 footprint and progressively
increase usage of non-bio degradable industrial
waste. These major industrial wastes are fly ash and
GGBS. Other minor industrial waste could be used
as cementitious material. Introduction of calcined
clay pozzolana as cementitious material has been
Corresponding author Ashok Kumar Tiwari is Vice President
of Concrete & Building Materials, UltraTech Cement Limited,
India.
Subrato Chowdhury is Former Joint President, UltraTech
Cement Limited, Inida.
110

Fig. 1 – CO2 discharge in production process of
construction materials
reported long back elsewhere globally. In India, it
began in late 1970s only, when BIS standard for
calcined clay became available for manufacturing
of Portland pozzolana cement [5]. Many publica-
tions report that performance of mortar and con-
crete composed with calcined clay closely compares
with mortar/concrete made with fly ash and GGBS.
The calcined clay is the potentially rich cementi-
tious material and its usage would greatly contrib-
ute in reducing carbon foot print.
The objective of this study is to evaluate the
performance of limestone calcine clay cement
(LC3) and commercially available Portland pozzo-
lana cement (PPC) towards understanding the prod-
ucts in greater details. The blended cements have
been in use widely for more than two decades in
reducing the CO2 footprint in relation to conven-
tionally used ordinary Portland cements. Most of
the countries today produce and use blended cement,
either binary or ternary blended for various con-
struction applications [3-7]. Accordingly the speci-
fication of cement are becoming performance ori-
ented rather than current one of prescription orient-
ed [8]. In India, due to large availability of fly ash
and to some extent GGBS, over 75% of cement
used is blended cement. The trend is similar across
the world and even in ordinary Portland cements,
performance improvers or minor additional com-
pounds such as GGBS, limestone, and fly ash are
replacing clinkers to the extent of up to 5% [9].
With these efforts, clinker conversion factor, which
is a measure of how much cement is produced per
unit clinker, has gone to 1.6 from traditional level
of 1.03 reducing carbon footprints by over 50%.
In countries, where fly ash is not abundantly
available, construction industry has been using lime-
stone powder as clinker substitute. Limestone re-
placement into Portland cement has been widely
studied for several years [9-11]. Limestone not only
works as micro filler, but also takes part in hydra-
tion process of clinker, improving workability,
strength, and durability [12]. The limestone can also
be used in ternary blends in combination with fly
ash, calcined clay and other pozzolana.
This study compares the behavior of two
blended cements, one produced at small cement
production unit for this experimental study, the oth-
er one being commercially available fly ash based
Portland pozzolana cement. The tests were con-
ducted in accordance with Indian standards [13-
14].
2. Production of LC3 Cement
A limestone calcined clay cement (LC3) con-
sisting of limestone, calcined clay, and portland
cement clinker was used. Cement has 15% lime-
stone, 31% calcined clay, and about 50% portland
cement clinker with remainder being gypsum.
Properties of the raw materials are given in Table 1.
Limestone and calcined clay were ground separate-
ly and intermixed with ground clinker. A commer-
cially available Portland pozzolana cement (PPC),
made from fly ash conforming to Indian Standard
[5] were used for bench marking.
The clay was calcined in a rotary kiln at a tem-
perature of 900 degree Celsius for optimum calcina-
tion. A weight loss of 0.3% was observed and lime
reactivity of calcined clay was observed to be 7.8
MPa, which was significantly higher than the re-
quirements of pozzolanic materials and certainly
better than those of fly ash.
Table 1 – Oxide composition of raw materials
Element Clinker,
%
Lime-
stone,
%
Clay,
%
Gypsum,
%
SiO2 21.1 11.02 54.47 2.77
Fe2O3 4.32 1.55 4.93 0.36
Al2O3 4.65 2.53 27.29 0.62
CaO 65.16 44.24 0.06 32.62
MgO 2.13 1.96 0.13 1.20
SO3 0.77 0 0.01 38.75
Na2O 0.38 0.5 0.12 0.06
K2O 0.20 0.28 0.25 0.04
LOI 0.96 36.96 10.28 23.02
3. Materials and Test Methods
3.1 Cement
Cement, after proper sampling, was tested as
per Indian Standards [13-14] for the following
items:
fineness, by Blaine test apparatus;
full physical properties, including particle size
distribution and retentions on different sieve
111
Journal of Asian Concrete Federation, Vol. 2, No. 2, Dec. 2016

sizes like 90 micron (R90), 75 micron (R75),
and 45 micron(R45);
full chemical analysis including insoluble resi-
due (IR), sulphate (SO3), loss on ignition (LOI),
magnesium oxide (MgO), total & soluble alka-
lis;
hydration study using calorimeter (ICP) at w/c
of 0.4 at 24, 72, 144, and 672 hours; and hydration study of LC3 by scanning electron
microscopy (SEM).
3.2 Cement paste
Workability retention study using marsh cone
and mini-slump
At w/c of 0.5 % by wt. without admixture and
at 0.4 with admixture
Fluorescent microscopy on cement paste po-
rosity
Mercury intrusion porosimeter Quanta chrome
MIP with high pressure 60,000 psi system for
porosity of paste
3.3 Cement mortar
Cement mortar with standard stand, ratio 1:3
for compressive strength
Cement pastes were tested for admixture com-
patibility using a marsh cone and retention was
measured using a mini slump. The mini-slump test
which was originally developed by Kantro [15] and
later modified by Zhor & Bremner [16], measures
the consistency of cement paste and is commonly
used for evaluating admixture-cement response for
flow and retention across the world. The mini-
slump cone is a small version of the slump cone.
The mini-slump cone is placed in the centre of a
piece of plane rigid and non-absorbent surface /
table. The paste was prepared at a water-binder ra-
tio (w/b) of 0.55 and retention of flow was meas-
ured up to 120 minutes.
4. Results and Discussions
A limestone calcined clay cement (LC3) con-
sisting of limestone, calcined clay, and Portland
cement clinker was used. Limestone and calcined
clay were ground separately and intermixed with
cement. A commercially available Portland pozzo-
lana cement (PPC), fly ash based, conforming to
Indian Standards [5] was used for bench marking.
Properties of cements, tested as per relevant Indian
standards [13-14] are given in Tables 2 and 4.
4.1 Cement properties
The chemical composition of cements is given
in Table 2 whereas the physical properties of
Table 2 – Composition of cement
Cement LOI IR SO3
LC3 7.18 22.68 2.15
PPC 2.78 24.23 2.83
Table 3 – Particle size distribution of cements
Sample d10 %,
µm
d50 %,
µm
d90 %,
µm
Mean
size, µm
LC3 1.26 13.11 57.48 22.25
PPC 1.70 18.09 51.80 23.04
Table 4 – Physical properties of cements
Cement
Blaine
fineness,
m2/kg
Normal
consisten-
cy, %
Compressive strength in
mortar, MPa,
at the age of
1
day
3
days
7
days
28
days
LC3 685 31 7.3 23.4 34.2 40.1
PPC 322 30 7.4 18.6 31.7 57.9
cement are listed in Tables 3 and 4. The LOI of
LC3 are much higher than the PPC. The higher LOI
is primarily contributed from the limestone addition.
The requisite variety of limestone for the purpose of
usage in LC3 are having intrinsic LOI in the range
of 32–37% typically whereas typical LOI of fly ash
is in the range of 0-6 %. SO3 range is 1.87–2.83%.
Crystals of tri-calcium silicate present in commer-
cially available cement are mixed with impurities
such as alkalis, sulphates, phosphorous, and host of
trace minerals. The hydration process of alite or tri-
calcium silicate initiates in presence of alkali sul-
phate or alkaline sulphate environment. Alite acti-
vates when sulphate concentration (SO3) of the sol-
id solution is close to 2% [17]. However PPC is
having SO3 concentration of 2.83% owing to possi-
ble usage of high sulphur bearing clinker. Insoluble
residue (IR) for all the cement is ranging 22.68–
24.23%. The contributory factors for IR are the per-
centage of fly ash addition and calcined clay.
The Blaine fineness of LC3 is significantly
higher in comparison with PPC, though mean parti-
cle size is similar (see Tables 3 and 4). The Blaine
fineness of the cement is influenced by the material
characteristics and the comminution system adopted.
Calcined clay and the limestone are vastly different
from clinker and fly ash as far as the material hard-
ness and grinding efficiency is concerned. In general,
the mean size of cements was similar, though d50 of
LC3 was significantly lower as compared to PPC.
The normal consistency of LC3 and PPC are in a
close range of 30–31% despite the fact that LC3
Blain fineness level is more than the double of PPC.
112
Journal of Asian Concrete Federation, Vol. 2, No. 2, Dec. 2016

The compressive strength of the mortar cubes
of all cements are shown in Table 4. One day
strength of all the cement are in a very close range.
However 28 day strength of LC3 is remarkably
low in relation to PPC. This may be contributed to
lower clinker concentrations. The LC3 exhibited
early strength development up to 7 days and the
development between 7 days to 28 days was lower
in comparison with PPC.
The compressive strength development from 7
to 28 days of LC3 is 15% of 28 days strength
whereas, it is 46% for PPC. The hydration kinetics
is closely linked with the intrinsic material charac-
teristics. In the case of fly ash, the products of hy-
dration closely reassembles calcium–silica hydrates
produced by hydration of Portland cement. Howev-
er the reaction does not start until sometimes after
mixing. In the case of fly ash class F, this can be as
long as one week or even more. The glass material
in fly ash is broken down only when the pH value
of the pore solution is at least about 13 [18]. The
strength recovery of PPC from 7 days to 28 days is
much higher than in relation to LC3.
The lime reactivity of calcined clay was much
higher than fly ash resulting in higher demand of
Portlandite (CH) availability in the hydration system.
The LC3 cement exhibited higher one day strength
and higher recovery of strength from 1 to 7 days in
comparison with PPC. The higher rate of reactions
with available pore solution resulted in total con-
sumption of Portlandite generated in system. This
could cause availability of unreacted calcined clay.
Pozzolana cement resulted in lower growth or lower
strength recovery from 7 to 28 days. Reaction of
alumina and calcium carbonate with the progress of
hydration process of LC3 is possibly contributing to
improved early strength of LC3 up to 7 days in
comparison with PPC.
4.2 Hydration behavior
The isothermal (heat conduction) calorimetry
is an efficient tool to study the stages related to the
hydration of cement pastes or mortars at constant
temperature. The calorimeter continuously measures
and displays the heat flow related to the hydration
reactions taking place in the cement paste after
mixing. The respective cement was studied for
heat liberation using conduction calorimeter at a
w/c ratio of 0.40. The heat flow curve and the total
heat liberation curve are shown in Fig. 2 along with
that of PPC. The heat liberated at different age are
given in Table 5.
It has been observed that LC3 hydrated faster
with heat liberation almost double when compared
with PPC. However, the same tapers down after144
hours without significant gains till 28 days. PPC
catches up and surpasses LC3 at 28 days. This is in
0
50
100
150
200
250
0 50 100 150 200 250
Tota
l Hea
t R
elea
sed
, J/g
Time, Hrs
PPC LC3
Fig. 2 – Total heat released and heat flow of LC3
compared with PPC
Table 5 – Heat liberated for LC3 and PPC at differ-
ent age
Heat liberated,
J/gram of cement
Time, hours
24 72 144 672
LC3 100.1 178.2 205.1 215
PPC 68.3 142.3 165.8 230.4
agreement with compressive strength development
of the two cements.
4.3 SEM analysis of hydration products
Changes with time in the morphology and na-
ture of the hydration products of LC3 cement, at
water to cement ratio of 0.5, were studied by
scanning electron microscope. The microstructure
was observed at different intervals of hydration:
i.e. 1, 3, 7, and 28 days. The samples were stud-
ied in both fractured surface and polished section
using SE and BSD at variable pressure mode. The
hydration products such as calcium silicate hydrate
(C-S-H), portlandite (CH), ettringite (AFt), mono-
sulfate (AFm), C-S-A-H, limestone particles, and
deleterious materials like quartz and feldspar were
observed. The initial products at 1 day of hydration
are amorphous looking like fibrous shape. These
products mainly appear on the surface of the unhy-
drated grains, filling in void space as they grow.
Fibrous like C-S-H having size <200 nm, CH, Aft,
and AFm phases appear more at 1 day.
Interlocking structure of C-S-H and rod like
ettringite appear at 3 days. During the first 7 days of
113
Journal of Asian Concrete Federation, Vol. 2, No. 2, Dec. 2016

Fig. 3 – Morphology of hydration products at 1 days
Fig. 5 – Morphology of hydration products at 7 days
hydration, the surface of the C3S grain are covered
by the radiating fibrous particles of C-S-
H,honeycomb structure, and interlocking space
between the grains.
As time of hydration increased, the fibrous
structure developed into a needle like C-S-H at 28
days. At 28 days hydration, the paste displayed a
massive tabular structure with platy with occasion-
ally fibrous hydration products. The morphology of
C-S-H is similar at 3 and 7 days.
Fig. 4 – Morphology of hydration products at
3 days
Fig. 6 – Morphology of hydration products
at 28 days
Both type I and II C-S-H were observed in all
the hydration period. The size of C-S-H increased
form 200 nm to 1.5 micron as the hydration period
in creased from 1 to 28 days. The morphology of
ettringite also changes from needle to rod like
structure as the hydration period increases. Lime-
stone particles are frequently present at all the ages
indicating incomplete reaction with cement parti-
cles. The amount of AFm and CH also decreases as
hydration period increases.
114
Journal of Asian Concrete Federation, Vol. 2, No. 2, Dec. 2016

Fig. 7 – Flow behavior of LC3
Fig. 8 – Flow behavior of PPC
Fig. 9 – Flow retention of cement pastes
4.4 Porosity of cement pastes
The porosity of cement paste composed with
LC3 and PPC with ratio of water to cementitious
material 0.4 was determined using mercury intru-
sive porosimeter, both in terms of inter particle and
intraparticle porosity [19]. The results are listed in
Table 6. It is observed that hydrated LC3 paste has
lower porosity in comparison with that of PPC. The
total porosity of LC3 paste is 0.92% against 1.13%
of PPC.
4.5 Admixture demand of cement paste
Admixture compatibility of cements, tested
with common admixture showed that the optimum
dosage for LC3 was 1.4%, while it was 1.0% for
PPT. The flow behavior of cement paste showed
that LC3 has higher admixture demand, almost 40%
higher as compared to binary blend cements PPC
Table 6 – Porosity of cement paste by MIP
Cement
Porosity, %
Interparticle Intraparticle Total
LC3 0.844 0.074 0.918
PPC 1.248 0.087 1.133
(see Figs. 7 and 8), even though the water demand
for normal consistency was similar. This may be due
the higher fineness of LC3.
4.6 Retention of flow
Retention of flow of cement paste shows that
LC3 has a low initial flow and poor retention as
compared to PPC (see Fig. 9). This may be due to
fine limestone powder and higher fineness of LC3.
5. Conclusions
This study observed that the limestone calcined
clay cement behaves differently as compared to
commercially available fly ash based blended ce-
ment. The compressive strength development of
limestone calcined clay cement is also different to
fly ash based blended cement in terms of low im-
provement at later ages. The hydration behavior
shows a distinct difference in terms of high heat
evolution at early age, unconventional of blended
cements. Not only the cement paste has a high water
demand, resulting in lower workability, but also it
needs higher dosage of superplasticizers, if used.
Porosity of LC3 cement paste is lower than that of
PPC paste showing an improved durability.
Acknowledgements
The paper is based on the study at Central R&D
of UltraTech Cement Limited at Taloja Centre, un-
der the leadership of the authors. Acknowledge-
ments are due to all scientist who have contributed
to the study in one or another way. Dr. Suresh K.,
Dr. Mohan Medhe, Dr. Narendra Kumar, Manish
Kuchya, Er. Sandeep Keskar, Dr. Arunachala Sa-
dangi need special mention for analytical support.
References
1. Schokker, A. J., (2012) The Sustainable Con-
crete Guide-Applications, US Green Concrete
Council.
2. Okuma, M., (2003) "Preservation of Global
Environment and Wood Utilization", Forest and
Wood Forum – Tomorrow’s Life and Wood
with the Environment P.71, Tokyo.
3. BS EN 197-1 (2000) Cement - Part 1: Compo-
sition, specifications and conformity criteria for
common cements.
115
Journal of Asian Concrete Federation, Vol. 2, No. 2, Dec. 2016

4. IS:455 (2015) Portland Slag Cement Specifica-
tion, Bureau of Indian Standards, New Delhi.
5. IS:1498 - Part I & II (2015) Portland Pozzolana
Cement (fly ash based & Calcine Clay based),
Bureau of Indian Standards, New Delhi.
6. IS:16415 (2015) Composite Cement, Bureau
of Indian Standards, New Delhi.
7. AS:3972 Type GP (2010) General purpose and
blended cements, Standards Australia Limited.
8. Chatterjee, A. K., (2014) Technological initia-
tives and status of fly ash in India, fly ash
sources, applications & potential environmental
impact, Nova publications, pp. 315.
9. Bonavetti, V., et al. (2000) Influence of initial
curing on the properties of concrete containing
limestone blended cement, Cement and Con-
crete Research, 30, pp. 703-708.
10. Heikal, M., et al. (2000) Limestone-filled poz-
zolanic cement, Cement and Concrete Research,
30, pp. 1827-1834.
11. Lothenbach, B., et al. (2008) Influence of lime-
stone on hydration of Portland cements, Ce-
ment and Concrete Research, 38, pp. 848-860.
12. Matschei, T., et al. (2007) The role of calcium
carbonate in cement hydration, Cement and
Concrete Research, 37, pp. 551-558.
13. IS: 4032 (1985) Method of chemical analysis of
hydraulic cement, Bureau of Indian Standards,
New Delhi (Reaff. 2005).
14. IS: 4031 (1988 & 1989) Methods of physical
test for hydraulic cement (Pt 2-6), Bureau of
Indian Standards, New Delhi (Reaff. 2003-
2009).
15. Kantro, D. L., (1980) "Influence of Water-
Reducing Admixtures on Properties of Cement
Paste, A Miniature Slump Test," Cement, Con-
crete and Aggregates, 1(2), pp.95-102.
16. Zhor, J., and Bremner, T. W. (1998) Advances
in Evaluation of Lignosulphonates and Con-
crete Admixtures, Fourth CANMET/ACI/JCI
Conference: Advances in Concrete Technology,
SP 179-58, American Concrete Institute, pp.
1011-1042.
17. Neville, A. M., (2011) Properties of Concrete,
5th edition, Prentice Hall.
18. Taylor, H. F. W., (1997) Cement Chemistry,
Thomas Telford.
19. ASTM D4404 - 10 Standard Test Method for
Determination of Pore Volume and Pore Vol-
ume Distribution of Soil and Rock by Mercury
Intrusion Porosimetry, P.A.
116
Journal of Asian Concrete Federation, Vol. 2, No. 2, Dec. 2016

Journal of Asian Concrete Federation
Vol. 2, No. 2, Dec. 2016, pp. 117-127
ISSN 2465-7964 / eISSN 2465-7972
http://dx.doi.org/10.18702/acf.2016.12.2.2.117
Experimental investigation of the use of CFRP grid for shear
strengthening of RC beams
Ngoc Linh Vu *; Kimitaka Uji; and Vu Dung Tran
(Received: August 4, 2016; Accepted: November 11, 2016; Published online: December 31, 2016)
Abstract: Carbon fiber reinforced polymer (CFRP) sheet and grid have been widely applied to improve both
shear and flexural strength of reinforced concrete (RC) beams. Compared to CFRP sheet, CFRP grid and
sprayed mortar have advantages in dealing with the damaged concrete surface. This work examined the ef-
fectiveness of CFRP grid and sprayed mortar in enhancing the shear capacity of RC beams. Three RC beams
were fabricated and two of them were strengthened by CFRP grid and sprayed mortar. Then four-points
bending test was carried out to collect the data on the behavior of CFRP grid and stirrups in the three beams.
The results are presented and discussed in this paper. This study evaluated the strengthening effectiveness of
CFRP grid and sprayed mortar and the behavior of stirrups and CFRP grid. The difference in behaviors be-
tween stirrups and CFRP grid was analyzed.
Keywords: CFRP grid, sprayed mortar, stirrup, shear strengthening, RC beam.
1. Introduction
After a period of rapid economic growth, re-
pairing and retrofitting of existing infrastructures
that have been aging rapidly, such as buildings,
bridges, and tunnels, have been among the most
important civil engineering challenges all over the
world. For example, in Japan, the percentage of
highway bridges that are more than 50 years old
was approximately 18% in 2013 and will be 43% in
2023. For tunnels, this percentage is 20% and 34%,
respectively [1]. The other reason for the demand
for strengthening and rehabilitation of structures is
the upgrading of their load carrying capacity and
resistance to withstand underestimated loads, to
ameliorate the increased perceived risk from earth-
quakes. Since 1990s, carbon fiber reinforced poly-
mer (CFRP) has been used in civil infrastructures to
increase the load carrying capacity due to the lim-
ited durability of traditional materials. Using CFRP
has been considered as a very effective strengthen-
ing and rehabilitation method for such work. CFRP
has many advantageous engineering characteristics
such as high strength-to-weight ratio and stiffness-
to-weight ratio, corrosion resistance, and ease of
application and construction. CFRP currently plays
a key role in strengthening and retrofitting concrete
structures in Japan. The area of CFRP sheet used
was 980,000 m2 in 2006 and 1,310,000 m
2 in 2013
[2]. CFRP is usually used in the form of sheet. The
consumption of CFRP in the form of grid was only
about 5% of that of CFRP sheets in 2006. CFRP
grid and sprayed mortar have advantages in dealing
with damaged concrete surface. Scheme of CFRP
grid application is shown in Fig. 1.
Fig. 1 – Schematics of CFRP grid reinforcement
application
Many experimental studies have been conduct-
ed over the past decade to study the performance of
concrete beams strengthened in shear with external-
ly bonded FRP composites. Bukhari [3] reviewed
the existing design guidelines for strengthening
continuous beams in shear with CFRP sheets and
proposed a modification to Concrete Society Tech-
nical Report. Chen [4] studied the shear behaviour
of RC beams with FRP grid and concluded that RC
beams strengthened with CFRP grid have good
shear behaviour in terms of both increasing th
Corresponding author Ngoc Linh Vu is a Ph.D. candidate of
Dept. of Civil and Environmental Engineering, Tokyo Metro-
politan Univ., Japan, is a lecturer of Dept. of Civil Engineer-
ing, Univ. of Transport and Communications, Vietnam
Kimitaka Uji is a Professor of Dept. of Civil and Environmen-
tal Engineering, Tokyo Metropolitan Univ., Japan
Vu Dung Tran is a Doctor of Dept. of Civil and Environmen-
tal Engineering, Tokyo Metropolitan Univ., Japan
117

Table 1 – Mix proportion of concrete
Gravel
(mm)
Slump
(mm)
W/C
(%)
Air
(%)
Weight (kg/m3)
Water Cement Sand Gravel Admixture
20 120 55.6 4.5 158 284 792 1126 1.3
Table 2 – Properties of polymer and epoxy primer
Properties Polymer Epoxy primer
Main component SBR synthetic rubber vinyl acetate-ethylene copolymer
Solid content 45-46 (% by weight) 45-48 (% by weight)
Appearance white milky liquid white milky liquid
Viscosity below 50 (mPa.s) 500-2000 (mPa.s)
pH 8.0-9.0 4.5-6.5
Density 1.0 (g/cm3) 1.06 (g/cm
3)
Table 3 – Mechanical properties of concrete and mortar
Type Compressive strength (N/mm2) Elastic modulus (kN/mm
2) Tensile strength (N/mm
2)
Concrete 34.1 31.9 2.92
Mortar 36.7 31.0 2.87
Table 4 – Mechanical properties of reinforcing bars and CFRP
shear capacity and controlling of the crack width.
Guo [5] examined the effect of shear capacity of
RC beams reinforced with a haunch using the PCM
shotcrete method with CFRP grid and investigated
the adhesive properties of the reinforced interface
between PCM and the existing concrete. Steffen [6]
concluded that the use of CFRP grid could provide
a quick, efficient method for providing corrosion
resistant concrete deck reinforcement. CFRP grid
reinforcement represents a suitable replacement for
steel rebars in some concrete structural members
subjected to aggressive environmental conditions
that accelerate corrosion of the steel reinforcement
and cause deterioration of the structures [7]. These
studies have not focused on the difference in behav-
iours between stirrups and CFRP grid. The main
purpose of this research was to study the capacity of
CFRP grid and the behavior of stirrups and CFRP
grid in shear strengthening. This paper illustrates
the use of CFRP grid combined with sprayed mor tar to improve the shear strength of RC beams.
The existing guidelines are related to the applica-
tion of CFRP sheet, and there are no specific guide-
lines for the application of CFRP grid. The material
factor in calculating the effectiveness of CFRP grid
in providing shear resistance capacity was evaluated.
Based on the experimental result, the effectiveness
of CFRP grid and sprayed mortar in enhancing the
shear strength of RC beams was also evaluated. The
difference in behavior between stirrups and CFRP
grid was analyzed in detail.
2. Experimental Program
Three RC beams were fabricated and tested.
The control RC beam was not strengthened while
the two other beams were shear strengthened by
CFRP grid and sprayed mortar. The three RC
beams were designed such that their flexural
strength was much higher than their shear strength
to ensure that failure was controlled by the shear
force.
Type Size Area
(mm2)
Yield
strength
(N/mm2)
Tensile
strength
(N/mm2)
Elastic
modulus
(N/mm2)
10cm
10cm
Strains gauges
Rebar
D32 794.2 389 587 2 105
D10 71.33 413 561 2 105
D6 31.67 417 570 2 105
CFRP grid CR8 26.5 * 1400** 1 105*
NOTE: * CFRP grid has no yield strength; ** manufacturer’s data. Fig. 2 – CFRP CR8
118
Journal of Asian Concrete Federation, Vol. 2, No. 2, Dec. 2016

2.1 Materials
The three RC beams were fabricated using
ready-mixed concrete with a compressive strength
of 34.1 N/mm2 and maximum aggregate size of 20
mm. In the concrete mix, high-early-strength
Portland cement was used and the water-cement
ratio was 0.556 with the addition of water-reducing
and air-entraining admixtures. The other parameters
of the concrete mix are shown in Table 1. The
mortar to be sprayed was made by mixing 25 kg
premixed mortar, 1.21 kg polymer, and 4.1 kg
water. In order to increase interface adhesion,
epoxy primer was applied to the surface of concrete
before spraying mortar. The properties of the
polymer and epoxy primer are shown in
Table 2.
D32 was used as the main reinforcing bar in
the tension zone. D6 and D10 were used as the
stirrup and reinforcing bar, respectively. The CFRP
grid used in this test was CFRP-CR8 (The CR8
label is given by the manufacturer) with a grid
spacing of 100 mm 100 mm. The mechanical
properties of concrete and mortar are given in Table
3. Mechanical properties of reinforcing bars and
CFRP grid are listed in Table 4.
2.2 Test Specimens
The RC beams had the dimensions 200 mm
500 mm 2,750 mm. They were labelled RC beam
1 (control beam), RC beam 2, and RC beam 3. RC
beam 1 and RC beam 2 were reinforced with 6D32
longitudinal rebars at the bottom and 2D10 longitu-
dinal rebars on the top. The stirrup spacing was 200
mm (see
Fig. 4). In RC beam 1, D10 bar was used for
stirrups while, in RC beam 2, D6 bar was used as
stirrups, which is smaller than the type used in the
RC beam 1. With the assumption that the shear
strength in this beam was lost due to corrosion, the
cross-sectional area of the stirrups was reduced. RC
beam 3 was reinforced with 6D32 longitudinal re-
bars at the bottom. RC beam 3 had no stirrups in
order to evaluate the capacity of CFRP grid for en-
hancing shear resistance without stirrups. RC beam
2 and RC beam 3 were strengthened by CFRP grid
and sprayed mortar. The CFRP grid was placed
along the beam web and mortar was sprayed to cre-
ate an additional 20 mm layer on both sides of the
two beams.
Table 5 shows the total shear reinforcement ar-
ea of each beam. Reinforcement area in RC beam 1
is the total of cross sections of D10, while, in RC
beam 3, it is the total cross sections of CFRP grid
(vertical grid only) and, in RC beam 2, it is the total
of cross sections of D6 and CFRP grid in 200 mm
beam length of each beam.
Fig. 3 – Reinforcing bars and stirrups
2.3 Casting RC Beams
First, the RC beams were cast in wooden
formwork and cured by moisture-retaining cover
(see Fig. 5). Eight days after the RC beam 2 and RC
beam 3 were cast, their web’s surface was sand
blasted. The roughness of the beam surface after
sand blasting was 0.15 mm. Four days later, CFRP
grid was fixed on both sides of the beam by steel
bolt anchors. On the next day, epoxy primer was
applied. The roughness of the beam surface after
applying epoxy was 0.13 mm. After the epoxy layer
had dried, the repair mortar was sprayed (see Fig. 6).
Finally, a curing compound was sprayed on the
mortar surface. Tests of the RC beams were carried
out at the age of 27th, 28
th, and 29
th day.
2.4 Instrumentation and Test method
Four-point-bending test was performed (see
Fig. 7) on the three beams, with a span length (L) of
2,350 mm and a shear span (a) of 1,100 mm. The
effective depth (d) was 423 mm. The shear span to
effective depth (a/d) ratio was 2.6. During the test,
when the first flexural crack and the first diagonal
crack appeared, the specimens were unloaded to
mark the cracks and take photographs. After that
the load was continually increased until the beams
failed. The failure processes were monitored by
strain gauges installed on concrete, reinforcing bars
and the CFRP grid, and by displacement transduc-
ers placed at mid-span and two end supports of each
beam. Fig. 8 through Fig. 10 show locations of the
displacement transducers and strain gauges installed
on rebar, concrete, and CFRP grid in the three RC
beams.
3. Results and Discussions
3.1 Load – displacement behavior, crack devel-
opment and failure mode Fig. 8 through 10 describe cracks generated
during the test. The cracks shown in bold lines were
the largest cracks at the ultimate state of each beam.
119
Journal of Asian Concrete Federation, Vol. 2, No. 2, Dec. 2016

Fig. 4 – Longitudinal and transverse cross-sections of three RC beams and strengthening scheme using
CFRP grid and sprayed mortar
Table 5 - Total cross-sectional area of shear reinforcement: CFRP grid and stirrups
No. Shear reinforcement Total reinforcement area
(mm2/200 mm length)
Ratio of shear reinforce-
ment
(%)
RC beam 1 D10 @200 mm 142.66 0.37%
RC beam 2 D6 @200 mm and CFRP grid CR8 @100 mm 169.34 0.35%
RC beam 3 CFRP grid CR8 @100 mm 105.60 0.22%
NOTE: As - area of shear reinforcement (mm2); b - beam width (bRC1 = 200 mm; bRC2 = bRC3 = 240 mm); s - shear rein-
forcement spacing (mm).
Fig. 5 – RC beams fabrication
Fig. 6 – Fixing CFRP grid and spraying mortar
120
Journal of Asian Concrete Federation, Vol. 2, No. 2, Dec. 2016

Fig. 7 – Beam loading
Based on the observation of cracks for the three
beams, it is supposed that all beam failures were
due to diagonal tension. The test results of all
beams are summarized in Table 6. RC beam 2 ex-
hibited the highest maximum load (757 kN) while
RC beam 3 exhibited the lowest (617 kN) and RC
beam 1 showed a value between the two extremes
(690 kN). Compared to the control beam (RC beam
1), the maximum test load of RC beam 2 was higher
by 9.7% while that of RC beam 3 was lower by
10.6%.
Table 6 – Summary of test results
Beam index Crack-
ing
load
(kN)
Maximum load
(kN) Max.
mid-
span
displ.
(mm)
Design Test
RC beam 1 225 354 690 8.4 RC beam 2 300 697 757 7.4 RC beam 3 300 656 617 7.1
The total cross-sectional area of shear rein-
forcement placed in 200-mm beam length was
142.6 mm2 (two bars of D10) in RC beam 1, while,
in RC beam 2 and RC beam 3, it was 169.3 mm2
(two rebars of D6 and four bars of CFRP CR8) and
105.6 mm2
(four bars of CFRP CR8), equivalent to
118.7% and 74.3% of that of RC beam 1, respec-
tively. The ratio of shear reinforcement of RC beam
1 was 0.37%, while, in RC beam 2 and RC beam 3,
it was 0.35% and 0.22%, equivalent to 94.6% and
59.5%, respectively. The total cross-sectional areas
of reinforcing bars and CFRP grid and the ratios of
shear reinforcement are shown in Table 5. From test
results, in two cases of strengthening, CFRP grid
and sprayed mortar proved the effectiveness for
enhancing the shear capacity. It could be concluded
that concrete, rebar, mortar, and CFRP grid worked
well together.
Fig. 11 shows the load versus mid-span dis-
placement curves for the three beams. The maxi-
mum mid-span displacements of the three beams
are listed in Table 6. RC beam 1 had the highest
mid-span displacement of 8.4 mm while RC beam 2
and RC beam 3 had lower values of 7.4 mm and 7.1
mm (lower than 11.9% and 15.5% compared to RC
beam 1), respectively. Each load versus mid-span
displacement curve (see Fig. 11) could be divided
into two stages. The first stage is before the crack-
ing (225 kN for RC beam 1, 300 kN for RC beam 2
and RC beam 3). In this stage, RC beam 2 and RC
beam 3 showed higher stiffness than RC beam 1
because their width was larger (240 mm) compared
to that of RC beam 1 (200 mm). In the second stage
after the cracking, there is a distinct difference be-
tween RC beam 1 and RC beam 3. The stiffness of
RC beam 3 became lower than that of RC beam 1
due to cracks developed and the cross-section re-
duced. The Young’s modulus of the stirrups is
higher than that of CFRP grid (200,000 N/mm2 ver-
sus 100,000 N/mm2, respectively, in Table 4). RC
beam 3 had CFRP grid but no stirrups. Therefore
stirrups provide higher stiffness to the beam and
result in smaller displacement value compared with
the CFRP grid. In general, after strengthened by
CFRP grid and sprayed mortar, both RC beam 2
and RC beam 3 had higher stiffness, ductility char-
acteristic, and the cracking loads were also im-
proved (except in the final period for RC beam 3,
when the load was over 500 kN).
3.2 Behavior of stirrups in RC beam 1 and
CFRP grid in RC beam 3
When the load increased, the RC beams de-
formed, cracks appeared and developed, and the
beams failed. The behavior of the stirrups in RC
beam 1 and that of the CFRP grid in RC beam 3
were different. Fig. 12 illustrates the load versus
strain curves of stirrups in RC beam 1 and CFRP
grid in RC beam 3. Strain gauges S3 and S4 with
locations shown in Fig. 8 were installed on the stir-
rups in RC beam 1. Strain gauges G13 and G35
with locations shown in Fig. 10 were installed on
the CFRP grid in RC beam 3. These strain gauges
were near the cracks in each beam.
From Fig. 12, in general, strain values on
CFRP grid in RC beam 3 are smaller than those on
stirrups in RC beam 1. The strain recorded by G13
was the highest in RC beam 3 and the strain record-
ed by S3 was the highest in RC beam 1. These
gauges were close to the ultimate cracks in each
beam (see Fig. 8 and Fig. 10). The load versus
strain curves consist of 3 stages: In the first stage,
there are no cracks in each beam. Cracking load of
RC beam 3 was around 300 kN while, for RC beam
1, it was around 225 kN (see Fig. 13). In this stage,
at the same load levels, the strain of G35 was
smaller than that of S4 and the slope of the experi-
mental load-strain curves of RC beam 3 was higher
121
Journal of Asian Concrete Federation, Vol. 2, No. 2, Dec. 2016

Fig. 8 – Locations of strain gauges on stirrups and experimental cracks in RC beam 1
Fig. 9 – Locations of strain gauges on stirrups and experimental cracks in RC beam 2
Fig. 10 – Locations of strain gauges on CFRP grid and experimental cracks in RC beam 3
than that of RC beam 1. The reason was the beam
width of RC beam 3 was 240 mm (two layers of 20
mm including CFRP grid and sprayed mortar were
applied on two sides of the RC beam) compared to
the 200 mm width of RC beam 1. Thus, the bending
stiffness of RC beam 3 increased by about 10%.
In the second stage, when the diagonal cracks
appeared and developed, the length and the width of
the cracks increased, the cross-sectional area re-
duced gradually, and the shear capacity of both
beams provided by concrete and mortar reduced.
The shear strength of RC beam 1 was mainly pro-
vided by stirrups whereas that of RC beam 3 was
mainly provided by CFRP grid. Moreover, the
Young’s modulus of CFRP grid (1 105 N/mm
2) is
a half of that of the stirrup (2 105 N/mm
2) as
shown in Table 4. Therefore, strains in RC beam 3
are higher than those in RC beam 1 as shown in Fig.
13 and Fig. 14.
In the third stage, when the load continued in-
creasing, the stress on the stirrup reached the yield
122
Journal of Asian Concrete Federation, Vol. 2, No. 2, Dec. 2016

Fig. 11 – Load vs. mid-span displacement curves
Fig. 12 – Load vs. strain curves of stirrups in RC beam 1 and CFRP grid in RC beam 3
Fig. 13 – Load vs. strain curves of S4 (RC beam 1)
and G35 (RC beam 3)
Fig. 14 – Load vs. strain curves of S3 (RC beam 1)
and G13 (RC beam 3)
123
Journal of Asian Concrete Federation, Vol. 2, No. 2, Dec. 2016

strength. From the values given in Table 4, the stir-
rup is expected to yield at a strain of
= 2,085 10-6
. In test, stir-
rup S3yielded at a strain of 2,180 10-6
equivalent
to a load of 475 kN as shown in Fig. 14. When the
stirrup yielded, the modulus of shear reinforcing
bars reduced rapidly, whereas CFRP grid was elas-
tic until fracture. This is the reason why strains in
RC beam 3 were smaller than those in RC beam 1.
3.3 Difference in behavior between CFRP grid
and stirrups in RC beam 2 Bonding between concrete and sprayed mortar
is one of the most important factors that influence
the effectiveness of reinforcement. The difference
in behaviours between the stirrups and CFRP grid
at the same positions in RC beam 2 may provide the
information on the bonding between concrete and
sprayed mortar. The strain gauges on CFRP grid G4,
G14, G30, and G35 and those on the stirrups S1, S2,
S3, and S4 were respectively at the same positions
in RC beam 2. Locations of these strain gauges are
shown in Fig. 9. The data of the bending test are
listed in Table 7. Fig. 15 illustrates the load versus
strain curves of the stirrups and CFRP grid in RC
beam 2.
The strain curves for the load between 300 kN
and 550 kN (see Table 7 and Fig. 15) show the fol-
lowing behaviour: When the load is greater than
350 kN, the strain values on the stirrup are higher
than that on the CFRP grid (except stirrup S1),
S3/G30 and S4/G35 are higher than S2/G14. At a
load greater than 700 kN, the difference in strains
between stirrup S4 and CFRP grid G35 becomes
larger. At the ultimate stage, the strain recorded by
S4 is about 5 times higher than that by G35 (4.9
times higher at a load of 750 kN). Thus, strain
gauge readings at the same position differed
significantly. This observation proved that, these
materials (the CFRP grid and the stirrup) no longer
worked together and the bonding between concrete
and mortar was damaged. The possible reasons are
as follows: First, when the strain on stirrups S2, S3,
and S4 was greater than 2,085 10-6
(as calculated
in section 3.2), the stirrups yielded and deformed
rapidly after this point. Second, when the load was
increased from 320 to 425 kN, cracks appeared and
propagated towards the loading point, the
compression area of the cross-section reduced.
Most of these cracks were located on the same posi-
tions as S2, S3, and S4 (see Fig. 9). Once a crack
crossed the locations of stirrups and CFRP grid, the
adhesion of mortar to concrete surface was also
damaged.
0
100
200
300
400
500
600
700
800
0 2000 4000 6000 8000
Load(kN)
Strain(μ)
G35
S4
a) Stirrup S4 and CFRP grid G35
0
100
200
300
400
500
600
700
800
0 5000 10000 15000
Load(kN)
Strain(μ)
G30
S3
b) Stirrup S3 and CFRP grid G30
Fig. 15 – Load vs. strain curves of stirrup and
CFRP grid in RC beam 2
3.4 Contribution of CFRP grid in shear
strengthening of RC beams
Design shear capacity values were calculated
for different values of shear strength as shown in
Table 6. Flexural cracks appeared when the flexural
cracking strength of concrete was exceeded by the
applied stress. After that, if the stress reached the
shear strength of concrete, diagonal cracks would
occur. The design shear capacity of RC beam 1 is
the sum of shear resistances contributed by concrete
and reinforcement while those of RC beam 2 and
RC beam 3 are the sums of shear resistances con-
tributed by concrete, reinforcement, and CFRP grid.
According to Eq. (9.2.3) of Ref [8], the design shear
capacity was calculated using following equations:
(1)
124
Journal of Asian Concrete Federation, Vol. 2, No. 2, Dec. 2016
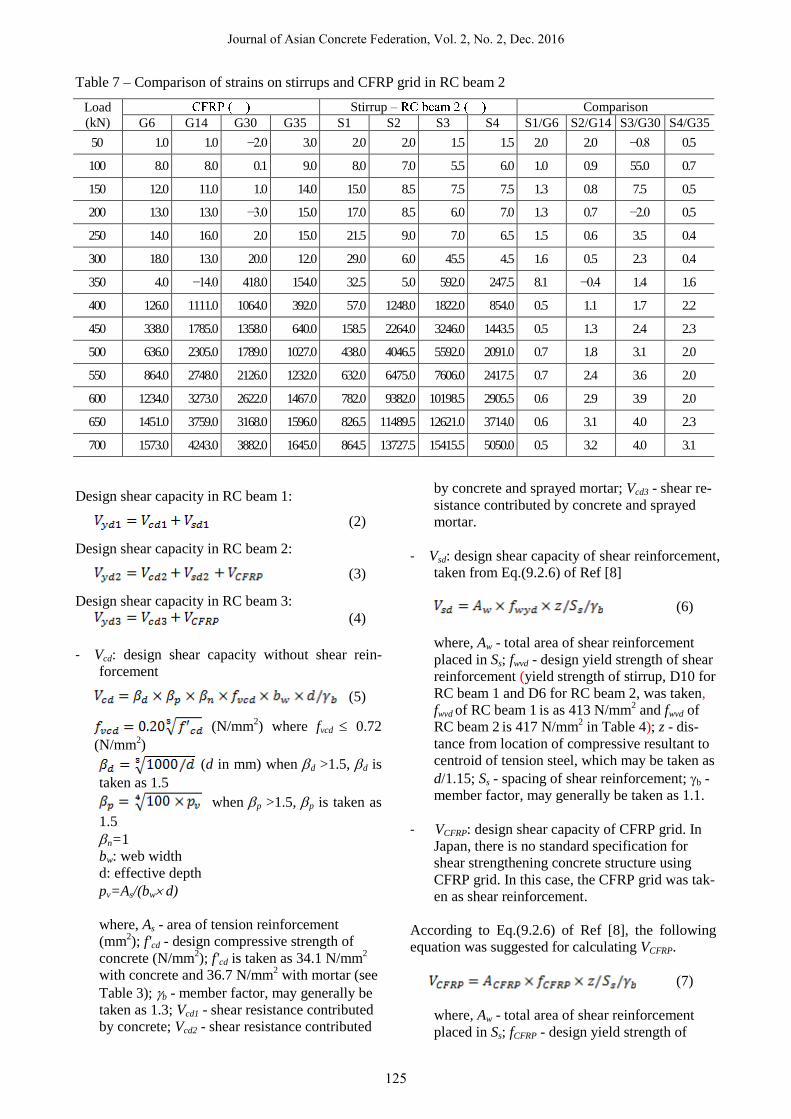
Table 7 – Comparison of strains on stirrups and CFRP grid in RC beam 2
Load
(kN)
Stirrup – Comparison
G6 G14 G30 G35 S1 S2 S3 S4 S1/G6 S2/G14 S3/G30 S4/G35
50 1.0 1.0 −2.0 3.0 2.0 2.0 1.5 1.5 2.0 2.0 −0.8 0.5
100 8.0 8.0 0.1 9.0 8.0 7.0 5.5 6.0 1.0 0.9 55.0 0.7
150 12.0 11.0 1.0 14.0 15.0 8.5 7.5 7.5 1.3 0.8 7.5 0.5
200 13.0 13.0 −3.0 15.0 17.0 8.5 6.0 7.0 1.3 0.7 −2.0 0.5
250 14.0 16.0 2.0 15.0 21.5 9.0 7.0 6.5 1.5 0.6 3.5 0.4
300 18.0 13.0 20.0 12.0 29.0 6.0 45.5 4.5 1.6 0.5 2.3 0.4
350 4.0 −14.0 418.0 154.0 32.5 5.0 592.0 247.5 8.1 −0.4 1.4 1.6
400 126.0 1111.0 1064.0 392.0 57.0 1248.0 1822.0 854.0 0.5 1.1 1.7 2.2
450 338.0 1785.0 1358.0 640.0 158.5 2264.0 3246.0 1443.5 0.5 1.3 2.4 2.3
500 636.0 2305.0 1789.0 1027.0 438.0 4046.5 5592.0 2091.0 0.7 1.8 3.1 2.0
550 864.0 2748.0 2126.0 1232.0 632.0 6475.0 7606.0 2417.5 0.7 2.4 3.6 2.0
600 1234.0 3273.0 2622.0 1467.0 782.0 9382.0 10198.5 2905.5 0.6 2.9 3.9 2.0
650 1451.0 3759.0 3168.0 1596.0 826.5 11489.5 12621.0 3714.0 0.6 3.1 4.0 2.3
700 1573.0 4243.0 3882.0 1645.0 864.5 13727.5 15415.5 5050.0 0.5 3.2 4.0 3.1
Design shear capacity in RC beam 1:
(2)
Design shear capacity in RC beam 2:
(3)
Design shear capacity in RC beam 3:
(4)
- Vcd: design shear capacity without shear rein-
forcement
(5)
(N/mm2) where fvcd 0.72
(N/mm2)
(d in mm) when d >1.5, d is
taken as 1.5
when p >1.5, p is taken as
1.5
n=1
bw: web width
d: effective depth
pv=As/(bw d)
where, As - area of tension reinforcement
(mm2); f'cd - design compressive strength of
concrete (N/mm2); f'cd is taken as 34.1 N/mm
2
with concrete and 36.7 N/mm2 with mortar (see
Table 3); b - member factor, may generally be
taken as 1.3; Vcd1 - shear resistance contributed
by concrete; Vcd2 - shear resistance contributed
by concrete and sprayed mortar; Vcd3 - shear re-
sistance contributed by concrete and sprayed
mortar.
- Vsd: design shear capacity of shear reinforcement,
taken from Eq.(9.2.6) of Ref [8]
(6)
where, Aw - total area of shear reinforcement
placed in Ss; fwvd - design yield strength of shear
reinforcement (yield strength of stirrup, D10 for
RC beam 1 and D6 for RC beam 2, was taken,
fwvd of RC beam 1 is as 413 N/mm2 and fwvd of
RC beam 2 is 417 N/mm2 in Table 4); z - dis-
tance from location of compressive resultant to
centroid of tension steel, which may be taken as
d/1.15; Ss - spacing of shear reinforcement; b -
member factor, may generally be taken as 1.1.
- VCFRP: design shear capacity of CFRP grid. In
Japan, there is no standard specification for
shear strengthening concrete structure using
CFRP grid. In this case, the CFRP grid was tak-
en as shear reinforcement.
According to Eq.(9.2.6) of Ref [8], the following
equation was suggested for calculating VCFRP.
(7)
where, Aw - total area of shear reinforcement
placed in Ss; fCFRP - design yield strength of
125
Journal of Asian Concrete Federation, Vol. 2, No. 2, Dec. 2016

shear reinforcement (In this experiment, there is
no yield strength of CFRP and CFRP can be
considered as a linear-elastic material. fCFRP was
taken as tensile strength, equal to 1,400
N/mm2); b - member factor of CFRP material
(as there is no standard specification for CFRP
grid, the safety ratio of 1.3 for CFRP sheet tak-
en from “Guideline for repair and strengthening
using CFRP sheet for concrete structure” [9]
was used)
According to test results in Table 6, RC beam
1 and RC beam 2 showed the maximum test loads
of 690 kN and 757 kN, respectively, much higher
than design loads of 354 kN and 697 kN, respec-
tively, due to the following reasons. First, the value
of the design load is calculated for linear-elastic
material, while at the load of 690 kN, the stirrup in
RC beam 1 already yielded; second, there is safety
ratio included in the formula in standard specifica-
tions. For RC beam 3, the design loads are higher
than the experimental maximum load, due to the
following reasons. First, applying the formula for
stirrups to calculate shear strength of CFRP grid
was not appropriate as some coefficients in the
formula were not reasonable for CFRP grid, the
stirrup has yield strength but CFRP grid does not.
Second, when computing the design shear strength,
it was assumed that the CFRP grid would work at
full capacity. Actually, the maximum stress in
CFRP grid was less than 1,400 N/mm2 as shown in
Table 4. At the ultimate state of strengthened beams,
the maximum load of RC beam 3 was 617 kN and
the maximum strain values of CFRP grid in RC
beam 3 were recorded by strain gauges G13 and
G35 (location of strain gauges are shown in Fig. 10).
The maximum strains were 11,943 10-6
and
6,377 10-6
as shown in Fig. 16, respectively. The
stress on the CFRP grid was calculated as follows.
The maximum stress values on the CFRP grid
recorded by G13 and G35 were 85.3% and 45.5%
of the tensile strength of CFRP grid (1,400 N/mm2)
as shown in Table 4. Guideline for repair and
strengthening using CFRP sheet for concrete struc-
ture [9] suggests that the material factor for calcu-
lating CFRP sheet capacity is 1.3. There is no men-
tion of the corresponding value for CFRP grid. Here,
using material factor of 1.3, the shear design load of
RC beam 3 would be 656 kN, which is not appro-
priate. In the present research work, a coefficient of
1.5 is proposed, indicating that the CFRP grid
works at 66.7% of its tensile strength. Using the
coefficient of 1.5, the design load will be 637 kN
for RC beam 2 and 600 kN for RC beam 3.
4. Conclusions
Experiments were conducted to study the per-
formance of CFRP grid and sprayed mortar for
shear strengthening of RC beams. CFRP grid con-
sists of vertical and horizontal components but this
study only focused on researching the vertical com-
ponent of the CFRP grid. Based on the collected
data, the following conclusions were drawn.
(1) CFRP grid and sprayed mortar could be signif-
icantly effective in shear strengthening. In this
experiment, RC beams strengthened with
CFRP CR8 and sprayed mortar (RC beam 2
and RC beam 3) attained 110.7% and 89.4% of
shear capacity compared with the ultimate load
of the control beam (RC beam 1). The cross-
sectional area of reinforcing materials in RC
beam 2 and RC beam 3 were equivalent to
118.7% and 74.3%, respectively, of the cross-
sectional area of stirrups in RC beam 1. In
general, the stiffness, ductility characteristic,
and the cracking load of the strengthened RC
beams (RC beam 2 and RC beam 3) using
CFRP grid and spayed mortar were improved.
(2) The behavior between the CFRP grid and the
stirrups reflects the bonding between concrete
and sprayed mortar. It is one of the most im-
portant factors that influences the reinforce-
ment effectiveness. According to experimental
results, when the load increased, variations of
the stirrup strains and the CFRP grid strains at
the same position in a strengthened RC beam
had similar tendencies. After the stirrups yield-
ed and the cracks developed in a strengthened
RC beam, the bonding between concrete and
sprayed mortar was considerably affected.
(3) In an application of CFRP grid and sprayed
mortar, CFRP grid could not work at 100% of
the tensile strength. Ref [9] reports the material
factor of 1.3 for calculating CFRP sheet capac-
ity, but the maximum stress of CFRP grid was
85.3% of the tensile strength in our experi-
ments. Therefore, a material factor of 1.5 is
proposed for the CFRP grid when applying the
formula in Ref [8] to calculate the shear
strength of a RC beam strengthened with
CFRP grid and sprayed mortar. Using a coeffi-
cient of 1.5 means the CFRP grid works at
66.7% of its capacity.
126
Journal of Asian Concrete Federation, Vol. 2, No. 2, Dec. 2016

It is concluded that the shear-strengthening of
RC beams by CFRP grid and sprayed mortar is ef-
fective. CFRP grid and sprayed mortar are useful in
strengthening and retrofitting of concrete structures.
CFRP grid can support or replace stirrups in RC
beams in providing shear strength. The availability
of CFRP grid and sprayed mortar should be more
intensively investigated and widely applied in con-
crete structures in the future.
References 1. White paper on land, infrastructure, transport
and tourism in Japan (2014), 123 pp.
2. "CFRP Repair and Reinforcement Method
Technology Research Association"
http://tampoken.com/04.html (accessed on Dec.
5, 2016)
3. I.A. Bukhari, (2010) “Shear strengthening of
reinforced concrete beams with CFRP,” Maga-
zine of Concrete Research, (1), pp. 62.
4. W.Y. Chen, (2010) “The shear behaviour of
beams strengthened with FRP grid,” Proceed-
ings of the 5th International Conference on FRP
Composites in Civil Engineering.
5. R. Guo, (2014) “Shearing Capacity and adhe-
sive Properties of Reinforce Interface for RC
beam with haunch retrofitted by CFRP grid
with spraying PCM shotcrete,” Memoirs of the
Faculty of Engineering, Kyushu University.
6. R. Steffen, (2003) Design and Constructability
of a CFRP Grid Reinforced Bridge Deck, High
Performance Materials in Bridges, pp. 106-116.
7. B. Zhang, (2004) “Behaviour of one-way con-
crete slabs reinforced with CFRP grid rein-
forcements,” Construction and Building Mate-
rials, 18(8), October 2004, pp. 625–635.
8. JSCE Guidelines for Concrete, N0.15. (2007)
Standard Specifications for Concrete Struc-
tures, “Design,” Japan Society of Civil Engi-
neers, pp. 156.
9. JSCE – Concrete Committee (2000) Guideline
for repair and strengthening using CFRP sheet
for concrete structure.
127
Journal of Asian Concrete Federation, Vol. 2, No. 2, Dec. 2016