Embed Size (px)
Citation preview
FIRE PATTERN ANALYSIS
Gerald Haynes, PE
Fire Protection Engineer
Forensic Fire Analysis, LLC
20th Annual Fire Investigative Approaches Training Seminar Myrtle Beach, SC
October 20, 2016
OBJECTIVES
Recognize the importance of fire pattern analysis in determining the origin of fires (NFPA 921)
Provide basic calculation methodology for use in conducting fire engineering analysis
Use fire hazard analysis (FHA) methodology for credible fire scenarios
Encourage the use of FDTs spreadsheets to supplement correlations and mathematical calculations based upon fundamental fire dynamics principles
2
3
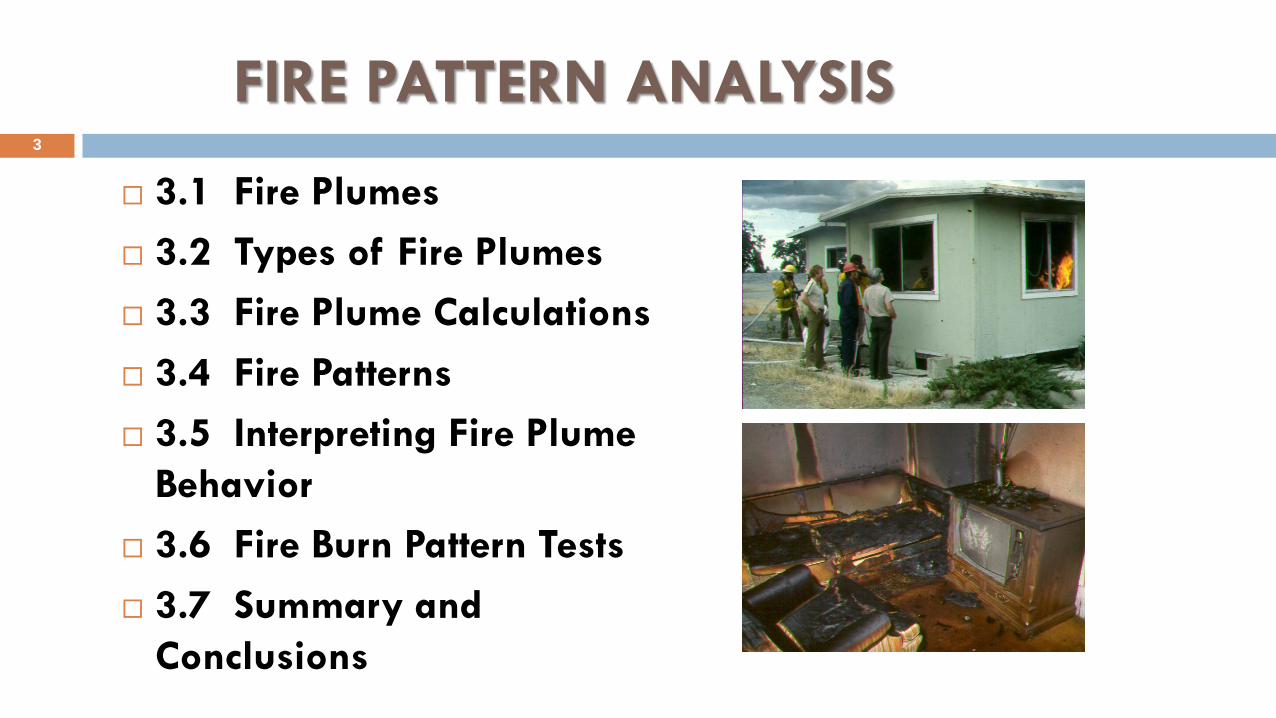
FIRE PATTERN ANALYSIS
3.1 Fire Plumes
3.2 Types of Fire Plumes
3.3 Fire Plume Calculations
3.4 Fire Patterns
3.5 Interpreting Fire Plume
Behavior
3.6 Fire Burn Pattern Tests
3.7 Summary and
Conclusions
OBJECTIVES 4
The Analysis of Fire Patterns
Is useful in documenting fire plume damage to areas/points of fire origin
Documents surfaces on materials that change their appearance when exposed to heat, flames, and products of combustion
Can document fire movement and intensity
Forms the basis for forensic fire scene reconstructions
V Patterns
Hourglass Patterns
Fire Plume Damage Correlations
3.1 FIRE PLUMES
3.1 FIRE PLUMES
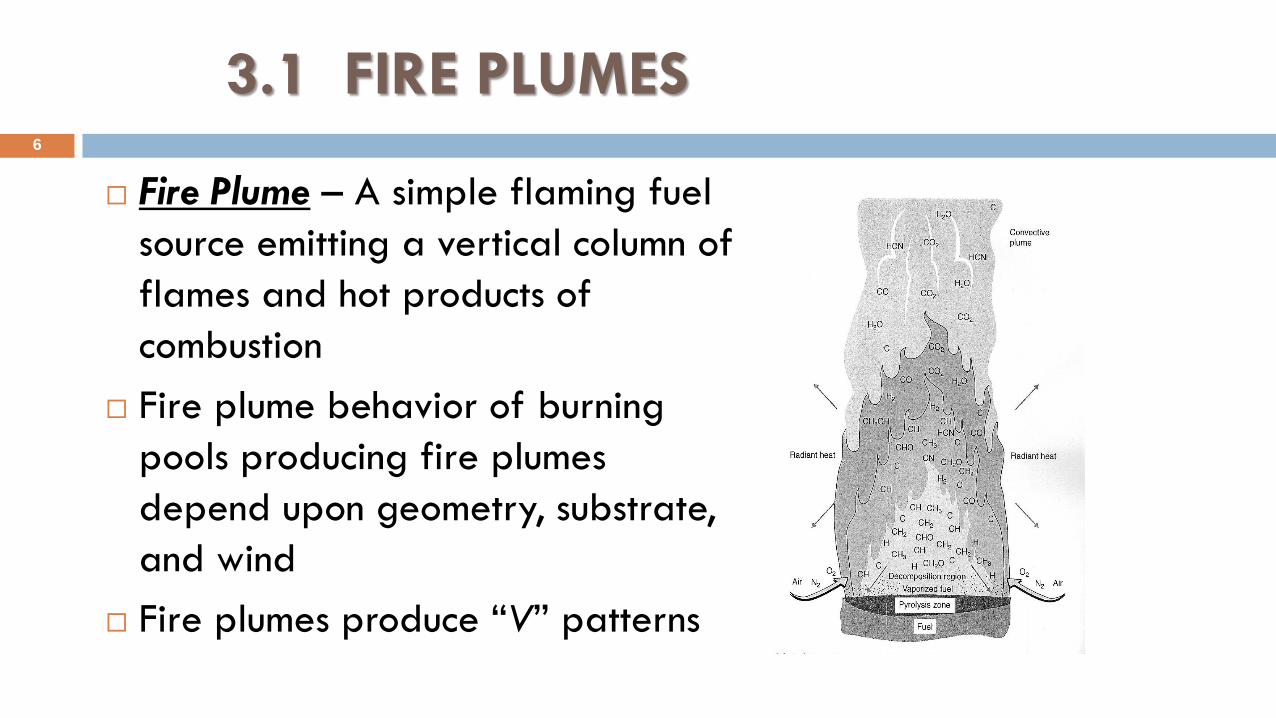
Fire Plume – A simple flaming fuel
source emitting a vertical column of
flames and hot products of
combustion
Fire plume behavior of burning
pools producing fire plumes
depend upon geometry, substrate,
and wind
Fire plumes produce “V” patterns
6
7
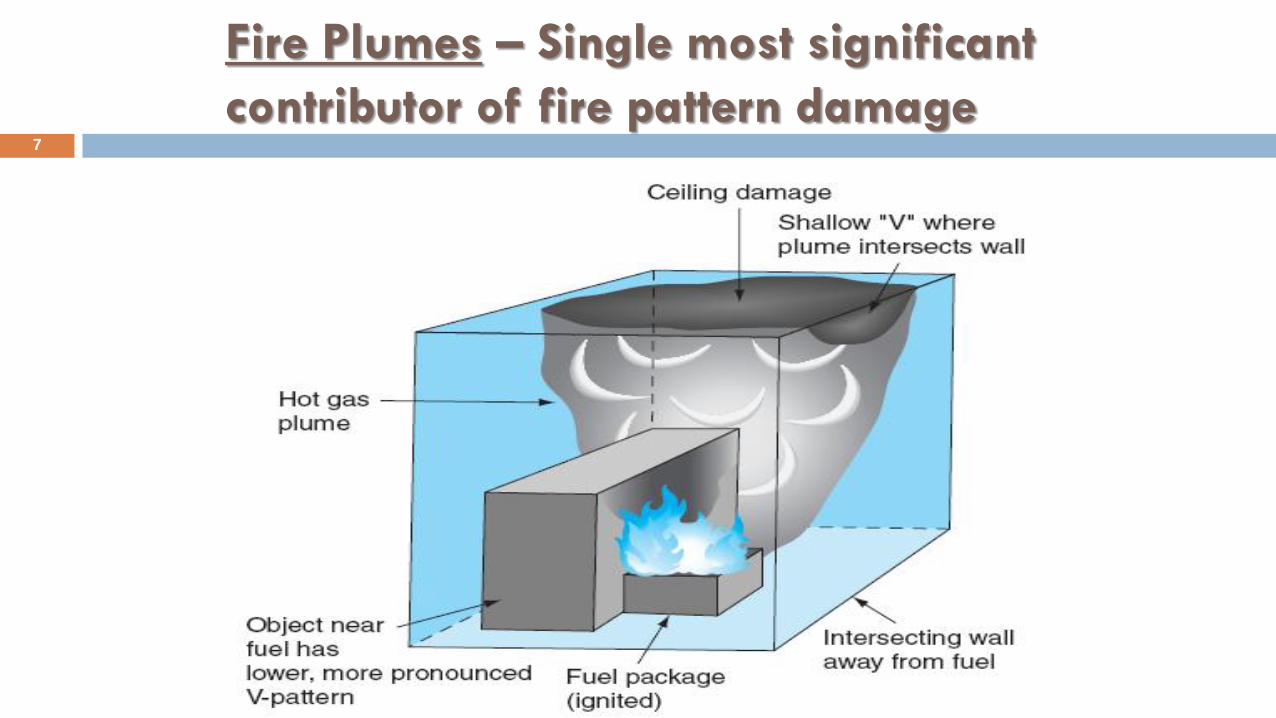
Fire Plumes – Single most significant
contributor of fire pattern damage
Formation of “V” Patterns
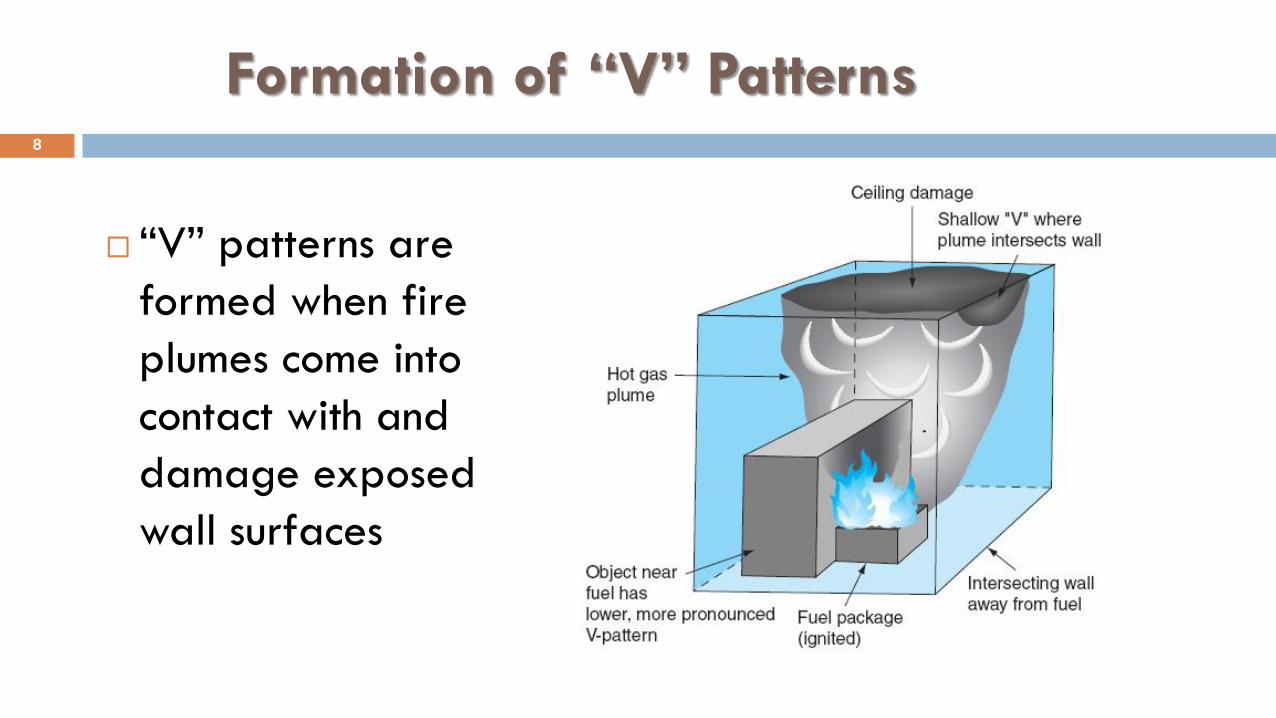
“V” patterns are
formed when fire
plumes come into
contact with and
damage exposed
wall surfaces
8
Fire Plumes – Temp. Distribution
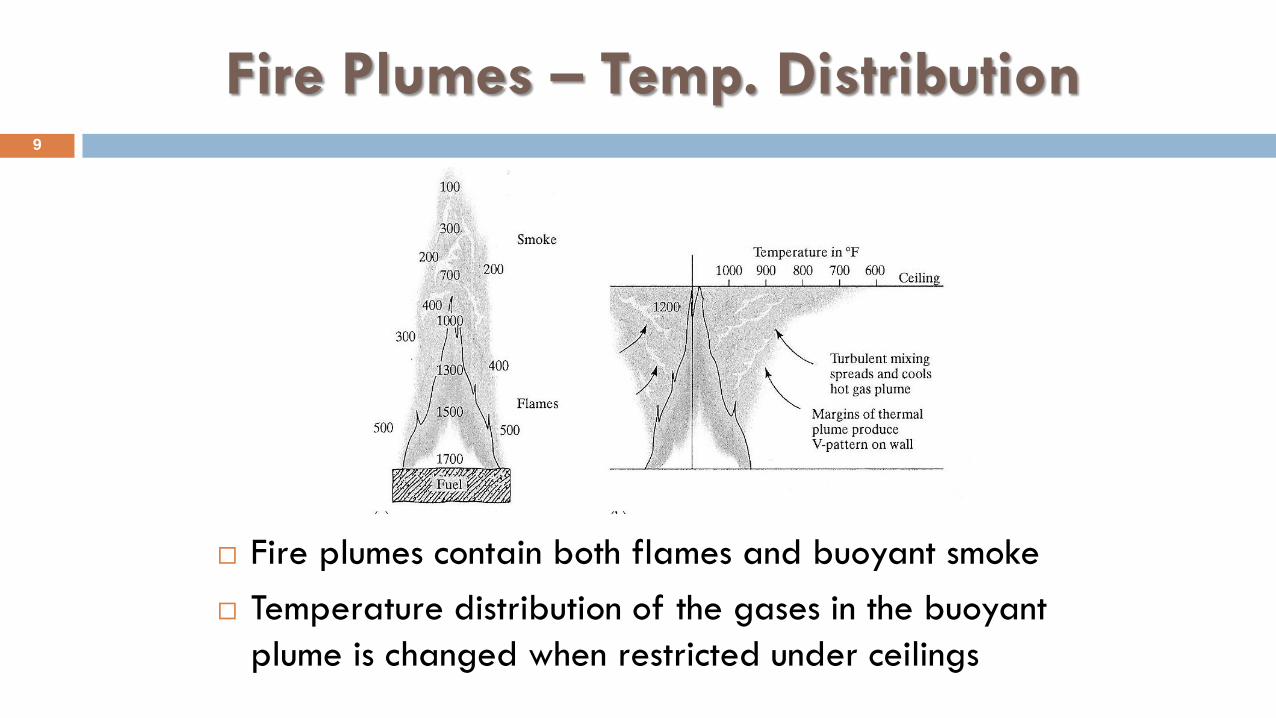
Fire plumes contain both flames and buoyant smoke
Temperature distribution of the gases in the buoyant
plume is changed when restricted under ceilings
9
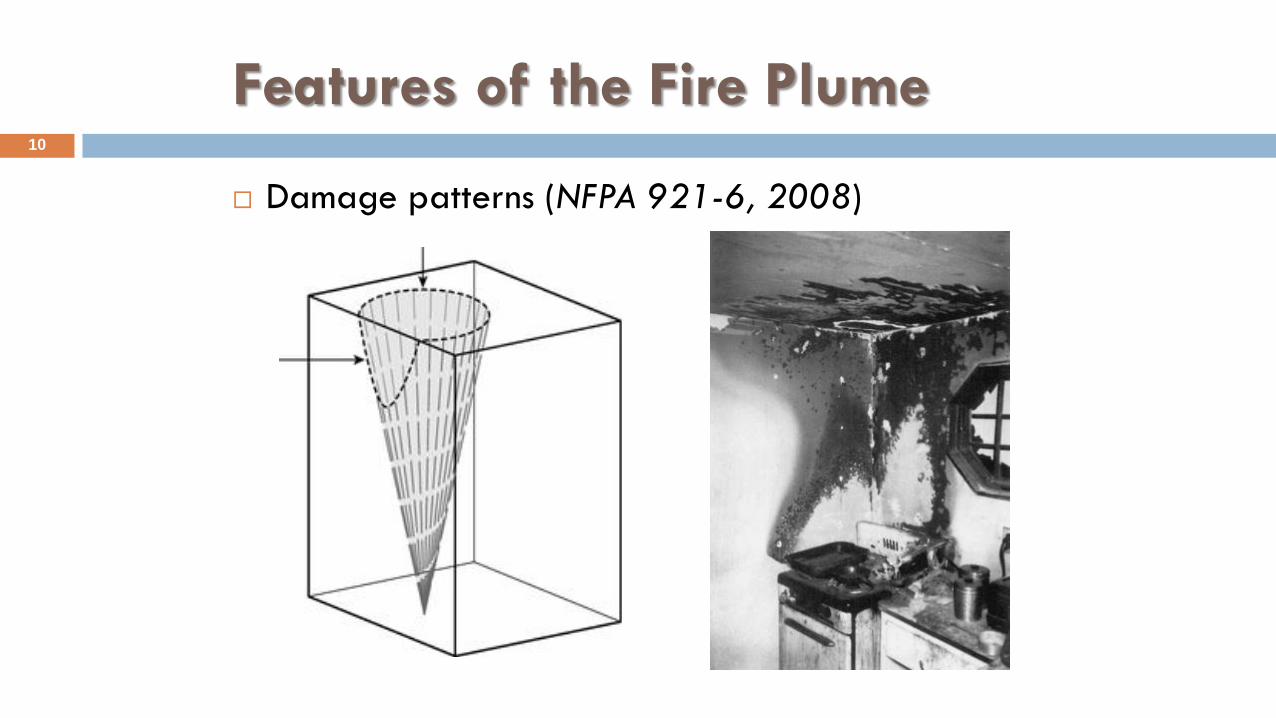
Features of the Fire Plume 10
Damage patterns (NFPA 921-6, 2008)
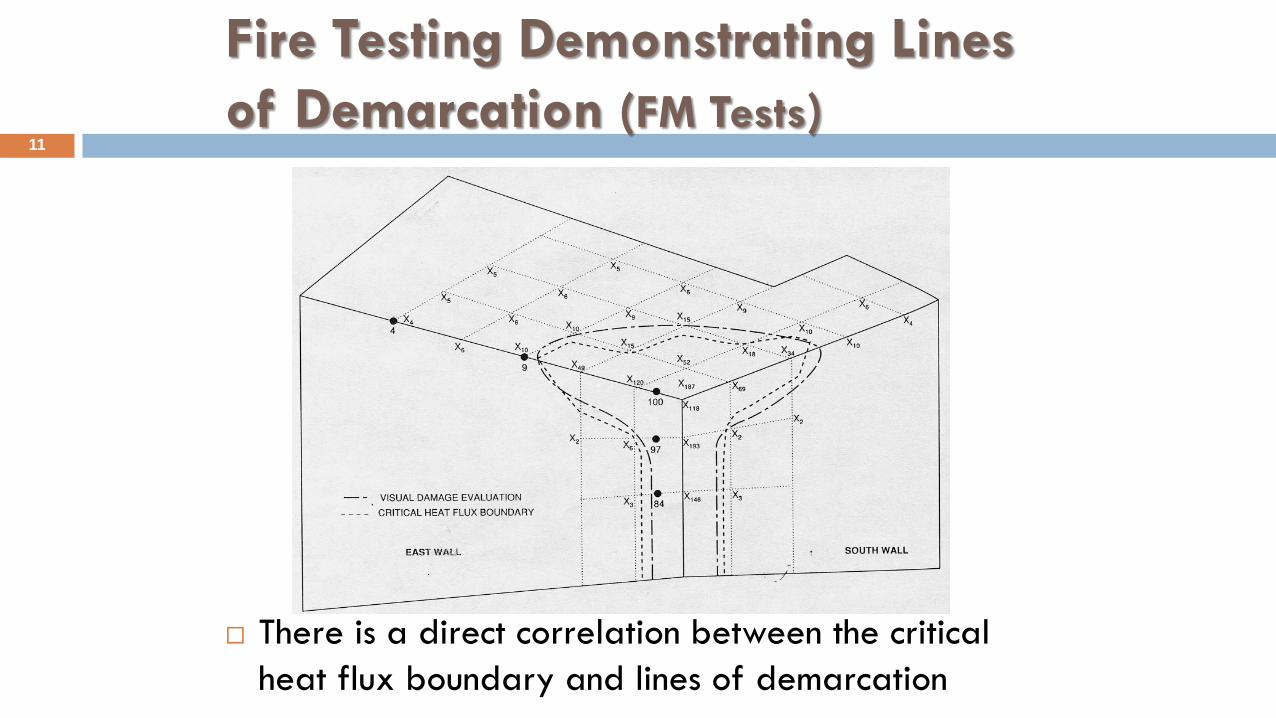
Fire Testing Demonstrating Lines
of Demarcation (FM Tests)
There is a direct correlation between the critical
heat flux boundary and lines of demarcation
11
3.2 TYPES OF FIRE PLUMES
Axisymmetric plumes
Window plumes
Balcony plumes
Line plumes
13
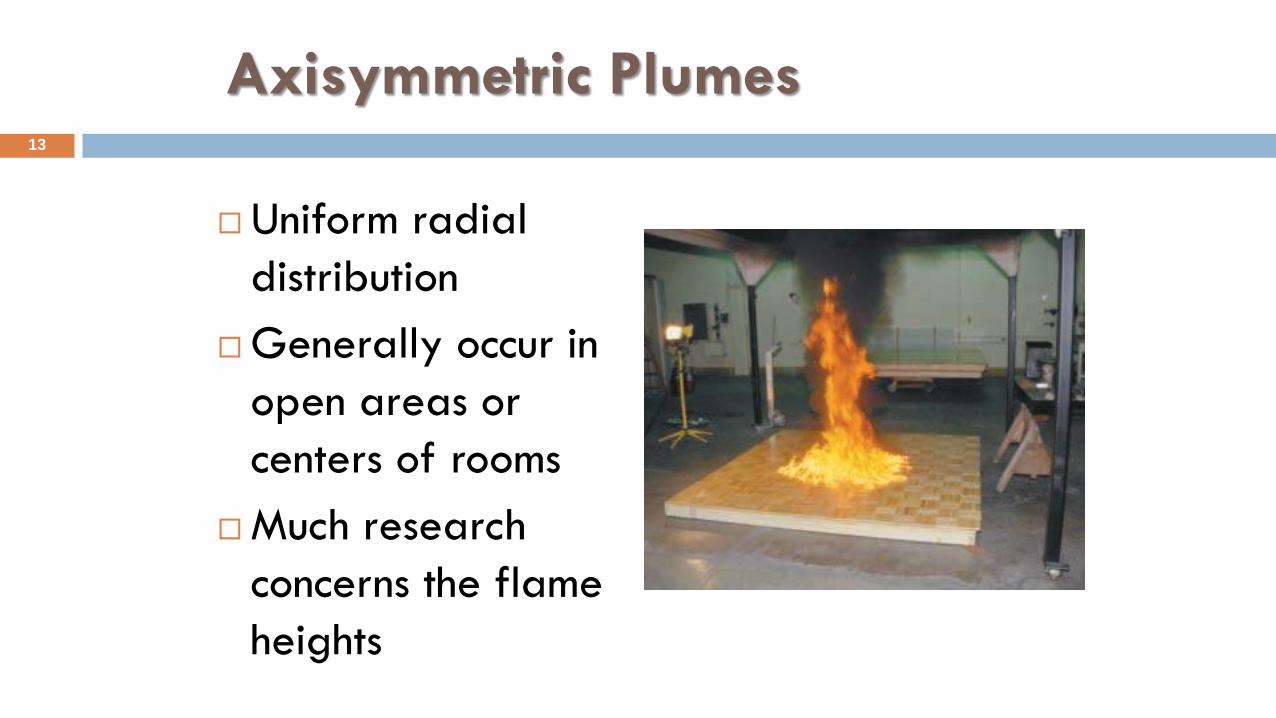
Axisymmetric Plumes
Uniform radial
distribution
Generally occur in
open areas or
centers of rooms
Much research
concerns the flame
heights
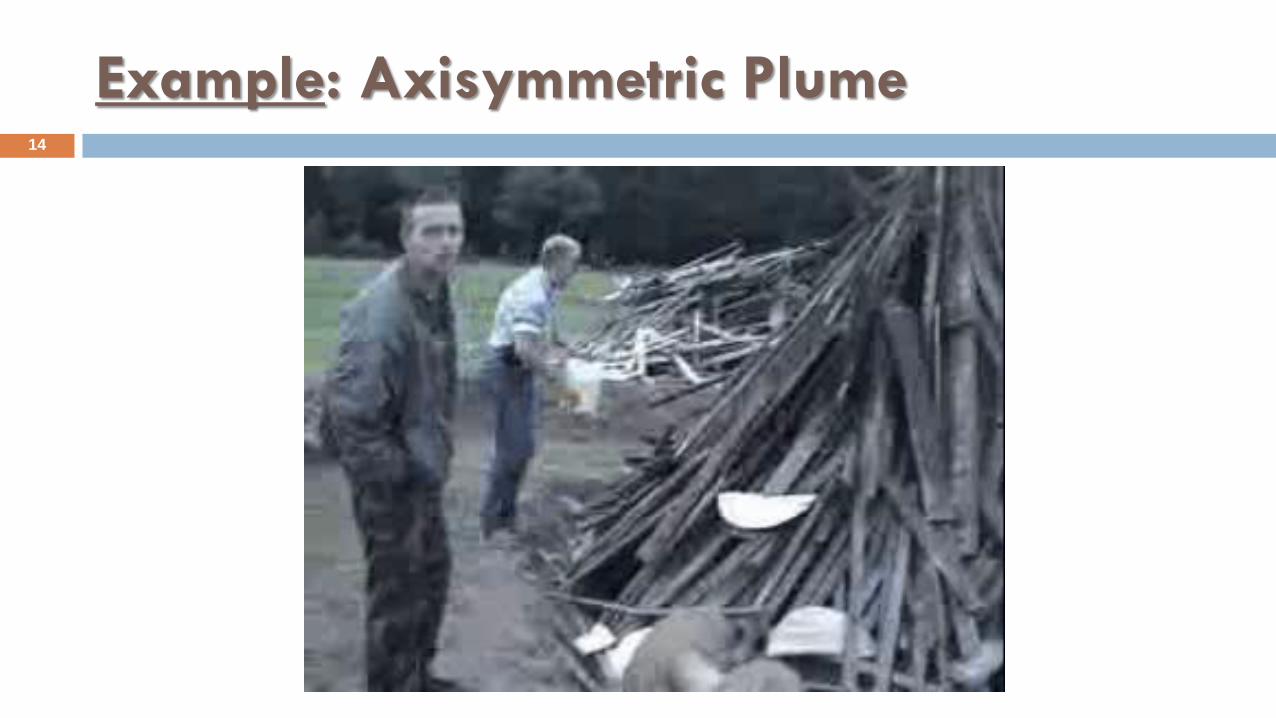
Example: Axisymmetric Plume 14
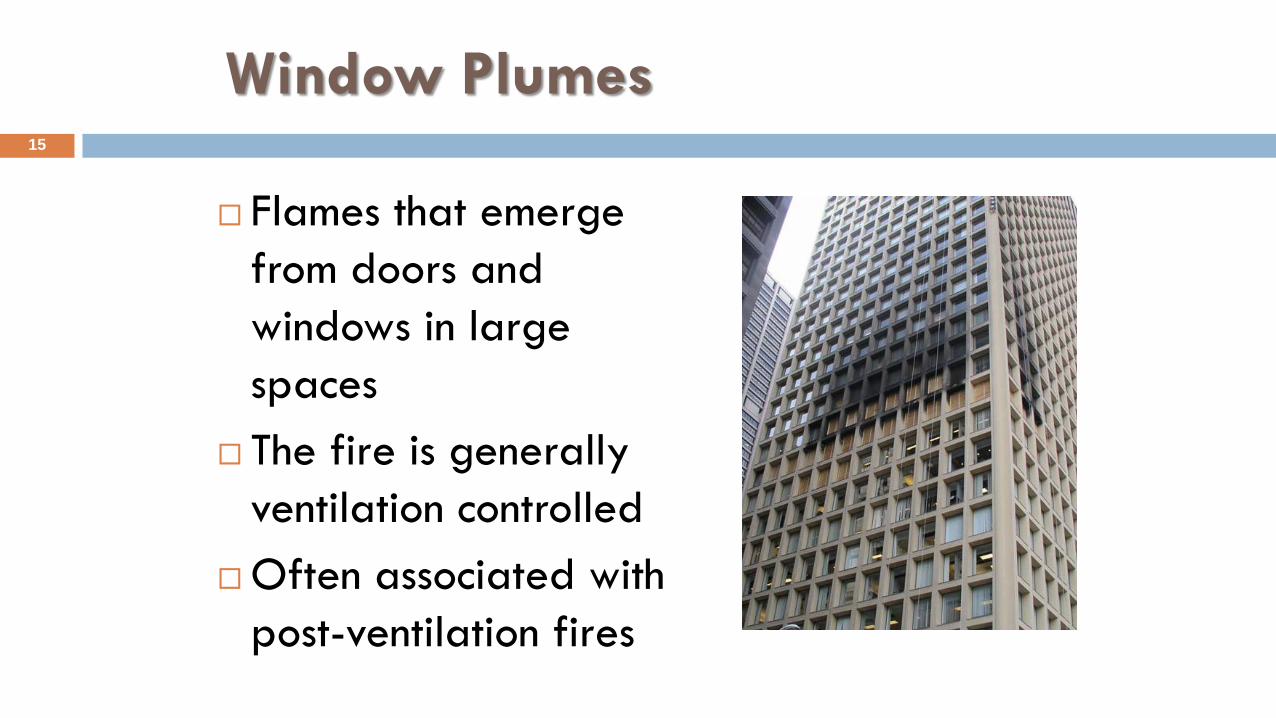
Window Plumes
Flames that emerge
from doors and
windows in large
spaces
The fire is generally
ventilation controlled
Often associated with
post-ventilation fires
15
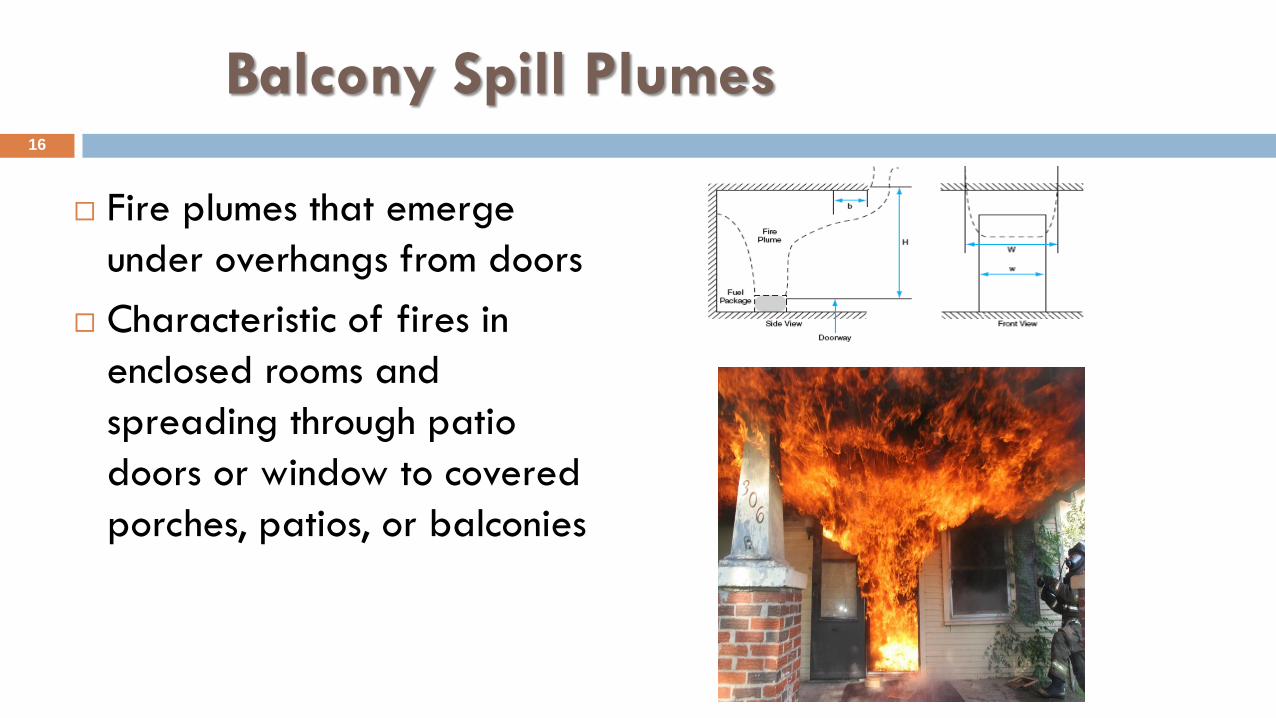
Balcony Spill Plumes
Fire plumes that emerge
under overhangs from doors
Characteristic of fires in
enclosed rooms and
spreading through patio
doors or window to covered
porches, patios, or balconies
16
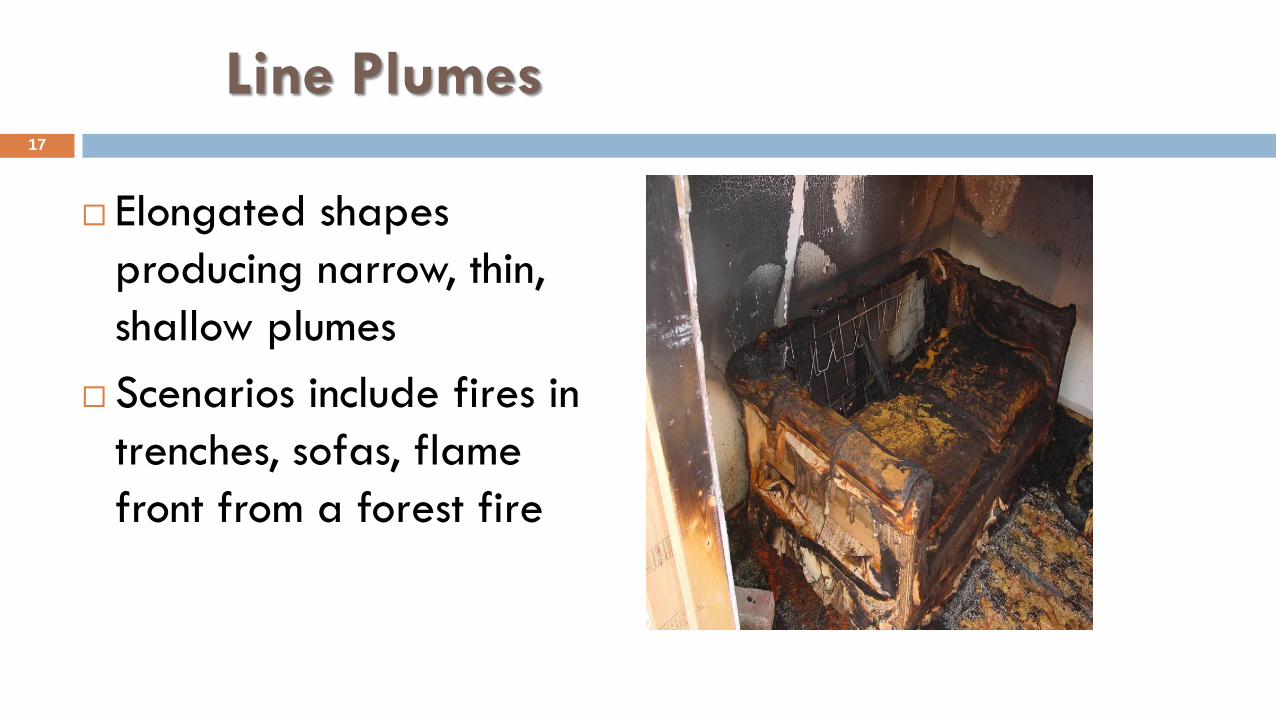
Line Plumes
Elongated shapes
producing narrow, thin,
shallow plumes
Scenarios include fires in
trenches, sofas, flame
front from a forest fire
17
3.3 FIRE PLUME CALCULATIONS
19
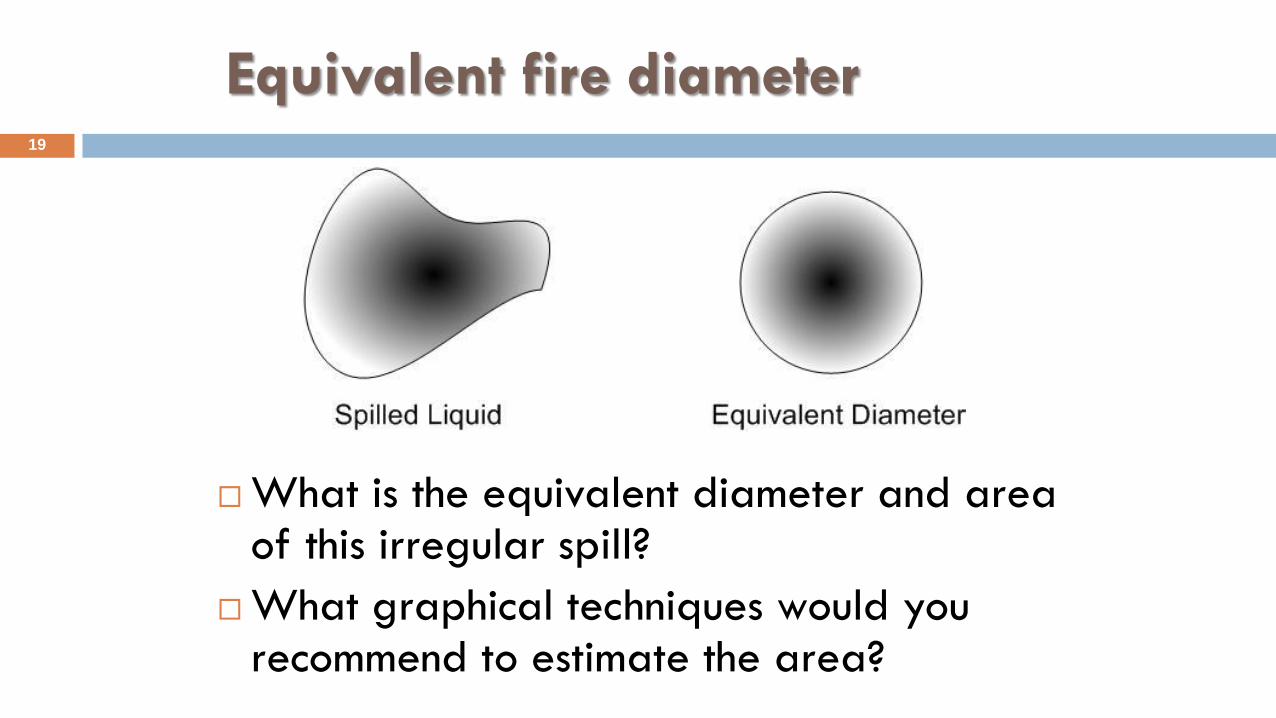
Equivalent fire diameter
What is the equivalent diameter and area of this irregular spill?
What graphical techniques would you recommend to estimate the area?
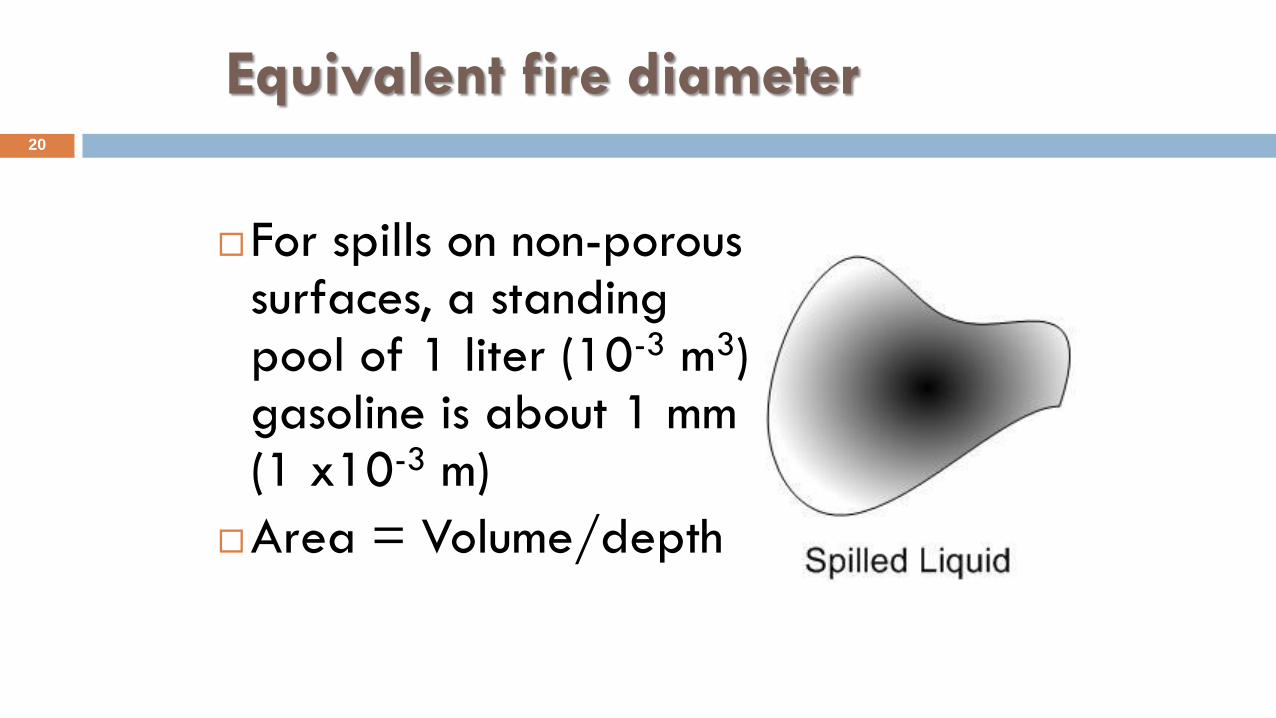
Equivalent fire diameter
For spills on non-porous surfaces, a standing pool of 1 liter (10-3 m3) gasoline is about 1 mm (1 x10⁻³ m)
Area = Volume/depth
20
21
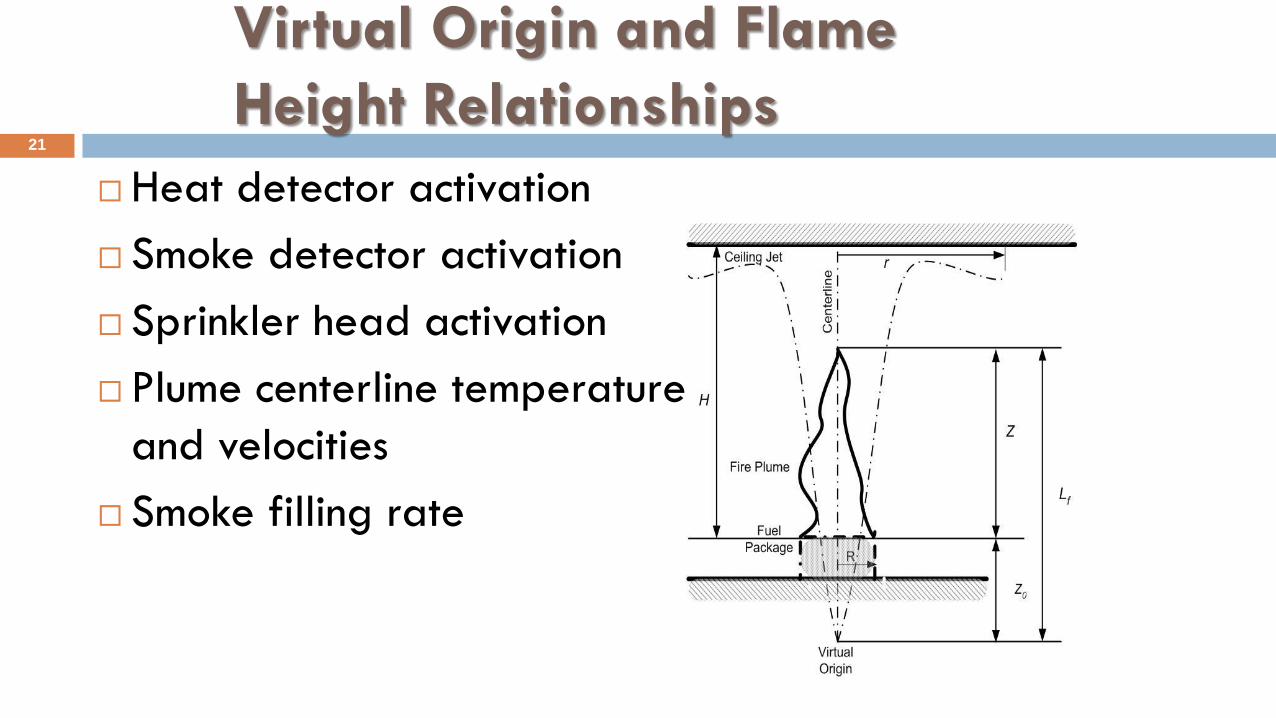
Virtual Origin and Flame
Height Relationships
Heat detector activation
Smoke detector activation
Sprinkler head activation
Plume centerline temperatures
and velocities
Smoke filling rate
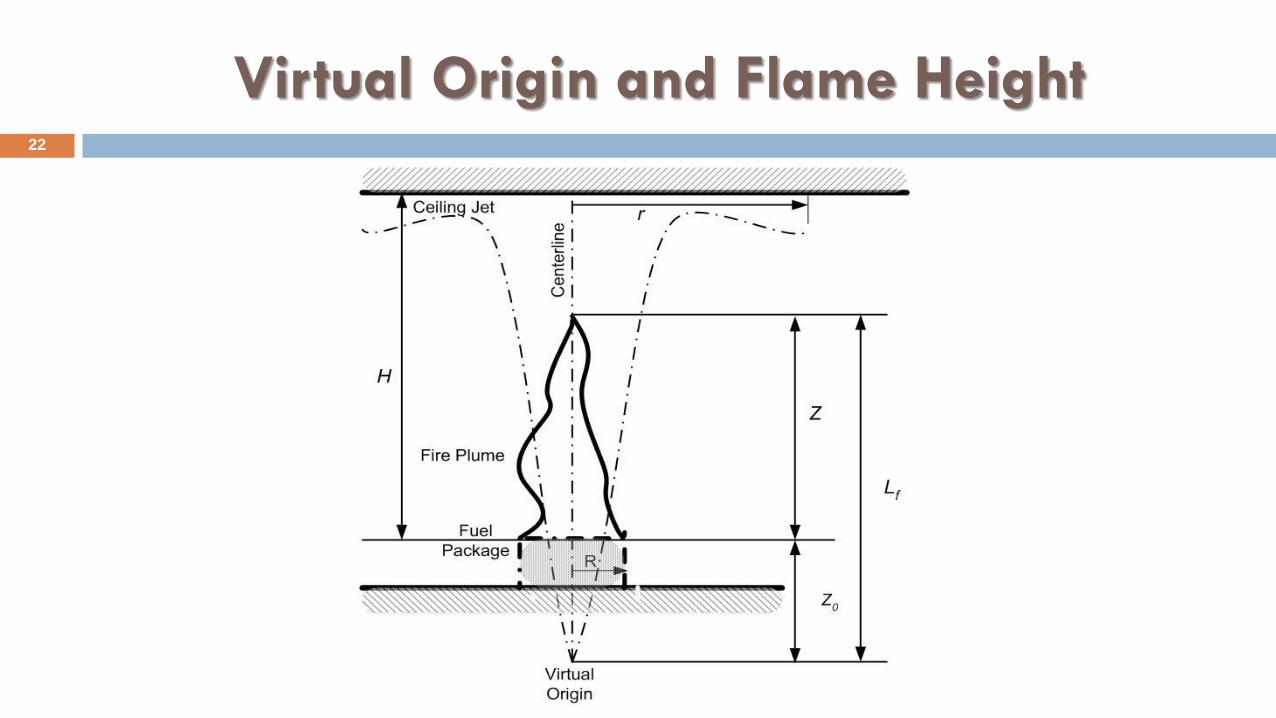
Virtual Origin and Flame Height 22
23
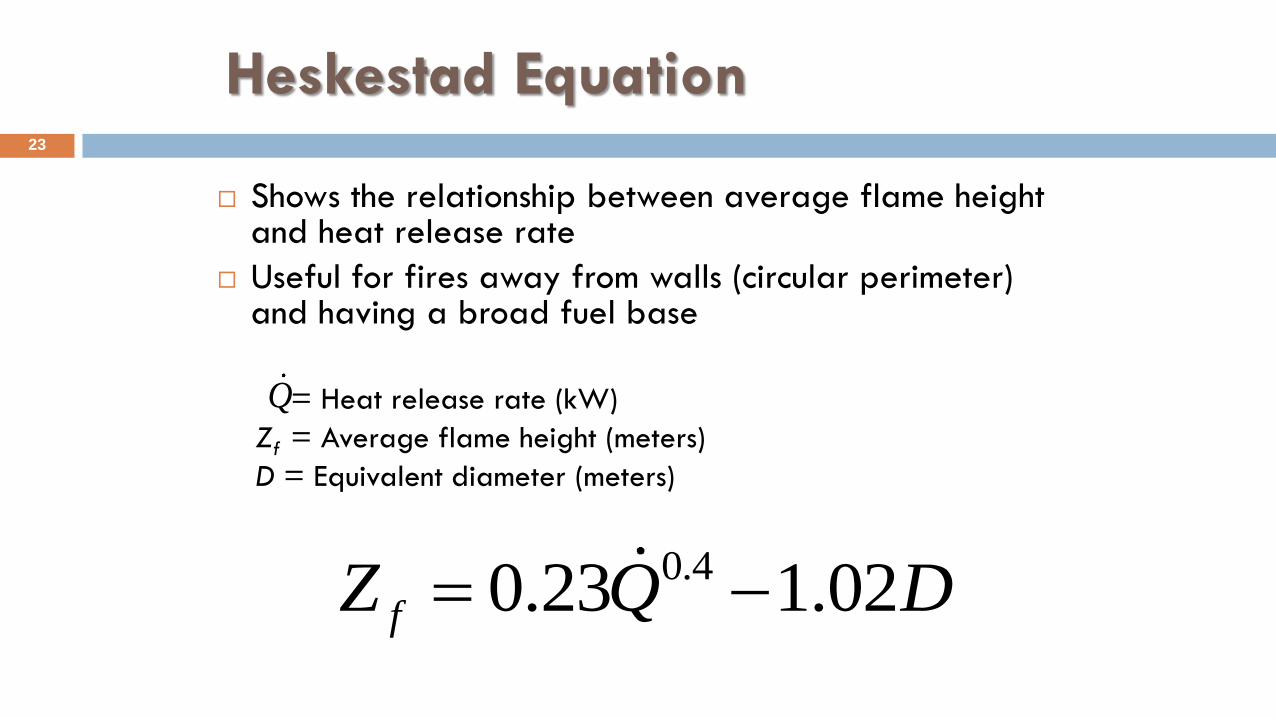
Heskestad Equation
Shows the relationship between average flame height and heat release rate
Useful for fires away from walls (circular perimeter) and having a broad fuel base
= Heat release rate (kW)
Zf = Average flame height (meters)
D = Equivalent diameter (meters)
0.40.23 1.02fZ Q D
Q
24
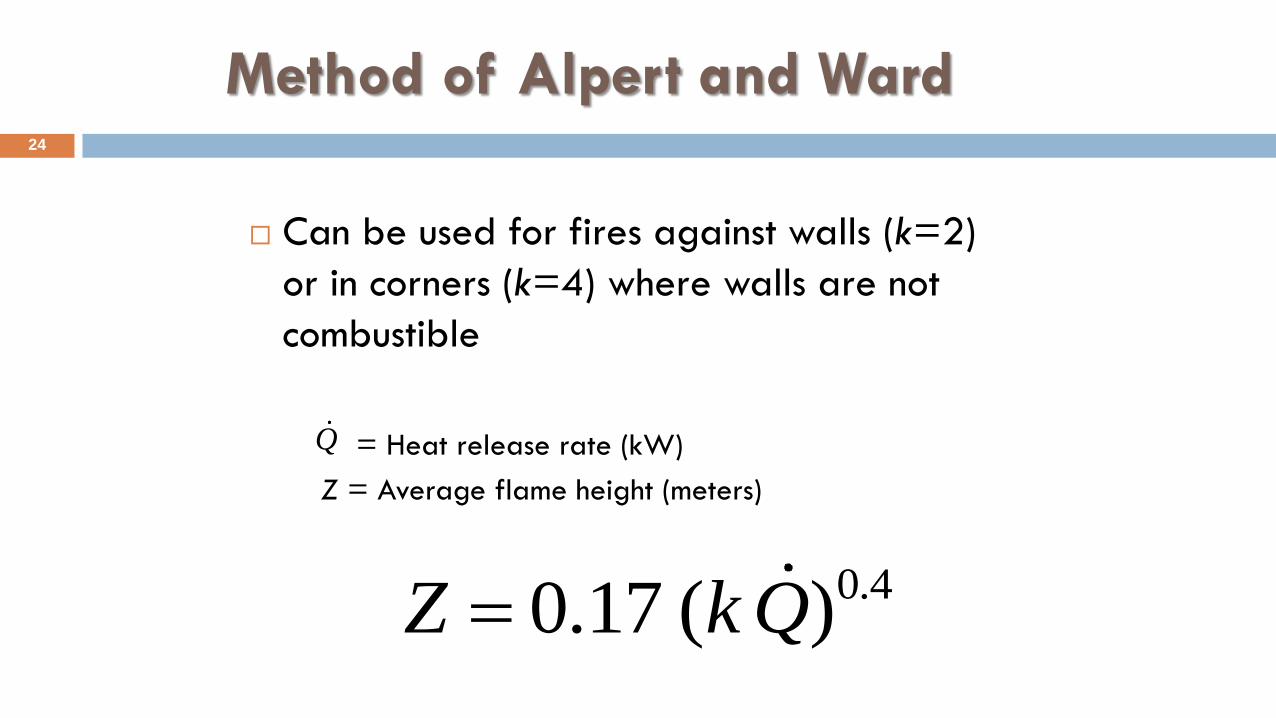
Method of Alpert and Ward
Can be used for fires against walls (k=2)
or in corners (k=4) where walls are not
combustible
= Heat release rate (kW)
Z = Average flame height (meters)
0.40.17 ( )Z k Q
Q
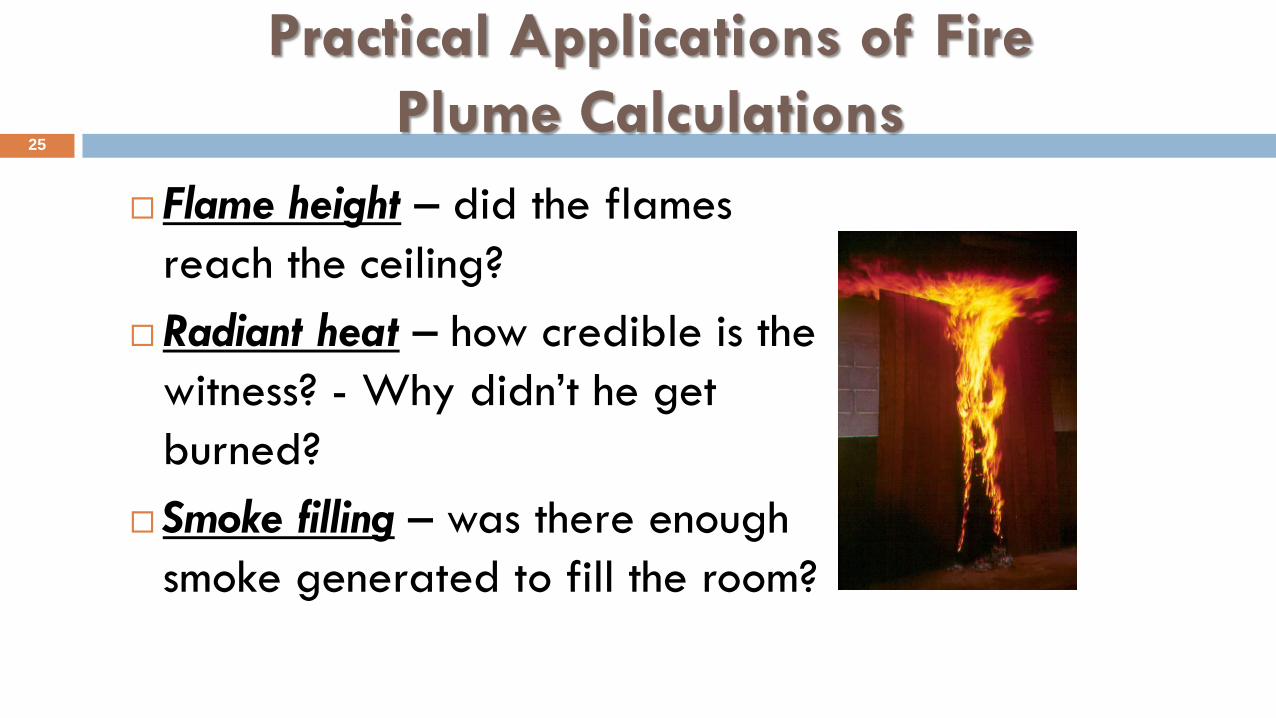
Practical Applications of Fire
Plume Calculations 25
Flame height – did the flames
reach the ceiling?
Radiant heat – how credible is the
witness? - Why didn’t he get
burned?
Smoke filling – was there enough
smoke generated to fill the room?
26
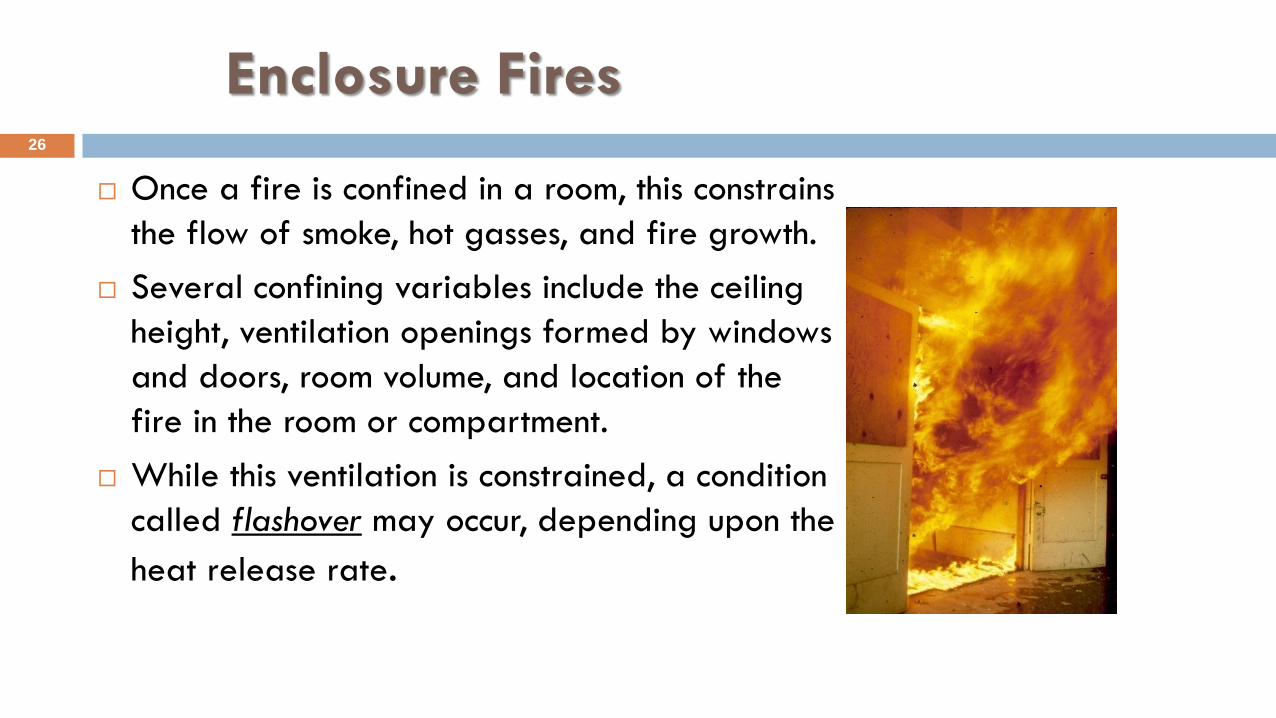
Enclosure Fires
Once a fire is confined in a room, this constrains
the flow of smoke, hot gasses, and fire growth.
Several confining variables include the ceiling
height, ventilation openings formed by windows
and doors, room volume, and location of the
fire in the room or compartment.
While this ventilation is constrained, a condition
called flashover may occur, depending upon the
heat release rate.
NFPA 555: Guide for Evaluating
Potential for Room Flashover 27
Addresses methods for evaluating the potential for room flashover:
Prevention of ignition
Installation of automatic fire suppression systems
Control of ventilation factors
Limitation of the heat release rate of room contents, furnishings, and interior finish
Accuracy, precision, and relevance are a function of the data from the test methods and calculations used.
These techniques can help minimize the probability of flashover or delay its occurrence, but might not prevent it.
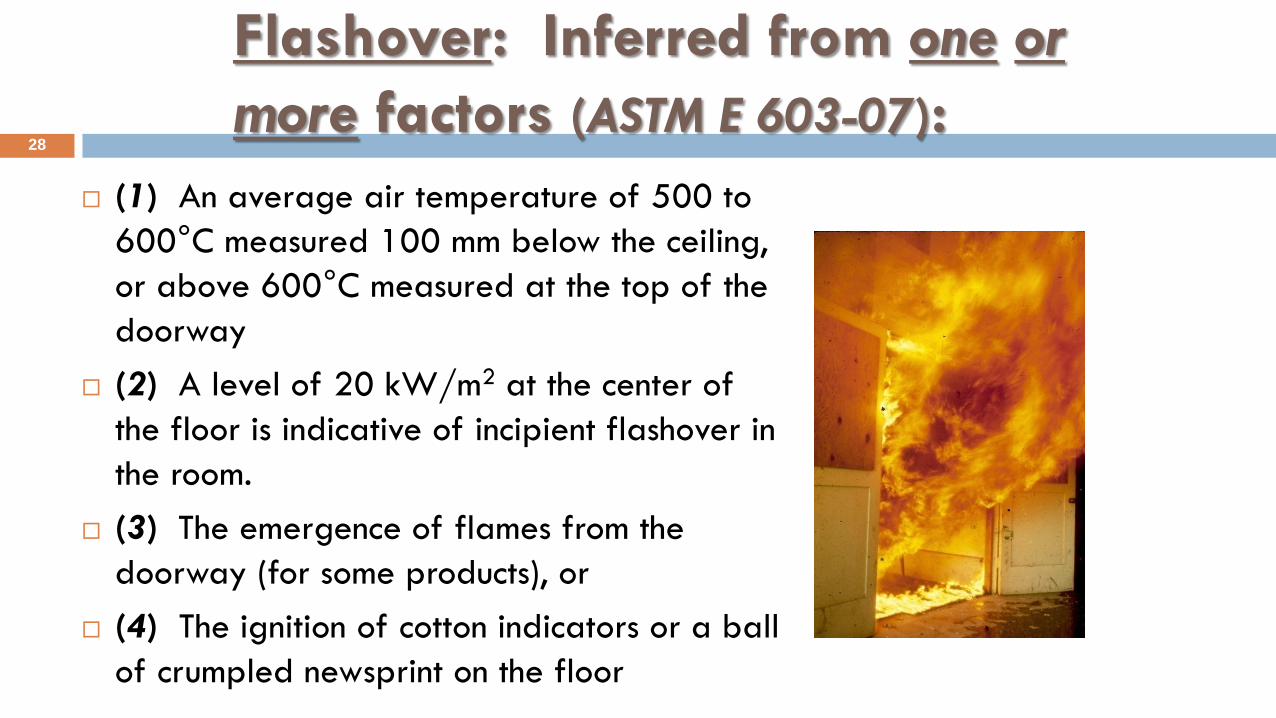
Flashover: Inferred from one or
more factors (ASTM E 603-07):
(1) An average air temperature of 500 to
600°C measured 100 mm below the ceiling,
or above 600°C measured at the top of the
doorway
(2) A level of 20 kW/m2 at the center of
the floor is indicative of incipient flashover in
the room.
(3) The emergence of flames from the
doorway (for some products), or
(4) The ignition of cotton indicators or a ball
of crumpled newsprint on the floor
28
29
Practical Reasons for Investigators
to Consider Flashover
Flashover conditions may mask pre-existing fire
burn patterns
Flashover may produce burn patterns consistent
with suspected accelerated fires (irregular floor
patterns, floor penetrations)
Eliminates the confusion of eyewitness reports of
“roll-over” and “flame over”
Class Quiz 30
What observations are needed to
determine if flashover has occurred in
the room of fire origin?
Class Quiz 31
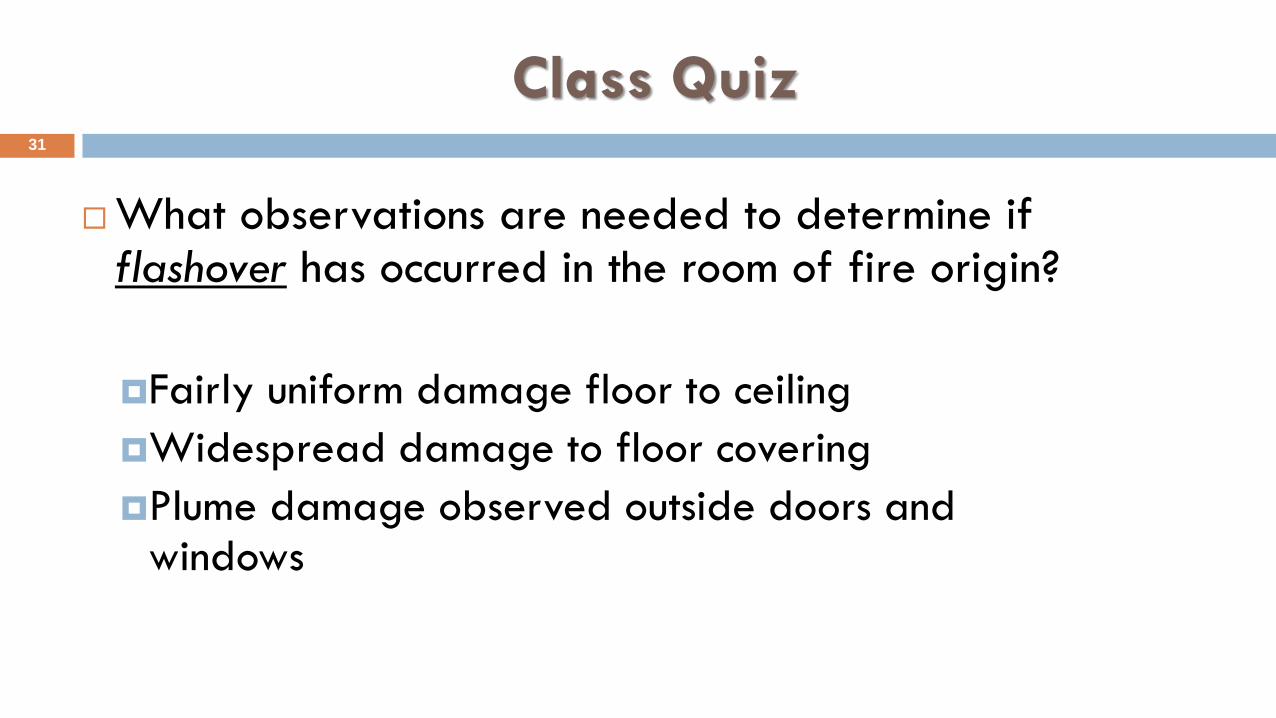
What observations are needed to determine if flashover has occurred in the room of fire origin?
Fairly uniform damage floor to ceiling
Widespread damage to floor covering
Plume damage observed outside doors and windows
32
ENCLOSURE FIRES - Minimum Heat
Release Rate for Flashover
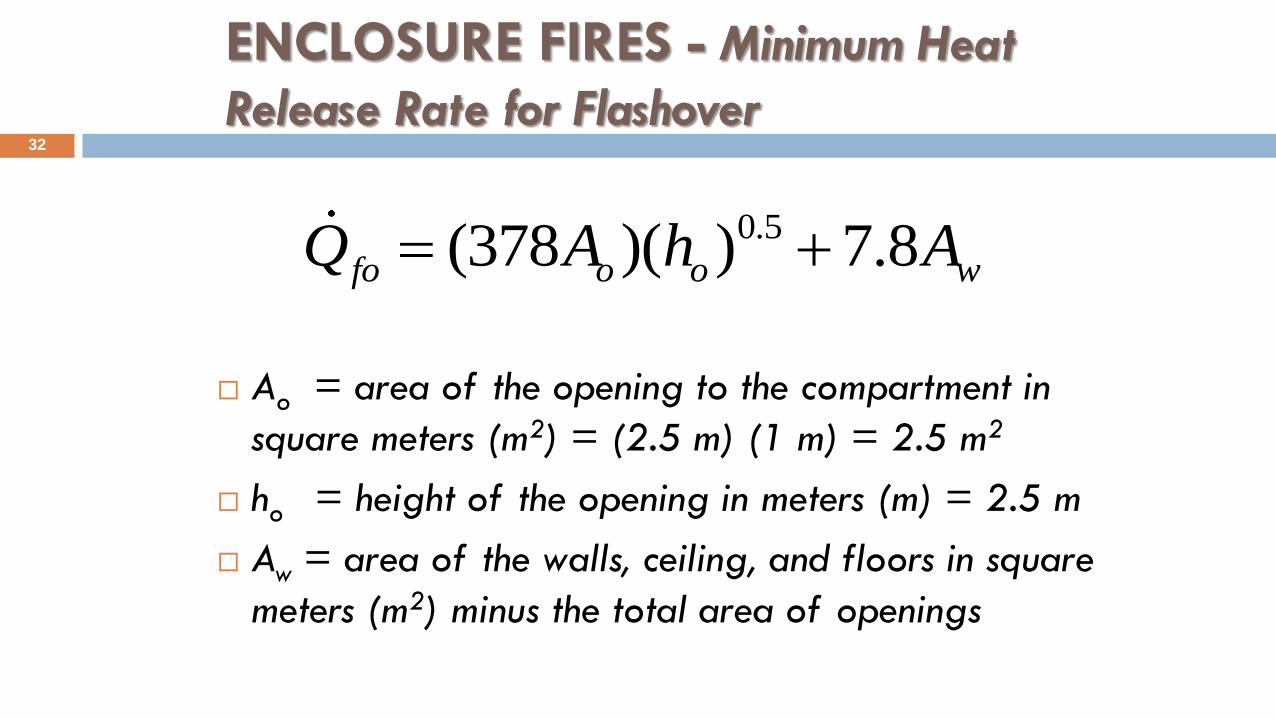
0.5(378 )( ) 7.8fo o o wQ A h A
Ao = area of the opening to the compartment in
square meters (m2) = (2.5 m) (1 m) = 2.5 m2
ho = height of the opening in meters (m) = 2.5 m
Aw = area of the walls, ceiling, and floors in square
meters (m2) minus the total area of openings
33
ENCLOSURE FIRES - Minimum Heat
Release Rate for Flashover
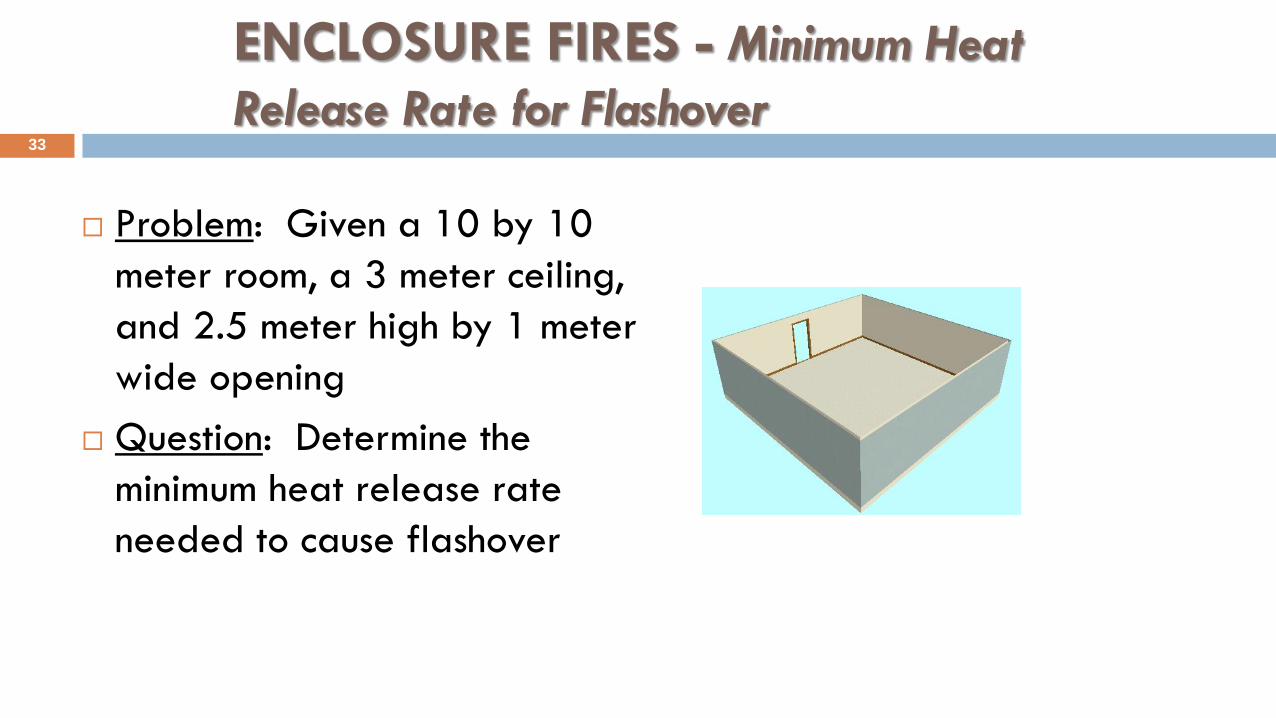
Problem: Given a 10 by 10
meter room, a 3 meter ceiling,
and 2.5 meter high by 1 meter
wide opening
Question: Determine the
minimum heat release rate
needed to cause flashover
34
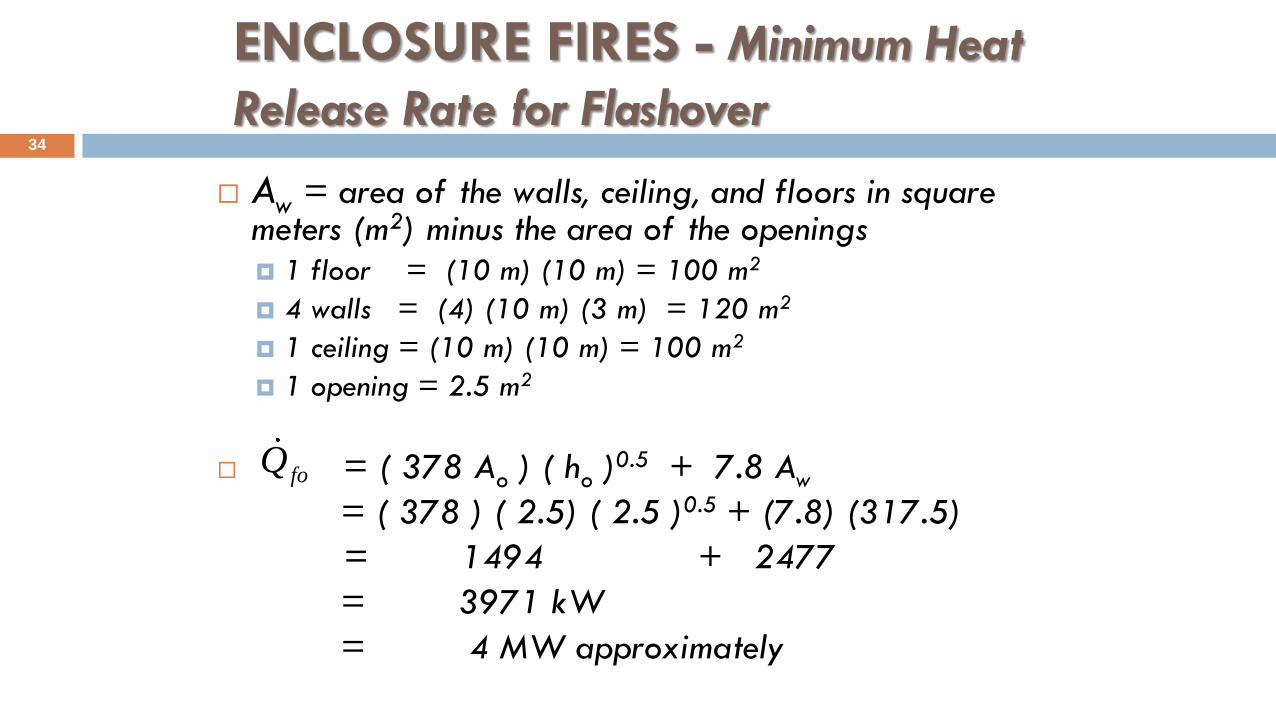
ENCLOSURE FIRES - Minimum Heat
Release Rate for Flashover
Aw = area of the walls, ceiling, and floors in square meters (m2) minus the area of the openings 1 floor = (10 m) (10 m) = 100 m2
4 walls = (4) (10 m) (3 m) = 120 m2
1 ceiling = (10 m) (10 m) = 100 m2
1 opening = 2.5 m2
= ( 378 Ao ) ( ho )0.5 + 7.8 Aw
= ( 378 ) ( 2.5) ( 2.5 )0.5 + (7.8) (317.5)
= 1494 + 2477
= 3971 kW
= 4 MW approximately
foQ
ENCLOSURE FIRES - Minimum Heat Release
Rate for Flashover using Fire Dynamic Tools 35
First line computer model contained in
spreadsheet calculation format
Developed by and can be obtained from the
Nuclear Regulatory Commission (NRC) see
website: ( http://www.nrc.gov/ )
NRC website contains both on-line manual and
latest spreadsheets
Example Problem Using FDTs
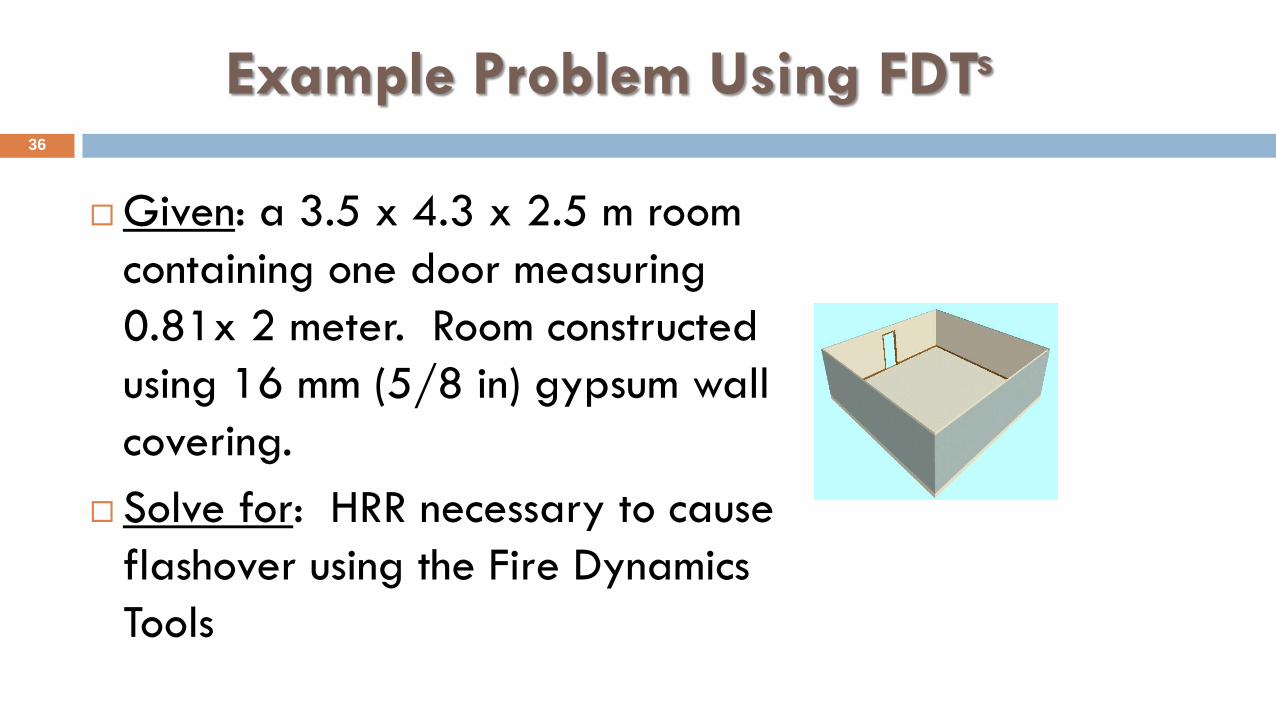
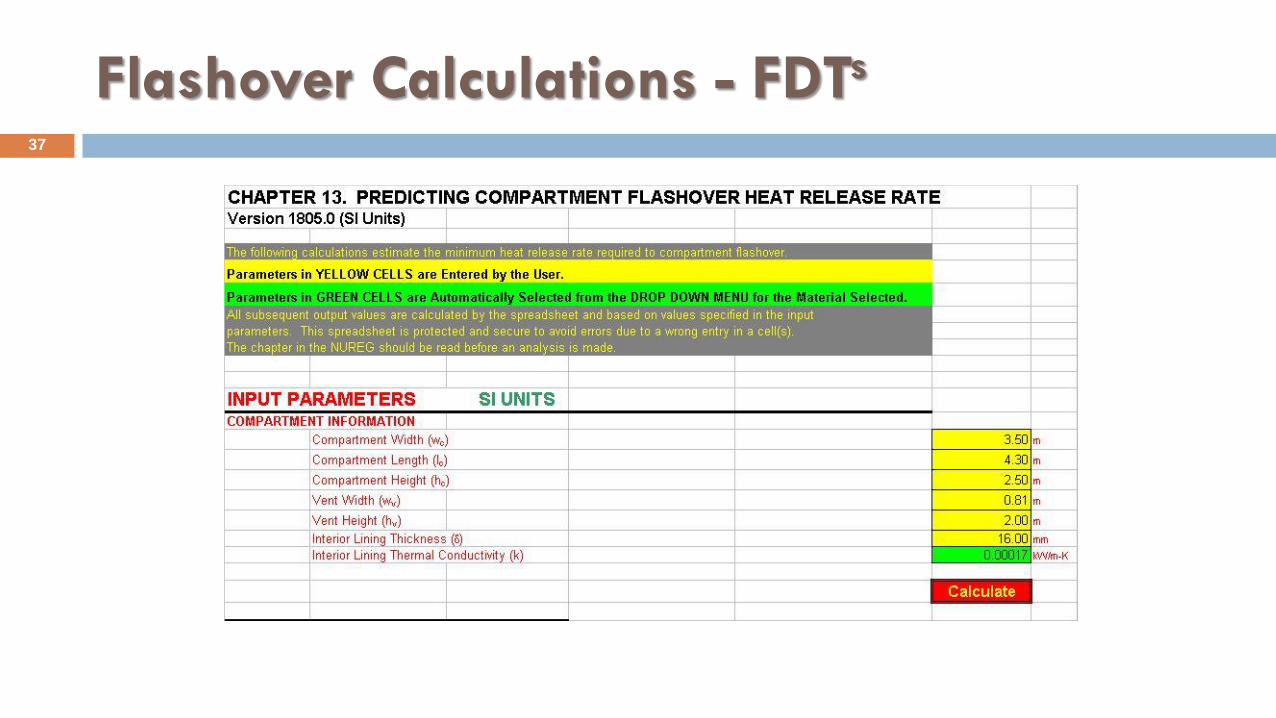
Given: a 3.5 x 4.3 x 2.5 m room
containing one door measuring
0.81x 2 meter. Room constructed
using 16 mm (5/8 in) gypsum wall
covering.
Solve for: HRR necessary to cause
flashover using the Fire Dynamics
Tools
36
Flashover Calculations - FDTs
37
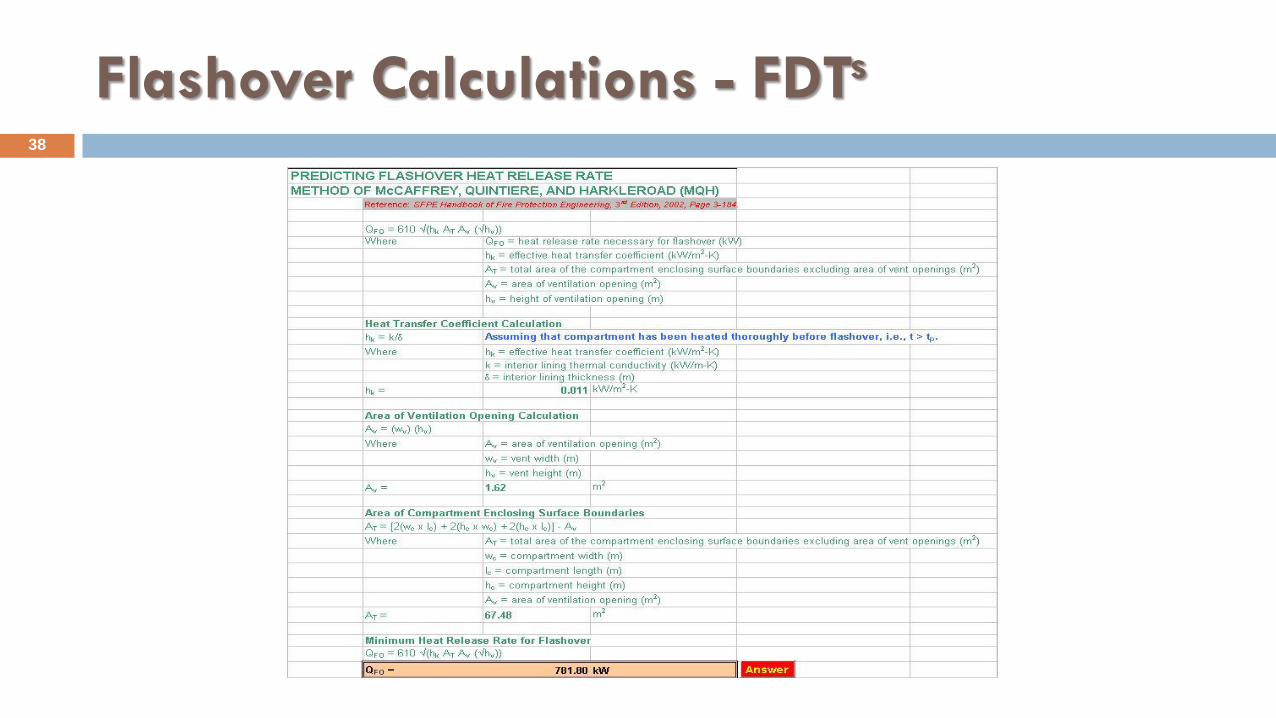
Flashover Calculations - FDTs
38
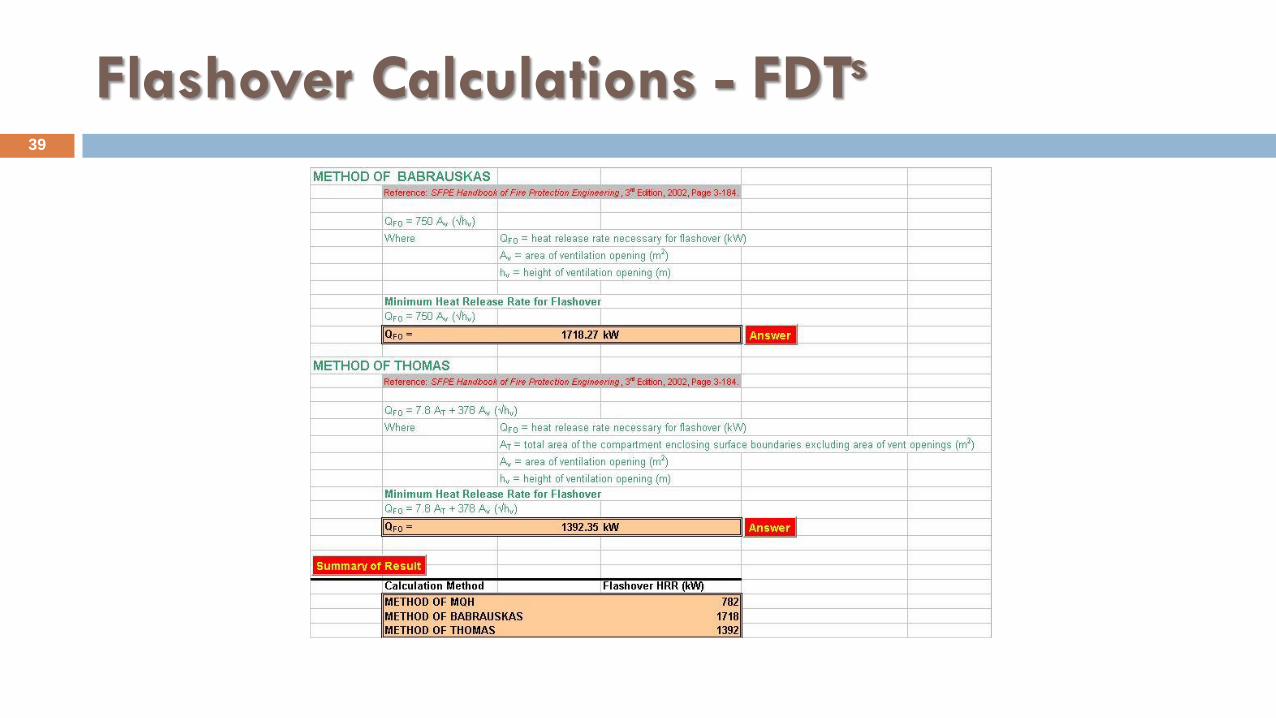
Flashover Calculations - FDTs
39
Importance of Multiple HRR Calculations for
Flashover 40
Each method has different data and variables
Supports validation of hypothesis testing
Illustrates the variability of mathematical models
Other Enclosure Relationships 41
Estimated radiant heat transfer
Burn injuries, exposure to other targets
Estimated heat/smoke detector and sprinkler response time
Time line analysis from incipient fire to activation of fire protection systems
Pre-flashover compartment fire temperatures
Habitability analysis
Smoke filling rate
Estimation of visibility
Fire Patterns
Fire Pattern Testing
Fire Pattern Examples
3.4 FIRE PATTERNS
3.4 FIRE PATTERNS 43
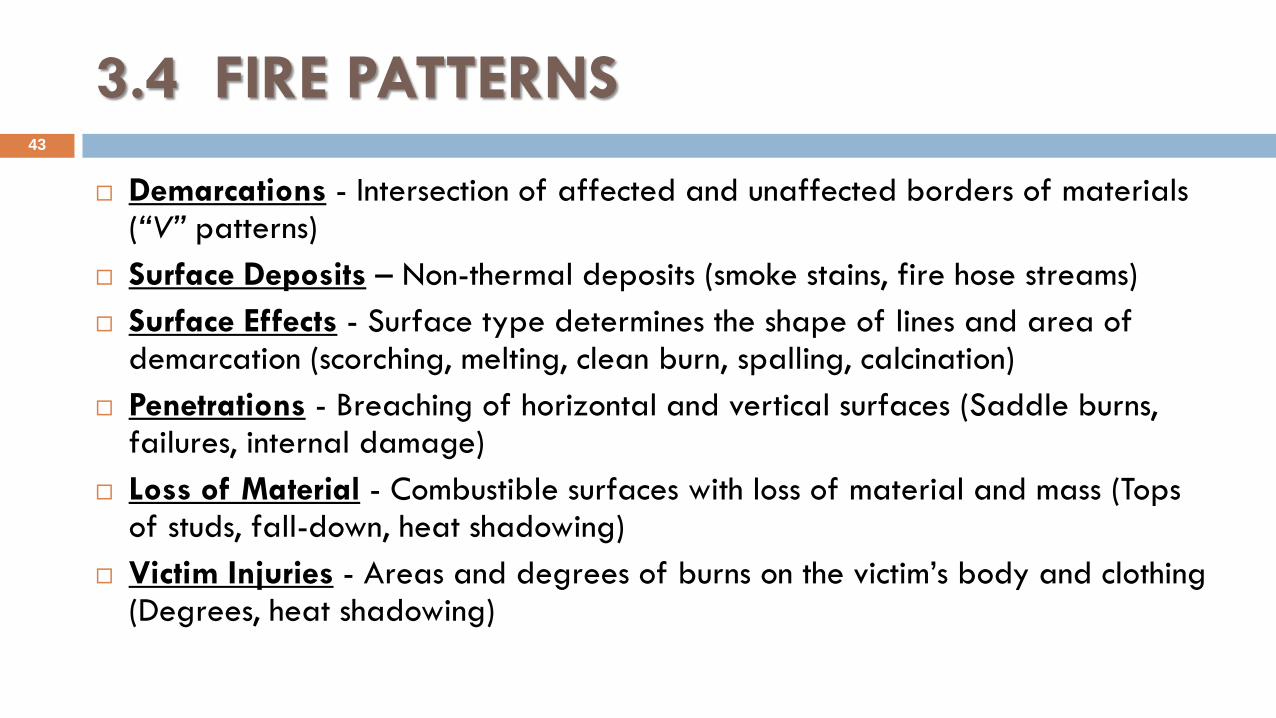
Demarcations - Intersection of affected and unaffected borders of materials (“V” patterns)
Surface Deposits – Non-thermal deposits (smoke stains, fire hose streams)
Surface Effects - Surface type determines the shape of lines and area of demarcation (scorching, melting, clean burn, spalling, calcination)
Penetrations - Breaching of horizontal and vertical surfaces (Saddle burns, failures, internal damage)
Loss of Material - Combustible surfaces with loss of material and mass (Tops of studs, fall-down, heat shadowing)
Victim Injuries - Areas and degrees of burns on the victim’s body and clothing (Degrees, heat shadowing)
Fire Pattern Testing 44
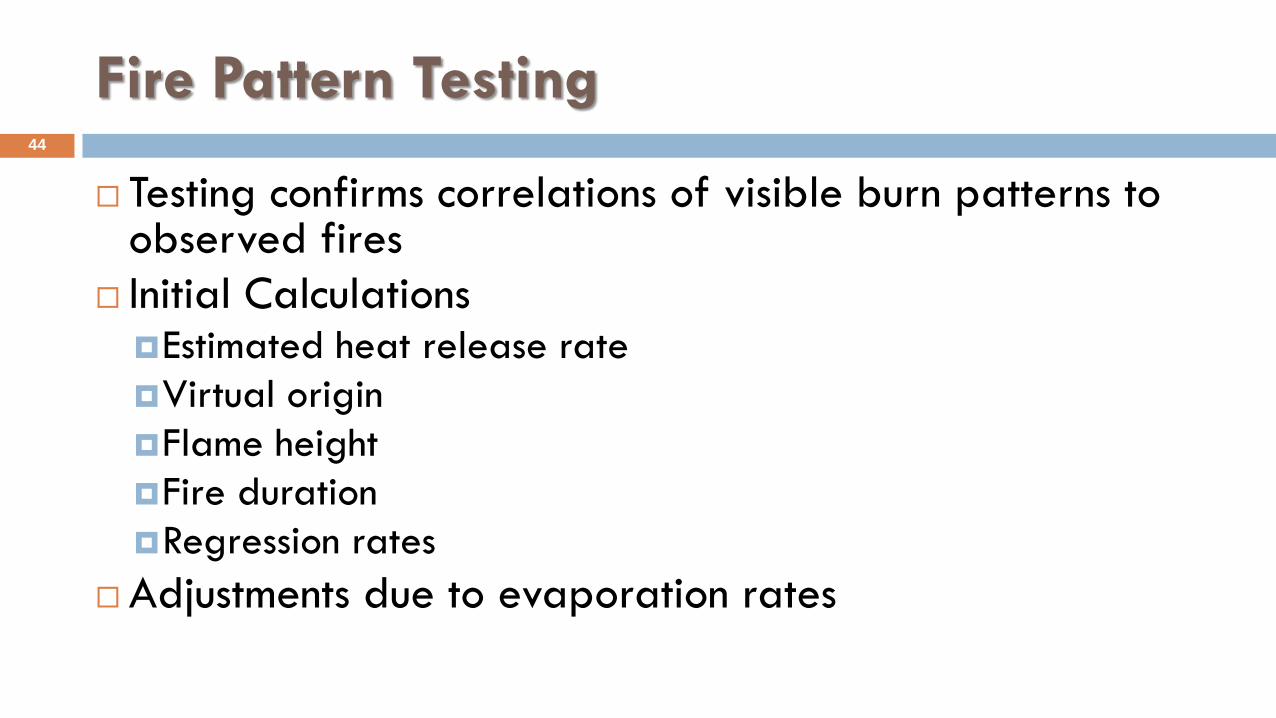
Testing confirms correlations of visible burn patterns to observed fires
Initial Calculations Estimated heat release rate
Virtual origin
Flame height
Fire duration
Regression rates
Adjustments due to evaporation rates
45
Fire Pattern Examples
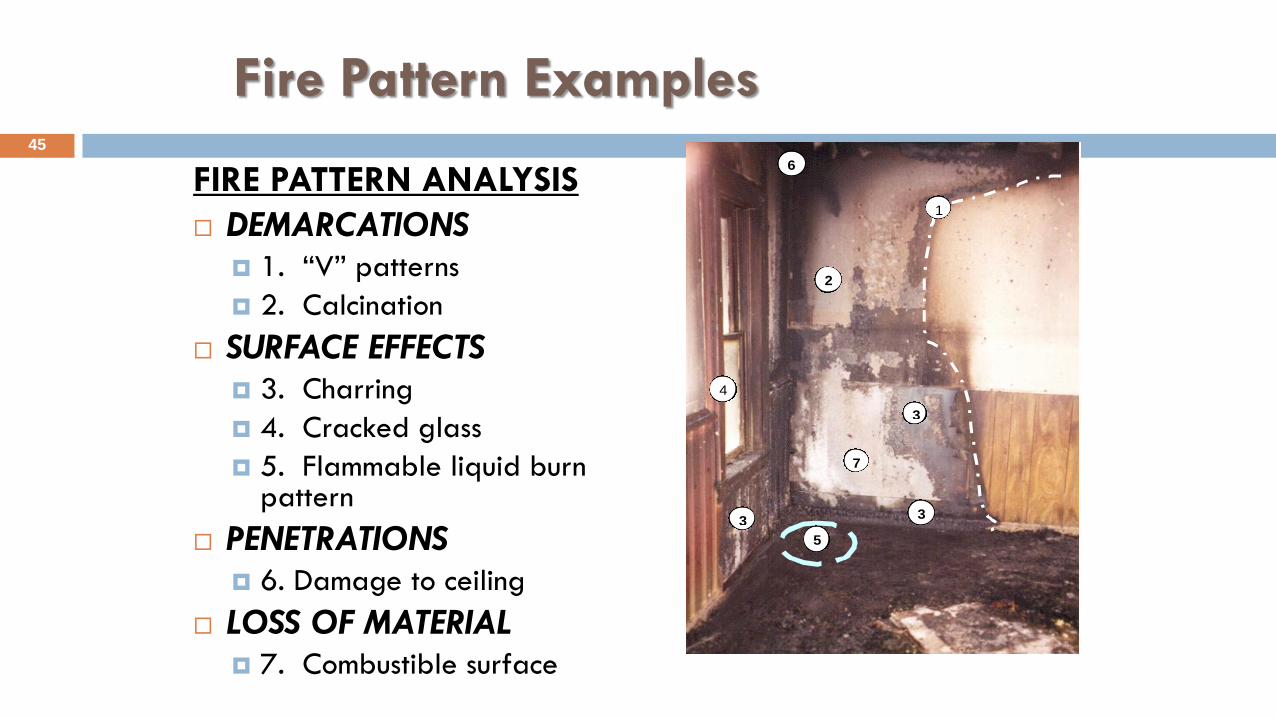
FIRE PATTERN ANALYSIS
DEMARCATIONS 1. “V” patterns
2. Calcination
SURFACE EFFECTS 3. Charring
4. Cracked glass
5. Flammable liquid burn pattern
PENETRATIONS 6. Damage to ceiling
LOSS OF MATERIAL 7. Combustible surface
1
3
6
2
5
3
4
3
7
Fire Pattern Examples
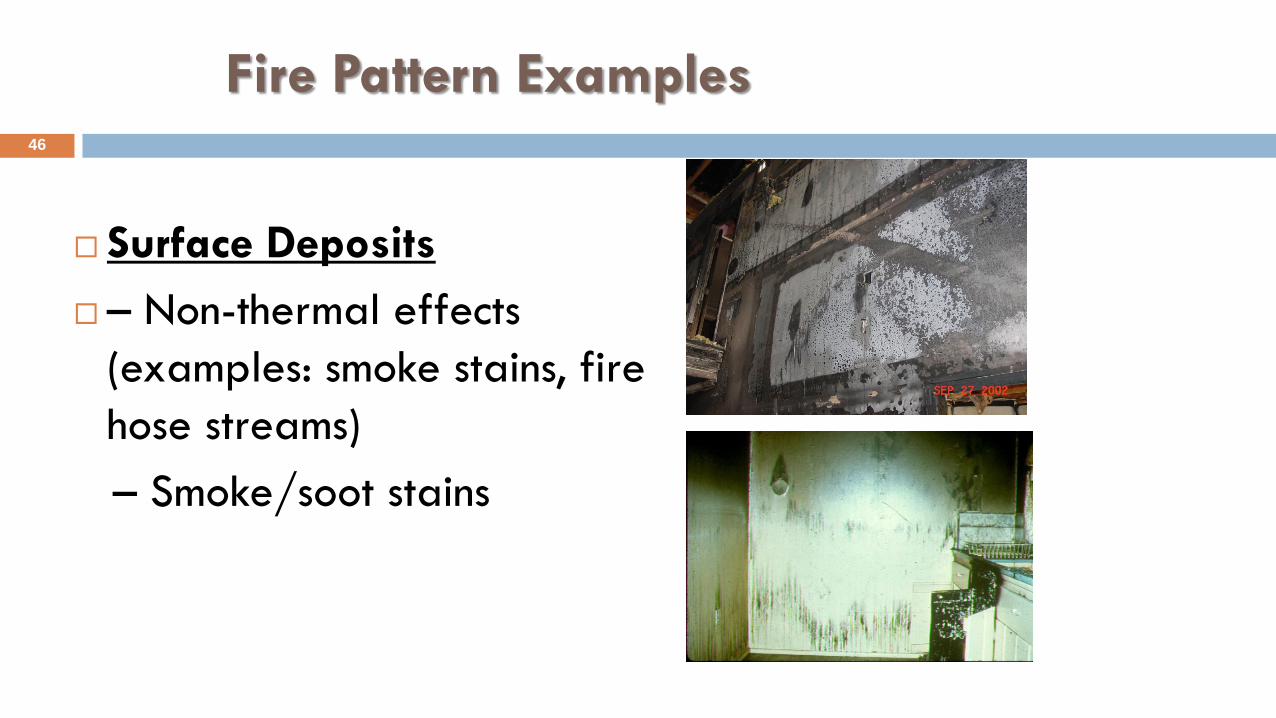
Surface Deposits
– Non-thermal effects
(examples: smoke stains, fire
hose streams)
– Smoke/soot stains
46
Glass Breakage
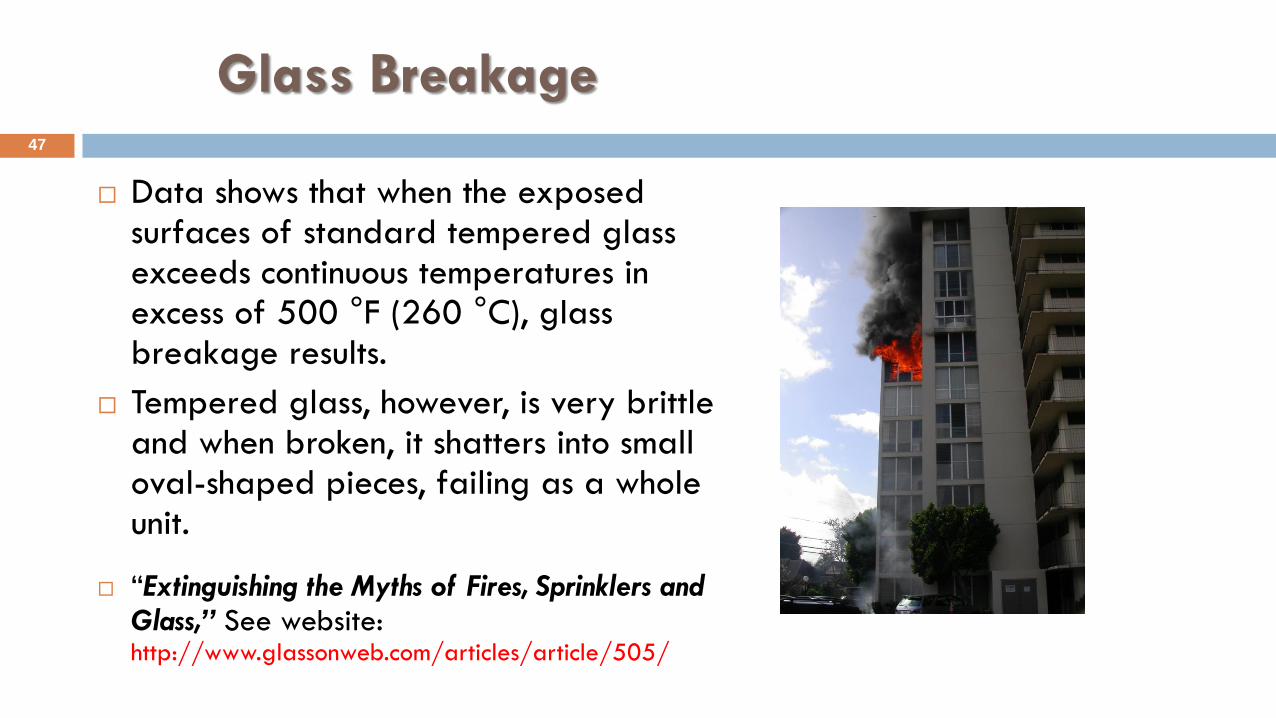
Data shows that when the exposed surfaces of standard tempered glass exceeds continuous temperatures in excess of 500 °F (260 °C), glass breakage results.
Tempered glass, however, is very brittle and when broken, it shatters into small oval-shaped pieces, failing as a whole unit.
“Extinguishing the Myths of Fires, Sprinklers and Glass,” See website: http://www.glassonweb.com/articles/article/505/
47
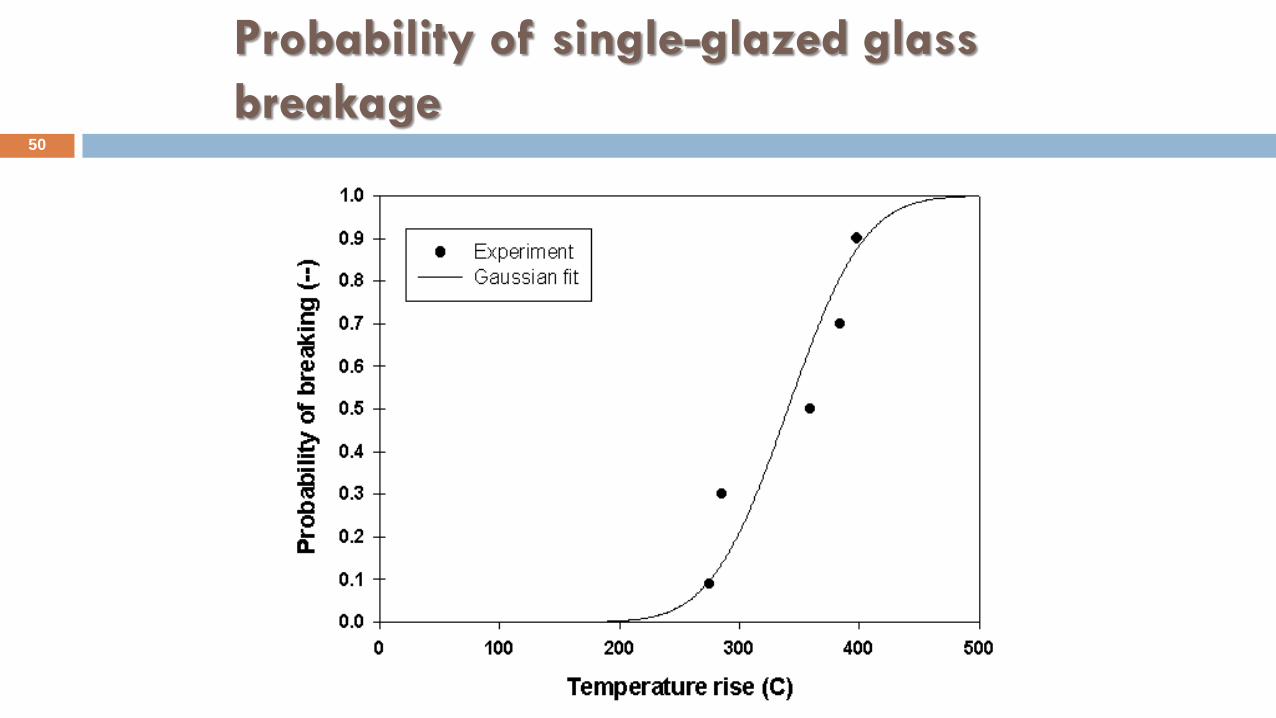
Glass Breakage 48
Single-glazed glass requires a much higher temperature to cause
breakage. This prediction is based upon results concerning glass
exposed to a uniform hot temperature come from the Building
Research Institute (BRI) of Japan.
Although only single-glazed, 3 mm thick window glass was studied,
tests developed a probability graph could be plotted as a function of
temperature rise above ambient
Probability of single-glazed glass breakage 49
The data shows that the Gaussian fit that can correlate
this data corresponds to a mean temperature rise of 644
°F (340 °C) corresponding to 50 percent probability of
breakage, along with a standard deviation of 122 °F
(50 °C).
T. Tanaka, et al., 1998. “Performance-Based Fire Safety Design
of a High-rise Office Building,” Building Research Institute, Japan.
V. Babrauskas, “Glass Breakage,” Fire Science and Technology,
Inc. , see website: www.doctorfire.com/glass.html
Probability of single-glazed glass
breakage 50
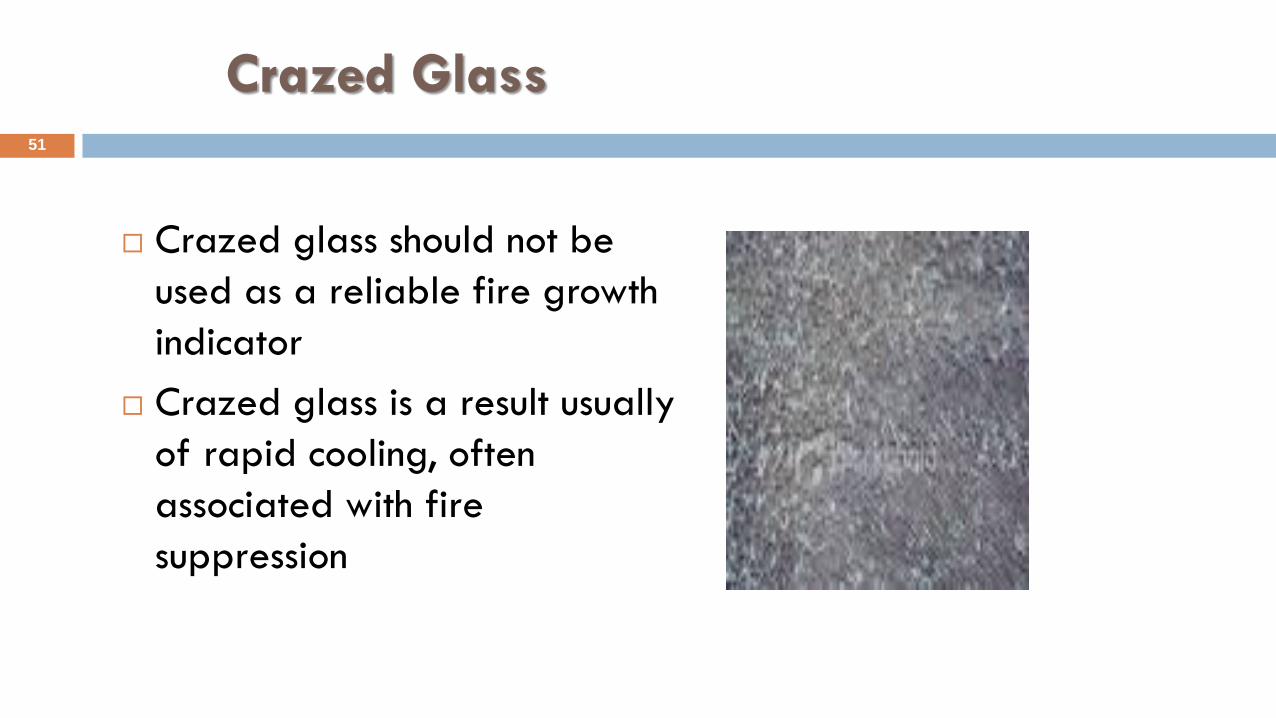
Crazed Glass
Crazed glass should not be
used as a reliable fire growth
indicator
Crazed glass is a result usually
of rapid cooling, often
associated with fire
suppression
51
52
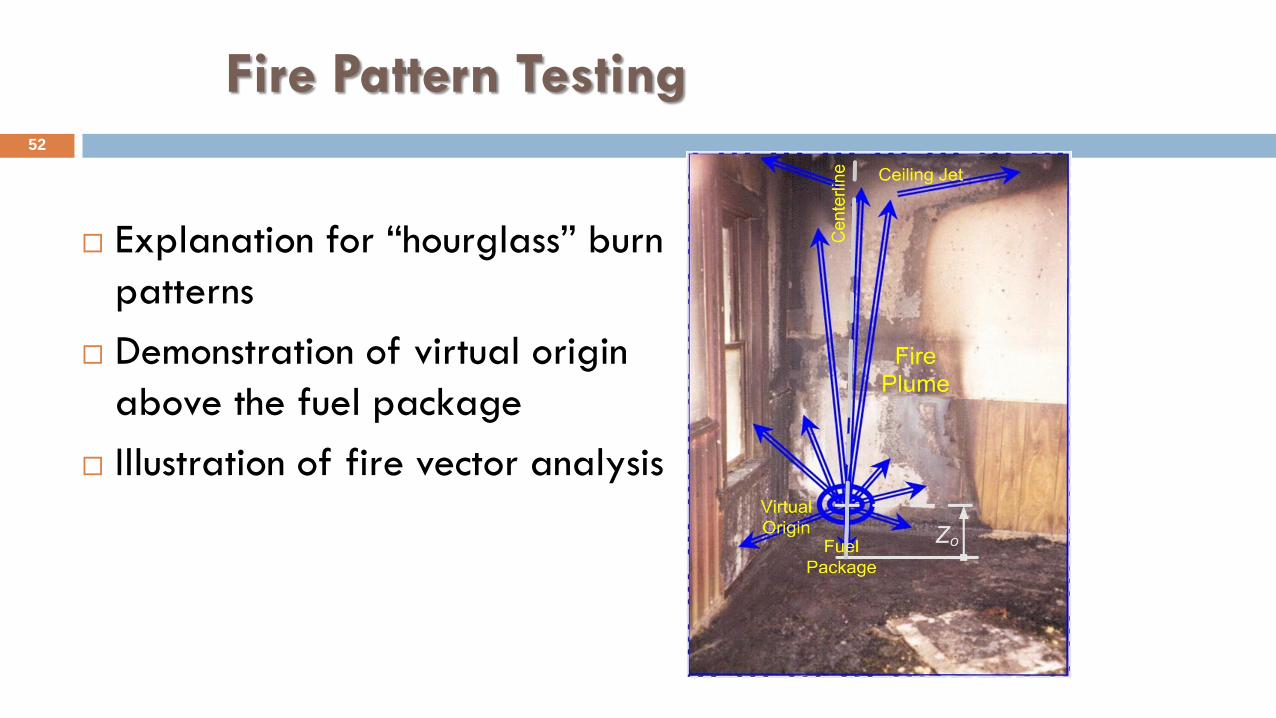
Fire Pattern Testing
Explanation for “hourglass” burn
patterns
Demonstration of virtual origin
above the fuel package
Illustration of fire vector analysis
53
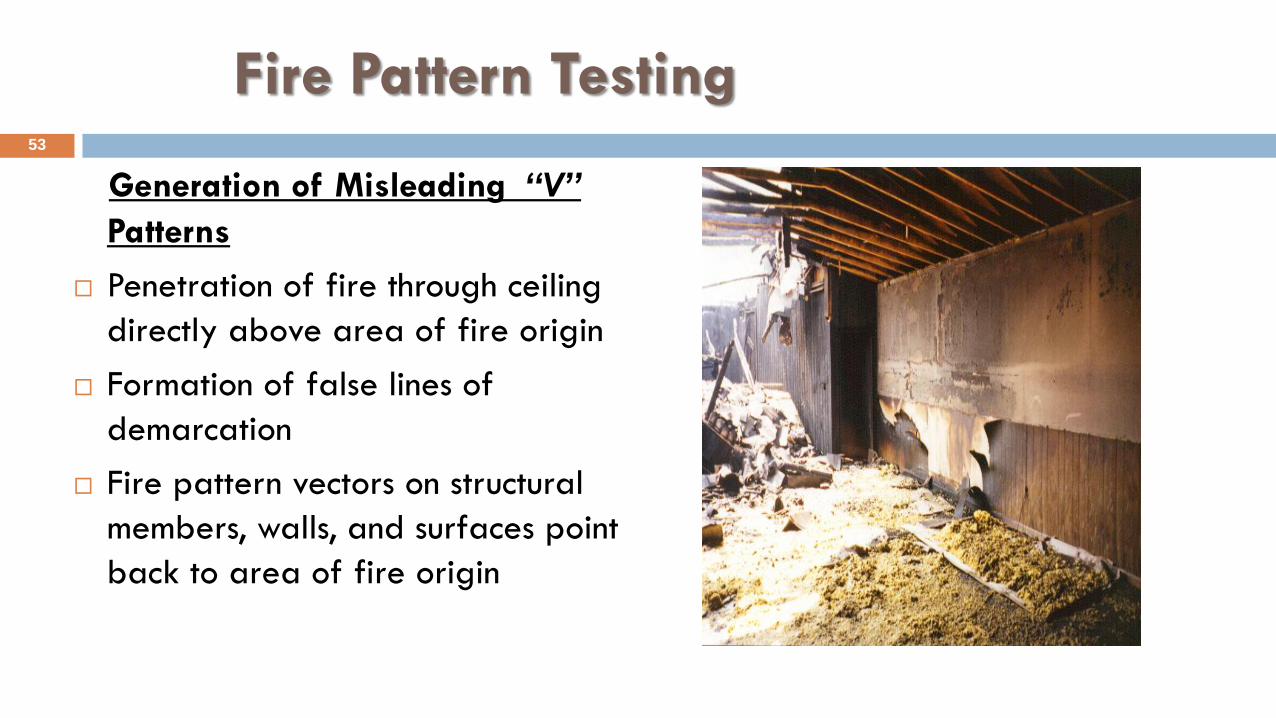
Fire Pattern Testing
Generation of Misleading “V”
Patterns
Penetration of fire through ceiling
directly above area of fire origin
Formation of false lines of
demarcation
Fire pattern vectors on structural
members, walls, and surfaces point
back to area of fire origin
3.5 INTERPRETING FIRE PLUME
BEHAVIOR 54
Upward and Downward Burning
Fire Intensity
Compartment Fires
Fuel Load
Fire Spread
Enhanced Vertical Fire Spread
Enhanced Downward and Outward Fire Spread
Impact of Radiation
Impact of Fire Suppression
Heat and Smoke Flow
Fire Intensity and Duration
Surface Temperature Impact
Impact of Fire Placement
“TRACING THE FIRE”
55
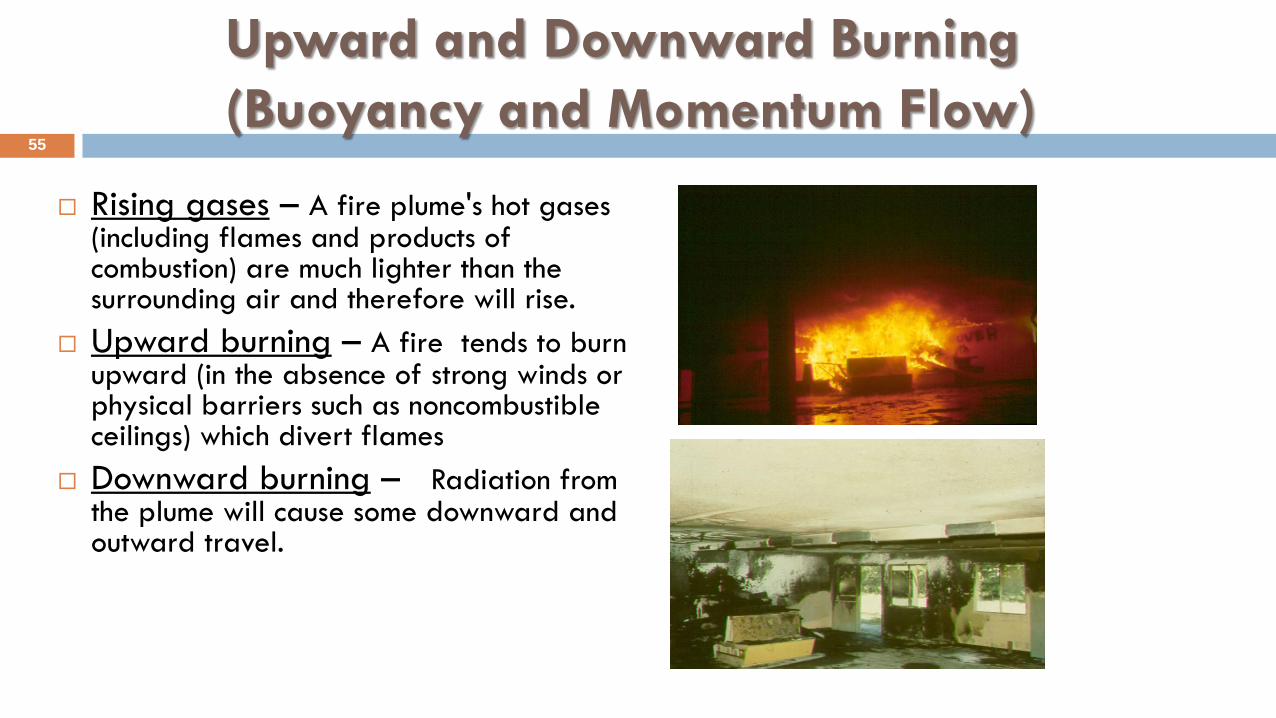
Upward and Downward Burning
(Buoyancy and Momentum Flow)
Rising gases – A fire plume's hot gases (including flames and products of combustion) are much lighter than the surrounding air and therefore will rise.
Upward burning – A fire tends to burn upward (in the absence of strong winds or physical barriers such as noncombustible ceilings) which divert flames
Downward burning – Radiation from the plume will cause some downward and outward travel.
56
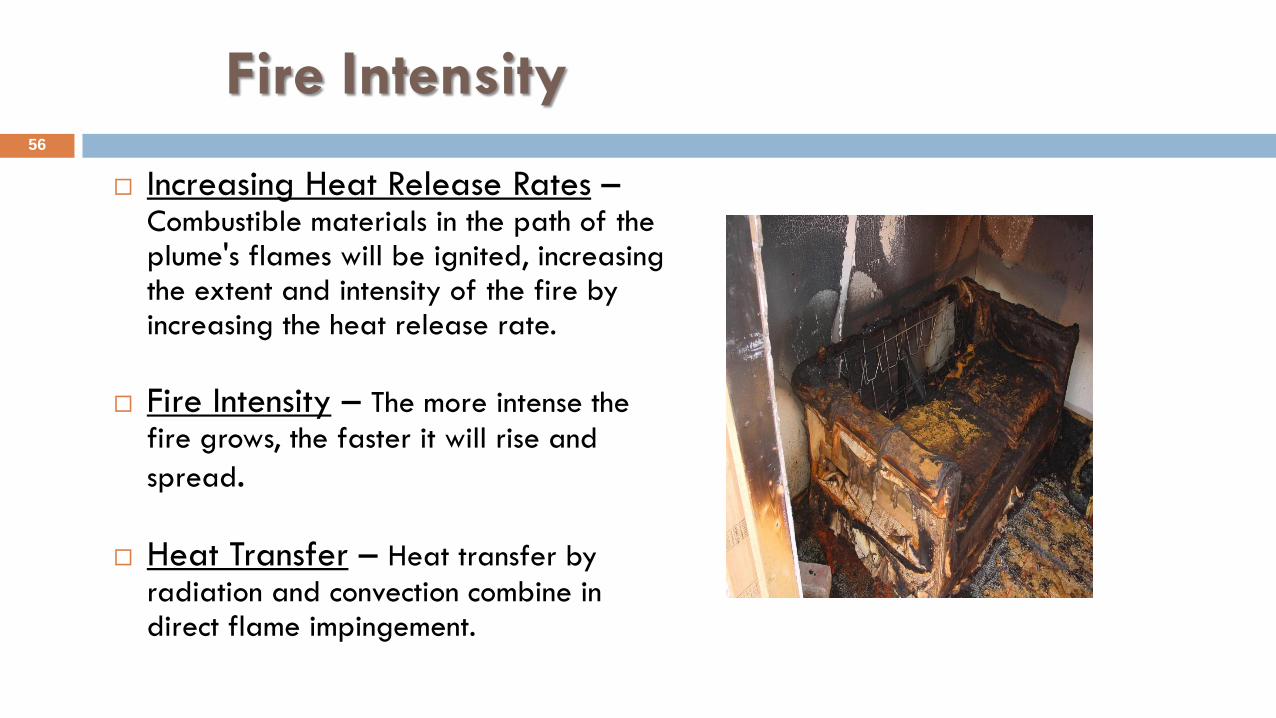
Fire Intensity
Increasing Heat Release Rates – Combustible materials in the path of the plume's flames will be ignited, increasing the extent and intensity of the fire by increasing the heat release rate.
Fire Intensity – The more intense the
fire grows, the faster it will rise and
spread.
Heat Transfer – Heat transfer by
radiation and convection combine in direct flame impingement.
57
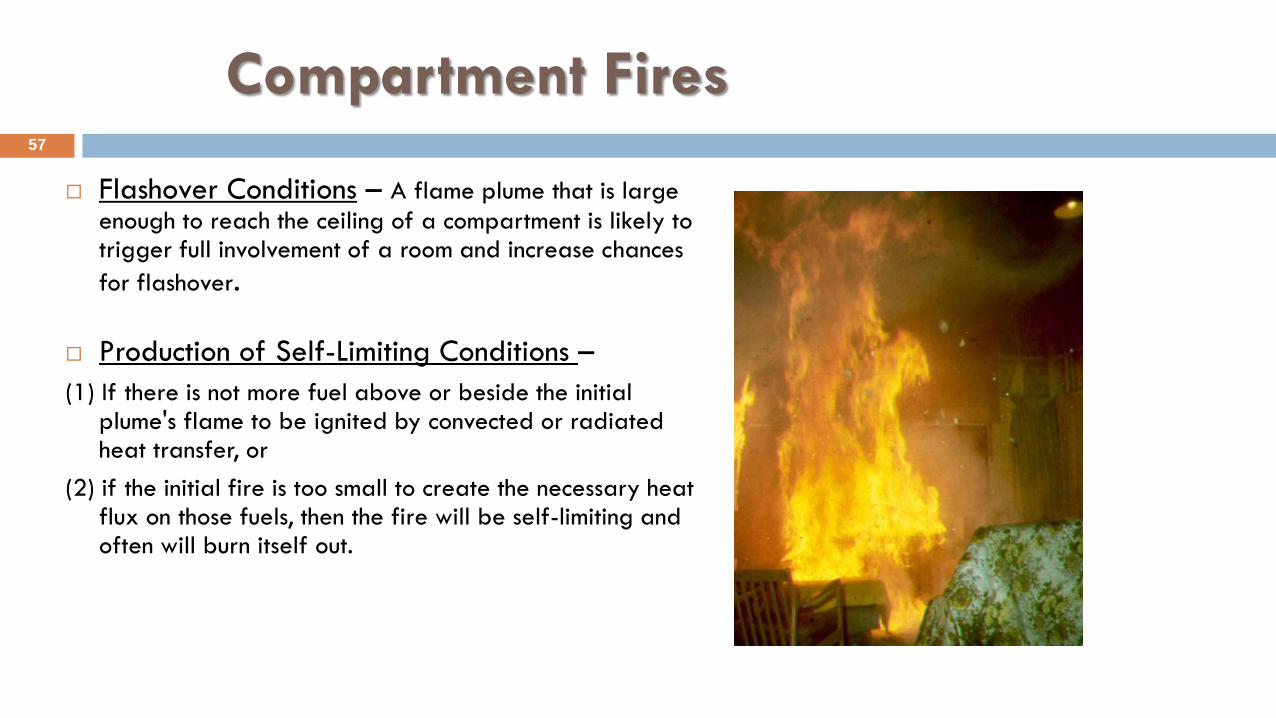
Compartment Fires
Flashover Conditions – A flame plume that is large
enough to reach the ceiling of a compartment is likely to trigger full involvement of a room and increase chances
for flashover.
Production of Self-Limiting Conditions –
(1) If there is not more fuel above or beside the initial plume's flame to be ignited by convected or radiated heat transfer, or
(2) if the initial fire is too small to create the necessary heat flux on those fuels, then the fire will be self-limiting and often will burn itself out.
58
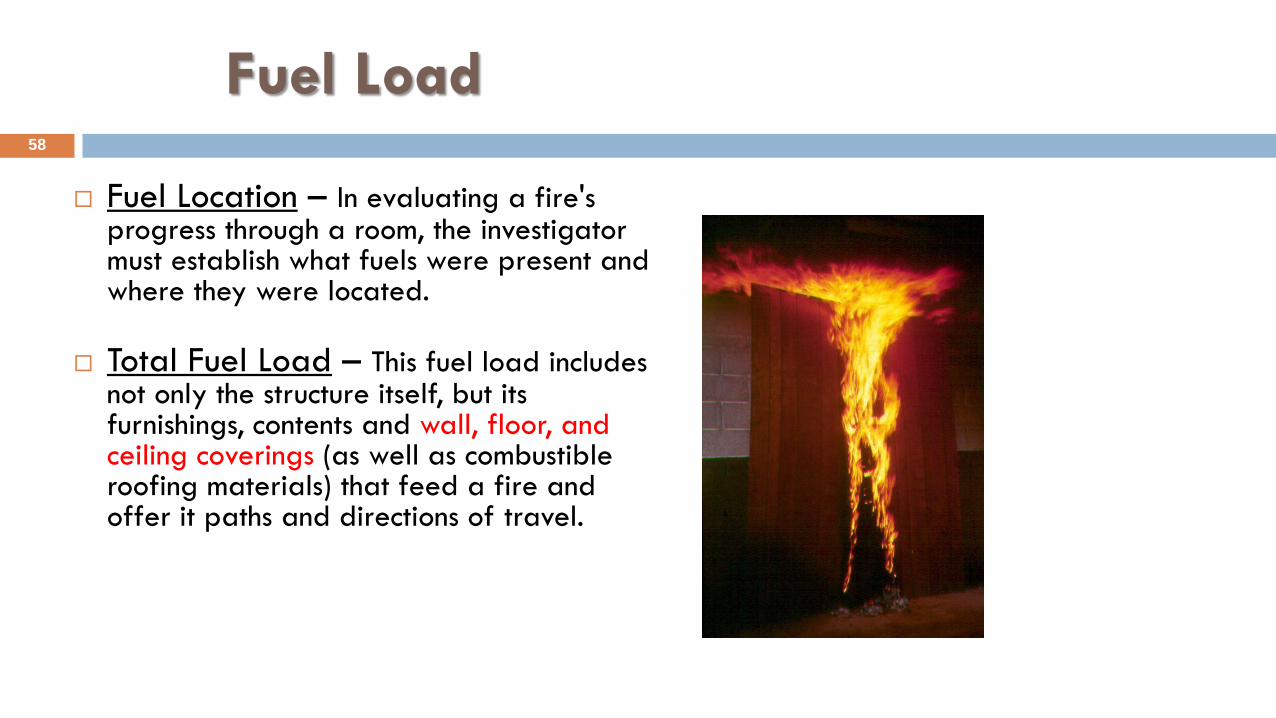
Fuel Load
Fuel Location – In evaluating a fire's progress through a room, the investigator must establish what fuels were present and where they were located.
Total Fuel Load – This fuel load includes not only the structure itself, but its furnishings, contents and wall, floor, and ceiling coverings (as well as combustible roofing materials) that feed a fire and offer it paths and directions of travel.
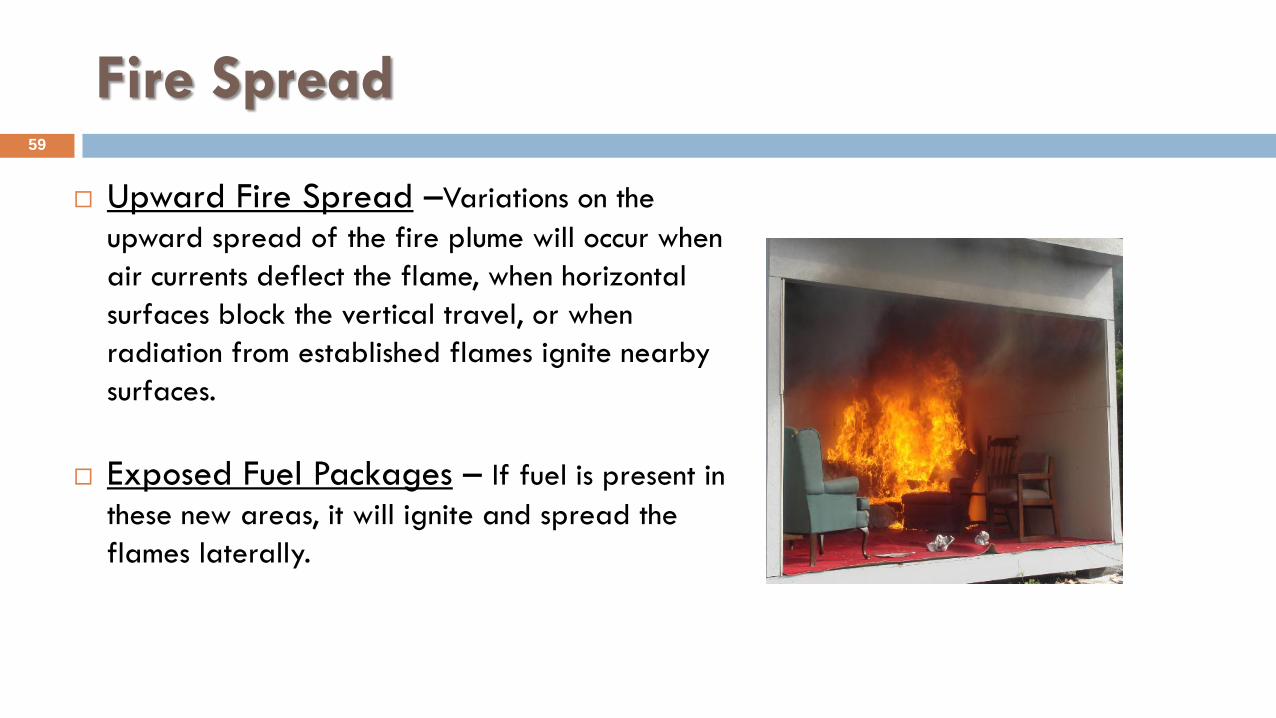
Fire Spread 59
Upward Fire Spread –Variations on the
upward spread of the fire plume will occur when
air currents deflect the flame, when horizontal
surfaces block the vertical travel, or when
radiation from established flames ignite nearby
surfaces.
Exposed Fuel Packages – If fuel is present in
these new areas, it will ignite and spread the
flames laterally.
60
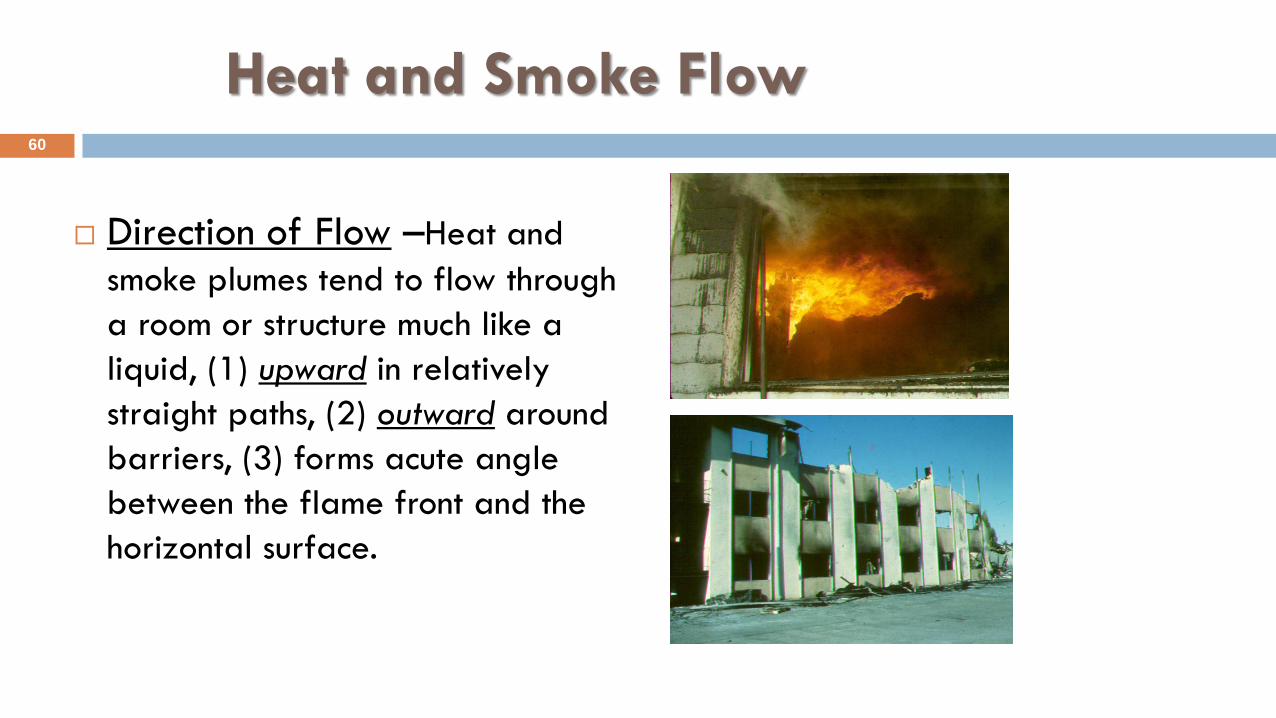
Heat and Smoke Flow
Direction of Flow –Heat and
smoke plumes tend to flow through
a room or structure much like a
liquid, (1) upward in relatively
straight paths, (2) outward around
barriers, (3) forms acute angle
between the flame front and the
horizontal surface.
61
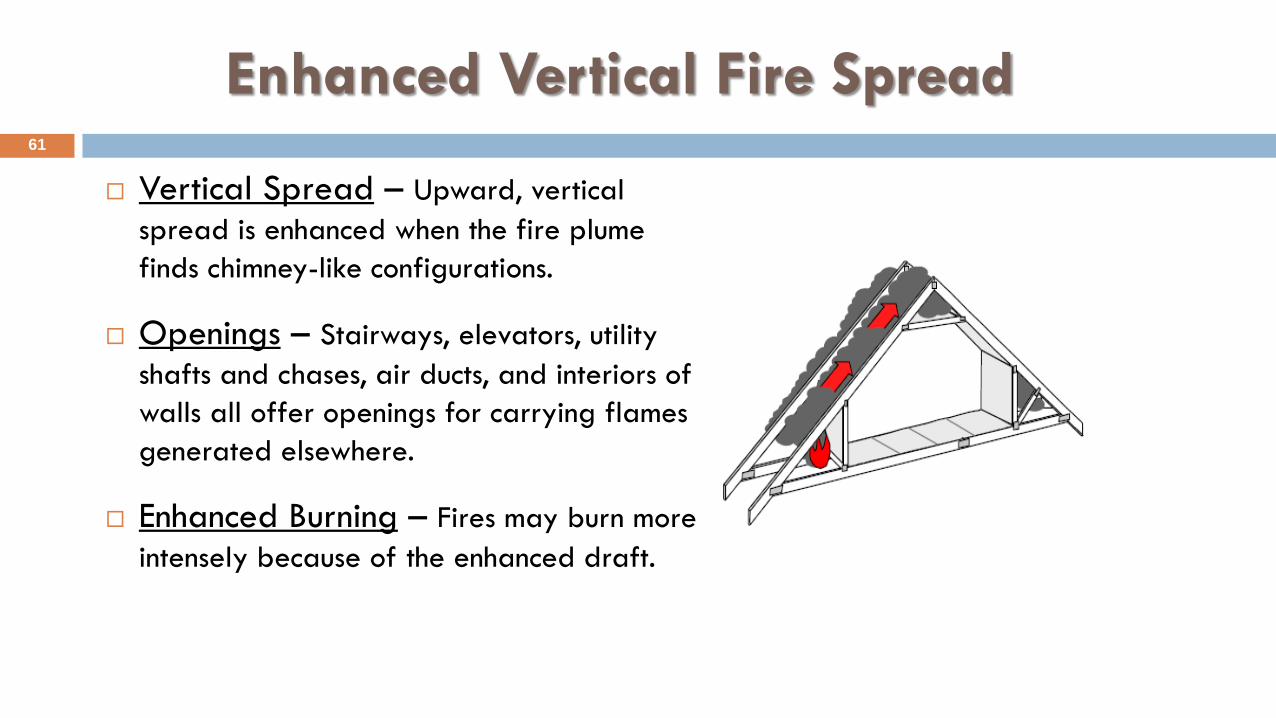
Enhanced Vertical Fire Spread
Vertical Spread – Upward, vertical
spread is enhanced when the fire plume
finds chimney-like configurations.
Openings – Stairways, elevators, utility
shafts and chases, air ducts, and interiors of
walls all offer openings for carrying flames
generated elsewhere.
Enhanced Burning – Fires may burn more
intensely because of the enhanced draft.
62
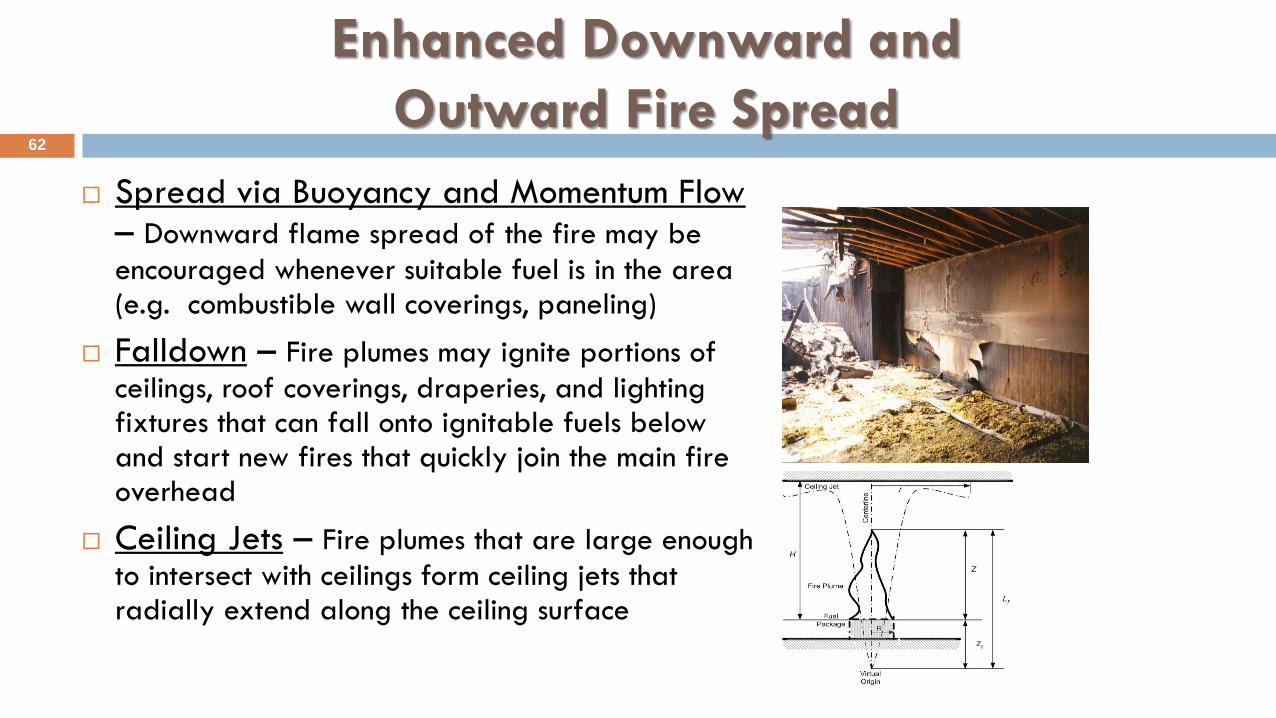
Enhanced Downward and
Outward Fire Spread
Spread via Buoyancy and Momentum Flow – Downward flame spread of the fire may be
encouraged whenever suitable fuel is in the area (e.g. combustible wall coverings, paneling)
Falldown – Fire plumes may ignite portions of
ceilings, roof coverings, draperies, and lighting fixtures that can fall onto ignitable fuels below and start new fires that quickly join the main fire overhead
Ceiling Jets – Fire plumes that are large enough
to intersect with ceilings form ceiling jets that radially extend along the ceiling surface
63
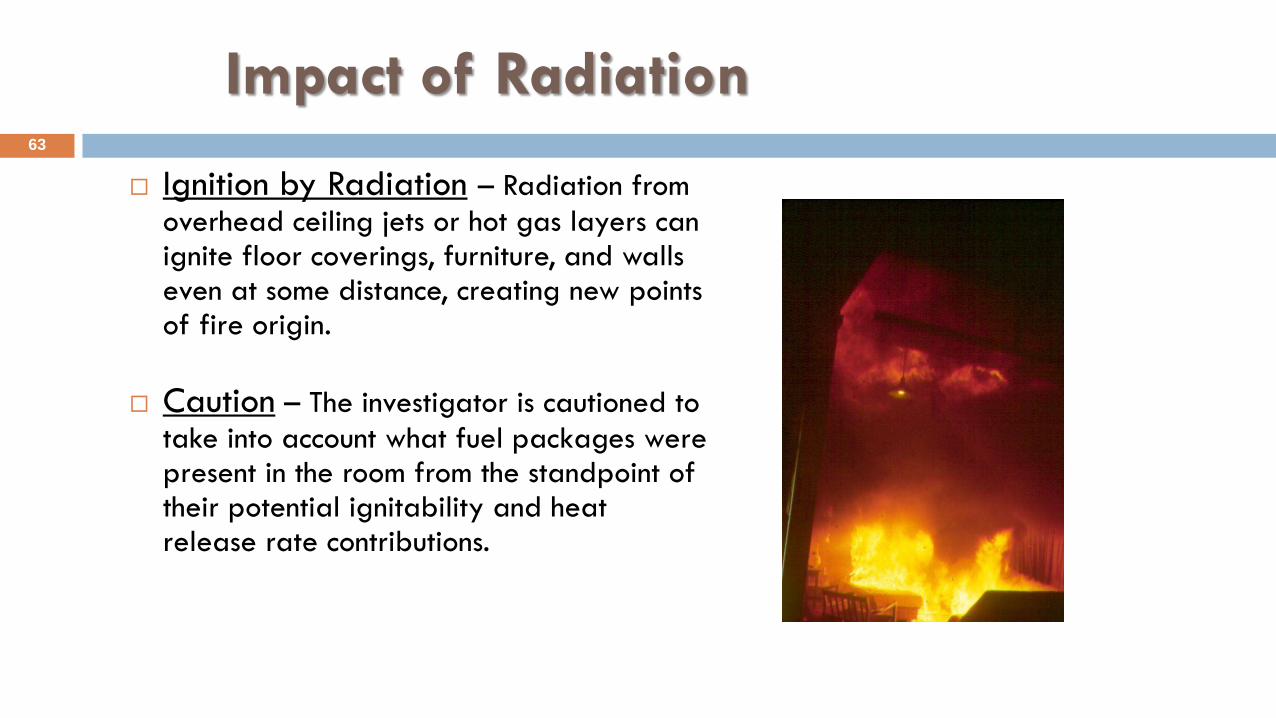
Impact of Radiation
Ignition by Radiation – Radiation from
overhead ceiling jets or hot gas layers can ignite floor coverings, furniture, and walls even at some distance, creating new points of fire origin.
Caution – The investigator is cautioned to
take into account what fuel packages were present in the room from the standpoint of their potential ignitability and heat release rate contributions.
64
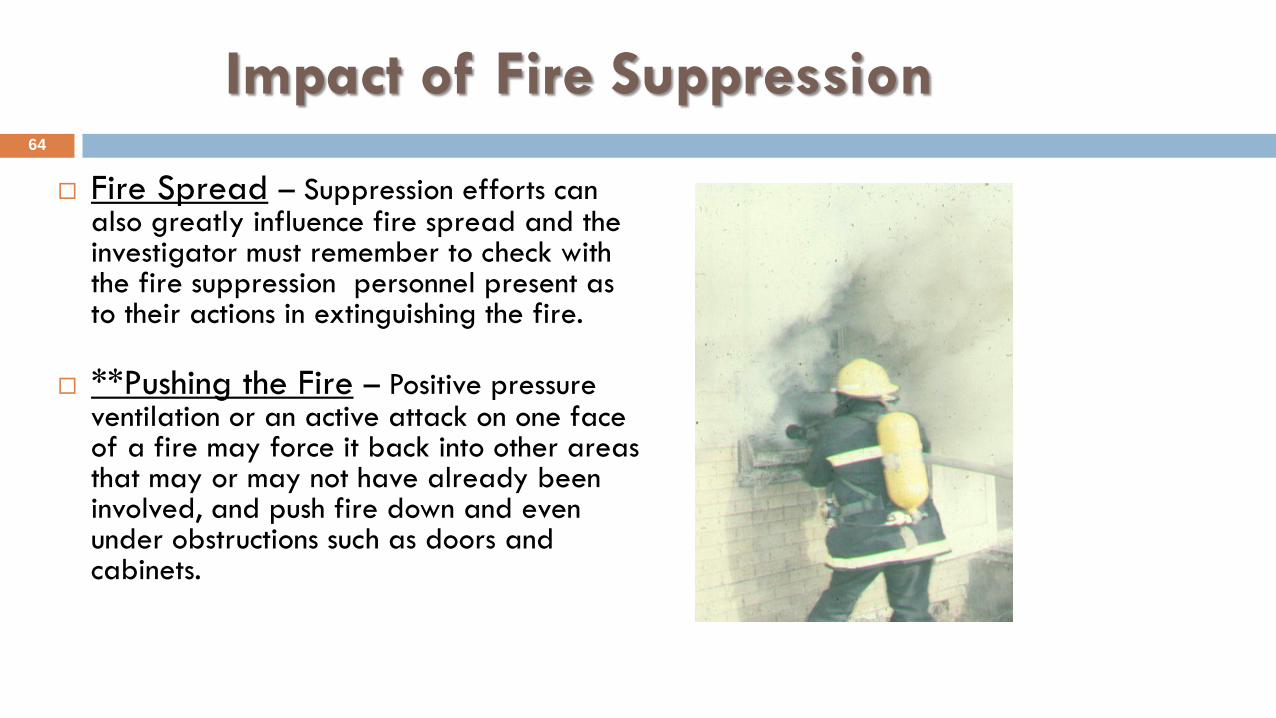
Impact of Fire Suppression
Fire Spread – Suppression efforts can also greatly influence fire spread and the investigator must remember to check with the fire suppression personnel present as to their actions in extinguishing the fire.
**Pushing the Fire – Positive pressure ventilation or an active attack on one face of a fire may force it back into other areas that may or may not have already been involved, and push fire down and even under obstructions such as doors and cabinets.
65
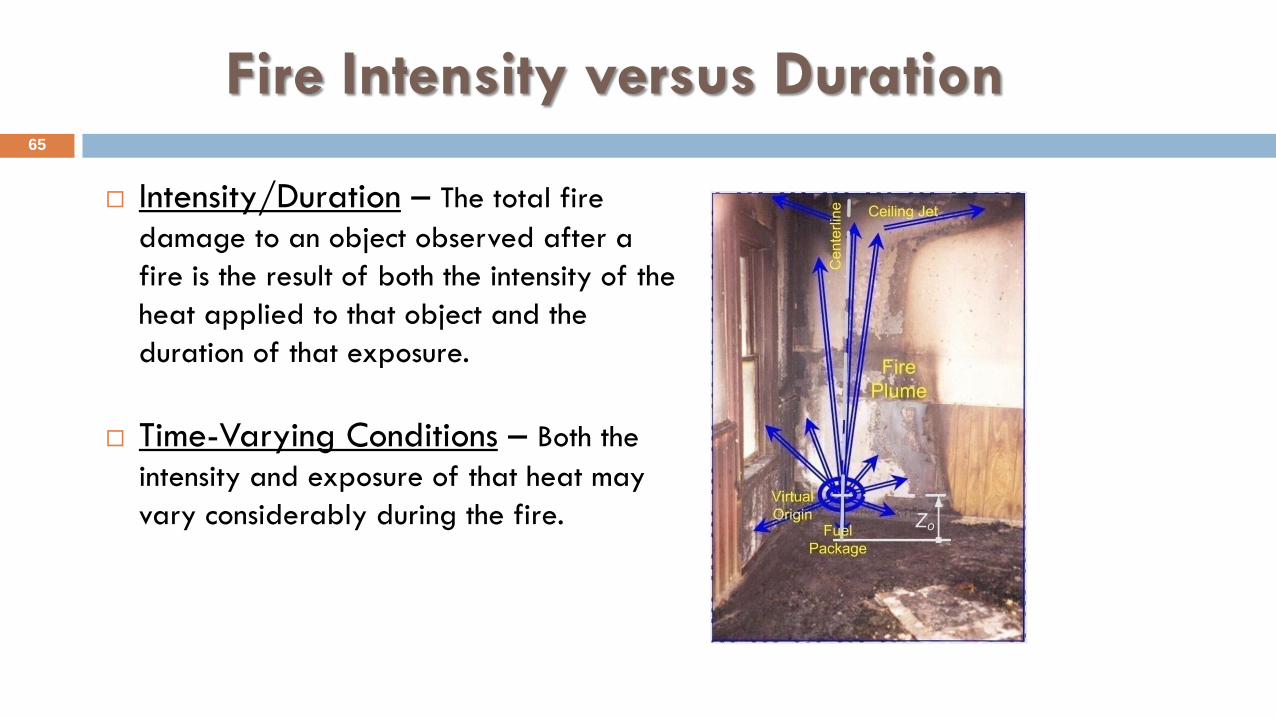
Fire Intensity versus Duration
Intensity/Duration – The total fire
damage to an object observed after a
fire is the result of both the intensity of the
heat applied to that object and the
duration of that exposure.
Time-Varying Conditions – Both the
intensity and exposure of that heat may
vary considerably during the fire.
66
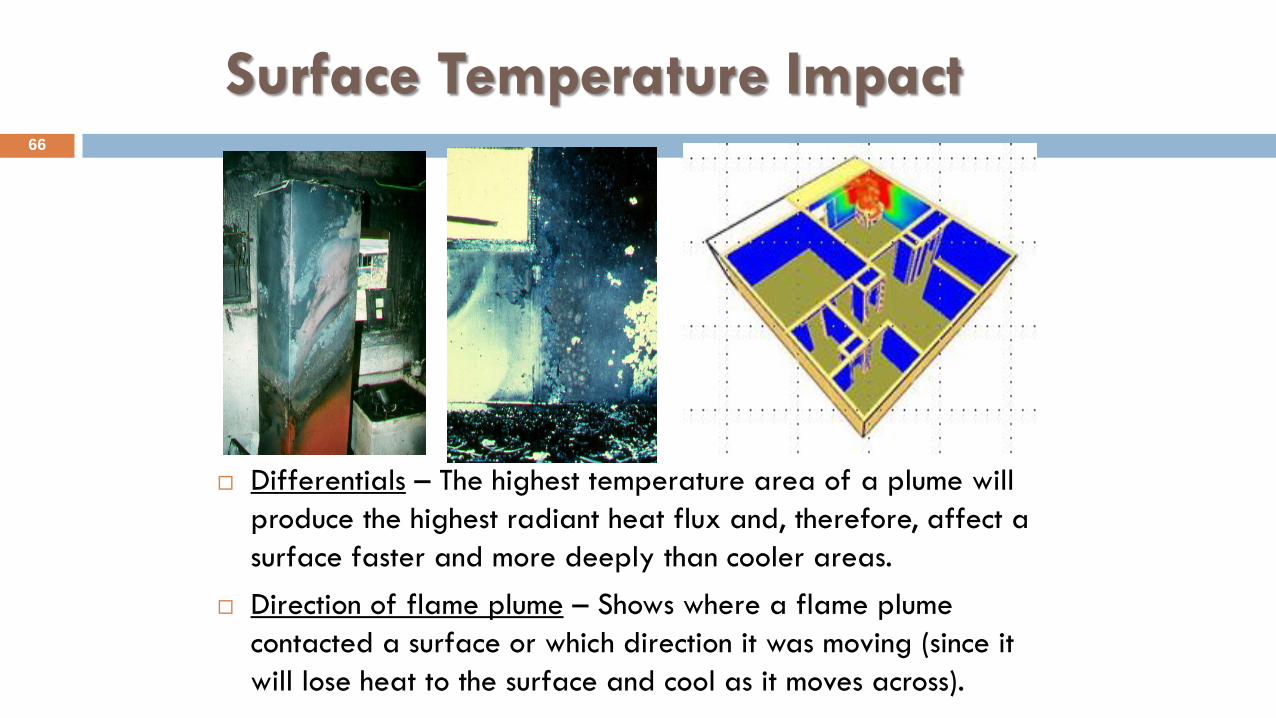
Surface Temperature Impact
Differentials – The highest temperature area of a plume will
produce the highest radiant heat flux and, therefore, affect a
surface faster and more deeply than cooler areas.
Direction of flame plume – Shows where a flame plume
contacted a surface or which direction it was moving (since it
will lose heat to the surface and cool as it moves across).
67
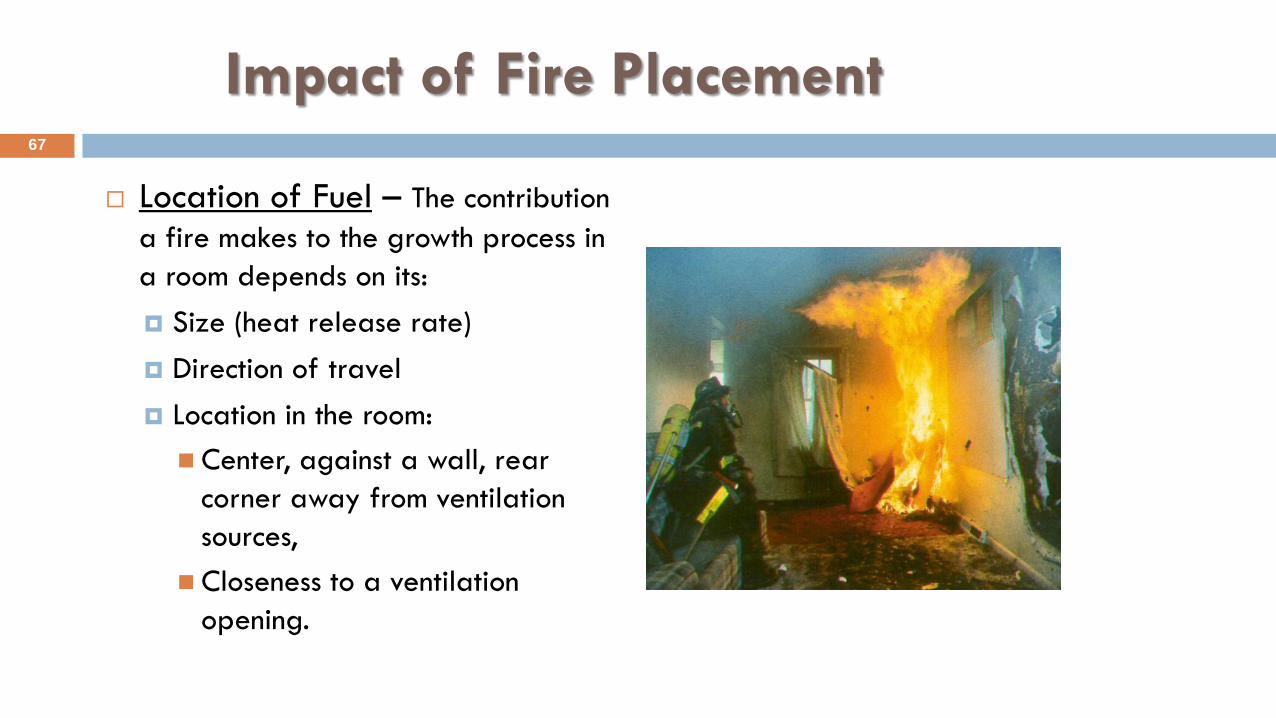
Impact of Fire Placement
Location of Fuel – The contribution
a fire makes to the growth process in
a room depends on its:
Size (heat release rate)
Direction of travel
Location in the room:
Center, against a wall, rear
corner away from ventilation
sources,
Closeness to a ventilation
opening.
3.6 SUMMARY 68
Fire investigation and reconstruction of a fire's growth
pattern back to its origin are based on the fact that fire
plumes form patterns of damage that are, to a large
extent, predictable.
As with the application of the scientific method, each
indicator is an independent test for direction of travel,
intensity, duration of heat application, or point of origin
and mat be documented separately.
SUMMARY (Con’t.) 69
The investigator should remember that there is no one indicator that proves the origin or cause of a fire. They must be evaluated together and yet they may not all agree.
The application of fire vectoring can also enrich and document the opinion rendered as to the original location of the fire plume.
As long as there is not too much damage, ample fire pattern indicators may exist and can be documented at post-flashover
SUMMARY 70
Fire plumes contribute to evidence of fire pattern damage, area/point of origin, and direction of travel
Do not overlook signs of physical evidence involving human activities
Rely on fire dynamics for insights