Embed Size (px)
Citation preview

U.S. CONSUMER PRODUCT SAFETY COMMISSION
DIRECTORATE FOR ENGINEERING SCIENCESWashington, DC 20207
FIRE INDICATORSEngineering Project Report
Dean L. LaRueAugust 2002

Page 1
Introduction
The heat flux – or heat energy per unit area – produced by some electrical appliances may besufficient to create a fire hazard by igniting surrounding combustibles. Various combustiblematerials are specified in a number of voluntary standards for heat-producing appliances to serveas indicators of the potential for ignition as a result of contact with or exposure to hot surfaces.The fire indicators are typically fabrics, textiles or other relatively thin fibrous materials, such assurgical cotton or cotton gauze. The use of such materials can provide an assessment of thepotential presented by heat-producing devices for ignition of ordinary household combustibles,but does not provide a quantitative measure of the heat energy required to ignite combustiblesthat are likely to be near such devices. In addition, fire indicators can be affected byenvironmental conditions, such as humidity; and differences in manufacturing practices may alsoaffect the ability of the fire indicator to consistently and accurately demonstrate a fire hazard.
If a maximum heat flux value that will not result in ignition of household combustibles could bedetermined, a voluntary standard requirement for mapping of the heat flux generated by anappliance could be developed. If the measured heat flux were below the maximum, the productwould pass. If not, the product would fail. Data resulting from heat flux mapping would alsoprovide manufacturers information that could lead to further product safety improvements.
Purpose
The purpose of testing described in this report was to quantify the heat flux required to ignitevarious household combustibles and fire indicators and to measure the heat fluxes generated byseveral consumer appliances. The heat flux values measured for the appliances were compared tothe minimum heat flux required to ignite combustibles (fire indicators and householdcombustibles). The data acquired from these tests may be used to determine a baseline value forheat flux mapping tests.
Heat Flux Measurements of Electrical Appliances
Heat flux measurements were recorded for seven household heat-producing appliances. Theappliances included an iron, a toaster oven, two in-wall air heaters, and three toasters. Theintended purpose of this testing was to determine approximate heat flux values produced byappliances that may be present in consumers’ homes. Engineering Sciences staff performed thistesting at the CPSC Engineering Laboratory.
A heat flux transducer is a sensor that can directly measure heat transfer rates. The transducerconverts the heat transfer rate to a proportional millivolt signal. The range for the transducer was0 – 2 W/cm2 although the specifications allow for an overrange of 150% of the full range or to 3W/cm2. Tubes are included on the transducer to introduce water into the transducer to cool it andmaintain a relatively stable temperature. According to the users manual, water is not required formeasurements that will not increase the temperature of the face of the transducer above 400 °F.Water was not used for any of the testing except where mentioned. A Heat Flux Meter was usedto provide a digital readout in heat flux units.

Page 2
Iron
The charts below show the results of heat flux tests for an iron. The iron was filled with waterand set on the highest heat setting. Figure 1 shows the data collected during a horizontal scanfrom left to right. This scan was performed at approximately the vertical center of the sole-plateof the iron, with the transducer as close to the sole-plate as possible without touching it. Themaximum recorded heat flux value was 0.17 W/cm2. The unusual shape of the graph is easilyexplained by the construction of the iron – the heating element is located near the outside edge ofthe sole-plate – hence, higher values are measured near the left and right edges of the iron.
Figure 1. Heat Flux of Iron at Sole-Plate (Horizontal Scan)Iron (Horizontal Scan)
00.020.040.060.08
0.10.120.140.160.18
0 0.5 1 1.5 2 2.5 3 3.5 4 4.5 5
Location (inches)
Hea
t Flu
x (W
/cm
2)
Figure 2 shows a vertical scan from the top down at the approximate center of the sole-plate (the2.5-inch mark shown in Figure 1 above). The shape of the sole-plate was typical of irons soldtoday, with the top forming a point and spreading out at the bottom. The peak value of 0.14W/cm2 at the 2.5-inch mark was where the heating element was located. The graph shows thatthe heat transfer rate is lower and more consistent near the bottom of the iron. This is due to thefact that the heat energy is spread out over a wider area near the bottom of the iron.
Figure 2. Heat Flux of Iron at Sole-Plate (Vertical Scan)Iron (Vertical Scan)
0
0.02
0.04
0.06
0.08
0.1
0.12
0.14
0.16
0 0.5 1 1.5 2 2.5 3 3.5 4 4.5 5 5.5 6 6.5 7
Location (inches)
Hea
t Flu
x (W
/cm
2)

Page 3
Toaster Oven
The charts below show the results of heat flux tests for a toaster oven in which the oven was setat 500 °F. Figure 3 shows a vertical scan from the top to the bottom of the toaster oven, adjacentto the door handle, and with the transducer approximately 0.25 inch away from the front of thetoaster oven. The graph shows that the maximum heat flux was located approximately 0.5 inchfrom the top of the toaster oven; this is the location of the top edge of the door. The maximumvalue recorded was 0.45 W/cm2.
Figure 3. Heat Flux of Toaster Oven/Oven Mode (Vertical Scan)
Toaster Oven (Vertical Scan - 500 degrees F)
00.05
0.10.15
0.20.25
0.30.35
0.40.45
0.5
0 0.5 1 1.5 2 2.5 3 3.5 4 4.5 5
Location (inches)
Hea
t Flu
x (W
/cm
2)
Left of HandleRight of Handle
Figure 4 shows the horizontal scan, from left to right, of the front of the toaster oven atapproximately 0.5 inch from the top. The transducer was held approximately 0.25 inch from thetoaster oven. The graph shows a gap in the data, which corresponded to the location of the doorhandle and which interfered with the placement of the heat flux transducer. Again, the maximumheat fluxes were recorded at the edges of the door, with the left edge having the maximum heatflux of 0.44 W/cm2.
Figure 4. Heat Flux of Toaster Oven/Oven Mode (Horizontal Scan)Toaster Oven (Horizontal Scan - 0.5" from Top - 500 degrees F
00.05
0.10.15
0.20.25
0.30.35
0.40.45
0.5
0 1 2 3 4 5 6 7 8 9 10 11 12 13 14
Location (inches)
Hea
t Flu
x (W
/cm
2)
0.25" away
Page 4
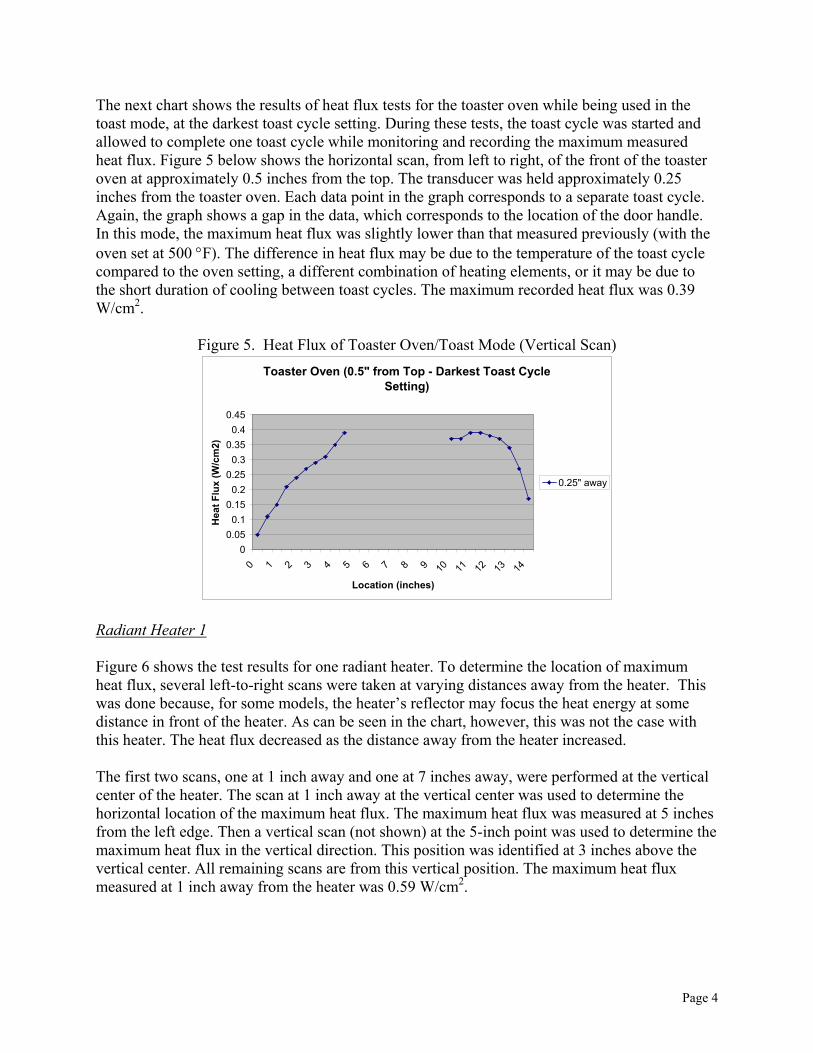
The next chart shows the results of heat flux tests for the toaster oven while being used in thetoast mode, at the darkest toast cycle setting. During these tests, the toast cycle was started andallowed to complete one toast cycle while monitoring and recording the maximum measuredheat flux. Figure 5 below shows the horizontal scan, from left to right, of the front of the toasteroven at approximately 0.5 inches from the top. The transducer was held approximately 0.25inches from the toaster oven. Each data point in the graph corresponds to a separate toast cycle.Again, the graph shows a gap in the data, which corresponds to the location of the door handle.In this mode, the maximum heat flux was slightly lower than that measured previously (with theoven set at 500 °F). The difference in heat flux may be due to the temperature of the toast cyclecompared to the oven setting, a different combination of heating elements, or it may be due tothe short duration of cooling between toast cycles. The maximum recorded heat flux was 0.39W/cm2.
Figure 5. Heat Flux of Toaster Oven/Toast Mode (Vertical Scan)Toaster Oven (0.5" from Top - Darkest Toast Cycle
Setting)
00.05
0.10.15
0.20.25
0.30.35
0.40.45
0 1 2 3 4 5 6 7 8 9 10 11 12 13 14
Location (inches)
Hea
t Flu
x (W
/cm
2)
0.25" away
Radiant Heater 1
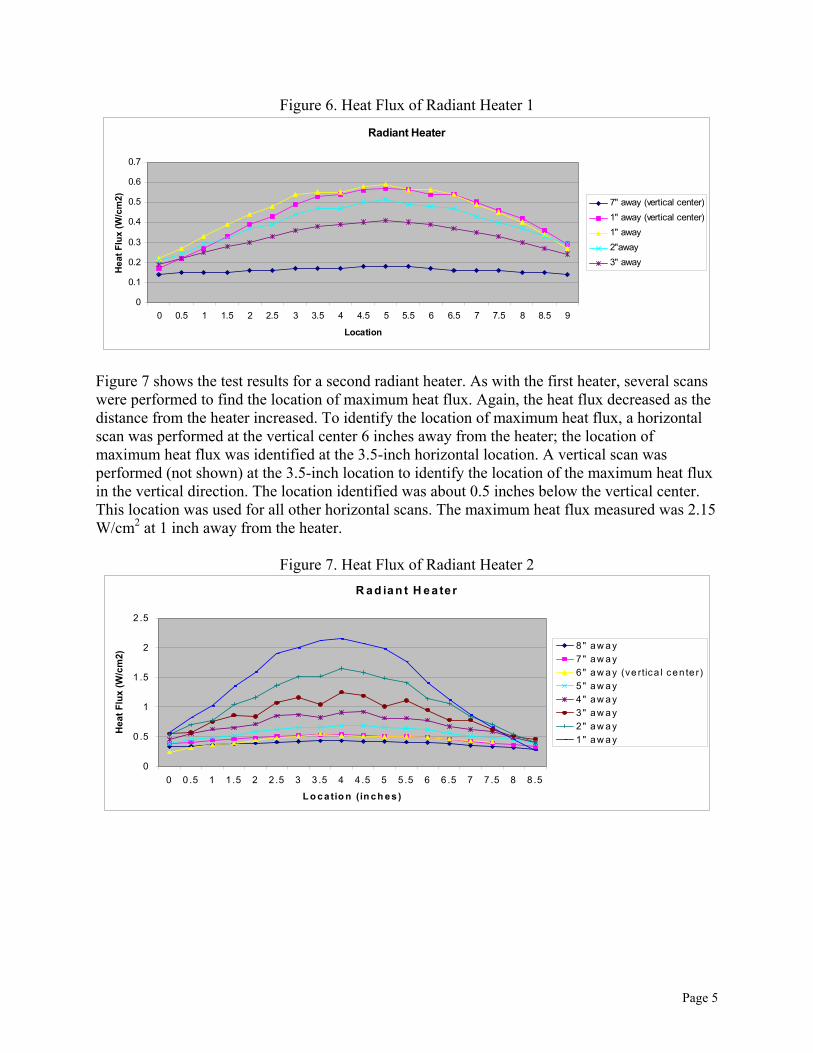
Figure 6 shows the test results for one radiant heater. To determine the location of maximumheat flux, several left-to-right scans were taken at varying distances away from the heater. Thiswas done because, for some models, the heater’s reflector may focus the heat energy at somedistance in front of the heater. As can be seen in the chart, however, this was not the case withthis heater. The heat flux decreased as the distance away from the heater increased.
The first two scans, one at 1 inch away and one at 7 inches away, were performed at the verticalcenter of the heater. The scan at 1 inch away at the vertical center was used to determine thehorizontal location of the maximum heat flux. The maximum heat flux was measured at 5 inchesfrom the left edge. Then a vertical scan (not shown) at the 5-inch point was used to determine themaximum heat flux in the vertical direction. This position was identified at 3 inches above thevertical center. All remaining scans are from this vertical position. The maximum heat fluxmeasured at 1 inch away from the heater was 0.59 W/cm2.
Page 5
Figure 6. Heat Flux of Radiant Heater 1
Radiant Heater
0
0.1
0.2
0.3
0.4
0.5
0.6
0.7
0 0.5 1 1.5 2 2.5 3 3.5 4 4.5 5 5.5 6 6.5 7 7.5 8 8.5 9
Location
Hea
t Flu
x (W
/cm
2) 7" away (vertical center)1" away (vertical center)1" away2"away3" away
Figure 7 shows the test results for a second radiant heater. As with the first heater, several scanswere performed to find the location of maximum heat flux. Again, the heat flux decreased as thedistance from the heater increased. To identify the location of maximum heat flux, a horizontalscan was performed at the vertical center 6 inches away from the heater; the location ofmaximum heat flux was identified at the 3.5-inch horizontal location. A vertical scan wasperformed (not shown) at the 3.5-inch location to identify the location of the maximum heat fluxin the vertical direction. The location identified was about 0.5 inches below the vertical center.This location was used for all other horizontal scans. The maximum heat flux measured was 2.15W/cm2 at 1 inch away from the heater.
Figure 7. Heat Flux of Radiant Heater 2R a d ia n t H e a te r
0
0 .5
1
1 .5
2
2 .5
0 0 .5 1 1 .5 2 2 .5 3 3 .5 4 4 .5 5 5 .5 6 6 .5 7 7 .5 8 8 .5
L o c a tio n (in ch es )
Hea
t Flu
x (W
/cm
2)
8" aw a y7 " aw a y6 " aw a y (ve rtica l cen te r)5 " aw a y4 " aw a y3 " aw a y2 " aw a y1 " aw a y
Page 6
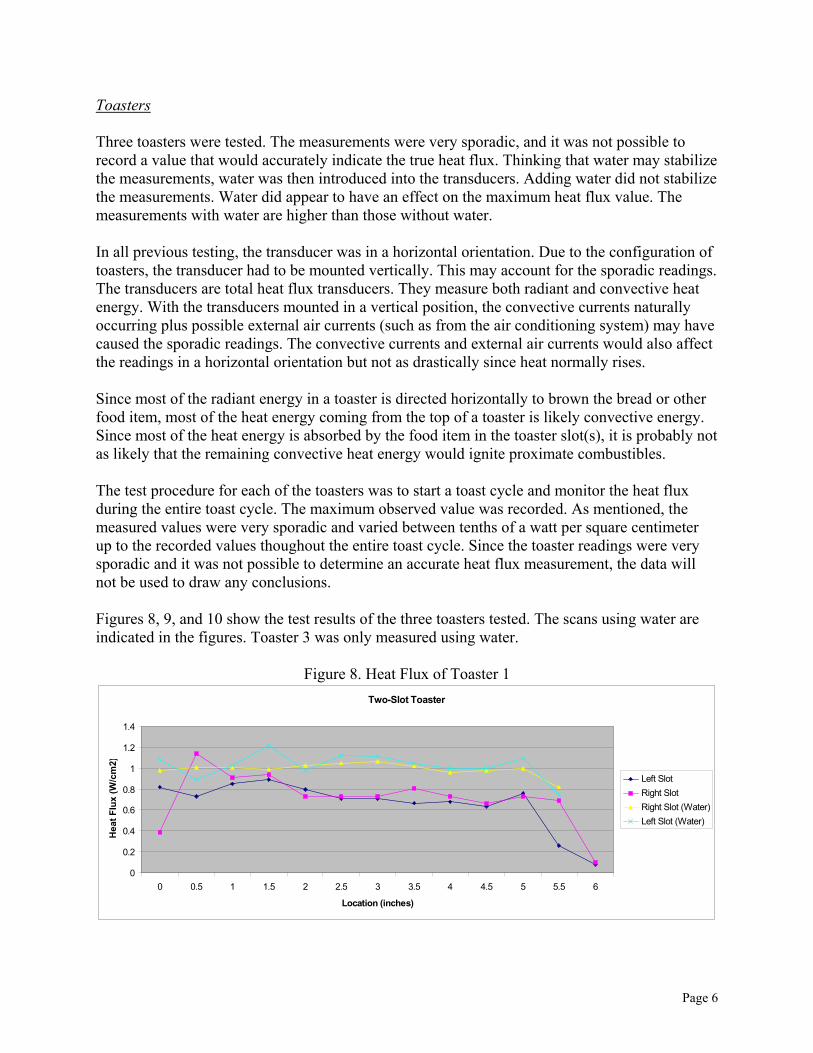
Toasters
Three toasters were tested. The measurements were very sporadic, and it was not possible torecord a value that would accurately indicate the true heat flux. Thinking that water may stabilizethe measurements, water was then introduced into the transducers. Adding water did not stabilizethe measurements. Water did appear to have an effect on the maximum heat flux value. Themeasurements with water are higher than those without water.
In all previous testing, the transducer was in a horizontal orientation. Due to the configuration oftoasters, the transducer had to be mounted vertically. This may account for the sporadic readings.The transducers are total heat flux transducers. They measure both radiant and convective heatenergy. With the transducers mounted in a vertical position, the convective currents naturallyoccurring plus possible external air currents (such as from the air conditioning system) may havecaused the sporadic readings. The convective currents and external air currents would also affectthe readings in a horizontal orientation but not as drastically since heat normally rises.
Since most of the radiant energy in a toaster is directed horizontally to brown the bread or otherfood item, most of the heat energy coming from the top of a toaster is likely convective energy.Since most of the heat energy is absorbed by the food item in the toaster slot(s), it is probably notas likely that the remaining convective heat energy would ignite proximate combustibles.
The test procedure for each of the toasters was to start a toast cycle and monitor the heat fluxduring the entire toast cycle. The maximum observed value was recorded. As mentioned, themeasured values were very sporadic and varied between tenths of a watt per square centimeterup to the recorded values thoughout the entire toast cycle. Since the toaster readings were verysporadic and it was not possible to determine an accurate heat flux measurement, the data willnot be used to draw any conclusions.
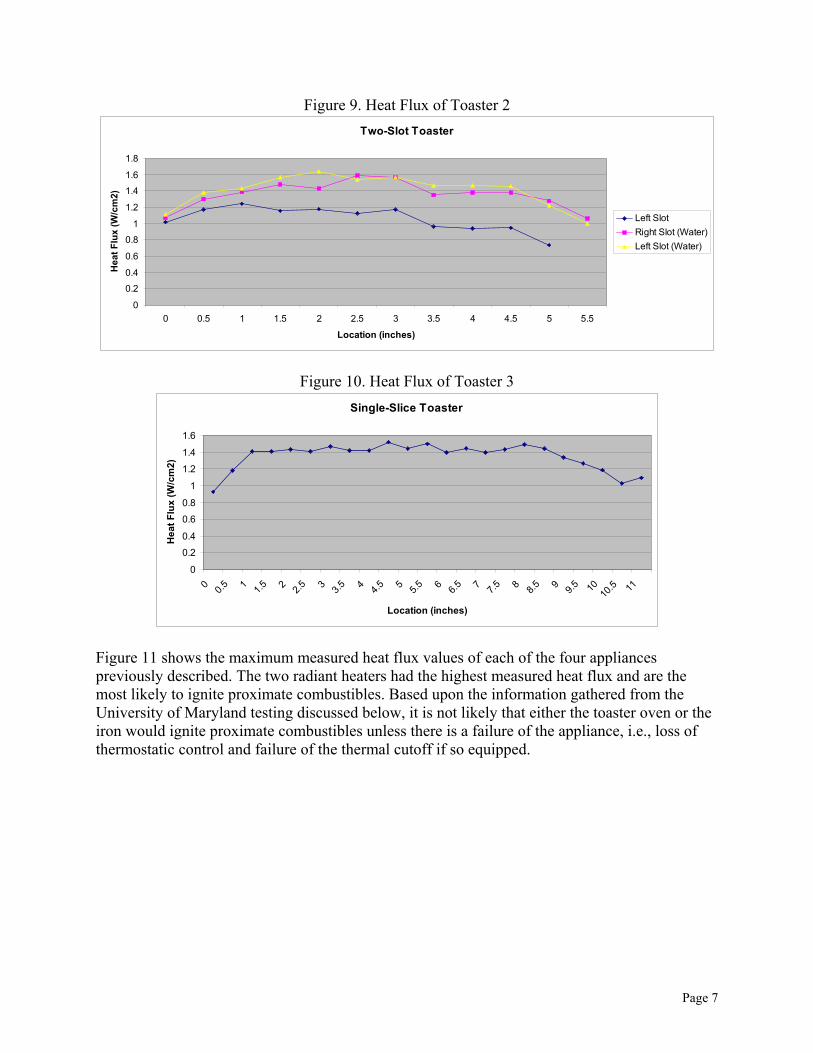
Figures 8, 9, and 10 show the test results of the three toasters tested. The scans using water areindicated in the figures. Toaster 3 was only measured using water.
Figure 8. Heat Flux of Toaster 1Two-Slot Toaster
0
0.2
0.4
0.6
0.8
1
1.2
1.4
0 0.5 1 1.5 2 2.5 3 3.5 4 4.5 5 5.5 6
Location (inches)
Hea
t Flu
x (W
/cm
2)
Left SlotRight SlotRight Slot (Water)Left Slot (Water)
Page 7
Figure 9. Heat Flux of Toaster 2Two-Slot Toaster
0
0.20.4
0.6
0.81
1.2
1.41.6
1.8
0 0.5 1 1.5 2 2.5 3 3.5 4 4.5 5 5.5
Location (inches)
Hea
t Flu
x (W
/cm
2)
Left SlotRight Slot (Water)Left Slot (Water)
Figure 10. Heat Flux of Toaster 3Single-Slice Toaster
0
0.20.4
0.60.8
1
1.21.4
1.6
0 0.5 1 1.5 2 2.5 3 3.5 4 4.5 5 5.5 6 6.5 7 7.5 8 8.5 9 9.5 10 10.5 11
Location (inches)
Hea
t Flu
x (W
/cm
2)
Figure 11 shows the maximum measured heat flux values of each of the four appliancespreviously described. The two radiant heaters had the highest measured heat flux and are themost likely to ignite proximate combustibles. Based upon the information gathered from theUniversity of Maryland testing discussed below, it is not likely that either the toaster oven or theiron would ignite proximate combustibles unless there is a failure of the appliance, i.e., loss ofthermostatic control and failure of the thermal cutoff if so equipped.

Page 8
Figure 11. Maximum Heat Fluxes of Appliances
Maximum Heat Flux
0
0.5
1
1.5
2
2.5
Radiant Heater 2 Radiant Heater 1 Toaster Oven Iron
Appliances
Hea
t Flu
x (W
/cm
2)
Testing of Household Combustibles and Standard Fire Indicators
Under contract to CPSC, the University of Maryland (U of M) conducted tests to determine thecritical heat flux of five materials (chosen to represent common, household combustibles) andfive standard fire indicators. The materials tested are outlined in the table below. The criticalheat flux is the minimum heat flux required to ignite the combustible.
Household Combustibles Fire IndicatorsNewsprint (black and white) Tissue paper (white)Paper towel (white) Surgical cottonWhite cotton blanket CheeseclothBeige terry cloth towel Canvas (cotton duck)Blue upholstery fabric White terrycloth towel
In the tests, the combustibles were subjected to a range of constant radiant heat fluxes todetermine the minimum heat fluxes needed to cause unpiloted glowing or flaming ignition of thematerial. (Pilot sparks and flames were not used as part of the testing protocol, so the test resultsrepresent unpiloted ignition.) A report of the tests conducted by U of M, along with the testresults, is described in their report, Ignition characteristics of various fire indicators subjected toradiant heat fluxes, which is attached as Appendix A.
The testing conducted by U of M was limited to a single layer of the combustible material. Forthe materials tested, the critical heat flux values ranged from a low of 13.7 kW/m2 (1.37 W/cm2)to a high of 47 kW/m2 (4.7 W/cm2). The data also showed that the heat flux required to ignite thecombustible decreased as the density of the combustible increased. This characteristic suggests

Page 9
that perhaps the critical heat flux would be lower if the material had a backing or if multiplelayers of the material were used.
Another observation from the testing showed that the cotton duck (canvas) ignited at the lowestheat flux and demonstrated the most consistent results.
Conclusions and Recommendations
The testing performed by CPSC staff and by the University of Maryland showed that there areheat-producing appliances in consumers’ homes that have the potential to ignite surroundingcombustibles. In CPSC staff tests, the measured maximum heat fluxes generated by selectedhousehold appliances ranged from 0.17 W/cm2 (1.7 kW/m2) to 2.15 W/cm2 (21.5 kW/m2). Intests conducted by U of M, the minimum heat fluxes required to ignite single layers of selectedcombustible materials were found to be in the range of 1.37 W/cm2 (13.7 kW/m2) to 4.7 W/cm2
(47 kW/m2). The table below shows the 10 materials tested by U of M and their correspondingcritical heat fluxes. This table is a summary of the data contained in Table 4. Minimum heatfluxes for ignition included in Appendix A.
Combustible Material Critical Heat Flux (W/cm2)Tissue Paper 3.62Cheesecloth 4.70Paper Towel 2.41Newsprint 2.84Surgical Cotton 2.52Canvas 1.52Blanket 1.49Upholstery 1.73Beige towel 1.37White towel 1.46
Of the appliances tested, only one of the radiant heaters produced sufficient heat energy to ignitesome of the combustibles tested, but it would not be sufficient to ignite all of the materials.Those tested materials that had the potential to be ignited by the heater were the canvas, thewhite cotton blanket, the upholstery fabric, the beige towel, and the white towel.
The data showed that the heat flux required to ignite the combustibles decreased as the density ofthe combustible increased. This indicates that if multiple layers of the combustible or a singlelayer of the combustible with a backing were tested, the critical heat flux may be lower. Inaddition, combustibles in a consumer’s home (e.g., a pile of clothing, a roll of paper towels, anupholstered pillow, etc.) will not likely be limited to a single layer of material.
Recommendation: Conduct additional testing to determine the critical heat flux ofcombustibles using multiple layers and also single layers of the combustible with variousbacking materials.

Page 10
Critical heat flux tests showed that the cotton duck ignited at the lowest heat flux, and itdemonstrated the most consistent results. Based on this, it appears that cotton duck is a good fireindicator. Currently, it is used only on a very limited basis in the voluntary standards. However,if the ignition characteristics of the material were better understood, it may prove to have morewidespread usefulness in the voluntary standards.
Recommendation: Conduct additional tests of cotton duck to better characterize thematerial.
Heat flux testing of a limited number of heat-producing appliances has been conducted. Tests ofadditional appliances should be performed, and testing and data acquisition should be automatedto provide more comprehensive results for analysis.
Recommendation: Conduct additional tests of heat-producing appliances to demonstratethe feasibility of the test method and to improve upon it. Manufacture/purchase aprogrammable controller to automate heat flux data acquisition.
The ultimate goal of this study is to identify a quantitative method to test the propensity for aconsumer product to ignite surrounding combustibles. An initial step has been made with thetests that have been conducted thus far. However, it is still premature to propose an alternativetest method with threshold values. The additional testing recommended above will help to focuson the appropriate threshold values.

Appendix A

Page A-1
Ignition characteristics of various fire indicatorssubjected to radiant heat fluxes
Frederick W. MowrerDepartment of Fire Protection EngineeringUniversity of Maryland
Abstract
Various combustible materials are specified in a number of fire test standards for heat-producing consumer products to serve as indicators of the potential for ignition as a result ofcontact with or exposure to hot surfaces. The objective of this study has been to collect dataon the heat energy required to ignite ordinary household combustibles that might be locatednear heat-producing consumer products. Samples of ten different household combustibleswere subjected to a range of constant radiant heat fluxes in a Cone Calorimeter and in a LIFTapparatus to determine the minimum heat fluxes needed to cause unpiloted glowing or flamingignition of the materials. Test results are analyzed in terms of thermally thin and thermallythick theories for ignition.
Keywords: Ignition, thermally thin, thermally thick, critical heat flux
Introduction
Various combustible materials are specified in a number of fire test standards for heat-producing consumer products to serve as indicators of the potential for ignition as a result ofcontact with or exposure to hot surfaces. The fire indicators specified in these standards aretypically fabrics, textiles or other relatively thin fibrous materials, such as surgical cotton orcotton gauze. The use of such materials can provide a realistic assessment of the potentialpresented by heat-producing devices for ignition of ordinary household combustibles, but doesnot provide a quantitative measure of the heat energy required to ignite combustibles that arelikely to be near such devices.
The objective of this study has been to collect data on the heat energy required to igniteordinary household combustibles that might be located near heat-producing consumerproducts. To collect this data, samples of ten different household combustibles were subjectedto a range of constant radiant heat fluxes in a Cone Calorimeter [1] and in a LIFT apparatus[2]. The samples were supported in the test devices without the backing materials normallyused in the Cone Calorimeter and the LIFT apparatus so as to represent a “thermally thin”exposure condition. Pilot sparks and flames were not used as part of the testing protocol, sothe test results represent unpiloted ignition. Many samples produced glowing combustion butnot flaming combustion in the absence of a pilot source, while others would exhibit flamingcombustion before evidence of glowing, particularly at higher heat fluxes. For the presentstudy, ignition was considered to have occurred when visible glowing was observed on thesurface of a material or when flaming ignition was observed, whichever occurred first.
Test materials
The ten different household combustibles used for this study include:

Page A-2
• Newsprint (black and white)• Tissue paper (white)• Paper towel (white)• Surgical cotton• Cheesecloth• Canvas• White cotton blanket• White terrycloth towel• Beige terrycloth towel• Blue upholstery fabric
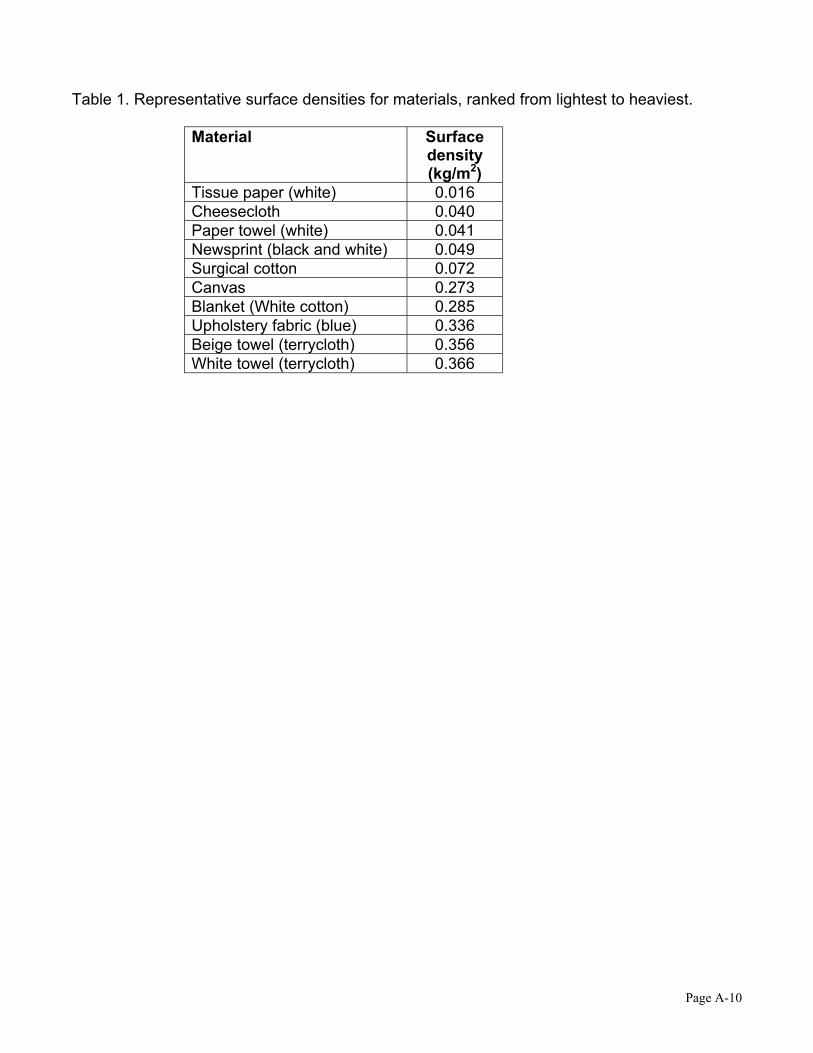
Representative surface densities for each material were measured by weighing 150 mm by150 mm (6 in. by 6 in.) samples of each material. These representative surface densities arereported in Table 1, with materials ranked from the lightest to the heaviest.
Test specimen preparation and mounting
The objective of this study was to evaluate the ignition propensity of the thin householdcombustibles by themselves, independent of the impact of substrates. Consequently, the testspecimen preparation and mounting procedures normally employed for the Cone Calorimeterand the LIFT apparatus were altered to accommodate this testing.
For testing in the Cone Calorimeter, square samples with dimensions of 178 mm by 178 mm (7in. by 7 in.) were cut from larger sections of material. Then 38 mm by 38 mm (1.5 in. by 1.5in.) square pieces were cut from each of the corners of the sample. A representative ConeCalorimeter sample is illustrated in Figure 1. The sample was then draped over a nominal 100mm by 100 mm by 76 mm (4 in. by 4 in. by 3 in.) deep Cone Calorimeter specimen holder.Finally, a standard Cone Calorimeter sample retainer frame was placed over the top of thespecimen and the specimen holder, acting to hold the specimen taut over the top of thespecimen holder while exposing a 94 mm by 94 mm (3.7 in. by 3.7 in.) area to the imposedheat flux from the Cone heater. In this way, the sample was not in contact with a substratematerial. The final assembly is illustrated in Figure 2.
For testing in the LIFT apparatus, square samples with dimensions of 229 mm by 229 mm (9in. by 9 in.) were cut from larger pieces of material. Then 38 mm by 38 mm (1.5 in. by 1.5 in.)square pieces were cut from each of the corners of the square sample. A representative LIFTapparatus sample is illustrated in Figure 3. The sample was then draped over a nominal 150mm by 150 mm (6 in. by 6 in.) frame of 25.4 mm (1 in.) thick calcium silicate board. The framehad a central opening with dimensions of approximately 125 mm by 125 mm (5 in. by 5 in.),such that the calcium silicate board was not located behind the sample in this central area.Finally, the sample and frame were inserted into the ignition sample section of the standardLIFT sample holder. This LIFT apparatus mounting arrangement is illustrated in Figure 4.
Before testing, test specimens were conditioned by storing them over a dessicant in a sampleconditioning chamber within the air-conditioned laboratory for a period of days.
Test procedures
Page A-3
Testing in the Cone Calorimeter was performed by first establishing and measuring the heatflux from the cone heater element at the plane of the sample surface. Once the desired heatflux was established, a sample mounted in the sample holder was inserted beneath the coneheater with an aluminum radiation shield covering the sample to protect it from the incidentthermal radiation. The radiation shield was then quickly removed from the sample surfacewhile a stopwatch was simultaneously started. Observations were made of the surface of thetest samples under the incident thermal radiation and the following times were recorded:
• Time to first observation of surface discoloration;• Time to first observation of smoking;• Time to first observation of surface glowing;• Time to first observation of flaming.
The oxygen consumption calorimetry measurements normally made in Cone Calorimeter testswere not included in this testing because the purpose of the tests was to evaluate ignitioncharacteristics, not heat release rates once the materials ignited.
Testing in the LIFT apparatus was performed by first establishing and measuring the heat fluxfrom the gas-fired radiant panel to the center of the plane of the sample surface. Once thedesired heat flux was established, the heat flux measurement gauge and assembly wereremoved from the apparatus. Within a short period of time, a sample holder with a samplemounted at the ignition end was rapidly inserted into the apparatus and a stopwatch wassimultaneously started. Observations were made of the surface of the test samples under theincident thermal radiation and the times identified above were recorded.
Between tests in both the Cone Calorimeter and the LIFT apparatus, the incident heat fluxeswere varied in an effort to find and bracket the minimum incident heat flux at which ignition wasobserved. Tests were conducted for periods of up to 20 minutes, consistent with the standardLIFT testing protocol. Because these tests were conducted without a pilot ignition source, thetime to ignition was considered to be the time to first observation of surface glowing or flaming,whichever occurred first.
Test results
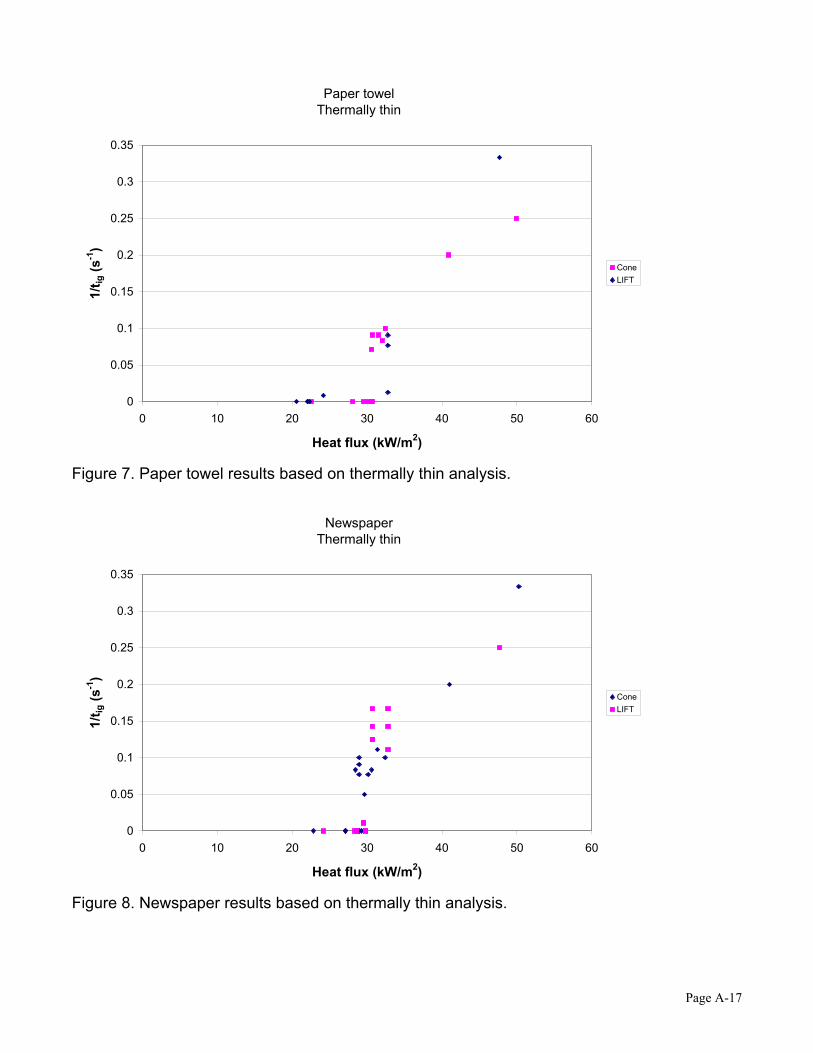
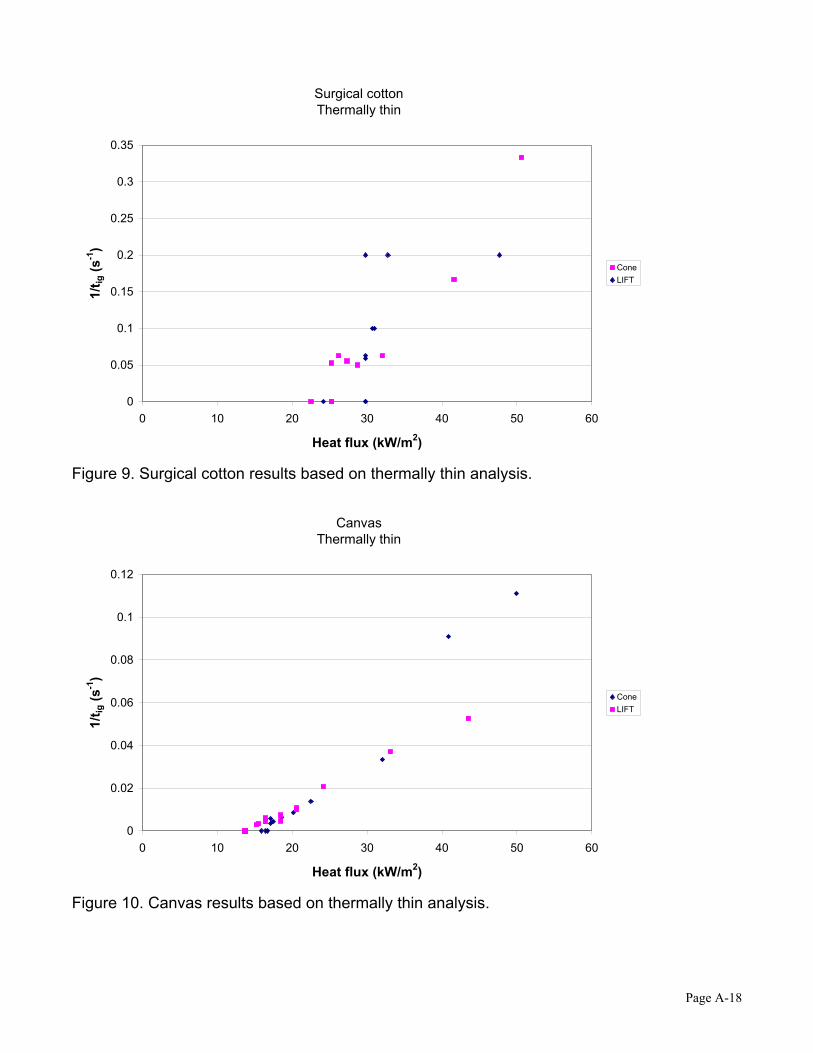
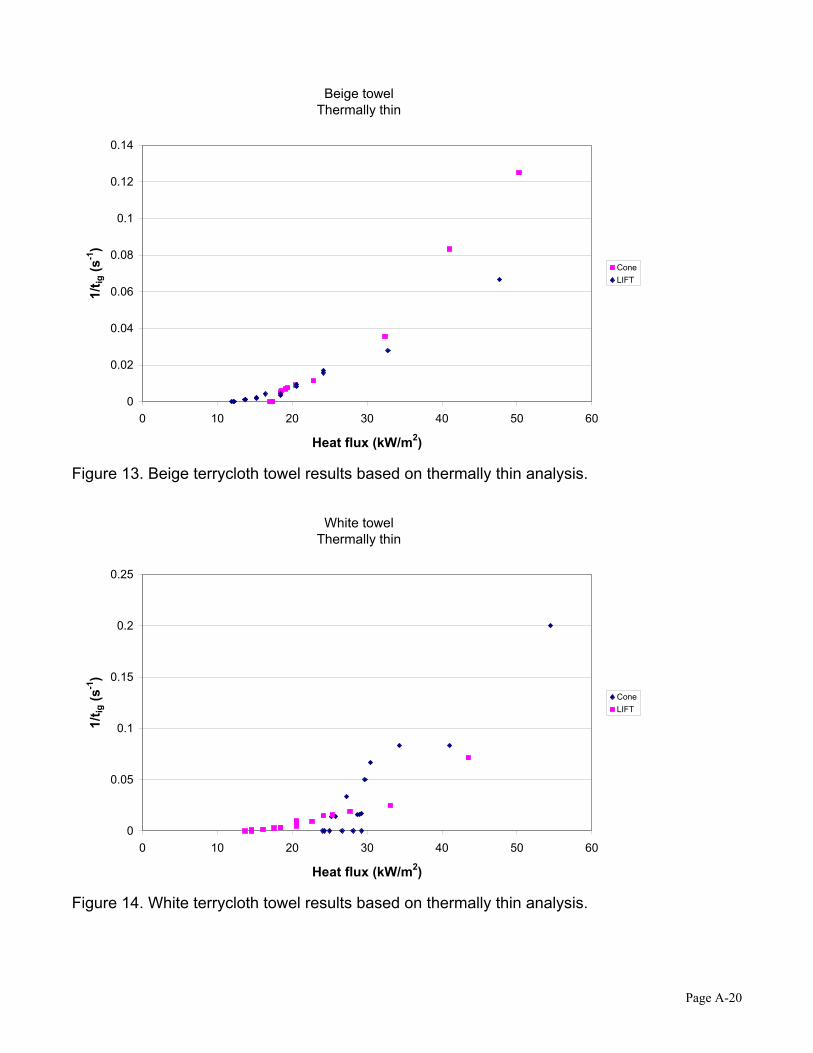
Test results for the ten materials are provided in Tables 2 and 3 and in Figures 5 through 14.In Table 2, the time to ignition is tabulated as a function of the incident heat flux for testsconducted in the Cone Calorimeter. In Table 3, the time to ignition is tabulated as a function ofthe incident heat flux for tests conducted in the LIFT apparatus. In Figures 5 through 14, theinverse of the time to ignition, i.e., 1−
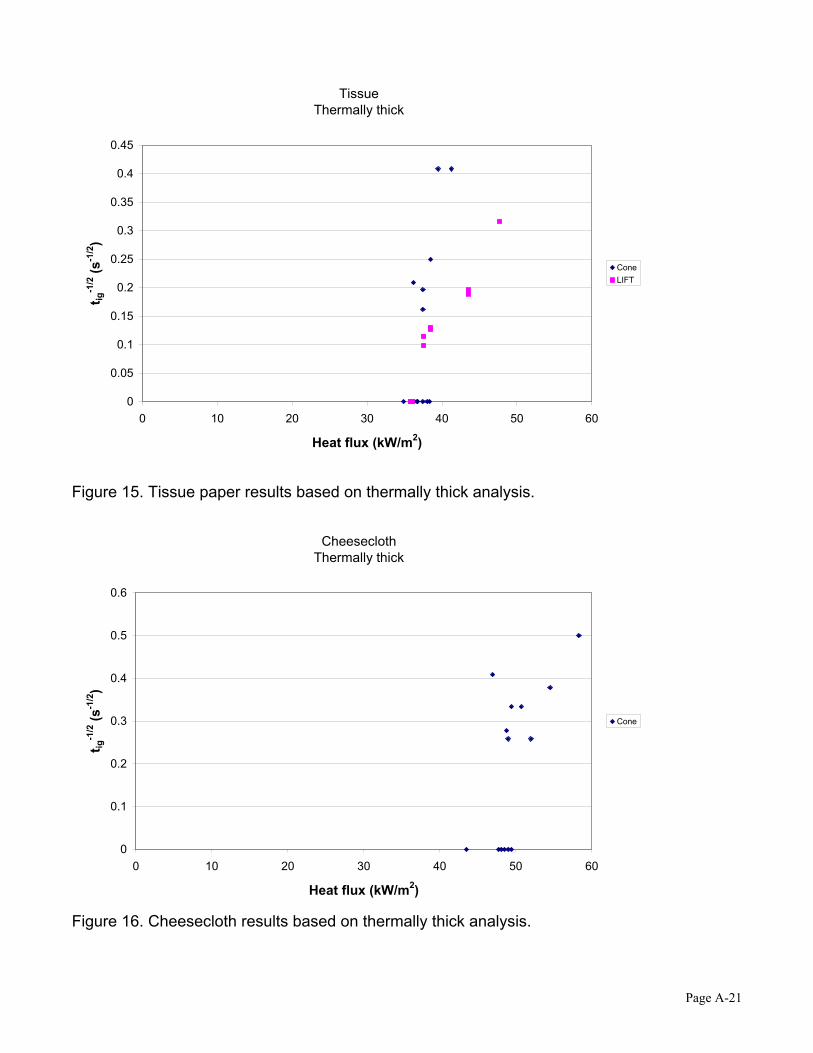
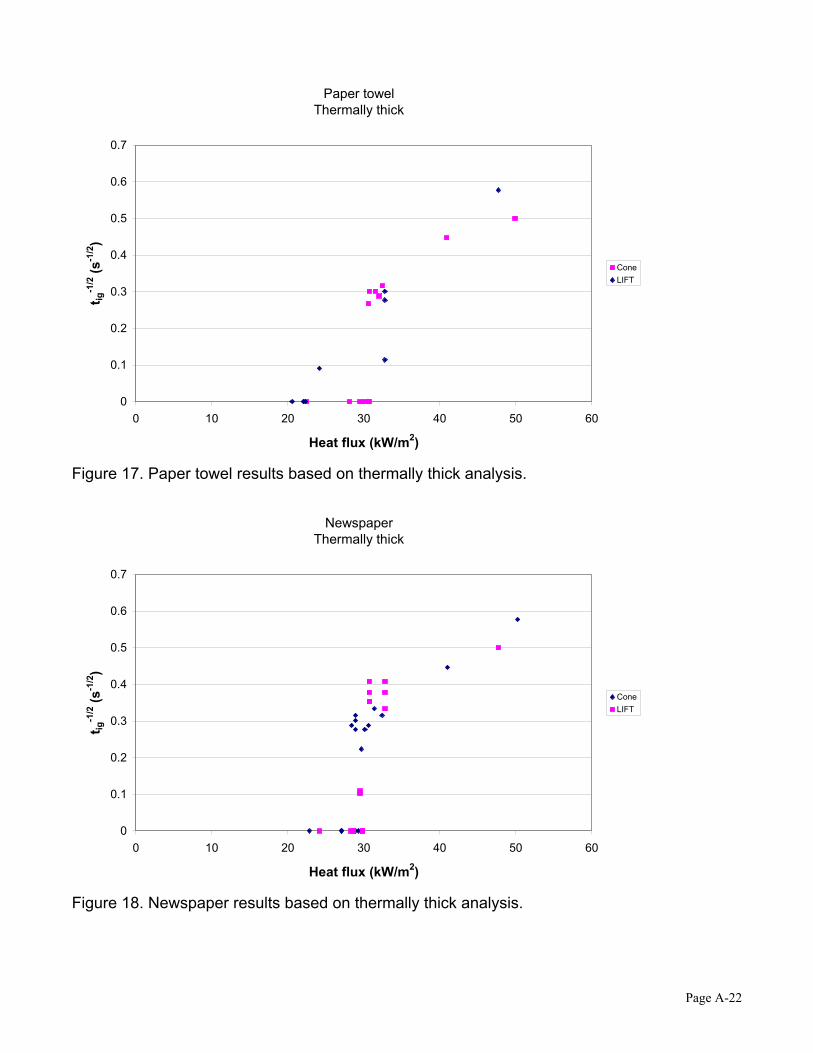
igt , is plotted as a function of the incident heat flux for eachof the ten materials. This form is relevant to the “thermally thin” analysis presented in the nextsection. In Figures 15 through 24, the inverse of the square root of the time to ignition, i.e.,
21 /igt − , is plotted as a function of the incident heat flux for each of the ten materials. This form is
relevant to the “thermally thick” analysis presented in the next section. Data for both the ConeCalorimeter tests and the LIFT apparatus tests are provided in each figure.
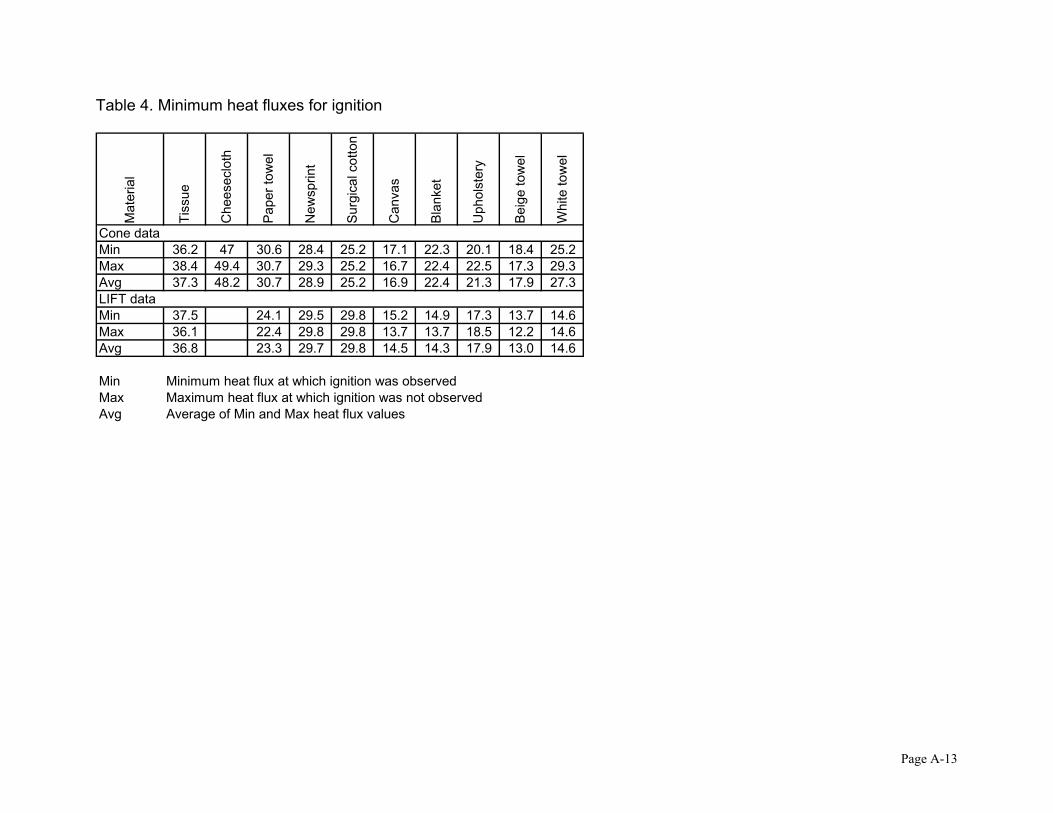
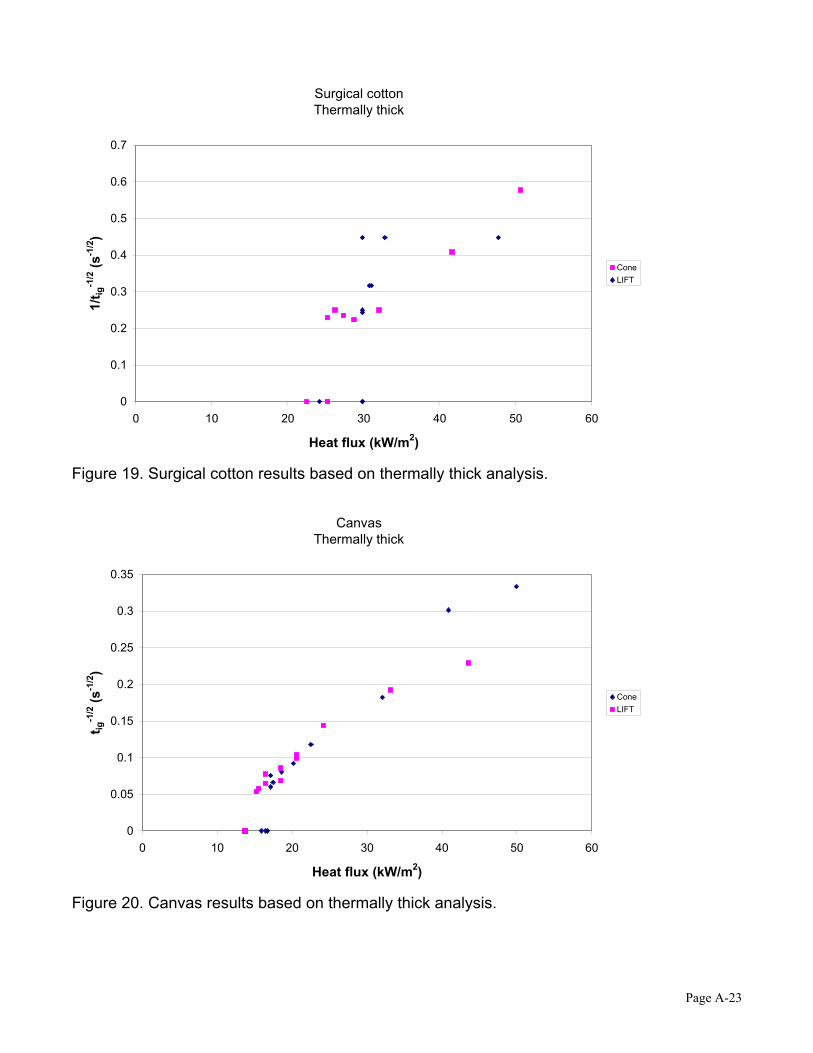
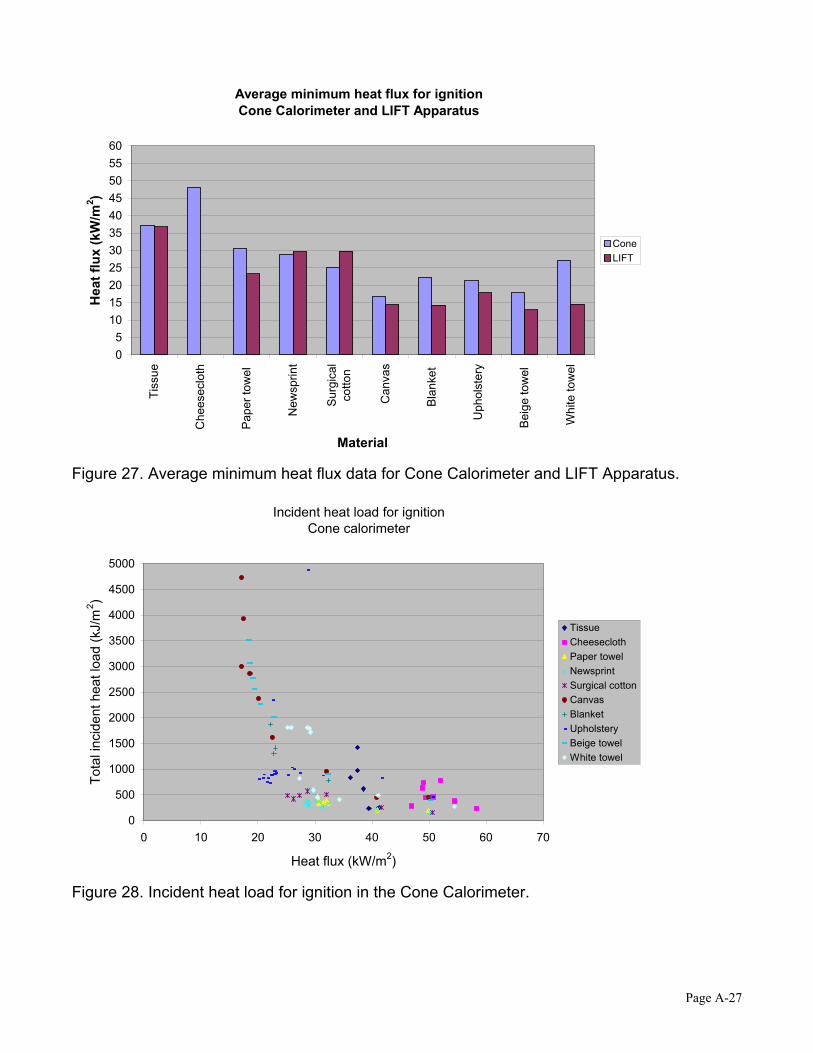
The minimum heat fluxes for ignition of each material are provided in Table 4 and in Figures 25through 27. For each material, Figures 25 and 26 provide the minimum heat fluxes at whichignition was observed, represented by “Min,” the maximum heat fluxes at which ignition was
Page A-4
not observed, represented by “Max,” and the average of the minimum and maximum values,represented by “Avg.” Figure 25 presents the data obtained in the Cone Calorimeter, whileFigure 26 presents the data from the LIFT apparatus. Figure 27 presents a side-by-sidecomparison of the average values for the minimum heat flux for ignition obtained in the two testdevices for each material.
Analysis
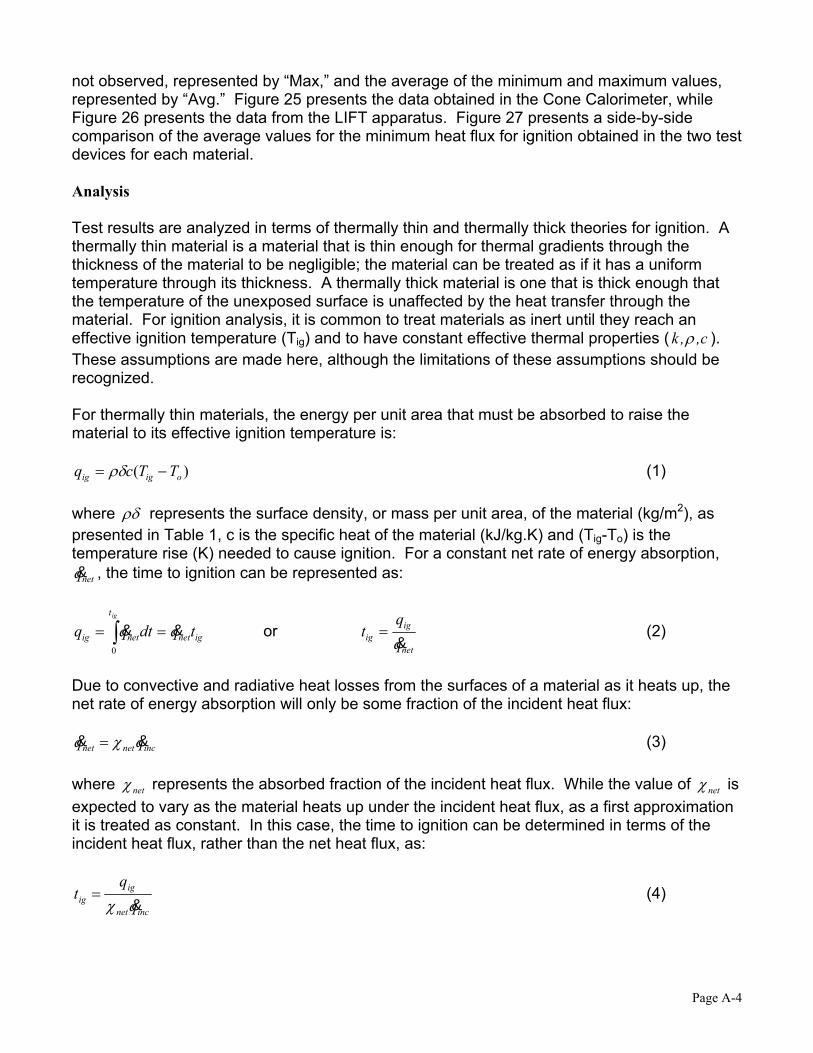
Test results are analyzed in terms of thermally thin and thermally thick theories for ignition. Athermally thin material is a material that is thin enough for thermal gradients through thethickness of the material to be negligible; the material can be treated as if it has a uniformtemperature through its thickness. A thermally thick material is one that is thick enough thatthe temperature of the unexposed surface is unaffected by the heat transfer through thematerial. For ignition analysis, it is common to treat materials as inert until they reach aneffective ignition temperature (Tig) and to have constant effective thermal properties ( c,,k ρ ).These assumptions are made here, although the limitations of these assumptions should berecognized.
For thermally thin materials, the energy per unit area that must be absorbed to raise thematerial to its effective ignition temperature is:
)( oigig TTcq −= ρδ (1)
where ρδ represents the surface density, or mass per unit area, of the material (kg/m2), aspresented in Table 1, c is the specific heat of the material (kJ/kg.K) and (Tig-To) is thetemperature rise (K) needed to cause ignition. For a constant net rate of energy absorption,
netq& , the time to ignition can be represented as:
ignet
t
netig tqdtqqig
&& == ∫0
ornet
igig q
qt
&= (2)
Due to convective and radiative heat losses from the surfaces of a material as it heats up, thenet rate of energy absorption will only be some fraction of the incident heat flux:
incnetnet qq && χ= (3)
where netχ represents the absorbed fraction of the incident heat flux. While the value of netχ isexpected to vary as the material heats up under the incident heat flux, as a first approximationit is treated as constant. In this case, the time to ignition can be determined in terms of theincident heat flux, rather than the net heat flux, as:
incnet
igig q
qt
&χ= (4)
Page A-5
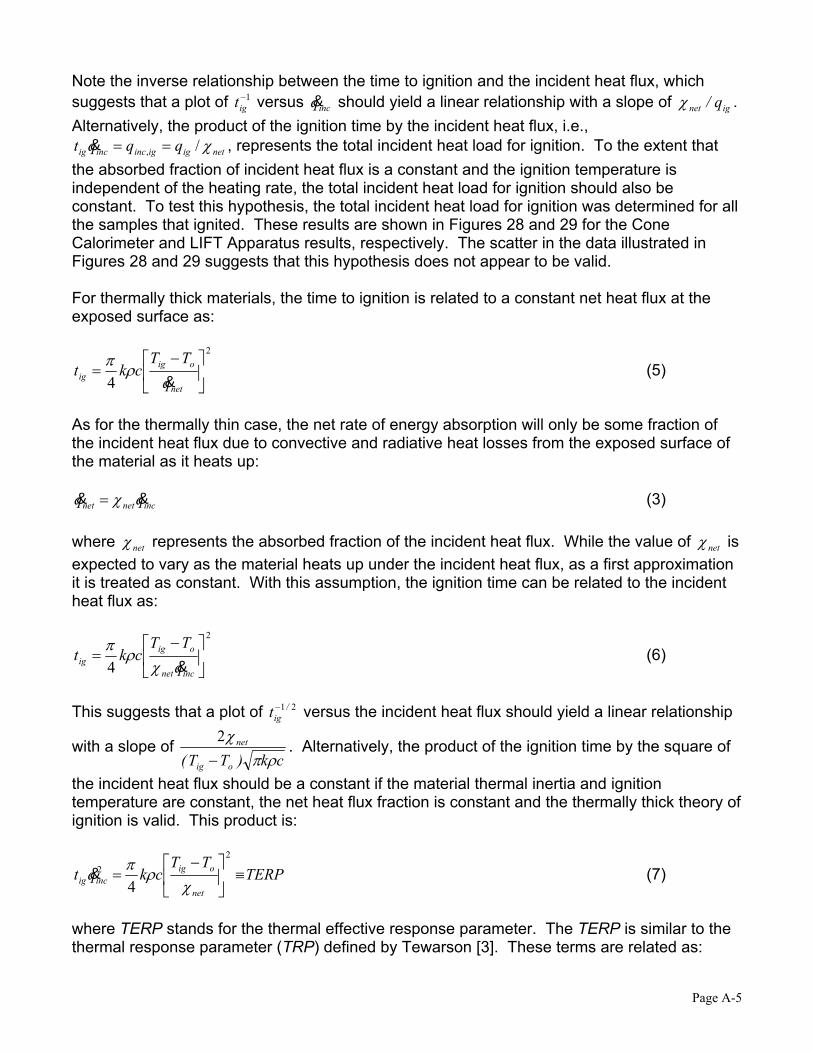
Note the inverse relationship between the time to ignition and the incident heat flux, whichsuggests that a plot of 1−
igt versus incq& should yield a linear relationship with a slope of ignet q/χ .Alternatively, the product of the ignition time by the incident heat flux, i.e.,
netigigincincig qqqt χ/, ==& , represents the total incident heat load for ignition. To the extent thatthe absorbed fraction of incident heat flux is a constant and the ignition temperature isindependent of the heating rate, the total incident heat load for ignition should also beconstant. To test this hypothesis, the total incident heat load for ignition was determined for allthe samples that ignited. These results are shown in Figures 28 and 29 for the ConeCalorimeter and LIFT Apparatus results, respectively. The scatter in the data illustrated inFigures 28 and 29 suggests that this hypothesis does not appear to be valid.
For thermally thick materials, the time to ignition is related to a constant net heat flux at theexposed surface as:
2
4
−=
net
oigig q
TTckt
&ρπ (5)
As for the thermally thin case, the net rate of energy absorption will only be some fraction ofthe incident heat flux due to convective and radiative heat losses from the exposed surface ofthe material as it heats up:
incnetnet qq && χ= (3)
where netχ represents the absorbed fraction of the incident heat flux. While the value of netχ isexpected to vary as the material heats up under the incident heat flux, as a first approximationit is treated as constant. With this assumption, the ignition time can be related to the incidentheat flux as:
2
4
−=
incnet
oigig q
TTckt
&χρπ (6)
This suggests that a plot of 21 /igt − versus the incident heat flux should yield a linear relationship
with a slope of ck)TT( oig
net
ρπχ
−2 . Alternatively, the product of the ignition time by the square of
the incident heat flux should be a constant if the material thermal inertia and ignitiontemperature are constant, the net heat flux fraction is constant and the thermally thick theory ofignition is valid. This product is:
TERPTT
ckqtnet
oigincig ≡
−=
22
4 χρπ& (7)
where TERP stands for the thermal effective response parameter. The TERP is similar to thethermal response parameter (TRP) defined by Tewarson [3]. These terms are related as:

Page A-6
2)/TRP(TERP netχ= (8)
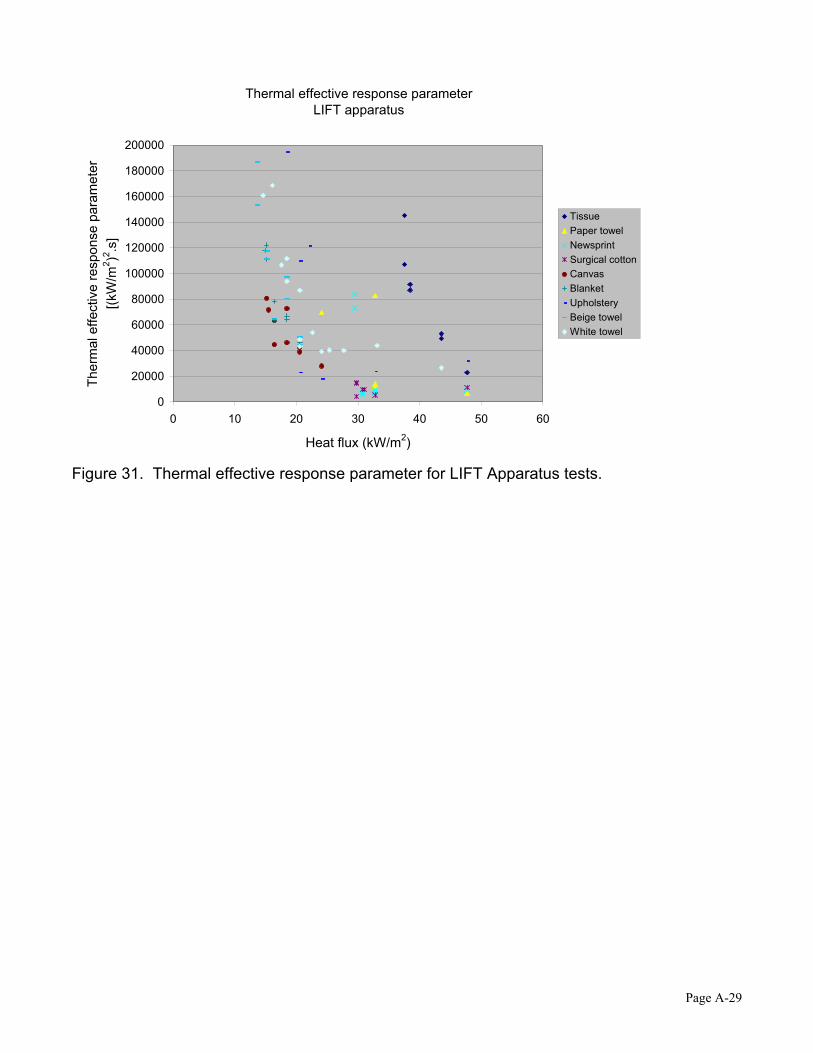
Values for the TERP are shown in Figures 30 and 31 for the Cone Calorimeter and LIFTApparatus results, respectively. The scatter in the data illustrated in Figures 30 and 31suggest that the assumptions stated above are not valid. There seems to be a general trendthat the TERP increases as the heat flux approaches the critical heat flux, suggesting that thenet heat flux fraction decreases as this limit is approached.
Discussion
The primary purpose of this investigation has been to determine the minimum heat fluxes forignition of different household combustibles. For all of the materials evaluated in both theCone Calorimeter and the LIFT Apparatus, except the surgical cotton, the minimum heat fluxfor ignition was found to be slightly lower in the LIFT Apparatus than in the Cone Calorimeter.The reason for this has not been conclusively determined. Possible reasons include thedifferences in sample size (100 mm x 100 mm versus 150 mm x 150 mm), sample orientation(horizontal versus vertical) and radiant source (electrical coil versus gas-fire panel).
Another potential reason for the differences in the minimum heat fluxes for ignition between theCone Calorimeter and the LIFT Apparatus was the sample mounting procedure used. Whilethe intention of the sample mounting was to permit the materials to be freely suspended in airwithout a backing material, in the LIFT Apparatus, one of the vertical edges of the sample wasin contact with the supporting Marinite test frame, as shown in Figure 7. During testing in theLIFT Apparatus, it was observed that the section of material in contact with the Marinite testframe would typically discolor first and ignition would typically occur first in this area,suggesting that contact of the test sample with the test frame influenced the heating of thesample in this area. Additional testing should be conducted to further explore the magnitude ofthese effects. This observation also suggests that multiple thicknesses of the test materialsshould be evaluated to determine the effect on the minimum heat flux for ignition.
The experimental data generally seems to indicate an inverse relationship between the surfacedensity and the minimum heat flux for ignition, with the heavier materials igniting at lower heatfluxes than the lighter materials. This seems to be related to the rapid loss of pyrolyzates forthe lighter materials. Contrary to the assumption of inert materials that do not pyrolyze untilreaching a well-defined ignition temperature, these real materials would begin smoking atrelatively low temperatures, but would not ignite, presumably because an ignitableconcentration of pyrolyzates did not form at the surface of the material.
In the LIFT Apparatus, the cotton canvas, the cotton blanket and the beige and white cottonterrycloth towels all exhibited similar minimum heat fluxes for ignition in the range of 12 to 15kW/m2. In the Cone Calorimeter, these same materials exhibited minimum heat fluxes forignition in the range of about 17 to 25 kW/m2, with the cotton canvas demonstrating the lowestminimum heat flux for ignition. In general, the cotton canvas seemed to exhibit behavioramong the most consistent of all the materials tested. This may be due to its relatively smoothsurface in comparison with these other materials. In view of its low minimum heat flux forignition and its fairly consistent ignition behavior, the canvas may be the best candidate toserve as a fire indicator of the ten materials evaluated.
Page A-7
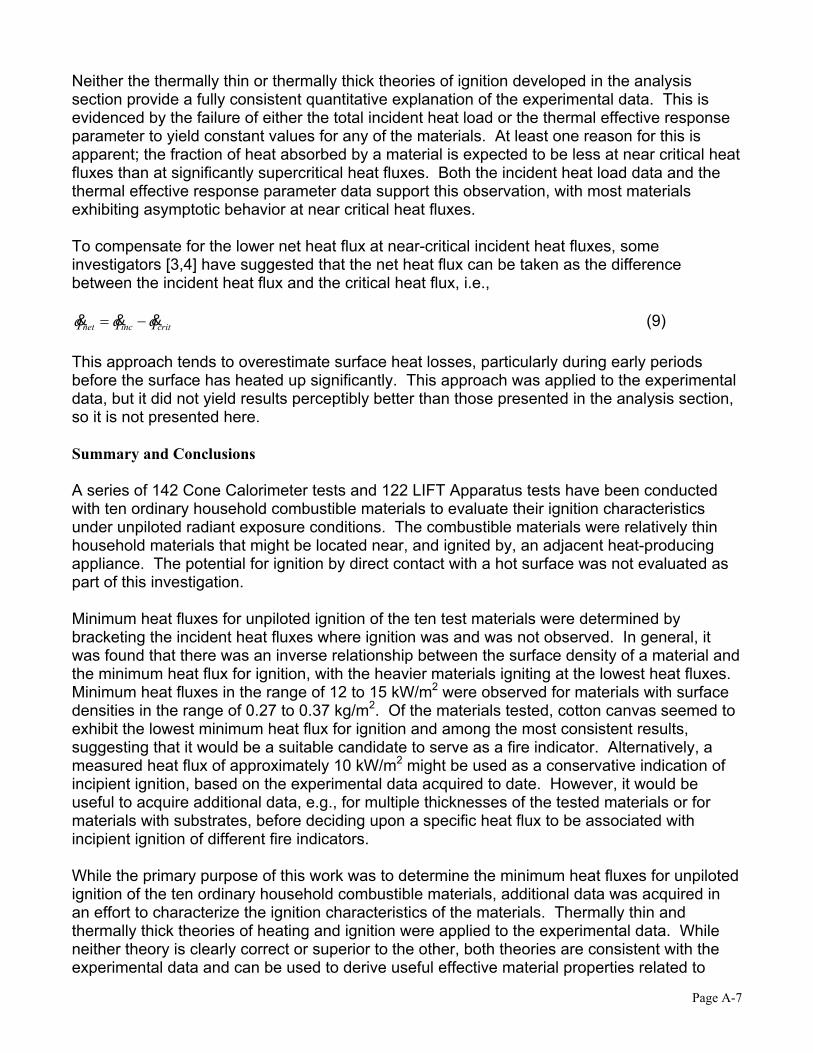
Neither the thermally thin or thermally thick theories of ignition developed in the analysissection provide a fully consistent quantitative explanation of the experimental data. This isevidenced by the failure of either the total incident heat load or the thermal effective responseparameter to yield constant values for any of the materials. At least one reason for this isapparent; the fraction of heat absorbed by a material is expected to be less at near critical heatfluxes than at significantly supercritical heat fluxes. Both the incident heat load data and thethermal effective response parameter data support this observation, with most materialsexhibiting asymptotic behavior at near critical heat fluxes.
To compensate for the lower net heat flux at near-critical incident heat fluxes, someinvestigators [3,4] have suggested that the net heat flux can be taken as the differencebetween the incident heat flux and the critical heat flux, i.e.,
critincnet qqq &&& −= (9)
This approach tends to overestimate surface heat losses, particularly during early periodsbefore the surface has heated up significantly. This approach was applied to the experimentaldata, but it did not yield results perceptibly better than those presented in the analysis section,so it is not presented here.
Summary and Conclusions
A series of 142 Cone Calorimeter tests and 122 LIFT Apparatus tests have been conductedwith ten ordinary household combustible materials to evaluate their ignition characteristicsunder unpiloted radiant exposure conditions. The combustible materials were relatively thinhousehold materials that might be located near, and ignited by, an adjacent heat-producingappliance. The potential for ignition by direct contact with a hot surface was not evaluated aspart of this investigation.
Minimum heat fluxes for unpiloted ignition of the ten test materials were determined bybracketing the incident heat fluxes where ignition was and was not observed. In general, itwas found that there was an inverse relationship between the surface density of a material andthe minimum heat flux for ignition, with the heavier materials igniting at the lowest heat fluxes.Minimum heat fluxes in the range of 12 to 15 kW/m2 were observed for materials with surfacedensities in the range of 0.27 to 0.37 kg/m2. Of the materials tested, cotton canvas seemed toexhibit the lowest minimum heat flux for ignition and among the most consistent results,suggesting that it would be a suitable candidate to serve as a fire indicator. Alternatively, ameasured heat flux of approximately 10 kW/m2 might be used as a conservative indication ofincipient ignition, based on the experimental data acquired to date. However, it would beuseful to acquire additional data, e.g., for multiple thicknesses of the tested materials or formaterials with substrates, before deciding upon a specific heat flux to be associated withincipient ignition of different fire indicators.
While the primary purpose of this work was to determine the minimum heat fluxes for unpilotedignition of the ten ordinary household combustible materials, additional data was acquired inan effort to characterize the ignition characteristics of the materials. Thermally thin andthermally thick theories of heating and ignition were applied to the experimental data. Whileneither theory is clearly correct or superior to the other, both theories are consistent with theexperimental data and can be used to derive useful effective material properties related to

Page A-8
ignition characteristics. Additional data and a more detailed numerical analysis would beuseful to further explore and characterize the material and ignition properties of the tenhousehold combustibles evaluated in this investigation.

Page A-9
References
1. ASTM International, Standard Test Method for Heat and Visible Smoke Release Ratesfor Materials and Products Using an Oxygen Consumption Calorimeter, StandardE1354-02, 2002.
2. ASTM International, Standard Test Method for Determining Material Ignition and FlameSpread Properties, Standard E1321-97a, 2002.
3. Tewarson, A., “Generation of Heat and Chemical Compounds in Fires,” Section 3 /Chapter 4 in The SFPE Handbook of Fire Protection Engineering (3rd edition), P. J.DiNenno, Editor-in-Chief, Society of Fire Protection Engineers, 2002.
4. Fleischmann, C.M., and Chen, F.F., “Radiant Ignition of Upholstered Furniture,”Proceedings of the International Conference on Engineered Fire Protection Design,Society of Fire Protection Engineers, 2001.
Page A-10
Table 1. Representative surface densities for materials, ranked from lightest to heaviest.
Material Surfacedensity(kg/m2)
Tissue paper (white) 0.016Cheesecloth 0.040Paper towel (white) 0.041Newsprint (black and white) 0.049Surgical cotton 0.072Canvas 0.273Blanket (White cotton) 0.285Upholstery fabric (blue) 0.336Beige towel (terrycloth) 0.356White towel (terrycloth) 0.366

Page A-11
Table 2. Times to ignition as function of heat flux for Cone Calorimeter tests.H
eat f
lux
(kW
/m2 )
Tiss
ue
Hea
t flu
x (k
W/m
2 )
Che
esec
loth
Hea
t flu
x (k
W/m
2 )
Pape
r tow
el
Hea
t flu
x (k
W/m
2 )
New
sprin
t
Hea
t flu
x (k
W/m
2 )
Surg
ical
cot
ton
Hea
t flu
x (k
W/m
2 )
Can
vas
Hea
t flu
x (k
W/m
2 )
Blan
ket
Hea
t flu
x (k
W/m
2 )
Uph
olst
ery
Hea
t flu
x (k
W/m
2 )
Beig
e to
wel
Hea
t flu
x (k
W/m
2 )
Whi
te to
wel
34.9 NI 43.5 NI 22.5 NI 22.8 NI 22.5 NI 15.9 NI 17.3 NI 20.1 40 17.0 NI 24.1 NI36.2 23 47.0 6 28.1 NI 27.1 NI 25.2 NI 16.5 NI 20.4 NI 20.8 40 17.3 NI 24.3 NI36.3 NI 47.8 NI 29.5 NI 27.1 NI 25.2 NI 16.7 NI 22.0 NI 20.9 43 17.3 NI 25.0 NI36.7 NI 48.1 NI 30.1 NI 28.4 12 25.2 NI 17.1 175 22.1 NI 21.5 35 18.4 191 25.2 7236.7 NI 48.5 NI 30.6 NI 28.9 10 25.2 19 17.1 276 22.3 84 21.7 38 18.6 165 25.8 7037.5 NI 48.8 13 30.6 14 28.9 11 26.2 16 17.4 225 22.4 NI 22.0 33 19.1 145 26.7 NI37.5 38 49.0 NI 30.7 11 28.9 13 27.3 18 18.6 154 22.8 57 22.2 40 19.4 132 27.3 3037.5 26 49.0 15 30.7 NI 28.9 NI 28.7 20 20.1 118 23.1 61 22.3 40 20.4 111 28.1 NI38.0 NI 49.4 NI 31.5 11 29.3 NI 32.0 16 22.5 72 32.4 24 22.5 NI 22.8 88 28.7 6338.4 NI 49.4 9 32.0 12 29.6 20 41.6 6 32.0 30 41.0 12 22.5 104 32.4 28 29.0 6238.5 16 50.7 9 32.4 10 30.1 13 50.6 3 40.9 11 50.3 9 22.8 42 41.0 12 29.2 5939.5 6 52.0 15 40.9 5 30.6 12 49.9 9 22.8 40 50.3 8 29.3 NI41.2 6 54.5 7 49.9 4 31.4 9 23.1 40 29.7 20
58.3 4 32.4 10 24.0 632 30.4 1541.0 5 24.3 1060 34.3 1250.3 3 25.2 35 41.1 12
25.8 40 54.5 526.2 3827.3 3428.7 17031.3 2841.6 2050.6 9

Page A-12
Test 3. Times to ignition as function of heat flux for LIFT Apparatus tests.H
eat f
lux
(kW
/m2 )
Tiss
ue
Hea
t flu
x (k
W/m
2 )
Che
esec
loth
Hea
t flu
x (k
W/m
2 )
Pape
r tow
el
Hea
t flu
x (k
W/m
2 )
New
sprin
t
Hea
t flu
x (k
W/m
2 )
Surg
ical
cot
ton
Hea
t flu
x (k
W/m
2 )
Can
vas
Hea
t flu
x (k
W/m
2 )
Blan
ket
Hea
t flu
x (k
W/m
2 )
Uph
olst
ery
Hea
t flu
x (k
W/m
2 )
Beig
e to
wel
Hea
t flu
x (k
W/m
2 )
Whi
te to
wel
35.8 NI 20.6 NI 24.1 NI 24.1 NI 13.7 NI 13.41 NI 16.7 NI 11.92 NI 13.7 NI35.8 NI 22.1 NI 28.3 NI 29.8 NI 13.71 NI 13.71 NI 16.7 NI 12.22 NI 14.6 NI36.1 NI 22.1 NI 28.6 NI 29.8 16 13.71 NI 13.71 NI 16.7 NI 12.22 NI 14.6 75437.5 76 22.4 NI 28.6 NI 29.8 17 15.2 350 14.9 532 17.3 NI 13.7 995 16.1 65237.5 103 24.1 120 29.5 84 29.8 NI 15.5 298 15.2 480 17.3 865 13.71 815 17.6 34538.4 62 32.8 77 29.5 96 29.8 5 16.4 236 15.2 529 18.5 570 15.2 481 18.5 27538.4 59 32.8 13 29.8 NI 30.7 10 16.4 166 16.4 291 18.5 NI 15.2 510 18.5 32743.5 28 32.8 11 29.8 NI 31.0 10 18.5 213 16.4 237 18.5 NI 16.4 240 20.6 11543.5 26 47.7 3 30.7 7 32.8 5 18.5 135 18.5 196 18.5 911 18.5 286 20.6 20647.7 10 30.7 8 47.7 5 20.6 92 18.5 189 20.6 54 18.5 236 20.6 102
30.7 8 20.6 101 20.6 110 20.6 54 20.6 120 22.6 10530.7 6 24.1 48 20.6 123 20.6 260 20.6 106 24.1 6732.8 9 33.1 27 24.1 50 22.1 250 24.1 64 25.3 6332.8 7 43.5 19 32.8 23 24.1 31 24.1 59 27.7 5232.8 6 47.7 14 32.8 22 32.8 36 33.1 4047.7 4 47.7 14 47.7 15 43.5 14
Page A-13
Table 4. Minimum heat fluxes for ignitionM
ater
ial
Tiss
ue
Che
esec
loth
Pape
r tow
el
New
sprin
t
Surg
ical
cot
ton
Can
vas
Blan
ket
Uph
olst
ery
Beig
e to
wel
Whi
te to
wel
Cone dataMin 36.2 47 30.6 28.4 25.2 17.1 22.3 20.1 18.4 25.2Max 38.4 49.4 30.7 29.3 25.2 16.7 22.4 22.5 17.3 29.3Avg 37.3 48.2 30.7 28.9 25.2 16.9 22.4 21.3 17.9 27.3LIFT dataMin 37.5 24.1 29.5 29.8 15.2 14.9 17.3 13.7 14.6Max 36.1 22.4 29.8 29.8 13.7 13.7 18.5 12.2 14.6Avg 36.8 23.3 29.7 29.8 14.5 14.3 17.9 13.0 14.6
Min Minimum heat flux at which ignition was observedMax Maximum heat flux at which ignition was not observedAvg Average of Min and Max heat flux values

Page A-14
Figure 1. Sample dimensions for Cone Calorimeter testing.
Figure 2. Representative sample mounted in Cone Calorimeter sample holder.
100 mm
100mm
176mm
176 mm
100 mm
100mm
90 mm

Page A-15
Figure 3. Sample dimensions for LIFT Apparatus testing.
Figure 4. Representative sample mounted in LIFT Apparatus sample holder as viewed fromback.
150 mm
150mm
229mm
229 mm
Sample
Marinitesample frame
Leaf springsampleholder

Page A-16
Figure 5. Tissue paper results based on thermally thin analysis.
Figure 6. Cheesecloth results based on thermally thin analysis.
TissueThermally thin
0
0.02
0.04
0.06
0.08
0.1
0.12
0.14
0.16
0.18
0 10 20 30 40 50 60
Heat flux (kW/m2)
1/t ig
(s-1
)
ConeLIFT
CheeseclothThermally thin
0
0.05
0.1
0.15
0.2
0.25
0.3
0 10 20 30 40 50 60
Heat flux (kW/m2)
1/t ig
(s-1
)
Cone
Page A-17
Figure 7. Paper towel results based on thermally thin analysis.
Figure 8. Newspaper results based on thermally thin analysis.
Paper towelThermally thin
0
0.05
0.1
0.15
0.2
0.25
0.3
0.35
0 10 20 30 40 50 60
Heat flux (kW/m2)
1/t ig
(s-1
)
ConeLIFT
NewspaperThermally thin
0
0.05
0.1
0.15
0.2
0.25
0.3
0.35
0 10 20 30 40 50 60
Heat flux (kW/m2)
1/t ig
(s-1
)
ConeLIFT
Page A-18
Figure 9. Surgical cotton results based on thermally thin analysis.
Figure 10. Canvas results based on thermally thin analysis.
Surgical cottonThermally thin
0
0.05
0.1
0.15
0.2
0.25
0.3
0.35
0 10 20 30 40 50 60
Heat flux (kW/m2)
1/t ig
(s-1
)
ConeLIFT
CanvasThermally thin
0
0.02
0.04
0.06
0.08
0.1
0.12
0 10 20 30 40 50 60
Heat flux (kW/m2)
1/t ig
(s-1
)
ConeLIFT

Page A-19
Figure 11. Cotton blanket results based on thermally thin analysis.
Figure 12. Blue upholstery fabric results based on thermally thin analysis.
BlanketThermally thin
0
0.02
0.04
0.06
0.08
0.1
0.12
0 10 20 30 40 50 60
Heat flux (kW/m2)
1/t ig
(s-1
)
ConeLIFT
UpholsteryThermally thin
0
0.02
0.04
0.06
0.08
0.1
0.12
0 10 20 30 40 50 60
Heat flux (kW/m2)
1/t ig
(s-1
)
ConeLIFT
Page A-20
Figure 13. Beige terrycloth towel results based on thermally thin analysis.
Figure 14. White terrycloth towel results based on thermally thin analysis.
Beige towelThermally thin
0
0.02
0.04
0.06
0.08
0.1
0.12
0.14
0 10 20 30 40 50 60
Heat flux (kW/m2)
1/t ig
(s-1
)
ConeLIFT
White towelThermally thin
0
0.05
0.1
0.15
0.2
0.25
0 10 20 30 40 50 60
Heat flux (kW/m2)
1/t ig
(s-1
)
ConeLIFT
Page A-21
Figure 15. Tissue paper results based on thermally thick analysis.
Figure 16. Cheesecloth results based on thermally thick analysis.
TissueThermally thick
0
0.05
0.1
0.15
0.2
0.25
0.3
0.35
0.4
0.45
0 10 20 30 40 50 60
Heat flux (kW/m2)
t ig-1
/2 (s
-1/2
)
ConeLIFT
CheeseclothThermally thick
0
0.1
0.2
0.3
0.4
0.5
0.6
0 10 20 30 40 50 60
Heat flux (kW/m2)
t ig-1
/2 (s
-1/2
)
Cone
Page A-22
Figure 17. Paper towel results based on thermally thick analysis.
Figure 18. Newspaper results based on thermally thick analysis.
Paper towelThermally thick
0
0.1
0.2
0.3
0.4
0.5
0.6
0.7
0 10 20 30 40 50 60
Heat flux (kW/m2)
t ig-1
/2 (s
-1/2
)
ConeLIFT
NewspaperThermally thick
0
0.1
0.2
0.3
0.4
0.5
0.6
0.7
0 10 20 30 40 50 60
Heat flux (kW/m2)
t ig-1
/2 (s
-1/2
)
ConeLIFT
Page A-23
Figure 19. Surgical cotton results based on thermally thick analysis.
Figure 20. Canvas results based on thermally thick analysis.
Surgical cottonThermally thick
0
0.1
0.2
0.3
0.4
0.5
0.6
0.7
0 10 20 30 40 50 60
Heat flux (kW/m2)
1/t ig
-1/2
(s-1
/2)
ConeLIFT
CanvasThermally thick
0
0.05
0.1
0.15
0.2
0.25
0.3
0.35
0 10 20 30 40 50 60
Heat flux (kW/m2)
t ig-1
/2 (s
-1/2
)
ConeLIFT

Page A-24
Figure 21. Cotton blanket results based on thermally thick analysis.
Figure 12. Blue upholstery fabric results based on thermally thick analysis.
BlanketThermally thick
0
0.05
0.1
0.15
0.2
0.25
0.3
0.35
0 10 20 30 40 50 60
Heat flux (kW/m2)
t ig-1
/2 (s
-1/2
)
ConeLIFT
UpholsteryThermally thick
0
0.05
0.1
0.15
0.2
0.25
0.3
0.35
0 10 20 30 40 50 60
Heat flux (kW/m2)
t ig-1
/2 (s
-1/2
)
ConeLIFT

Page A-25
Figure 23. Beige terrycloth towel results based on thermally thick analysis.
Figure 24. White terrycloth towel results based on thermally thick analysis.
Beige towelThermally thick
0
0.05
0.1
0.15
0.2
0.25
0.3
0.35
0.4
0 10 20 30 40 50 60
Heat flux (kW/m2)
t ig-1
/2 (s
-1/2
)
ConeLIFT
White towelThermally thick
0
0.05
0.1
0.15
0.2
0.25
0.3
0.35
0.4
0.45
0.5
0 10 20 30 40 50 60
Heat flux (kW/m2)
t ig-1
/2 (s
-1/2
)
ConeLIFT
Page A-26
Figure 25. Minimum heat flux results for the Cone Calorimeter.
Figure 26. Minimum heat flux results for the LIFT apparatus.
Minimum heat flux for ignitionCone Calorimeter
0
10
20
30
40
50
60Ti
ssue
Che
esec
loth
Pape
r tow
el
New
sprin
t
Surg
ical
cotto
n
Can
vas
Blan
ket
Uph
olst
ery
Beig
e to
wel
Whi
te to
wel
Material
Hea
t flu
x (k
W/m
2 )
MinMaxAvg
Minimum heat flux for ignitionLIFT Apparatus
0
10
20
30
40
50
60
Tiss
ue
Che
esec
loth
Pape
r tow
el
New
sprin
t
Surg
ical
cotto
n
Can
vas
Blan
ket
Uph
olst
ery
Beig
e to
wel
Whi
te to
wel
Material
Hea
t flu
x (k
W/m
2 )
MinMaxAvg
Page A-27
Figure 27. Average minimum heat flux data for Cone Calorimeter and LIFT Apparatus.
Figure 28. Incident heat load for ignition in the Cone Calorimeter.
Average minimum heat flux for ignitionCone Calorimeter and LIFT Apparatus
05
1015202530354045505560
Tiss
ue
Che
esec
loth
Pape
r tow
el
New
sprin
t
Surg
ical
cotto
n
Can
vas
Blan
ket
Uph
olst
ery
Beig
e to
wel
Whi
te to
wel
Material
Hea
t flu
x (k
W/m
2 )
ConeLIFT
Incident heat load for ignitionCone calorimeter
0
500
1000
1500
2000
2500
3000
3500
4000
4500
5000
0 10 20 30 40 50 60 70
Heat flux (kW/m2)
Tota
l inc
iden
t hea
t loa
d (k
J/m
2 )
TissueCheeseclothPaper towel NewsprintSurgical cottonCanvasBlanket UpholsteryBeige towel White towel

Page A-28
Figure 29. Incident heat load for ignition in the LIFT Apparatus.
Figure 30. Thermal effective response parameter for Cone Calorimeter tests.
Incident heat load for ignitionLIFT apparatus
0
2000
4000
6000
8000
10000
12000
14000
16000
18000
0 10 20 30 40 50 60
Heat flux (kW/m2)
Tota
l inc
iden
t hea
t loa
d (k
J/m
2 )
TissuePaper towel NewsprintSurgical cottonCanvasBlanket UpholsteryBeige towel White towel
Thermal effective response parameterCone calorimeter
0
10000
20000
30000
40000
50000
60000
70000
80000
90000
100000
0 10 20 30 40 50 60 70
Heat flux (kW/m2)
Ther
mal
effe
ctiv
e re
spon
se p
aram
eter
[(k
W/m
2 )2 .s]
TissueCheeseclothPaper towel NewsprintSurgical cottonCanvasBlanket UpholsteryBeige towel White towel
Page A-29
Figure 31. Thermal effective response parameter for LIFT Apparatus tests.
Thermal effective response parameterLIFT apparatus
0
20000
40000
60000
80000
100000
120000
140000
160000
180000
200000
0 10 20 30 40 50 60
Heat flux (kW/m2)
Ther
mal
effe
ctiv
e re
spon
se p
aram
eter
[(k
W/m
2 )2 .s]
TissuePaper towel NewsprintSurgical cottonCanvasBlanket UpholsteryBeige towel White towel