Embed Size (px)
Citation preview

© BUSHFIRE CRC LTD 2006
PROGRAM A REPORT NO. A.10.01
FIRE DYNAMICS IN MALLEE-HEATH FUEL, WEATHER AND FIRE BEHAVIOUR PREDICTION IN SOUTH AUSTRALIAN SEMI-ARID SHRUBLANDS
M.G. Cruz1, S. Matthews1, J. Gould1, P. Ellis1, M. Henderson2, I. Knight1, J. Watters1 1 Bushfire Dynamics and Applications, CSIRO Sustainable Ecosystems and CSIRO Climate Adaptation Flagship,
Canberra, ACT, Australia 2 Department of Environment and Heritage, Adelaide, SA, Australia

© Bushfire Cooperative Research Centre 2006.
No part of this publication must be reproduced, stored in a retrieval system or transmitted in any form without prior written permission from the copyright owner, except under the conditions permitted under the Australian Copyright Act 1968 and subsequent amendments.
Publisher:
CSIRO Sustainable Ecosystems Canberra, ACT, Australia
ISBN: 0 00000 000 0
March 2010

© BUSHFIRE CRC LTD 2006
PROGRAM A REPORT NO. A.10.01
FIRE DYNAMICS IN MALLEE-HEATH FUEL, WEATHER AND FIRE BEHAVIOUR PREDICTION IN SOUTH AUSTRALIAN SEMI-ARID SHRUBLANDS
M.G. Cruz1, S. Matthews1, J. Gould1, P. Ellis1, M. Henderson2, I. Knight1, J. Watters1 1 Bushfire Dynamics and Applications, CSIRO Sustainable Ecosystems and CSIRO Climate Adaptation Flagship,
Canberra, ACT, Australia 2 Department of Environment and Heritage, Adelaide, SA, Australia


PROGRAM A :: REPORT NO. A.10.01
i
CONTENTS ABSTRACT - FIRE DYNAMICS IN MALLEE-HEATH 0H1 ACKNOWLEDGEMENTS 1H2 EXECUTIVE SUMMARY 2H3 2. EXPERIMENTAL DESIGN 3H6 2.1. Site characteristics 4H6 2.2. Fire climate 5H9 2.3. Plot layout 6H13 2.4. Methods 7H14 3. FUEL COMPLEX DYNAMICS 8H19 3.1. Introduction 9H19 3.2. Methods 10H22 3.3. Results 11H24 3.4. Discussion and conclusions 12H34 4. FUEL MOISTURE 13H39 4.1. Introduction 14H39 4.2. Field measurements 15H39 4.3. Modelling 16H44 5. FIRE BEHAVIOUR - EXPERIMENTS 17H56 5.1. Introduction 18H56 5.2. Methods 19H56 5.3. Results 20H61 5.4. Concluding remarks 21H86 6. FIRE MODELLING 22H87 6.1. Introduction 23H87 6.2. Methods 24H88 6.3. Results and discussion 25H91 6.4. Concluding remarks 26H105 REFERENCES 27H107 APPENDIX 1 – FUEL DATA 28H113 APPENDIX 2. VISUAL ASSESSMENT SCORING KEY 29H120 APPENDIX 3 – FUEL MICROCLIMATE 30H125 A.3.1. Methods 31H125 A.3.2. Results 32H126 A.3.3. Discussion 33H130 APPENDIX 4 – VERTICAL WIND PROFILE 34H132 A.4.1. Methods 35H132 A.4.2. Results 36H133

PROGRAM A :: REPORT NO. A.10.01
ii
PROGRAM A :: REPORT NO. A.10.01
1
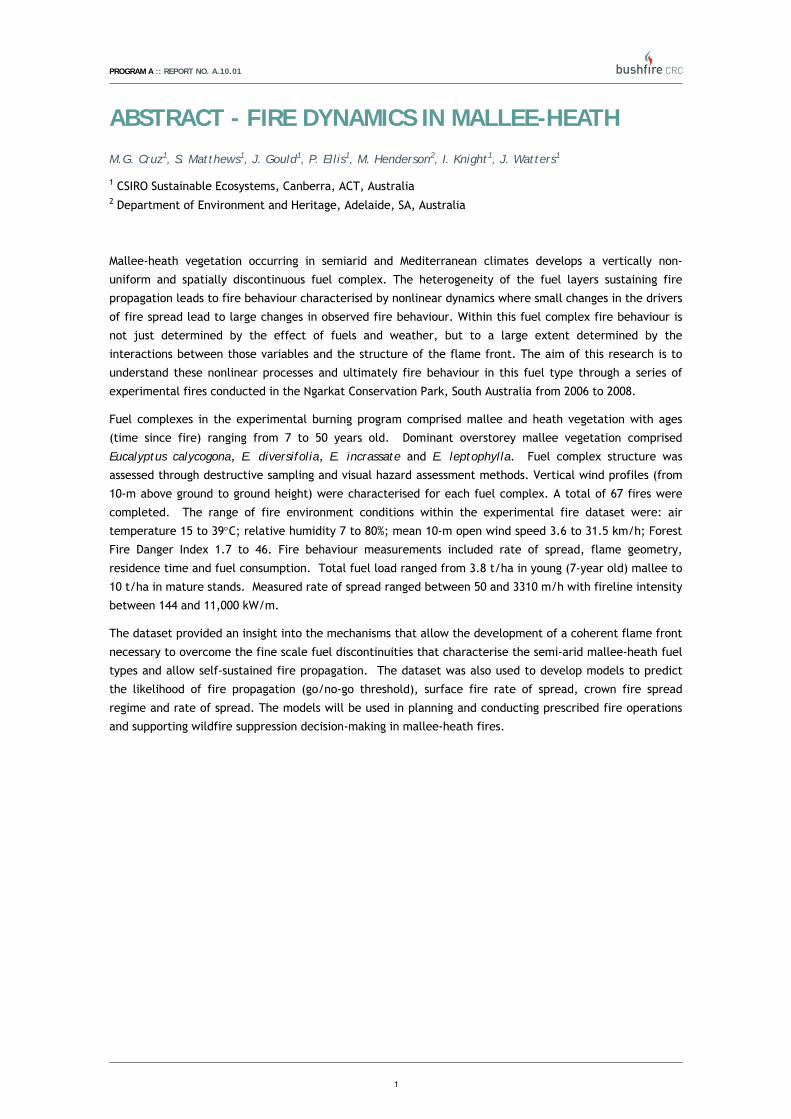
0BABSTRACT - FIRE DYNAMICS IN MALLEE-HEATH 68BM.G. Cruz1, S. Matthews1, J. Gould1, P. Ellis1, M. Henderson2, I. Knight1, J. Watters1
1 CSIRO Sustainable Ecosystems, Canberra, ACT, Australia 2 Department of Environment and Heritage, Adelaide, SA, Australia
Mallee-heath vegetation occurring in semiarid and Mediterranean climates develops a vertically non-
uniform and spatially discontinuous fuel complex. The heterogeneity of the fuel layers sustaining fire
propagation leads to fire behaviour characterised by nonlinear dynamics where small changes in the drivers
of fire spread lead to large changes in observed fire behaviour. Within this fuel complex fire behaviour is
not just determined by the effect of fuels and weather, but to a large extent determined by the
interactions between those variables and the structure of the flame front. The aim of this research is to
understand these nonlinear processes and ultimately fire behaviour in this fuel type through a series of
experimental fires conducted in the Ngarkat Conservation Park, South Australia from 2006 to 2008.
Fuel complexes in the experimental burning program comprised mallee and heath vegetation with ages
(time since fire) ranging from 7 to 50 years old. Dominant overstorey mallee vegetation comprised
Eucalyptus calycogona, E. diversifolia, E. incrassate and E. leptophylla. Fuel complex structure was
assessed through destructive sampling and visual hazard assessment methods. Vertical wind profiles (from
10-m above ground to ground height) were characterised for each fuel complex. A total of 67 fires were
completed. The range of fire environment conditions within the experimental fire dataset were: air
temperature 15 to 39°C; relative humidity 7 to 80%; mean 10-m open wind speed 3.6 to 31.5 km/h; Forest
Fire Danger Index 1.7 to 46. Fire behaviour measurements included rate of spread, flame geometry,
residence time and fuel consumption. Total fuel load ranged from 3.8 t/ha in young (7-year old) mallee to
10 t/ha in mature stands. Measured rate of spread ranged between 50 and 3310 m/h with fireline intensity
between 144 and 11,000 kW/m.
The dataset provided an insight into the mechanisms that allow the development of a coherent flame front
necessary to overcome the fine scale fuel discontinuities that characterise the semi-arid mallee-heath fuel
types and allow self-sustained fire propagation. The dataset was also used to develop models to predict
the likelihood of fire propagation (go/no-go threshold), surface fire rate of spread, crown fire spread
regime and rate of spread. The models will be used in planning and conducting prescribed fire operations
and supporting wildfire suppression decision-making in mallee-heath fires.

PROGRAM A :: REPORT NO. A.10.01
2
1BACKNOWLEDGEMENTS We, the authors, are grateful for the support of South Australia Department for Environment and Heritage
(DEH) for permission to conduct experimental fires within the Ngarkat Conservation Park and to very many
people have helped us in many ways. In particular, we are indebted to Brett Stephens and Murrayland
Regional staff for is support, coordination and DEH responsibility for fire suppression during the
experiments. Special thanks to South Australia Country Fire Service and Victoria Department of
Sustainability and Environment for providing additional suppression resources. Fire management and
research organizations staff from ACT, SCION (New Zealand), Western Australia, University of Melbourne
(Victoria), Department of Sustainability and Environment (Victoria) and Universitat Politecnica de
Catalunya (Spain) participated in the field experiments. This research was support by Bushfire Cooperative
Research Centre and CSIRO.

PROGRAM A :: REPORT NO. A.10.01
3
2BEXECUTIVE SUMMARY
37BWhy
Fuel complex dynamics, fire weather and behaviour are poorly understood in semi-arid mallee-heath
shrublands. Information on these three fire environment facets is required to support a spectrum of fire
management activities in these fuel types. The understanding of how these factors are linked and
determine fire characteristics and effects forms the foundation for safe and effective fire use to maintain
ecosystem function and values.
Fire behaviour research in mallee fuel types is not new and a number of studies have quantified fire
behaviour in these fuel types. However, none of these studies had the scale that would allow the
development of predictive relationships between fuels, weather and fire behaviour that would be most
applicable to prescribed fire burning conditions.
38BAim
To develop a model system that would allow accurate predictions of prescribed fire behaviour the study
consisted of four main research objectives:
• To quantify how fuel structure change with time since fire in mallee-heath vegetation types and
its effect on fire behaviour.
• To quantify how weather variables and vegetation type influence within-stand microclimate and
determine diurnal and seasonal dead fuel moisture cycles.
• To characterise the effect of vegetation structure in determining the vertical wind speed profile.
• To quantify and develop functional relationships that describe the effect of fuel, weather and fire
dependent processes on fire behaviour.
39BExperimental design
An experimental site characterised by a mosaic of fuel ages (time since last burnt) and types (mallee-heath
vs pure heath) was selected allowing a range of fuel complex structures.
Fuel structure was characterized at a plot scale relying on destructive and visual assessment methods.
A total of 67 fires were ignited in plots ranging in size from approximately 100 x 100 m to 250 x 250 m
under a wide range of burning conditions. Dead fuel moisture contents and 10-m open wind speed varied
respectively between 2 - 20% and 2 - 24 km/h.
Fire behaviour ranged from self-extinguishing fires to sustained active crown fire propagation. Rates of fire
spread in sustained fires ranged from 3 - 55 m/min (50 – 3310 m/h), for a maximum estimated fireline
intensity of 11,000 kW/m.
PROGRAM A :: REPORT NO. A.10.01
4
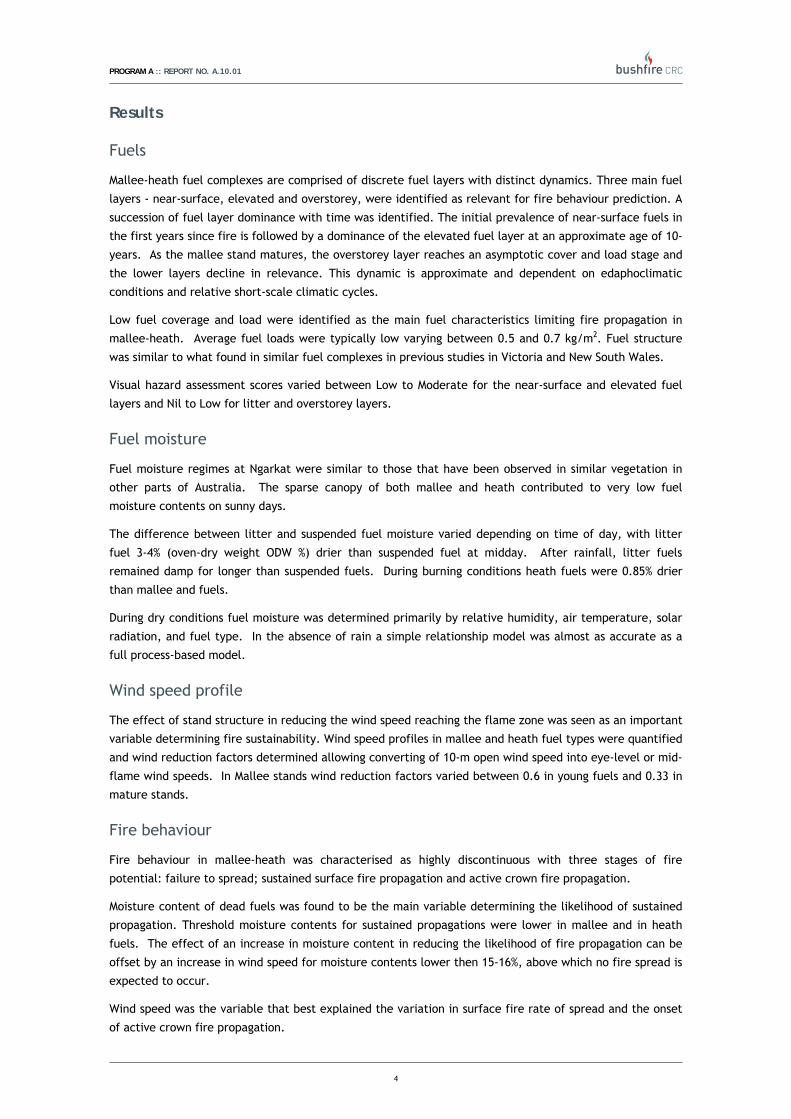
40BResults
64BFuels
Mallee-heath fuel complexes are comprised of discrete fuel layers with distinct dynamics. Three main fuel
layers - near-surface, elevated and overstorey, were identified as relevant for fire behaviour prediction. A
succession of fuel layer dominance with time was identified. The initial prevalence of near-surface fuels in
the first years since fire is followed by a dominance of the elevated fuel layer at an approximate age of 10-
years. As the mallee stand matures, the overstorey layer reaches an asymptotic cover and load stage and
the lower layers decline in relevance. This dynamic is approximate and dependent on edaphoclimatic
conditions and relative short-scale climatic cycles.
Low fuel coverage and load were identified as the main fuel characteristics limiting fire propagation in
mallee-heath. Average fuel loads were typically low varying between 0.5 and 0.7 kg/m2. Fuel structure
was similar to what found in similar fuel complexes in previous studies in Victoria and New South Wales.
Visual hazard assessment scores varied between Low to Moderate for the near-surface and elevated fuel
layers and Nil to Low for litter and overstorey layers.
65BFuel moisture
Fuel moisture regimes at Ngarkat were similar to those that have been observed in similar vegetation in
other parts of Australia. The sparse canopy of both mallee and heath contributed to very low fuel
moisture contents on sunny days.
The difference between litter and suspended fuel moisture varied depending on time of day, with litter
fuel 3-4% (oven-dry weight ODW %) drier than suspended fuel at midday. After rainfall, litter fuels
remained damp for longer than suspended fuels. During burning conditions heath fuels were 0.85% drier
than mallee and fuels.
During dry conditions fuel moisture was determined primarily by relative humidity, air temperature, solar
radiation, and fuel type. In the absence of rain a simple relationship model was almost as accurate as a
full process-based model.
66BWind speed profile
The effect of stand structure in reducing the wind speed reaching the flame zone was seen as an important
variable determining fire sustainability. Wind speed profiles in mallee and heath fuel types were quantified
and wind reduction factors determined allowing converting of 10-m open wind speed into eye-level or mid-
flame wind speeds. In Mallee stands wind reduction factors varied between 0.6 in young fuels and 0.33 in
mature stands.
67BFire behaviour
Fire behaviour in mallee-heath was characterised as highly discontinuous with three stages of fire
potential: failure to spread; sustained surface fire propagation and active crown fire propagation.
Moisture content of dead fuels was found to be the main variable determining the likelihood of sustained
propagation. Threshold moisture contents for sustained propagations were lower in mallee and in heath
fuels. The effect of an increase in moisture content in reducing the likelihood of fire propagation can be
offset by an increase in wind speed for moisture contents lower then 15-16%, above which no fire spread is
expected to occur.
Wind speed was the variable that best explained the variation in surface fire rate of spread and the onset
of active crown fire propagation.

PROGRAM A :: REPORT NO. A.10.01
5
The near-surface fuel layer was the principal layer influencing the onset of sustained propagation, but
once a sustained flame front developed it did not have a significant effect on the rate of fire spread.
The rate of surface fire spread was mostly linked to the elevated fuel layer descriptors, namely percent
cover score (PCS) and fuel hazard score (FHS).
Flames tended to be deep at the head of the fire but shallow at the flanks. Flame residence time varied
between approximately 20 seconds in young fuels and 2 minutes in the accumulated litter under mature
mallee clumps.
Crowning and spotting were identified as fire-dependent phenomena associated with high intensity
propagation. Active crown fire propagation will occur in mature mallee stands when 10-m open wind
speeds are higher than 20 km/h and dead fuel moisture content lower then 8%. This is accompanied by
extensive short range spotting that allows the fire to maintain high rates of spread and breach areas of fuel
discontinuity. The onset of crowning is associated with a sudden and significant increase in the fire rate of
spread.
41BOutcomes
We developed a model system to describe fire behaviour in SA mallee-heath fuel types. The system is most
applicable to prescribed fire burning conditions in mallee-heath fuels, but extending into Very High to
Extreme Fire Danger Rating classes. The system integrates a series of models aimed at predicting various
fire characteristics required by fire managers to plan and conduct prescribed burns. The system comprises
the following submodels:
• Likelihood of sustained fire propagation (go / no-go model)
• Rate of spread of a surface fire (modelled separately for pure heath and mallee-heath stands).
• Likelihood of crown fire propagation (applicable to mallee-heath stands)
• Rate of spread of an active crown fire in mallee fuels.
• Flame height and length models
The model system has most application in the development of burn prescriptions, in support of the
development of burn plans, optimisation of the allocation of suppression resources prior to ignition and the
support of decision-making during the execution of prescribed burns.
The integration of flame characteristics, such as expected residence time and flame dimensions, with
information on mallee-heath species response to fire will allow integration of a fire effects component in
the fire prescription.

PROGRAM A :: REPORT NO. A.10.01
6
3B2. EXPERIMENTAL DESIGN The overall aim of the present study was to develop a good understanding of fuel structure, fire weather
and behaviour in South Australian mallee-heath fuel types. Specific objectives were to improve our
understanding of fire dynamics in discontinuous fuel complexes and develop a prescribed burn guide for
mallee-heath fuel types.
To meet the objective of develop a prescribed burn guide for mallee-heath fuel types, the study focused
on (1) characterizing the dynamics of the main drivers of fire spread, i.e. fuel complex structure, fuel
moisture and wind speed; and (2) conducting fire behaviour experiments under a wide range of fire
weather conditions. The datasets arising from the experimental component of the study form the basis to
develop models describing fuel dynamics, the interaction of weather and stand characteristics in
determining fuel moisture content and understorey wind speed, and how all these fire environment
variables influence fire behaviour.
Four main research subjects were prioritised: (1) fuel complex dynamics; (2) within stand microclimate
and fuel moisture; (3) vertical wind structure; and (4) fire behaviour. In order to develop a comprehensive
fire behaviour dataset, i.e., covering a wide range of fuel complex structures, weather conditions and fire
intensity, we selected an experimental site characterized by a mosaic of fuel ages and types and conduct
the experimental burning program through three distinct phases of increasing fire potential: phase I: May
2006; phase II: April 2007; and phase III: March 2008.
13B2.1. SITE CHARACTERISTICS Survey of possible experimental burning sites in the Ngarkat Conservation Park in South Australia started in
2004 in consultation with Department for Environment and Heritage. In Autumn 2005 an experimental area
(35° 45’ S, 140° 51’ E) west of the private in-holding along the Bordertown-Pinnaroo Road, Kirra Station,
was selected (Fig. 2.1). This site is a characteristic dune and swale system comprising large flat areas with
relatively small dunes intermixed. Elevation was approximately 130 m above sea level. Soils in Ngarkat are
Aeolian sands of varying depth, overlying deep alluvial soils of the old River Murray delta (Specht & Rayson
1957). Where the sand depth is shallow or absent, red clay-loam pans are present.
The area fire history and local landform variations resulted in a mosaic of fuel complexes that allows for
the research of fuel structure on fire behaviour. The area had three age classes resultant from wildfires
occurring in 1958, 1986 and 1999 and two fuel types: mallee dominated shrubland and heath. Heath
vegetation from the 1958 wildfire could not be located at the site and this age of heath is relatively rare in
this landscape. The Mallee fuel type (Fig. 2.2) is characterized as open woodland with Eucalyptus
calycogona, E. diversifolia, E. incrassata and E. leptophylla as dominant overstorey species and an
understorey of Astroloma conostephioides, Adenanthos terminalis, Babingtonia behrii, Calytrix
involucrata, C. tetragona, Daviesia benthamii, Dillwynia hispida, Leptospermum coriaceum, L.
myrsinoides and Phyllota pleurandroides. A ground layer of mixed grasses and sedges was also present. In
the experimental area this fuel type tended to be absent from deep sandy soils and dune crests, being
often found in areas where soils tended to be more loamy with a higher clay content. By contrast the
heath fuel type (Fig 2.3) tended to be associated with large flat inter-dunal swales and areas with deeper
sands. Dominant vegetation in this fuel type was Banksia ornata, Leptospermum myrsinoides and
Babingtonia behrii. Mallee clumps were almost absent (typically cover < 5 %) in the heath-classified areas.

PROGRAM A :: REPORT NO. A.10.01
7
Figure 2.1. Aerial oblique photograph of Ngarkat experimental burn project site. Photograph is taken from
NW – SE direction.

PROGRAM A :: REPORT NO. A.10.01
8
Figure. 2.2. Typical surface fuel layer cover associated with 8-yr (a), (b) 21-yr and (c) 49-yr old mallee
vegetation within the Ngarkat experimental site.

PROGRAM A :: REPORT NO. A.10.01
9
Figure. 2.3. Typical surface fuel layer cover associated with 8-yr (a) and (b) 21-yr old heath vegetation
within the Ngarkat experimental site.
14B2.2. FIRE CLIMATE Ngarkat has a Mediterranean climate with warm, dry summers and cool, wetter winters. Observations from
Bureau of Meteorology weather stations (Lameroo, #025509, 35.33°S, 140.52°E and Keith, #025507,
36.10°S, 140.36°E) were used to characterize the local climate and fire weather.
The climate statistics reported below were calculated for both stations and were found to be almost
identical. For clarity of presentation only the results from the Keith station are shown. Keith was chosen
because the station at Lameroo was moved to a new location in 2005. This would not affect climate
averages significantly but may have an impact on comparing weather during the years of the field
programme with the averages. Climate averages were calculated for the 30 years from 1 January 1978 to
31 December 2008. No attempt was made to infill or interpolate missing values.
In addition to mean series, histograms were calculated for some variables. Histograms were calculated for
each month using all daily values from all years for that month. For the months November to April average
PROGRAM A :: REPORT NO. A.10.01
10
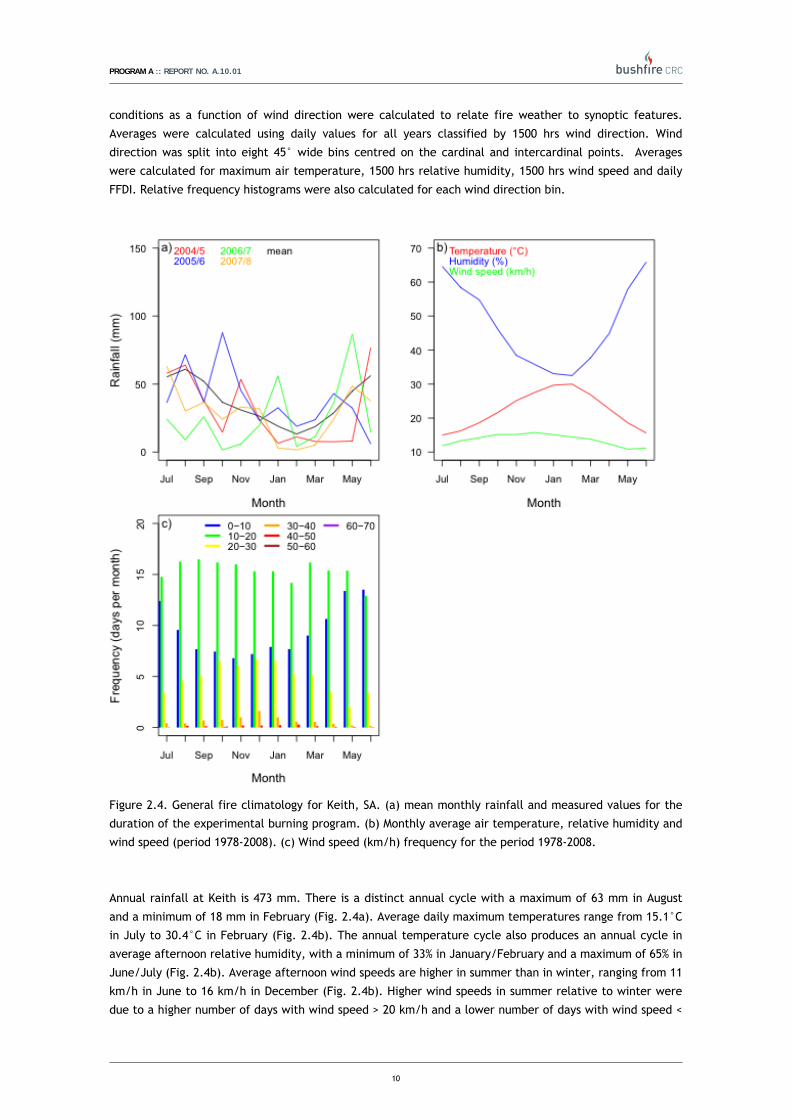
conditions as a function of wind direction were calculated to relate fire weather to synoptic features.
Averages were calculated using daily values for all years classified by 1500 hrs wind direction. Wind
direction was split into eight 45° wide bins centred on the cardinal and intercardinal points. Averages
were calculated for maximum air temperature, 1500 hrs relative humidity, 1500 hrs wind speed and daily
FFDI. Relative frequency histograms were also calculated for each wind direction bin.
Figure 2.4. General fire climatology for Keith, SA. (a) mean monthly rainfall and measured values for the
duration of the experimental burning program. (b) Monthly average air temperature, relative humidity and
wind speed (period 1978-2008). (c) Wind speed (km/h) frequency for the period 1978-2008.
Annual rainfall at Keith is 473 mm. There is a distinct annual cycle with a maximum of 63 mm in August
and a minimum of 18 mm in February (Fig. 2.4a). Average daily maximum temperatures range from 15.1°C
in July to 30.4°C in February (Fig. 2.4b). The annual temperature cycle also produces an annual cycle in
average afternoon relative humidity, with a minimum of 33% in January/February and a maximum of 65% in
June/July (Fig. 2.4b). Average afternoon wind speeds are higher in summer than in winter, ranging from 11
km/h in June to 16 km/h in December (Fig. 2.4b). Higher wind speeds in summer relative to winter were
due to a higher number of days with wind speed > 20 km/h and a lower number of days with wind speed <

PROGRAM A :: REPORT NO. A.10.01
11
10 km/h (Fig. 2.4.c). The frequency of days with wind speed of 10 – 20 km/h remains constant throughout
the year.
Figure 2.5. Fire weather as a function of wind direction. All lines are averages 1978-2008. Bars are relative
frequency of each wind direction.
PROGRAM A :: REPORT NO. A.10.01
12
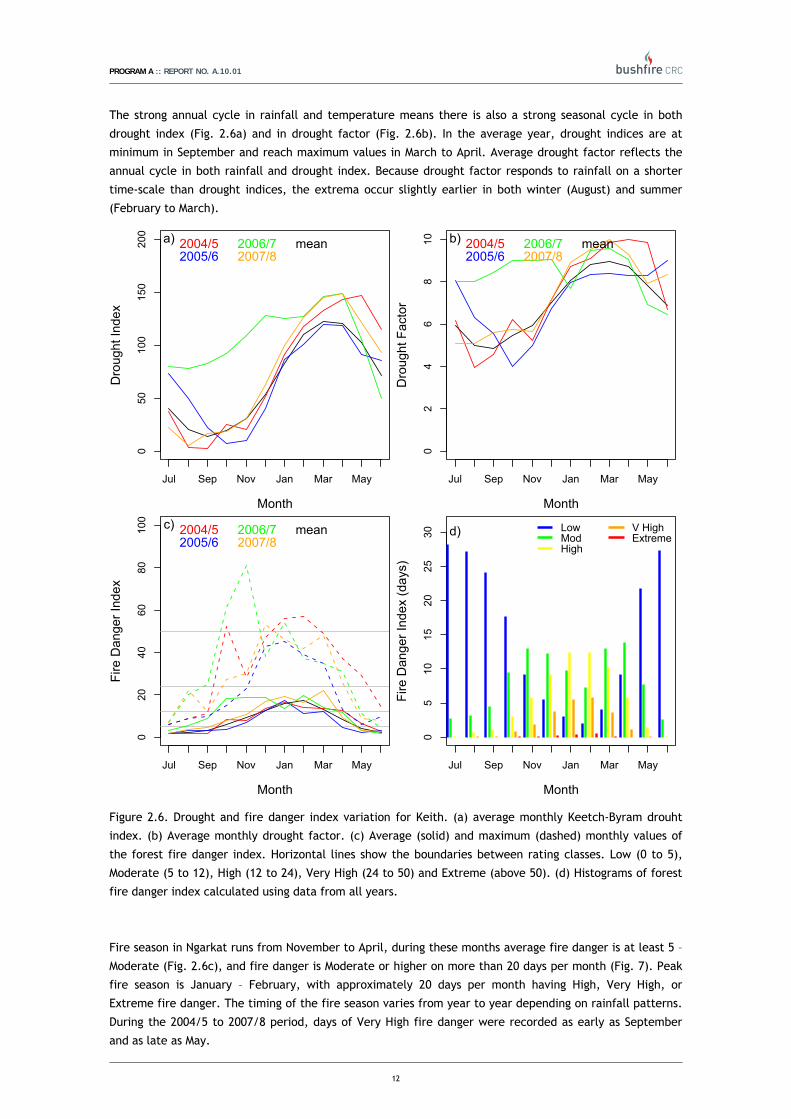
The strong annual cycle in rainfall and temperature means there is also a strong seasonal cycle in both
drought index (Fig. 2.6a) and in drought factor (Fig. 2.6b). In the average year, drought indices are at
minimum in September and reach maximum values in March to April. Average drought factor reflects the
annual cycle in both rainfall and drought index. Because drought factor responds to rainfall on a shorter
time-scale than drought indices, the extrema occur slightly earlier in both winter (August) and summer
(February to March).
050
100
150
200
Month
Dro
ught
Inde
x
Jul Sep Nov Jan Mar May
2004/52005/6
2006/72007/8
meana)
02
46
810
Month
Dro
ught
Fac
tor
Jul Sep Nov Jan Mar May
2004/52005/6
2006/72007/8
meanb)
020
4060
8010
0
Month
Fire
Dan
ger I
ndex
Jul Sep Nov Jan Mar May
2004/52005/6
2006/72007/8
meanc)
05
1015
2025
30
Month
Fire
Dan
ger I
ndex
(day
s)
Jul Sep Nov Jan Mar May
LowModHigh
V HighExtremed)
Figure 2.6. Drought and fire danger index variation for Keith. (a) average monthly Keetch-Byram drouht
index. (b) Average monthly drought factor. (c) Average (solid) and maximum (dashed) monthly values of
the forest fire danger index. Horizontal lines show the boundaries between rating classes. Low (0 to 5),
Moderate (5 to 12), High (12 to 24), Very High (24 to 50) and Extreme (above 50). (d) Histograms of forest
fire danger index calculated using data from all years.
Fire season in Ngarkat runs from November to April, during these months average fire danger is at least 5 –
Moderate (Fig. 2.6c), and fire danger is Moderate or higher on more than 20 days per month (Fig. 7). Peak
fire season is January – February, with approximately 20 days per month having High, Very High, or
Extreme fire danger. The timing of the fire season varies from year to year depending on rainfall patterns.
During the 2004/5 to 2007/8 period, days of Very High fire danger were recorded as early as September
and as late as May.

PROGRAM A :: REPORT NO. A.10.01
13
Fire weather at Ngarkat is strongly dependent on wind direction (Fig. 2.5). The highest fire danger days
occur with winds from the west, north-west, and north. Days with these wind directions are warmer and
drier than average, resulting in higher fire danger compared to other weather directions. Although there is
an annual cycle in wind speed with the strongest winds during summer, days with high fire danger did not
have higher than average wind speeds. Days with easterly or southerly winds were associated with cooler
temperatures, higher humidity, and lower fire danger.
These statistics reflect the normal passage of synoptic weather systems over Ngarkat: easterly winds under
the influence of a high pressure system over Australia, turning northwesterly as the high moves off shore,
followed by southwesterly winds with the passage of a cold front, with winds finally returning to the east
as a new high moves over Australia. Seasonal variation occurs as these weather systems are located further
north in Spring and Autumn, and further south in Summer.
Weather for 2004-2008
Rainfall was below average for all years from July 2004 to June 2008. The most significant dry spell was
from June to December 2006 (Fig. 2.4a), when only 73 mm was recorded, compared to the average of 330
mm. This resulted in very much above average drought index leading into the summer of 2006/7 (Fig.
2.6a). During the rest of the experimental period (June 2004 to July 2008), drought indices are average or
near average.
Air temperatures were near or above average for most of the experimental period, except for Autumn of
2005 and February in 2005, 2006, and 2008. Relative humidity records mirrored temperature
measurements with most monthly means at or below average conditions, except for the Autumn of 2005
and February in 2005, and 2006. Wind speeds were at or below average for all of the experimental period.
Drought in 2006 resulted in an early start to the fire season, with the weekly average exceeding 5 –
Moderate as early as August, and reaching average summer values in October (Fig. 2.5). Very high values
were also recorded late in the fire season in March 2008. For the rest of the experimental period fire
danger was near to average conditions. Fire danger values were close to average because above average
temperatures and low humidity were countered by below average wind speeds.
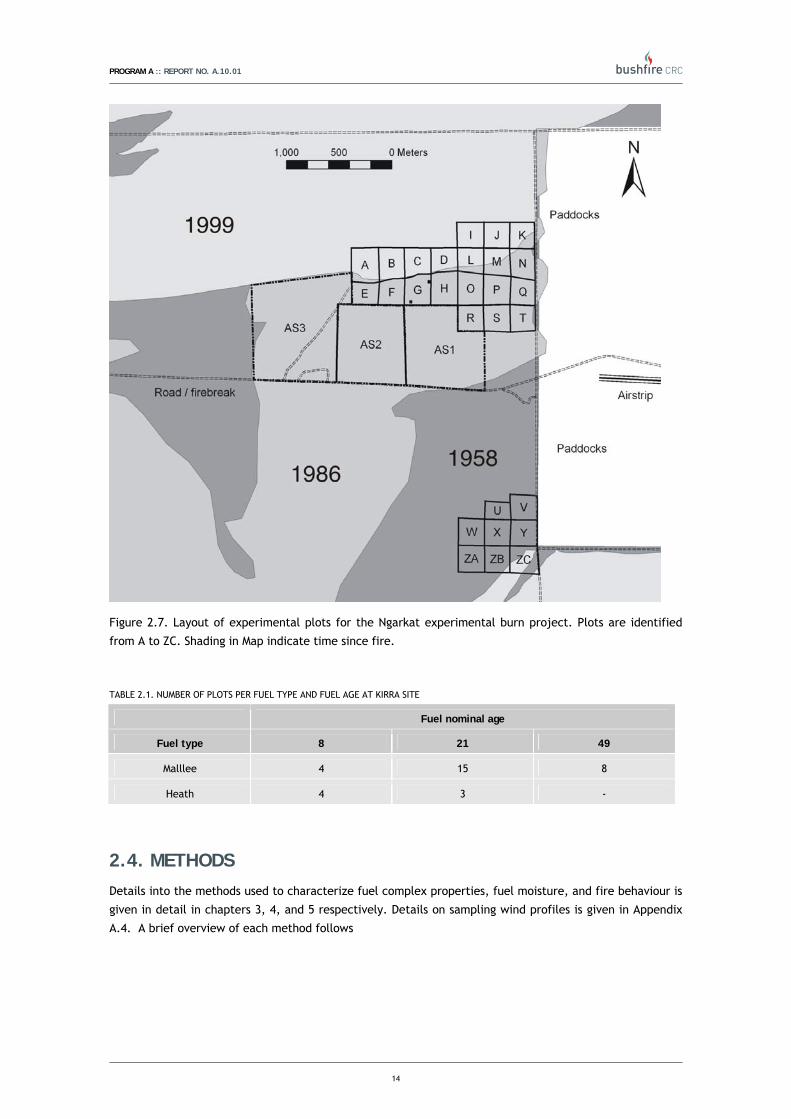
15B2.3. PLOT LAYOUT In 2006 10 m wide fire breaks were constructed around 27 fire behaviour plots (A through ZC in Fig. 2.7).
These plots were approximately square with sides 250 m long. Plot size was a compromise between the
ability to adequately monitor fire behaviour and the requirements to observe steady state fire spread.
Small variations in size and shape were due to local topography and change in fuel type. Three large plots
(AS plots) were established in 2008 with the objective of investigating aerial fire suppression effectiveness
(Plucinski et al. 2010). Plot location aimed to capture a representative proportion of fuel ages and types.
Their close proximity ensured that weather conditions would be homogeneous when conducting
simultaneous experiments in different fuel types. Plot distribution per age and fuel type is given in Table
2.1. Heath fuel type cover a small proportion of the study area and only 7 plots were prepared at the study
site (Table 2.1) against 27 plots in mallee vegetation. A further array of 8 plots (350 x 250 m) in 20-year
old heath fuels were set in 2007 at the McCallum site (35° 45 S, 140° 51 E), 28 km WSW of the main site.
PROGRAM A :: REPORT NO. A.10.01
14
Figure 2.7. Layout of experimental plots for the Ngarkat experimental burn project. Plots are identified
from A to ZC. Shading in Map indicate time since fire.
TABLE 2.1. NUMBER OF PLOTS PER FUEL TYPE AND FUEL AGE AT KIRRA SITE
Fuel nominal age
Fuel type 8 21 49
Malllee 4 15 8
Heath 4 3 -
16B2.4. METHODS Details into the methods used to characterize fuel complex properties, fuel moisture, and fire behaviour is
given in detail in chapters 3, 4, and 5 respectively. Details on sampling wind profiles is given in Appendix
A.4. A brief overview of each method follows

PROGRAM A :: REPORT NO. A.10.01
15
42B2.4.1. Fuel assessment
A detailed description of fuels is required to understand how fuel complex structure directly determines
combustion processes and heat transfer efficiency; and influence the micro-meteorological conditions that
drive fire propagation. Fuel sample design and intensity (at plot level) was determined by vegetation
structure, plot size and the resources available (Catchpole and Wheeler 1992). The heterogeneity of the
mallee heath fuel types required the application of two distinct sample designs to characterize physical
fuel complex properties.
The point intersect method (Canfield 1941) was used to determine fuel layer and stratum cover and
height, gap fraction and gap size distribution. These measurements characterize horizontal fuel
continuity, namely the gap size relative to the fuel volume, a feature that is determinant in controlling the
likelihood that a flame front will self-sustain (Burrows et al. 2009).
Destructive sampling was used to estimate fuel layer (litter, near-surface, elevated and overstorey) load,
arrangement, bulk density and proportion of dead fuels. These are the physical fuel parameters that
influence how flames develop and propagated within a fuel layer.
A further method, a visual hazard scoring system (Gould et al 2007) was used. This method numerically
characterises the various fuel layers and strata through visually estimated cover and hazard scores. These
surrogates of fuel cover, load and arrangement provide a quantitative description of fuel hazard. The
method was found to be capable to adequately describe fuel dynamics (accumulation through time) in the
Jarrah forest of the Southwest WA. The numerical scores were able to explain fire behaviour such as fire
rate of spread and flame height in this fuel type and predictive models were develop based on then (Gould
et al. 2007). The Visual Hazard Scoring system was found to be robust (low observer bias) and with a low
implementation cost. These features make the method a good alternative to other fuel sampling methods
that are onerous and time consuming (e.g., destructive sampling). The Visual Hazard Scoring system was
used to verify its applicability to describe fuel structure and fire behaviour in mallee heath fuels.
43B2.4.2. Fuel moisture
Dead fine fuel moisture content has been found to be the crucial fire environment variable determining
fire sustainability and an important predictor of rate of fire spread in discontinuous fuel types (McCaw
1999, Burrows et al. 2009). Measurements of the moisture content of litter and suspended dead fuels were
conducted prior to each experimental fire. Alongside these measurements an intense fuel moisture and
micrometeorology sampling protocol was established to develop a dataset that can be used to
parameterize a process-based fuel moisture model (Matthews 2006). This sampling focused on the diurnal
dynamics of fuel moisture for a range of drying conditions and was supplemented by laboratory
measurements made to determine physical properties of mallee and heath fuels. Live fuel moisture
sampling was also conduced throughout each experimental period.
44B2.4.3. Vertical wind speed profile
Vegetation characteristics largely determine the vertical wind speed profile. As the height above ground
diminishes, wind speed is reduced due to mechanical turbulence. Information relative to wind ratios (e.g.,
10-m open wind speed/eye-level wind speed) in different vegetation types is scant and a major source of
error when predicting fire behaviour (Burrows et al. 2000). An understanding of how vegetation structure

PROGRAM A :: REPORT NO. A.10.01
16
determines the wind profile above the canopy and within the sub-canopy space results in improved
accuracy of fire behaviour prediction systems.
To characterize the vertical wind profiles in mallee–heath fuel types we sample wind speed variation with
height above ground through the use of a vertical array of 5 sonic anemometers. Wind profiles were
sampled in four distinct fuel types: 1958 mallee; 1986 mallee; 1986 heath and 1999 mallee/heath.
BOX. 2.1. UNITS TO DESCRIBE FUEL LOAD AND RATE OF FIRE SPREAD
Fire behaviour models are not a substitute of experience (Rothermel 1983) but their systematic use and evaluation allows users to better understand fire dynamics in complex situations and form a quantified mental image of fire potential.
In our report we departed from the usual units used to describe two of the most commonly quantities used to assess fire potential, fuel load (kg/m2 instead of tons/ha) and rate of fire spread (m/min instead of km/hr or m/hr). Why?
Fuel load has been typically given in metric tonnes per hectare (e.g., McCarthy et al. 1998) and rate of fire spread in kilometres per hour (McArthur 1967) or meters per hour (Sneeuwjagt and Peet 1998, Gould et al. 2007b). The issue with these quantities is the difficulty to envisage its dimensions (see Van Wagner 1978).
Considering fuel load, we can easily call to mind what is one or two kilograms, but we cannot do that with ten tonnes. In a similar way, it is simple to visualize one square meter, but daunting to accurately estimate what is a hectare under a forest canopy. With the measures of rate of fire spread analogous issues arise. Considering the propagation under prescribed burning conditions the scale km/hr or m/hr lack the resolution to help a user visualize the propagation of a low to moderate intensity fire. We feel that describing rate of fire spread in m/min provides a better mental image of fire behaviour for field application in prescribed burning operations. As such we used these units throughout the report.
Nonetheless, we consider that for some application, e.g., large-scale fire simulations, the use of m/min is not adequate. The scale is not adequate for the intended application. In such scenarios the use of m/hr or km/hr is likely to be more appropriate. Conversion to these units can be readily accomplished.
Units used in this report Convert to Correction factor
Fuel quantity kg/m2 tons/ha x 10
Rate of fire spread m/min m/hr x 60
45B2.4.5. Fire behaviour
The prediction of fire behaviour in discontinuous fuels typical of arid and semi-arid regions of Australia
require a modelling approach where an estimate of the likelihood of sustained fire propagation is required
prior to the estimate of other fire quantities, such as, rate of spread and fireline intensity (Gill et al.
1995). Hence, the research into fire propagation in mallee-heath fuels had two key experimental
components: (1) determine the necessary fire environment conditions for fire to propagate; and (2)
characterize the behaviour of a propagating fire.
For each mallee-heath fuel complex, defined by a certain fuel arrangement and discontinuity, there will
be a weather scenario that will allow fire to propagate. We can see these threshold conditions as a fine
fuel moisture content – wind speed pair that will allow the development of a coherent flame front (as
defined by flame angle, height and depth) that will bridge the gaps between discrete fuels and sustain fire
propagation. To identify the fire propagation threshold conditions, the experimental design required
carrying out multiple experimental fires throughout a burning day cycle. Morning fires were normally
characterized by higher fuel moisture conditions, and as the day progressed, fuels progressively became

PROGRAM A :: REPORT NO. A.10.01
17
drier and winds increase in strength. This approach allowed to identify under which conditions fire
propagation would or would not sustain itself.
Experimental fires were normally conducted simultaneously in distinct fuel types (e.g., mallee and heath
of identical age; mallee of distinct ages) allowing to identify differences in fire behaviour arising from fuel
complex structure. The number of simultaneous fires was a function of the resources available and varied
between 2 and 3. Experimental fires were ignited with two or more handheld drip torches. Fire behaviour
was monitored for each experiment. Fire spread measurement methods used depended on the type of
fire. For slow moving fires the perimeter was mapped through the use of numbered metal tags at fixed
time intervals. For the fast spreading fires, a grid of buried thermal dataloggers was set before ignition to
map fire propagation (Simard et al. 1983). A number of observers took detailed notes of the fuels
sustaining propagation, flame geometry, residence time and spotting activity. Wind speed and direction
was measured at two locations in the vicinity of the experimental block with vegetation representative of
the experimental plot. Wind was measured at 2- and 10-m height about ground. Fuel moisture content of
the different fuels layers was sampled before ignition.
The established plot sizes provided flexibility regarding the size of each experimental burn. Cheney and
Gould (1995) showed that for grasslands a minimum fire line width is required to attain steady state fire
propagation. This minimum value is dependent on the fire spread potential conditions present during the
experiment. From this premise, for each particular experimental fire, its dimension (ignition line length
and extent of the experimental fire run) was defined as a function of the forecasted weather conditions.
Ignition line length varied between 100 m and 220 m, respectively for fires experiments carried out under
moderate and extreme fire spread potential. Fire spread run extent also varied in a similar fashion,
between 100 and 350 m.

PROGRAM A :: REPORT NO. A.10.01
18

PROGRAM A :: REPORT NO. A.10.01
19
4B3. FUEL COMPLEX DYNAMICS
17B3.1. INTRODUCTION Reliable information on fuel complex structure is required for a wide range of fire management activities,
from operational planning and execution of prescribed burns, to plan landscape-scale fuel management
activities. Fuel complex structure influences fire behaviour and severity through various mechanisms. It
determines the micro meteorological conditions that define the fire environment, e.g., within stand wind
speed, understorey development, fuel exposure to solar radiation. It defines the energy available to be
released in combustion processes and the effectiveness of heat transfer to unburned fuels under given
weather conditions. First order fire effects, such as fuel consumption and plant mortality, to ecosystem
components are largely determined by the quantity and rate of energy released, fire characteristics that
are a function of fuel complex descriptors such as fuel load and arrangement. Fuels are the sole fire
environment variable that is amenable to human modification. The understanding of its effect on fire
behaviour allows to proactively managing fuels to minimize fire severity under current and future climate
change scenarios.
Historically fuels have been described in various ways, reflecting our understanding of their effect on fire
behaviour. From the acknowledgement of an effect of fuel structure on fire behaviour and difficulty to
control, emerged a need to classify fuels into distinct fuel types, e.g., pine vs. eucalypt forest (Beggs
1973). Further advances in our understanding of fire dynamics lead to the inclusion of available fuel load
in models to predict fire rate of spread (McArthur 1967). Our current understanding of fire dynamics
indicates that such effect is simplistic and a better description of the fuel complex is necessary to be able
to predict fire behaviour in the range of possible fuel configurations that fire manager’s face in their day-
to-day activities.
Current trends in fire behaviour modelling indicates that the fuel characteristics that will be required for
future models are those that describe the main physical properties (e.g., proportion of fuel particles by
size and state, depth and load of each fuel stratum and associated porosity, horizontal and vertical
continuity) of the fuel complex. Being the fuel complex an aggregate of fuel strata, each with its own
unique structural characteristics.
Following this premise we aimed to characterise the physical structure of mallee heath fuel complexes
through time since last fire. This characterisation of fuel dynamics in mallee-heath attempt to identify the
fuel complex characteristics that change with time and lead to changes in the flammability of the system.
Our fuel complex characterisation was based on the quantification of the physical properties that are
known to influence fire behaviour. This inventory of fuel properties, whilst time consuming and onerous
provides the basis to understand the effect of fuel complex structure on fire behaviour, such as the
development of self-sustained fire propagation, fire spread – flame structure interdependencies and fire
intensity. The knowledge of fuel properties and these fire behaviour characteristics are necessary to
expand the use of fire behaviour models to predict first order fire effects such as, plant response to fire,
coarse woody fuel consumption and smoke production (Reinhardt et al. 1999).
Mallee-heath vegetation occurring in semi-arid climates develops a vertically non-uniform and spatially
discontinuous fuel complex. As a broad description, the fuel complex has a mallee overstorey with cover
and height (2 to 10 m tall) depending on time since fire, bioclimatic conditions and soil type. Long strands
of bark suspended along the stems and an intermediate canopy layer of tall shrub species (e.g., Callitris
ssp.) constitute ladder fuels that facilitate the transition from a surface to a crown fire. A shrub
component (0.5 to 2 m tall) comprising a large variability of species, namely sclerophyll and semi-
succulent shrubs, develops in the understorey and constitutes the elevated layer. This layer is an
important support for fire propagation due to the physical (well aerated fine fuels, dead components
within the canopy) and chemical (terpenes and waxes within foliage) characteristics of the shrub species

PROGRAM A :: REPORT NO. A.10.01
20
(Keith et al. 2001). The extent of this heath understorey varies from dense to moderately dense. A lower
layer (0.1 to 0.3 m) of tussock and hummock grasses, ephemeral herbs, low sedges, low shrubs and dead
suspended material comprises the near-surface layer. The presence of the overstorey and elevated layers
suppress the development of the near-surface layer, resulting in a sparse and discontinuous layer. Although
not determining fire spread per se, the high dead/live ratios of this layer constitute an important fuel to
sustain fire propagation in the elevated layer. The low bulk densities of the shrub components of the
elevated layer in the semi-arid environment would not support fire spread without the near-surface layer,
unless under very severe fire weather conditions (Bradstock and Cohn 2002). Fluxes of ephemeral grasses
can follow periods of above average rainfall, increasing the cover of the near-surface layer to a level
where it becomes the main fuel layer carrying the fire. The litter (surface) layer in mallee heath fuel types
vary from a well develop layer under the mallee clumps to a very sparse cover under the shrubs, where the
fine dead leaves tend to mix and be partially buried by sand (Bradstock and Gill 1993). Fuel accumulation
below the mallee clumps can cause a substantial increase in fire intensity, leading to the combustion of
bark strands, crowning and generation of fire brands; important fire spread mechanisms contributing to the
fast rates of spread observed under severe fire weather conditions (Noble 1989).
Several studies provide information on the physical characteristics of mallee-heath and mallee-spinifex
fuel complexes. McCaw (1997) carried out a comprehensive inventory of fuel characteristics in 20-year old
mallee-heath stand in the Stirlings Range, Western Australia. Fuel loads (available fuel load comprising
litter (dead fuels, twig and bark), dead suspended fuels diameter (d) <25mm and live fuels d <25mm) in
burn plots varied between 0.9 and 1.5 kg/m2, with an average of 1.2 kg/m2. Fuel load was distributed as:
39% live fuels; 36% litter; and 25% other elevated dead fuels. Overall fuel loads between 0.1 and 1.7 kg/m2
in various mallee stands have been reported by Noble (1986). Bradstock et al. (1992) report litter fuel
loads of 0.3 kg/m2 under 14-year old mallee clumps. Bradstock and Gill (1993) conducted detailed sampling
within mallee clumps (E. dumosa and E. socialis, 3-4 m tall, 15-year old) and found a decrease in litter
load from the edge of the clump (1.4 kg/m2) to the centre (0.7 kg/m2). It is worthwhile to note that these
values are reported on a plant basis, i.e., 100% cover. Extrapolation of these values to an area basis (e.g.,
hectare) requires knowledge on plant cover.
Information of fuel load and cover contributed by other fuels, such as shrubs and perennial and ephemeral
grasses is essential in understanding fire dynamics in this fuel type as mallee cover is highly discontinuous.
Noble and Vines (1993) report eucalyptus cover between 14 and 25%, Bradstock and Cohn (2002) between
20 and 50%, Noble (1986) 34%, and McCaw (1997) 5 to 10%. Bradstock et al. (1992) and Bradstock and Gill
(1993) quantified fuel structure in Spinifex hummocks (T. irritans). Measured fuel loads varied between 0.4
and 3.0 kg/m2. Noble and Vines (1993) quantified grass fuel dynamics in distinct mallee communities in
New South Wales. Cover of spinifex hummocks varied between 6 and 15%, while cover of perennial grasses
was a function of rainfall and overstorey canopy. In the absence of overstorey canopy (post fire condition)
and in an above-median rainfall year, perennial grasses cover reached 30%. The existence of an overstorey
canopy cover limit the cover of these fuels to levels below 10%, even on years of high rainfall.
This summary of fuel characteristics in distinct mallee-heath and mallee-spinifex fuel complexes highlights
the variability in fuel dynamics and structures that can be encountered in prescribed burn situations, and
the difficulty to assign standardised fuel characteristics to mallee shrublands. These prompt to develop a
comprehensive inventory of fuel characteristics within the Ngarkat experimental burn area. To improve our
ability to quantify fuel characteristics in this vegetation type we complemented the sampling of physical
fuel properties with the application of a visual Fuel Hazard Scoring system (Gould et al. 2007). This
system, based on previous work by Wilson (1992, 1993), Tolhurst et al. (1996) and McCarthy et al. (1998),
aims at describe the hazard associated with the fuel complex based on visually estimated qualitative
descriptors of fuel structure. These surrogates of fuel load and arrangement provide a description of fuel
hazard, and the present study allowed quantifying the relationship between particular cover and hazard
scores and observed fire behaviour.

PROGRAM A :: REPORT NO. A.10.01
21
BOX. 3.1. FUEL COMPLEX
Fuel is the general term used to describe vegetation properties that relate to fire behaviour and are meaningful to bushfire management (Anderson 1974). A fuel complex is the assemblage of fuel strata (e.g., canopy, ladder, surface) and layers (e.g., elevated, near-surface and litter). Layers assume somewhat homogeneous properties as defined by the bulk characteristics of its fuel particles. Strata and layers are differentiated by the vertical distance to the ground and fuel orientation. An understanding of the effect of this multi-layered fuel arrangement on fire behaviour requires the quantification of the physical characteristics defining each fuel strata/layer and its vertical and horizontal continuity.
Fuel strata and their relationship with a bushfire combustion environment (from Gould 2003)
Key fuel strata/layers
Canopy strata Canopy length and load, and the distance from the surface fuel layer to the bottom of the live canopy are fuel characteristics that influence the onset and propagation of crown fires. Canopy cover or horizontal continuity also determined dead fuel moisture content dynamics and the sustainability of crown fire propagation. Bark layer Bark fuels constitute a substantial proportion of fuel consumed in active flaming combustion in some eucalyptus forest types, creating a ladder for fire to spread vertically into the canopy. More importantly, bark fuels are the main source of firebrand material that originates spot fires. The contribution of bark to fire propagation depends on bark type (Cheney and Bary 1969). Stringybark firebrands are frequently small, but numerous, being responsible for high density spotting at short distances. Candlebark is characterised by long bark strips that when injected into the buoyant plume have the potential to cause long distance spotting. Surface fuel strata (supports surface fire propagation)
Elevated fuel layer The elevated fuel layer is mostly made up of shrubs and juvenile understorey trees up a few meters tall. Fuel particles have to a large extent an upright orientation. Fuel load comprises mostly live fuels, with the dead fuel component increasing with time since fire. Main fuel characteristics determining fire potential are fuel layer height, load, cover, proportion of dead component and the inherent flammability of the species (e.g., sclerophyll vs. succulents).
Flame depth
Bark
Canopy
Elevated fuels
Near-surface fuels
Litter fuels
Down woody fuel
Duff
Fuel layer / strata
Embers / firebrands Crown fire
Surface fire
Post frontal combustion
Spot fires
Flame height
Fire behaviour

PROGRAM A :: REPORT NO. A.10.01
22
Near-surface fuel layer This layer contains grasses and low shrubs and has litter-fuel components such as leaves, bark and twigs suspended within it. The orientation of the fuel component is variable but there is a substantial proportion of upright material, which clearly divides this layer from the litter fuel layer. Important descriptors of this layer are its height, load, cover, fuel particle type and proportion of dead fuels. Litter fuel layer (called surface fuel layer in dry eucalypt forests - Gould et al. 2007) Litter components of freshly fallen leave, twig and bark materials are generally layered horizontally on the forest floor. This layer usually makes up the bulk of the fuel load in forests and determines flame depth of surface fires. Important descriptors of this layer are its load, cover and height. Duff The duff layer, composed of partially decomposed plant material that lost identifiable attributes, is tightly compacted and is in close contact with the mineral soil. Downed woody or coarse woody debris Any piece of dead woody materials, e.g., dead boles, limbs and logging slash, with diameter larger then 25 mm. These fuels do not have a direct influence on the rate of spread and characteristics of the flame front, but contribute to the overall energy released by the fire and plume characteristics. They also determine some of the first and second order fire effects.
18B3.2. METHODS Fuel complex characterisation involved a variety of sampling methods aimed at quantifying the physical
properties of each fuel stratum and surrogate variables. We defined the fuel complex as being an
aggregate of two strata, the surface stratum encompassing litter, near-surface and elevated fuel layers,
and the canopy stratum, encompassing the intermediate and overstorey canopy layers (Figure 3.1). Three
main sampling methods were used in conjunction: point intersect, destructive sampling, and visual scoring.
A systematic sampling grid was established within each experimental plot with the location of destructive
and visual scoring sampling points (Figure 3.2). Transect lines were established within a sub-set of
experimental plots to determine gap size and distribution, fuel layer/stratum cover and height through the
point intersect method.
Fig. 3.1: Idealized profile of mallee-heath fuel complex

PROGRAM A :: REPORT NO. A.10.01
23
Fig 3.2. (a) Typical fuel sampling grid for the Ngarkat experimental burn plots; (b) detail of fuel sampling
layout. Dashed line represents gap sampling transect.
Point intersect method
Fuel layer and stratum cover and height, gap fraction and size distribution were sampled through the point
intersect method (Canfield 1941). Three transects were systematically established normal to the expected
fire spread direction in 13 experimental plots. Transect length varied with plot size, from 200 m in the
smaller plots to 400 m in the larger plots. Points were sample every 1-m along the transect line. At each
point, intercept of bare ground, litter, near-surface, elevated and overstorey canopy fuels along with the
dominant fuel layer height were recorded.
Destructive sampling
Measurements of fuel load per fuel layer (litter, near-surface and elevated), state (live and dead) and size
class (live: diameter (d) < 3 mm, Dead: d < 6 mm, 6 mm < d < 25 mm, d > 25 mm) were conducted in 2 m2
sampling area randomly located next to the sampling grid (Fig. 3.2). Total number of destructive fuel
sample plots varied with plot size and resources available. Prior to fuel disturbance, fuel layer height and
cover were visually estimated within the sample plot. Visual assessment of fuel characteristics was also
conducted for the destructive sample location. Fuels were sorted and weighted in situ ensuring no particle
loss. After weighting, a subsample of each fuel category was taken in a sealed container for fuel moisture
determination. Fuel moisture samples were oven dried at nominally 100°C for 24 hours to determine their
dry weight.
Overstorey mallee canopy biomass (foliage, live twigs (d<0.3 mm) and dead twigs (d < 6 mm, 6 mm < d <
25 mm)) were destructively sampled. Within each fuel age, nine plants were randomly selected to cover
the observed height range. Prior to felling, measurements of canopy dimensions (width, length and depth)
and height were conducted to each mallee clump (comprising several stems). The stems were felled into a
large polyethylene sheet and fuel particles were partitioned by category and weighted in situ. As per the
shrub component, a subsample of each fuel category was collected into a sealed container for fuel
moisture determination. Live fuels moisture content sampled were oven dried at nominally 100°C until a
constant weight was reached.
Other relevant fuel bed structure descriptors, such as bulk density and death fuel fraction (dead/live fuel
ratio, D/L), were derived for each stratum from the data collected.

PROGRAM A :: REPORT NO. A.10.01
24
Visual Hazard Scores
Visual assessment of fuel characteristics followed the Visual Hazard Scoring System defined by Gould et al.
(2007) for Project Vesta. The system integrates information on fuel coverage (Percent Cover Score, PCS)
and fuel hazard (Fuel Hazard Score, FHS) for each of five fuel layers (litter, near-surface, elevated,
intermediate tree and overstorey). The percent Cover Score rates the cover of each layer into 5 classes (0
to 4; linear for all but the litter layer) as outlined in Appendix A2. The fuel Hazard Score provides a
qualitative assessment of the “flammability” associated with each layer based on such characteristics as
the fuel particle distribution (e.g., live vs. dead proportions) and morphology, fuel quantity, and vertical
and horizontal arrangement. The fuel hazard is rated into 5 classes (classes definition given in Appendix
A2).
Visual Hazard Scores (PCS and FHS) and fuel layer height were systematically appraised at predefined
points in the sampling grid (Fig 3.2). At each Visual Hazard Score sampling point, surface, near-surface
and elevated fuel layers were assessed within a 5-m radius. Intermediate and overstorey canopy fuels
were assessed within a 10-m radius of the sample point.
Analysis
The nature of the fuel data sampled, continuous (e.g., fuel layer height, fuel layer load) and ranked (PCS,
FHS) data required a number of distinct statistical methods to test for differences between fuel
characteristics with age. For the continuous variables in the heath fuel type, with only two ages classes,
independent samples T-tests were used. For the categorical variables the non-parametric Mann-Whitney U
test was used. The mallee fuel type encompassed three age groups, nominally 8-yr, 21-yr and 49-yr.
Multiple comparison tests were then used to test for significant fuel characteristics differences with age.
Scheffe multiple comparison test was used for the continuous variables and the Kurskal-Wallis H test for
the ranked data. Variables were tested at the significance level α=0.05.
19B3.3. RESULTS Fuel layer/strata - cover
The mallee-heath fuel complex was considered to be composed of two main strata, surface (comprising
litter, near-surface and elevated layers) and overstorey (Fig. 3.1). This classification aim to separate the
fuels by their contribution to fire spread regime, i.e., surface and crown fire propagation.
Table 3.1 provides the horizontal distribution of fuel cover per layer and bare ground for heath and mallee
fuel complexes. The plots classified as heath had sparse mallee overstorey component covering less then
5% of the area. Cover of mallee eucalypt clumps in the mallee fuel type varied between 6 (in younger
fuels) and 24% on a plot basis (Fig 3.3), and between 13 and 18% when considering fuel age (Table 3.1). For
the mallee fuel type Scheffe multiple comparison test identified significant differences for bare ground
between 8-yr old fuels and 21-yr (p=0.01) and 49-yr (p=0.03) old fuels. None of the fuel layers showed
significant changes in percent cover with age or fuel type. Near-surface and elevated fuel layers cover
varied between 11 and 16% and 19 and 37% respectively.

PROGRAM A :: REPORT NO. A.10.01
25
TABLE 3.1. MEAN FUEL LAYER/STRATUM PERCENT COVER PER FUEL TYPE AND AGE
Fuel age (years) Fuel strata 8 21 49
Heath
Bare ground 29 18
Litter 26 24
Near-surface 11 16
Elevated fuel 32 37
Overstorey 2 3
Mallee
Bare ground 35 18 21
Litter 11 17 16
Near-surface 17 16 16
Elevated fuel 19 36 29
Overstorey 17 13 18

PROGRAM A :: REPORT NO. A.10.01
26
Figure 3.3. Plot variation in ground cover classes for heath and mallee fuel types. BG – bare ground; L –
litter; NS – near-surface; E – elevated; OC – overstorey canopy. Values linked to NS, E and OC slices
indicate average height (m) of fuel component.

PROGRAM A :: REPORT NO. A.10.01
27
Figure 3.4. Low level oblique photograph of Plot X (49 tear-old mallee fuel type) showing medium scale
(≅0.01 ha) fuel heterogeneity. Mallee canopy (20% cover) has the darker signature.
Fuel layer/stratum - height
Fuel layer/stratum height is an important fuel complex property that determines its porosity and defines
the unit volume where the flame develops. For the same fuel load and burning conditions, a deeper fuel
layer will support taller flames. This is particularly important in discontinuous layers as it is the size of the
flames that will allow the flame front to cross patches of fuel discontinuity.
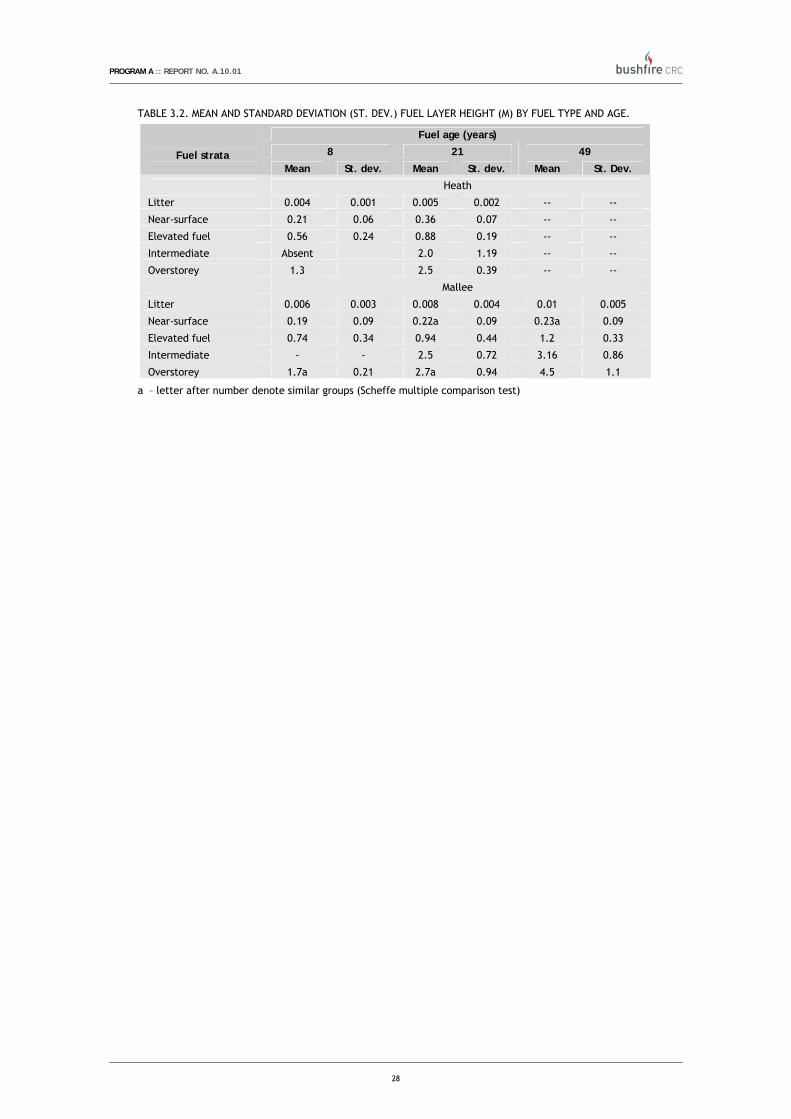
The litter layer in the heath fuel type consisted of a thin (less then 0.01 m) and incipient layer of small
shrub dead leaves. In this fuel type there were no significant differences for the litter layer height
between fuel ages 8- and 21-years. Both near-surface and elevated fuel layers showed a significant
(p<0.01) increase in height between these two ages (Table 3.2). The largest change was observed for the
near-surface layer with height extending from 0.21 to 0.36 m, and increase of 71%. The elevated layer
increase was 57%.
For the mallee fuel type, the litter layer height showed a significant (p=0.04) increase from age 8-yr (0.004
m) to age 21-yr (0.007 m), after which change in height was not significant (Table 3.2). The near-surface
fuel layer showed a similar dynamics, with layer height showing a significative increase (p=0.03) between
age 8- and age 21-yr. As per the litter layer, no significant changes occur between age 8 and 21-yr.
Scheffe multiple comparison test considered near-surface layer height for the 21- and 49-yr fuels as an
homogeneous subset. Elevated fuels in the mallee fuel type were higher then found in the heath fuel type
(Fig. 3.4). Significant changes (Scheffe, p<0.001) in elevated fuel layer height were found between the
three sampled ages. Relative increases in elevated layer height were 27% between ages 8- and 21-yr, and
28% from 21- to 49-yr. The overstorey layer, consisting exclusively of mallee shrubs, showed modest
changes in height from age 8- to 21-yr (Table 3.2, Fig. 3.4), followed by a significant (p<0.001) increase
(67%) at age 49-yr, at which average height was 4.5 m.
PROGRAM A :: REPORT NO. A.10.01
28
TABLE 3.2. MEAN AND STANDARD DEVIATION (ST. DEV.) FUEL LAYER HEIGHT (M) BY FUEL TYPE AND AGE.
Fuel age (years)
8 21 49 Fuel strata Mean St. dev. Mean St. dev. Mean St. Dev.
Heath
Litter 0.004 0.001 0.005 0.002 -- --
Near-surface 0.21 0.06 0.36 0.07 -- --
Elevated fuel 0.56 0.24 0.88 0.19 -- --
Intermediate Absent 2.0 1.19 -- --
Overstorey 1.3 2.5 0.39 -- --
Mallee
Litter 0.006 0.003 0.008 0.004 0.01 0.005
Near-surface 0.19 0.09 0.22a 0.09 0.23a 0.09
Elevated fuel 0.74 0.34 0.94 0.44 1.2 0.33
Intermediate - - 2.5 0.72 3.16 0.86
Overstorey 1.7a 0.21 2.7a 0.94 4.5 1.1
a – letter after number denote similar groups (Scheffe multiple comparison test)
PROGRAM A :: REPORT NO. A.10.01
29
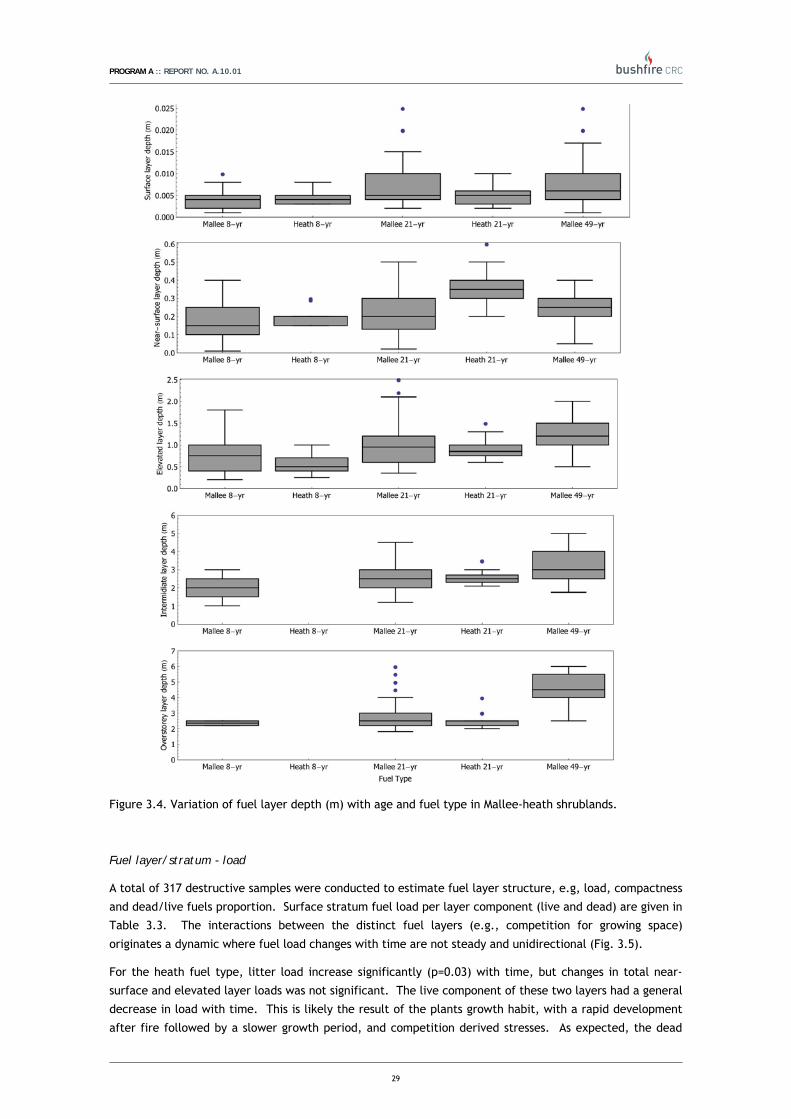
Figure 3.4. Variation of fuel layer depth (m) with age and fuel type in Mallee-heath shrublands.
Fuel layer/stratum - load
A total of 317 destructive samples were conducted to estimate fuel layer structure, e.g, load, compactness
and dead/live fuels proportion. Surface stratum fuel load per layer component (live and dead) are given in
Table 3.3. The interactions between the distinct fuel layers (e.g., competition for growing space)
originates a dynamic where fuel load changes with time are not steady and unidirectional (Fig. 3.5).
For the heath fuel type, litter load increase significantly (p=0.03) with time, but changes in total near-
surface and elevated layer loads was not significant. The live component of these two layers had a general
decrease in load with time. This is likely the result of the plants growth habit, with a rapid development
after fire followed by a slower growth period, and competition derived stresses. As expected, the dead
PROGRAM A :: REPORT NO. A.10.01
30
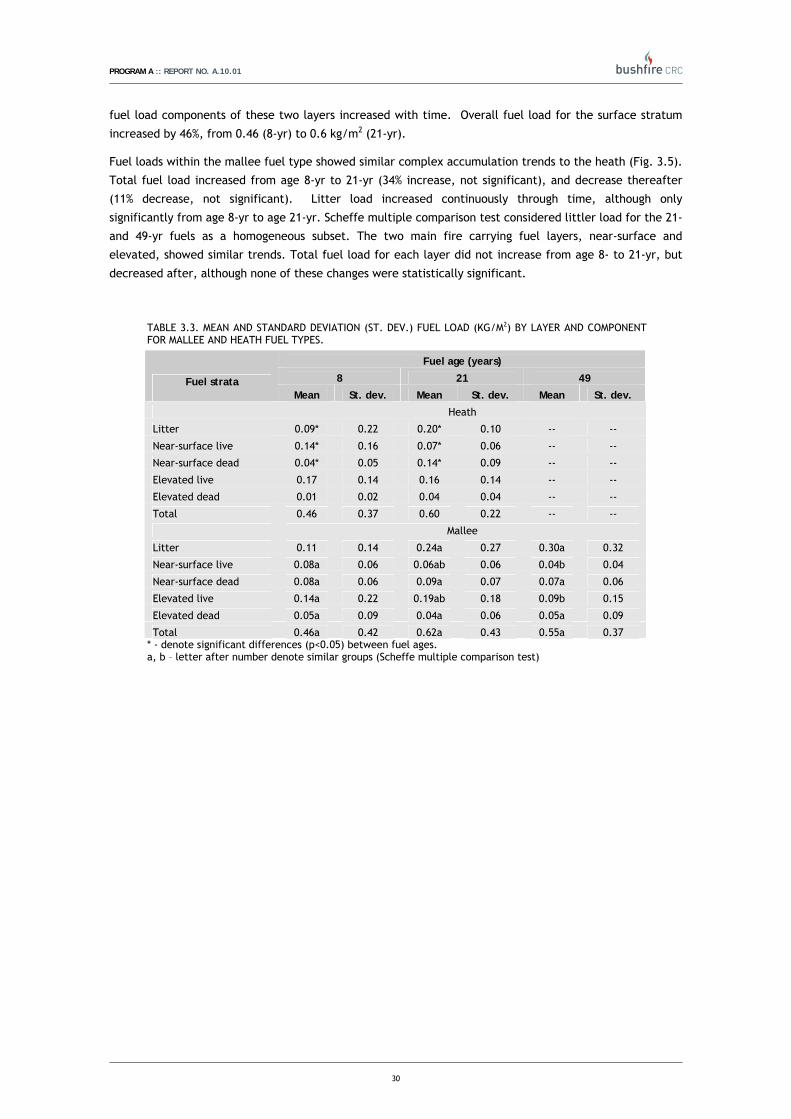
fuel load components of these two layers increased with time. Overall fuel load for the surface stratum
increased by 46%, from 0.46 (8-yr) to 0.6 kg/m2 (21-yr).
Fuel loads within the mallee fuel type showed similar complex accumulation trends to the heath (Fig. 3.5).
Total fuel load increased from age 8-yr to 21-yr (34% increase, not significant), and decrease thereafter
(11% decrease, not significant). Litter load increased continuously through time, although only
significantly from age 8-yr to age 21-yr. Scheffe multiple comparison test considered littler load for the 21-
and 49-yr fuels as a homogeneous subset. The two main fire carrying fuel layers, near-surface and
elevated, showed similar trends. Total fuel load for each layer did not increase from age 8- to 21-yr, but
decreased after, although none of these changes were statistically significant.
TABLE 3.3. MEAN AND STANDARD DEVIATION (ST. DEV.) FUEL LOAD (KG/M2) BY LAYER AND COMPONENT FOR MALLEE AND HEATH FUEL TYPES.
Fuel age (years)
8 21 49 Fuel strata Mean St. dev. Mean St. dev. Mean St. dev.
Heath
Litter 0.09* 0.22 0.20* 0.10 -- --
Near-surface live 0.14* 0.16 0.07* 0.06 -- --
Near-surface dead 0.04* 0.05 0.14* 0.09 -- --
Elevated live 0.17 0.14 0.16 0.14 -- --
Elevated dead 0.01 0.02 0.04 0.04 -- --
Total 0.46 0.37 0.60 0.22 -- --
Mallee
Litter 0.11 0.14 0.24a 0.27 0.30a 0.32
Near-surface live 0.08a 0.06 0.06ab 0.06 0.04b 0.04
Near-surface dead 0.08a 0.06 0.09a 0.07 0.07a 0.06
Elevated live 0.14a 0.22 0.19ab 0.18 0.09b 0.15
Elevated dead 0.05a 0.09 0.04a 0.06 0.05a 0.09
Total 0.46a 0.42 0.62a 0.43 0.55a 0.37 * - denote significant differences (p<0.05) between fuel ages. a, b – letter after number denote similar groups (Scheffe multiple comparison test)

PROGRAM A :: REPORT NO. A.10.01
31
Figure 3.5. Variation of fuel layer load (kg/m2) with age and fuel type in Mallee-heath shrublands. The
near-surface and elevated fuel load includes both live and dead fuel
Overstorey canopy fuel structure was estimated from the destructive sample of 9 Mallee clumps from the
21- and 49 year-old fuels. Clump height ranged between 2.3 and 5.5 m, averaging 3.5 m (st. dev. 1.17 m).
Clump area varied between 2.1 and 8.8 m2, for an average of 4.9 m2. Average mallee clump fuel structure
properties can be summarized as (standard deviation in parenthesis): canopy fuel load: 0.60 kg/m2 (0.14);
canopy base height: 2.6 m (1.02). No significant differences in canopy fuel load were found with age and
clump size. Linking the cover estimated from the gap intersect method with the mallee canopy fuel load
derived from destructive sampling gives for overall canopy fuel load of 0.015 and 0.1 kg/m2 respectively
for heath and mallee fuel types.
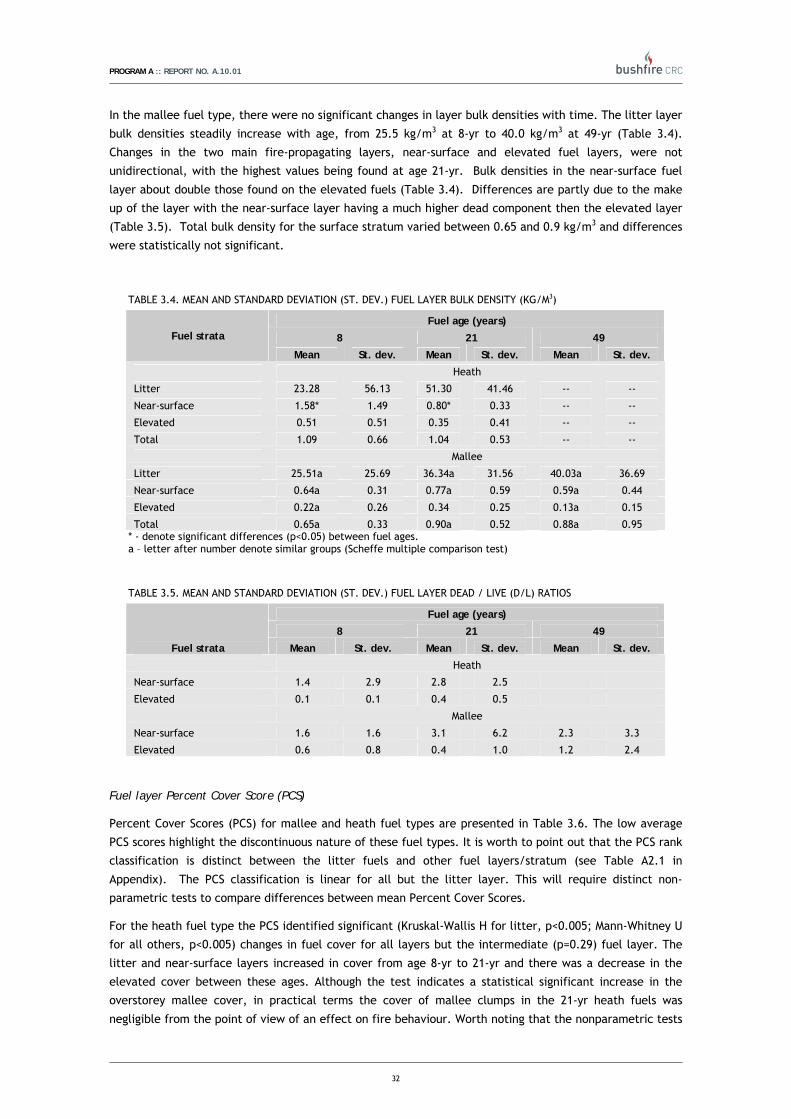
Fuel layer/stratum - bulk density
Bulk density varied greatly between fuel layers. For the heath fuel type, the litter layer increased 23.3 and
51.3 kg/m3, whereas the elevated layer varied between 0.13 and 0.51 kg/m3. No significant changes in
layer bulk density with age were observed with the exception of the near-surface fuels. This layer had a
significant (p=0.04) reduction in bulk density with age, changing from 1.58 at 8-yr to 0.8 kg/m3 at 21-yr.
PROGRAM A :: REPORT NO. A.10.01
32
In the mallee fuel type, there were no significant changes in layer bulk densities with time. The litter layer
bulk densities steadily increase with age, from 25.5 kg/m3 at 8-yr to 40.0 kg/m3 at 49-yr (Table 3.4).
Changes in the two main fire-propagating layers, near-surface and elevated fuel layers, were not
unidirectional, with the highest values being found at age 21-yr. Bulk densities in the near-surface fuel
layer about double those found on the elevated fuels (Table 3.4). Differences are partly due to the make
up of the layer with the near-surface layer having a much higher dead component then the elevated layer
(Table 3.5). Total bulk density for the surface stratum varied between 0.65 and 0.9 kg/m3 and differences
were statistically not significant.
TABLE 3.4. MEAN AND STANDARD DEVIATION (ST. DEV.) FUEL LAYER BULK DENSITY (KG/M3)
Fuel age (years)
8 21 49 Fuel strata
Mean St. dev. Mean St. dev. Mean St. dev.
Heath
Litter 23.28 56.13 51.30 41.46 -- --
Near-surface 1.58* 1.49 0.80* 0.33 -- --
Elevated 0.51 0.51 0.35 0.41 -- --
Total 1.09 0.66 1.04 0.53 -- --
Mallee
Litter 25.51a 25.69 36.34a 31.56 40.03a 36.69
Near-surface 0.64a 0.31 0.77a 0.59 0.59a 0.44
Elevated 0.22a 0.26 0.34 0.25 0.13a 0.15
Total 0.65a 0.33 0.90a 0.52 0.88a 0.95 * - denote significant differences (p<0.05) between fuel ages. a – letter after number denote similar groups (Scheffe multiple comparison test)
TABLE 3.5. MEAN AND STANDARD DEVIATION (ST. DEV.) FUEL LAYER DEAD / LIVE (D/L) RATIOS
Fuel age (years)
8 21 49
Fuel strata Mean St. dev. Mean St. dev. Mean St. dev.
Heath
Near-surface 1.4 2.9 2.8 2.5
Elevated 0.1 0.1 0.4 0.5
Mallee
Near-surface 1.6 1.6 3.1 6.2 2.3 3.3
Elevated 0.6 0.8 0.4 1.0 1.2 2.4
Fuel layer Percent Cover Score (PCS)
Percent Cover Scores (PCS) for mallee and heath fuel types are presented in Table 3.6. The low average
PCS scores highlight the discontinuous nature of these fuel types. It is worth to point out that the PCS rank
classification is distinct between the litter fuels and other fuel layers/stratum (see Table A2.1 in
Appendix). The PCS classification is linear for all but the litter layer. This will require distinct non-
parametric tests to compare differences between mean Percent Cover Scores.
For the heath fuel type the PCS identified significant (Kruskal-Wallis H for litter, p<0.005; Mann-Whitney U
for all others, p<0.005) changes in fuel cover for all layers but the intermediate (p=0.29) fuel layer. The
litter and near-surface layers increased in cover from age 8-yr to 21-yr and there was a decrease in the
elevated cover between these ages. Although the test indicates a statistical significant increase in the
overstorey mallee cover, in practical terms the cover of mallee clumps in the 21-yr heath fuels was
negligible from the point of view of an effect on fire behaviour. Worth noting that the nonparametric tests

PROGRAM A :: REPORT NO. A.10.01
33
used for the PCS and FHS are less powerful then the tests used for the sampled physical fuel variables
discussed above.
Simultaneous Kruskal Wallis H test was used to compare PCS across the three nominal ages in the mallee
fuel type. All the fuel layers/stratums but the near-surface one showed significant differences (p<0.001).
As for other fuel characteristics, the changes in percent cover for the near-surface and elevated layers
were not unidirectional (Table 3.6). This highlights the complex time dependent interactions between the
various strata, where the expansion of upper strata restricts the development of the understorey fuel
layers.
TABLE 3.6. MEAN AND STANDARD DEVIATION (ST. DEV.) FUEL LAYER PCS
Fuel age (years)
8 21 49 Fuel strata
Mean St. dev. Mean St. dev. Mean St. dev.
Heath
Litter 0.1* 0.4 0.9* 0.4
Near-surface 1.0* 0.0 2.3* 0.6
Elevated 2.0* 0.0 1.3* 0.5
Intermediate 0.0 0.0 0.1 0.3
Overstorey 0.1* 0.4 0.6* 0.5
Mallee
Litter 0.3* 0.4 1.0* 0.5 1.0* 0.7
Near-surface 1.7 0.8 1.5 0.6 1.5 0.5
Elevated 1.5* 0.6 1.9* 0.7 1.3* 0.5
Intermediate 0.1* 0.3 0.4* 0.6 0.6* 0.7
Overstorey 0.0* 0.2 0.4* 0.6 0.9* 0.7
* - denote significant differences (p<0.05) between fuel ages using Kruskal Wallis H test.
Fuel layer Fuel Hazard Score (FHS)
Fuel Hazard Scores (FHS) for heath and mallee fuel types are presented in Table 3.7. For the heath fuel
type the near-surface and elevated layers have the largest Fuel Hazard Scores, demonstrating the
relevance of these fuel layers for fire propagation. Nonetheless, FHS for these layers decrease with time
(Table 3.7). Both these changes in FHS were statistically significant (p<0.005). Litter layer FHS did not
increase with time, being kept at a value close to 1 (very thin litter layer). FHS for intermediate and
overstorey attempt to rank bark hazard. Both plant traits and young age resulted in very low bark FHS
(<0.6) in the heath fuel type.
FHS in the mallee fuel type differ slightly from the heath fuel type (Table 3.7). Kruskal-Wallis tests
identified significant differences (p<0.005) with time for all fuel layers. All layers increase FHS from age
8- to 21-yr. After 21-yr, FHS for the surface fuel stratum layers seem to become constant, whereas the
bark FHS for the intermediate and overstorey stratums continue to increase.

PROGRAM A :: REPORT NO. A.10.01
34
TABLE 3.7. MEAN AND STANDARD DEVIATION (ST. DEV.) FUEL LAYER FHS
Fuel age (years)
8 21 49 Fuel strata
Mean St. dev. Mean St. dev. Mean St. dev.
Heath
Litter 1.1 0.4 1.1 0.3
Near-surface 3.0* 0.0 2.5* 0.4
Elevated 1.9* 0.4 1.4* 0.5
Intermediate 0.0 0.0 0.1 0.3
Overstorey 0.1* 0.4 0.6* 0.5
Mallee
Litter 1.0* 0.1 1.6* 0.6 1.8* 0.7
Near-surface 1.8* 0.5 2.2* 0.6 2.0* 0.7
Elevated 1.3* 0.4 1.7* 0.5 1.6* 0.6
Intermediate 0.1* 0.3 0.3* 0.5 0.4* 0.5
Overstorey 0.0* 0.1 0.5* 0.9 1.2* 1.2
* - denote significant differences (p<0.05) between fuel ages using Kruskal Wallis H test.
20B3.4. DISCUSSION AND CONCLUSIONS The focus of the fuel inventory work was to quantify the fuel characteristics that affect fire spread
mechanisms in mallee-heath fuel complexes. In addition, the sample of fuel structure over a range of
ages allowed investigating fuel dynamics with time by considering a space-for-time sampling assumption.
Our analysis is restricted to the changes in fuel structure over two ages for heath (7 to 21 years) and three
ages for mallee: 7 to 21 years, and 20 to 50 years.
The mallee-heath fuel complex is made up of discrete fuel layers of distinct dynamics (Table 3.8), with the
development of each particular fuel layer dependent on weather/climate factors and competitive
influences of other layers (Bradstock 1989). We did not sample fuel structure for stand ages younger then
7-years. During this early period ephemeral grasses reach maximum abundance due to lack of over- and
understorey layers competition. At age 7, approximately one third of the ground was not covered by any
fuels and the litter layer was still incipient in terms of both cover and load. The near-surface fuel layer,
comprising mostly grasses, had attained its steady state condition, and the elevated layer was
characterized by shrubs less then a meter tall, with an overall layer bulk density varying between 0.2 and
0.5 kg/m3 for the mallee-heath and heath fuel types respectively. The overstorey component, representing
the mallee canopy, averaged 17% cover and a height of 2.3 m. The aggregate of fuel layers constitute a
sparse fuel complex. The extent of fuel discontinuity suggested that fire would not be able to propagate
unless under very severe fire weather conditions.
Between age 7 and 21-years fuel dynamics in the heath fuel type was characterized by an increase in
height and maintenance of load at a steady level for the near-surface and elevated fuel layers (Table 3.8,
Figure 3.6). For the mallee-heath fuel type, changes in the near-surface fuel layer were not significant,
whereas all other layers showed a significant increase in cover, height and load (with the exception of the
overstorey canopy cover). Changes in the mallee-heath fuel complex structure between age 19 and 50
years were complex, highlighting the competitive interactions between the various strata, where the
expansion of upper strata restricts the development of the understorey fuel layers. There were significant
increases in all overstorey canopy fuel metrics, while the elevated fuel layer (likely the single most
important fuel layer in this fuel type) increased in height, but had a significant reduction in cover and
load. The near-surface layer characteristics remain unchanged during this period.

PROGRAM A :: REPORT NO. A.10.01
35
TABLE 3.8: CHANGES IN FUEL STRUCTURE CHARACTERISTICS WITH AGE IN HEATH FUEL TYPE.
⇑ denotes significant increase (p< 0.1); ⇓ denotes significant decrease (p<0.1); = denotes no significant change (p>0.1).
7 – 21 years Fuel property
Litter NS Elev. OS
Height = ⇑ ⇑ ⇑
Load ⇑ = = =
PCS ⇑ ⇑ ⇓ =
FHS = = = =
TABLE 3.9: CHANGES IN FUEL STRUCTURE CHARACTERISTICS WITH AGE IN MALLEE-HEATH FUEL TYPE.
⇑ denotes significant increase (p< 0.1); ⇓ denotes significant decrease (p<0.1); = denotes no significant change (p>0.1).
7 – 21 years 20 – 50 years Fuel property
Litter NS Elev. OS Litter NS Elev OS
Cover ⇑ = ⇑ = = = ⇓ ⇑
Height ⇑ = ⇑ ⇑ = = ⇑ ⇑
Load ⇑ = ⇑ ⇑ ⇑ = ⇓ ⇑
PCS ⇑ = ⇑ ⇑ = = ⇓ ⇑
FHS ⇑ ⇑ ⇑ ⇑ ⇑ ⇓ = ⇑
The results in Table 3.8 and 3.9 follow Walker (1981) and Bradstock (1989) speculative reasoning on fuel
complex dynamics in mallee-heath vegetation. Distinct fuel layers evolve with time since fire disturbance
as a function of competition stresses. Both the near-surface and elevated fuel layers increase in relevance
with time after fire, peaking before competition limits development and induces a regressive condition, as
seen for fuel load in Figure 3.6. When considering both fuel load and cover evolution with time, the
distinct growth habits of the plants that constitute each fuel layer will determine particular dynamics of
development.
Total sampled fuel loads were within range but slightly lower then found in other studies in mallee-heath.
Specht (1966) sampling 10-year old fuels within the Ngarkat Conservation Area reported average above
ground biomass of 0.85 kg/m2. McCaw (1997) report average available fuel loads of 1.2 kg/m2 in 21-year
old mallee-heath stands in the Stirlings Ranges, WA. The low average fuel loads of these communities are
associated with the semi-arid environment with large periods of the year under a large soil moisture deficit
and the low levels of nutrients present (McCaw 1997). The fuel loads found in the present work were lower
then found in other studies (e.g., Burrows and McCaw 1990; Bradstock and Gill 1994; McCaw 1997). This
could be possibly attributed to the drought that characterised the study period.

PROGRAM A :: REPORT NO. A.10.01
36
Figure 3.6. Load distribution per fuel layer with time in heath and mallee vegetation.
Two key fuel parameters in determining fire behaviour in mallee-heath fuel types are height and cover.
This is because these two parameters define the relative size of the discrete fuel volumes to the fuel gaps.
For the same cover level, larger fuel volumes support larger flames which increase the likelihood of fire to
cross fuel gaps. Both elevated and overstorey layers showed an increase in height with time. At age 49-
years the elevated fuel layer height averaged 1.2 m, and overstorey mallee component had a height of 4.5
m. The height increase with time between age 21- and 49 years old fuels suggest that at the older age an
asymptote has been reached. The near-surface fuel layer height remained unchanged with time in the
mallee fuel type, averaging 0.2 m. In the pure heath fuel type the near-surface layer showed an increase
in height from age 8- to 21-years. At age 21-years, near-surface layer fuel height was substantially higher
in heath (0.36 m) than in mallee (0.22 m). Litter was characterised by low depths (<0.01 m). The low
average litter height values result from the integration of the mostly incipient litter below the heath
component with the more developed mallee litter, which averaged 0.02 m height.
Gaps characterised by absence of fuel covered between one-third (age 8-years) to approximately 20% (age
49-years) of the surface. The overstorey mallee component cover was less then 5% in the heath fuel type
and between 13 and 18% in the mallee-heath fuel type. This level of cover was less then found in other
studies revealing the importance of the site heathy component. Noble (1986) reports mallee cover of 34%
and Bradstock and Cohn (2002) report several studies with mallee cover between 20 – 50%. Changes in the
litter and near-surface fuel layers with time were subtle and statistically non significant. This suggests
that cover of these two layers achieve their maximum for a particular site before age 8-years. The
elevated fuel layer cover in the heath fuel type did not change significantly with time. In the mallee fuel
type the elevated fuel layer increased in cover initially between age 8 and 21-year. After this period the
cover decreased as the overstorey mallee component matured.
The sampled visual assessment scores varied between low to moderate (Gould et al. 2007) in the near-
surface and elevated layers and nil to low in the litter and overstorey layers. These ratings encapsulate
the reduced cover and low loads associated to the various fuel layers. It is important to understand the
context of the visual assessment scores before inferences about the flammability of the heath and mallee
fuel types are made. The scores are related to factors that determine difficulty of suppression (both from
a fire behaviour potential and accessibility point of view) in dry eucalypt forest. The impact of macro-
meteorological conditions in mallee-heath fire behaviour dynamics is distinct from forest fuel types. The
structural properties of the mallee-heath fuel bed, e.g., low fuel loads and bulk densities, determine that
the fire processes and the resulting fire spread regime can be distinct from what is found in eucalypt
forests. As such, the low ratings do not indicate a low flammability per se. Evaluation of the impact of
the individual scores in fire behaviour will be analysed in chapter 4 and 5.

PROGRAM A :: REPORT NO. A.10.01
37
The ultimate goal of modelling fuel dynamics is to predict fuel structure changes with time and
environment conditions. The limited fuel characterization work carried out in this study highlight the
complex interactions between fuel layers in the mallee heath fuel type, but do not allow to fully
comprehend how fuels change with time. Mallee-heath vegetation, and in turn the structure of the fuel
complex, is determined by soil characteristics (Specht 1982), preceding climatic conditions and fire regime
(McCaw 1997). These meta-processes determine the specific vegetation associations that will occur at a
given site. Our sampling approach was insufficient to describe the effects of the meta-processes on fuel
dynamics. Modelling fuel dynamics in mallee-heath will require a mechanistic modelling approach that
integrates plant morphology and physiology, soil characteristics, past/future climatic conditions and fire
regime.

PROGRAM A :: REPORT NO. A.10.01
38

PROGRAM A :: REPORT NO. A.10.01
39
5B4. FUEL MOISTURE
21B4.1. INTRODUCTION Dead fine fuel moisture content is an important determinant of fire ignition and behaviour. This chapter
describes the fuel moisture measurements and modelling. This work includes:
• Field measurements of fuel moisture made at the same time as the experimental burns,
• Additional field measurements made to examine diurnal variation in fuel moisture during the day,
• Laboratory measurements made to determine physical properties of mallee and heath fuels,
• Development of models to predict dead fuel moisture content of litter and suspended mallee and
heath fuels,
• Development of operational tools (nomograms) for predicting fuel moisture content in the field
The operational model are simple and practical tools for use in the field. These simple tools are backed up
by the rigorous field measurements and process-based modelling described in this chapter.
22B4.2. FIELD MEASUREMENTS
46B4.2.1. Methods
Measurements of dead fuel moisture content were made in 2006, 2007, and 2008. In addition, detailed
microclimate measurements were made in 2007. Fuel moisture was measured by destructive sampling.
Two types of samples were collected from both mallee and heath vegetation. Litter was collected from
the top 10 mm of the litter layer. In many places the litter layer was less than 10 mm deep, in which case
the entire layer was sampled. Suspended fuel samples were taken from between 0.1 and 1.0 m height,
depending on the vertical distribution of fuel at each sampling location. Only dead, fine fuels were
collected. For each observation, five samples each of litter and suspended fuel of 10 – 20 g of dead
material of diameter less than 6 mm were placed in a sealed tin. The sample tins were returned to a field
office where they were weighed, dried for 24 h at 105 °C in a fan forced oven, and then reweighed. Fuel
moisture content was calculated as a percentage of dry weight
dry
drywet
mmm
=M−
100 (1)
where M is fuel moisture content, and mwet and mdry are the mass of the sample before and after oven
drying.
Two days of intensive moisture sampling were conducted. On these days 5 samples each of mallee litter
and suspended fuel, and heath litter and suspended dead fuel were collected simultaneously
approximately every hour from 09:00 to 17:00. The first sampling day was 14 May 2006. 25 mm of rain
had fallen on the site over a period of 4 days from 7 to 10 May 2006. Measurements were made in mallee
and heath that had last been burned in 1986. Samples were taken from plots separated by 100 m.
Microclimate measurements were not available for this day but air temperature and relative humidity were
measured using an aspirated psychrometer. The second day of observations was 20 April 2007. No rain
had fallen recently and the fuels and soil were dry. Measurements were made at the same location as the
microclimate instruments (see below). Five samples of soil moisture between 0 - 2 cm and 0 - 5 cm were
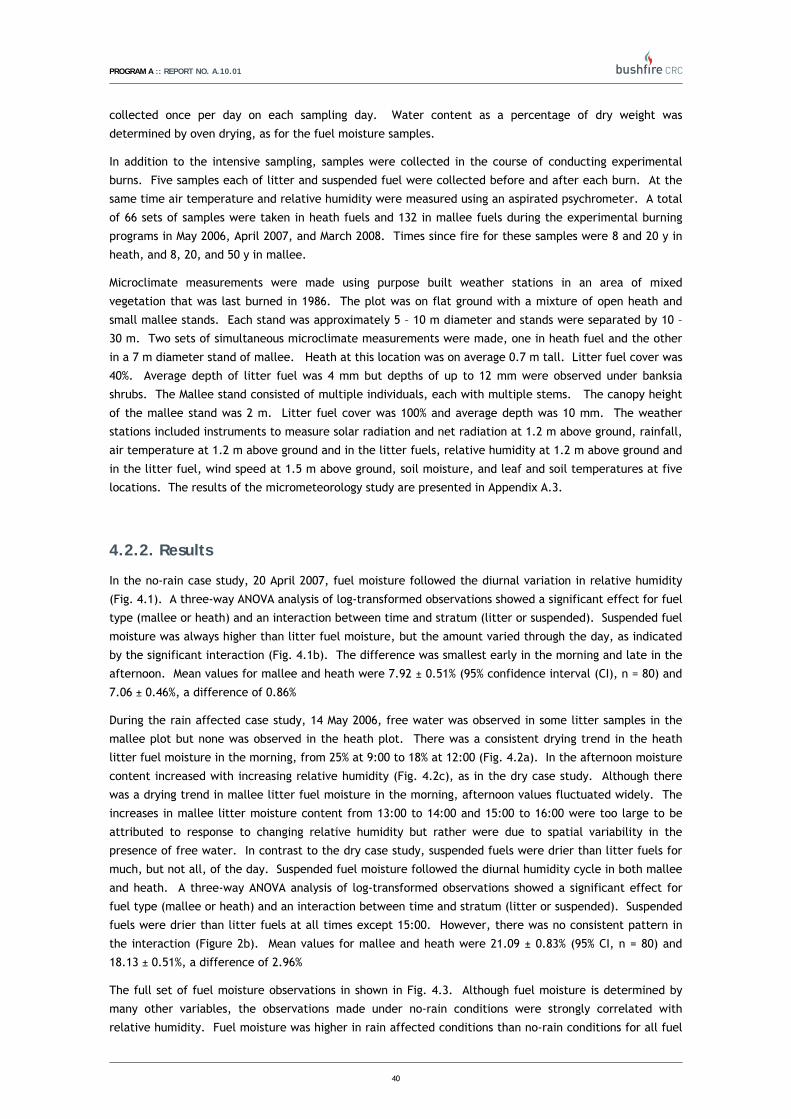
PROGRAM A :: REPORT NO. A.10.01
40
collected once per day on each sampling day. Water content as a percentage of dry weight was
determined by oven drying, as for the fuel moisture samples.
In addition to the intensive sampling, samples were collected in the course of conducting experimental
burns. Five samples each of litter and suspended fuel were collected before and after each burn. At the
same time air temperature and relative humidity were measured using an aspirated psychrometer. A total
of 66 sets of samples were taken in heath fuels and 132 in mallee fuels during the experimental burning
programs in May 2006, April 2007, and March 2008. Times since fire for these samples were 8 and 20 y in
heath, and 8, 20, and 50 y in mallee.
Microclimate measurements were made using purpose built weather stations in an area of mixed
vegetation that was last burned in 1986. The plot was on flat ground with a mixture of open heath and
small mallee stands. Each stand was approximately 5 – 10 m diameter and stands were separated by 10 –
30 m. Two sets of simultaneous microclimate measurements were made, one in heath fuel and the other
in a 7 m diameter stand of mallee. Heath at this location was on average 0.7 m tall. Litter fuel cover was
40%. Average depth of litter fuel was 4 mm but depths of up to 12 mm were observed under banksia
shrubs. The Mallee stand consisted of multiple individuals, each with multiple stems. The canopy height
of the mallee stand was 2 m. Litter fuel cover was 100% and average depth was 10 mm. The weather
stations included instruments to measure solar radiation and net radiation at 1.2 m above ground, rainfall,
air temperature at 1.2 m above ground and in the litter fuels, relative humidity at 1.2 m above ground and
in the litter fuel, wind speed at 1.5 m above ground, soil moisture, and leaf and soil temperatures at five
locations. The results of the micrometeorology study are presented in Appendix A.3.
47B4.2.2. Results
In the no-rain case study, 20 April 2007, fuel moisture followed the diurnal variation in relative humidity
(Fig. 4.1). A three-way ANOVA analysis of log-transformed observations showed a significant effect for fuel
type (mallee or heath) and an interaction between time and stratum (litter or suspended). Suspended fuel
moisture was always higher than litter fuel moisture, but the amount varied through the day, as indicated
by the significant interaction (Fig. 4.1b). The difference was smallest early in the morning and late in the
afternoon. Mean values for mallee and heath were 7.92 ± 0.51% (95% confidence interval (CI), n = 80) and
7.06 ± 0.46%, a difference of 0.86%
During the rain affected case study, 14 May 2006, free water was observed in some litter samples in the
mallee plot but none was observed in the heath plot. There was a consistent drying trend in the heath
litter fuel moisture in the morning, from 25% at 9:00 to 18% at 12:00 (Fig. 4.2a). In the afternoon moisture
content increased with increasing relative humidity (Fig. 4.2c), as in the dry case study. Although there
was a drying trend in mallee litter fuel moisture in the morning, afternoon values fluctuated widely. The
increases in mallee litter moisture content from 13:00 to 14:00 and 15:00 to 16:00 were too large to be
attributed to response to changing relative humidity but rather were due to spatial variability in the
presence of free water. In contrast to the dry case study, suspended fuels were drier than litter fuels for
much, but not all, of the day. Suspended fuel moisture followed the diurnal humidity cycle in both mallee
and heath. A three-way ANOVA analysis of log-transformed observations showed a significant effect for
fuel type (mallee or heath) and an interaction between time and stratum (litter or suspended). Suspended
fuels were drier than litter fuels at all times except 15:00. However, there was no consistent pattern in
the interaction (Figure 2b). Mean values for mallee and heath were 21.09 ± 0.83% (95% CI, n = 80) and
18.13 ± 0.51%, a difference of 2.96%
The full set of fuel moisture observations in shown in Fig. 4.3. Although fuel moisture is determined by
many other variables, the observations made under no-rain conditions were strongly correlated with
relative humidity. Fuel moisture was higher in rain affected conditions than no-rain conditions for all fuel

PROGRAM A :: REPORT NO. A.10.01
41
types, even at moisture contents well below the fibre saturation point. Because fuel moisture in the
presence of rain depends on complex interception and evaporation processes (Matthews 2006, Viney 1991),
the rain-affected results in Fig. 4.3 are specific to this particular data set and do not illustrate a general
relationship between relative humidity and fuel moisture. Over the full data set, relationships between
fuel types and fuel strata were the same as those described for the dry case study.
0
5
10
15
Fuel
moi
stur
e (%
)
09 10 11 12 13 14 15 16Local time (h)
a) Mallee suspendedMallee litter
Heath suspendedHeath litter
1.0
1.5
2.0
2.5
3.0
log(
fuel
moi
stur
e)
09 10 11 12 13 14 15 16Local time (h)
b) SuspendedLitter
Rel
ativ
e hu
mid
ity (%
)
0
10
20
30
40
50
60
15
20
25
30
Tem
pera
ture
(°C
)
09 10 11 12 13 14 15 16Local time (h)
Relative humidityTemperature
c)
Figure 4.1. Observations from 20 April 2007. a) Raw fuel moisture data. Points are means, vertical bars are
95% confidence-intervals (n = 5). b) Interaction of time and fuel stratum, modelled data from ANOVA of
log-transform of data in (a). Points are means, lines are 95% CI (n = 10). c) Air temperature and relative
humidity at 1.2 m AGL.
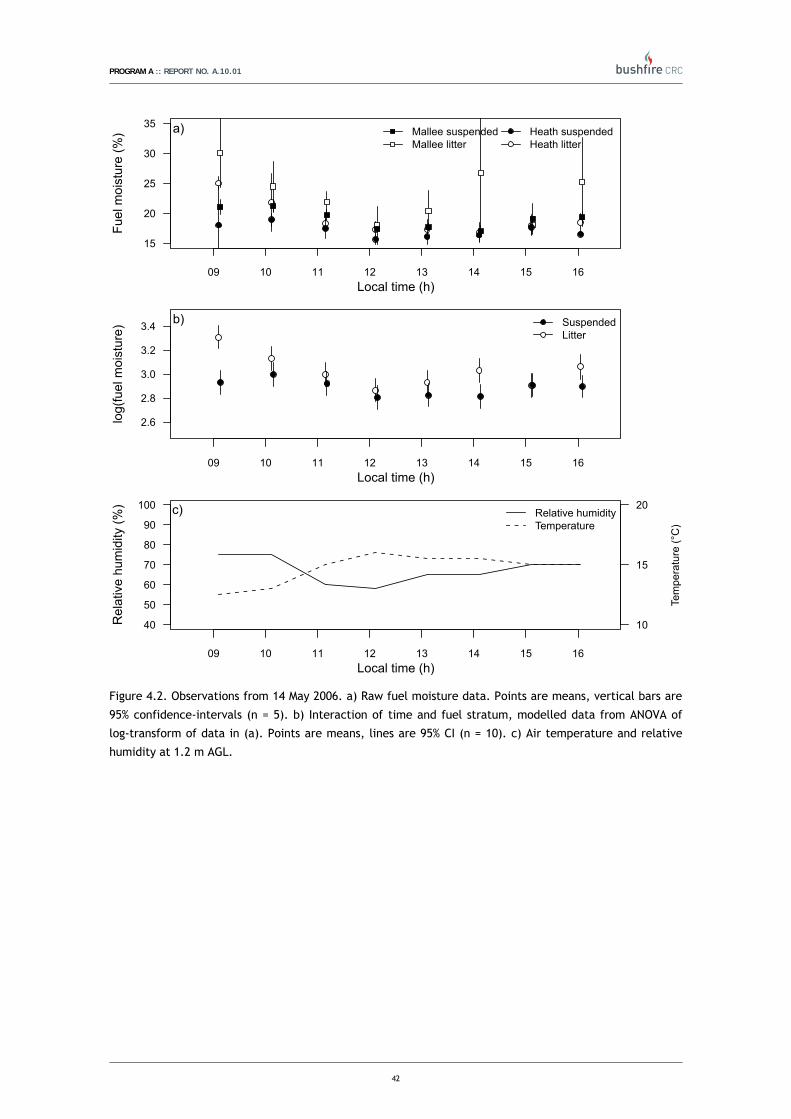
PROGRAM A :: REPORT NO. A.10.01
42
15
20
25
30
35Fu
el m
oist
ure
(%)
09 10 11 12 13 14 15 16Local time (h)
a) Mallee suspendedMallee litter
Heath suspendedHeath litter
2.6
2.8
3.0
3.2
3.4
log(
fuel
moi
stur
e)
09 10 11 12 13 14 15 16Local time (h)
b) SuspendedLitter
Rel
ativ
e hu
mid
ity (%
)
40
50
60
70
80
90
100
10
15
20
Tem
pera
ture
(°C
)
09 10 11 12 13 14 15 16Local time (h)
Relative humidityTemperature
c)
Figure 4.2. Observations from 14 May 2006. a) Raw fuel moisture data. Points are means, vertical bars are
95% confidence-intervals (n = 5). b) Interaction of time and fuel stratum, modelled data from ANOVA of
log-transform of data in (a). Points are means, lines are 95% CI (n = 10). c) Air temperature and relative
humidity at 1.2 m AGL.

PROGRAM A :: REPORT NO. A.10.01
43
0 20 40 60 80 100
05
1015
2025
30
Relative humidity (%)
Hea
th s
uspe
nded
FM
C (%
)Rain affectedNo rain
0 20 40 60 80 100
05
1015
2025
30
Relative humidity (%)M
alle
e su
spen
ded
FMC
(%)
0 20 40 60 80 100
05
1015
2025
30
Relative humidity (%)
Hea
th li
tter F
MC
(%)
0 20 40 60 80 100
05
1015
2025
30
Relative humidity (%)
Mal
lee
litte
r FM
C (%
)
Figure 4.3. All fuel moisture observations from 2006, 2007, and 2008. Horizontal axis is measured screen
level relative humidity.
48B4.2.3. Discussion
The lowest average moisture content observed was 1.7%, measured in mallee litter litter. At this time air
temperature was 35.4 °C and relative humidity was 6.5%. This moisture content is lower than has
previously been observed for eucalypt forest. Similarly low fuel moisture contents have been observed in
heath fuels (Aguado et al. 2007), however Aguado et al. (2007) used a low drying temperature (60°C),
which likely led to under-estimation of moisture content by up to 3% (Matthews 2010)
During burning conditions heath fuels were 0.85% drier than mallee and fuels. The difference between
litter and suspended fuel moisture varied depending on time of day. This is likely to be due to variation in
the radiative heating and convective cooling of the different fuel strata. Litter fuels are more densely
packed and less exposed to the wind than suspended fuels. Consequently, they are less able to dissipate
heat during times of strong sunshine and will tend to have a higher temperature. If litter temperature is
higher than suspended fuel temperature, then relative humidity will be lower and, as observed, fuel
moisture will also be lower. After rain, suspended fuels dried more rapidly than surface fuels. Although
only a very limited about of data were presented, there are strong physical grounds to expect this to be

PROGRAM A :: REPORT NO. A.10.01
44
the case in all circumstances. Suspended fuels retain less rainfall and are more exposed to the atmosphere
than litter fuels, leading suspended fuels to dry more rapidly. The observed differences in fuel moisture
between fuel types and fuel strata have implications for management of fire in mallee and heath
dominated fuels, as the different strata play different roles in regulating fire behaviour in each fuel type
(see chapter 6).
The fuel moisture observations were typical of those seen in similarly structured vegetation types.
The microclimate and fuel moisture observations presented here show similar characteristics to those
measured in mallee-heath in Western Australia (McCaw 1997) and heath in New South Wales (Plucinski
2003). McCaw observed moisture in Eucalyptus pachyloma Benth. litter to be up to 4% lower than that of
dead suspended Drosera drummondii Lehm. leaves. Plucinski observed that litter moisture contents in
several heath species were lower than suspended fuels during dry conditions but higher after rain, as was
the case in the present study. Although dead fuel moisture contents have been measured in shrublands for
fire behaviour experiments on other continents (Eriksson et al. 2003, Fernandes et al. 2000) the
measurements have not been presented in sufficient detail to allow a comparison with the present study.
However, it is expected that the microclimatic processes and differences in fuel moisture between litter
and suspended fuels observed in this study would be observed in all shrublands.
23B4.3. MODELLING
49B4.3.1. Methods
Models of fuel moisture in mallee-heath shrubland were developed using the method of Matthews et al.
(2009). In summary:
• Matthews (2006) litter- and Matthews and McCaw (2006) suspended-fuel moisture process-based
models were parameterised for Ngarkat fuels using laboratory measurements.
• These models were tested against the field measurements described above
• A simplified model using only a single differential equation was derived from the process-based
model. This was tested against the field observations
• A table of afternoon fuel moisture values for specified air temperature, humidity, wind speed,
and solar radiation values was calculated from the process-based models using an idealised diurnal cycle.
This was tested against the field observations
Details of the methods are provided in Matthews et al. (2010).
The process based models used for this study require a detailed description of the fuels. Because the
model has already been used with mallee fuels (Matthews 2006), the main requirement for this study was
determination of equilibrium moisture content and response time for the fuels at Ngarkat. Measurements
were made using the CSIRO Climate Chamber (Pippen 2007).
The measurement procedure was:
• Samples of fuel collected in the field were moistened with distilled water and left overnight in
the chamber in sealed containers to absorb the water.
• The samples was then exposed in the chamber until they reached equilibrium mass
This procedure was repeated until all necessary temperature and humidity combinations had been
measured. Measurements were made only for desorbing conditions. The samples were then oven dried for
24 h at 105 °C to determine dry mass. Measurements were made for mallee litter and suspended fuel and

PROGRAM A :: REPORT NO. A.10.01
45
for heath litter and suspended fuel. Measurements were made for humidity from 10 to 80% and
temperatures of 20 °C and 40 °C. Nelson's (1983) model was used to describe equilibrium moisture content
(EMC) as a linear function of change in Gibbs energy:
eBm+A=ΔGln (2)
⎟⎟⎠
⎞⎜⎜⎝
⎛⎟⎠⎞
⎜⎝⎛100
lnlnln HMRT=ΔG (3)
where ΔGln is the change in Gibbs energy, me is equilibrium moisture content (EMC, kg kg-1), R is the
universal gas constant (1.9872 cal K-1 mol-1), M is the molar mass of water (18.1053 g mol-1), T is fuel
temperature (K) and H is relative humidity (%). Following Pippen (2007), temperature dependent EMC
parameters were used with a constant rate of change of EMC of -0.001 kg kg-1 K-1. Values shown in Table
4.1 are for 20°C.
Response time was determined by fitting an exponential decay model to samples masses recorded by the
Climate Chamber data logging system. The complete set of parameters are shown in Table 4.1.
TABLE 4.1. MODEL PARAMETERS.
Mallee Heath Parameters Litter Suspended Litter Suspended
Litter layer bulk density (kg m-3) 62
Litter density (kg m-3) 550
Litter layer depth (m) 0.015 0.01 0.02 0.01
Litter SA:V ratio (m-1) 3000
Litter characteristic length (m) 0.03
Nelson A @ 20 °C 5.75 5.45 5.5 5.5
Nelson B @ 20 °C -19.61 -17.13 -16.67 -16.67
Litter surface conductance, Kma,E (m s-1) 0.0003 0.0003 0.0010 0.0010
Litter saturation moisture content (kg kg-1) 1.3
Liquid water absorption A (kg kg-1) 0.21
Liquid water absorption B (kg kg-1) -1.43
Litter albedo 0.27
Radiation attentuation coefficient 1.36
Litter heat conductivity, slope (W m-1 K-1) 0.22
Litter heat conductivity, intercept (W m-1 K-1) 0.14
Litter-surface water heat conductivity, Klm,H (W m-2 K-1) 700
Litter storage capacity per kg dry mass 0.58
Drainage coefficient (s-1) 0.00003
Diffusivity at top of litter layer, D0a (m2 s-1) 0.00002
and D0b (s m-1) 2.6
Attenuation coefficient, X a 2.08
and X b (s m-1) 2.38
Soil albedo 0.2
Soil field capacity (m3 m-3) 0.3
Aerodynamic roughness length (m) 0.01
Screen height (m) 1.2

PROGRAM A :: REPORT NO. A.10.01
46
The first simple model was developed by reducing the Matthews (2006) model from six differential
equations to one equation. As described in Matthews et al. (2010), this simplified model consists of a
moisture balance differential equation, and an equation to predict fuel temperature from solar radiation,
air temperature and relative humidity. The moisture balance equation is:
ρ l i t t er∂m∂ t
= σ ρ air K �H �T m , m �q sa t �T m , P �− q � (4)
where �litter is the density of the litter dry mass (550 kg m-3), m is moisture content (kg kg-1), σ is the
litter surface-area to volume ratio of the fuel particles (3000 m2 m-3), ρair is air density (kg m-3), K is the
combined litter layer and litter conductance (s), H is fuel relative humidity as a function of m, and fuel
temperature, Tm (°C), qsat is saturation specific humidity (kg kg-1) as a function of Tm and air pressure, P
(Pa), q is specific humidity (kg kg-1), and the difference between litter temperature and air temperature is
a function of boundary conditions:
( )aam TW,S,f=TT − (5)
where S is downwards solar radiation under the forest canopy (W m-2), W is wind speed at screen level (1.2
m) under the forest canopy (m s-1), and Ta is screen level air temperature (�C) and the parameter values
are the same as those in Table 4.1. The fuel temperature equation is:
( )( ) ( )0.6Wexp105.530.003T0.010.02
0.31T0.6W2.25exp5 −⋅−−
−−−−
−a
a
am
++=b
=abS+a=TT
(6)
The methods of Matthews et al. (2010) were used to derive tables of afternoon fuel moisture from the
process-based model. Table values were calculated for:
• Solar radiation: 200, 350, 500, 650, 800 W m-2 at fuel level
• Air temperature: 10, 20, 30, 40 °C
• Relative humidity: 5, 10, 15, 20, 25, 30, 35, 40, 45, 50, 55, 60, 65, 70, 75, 80 %
• Wind speed: 10, 20, 30, 40 km h-1 at 10 m in the open
The methods described here did not depend on field measurements of fuel moisture to calibrate the
models. The means that all field observations were available for testing the models.
The models were tested by making predictions for the observations presented in 4.2.2. Separate models
were used for mallee and heath fuels, and for litter and suspended fuel. The Matthews (2006) and single
equation model were run at 1h resolution using observations from on-site weather stations as boundary
conditions. As no solar radiation measurements were made in 2006, these were simulated using the
method of Bird and Hulstrom (1981). Predictions were extracted for comparison with observations by linear
interpolation between adjacent hourly predictions. The table model was tested by matching observed
weather conditions with the nearest matching table entry.
50B4.3.2. Results
Observed and predicted fuel moisture content for each of the four fuel types and three models are shown
in Figures 4.4 – 4.6. Error statistics (mean error, mean absolute error, root mean squared error) are given
in Table 2. The Matthews (2006) performed best overall. In particular, it was the only model which
correctly predicted high litter moisture contents after rain (observed values > 20% in Figures 4.5 and 4.6).
The single-equation and tables models both under-predict when fuels are moisture after rainfall because
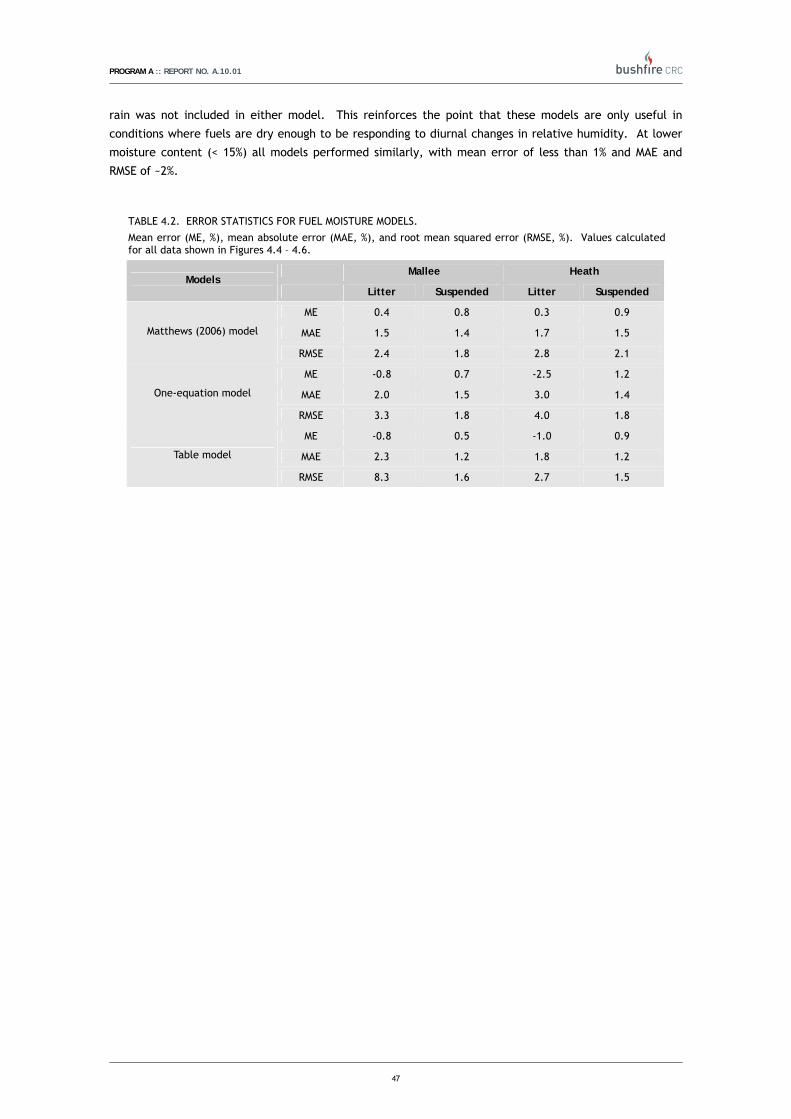
PROGRAM A :: REPORT NO. A.10.01
47
rain was not included in either model. This reinforces the point that these models are only useful in
conditions where fuels are dry enough to be responding to diurnal changes in relative humidity. At lower
moisture content (< 15%) all models performed similarly, with mean error of less than 1% and MAE and
RMSE of ~2%.
TABLE 4.2. ERROR STATISTICS FOR FUEL MOISTURE MODELS.
Mean error (ME, %), mean absolute error (MAE, %), and root mean squared error (RMSE, %). Values calculated for all data shown in Figures 4.4 – 4.6.
Mallee Heath Models
Litter Suspended Litter Suspended
ME 0.4 0.8 0.3 0.9
MAE 1.5 1.4 1.7 1.5 Matthews (2006) model
RMSE 2.4 1.8 2.8 2.1
ME -0.8 0.7 -2.5 1.2
MAE 2.0 1.5 3.0 1.4 One-equation model
RMSE 3.3 1.8 4.0 1.8
ME -0.8 0.5 -1.0 0.9
MAE 2.3 1.2 1.8 1.2 Table model
RMSE 8.3 1.6 2.7 1.5
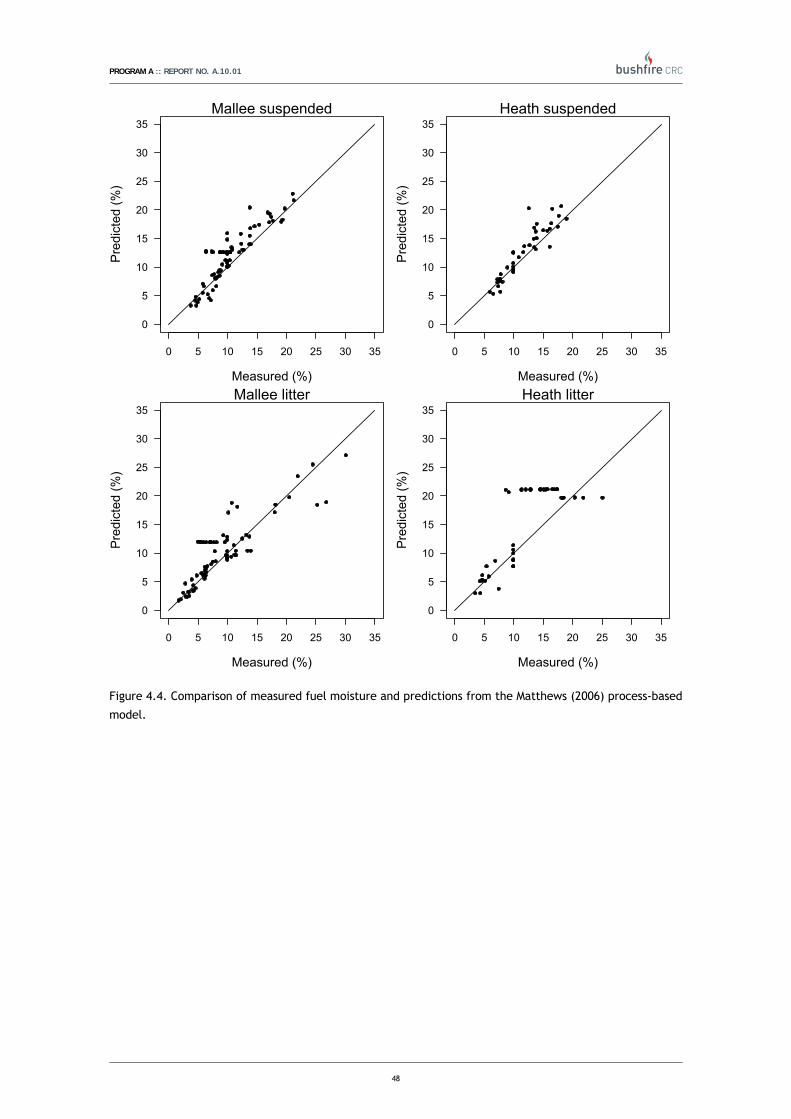
PROGRAM A :: REPORT NO. A.10.01
48
0 5 10 15 20 25 30 35
0
5
10
15
20
25
30
35
Measured (%)
Pre
dict
ed (%
)Mallee suspended
0 5 10 15 20 25 30 35
0
5
10
15
20
25
30
35
Measured (%)
Pre
dict
ed (%
)
Heath suspended
0 5 10 15 20 25 30 35
0
5
10
15
20
25
30
35
Measured (%)
Pre
dict
ed (%
)
Mallee litter
0 5 10 15 20 25 30 35
0
5
10
15
20
25
30
35
Measured (%)
Pre
dict
ed (%
)Heath litter
Figure 4.4. Comparison of measured fuel moisture and predictions from the Matthews (2006) process-based
model.
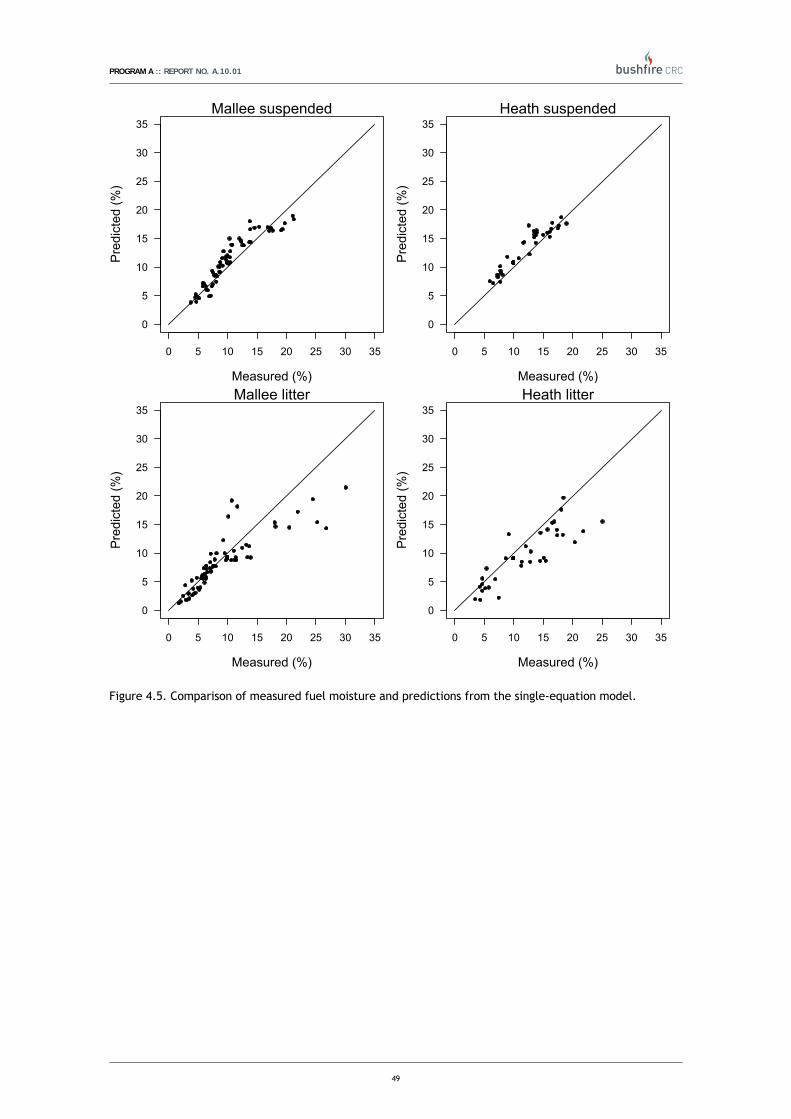
PROGRAM A :: REPORT NO. A.10.01
49
0 5 10 15 20 25 30 35
0
5
10
15
20
25
30
35
Measured (%)
Pre
dict
ed (%
)Mallee suspended
0 5 10 15 20 25 30 35
0
5
10
15
20
25
30
35
Measured (%)
Pre
dict
ed (%
)
Heath suspended
0 5 10 15 20 25 30 35
0
5
10
15
20
25
30
35
Measured (%)
Pre
dict
ed (%
)
Mallee litter
0 5 10 15 20 25 30 35
0
5
10
15
20
25
30
35
Measured (%)
Pre
dict
ed (%
)Heath litter
Figure 4.5. Comparison of measured fuel moisture and predictions from the single-equation model.

PROGRAM A :: REPORT NO. A.10.01
50
0 5 10 15 20 25 30 35
0
5
10
15
20
25
30
35
Measured (%)
Pre
dict
ed (%
)Mallee suspended
0 5 10 15 20 25 30 35
0
5
10
15
20
25
30
35
Measured (%)
Pre
dict
ed (%
)
Heath suspended
0 5 10 15 20 25 30 35
0
5
10
15
20
25
30
35
Measured (%)
Pre
dict
ed (%
)
Mallee litter
0 5 10 15 20 25 30 35
0
5
10
15
20
25
30
35
Measured (%)
Pre
dict
ed (%
)Heath litter
Figure 4.6. Comparison of measured fuel moisture and predictions from the table model.
51B4.3.3. Discussion
Of the three models developed and tested, only the process-based model was able to predict fuel moisture
under all conditions observed during the Ngarkat field programme. However, under non-rain affected
conditions, the two simplified models also performed adequately.
Fuel moisture at any given time is strongly dependent on fuel moisture in preceding hours and days. For
this reason it is best, where ever possible, to use a model which tracks fuel moisture as a function of time,
e.g. the process-based or one-equation models. In non-rain affected conditions, it is only necessary to
begin model calculations using weather conditions for a few hours preceding the required prediction time.
E.g. morning weather observations and an afternoon fire weather forecast are sufficient to run the one-
equation model if the methods of Matthews et al. (2007) are used to interpolate between the observations
and forecast. This method will provide the best fuel moisture prediction with the least input.
Where this is not possible, the table model may be used. Because the table model contains hundreds of
entries, and solar radiation is not readily measured in fireground operations, nomograms are provided as a
guide to estimating fuel moisture (Figures 4.7 – 4.10). Note that these tables do not account for rainfall
and are subject to the limitations described in preceding sections.

PROGRAM A :: REPORT NO. A.10.01
51
Instructions:
1. Select the appropriate nomogram for the required fire behaviour prediction (see §?.??)
2. Start at the current date at the bottom of the “Date and location” panel.
3. Go up to the latitude of the forecast point.
4. Go right to the appropriate line in the “Time and cloudiness panel”. Use the “12-17” lines from
12:00 to 17:00 daylight savings time or 11:00 to 16:00 standard time. Use the “other” lines during the rest
of the day. Do not use the nomogram at night.
5. Go down to the appropriate line in the “Relative humidity” panel. If measured/forecast humidity
lies between the marked lines (e.g. 57%), use the location between the lines.
6. Go left to the appropriate line in the “Temperature” panel. If measured/forecast temperature
lies between the marked lines (e.g. 27°C), use the location between the lines.
7. Go down to read off the fuel moisture prediction.
40
37
34
31
28
25
Date and location
Jan
Feb
Mar
Apr
May Jun
Jul
Aug
Sep Oct
Nov
Dec Jan
Time and cloudiness
Cle
ar 1
2−17
50%
clo
ud 1
2−17
Ove
rcas
t 12−
17C
lear
oth
er
50%
clo
ud o
ther
Ove
rcas
t oth
er
Air temperature
20 C
30 C
40 C
Fuel moisture (%)1 3 5 7 9 11 13 15
5
10
15
20
25
30
35
40
45
50
55
60
65
70
75
80
Relative humidity
Figure 4.7. Nomogram for the prediction of mallee litter fuel moisture content.
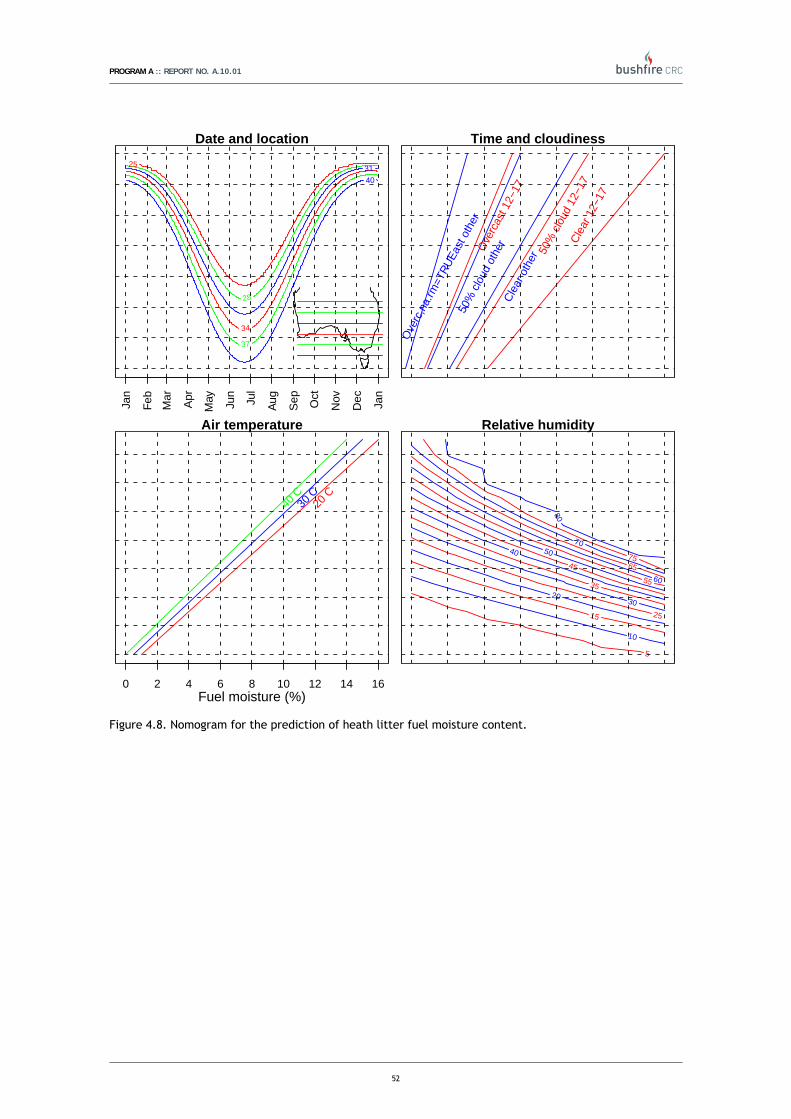
PROGRAM A :: REPORT NO. A.10.01
52
40
37
34
31
28
25
Date and locationJa
n
Feb
Mar
Apr
May Jun
Jul
Aug
Sep Oct
Nov
Dec Jan
Time and cloudiness
Cle
ar 1
2−17
50%
clo
ud 1
2−17
Ove
rcas
t 12−
17C
lear
oth
er
50%
clo
ud o
ther
Ove
rc,n
a.rm
=TR
UEa
st o
ther
Air temperature
20 C
30 C
40 C
Fuel moisture (%)0 2 4 6 8 10 12 14 16
5
10
15
20
25
30
35
40 45
50
55 60
65
70 75
80
Relative humidity
Figure 4.8. Nomogram for the prediction of heath litter fuel moisture content.

PROGRAM A :: REPORT NO. A.10.01
53
40
37
34
31
28
25
Date and locationJa
n
Feb
Mar
Apr
May Jun
Jul
Aug
Sep Oct
Nov
Dec Jan
Time and cloudiness
Cle
ar 1
2−17
50%
clo
ud 1
2−17
Ove
rcas
t 12−
17C
lear
oth
er
50%
clo
ud o
ther
Ove
rcas
t oth
er
Air temperature
20 C
30 C
40 C
Fuel moisture (%)4 6 8 10 12 14 16 18 20
5
10 15
30 35 40
45
55 60
65
70
75
80
Relative humidity
Figure 4.9. Nomogram for the prediction of mallee suspended fuel moisture content.

PROGRAM A :: REPORT NO. A.10.01
54
40
37
34
31
28
25
Date and locationJa
n
Feb
Mar
Apr
May Jun
Jul
Aug
Sep Oct
Nov
Dec Jan
Time and cloudiness
Cle
ar 1
2−17
50%
clo
ud 1
2−17
Ove
rcas
t 12−
17C
lear
oth
er
50%
clo
ud o
ther
Ove
rcas
t oth
er
Air temperature
20 C
30 C
40 C
Fuel moisture (%)2 4 6 8 10 12 14 16 18 20
5 10
15
20 25
30 35 40
45
50
55
60 65
70
75
80
Relative humidity
Figure 4.10. Nomogram for the prediction of heath suspended fuel moisture content.

PROGRAM A :: REPORT NO. A.10.01
55
PROGRAM A :: REPORT NO. A.10.01
56
6B5. FIRE BEHAVIOUR - EXPERIMENTS
24B5.1. INTRODUCTION The prediction of fire spread in discontinuous fuels (Gill et al. 1995; Burrows et al. 2009) or under marginal
conditions (Mardsen-Smedley et al. 2001) follows a two-step process. The first component requires
determining the environment conditions that will allow a coherent and sustained flame front to develop,
providing the propagating flux that allow the fire to self sustain. Failure to meet these requirements will
result on the fragmentation of the flame front into discrete units that will fail to breach fuel gaps and
eventually lead to the extinguishment of the flame front. The second component of the process applies
after sustained fire propagation occurs and deals with predicting the fire behaviour quantities that can be
used to support decision making, e.g., rate of spread, flame geometry, residence time, fireline intensity
and spotting characteristics. The understanding of the necessary conditions to achieve sustained fire
propagation has relevance to plan and conduct prescribed burns under marginal spreading conditions. By
combining weather forecasts and information on fuel temporal and spatial distribution fire managers can
better use available resources to target fuel complexes that will increase the likelihood of sustainable
propagation and attainment of fire prescription objectives.
Information on fire behaviour characteristics in mallee stands with heath or spinifex understory has been
collected on a number of studies in NSW (Bradstock et al. 1992, Bradstock and Gill 1993), Victoria (Billing
1981, Sandell et al. 2006) and WA (McCaw 1995, 1997). Of these studies only McCaw (1997) produced a
dataset with the span that allow investigating the effect of fire weather variables on the fire
sustainability, rate of spread and flame heights. This study was conducted in 20-year old mallee-heath and
identified fuel moisture content as the key variable determining fire sustainability and wind speed the
variable with the strongest effect of rate of fire spread. This author also evaluated a number of fire
behaviour models and found then unable to discriminate sustained from self-extinguishing fires and not
adequate to describe fire spread in mallee-heath fuels. Burrows et al. (1991) and (2009) described fire
behaviour in spinifex grasslands of two Western Australia deserts. Although these fuel complexes are
structurally distinct from the South Australian mallee-heath due to the absence of the overstorey
component, the dominant surface fire spread mechanisms should be similar to what observed in mallee-
spinifex fuel complexes, making Burrows et al. outcomes and models possibly adaptable to this vegetation
type.
The current study aimed at characterises fire behaviour in the mallee-heath fuel complexes of the Ngarkat
Conservation Park, South Australia. The project was develop with the aim to conduct a sufficient number
of experimental fires under a range of weather conditions and fuel complex structures to quantify the
effect of fire environment variables on fire behaviour and allows developing fire behaviour prediction
models to support fire management decision-making.
25B5.2. METHODS To quantify the effect of weather and fuel variables in determining sustained fire propagation and fire
behaviour characteristics in mallee-heath fuel complexes two types of experimental fires were conducted:
(a) fire sustainability and (b) fire behaviour experiments. Fire sustainability experiments aimed to quantify
the conditions that allow sustainable fire propagation, whereas fire behaviour experiments focus on
measuring fire characteristics in well-developed flame fronts. The sustainability experiments were smaller
in scale than the fire behaviour experiments. This was a compromise to gather a sufficiently large dataset
on fire sustainability given constrains derived from the size of the experimental area and the distribution
of plots by fuel type/age. The size of the fire sustainability plots allow fire to develop into a pseudo-
steady state propagation stage but would not provide information on the transient nature of fire
PROGRAM A :: REPORT NO. A.10.01
57
propagation and short range spotting characteristics, features that were measured on the fire behaviour
plots.
Planning
General plot layout is shown in Fig. 2.1 and 2.7. Plot size and orientation allowed conducting experimental
fires from a variety of wind directions. Decision regarding which plots to burn within a given day was a
function of the forecasted burning conditions (site specific fire weather forecast provided by the Bureau of
Meteorology), gaps within the dataset, and safety constrains (e.g., downwind control issues, spotting
potential into unburned fuels). Planed experimental fires were divided into fire sustainability and fire
behaviour experiments. A typical experimental burn day would start with fire sustainability experiments.
If the fire would not sustain itself, sequential ignitions were carried out at fixed time intervals (between 1
and 2 hours depending on the evolution of fire potential throughout the day) until a sustainable flame front
would successfully propagate until the end of the plot. After a successful fire sustainability experiment,
fire behaviour experiments in the same fuel types ensued. Both fire sustainability and behaviour
experiments were carried out simultaneously in different fuel types. Simultaneous experimental fires were
driven by comparable weather conditions and allowed to investigate differences in fire behaviour due to
fuel complex structure. The number of simultaneous experiments ignited depended on resources available
and varied between two and three.
Ignition and plot dimensions
Ignition line length depended on plot size, fuel type and prevalent weather conditions. Initial trials
indicate that ignition line length less than 75 m produce less than quasi-steady rate of spread, with an
ever-decreasing fireline width, and which were not representative of a typical prescribed burn in mallee-
heath fuel complexes. It was found in these trials that ignition line lengths of 100 - 110 m would sustain
quasi-steady fire spread throughout the length of the experimental plots. Given the predefined plot layout
it was established that a fire sustainability experiment would have a 110 - 120 m long ignition length and
an approximate run of 100 m. Plots 250 x 250 (≈6.2 ha) were divided into 4 subplots of equal size (≈1.5 ha).
Fire sustainability experiments were ignited in the windward side of the subplot. If the flame front failed
to propagate the burn was considered a no-go and subsequent ignition was planed for when weather
conditions would increase fire spread potential. This ignition was located on the leeward side of the
previous burn if there were enough unburned fuel to allow a run of approximately 100 m. If this condition
was not meet, the ignition line would be located in the windward side of a new subplot.
Fire behaviour plots had identical ignition line lengths, but would be allowed to propagate the full length
of the plot (approximately 250 m). Under High or lower Fire Danger conditions (FFDI) < 34.9 simultaneous
ignitions in distinct fuel types (mallee vs. heath, 9- vs. 20- vs. 50-year old fuels) were conducted. Above
the Very High Fire Danger class lower threshold (FFDI = 35) fire behaviour experiments were conducted in a
full 250x250 m plot with an ignition line of 220 m, and no simultaneous ignitions took place. This scaling
up of the fire experiment allowed to measure fire behaviour characteristics that are relevant for the fire
propagation process under severe burning conditions, namely spotting and crowning behaviour. The three
large plots (>30 ha) (AS, Aerial Suppression, Fig. 2.7) had ignition lengths of 220 m. Ignition lines were
established with two operators with handheld drip torches. Ignitions started at the centre of a pre-marked
ignition line, with the lighters moving outward at a fixed pace that ensure the development of a solid
flame front in less than 2 minutes.

PROGRAM A :: REPORT NO. A.10.01
58
Weather
Three automatic weather stations (AWS) were placed at fixed locations during the experimental burning
program. Two were located in the clear grass paddocks 300 m east of the experimental blocks and one
located in plot C (See Fig 2.7). At these locations air temperature, relative humidity, wind speed and
direction (measured at 10-m in the open) were averaged and logged at 10 min intervals. Solar radiation
was collected only in 2008. Long-term fuel dryness measures (e.g., KBDI) were collected at Bureau of
Meteorology weather stations located in Keith (57 km SW of experimental site) and Lameroo (58 km NW).
For each experimental fire, detailed wind measurements were conducted at two locations in the vicinity of
the burn. A 10-m tower with two 2-D sonic wind sensors (WindSonic 1, Gill Instruments Ltd; located at 2
and 10-m heights) was placed 50 to 75 m along the side of the burn plot (Fig. 5.1). A smaller tower with a
sole 2-D sonic wind sensor at 2-m was placed 50 to 75 m in the windward side of the ignition line centre.
Both towers were located in areas of fuel structure representative of the experimental fire. The 10-m
tower with two anemometers provided a rough characterization of the vertical wind profile close to the
vegetation. Wind direction and speed measurements were made at a frequency of 1 Hz, with 5-sec
averages being recorded before, during and after each experimental fire. The relatively short time interval
at which wind was sampled aimed at characterise gust and lull structure around and during each
experimental burn.
Fuel moisture
Moisture content of dead fine fuels was measured by destructive sampling. Two types of samples were
collected from both mallee and heath vegetation. Surface litter was collected from the top 10 mm of the
litter layer. At locations where the litter layer was less than 10 mm deep, the entire layer was sampled.
Suspended dead fuel samples were taken from between 0.1 and 1.0 m height, depending on the vertical
distribution of fuel at each sampling location. Fifteen minutes prior to each experimental fire five samples
each (10 – 20 g) of litter and suspended fuel dead material of diameter < 6 mm were placed in a sealed tin.
Dead fuel moisture samples were also collected after the completion of experimental fires if it was
perceived that fuel moisture content changed between the pre-fire samples and the end of the
experiment.
The large number of understorey and overstorey species made it impractical to sample live fuel moisture
from specific species. Live fuel moisture data was collected while conducting destructive fuel sampling in
the days preceding each experimental burn. Six to twelve samples (number varying with plots size) of live
fuel (foliage and live twigs diameter < 3 mm) were systematically collected along three transects. Each
sample (40 to 60 g) was placed in a sealed tin.
The sample tins were returned to a field laboratory where they were weighed, dried for 24 hours at a
nominal temperature of 100 °C in a fan forced oven, and then reweighed. Fuel moisture content was
calculated as a percentage of dry weight:
dry
drywet
mmm
MC−
= [5.1]
where MC is fuel moisture content, and mwet and mdry are the mass of the sample before and after oven
drying.
Fire behaviour measurements
Fire behaviour was monitored through instrumentation set prior to the burn and direct observation by
researchers. Thermologgers were buried or placed within insulated containers through a grid pattern

PROGRAM A :: REPORT NO. A.10.01
59
within each burn plot. The grid sampling of fire spread characteristics yield information on its variability.
A thermologger consisted of a small datalogger (HOBO® U12, Onset, Massachusetts, USA) with a 200 mm
long, 1.5-mm diameter, type K metal-sheathed thermocouple (Pyrosales, NSW, Australia). Thermocouple
size and characteristics was a compromise between response time and durability. Loggers sample
temperatures at 1 Hz (1-sec interval). Grid spacing varied between 25 and 50 m, depending on the
expected rate of fire spread and number of plots being burned simultaneously. The thermologger
registered the time the flame front arrived at each grid point. The time of fire arrival, assumed to coincide
with a temperature of 320 C (Albini 1985) was used to determine fire-spread pattern and rate of fire
spread through a triangulation method (Simard et al. 1984, McCaw 1997). Flame time-temperature profile,
flame residence time and an estimate of flame depth were derived for each grid point. The grid was set
up with compass and hip-chain, and grip points georeferenced with GPS (Trimble GeoXT). Differencial
correction of GPS coordinates yield a precision <0.5 m. For the size of the triangles used this precision
translates into a relative error of less then 2%.
Two groups of two fire behaviour observers in close proximity to the flame front monitored fire
characteristics throughout each experiment. Fire behaviour quantities recorded at 2-minutes intervals
were: fuel layers supporting fire spread, flame geometry (depth, height and angle), spotting activity
(distance, quantity and density), overstorey canopy consumption and in-draughts. In low intensity fires the
observers mapped the fire perimeters at 2-minute intervals through the use of numbered metal tags.
Figure 5.1. Experimental fire layout depicting pre-fire fuel moisture sampling location, wind towers
location (AWS) and thermologger grid. Red lines depict ignition line and fire growth isochrones extracted
from Infrared imagery (see details on IR imagery analysis in Pastor et al. submitted).
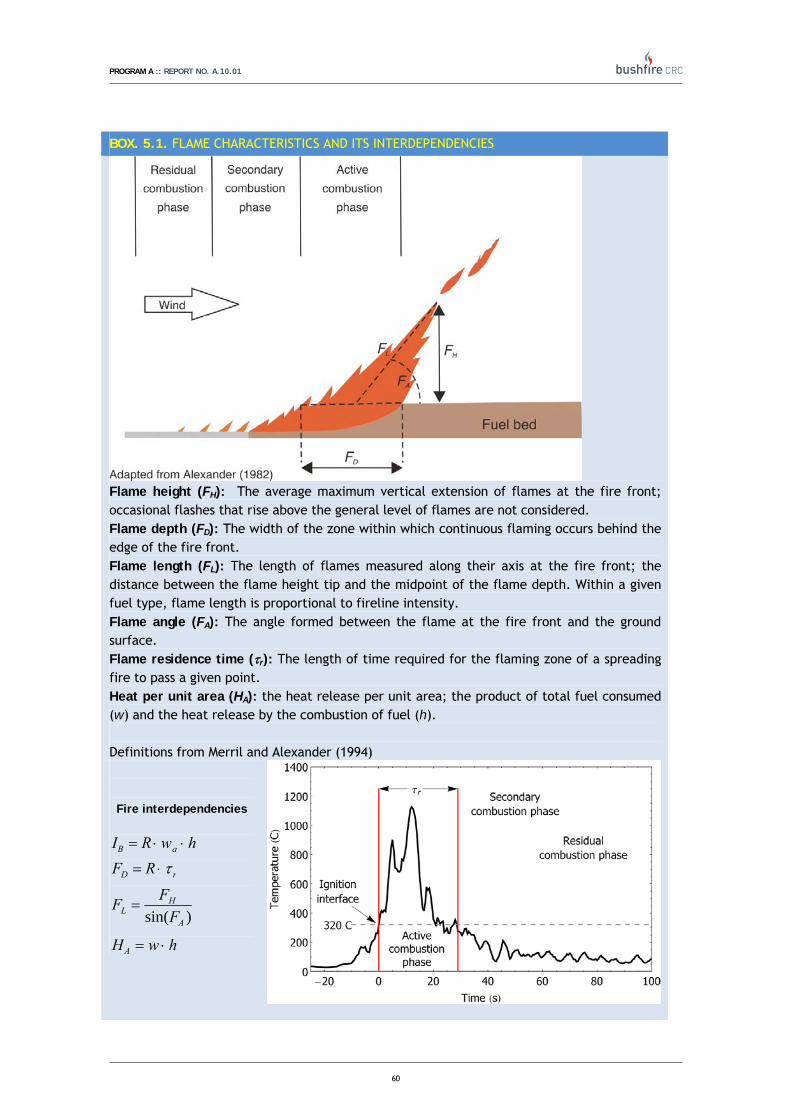
PROGRAM A :: REPORT NO. A.10.01
60
BOX. 5.1. FLAME CHARACTERISTICS AND ITS INTERDEPENDENCIES
Flame height (FH): The average maximum vertical extension of flames at the fire front; occasional flashes that rise above the general level of flames are not considered. Flame depth (FD): The width of the zone within which continuous flaming occurs behind the edge of the fire front. Flame length (FL): The length of flames measured along their axis at the fire front; the distance between the flame height tip and the midpoint of the flame depth. Within a given fuel type, flame length is proportional to fireline intensity. Flame angle (FA): The angle formed between the flame at the fire front and the ground surface. Flame residence time (τr): The length of time required for the flaming zone of a spreading fire to pass a given point. Heat per unit area (HA): the heat release per unit area; the product of total fuel consumed (w) and the heat release by the combustion of fuel (h). Definitions from Merril and Alexander (1994) Fire interdependencies
IB = R ⋅ wa ⋅ h
FD = R ⋅ τ r
FL =FH
sin(FA )
HA = w ⋅ h
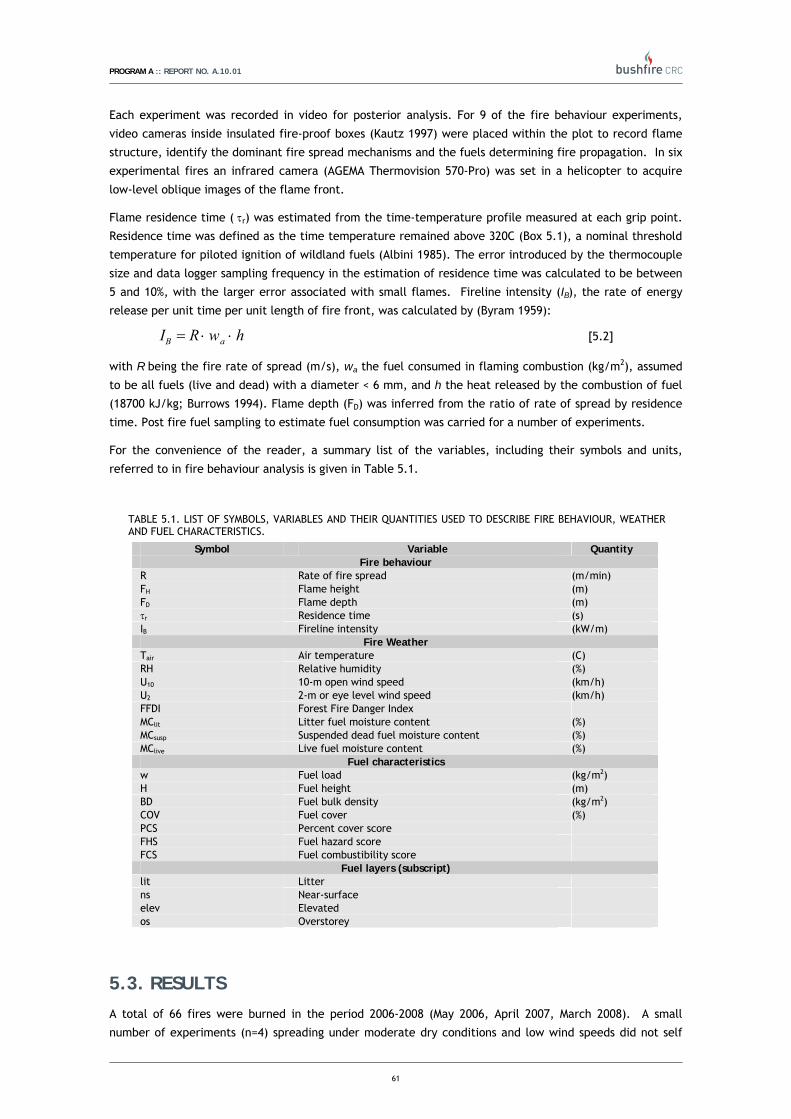
PROGRAM A :: REPORT NO. A.10.01
61
Each experiment was recorded in video for posterior analysis. For 9 of the fire behaviour experiments,
video cameras inside insulated fire-proof boxes (Kautz 1997) were placed within the plot to record flame
structure, identify the dominant fire spread mechanisms and the fuels determining fire propagation. In six
experimental fires an infrared camera (AGEMA Thermovision 570-Pro) was set in a helicopter to acquire
low-level oblique images of the flame front.
Flame residence time ( τr) was estimated from the time-temperature profile measured at each grip point.
Residence time was defined as the time temperature remained above 320C (Box 5.1), a nominal threshold
temperature for piloted ignition of wildland fuels (Albini 1985). The error introduced by the thermocouple
size and data logger sampling frequency in the estimation of residence time was calculated to be between
5 and 10%, with the larger error associated with small flames. Fireline intensity (IB), the rate of energy
release per unit time per unit length of fire front, was calculated by (Byram 1959):
IB = R ⋅ wa ⋅ h [5.2]
with R being the fire rate of spread (m/s), wa the fuel consumed in flaming combustion (kg/m2), assumed
to be all fuels (live and dead) with a diameter < 6 mm, and h the heat released by the combustion of fuel
(18700 kJ/kg; Burrows 1994). Flame depth (FD) was inferred from the ratio of rate of spread by residence
time. Post fire fuel sampling to estimate fuel consumption was carried for a number of experiments.
For the convenience of the reader, a summary list of the variables, including their symbols and units,
referred to in fire behaviour analysis is given in Table 5.1.
TABLE 5.1. LIST OF SYMBOLS, VARIABLES AND THEIR QUANTITIES USED TO DESCRIBE FIRE BEHAVIOUR, WEATHER AND FUEL CHARACTERISTICS.
Symbol Variable Quantity Fire behaviour
R Rate of fire spread (m/min) FH Flame height (m) FD Flame depth (m) τr Residence time (s) IB Fireline intensity (kW/m)
Fire Weather Tair Air temperature (C) RH Relative humidity (%) U10 10-m open wind speed (km/h) U2 2-m or eye level wind speed (km/h) FFDI Forest Fire Danger Index MClit Litter fuel moisture content (%) MCsusp Suspended dead fuel moisture content (%) MClive Live fuel moisture content (%)
Fuel characteristics w Fuel load (kg/m2) H Fuel height (m) BD Fuel bulk density (kg/m2) COV Fuel cover (%) PCS Percent cover score FHS Fuel hazard score FCS Fuel combustibility score
Fuel layers (subscript) lit Litter ns Near-surface elev Elevated os Overstorey
26B5.3. RESULTS A total of 66 fires were burned in the period 2006-2008 (May 2006, April 2007, March 2008). A small
number of experiments (n=4) spreading under moderate dry conditions and low wind speeds did not self

PROGRAM A :: REPORT NO. A.10.01
62
extinguish but were characterized by small thin flames, a discontinuous flame front and low rates of
spread (typically flame heights <0.5 m). Fuel consumption in these fires was patchy and restricted to the
litter and some of the near-surface fuels. Although these burns did not self-extinguished, they would not
meet typical fuel management objectives in mallee-heath vegetation, such as fuel consumption and depth
of area burned. After discussions with fire managers it was rationalised that these burns should be
considered as no-go or self extinguished fires.
BOX. 5.2. FIRE IN MALLEE-HEATH FUELS
Range in fire behaviour observed in mallee-heath experimental fires. Top-left: Break-up of flame front in discontinuous heath vegetation under marginal burning conditions; Top-right: Marginal propagation in mallee litter; Bottom-left: Moderate intensity, fast spreading fire in heath fuels; Bottom-right: High intensity experimental fire in mallee-heath fuels (clump height 2.5 - 3 m).
Fig. 5.2 discriminates the full dataset into sustained and self extinguished fires plotted against the Forest
Fire Danger Index (FFDI). The dataset provides an adequate cover of the range of conditions under which
prescribed fires in mallee-heath are likely to occur (Noble 1981; Sandell et al. 2006), and extends into
drier ranges of dead fuel moisture (below 5%) typical of summer time conditions. A number of
experimental fires in mallee fuel type were conducted under the upper range of the Very High FFDI. The
distribution of sustained and self-extinguished fires within the Moderate FFDI class in the mallee fuel type
bear out the effect that fuel discontinuity in semi-arid mallee-heath vegetation has in limiting fire
propagation. In this FFDI class, 80% of the lighted fires self-extinguished. Within this FDI range it is also
manifest that mallee and heath fuel types have distinct wind speed – fuel moisture content thresholds for

PROGRAM A :: REPORT NO. A.10.01
63
sustained fire propagation. Seventy-five percent of the heath fires in the Moderate class sustained
propagation. A gap of fire data within the combination of high wind – high fuel moisture can be identified
in Fig. 5.2.
Figure 5.2. Fine dead fuel moisture and 10-m open wind speed plotted in relation to FFDI classes (McArthur
1967) for the mallee and heath fuel types. Black and grey dots identify sustained and self-extinguished
fires respectively. Fuel moisture content is calculated by Viney (1992) derivation of McArthur (1967) fuel
moisture table (see Matthews 2009).
Table 5.2 and 5.3 provide the experimental fires range of weather and fire behaviour variables partitioned
by fuel type and age. Within the mallee vegetation type, the fires with highest FFDI were conducted in
the younger ages (Table 5.2). No experimental fires were conducted under Very High Fire Danger Index
conditions in the older fuels due to the increased risk of fire escape from the experimental area associated
with higher long range spotting potential existent on these fuels.
Fires in the heath fuel type were conducted under milder fire weather conditions than in mallee fuels. The
overall area covered by heath fuels allowed for the establishment of 8 plots. These plots were burned in
the 2006 and 2007 seasons. No experimental plots were available in 2008 when higher fire potential
conditions were present. A new heath fuel experimental area with 8 plots (350 x 250 m) in 20-year old
heath fuels were set in 2007, 28 km WSW of the main site. Operational constrains did not allowed the use
of these plots during the study period limiting the comprehensiveness of the dataset in this fuel type.
The range in rates of fire spread and fireline intensities in Table 5.2 and 5.3 are relative to plot averages.
Higher rates of spread and intensities were observed over small time intervals as a response to wind gusts.
The average rate of fire spread is a weighted mean taking into account the length of each run. The initial
run (first 25-50 meters depending on burning severity) of each fire, in which the flame front was not yet in
equilibrium with the environmental conditions, was not considered in the calculation of average rate of
spread. Flame height measurements were restricted to a number of fires (n=33). This dataset comprises
sustained and self extinguished fires that spread for more than 10 minutes. Not all sustained fires yield
flame dimension data. Smoke and safety constrains limited the estimation of flame dimensions in some of
the experimental fires carried out in the mature mallee fuels.

PROGRAM A :: REPORT NO. A.10.01
64
TABLE 5.2: RANGE IN WEATHER AND FIRE BEHAVIOUR VARIABLES ASSOCIATED WITH MALLEE EXPERIMENTAL FIRES. Fuel age (years) Variable 8 21 49
Fire weather Tair 18.5 – 39 18.5 – 37.2 16 – 36 RH 12 – 50 7.2 – 50 15 – 80 U10 4.9 – 14.9 9 – 19.7 6.2 – 23.9 U2 3 – 9.1 3.4 – 10.5 2.2 – 9.4 FFDI 5.8 – 44.1 5.7 – 46.1 1.7 – 34.4 MClit 3.4 – 13.2 1.9 – 19.9 4.2 – 13.4 MCsusp 5.2 – 15.3 4.2 – 17.6 6.6 – 17.1 MClive 63 - 76 51 - 93 58 - 89
Fire behaviour * n (sustained spread fires) 7 (2) 14 (8) 22 (8) R 28.7 5.91 – 46.6 1.2 – 55.1 IB 6450 1591 – 6931 735 – 10956 FH 4 1.5 – 3.8 0.8 - 6
* Fire behaviour data is relative to sustained fires.
TABLE 5.3. RANGE IN WEATHER AND FIRE BEHAVIOUR VARIABLES ASSOCIATED WITH HEATH EXPERIMENTAL FIRES
Fuel age (years) Variable 8 21
Fire weather Tair 17.5 – 32 14.5 – 33.6 RH 26.3 – 55 20.2 – 60 U10 4.9 – 14.4 5.7 – 17.8 U2 4.2 – 10 4 – 13.7 FFDI 3.9 – 20.9 3.5 – 25.8 MClit 3.4 – 14.4 4.0 – 20.4 MCsusp 7.4 – 16.1 6.5 – 15.0 MClive 63 - 84 67 – 93
Fire behaviour * n (sustained spread fires) 5 (2) 18 (12) R 11.2 – 43.9 9.1 – 38.5 IB 1153 – 6328 1866 – 7302 FH 2.3 - 3 1.3 – 2.8 * Fire behaviour data is relative to sustained fires.
Ignition of a fire can change the wind field in its vicinity. For each experimental fire we partitioned the
wind data into pre-, during and post-fire period. The wind speed for the pre- and post-fire periods was
averaged for a length of 5 minutes. Paired comparisons found no significant differences for the average
wind speed measured during the fire and the pre- and post-fire periods.
Fire sustainability
For a fire to propagate the combustion outputs and heat transfer mechanisms need to provide the
propagating flux that allows for the continuous ignition of unburned fuels. The balance between these
three fire processes allows a fire to spread at a “quasi-steady state”, i.e., in equilibrium with the
environment. Fire environment conditions are never constant and fire spread is a non-steady phenomenon
varying around a mean value (e.g., average rate of fire spread, average fireline intensity). For any given
fuel complex there will be a combination of fire environment conditions (e.g., fuel moisture content, wind
speed, slope and atmospheric stability) that will not allow the development of a propagating flux that
meets the requirements for sustained spread. In mallee-heath fuels if a continuous line of fire is ignited
under these conditions the flame front breaks down into increasingly smaller discrete structures and fire
spread eventually ceases.
To analyse the conditions that determine sustained fire propagation in mallee-heath fuel types we
considered the mallee and heath fuel types separately and combined. This allowed investigating if the
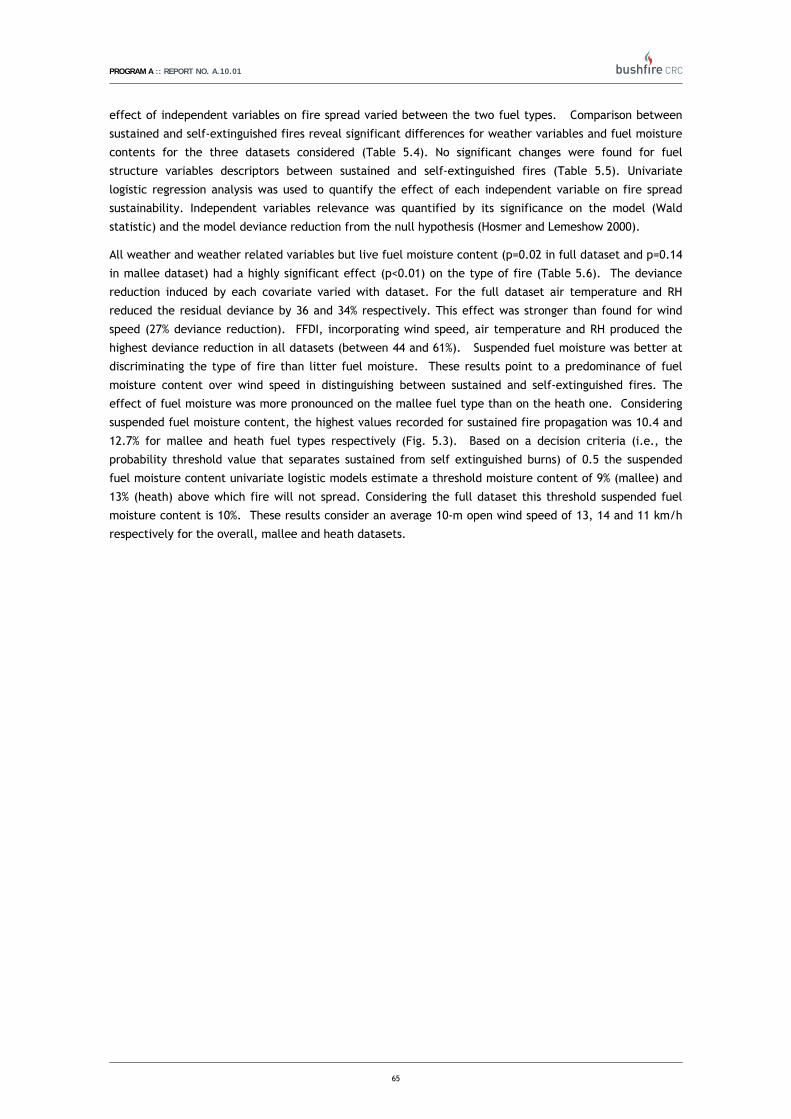
PROGRAM A :: REPORT NO. A.10.01
65
effect of independent variables on fire spread varied between the two fuel types. Comparison between
sustained and self-extinguished fires reveal significant differences for weather variables and fuel moisture
contents for the three datasets considered (Table 5.4). No significant changes were found for fuel
structure variables descriptors between sustained and self-extinguished fires (Table 5.5). Univariate
logistic regression analysis was used to quantify the effect of each independent variable on fire spread
sustainability. Independent variables relevance was quantified by its significance on the model (Wald
statistic) and the model deviance reduction from the null hypothesis (Hosmer and Lemeshow 2000).
All weather and weather related variables but live fuel moisture content (p=0.02 in full dataset and p=0.14
in mallee dataset) had a highly significant effect (p<0.01) on the type of fire (Table 5.6). The deviance
reduction induced by each covariate varied with dataset. For the full dataset air temperature and RH
reduced the residual deviance by 36 and 34% respectively. This effect was stronger than found for wind
speed (27% deviance reduction). FFDI, incorporating wind speed, air temperature and RH produced the
highest deviance reduction in all datasets (between 44 and 61%). Suspended fuel moisture was better at
discriminating the type of fire than litter fuel moisture. These results point to a predominance of fuel
moisture content over wind speed in distinguishing between sustained and self-extinguished fires. The
effect of fuel moisture was more pronounced on the mallee fuel type than on the heath one. Considering
suspended fuel moisture content, the highest values recorded for sustained fire propagation was 10.4 and
12.7% for mallee and heath fuel types respectively (Fig. 5.3). Based on a decision criteria (i.e., the
probability threshold value that separates sustained from self extinguished burns) of 0.5 the suspended
fuel moisture content univariate logistic models estimate a threshold moisture content of 9% (mallee) and
13% (heath) above which fire will not spread. Considering the full dataset this threshold suspended fuel
moisture content is 10%. These results consider an average 10-m open wind speed of 13, 14 and 11 km/h
respectively for the overall, mallee and heath datasets.
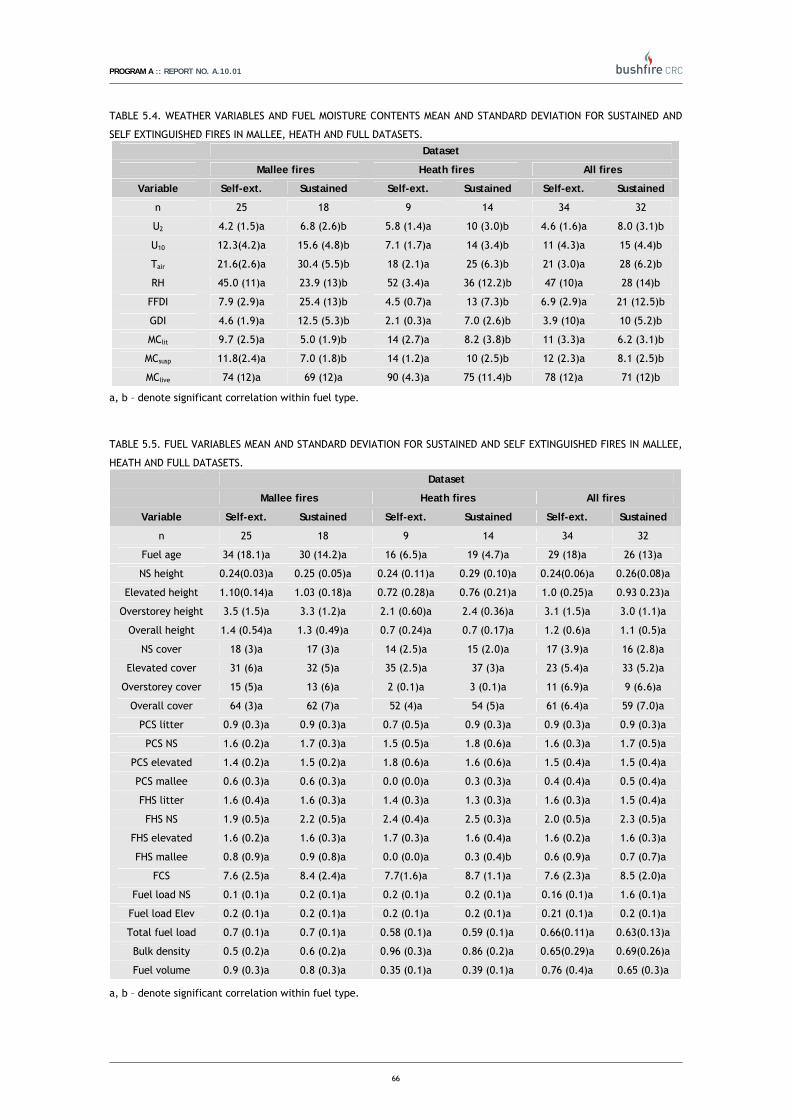
PROGRAM A :: REPORT NO. A.10.01
66
TABLE 5.4. WEATHER VARIABLES AND FUEL MOISTURE CONTENTS MEAN AND STANDARD DEVIATION FOR SUSTAINED AND
SELF EXTINGUISHED FIRES IN MALLEE, HEATH AND FULL DATASETS.
Dataset
Mallee fires Heath fires All fires
Variable Self-ext. Sustained Self-ext. Sustained Self-ext. Sustained
n 25 18 9 14 34 32
U2 4.2 (1.5)a 6.8 (2.6)b 5.8 (1.4)a 10 (3.0)b 4.6 (1.6)a 8.0 (3.1)b
U10 12.3(4.2)a 15.6 (4.8)b 7.1 (1.7)a 14 (3.4)b 11 (4.3)a 15 (4.4)b
Tair 21.6(2.6)a 30.4 (5.5)b 18 (2.1)a 25 (6.3)b 21 (3.0)a 28 (6.2)b
RH 45.0 (11)a 23.9 (13)b 52 (3.4)a 36 (12.2)b 47 (10)a 28 (14)b
FFDI 7.9 (2.9)a 25.4 (13)b 4.5 (0.7)a 13 (7.3)b 6.9 (2.9)a 21 (12.5)b
GDI 4.6 (1.9)a 12.5 (5.3)b 2.1 (0.3)a 7.0 (2.6)b 3.9 (10)a 10 (5.2)b
MClit 9.7 (2.5)a 5.0 (1.9)b 14 (2.7)a 8.2 (3.8)b 11 (3.3)a 6.2 (3.1)b
MCsusp 11.8(2.4)a 7.0 (1.8)b 14 (1.2)a 10 (2.5)b 12 (2.3)a 8.1 (2.5)b
MClive 74 (12)a 69 (12)a 90 (4.3)a 75 (11.4)b 78 (12)a 71 (12)b
a, b – denote significant correlation within fuel type.
TABLE 5.5. FUEL VARIABLES MEAN AND STANDARD DEVIATION FOR SUSTAINED AND SELF EXTINGUISHED FIRES IN MALLEE,
HEATH AND FULL DATASETS.
Dataset
Mallee fires Heath fires All fires
Variable Self-ext. Sustained Self-ext. Sustained Self-ext. Sustained
n 25 18 9 14 34 32
Fuel age 34 (18.1)a 30 (14.2)a 16 (6.5)a 19 (4.7)a 29 (18)a 26 (13)a
NS height 0.24(0.03)a 0.25 (0.05)a 0.24 (0.11)a 0.29 (0.10)a 0.24(0.06)a 0.26(0.08)a
Elevated height 1.10(0.14)a 1.03 (0.18)a 0.72 (0.28)a 0.76 (0.21)a 1.0 (0.25)a 0.93 0.23)a
Overstorey height 3.5 (1.5)a 3.3 (1.2)a 2.1 (0.60)a 2.4 (0.36)a 3.1 (1.5)a 3.0 (1.1)a
Overall height 1.4 (0.54)a 1.3 (0.49)a 0.7 (0.24)a 0.7 (0.17)a 1.2 (0.6)a 1.1 (0.5)a
NS cover 18 (3)a 17 (3)a 14 (2.5)a 15 (2.0)a 17 (3.9)a 16 (2.8)a
Elevated cover 31 (6)a 32 (5)a 35 (2.5)a 37 (3)a 23 (5.4)a 33 (5.2)a
Overstorey cover 15 (5)a 13 (6)a 2 (0.1)a 3 (0.1)a 11 (6.9)a 9 (6.6)a
Overall cover 64 (3)a 62 (7)a 52 (4)a 54 (5)a 61 (6.4)a 59 (7.0)a
PCS litter 0.9 (0.3)a 0.9 (0.3)a 0.7 (0.5)a 0.9 (0.3)a 0.9 (0.3)a 0.9 (0.3)a
PCS NS 1.6 (0.2)a 1.7 (0.3)a 1.5 (0.5)a 1.8 (0.6)a 1.6 (0.3)a 1.7 (0.5)a
PCS elevated 1.4 (0.2)a 1.5 (0.2)a 1.8 (0.6)a 1.6 (0.6)a 1.5 (0.4)a 1.5 (0.4)a
PCS mallee 0.6 (0.3)a 0.6 (0.3)a 0.0 (0.0)a 0.3 (0.3)a 0.4 (0.4)a 0.5 (0.4)a
FHS litter 1.6 (0.4)a 1.6 (0.3)a 1.4 (0.3)a 1.3 (0.3)a 1.6 (0.3)a 1.5 (0.4)a
FHS NS 1.9 (0.5)a 2.2 (0.5)a 2.4 (0.4)a 2.5 (0.3)a 2.0 (0.5)a 2.3 (0.5)a
FHS elevated 1.6 (0.2)a 1.6 (0.3)a 1.7 (0.3)a 1.6 (0.4)a 1.6 (0.2)a 1.6 (0.3)a
FHS mallee 0.8 (0.9)a 0.9 (0.8)a 0.0 (0.0)a 0.3 (0.4)b 0.6 (0.9)a 0.7 (0.7)a
FCS 7.6 (2.5)a 8.4 (2.4)a 7.7(1.6)a 8.7 (1.1)a 7.6 (2.3)a 8.5 (2.0)a
Fuel load NS 0.1 (0.1)a 0.2 (0.1)a 0.2 (0.1)a 0.2 (0.1)a 0.16 (0.1)a 1.6 (0.1)a
Fuel load Elev 0.2 (0.1)a 0.2 (0.1)a 0.2 (0.1)a 0.2 (0.1)a 0.21 (0.1)a 0.2 (0.1)a
Total fuel load 0.7 (0.1)a 0.7 (0.1)a 0.58 (0.1)a 0.59 (0.1)a 0.66(0.11)a 0.63(0.13)a
Bulk density 0.5 (0.2)a 0.6 (0.2)a 0.96 (0.3)a 0.86 (0.2)a 0.65(0.29)a 0.69(0.26)a
Fuel volume 0.9 (0.3)a 0.8 (0.3)a 0.35 (0.1)a 0.39 (0.1)a 0.76 (0.4)a 0.65 (0.3)a
a, b – denote significant correlation within fuel type.

PROGRAM A :: REPORT NO. A.10.01
67
Figure 5.3. Fire sustainability for (a) mallee and (b) heath experimental fires as function of suspended
dead fuel moisture content and 2-m wind speed.
Scatterplots of fire sustainability as a function of suspended dead fuel moisture content and 2-m wind
speeds identifies a band of fuel moisture content where there is higher uncertainty regarding the
likelihood of sustained propagation (Fig. 5.3a and b). This band, which spread from 7 to 11% and 12 and
14% fuel moisture content respectively for mallee and heath fuels, identifies a range of fuel moistures in
which other variables play an important role in determining fire sustainability. Wind speed and fuel
characteristics, such as cover and height, are important in determining flame characteristics (such as
height, depth and angle) that will influence the likelihood that the flame front will breach fuel gaps and
allow fire to spread sustainably. Considering the fuel moisture ranges mentioned above, the higher the
fuel discontinuity the higher the wind speed necessary to maintain the propagating flux necessary to
sustain fire propagation.
TABLE 5.6. WEATHER VARIABLE SIGNIFICANCE AND DEVIANCE REDUCTION FOR UNIVARIATE LOGISTIC REGRESSION MODELS
FOR THE LIKELIHOOD OF SUSTAINED FIRE PROPAGATION.
Dataset
Mallee fires (n=43) Heath fires (n=23) All fires (n=66)
Variable p Deviance reduction
p Deviance reduction
p Deviance reduction
U2 0.002 23 0.01 39 >0.0001 27
U10 0.002 10 0.02 61 0.0008 17
Tair >0.0001 52 0.06 43 >0.0001 36
RH 0.001 42 0.03 43 >0.0001 34
FFDI 0.009 55 0.07 61 >0.0001 44
GDI >0.0001 55 0.99 0 >0.0001 45
MClit 0.003 55 0.02 47 >0.0001 31
MCsusp 0.002 60 0.06 56 >0.0001 38
MClive 0.14 4 0.01 37 0.02 6
Young mallee-heath fuel complexes, characterized by very low fuel loads and incipient cover, are
commonly seen as areas that will only support fire spread under Very High to Extreme Fire Danger
conditions. Of the 12 plots burned in the 8-year old mallee-heath fuel complexes only four allowed for the
development of a sustained flame front. Remarkably low litter fuel moisture contents (<5%) were

PROGRAM A :: REPORT NO. A.10.01
68
necessary to sustain fire propagation in these fuels. Although some wind seemed to be necessary to
develop a coherent flame front, there was no requirement for high wind speed to sustain propagation.
These three fires burned under 2-m wind speeds <10 km/h.
TABLE 5.7. FUEL VARIABLE SIGNIFICANCE AND DEVIANCE REDUCTION FOR UNIVARIATE LOGISTIC REGRESSION MODELS FOR
THE LIKELIHOOD OF SUSTAINED FIRE PROPAGATION.
Dataset
Mallee fires (n=43) Heath fires (n=23) All fires (n=66) Variable
p Deviance reduction
p Deviance reduction
p Deviance reduction
Fuel age 0.45 1 0.19 7 0.41 1
NS height 0.42 1 0.30 4 0.16 2
Elevated height 0.16 3 0.68 0 0.25 2
Overstorey height 0.60 0 0.22 6 0.54 1
Overall height 0.43 1 0.54 1 0.30 1
NS cover 0.18 3 0.37 3 0.24 2
Elevated cover 0.51 1 0.26 5 0.19 2
Overstorey cover 0.23 2 0.67 1 0.14 2
Overall cover 0.18 3 0.29 4 0.30 1
PCS litter 0.81 0 0.42 2 0.78 0
PCS NS 0.34 1 0.17 7 0.09 3
PCS elevated 0.50 1 0.49 2 0.99 0
PCS mallee 0.51 1 0.21 24 0.37 1
FHS litter 0.88 0 0.36 3 0.38 1
FHS NS 0.08 5 0.31 4 0.03 6
FHS elevated 0.71 0 0.60 1 0.95 0
FHS mallee 0.55 1 0.23 23 0.50 1
FCS 0.29 2 0.12 11 0.10 3
Fuel load NS 0.72 0 0.75 0 0.74 0
Fuel load Elev 0.93 0 0.42 2 0.63 0
Total fuel load 0.67 0 0.87 0 0.53 0
Bulk density 0.61 0 0.33 3 0.67 0
Fuel volume 0.35 1 0.47 2 0.24 2
The effect of fuel complex variables was found to be minor on differentiating the sustained from self
extinguished fires (Table 5.7). For the overall dataset only near-surface FHS had a p-value <= 0.05. Two
other variables, near-surface PCS and FCS, had a p-value lower or equal to 0.1. Considering the full
dataset maximum deviance reduction computed due to a fuel covariate was 6% for the near-surface FHS.
Nonetheless, substantial differences in spread potential were observed in burns conducted simultaneously
in distinct fuel ages.
Simultaneous burning of plots H3 – T1 (21-year old fuels, heath vs. mallee) and Q8 – V6 (21- vs. 49-year old
mallee) highlighted the differences in fire potential between these fuel types under moderate fire danger
conditions (Table 5.8). For each pair of burns there was a sustained and a self-extinguished fire. A
comparison between some of the most influential fuel complex variables reveals no large differences in
individual fuel characteristics that would determine substantial differences in fire potential. It is
suspected that will be the aggregate of fuel complex characteristics and their indirect effect on the within
stand fire weather that determine the differences in fire behaviour. The set of simultaneous fire
behaviour experiments (11 sets of concurrent experimental burns were conducted) indicate that mallee
fuel complexes require higher fire potential to self sustain than the heath fuel types. Similarly, as the
mallee fuel complex matures above the age of full establishment higher fire potential conditions are

PROGRAM A :: REPORT NO. A.10.01
69
required to achieve sustained fire propagation. The rate of spread values in Table 5.7 also highlight the
non-linear fire behaviour characteristics of discontinuous fuel complexes such as mallee-heath. Fire fails
to propagate until a set of environment conditions is encountered, after which fire behaviour is rather
severe. On both the self extinguished fires in Table 5.8 it was felt that environment conditions were close
to sustained propagation.
TABLE 5.8. COMPARISON OF WEATHER, FUEL CHARACTERISTICS AND FIRE BEHAVIOUR FOR TWO SETS OF SIMULTANEOUS
EXPERIMENTAL FIRES.
Date 19/05/2006 18/04/07
Fire H3 T1 Q8 V6
Fuel type Heath Mallee Mallee Mallee
Fuel age 21-years 21-years 21-years 49-years
Tair (C) 20 20 22 22
RH (%) 37 37 42 42
MCsusp (%) 12.7 12.3 10.4 9.3
U2 (km/h) 11.3 8 5.1 4.2
Helev 0.5 1.4 0.9 1.2
Covos (%) 3 13 13 18
PCSns 1.1 1.3 1.8 1.5
FHSns 2.3 1.9 1.6 1.7
FCS 9.7 7.7 6.5 7.1
W 0.61 0.91 0.67 0.75
BD 1.2 0.5 0.7 1.3
Fire type Sustained Selfextinguished Sustained Selfextinguished
R 39 0 11 0
IB 7300 0 2350 0
Rate of fire spread
From the total of 66 experimental fires conducted, 32 were self sustained fires. Changes in wind direction
and instrument failure increase the uncertainty on the measured rate of spread for four fires. These were
not included on the rate of spread analysis, leaving the dataset with a total of 28 fires, 11 in heath and 17
in mallee fuels (Table 5.9). Experimental fire duration averaged 14 minutes (ranged between 5 and 37
minutes). Table 5.9 provides the general statistics of weather and fire behaviour variables by fuel type.
Ranges of average rate of spread were 9.1-43.9 and 3.8-55.1 m/min respectively for heath and mallee
fuels. Although the mean of the plots rate of spread is similar between the heath and mallee subsets of
data, 21.7 and 22.3 m/min respectively, heath fires occurred generally under milder burning conditions.
The mean FFDI was 14 and 24 for the heath and mallee fire experiments respectively. This illustrates the
higher spread potential of heath fuels compared to the mallee fuel complex for the moderate to high
forest fire danger indexes. Data plotted on Fig. 5.3a and b suggests that the differences in rate of spread
are likely due to the effect of the overstorey canopy in decreasing the wind speeds driving fire in the
understorey fuels. The plot of rate of spread as a function of 10-m open wind (Fig.5.4b) shows that in
general heath fuels require lower wind speeds to reach a given rate of spread. When we consider 2-m wind
speed this disparity is not visible (Fig. 5.4a) and the heath and mallee data follow the same trend. This
figure also shows that there is a cluster of 4 heath fires with relatively high 2-m wind speeds but low rates
of spread. This group of data corresponds to fires with suspended fuel moisture contents higher then 10%
(Fig.5.5b). Under these marginal conditions flank propagation is limited or inexistent and the flame front is
prone to lose cohesiveness when areas of fuel discontinuity are breached. In this scenario the flame front
breaks up into discrete units and the overall forward propagating flux is reduced. Overall, the data in Fig.

PROGRAM A :: REPORT NO. A.10.01
70
5.5a and b suggests that the fuel moisture content damping effect at higher fuel moistures is more
pronounced in mallee fuels.
The above comparative analysis of fire behaviour in mallee versus heath fuels is valid to the burning
conditions covered in Fig. 5.2. The effect of mallee bark fuels in establishing a fire spread regime where
short range, high density spotting coupled with crowning has a large influence on the overall fire
propagation was observed on experimental fires in the older mallee fuel type burning under moderately
low fuel moistures (4-8%) - high wind speeds. The change in fire dynamics that the onset of crowning and
spotting causes induces high rates of spread. Under this high fire potential conditions it is expected that
fires will spread faster in mallee fuel complexes then in heath fuels.
TABLE 5.9. DESCRIPTIVE STATISTICS, MEAN (ST. DEV.) [MIN-MAX], FOR ENVIRONMENTAL AND FIRE
BEHAVIOUR VARIABLES ASSOCIATED SUSTAINED FIRES IN HEATH AND MALLEE FUEL TYPES. Variable Mallee (n=17) Heath (n=11) Tair (C) 29.9 (5.3) [21, 39] 25.9 (5.6) [19.5, 33] RH (%) 24.6 (13.4) [7.2, 45] 33.3 (8.2) [22.4, 48] U2 (km/h) 6.5 (2.5) [3.5, 10.5] 10 (3.4) [4, 13.7] U10 (km/h) 15.6 (5) [10.5, 27.9] 14.1 (3.8) [7.3, 18.5] MClit (%) 5.1 (1.9) [1.9, 9.1] 7.5 (2.9) [3.4, 11.4] MCsusp (%) 7.2 (1.8) [4.2, 10.4] 9.5 (2.3) [6.5, 12.7] MClive (%) 69 (12) [51, 89] 74 (11) [63, 93] FFDI 24.3 (12.6) [9.2, 46.1] 14.1 (5.8) [7.0, 24.2] R (m/min) 22.3 (16.4) [3.8, 55.1] 21.7 (12.3) [9.1, 43.9] IB (kW/h) 4264 (2838) [734, 10956] 3827 (2060) [1154, 7302] FH (m) 2.9 (1.5) [9.21, 6] 2.2 (0.6) [1.3, 3]
Figure 5.4. Experimental fire rates of spread by fuel type (mallee vs. heath) as a function of (a) 2-m and
(b) 10-m open wind speed.

PROGRAM A :: REPORT NO. A.10.01
71
Figure 5.5. Experimental fire rates of spread by fuel type (mallee vs. heath) as a function of (a) litter and
(b) suspended dead fuel moisture content.
Figure 5.6. Experimental fire rates of spread by fuel type (mallee vs. heath) as a function of (a) total fuel
load and (b) fuel bulk density.
Of the weather variables in Table 5.9 only wind speed (U2 and U10) had a statistically significant effect on
fire rate of spread (Table 5.10). Pearson correlation coefficients (r) calculated for the three fuel moisture
measures were found not significant. These results underline the dominant effect of wind speed on the
rate of spread of shrubland fuels and is in agreement with previous research results that indicate a limited
effect of litter and suspended fuel moisture on the rate of fire spread in shrubland fuel complexes (e.g.,
McCaw 1997, Catchpole et al. 1998). No significant relation existed between wind and fuel moisture
variables (p>0.1).

PROGRAM A :: REPORT NO. A.10.01
72
Fuel load (w) had a significant effect on rate of fire spread (Fig. 5.6a), albeit negative (r=-0.4, p=0.03).
This particular result seems counterintuitive as fuel load is seen as having a direct effect on rate of fire
spread in forest fuel complexes (McArthur 1967). A possible explanation for the inverse effect of fuel load
in rate of spread considers flame – wind interactions. A given flame structure (e.g., height and angle) is
the result of the balance between the energy released by the fire and the wind strength. It was observed
that in the heath and young mallee fuel types flames possessed limited buoyancy and were easily tilted
forward. This maximizes energy transfer into unburned fuels leading to fast rates of spread. The low
buoyancy in these flames was associated with the low fuel load and cover characteristic of younger fuels,
hence the inverse relationship between fuel load and rate of fire spread. Fuel load was not significantly
correlated with wind speed or dead fuel moisture content.
None of the remaining fuel complex variables analysed had a significant effect on rate of fire spread. The
highest p-value associated with a fuel descriptor other than fuel load was 0.14 (elevated FHS).
TABLE 5.10. PEARSON CORRELATION COEFFICIENT (r) BETWEEN RATE OF FIRE SPREAD AND WEATHER/FUEL VARIABLES.
Variable Pearson r Significance
U10 0.531 0.004
U2 0.418 0.027
MCsusp -0.108 0.583
MClit -0.175 0.373
W -0.402 0.034
FHSelev 0.283 0.144
Fire rate of spread data in Table 5.9 is relative to plot averages. The thermologger grid allowed for
multiple measurements of rate of spread within a plot. Along with the average rate of spread, this data
was used to estimate its standard deviation, from which a rate of spread distribution can be determined.
This allows to better understand the transient nature of fire spread and maximum values associated with
the average rate of spread.
Table 5.11 gives data on fire variability for a subset of experiments where the number of rate of spread
measurements were greater than five. For three of the fires (AS1, AS3 and G8) the standard deviation was
greater than the mean rate of spread. In these fires the standard deviation averaged 150% of the mean.
Variation in rate of spread was smaller in the remaining fires, with the standard deviation averaging 57% of
the mean. It is not clear what were the causes of these differences. A measure of wind gustiness, the ratio
between the wind speed gust and average, did not provide insight into the magnitude of fire spread
variability. For this subset of data, the ratio of maximum measured rate of spread and mean rate of spread
varied between 5.9 and 2.1.
The knowledge of the rate of fire spread probability distribution and its maximum values is important to
understand other fire behaviour characteristics. Considering the direct dependence of fireline intensity on
rate of fire spread (eq. 5.2), short-term variations in fire spread rate lead to peaks in fire intensity that
will more then double the mean value. This has direct implications in fire features such as the onset of
crowning and spotting. Spotting density and distances are a function of fireline intensity as the vertical
momentum within the flame will determine the height firebrands will be lofted within the buoyant plume
(Albini 1983; Ellis 2000). Peaks in fireline intensity will cause surges in spotting that will affect overall fire
development. This transient feature of fire behaviour has also strong implications in fire-fighter safety.
Sudden increases in rate of spread and intensity are the major cause of fire-fighter entrapments (Cheney
et al. 2001, Viegas 2006).

PROGRAM A :: REPORT NO. A.10.01
73
TABLE 5.11. RATE OF SPREAD VARIABILITY AND WIND GUST STRUCTURE FOR SELECTED FIRE PLOTS.
Rate of fire spread (m/min) Wind speed Plot
Run length (m)
n Mean St. Dev Max Max/mean Gust/mean
AS1 300 5 40.0 66.9 169 4.2 1.7
AS2 300 15 46.6 29.2 100 2.1 2.2
AS3 200 9 42.6 62.1 250 5.9 1.8
B 200 6 13.3 7.4 24.6 1.8 1.8
F1 110 6 12.9 9.5 30.2 2.3 2.1
G8 200 5 9.9 14.9 40 4.0 1.8
O 240 6 13.5 9.9 34.5 2.6 1.9
The fire behaviour dataset allowed investigating the adequacy of existent fire danger and spread models to
mallee-heath fuel complexes. The Forest (McArthur 1967) and Grassland (McArthur 1966) Fire Danger
Indexes were plotted and regressed against the mallee-heath rate of spread data. The Forest Fire Danger
Index (FFDI) did not show a relationship with mallee-heath rate of spread (Fig. 5.7a). A linear regression of
FFDI on rate of fire spread was found not significant (p = 0.25), explaining only 5% of the variation in rate
of spread. The Grassland Fire Danger Index (GFDI) was slightly better related to rate of spread (Fig 5.7b),
albeit the relationship was still weak. GFDI explained 27% of the variation in rate of spread through linear
regression analysis (p = 0.003).
Four rate of fire spread models specific for semi-arid vegetation and/or shrublands were tested. The
models used were: (1) McCaw (1997) model developed for southern WA mallee-heath shrubland; (2)
Burrows et al. (2009) model for WA Spinifex fuels; (3) Catchpole et al. (1998) model for shrublands; and (4)
Rothermel (1972) model. The Rothermel model is a semi-physical model with applicability to a wide range
of fuel complexes. For the evaluation of this model we tested it through the use of two of its standardized
fuel models, fuel model 4 (chaparral) and 6 (dormant shrubs) (see Anderson 1982 for details on fuel model
characteristics). In addition, we also evaluated the performance of the two fire spread models used
operationally to predict fire behaviour in Eastern and South Australia, the McArthur Forest Fire Danger
Meter (FFDM) Mk 5 (McArthur 1973) and the grassland fire spread model (Cheney et al. 1998). Although
these two models are not appropriate for shrubland fuels they are commonly used when estimates on rates
of spread are required in fuel types other than dry sclerophyll eucalypt forests and grasslands.

PROGRAM A :: REPORT NO. A.10.01
74
Figure 5.7. Observed rate of fire spread in mallee and heath fires vs (a) FFDI, (b) GFDI, (c) McArthur (1973)
Mark 5 meter, (d) McCaw (1997) WA mallee model, (e) Catchpole et al. (2002) shrubland model, (f)
Rothermel (1972) model with Chaparral fuel model, (g) Rothermel (1972) model with dormant shrubs fuel
model, (h) Burrows et al. (2009) Spinifex model and (i) Cheney et al. (1998) grassland model (undisturbed
grasses).
Table 5.12 presents evaluation statistics for the various models sorted by lowest root mean square error.
For the heath fires the best performing models were McCaw (1997) mallee-heath model and the Burrows et
al. (2009) Spinifex model. These models yield mean absolute errors around 10 m/min and relatively small
bias. McCaw (1997) model tended to underpredict rate of fire spread and Burrows et al (2009)
overpredicted. The largest errors were produced by the FFDM and grassland models.
Model predictions for the mallee fires showed similar overall levels of uncertainty. Chaparral fuel model 4
from the Rothermel model produced the lowest root mean square error (12.6) and no discernable bias
(0.01). Better results could be obtained by this model by using custom fuel models, as found by McCaw
(1997). Both McCaw (1997) and Burrows et al. (2009) models produced comparable RMSE, but distinct bias
error trends. Burrows et al. (2009) model yield a slight overprediction (2.5), whereas McCaw (1997) model
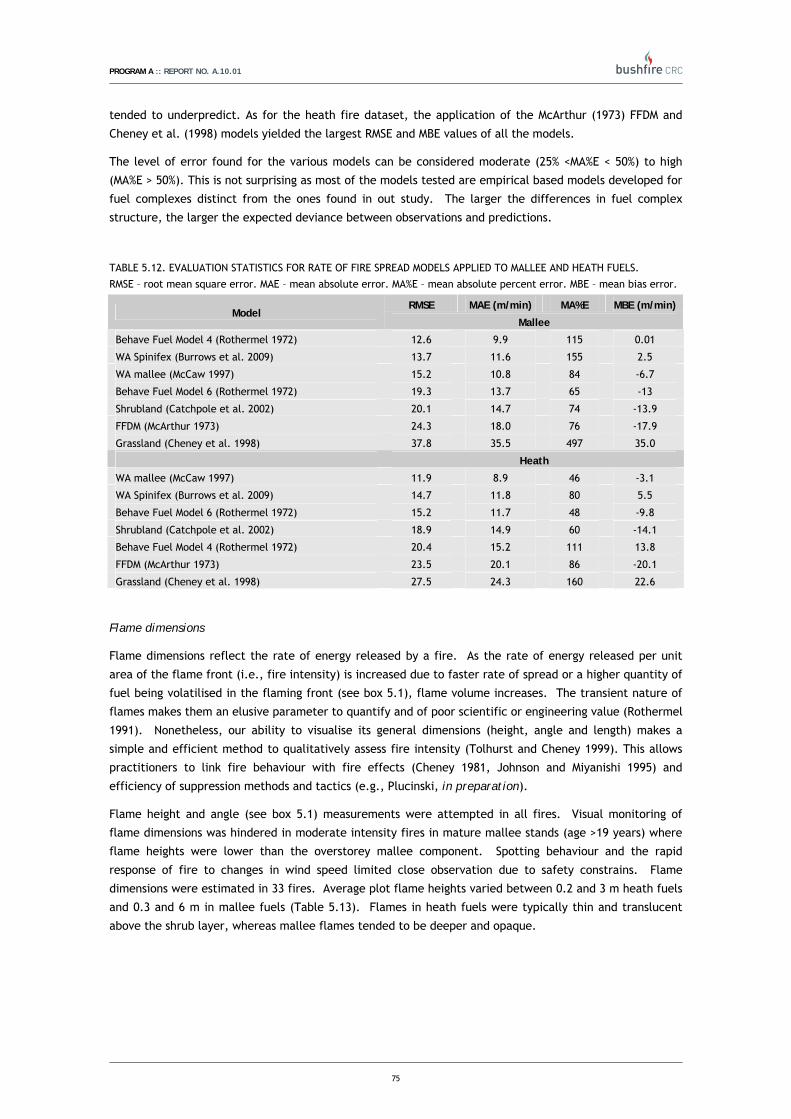
PROGRAM A :: REPORT NO. A.10.01
75
tended to underpredict. As for the heath fire dataset, the application of the McArthur (1973) FFDM and
Cheney et al. (1998) models yielded the largest RMSE and MBE values of all the models.
The level of error found for the various models can be considered moderate (25% <MA%E < 50%) to high
(MA%E > 50%). This is not surprising as most of the models tested are empirical based models developed for
fuel complexes distinct from the ones found in out study. The larger the differences in fuel complex
structure, the larger the expected deviance between observations and predictions.
TABLE 5.12. EVALUATION STATISTICS FOR RATE OF FIRE SPREAD MODELS APPLIED TO MALLEE AND HEATH FUELS.
RMSE – root mean square error. MAE – mean absolute error. MA%E – mean absolute percent error. MBE – mean bias error.
RMSE MAE (m/min) MA%E MBE (m/min) Model
Mallee
Behave Fuel Model 4 (Rothermel 1972) 12.6 9.9 115 0.01
WA Spinifex (Burrows et al. 2009) 13.7 11.6 155 2.5
WA mallee (McCaw 1997) 15.2 10.8 84 -6.7
Behave Fuel Model 6 (Rothermel 1972) 19.3 13.7 65 -13
Shrubland (Catchpole et al. 2002) 20.1 14.7 74 -13.9
FFDM (McArthur 1973) 24.3 18.0 76 -17.9
Grassland (Cheney et al. 1998) 37.8 35.5 497 35.0
Heath
WA mallee (McCaw 1997) 11.9 8.9 46 -3.1
WA Spinifex (Burrows et al. 2009) 14.7 11.8 80 5.5
Behave Fuel Model 6 (Rothermel 1972) 15.2 11.7 48 -9.8
Shrubland (Catchpole et al. 2002) 18.9 14.9 60 -14.1
Behave Fuel Model 4 (Rothermel 1972) 20.4 15.2 111 13.8
FFDM (McArthur 1973) 23.5 20.1 86 -20.1
Grassland (Cheney et al. 1998) 27.5 24.3 160 22.6
Flame dimensions
Flame dimensions reflect the rate of energy released by a fire. As the rate of energy released per unit
area of the flame front (i.e., fire intensity) is increased due to faster rate of spread or a higher quantity of
fuel being volatilised in the flaming front (see box 5.1), flame volume increases. The transient nature of
flames makes them an elusive parameter to quantify and of poor scientific or engineering value (Rothermel
1991). Nonetheless, our ability to visualise its general dimensions (height, angle and length) makes a
simple and efficient method to qualitatively assess fire intensity (Tolhurst and Cheney 1999). This allows
practitioners to link fire behaviour with fire effects (Cheney 1981, Johnson and Miyanishi 1995) and
efficiency of suppression methods and tactics (e.g., Plucinski, in preparation).
Flame height and angle (see box 5.1) measurements were attempted in all fires. Visual monitoring of
flame dimensions was hindered in moderate intensity fires in mature mallee stands (age >19 years) where
flame heights were lower than the overstorey mallee component. Spotting behaviour and the rapid
response of fire to changes in wind speed limited close observation due to safety constrains. Flame
dimensions were estimated in 33 fires. Average plot flame heights varied between 0.2 and 3 m heath fuels
and 0.3 and 6 m in mallee fuels (Table 5.13). Flames in heath fuels were typically thin and translucent
above the shrub layer, whereas mallee flames tended to be deeper and opaque.

PROGRAM A :: REPORT NO. A.10.01
76
TABLE 5.13. DESCRIPTIVE STATISTICS, MEAN (ST. DEV.) [MIN-MAX], FOR FLAME HEIGHT (FH), FLAME ANGLE (FA) AND
FLAME LENGTH (ESTIMATED , FL) IN HEATH AND MALLEE FUEL TYPES.
Dataset
Mallee fires (n=22) Heath fires (n=11) All fires (n=33)
FH 2.0 (1.59) [0.3, 6] 1.8 (0.94) [0.2, 3] 1.9 (1.39) [0.2, 6]
FA 66 (19) [28, 92] 69 (16) [30, 84] 66 (18.7) [28, 92]
FL 2.9 (2.99) [0.3, 12] 2.1 (1.48) [0.2, 5.5] 2.6 (0.26) [0.2, 12]
Flame heights were significantly correlated to R and IB, wind speed and dead fuel moisture content (Table
5.14). The strength of the relationship between flame height and wind (r = 0.61 for U10) and fuel moisture
(r = -0.62 for MClit) were analogous (Fig. 5.8). No fuel descriptor had a significant effect on flame height.
The FH – IB relationship is distinct for heath and mallee fuels (Fig. 5.9). Flames in heath fuels were smaller
for the same fireline intensity. These differences are likely the result of (1) differences on the overall fuel
bed height between the two fuel types; and (2) low buoyancy in the heath fuels allowing the wind to tilt
the flame forward.
Flame length was not measured but estimated from flame height and angle (Box 5.1). Flame length was
highly correlated with R and IB, although correlations were in general slightly less then the observed for
flame height (Table 5.14). This was somewhat surprising as for a given fuel complex, flame length is
directly related to fireline intensity (Byram 1959, Tolhurst and Cheney 1999). The flame length – fireline
intensity scatter plot (Fig. 5.9b) shows a linear relationship for most of the data with the exception of two
datapoints in the upper range of the fireline intensity range. This deviation is explained by the fact that
these two fires were full-fledged crown fires in mature mallee stands. As a fire transitions from the surface
to the crown fuels the fuel volume supporting flame propagation increases. For the mature mallee fuel
complex, it changes from about 1 (elevated fuel layer height) to 4-5 meters (overstorey height).
TABLE 5.14. PEARSON CORRELATION COEFFICIENT BETWEEN FLAME GEOMETRY
DESCRIPTORS AND WEATHER, FUEL AND FIRE BEHAVIOUR VARIABLES (N=33).
Variable FH FA FL
R 0.80* -0.51* 0.70*
IB 0.78* -0.52* 0.72*
U10 0.61* -0.54* 0.65*
U2 0.51* -0.51* 0.50*
MClit -0.62* 0.22 -0.44*
MCsusp -0.61* 0.29 -0.48*
* - Correlation is significant at the 0.01 level.

PROGRAM A :: REPORT NO. A.10.01
77
Figure 5.8. Measured flame heights for heath and mallee fires as a function of (a) 10-m open wind speed
and (b) suspended dead fuel moisture content.
Figure 5.9. (a) flame height and (b) flame length in heath and mallee fires as a function of Byram’s fireline
intensity.
Residence time
Flame residence time attempts to quantify the time flaming combustion exists at a fixed location.
Residence time influences the ignition and combustion of larger woody fuels on the ground and live foliage
in the canopy. It also influences the heat pulse to organic and mineral soil layers, which triggers an array
of processes such as nutrient volatilization and seed scarification. A total of 195 residence time
measurements relative to the head fire part of the fire perimeter were collected in 20 experimental fires.
The number of residence time measurements per plot depended on plot size and the number of
experimental fires conducted on the day. Sampling intensity varied between 33 and 5. Fig. 5.10a describes
the distribution of residence time (mean = 38.6 sec; st. dev. = 27.0) within an experimental burn (plot
AS2). Residence time seems to follow a Weibull distribution with the spread of the right tail a function of
the mallee cover. Temperature – time profiles and residence times measured in heath fuels or under
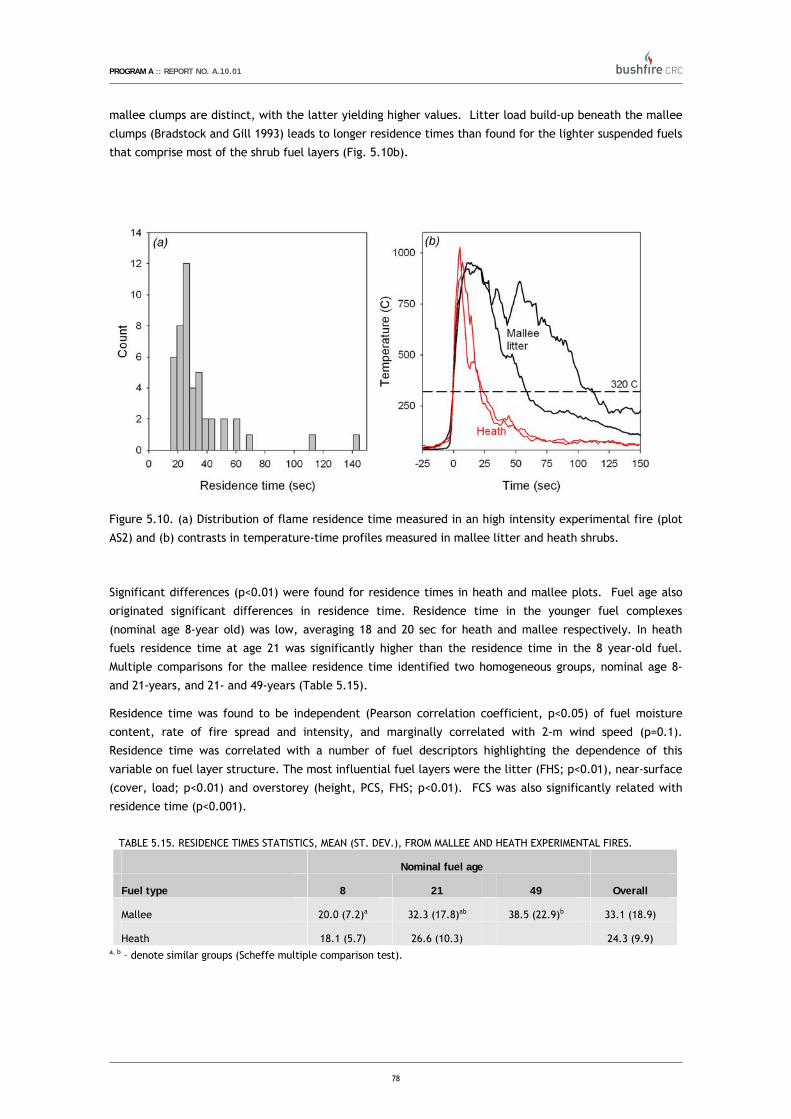
PROGRAM A :: REPORT NO. A.10.01
78
mallee clumps are distinct, with the latter yielding higher values. Litter load build-up beneath the mallee
clumps (Bradstock and Gill 1993) leads to longer residence times than found for the lighter suspended fuels
that comprise most of the shrub fuel layers (Fig. 5.10b).
Figure 5.10. (a) Distribution of flame residence time measured in an high intensity experimental fire (plot
AS2) and (b) contrasts in temperature-time profiles measured in mallee litter and heath shrubs.
Significant differences (p<0.01) were found for residence times in heath and mallee plots. Fuel age also
originated significant differences in residence time. Residence time in the younger fuel complexes
(nominal age 8-year old) was low, averaging 18 and 20 sec for heath and mallee respectively. In heath
fuels residence time at age 21 was significantly higher than the residence time in the 8 year-old fuel.
Multiple comparisons for the mallee residence time identified two homogeneous groups, nominal age 8-
and 21-years, and 21- and 49-years (Table 5.15).
Residence time was found to be independent (Pearson correlation coefficient, p<0.05) of fuel moisture
content, rate of fire spread and intensity, and marginally correlated with 2-m wind speed (p=0.1).
Residence time was correlated with a number of fuel descriptors highlighting the dependence of this
variable on fuel layer structure. The most influential fuel layers were the litter (FHS; p<0.01), near-surface
(cover, load; p<0.01) and overstorey (height, PCS, FHS; p<0.01). FCS was also significantly related with
residence time (p<0.001).
TABLE 5.15. RESIDENCE TIMES STATISTICS, MEAN (ST. DEV.), FROM MALLEE AND HEATH EXPERIMENTAL FIRES.
Nominal fuel age
Fuel type 8 21 49 Overall
Mallee 20.0 (7.2)a 32.3 (17.8)ab 38.5 (22.9)b 33.1 (18.9)
Heath 18.1 (5.7) 26.6 (10.3) 24.3 (9.9) a, b – denote similar groups (Scheffe multiple comparison test).
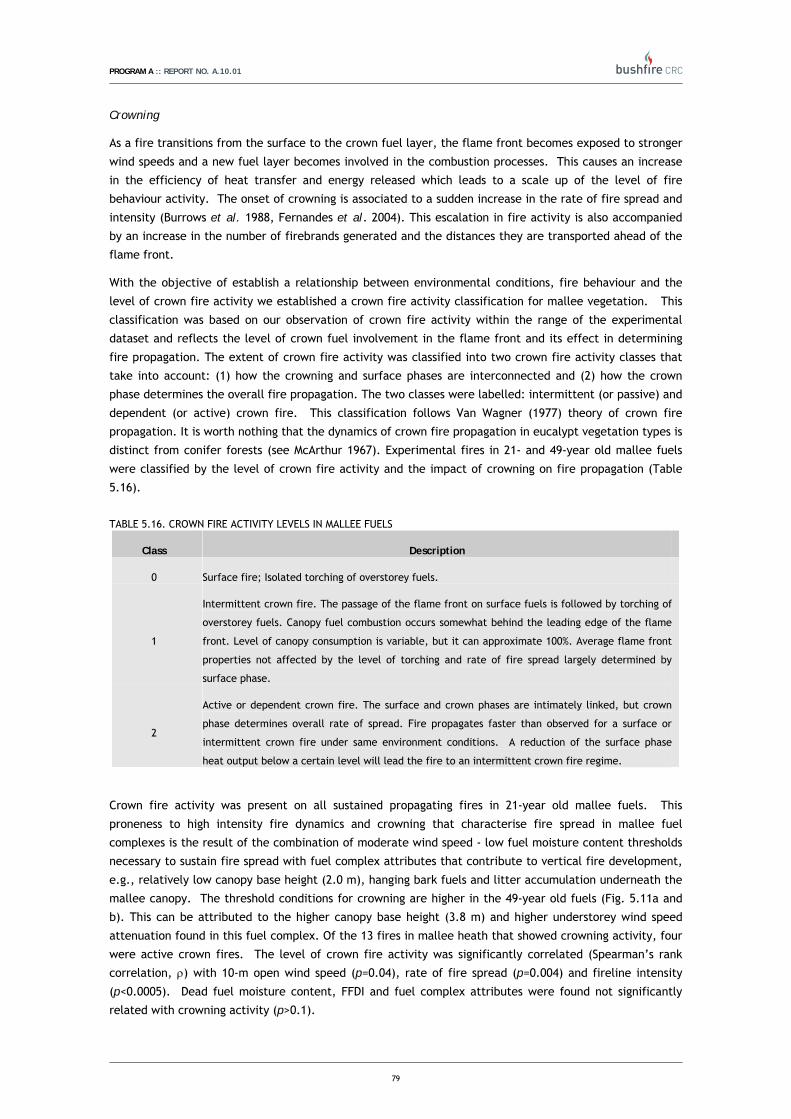
PROGRAM A :: REPORT NO. A.10.01
79
Crowning
As a fire transitions from the surface to the crown fuel layer, the flame front becomes exposed to stronger
wind speeds and a new fuel layer becomes involved in the combustion processes. This causes an increase
in the efficiency of heat transfer and energy released which leads to a scale up of the level of fire
behaviour activity. The onset of crowning is associated to a sudden increase in the rate of fire spread and
intensity (Burrows et al. 1988, Fernandes et al. 2004). This escalation in fire activity is also accompanied
by an increase in the number of firebrands generated and the distances they are transported ahead of the
flame front.
With the objective of establish a relationship between environmental conditions, fire behaviour and the
level of crown fire activity we established a crown fire activity classification for mallee vegetation. This
classification was based on our observation of crown fire activity within the range of the experimental
dataset and reflects the level of crown fuel involvement in the flame front and its effect in determining
fire propagation. The extent of crown fire activity was classified into two crown fire activity classes that
take into account: (1) how the crowning and surface phases are interconnected and (2) how the crown
phase determines the overall fire propagation. The two classes were labelled: intermittent (or passive) and
dependent (or active) crown fire. This classification follows Van Wagner (1977) theory of crown fire
propagation. It is worth nothing that the dynamics of crown fire propagation in eucalypt vegetation types is
distinct from conifer forests (see McArthur 1967). Experimental fires in 21- and 49-year old mallee fuels
were classified by the level of crown fire activity and the impact of crowning on fire propagation (Table
5.16).
TABLE 5.16. CROWN FIRE ACTIVITY LEVELS IN MALLEE FUELS
Class Description
0 Surface fire; Isolated torching of overstorey fuels.
1
Intermittent crown fire. The passage of the flame front on surface fuels is followed by torching of
overstorey fuels. Canopy fuel combustion occurs somewhat behind the leading edge of the flame
front. Level of canopy consumption is variable, but it can approximate 100%. Average flame front
properties not affected by the level of torching and rate of fire spread largely determined by
surface phase.
2
Active or dependent crown fire. The surface and crown phases are intimately linked, but crown
phase determines overall rate of spread. Fire propagates faster than observed for a surface or
intermittent crown fire under same environment conditions. A reduction of the surface phase
heat output below a certain level will lead the fire to an intermittent crown fire regime.
Crown fire activity was present on all sustained propagating fires in 21-year old mallee fuels. This
proneness to high intensity fire dynamics and crowning that characterise fire spread in mallee fuel
complexes is the result of the combination of moderate wind speed - low fuel moisture content thresholds
necessary to sustain fire spread with fuel complex attributes that contribute to vertical fire development,
e.g., relatively low canopy base height (2.0 m), hanging bark fuels and litter accumulation underneath the
mallee canopy. The threshold conditions for crowning are higher in the 49-year old fuels (Fig. 5.11a and
b). This can be attributed to the higher canopy base height (3.8 m) and higher understorey wind speed
attenuation found in this fuel complex. Of the 13 fires in mallee heath that showed crowning activity, four
were active crown fires. The level of crown fire activity was significantly correlated (Spearman’s rank
correlation, ρ) with 10-m open wind speed (p=0.04), rate of fire spread (p=0.004) and fireline intensity
(p<0.0005). Dead fuel moisture content, FFDI and fuel complex attributes were found not significantly
related with crowning activity (p>0.1).

PROGRAM A :: REPORT NO. A.10.01
80
Figure 5.11. Level of crown fire activity in relation to (a) 10-m open wind speed and fuel age; and (b) 10-m
open wind speed and fireline intensity.
Spotting
Spotting, the process of firebrand generation, transport and ignition of new fires, is a significant fire
spread mechanism (McArthur 1967), and the dominant method in high intensity fires in forests dominated
by eucalypt species (Cheney and Bary 1969). Spotting effect on fire propagation can range from isolated
spot fires that have little effect on fire behaviour of the main fire but can ignite new fires that burn
independently, to mass short range spotting phenomena that upon coalescence can lead to firestorm
behaviour (McArthur 1967).
For a given fuel complex and fire intensity a wider flame front leads to a stronger convection plume and
longer firebrand transport distances. The size of the experimental fires (1 to 13 ha) limits the
development of the convection plume and inferences that can be made regarding medium to long range
spotting phenomena in mallee heath fuels. The scale of our experimental approach is nonetheless
adequate for describing short range spotting characteristics. In order to qualitatively characterize short
range spotting two descriptors were considered: density of ignitions and distance from main flame front. A
classification was established for each spotting characteristic (Table 5.17) and applied to the experimental
fire dataset. Measurements of spotting distance and density were based on visual observation (in contrast
to the methods detailed in Gould et al. 2007) and should be seen as conservative. It is likely that a large
number of spot fires were not detected.
TABLE 5.17. DESCRIPTION OF SPOTTING ACTIVITY AND SPOTTING DISTANCES CLASSES.
Class Spotting activity Typical spotting
distances
0 No spotting activity observed
1 Isolated short range spot fires. < 10 m
2 Frequent spotting activity; between 5 – 10 spot fires per 100 m fireline width.
Spotting activity not affecting overall fire propagation
10 - 50
3 Widespread spotting activity; More then 10 spot fires per 100 m fireline width.
Spotting activity impacting overall fire rate of spread.
> 50

PROGRAM A :: REPORT NO. A.10.01
81
Short range spotting (Classes 1,2 and 3) was observed in 88% of the experimental fires with sustainable
propagation. This illustrates the ubiquitous nature of short range spotting in mallee-heath fuels. Most of
the spotting activity was within class 1 and 2, with no effect on overall fire spread rate, but allowing fire
to cross small areas of fuel discontinuity such as roads or small fuelbreaks. No spotting activity in class 2
and 3 were observed in heath fuels (Fig. 5.12) or young mallee fuels. Widespread spotting activity was
observed in three fires in mature mallee stands when 10-m open winds exceeded 20 km/h and suspended
dead fuel moisture contents <8%.
The level of spotting density was significantly correlated (Spearman’s rank correlation, ρ) with crowning
activity (ρ = 0.726, p < 0.0005) but not with any of the measured weather and fuel variables. Rate of
spread and fireline intensity were also not related to spotting activity. Short range spotting distance
(Table 5.17) was significantly correlated with spotting density (ρ = 0.935, p < 0.0005) and crowning activity
(ρ= 0.717, p < 0.0005), and unrelated with any other measured environmental and fire behaviour variable.
These results highlight the dependency of short range spotting phenomena on the level of crown fire
activity. This fire-dependent dynamics is responsible for a rapid, nonlinear increase in the overall rate of
fire spread as the mechanisms determining fire propagation are distinct from observed for fire spreading in
the surface fuel stratum.
Figure 5.12. Level of spotting activity in relation to (a) 10-m open wind speed and (b) suspended dead fuel
moisture content in heath and mallee fuels.
52B5.3. Discussion
Fire sustainability
Dead fuel moisture content was found to be the dominant fire environment variable determining fire
sustainability. The moisture content of dead suspended fuels was found to better explain fire
sustainability than the moisture content of litter fuels. Live fuel moisture was not found to have a
significant effect on fire sustainability. Mallee stands required lower fuel moisture contents to sustain
spread than the heath fuels. Considering average dataset characteristics, the threshold suspended fuel
moisture content to sustain fire propagation was 9% in mallee and 13% in heath. The mallee figure is close

PROGRAM A :: REPORT NO. A.10.01
82
to the 8% shallow litter fuel moisture content threshold found by McCaw (1997) in structurally similar 20-
year old mallee in the South-west WA. The threshold fuel moisture content values are not to be seen as
absolute, but indicative. Other variables, such as wind speed and fuel cover, have a measurable effect on
fire sustainability and will allow fire to spread under higher, or require lower, fuel moistures contents
depending on the ambient wind speed and fuel cover.
Wind speed had a significant effect on the likelihood of sustained propagation. Overall, 2-m wind speed, a
proxy of midflame wind speed, was a better discriminator than 10-m open wind speed. The presence of
wind is necessary to aid the process of fire propagation. Nonetheless, light winds, e.g., midflame wind
speed > 5 km/h, will suffice to prompt the development of a solid flame front if fuels are notably dry
(Billing 1981, Bradstock et al. 1992). The effect of wind speed on fire sustainability is restricted to the low
range of fuel moisture contents, i.e., low fuel moisture conditions are a pre-requisite for wind speed to
show an effect. Higher wind speeds were not able to offset the damping effect of high fuel moistures. It
was observed that under these conditions higher winds would tilt flames forward, pre-heat and ignite fuels
ahead of the fire, but the lack of flank propagation would quickly result in the fragmentation of the flame
front, followed by the progressive reduction in the size of the discrete flame units, and eventual extinction
of the flame front. This occurred independently of the ignition source (i.e., drip torches or vehicle
mounted flame thrower).
The fuel moisture thresholds discussed here should not be considered moisture of extinctions. Litter fuels
under mallee clumps would sustain fire propagating with minute flame heights (<0.1 m) and low rates of
spread (<0.3 m/min) with fuel moisture contents around 13% and nil wind. Under these conditions only
litter fuels were involved in the flame front and horizontal fuel continuity was required to allow fire to
propagate between mallee clumps. These fires were considered not to meet prescribed burn fuel
reduction/hazard mitigation objectives. Nonetheless, for other fire management applications, such as
wildfire suppression, it is important to know the thresholds under which live flame will self sustain in
mallee fuel types.
The threshold fuel moisture for sustainable fire propagation was observed to be strongly dependent on fuel
structure. Nonetheless, when considering individual fuel descriptors, only one fuel variable, near-surface
FHS, was found to have a significant effect on fire sustainability, albeit small when compared with the
effect of fuel moisture or wind speed. This lack of effect of individual fuel variables, e.g., cover, height,
bulk density, on fire sustainability hints that it is fuel complex as a whole that exert an effect on fire
sustainability. The contrast between threshold fuel moisture contents for distinct fuel complex was
clearly observed when conducting simultaneous fires in fuels with distinct ages. Younger fuels,
characterised by lower fuel cover and load, required a substantially higher fire potential to sustain
propagation. Fire propagation in 9-year old fuels was only possible when suspended fuel moisture was <5%
and midflame wind speeds (2-m) were close to 10 km/h. Propagation in younger fuels, e.g., 3-5-year old,
has been observed under drier/windier conditions in the Ngarkat CP and southwest WA mallee-heath
(McCaw et al. 1992) under certain burning conditions (e.g., FFDI > 75).
The effect of solar radiation in the development of sustained fires was not quantified in our study, as we
did not systematically measure this quantity. McCaw (1997) found this variable to have an effect on fire
sustainability, with no fires spreading under heavy overcast conditions when solar radiation was <400
W/m2. We also observed that in three operational prescribed fires conducted in the vicinity of the
threshold fire weather conditions for sustained propagation, occasional shading of the fire ground due to
cloud cover would halt fire propagation.
Direct comparison between our study data and results collected in operational (e.g., Billing 1981, Noble
1986) and experimental (Bradstock et al. 1992) burns in mallee-heath is hindered by the lack detailed fire
environment information (e.g., winds, fuel moisture) in these publications. The comparison between
proxies of fire potential (e.g, estimated fuel moisture as per Vinney (1992) and FFDI) between our and
these studies reveal general agreement, i.e, no bias or large departures.
PROGRAM A :: REPORT NO. A.10.01
83
Rate of fire spread
After a self-sustained and continuous flame front is established, wind speed was the fire environment
variable with the largest influence on the rate of fire spread. Analysis of the response of fires to changes in
wind speed reveals a very strong effect of this variable on rate of spread. The strong effect of wind speed
can be attributed to two fuel complex features: the absence or open nature of the overstorey component
and low fuel loads. The open nature of the mallee stands induces limited mechanical reduction in wind
speed with height. The low fuel loads that characterise the Ngarkat mallee-heath fuel complexes limit the
depth and upward momentum of flames. The wind will overpower the buoyancy associated with the flames
and tilt them forward, maximizing heat transfer through advection and leading to rapid ignition of these
fuels. Observation of in-fire video (Kautz 1997) identifies flame contact arising from its turbulence as the
main mechanism driving the propagation of the flame front (Nelson and Adkins 1988, Cheney 1981).
The horizontal and vertical discontinuities that characterise the mallee-heath fuel complex induce sudden
changes in fire spread. As the fire transitions from a fuel strata or layer to another above, e.g., from the
surface fuel (litter, near-surface, elevated) to the overstorey stratum, rapid increases in rate of spread
and intensity were observed. This nonlinear characteristic of fire behaviour in mallee-heath fuels is largely
determined by wind speed. Fire behaviour in mallee fuels was also strongly related to fire dependent
dynamics such as crowning and spotting. Our data and observations suggest that the occurrence of these
two phenomena occurs through a positive feedback mechanism. Crowning generate a high density of short
range spotting activity that coalesce as the main flame front arrives. The deep flame front that ensues
generates the upward heat flux that allows for the sustainability of active crown fire propagation. The
nonlinearity associated with the presence of these mechanisms masks the effect of other fire environment
variables in fire behaviour.
None of the dead fuel moisture content measures were significantly correlated with rate of fire spread.
This can be partially accounted for the nonlinear processes determining overall fire spread and the heat
transfer efficiency associated with vertically oriented fuel beds. Analogous results were obtained by
McCaw (1997) in Western Australia mallee-heath. The effect of dead fuel moisture in other shrub fuel
complexes has been shown to be limited (Catchpole et al 1998, Vega et al. 2006).
Of all the fuel descriptors analysed only fuel load was found significant correlated with rate of fire spread.
The relationship between fuel load and rate of spread was negative, i.e., the lower the fuel load, the
higher the rate of spread. At first this relationship seems to be at odds with accepted fire behaviour
knowledge (e.g., McArthur 1967). In our dataset this inverse relationship emerges because a large
proportion of the fast spreading fires were in young mallee and heath fuels. The light fuel loads associated
with these fuel complexes allowed the ambient wind to tilt flames into the unburned fuels as described
before, maximizing heat transfer and resulting in fast spread rates. This fire spread mechanism is
analogous to what happens in other light fuel beds such as grasslands where the effect of fuel load has
been found not to be statistically significant (Cheney et al. 1993).
One of the difficulties of finding a significant effect of fuel variables in fire behaviour in mallee-heath fuel
types is because the fuels that are determining fire spread depend on fire behaviour itself. As fire
behaviour increases in intensity the fuel layer determining fire propagation will change (Cheney 1981). In
low intensity fires the flames travel on the litter and near-surface fuels; as fire intensity increases, the
flame front progressively involve and is determined by the elevated fuels and latter by the overstorey
canopy.
We compared our data with predictions of various models for semi-arid and/or shrubland fuels. We found
that in general fires in spinifex fuels would spread about 50% and 25% faster than in our mallee and heath
fuels, respectively. Models developed for mallee-heath in Western Australia (McCaw 1997) and other
shrubland fuels (see Catchpole et al. (1998) for fuel types considered) tended to underpredict the rate of

PROGRAM A :: REPORT NO. A.10.01
84
spread of our fires. This was considered to be indicative that for the same general weather conditions, our
fires spread faster than in those two fuel types. Simulations with McArthur Mk 5 Forest Fire Danger Meter
(McArthur 1973) and Cheney et al. (1998) grassland fire model produced very erroneous results,
highlighting the need to carefully choose adequate fire spread models to support fire management decision
making. Both these two models are not appropriate to predict fire behaviour in mallee-heath or other
shrublands fuels.
Flame dimensions
Measured (height and angle) and estimated (length) flame dimensions were found to be significantly
correlated with rate of fire spread and intensity, and dependent on wind speed and fuel moisture content
(excluding flame angle). No fuel structure parameter, either physical (e.g., load or height), or surrogate
(e.g., hazard or cover score) were found to be significantly related to flame characteristics. Heuristics
would suggest that fuel structure parameters such as fuelbed height and load have an effect on flame
characteristics. It is likely that the failure to find such an effect on the current study is because under the
burning conditions sustainable propagation occurs in mallee-heath fuels the effect of wind and fuel
moisture overshadows the effect of fuel parameters. Flames tended to be deep at the head of the fire but
shallow at the flanks. This highlighted to importance of wind speed in determining head fire behaviour and
the limits that fuel discontinuity put in flank- and back-fire spread. Flank fires were easily contained even
on the most intense of the experimental fires.
Residence time
In the discontinuous and heterogeneous fuel distribution that characterizes mallee-heath fuel complexes
residence time was found to vary markedly within a fire. For the most intensely sampled fire (Plot AS2,
n=33), residence time standard deviation was 69% of the mean. Higher residence times were associated
with mallee clumps where a well-defined and compacted litter layer is established as the stand matures
(see Bradstock and Gill 1994). The lower residence time values were measured in areas covered by heath
fuels. These fuels are typically fine and the cover is characterised as sparse, with low overall fuel loads
and bulk density. Residence time was found independent of fuel moisture content, wind speed and fire
behaviour characteristics as rate of fire spread and intensity. Residence time was found to be dependent
on fuel age, with significant higher values being observed in older fuels. Residence time in the younger
fuel complexes was found to average 18 and 20 seconds in heath and mallee respectively. These low
residence times might have ecological implications, as the length of the heat pulse might not be sufficient
to open seed capsules. To the best knowledge of the authors there are no published results quantifying the
heat required to open the seed capsules of the various obligated seeders common in Australian semi-arid
ecosystems. In the mature (21-year or older) mallee fuel complexes residence times averaged between 30
and 40 sec. These values occupy the lower range of residence time in shrubland fuels (Silvani and
Morandini 2009; Cruz et al., in preparation) and dry sclerophyll eucalypt forest (Gould et al. 2007).
Crowning
Some form of crown fire activity was found to be an ever-present feature of sustained fire propagation in
mallee stands. The flame structure required to provide the necessary propagating heat fluxes that sustain
surface fire propagation in-between mallee clumps would flare up and induce crown combustion upon
reaching the litter and hanging bark ribbons that accumulate under the canopy. Under moderate burning
conditions it was found that isolated crowning would not cause an increase in the overall fire spread rate
but it would produce a number of spot fires that would assist on breach areas devoid of fuel. Fires
classified as intermitent crown fires were characterised by high rates of spread and prolific spotting

PROGRAM A :: REPORT NO. A.10.01
85
activity. These three fire behaviour characteristics, crowning activity – high rate of spread – spotting
activity level, seem to be interdependent and occur simultaneously. As fire environment characteristics
such as wind speed and fuel dryness increase, fire behaviour intensity escalate with the outcomes of each
of these fire behaviour characteristics self-reinforcing the other two. This positive feedback mechanism
causes sudden, discrete jumps in rate of fire spread. The relationship between fire environments
characteristics, namely wind, and rate of spread is discontinuous, or stepped, as described by Cheney
(1981). The large effect of wind speed and the feed-back fire mechanisms were found to be the main
factors driving crowning activity. Fuel structure and fuel moisture were not found to be a significant
variable. This does not mean that these variables do not contribute to crowning. As an example, mallee
cover and hence the overstorey canopy bulk density should have an effect in sustaining crowning and
spotting mechanisms, but we were unable to identify this relationship. It is likely that the combination of
the wind effect/fire behaviour feed-back mechanisms and the small number of dependent crown fires
limited the scope of the statistical analysis in finding the effect of fuel structure variables.
Van Wagner (1977) considers a further class of crown fire activity, the independent crown fire. It was
theorized in such a fire the rate of spread was determined by the crown phase, almost independently of
the surface phase. Such level of fire activity has not been documented in conifer forests and ruled out as
a stable phenomenon (Albini and Stocks 1986). In eucalypt fuels it has been pointed out that crown fire
activity occurs only when aided by the heat flux supplied by the surface phase (Cheney 1983). In-fire video
collected on the most intense fires in mallee fuels show that the ignition of the canopy foliage occurs a
few seconds after flame contact. Even with flame angles of 33 - 45°, the ignition of the canopy fuels
occurred behind the leading edge of the surface phase.
Spotting
Spotting activity in our experimental fires ranged from isolated spot fire activity, with nil effect on rate of
spread, to frequent spot fire generation with concentration decreasing with distance from the flame front
(see Cheney and Bary 1969, Gould et al. 2007). Frequent to widespread spotting was restricted to mallee
stands. The stems of mallee species found on the study area had relatively long and fine ribbons of hanging
bark. Upon arrival of the highly turbulent flame front the bark ribbons would readily ignite and break into
multiple pieces that were transported forward. These constitute the main firebrand material in the
mallee fuels. Spotting activity in heath fuels was restricted to isolated spotting occurring within relative
small distances from the flame front (typically <10 m). We were unable to identify the typical firebrand
material responsible for spotting in the heath fuels. It is important to note that no heath fires were
conducted under the Very High Fire Danger conditions (i.e., FFDI>24) in which we observed widespread
spotting in mallee fuels.
In mallee fuels spotting activity was related to crowning activity but not with fuel moisture or wind speed.
Spotting activity had no effect in the overall fire rate of spread with the exception of the most intense
fires that had widespread spotting. In the isolated and frequent spotting activity classes the spot fires were
engulfed by the main flame front within the early stages of development of a point source fire. In these
conditions spotting was a relevant fire propagation process by allowing fire to breach areas devoid of fuel
such as fuelbreaks or roads. In-fire video analysis of the most intense fires reveals a shower of spot fires
occurring meters ahead of the main flame front. This band of rapid coalescing spot fires preceded the
flame front and appears to contribute to the overall rate of spread. The coalescing fires could cover 25%
of a strip 2-3 meters wide directly ahead of the main flame front, facilitating the ignition of unburned
fuels. The coalescing fires band also had an effect in enlarging the size of the upward heat flux source
responsible for the ignition of canopy fuels.
McCaw (1997) notes that spotting distances >100 m did not occur in a set of experimental fires in WA
mallee-heath. He pointed out that this result was likely the result of a small number of species with loose,

PROGRAM A :: REPORT NO. A.10.01
86
fibrous bark. Similarly, we did not observe spotting distances >60-80 meters in our experimental fires.
Nonetheless, analysis of the Ngarkat CP fire history reveals spot fire ignitions occurring several kilometres
ahead of the main fire front. Sandell et al. (2006) reported that in mallee wildfires most of the spotfires
falls within 1-km of a fire edge, but long range spotting can reach 5 km. The absence of larger spotting
distances in our higher intensity experimental fires is likely due to the limited development of the
convection plume above our fires. The buoyancy necessary to lift firebrands high enough to be transport
at long distances can not be achieved with fires at the scale of ours.
27B5.4. CONCLUDING REMARKS Fire behaviour addresses a number of observable, mutually dependent, fire characteristics that determine
the risk fire constitutes to human life and property, its effects on ecosystem components, and the
difficulty of control.
A set of 66 experimental fires were conducted in mallee-heath fuel complexes to quantify the relationship
between fire environment variables, fuels and fire behaviour, and the interdependencies between fire
behaviour characteristics.
Fire behaviour in mallee-heath fuel types is characterised as being highly discontinuous. We identified
three states of fire propagation potential. A lower state where a fire if ignited will self-extinguish, a
middle state where high intensity surface fire propagation will occur with the passive involvement of the
overstorey crown fuel layer, and a third state where a high intensity, fast spreading crown fire develops
with the assistance of short-distance, high density spotting processes. Surges between fire propagation
states can be caused by small variations in the environment conditions but lead to sudden and significant
changes in rate of fire spread and intensity. Drops between states have the inverse effect.
Fire behaviour in the two lower states was observed as being largely dependent on fuel moisture content
(largely determining fire sustainability) and wind speed (main control of fire rate of spread). The extent
that higher wind speeds can offset the effect of higher fuel moistures is limited to fuel moisture contents
up to 15%. For higher fuel moistures, although the increase in heat transfer efficiency associated with
higher winds allow the a recently ignited flame front to propagate forward, the lack of flank propagation
and fuel discontinuity lead to a rapid fragmentation of the flame front into ever increasing smaller
segments, followed by flame extinguishment. These fuel moisture thresholds should not be seen as
moisture of extinction. Marginal flame presence and smouldering combustion can occur in mallee clump
litter under higher fuel moisture contents.
The transition from the second state (high intensity surface fire / passive crown fire) to an active crown
fire required mature mallee fuels and moderate wind speeds (wind speeds >15 km/h). As the fire
transitions into this higher state the high density short-range spotting develops. Fire attains a pseudo
steady-state rate of fire spread that depends not only on weather conditions, but also on the
interdependence of high fireline intensity, crowning and spotting behaviour.
Modelling fire behaviour in mallee-heath fuel types will require a framework that considers transitional fire
behaviour, where fire propagation is associated with distinct fuel layers, and the specifics of the fire
propagation mechanisms in each state. Observation and statistical analysis indicates that the effect of
environment variables in fire spread depends on the fuel layer determining fire propagation. This
approach has been successful in modelling fire behaviour in other vertically discontinuous fuel complexes
such as pine plantations (Van Wagner 1993, Cruz et al. 2008).
PROGRAM A :: REPORT NO. A.10.01
87
7B6. FIRE MODELLING
28B6.1. INTRODUCTION Fire behaviour in discontinuous fuel complexes such as mallee-heath is markedly nonlinear with sudden
increases in rate of fire spread and intensity being associated with relatively small changes in environment
characteristics. Associated with this nonlinear dynamics is the establishment of a flame front being
supported by distinct fuel layers (litter and near-surface → elevated → overstorey). As the fire
transitions from a lower to a higher fuel strata, the increase in the amount of fuel involved in combustion
processes, exposure to stronger wind speeds and higher heat transfer efficiency creates a new pseudo-
steady state fire dynamics independent of the previous state.
The analysis in Chapter 5 highlighted three discrete fire states in mallee-heath fuel complexes: (1) failure
to develop a self-sustaining flame front; (2) high intensity surface fire with or without passive crown
involvement; and (3) active crown fire propagation. The sudden increases in fire rate of spread and
intensity that occur as the changes in environment conditions take the fire to a higher fire propagation
state has strong implications in fire fighting safety and fire management applications such as prescribed
burning. The ability to predict under which conditions these transitions will occur is crucial to support
prescribed burning operations.
An attempt to develop a fire behaviour prediction system for these fuels complexes require the modelling
of various fire behaviour properties, namely the onset of sustained surface fire propagation; the rate of
spread and intensity of a surface fire, ignition of overstorey fuels and the onset of active crown fire
propagation (see Gill et al. 1995; McCaw 1997). In addition, a number of fire behaviour auxiliary
properties (e.g., flame height and length, residence time) necessary to support fire management decision
making need also to be modelled. Fig. 6.1 depicts the modelling framework for the mallee-heath fire
behaviour prediction system to be followed in the present study. The process of predicting fire behaviour
in mallee-heath fuel complexes can be summarized as follows:
(1) Assess fuel complex structure and relevant meteorological variables;
(2) Calculate dead fuel moisture content and within stand wind speed (or 10-m open wind speed
depending on the model characteristics).
(3) Compute the probability of sustained surface fire propagation. If the probability is < 0.5, then it
is considered that a line ignition will self extinguished and alternative fuel complexes or lighting pattern
should be explored from step (1). If the probability of sustained propagation is > 0.5, then:
(4) Compute the probability of active crown fire propagation. If the probability is < 0.5, then the fire
is assumed to be spreading largely controlled by the surface phase and surface fire behaviour
characteristics (e.g., rate of fire spread, flame height, spotting activity) are estimated; If the probability is
> 0.5, then crown fire behaviour characteristics need to be estimated.

PROGRAM A :: REPORT NO. A.10.01
88
Figure 6.1. Mallee-heath fire behaviour prediction system flow diagram highlighting inputs
(parallelograms), intermediate calculations (rectangles), decisions (rhombus) and predicted fire
characteristics (rounded rectangle).
29B6.2. METHODS The basis of the current modelling is the available experimental fire behaviour dataset described in
Chapter 5. The main premise is that the dataset encompasses a relative wide variety of fuel and weather
conditions that allow for the modelling of fire behaviour without biasing the results to certain fuel
characteristics and fire environment factors.

PROGRAM A :: REPORT NO. A.10.01
89
The diverse fire processes and characteristics that need to be modelled require distinct modelling
approaches. For each specific fire process/characteristic the modelling approach we followed depended on
two considerations: (1) how well we understand the mechanisms driving the fire process/characteristic and
(2) how well the experimental dataset describes the range of conditions determining the fire
process/characteristic. The modelling approach can then range from fully empirical (poor understanding of
phenomena), a combination of physical insight and calibrating data or the use of existent fire behaviour
models.
53BSurface fire spread sustainability (go / no-go)
Given the binary nature of the dependent variable (i.e., the fire spreads or self-extinguishes), logistic
regression analysis was identified has an appropriate method to model fire sustainability. The multiple
logistic regression model has the following form (Hosmer and Lemeshow 2000, p. 31):
P yi =1( )=eg x( )
1+ eg x( ) (6.1)
being the logit given by the following equation:
( ) ii xxxxg ββββ ++++= ...22110 (6.2)
where P(yi = 1) is the probability that a sustained surface fire spread will occur, xi are the independent
variables, and βi are coefficients estimated through the maximum likelihood method.
The fire environment variables discussed in Chapter 5 were selected to test their influence in the proposed
model (see Table 5.1). Fuel type (mallee-heath vs. pure heath) was considered as a categorical variable
for modelling purposes. This variable entered the model as a design variable, D. The classes and the
design variable values were: Mallee-heath: D = 0; Pure heath: D = 1. Because the values of the design
variables are assumed to be nominally scaled the logit in Eq. 6.2 is changed to:
g x( )= β0 + β1x1 + ...+ βixi + β jD j (6.3)
where jth variable is the fuel type, and Dj the design variables.
The decision criteria, i.e., the probability threshold value that separates sustained from self-
extinguished fires, was considered to be 0.5. A prediction below this threshold is indicative of a self-
extinguishing fire. The interpretation of the probability outcomes should not follow a binary approach. This
is addressed in the results/discussion section.
The model was analysed through (1) the rationality of the explanatory variables, (2) the
significance of the regression coefficients, and (3) several statistical indicators characterizing model
performance.
54BRate of surface fire spread
Surface fire rate of spread data was collected in 23 self-sustained fires, 10 in heath and 13 in mallee fuels,
with well developed flame fronts (i.e., rate of spread > 1.5 m/min; flame height >1 m). Correlation
analysis between candidate independent variables was discussed in detail in Chapter 5. Modelling the rate
of spread of mallee-heath fires relied on least squares regression analysis. Both multiple (stepwise) and
nonlinear regression analysis methods were considered.

PROGRAM A :: REPORT NO. A.10.01
90
55BActive crown fire propagation
Analysis carried out in Chapter 5 indicates that as fireline intensity increases the onset of fire dependent
phenomena such as crowning and spotting leads to an increase in the overall rate of fire spread and
intensity. Predicting the behaviour of active crown fires in mallee stands requires determining the
environment conditions that will lead to this propagation regime and the associated rate of fire spread.
Modelling the onset of active crown fire spread follow the logistic regression modelling approach described
for surface fire spread sustainability. The modelling of the rate of spread of active crown fires relied on
least squares regression analysis as described for surface fire rate of spread. Restrictions imposed into
conducting experimental fires in mature mallee stands under the high fire spread potential that result in
active crown fire propagation limited the amount of data collected to only 4 fires. To complement this
reduced crown fire behaviour dataset we incorporated in the analysis three high intensity mallee-heath
experimental fires (plots D, G and J) conducted in the Stirlings National Park, Western Australia, and
described in McCaw (1997).
56BFlame height and length
The relationship between fireline intensity and flame dimensions is largely dependent on fuel complex
structure (Cheney 1990). A multitude of models exist to predict flame dimensions from environment
variables or fireline intensity (Alexander 1998). We considered two distinct approaches to describe flame
height and length for mallee-heath fuel complexes. The first alternative consisted in evaluating, and if
necessary parameterize, existing physical-based models. The second alternative was based on the
development of fuel complex specific fireline intensity – flame dimension models from our own dataset. It
is believe that the reliance on the physical based models will provide sounder modelling results, and
consequently with wider applicability than the fireline intensity – flame dimension models. Both
approaches were tested.
57BResidence time
Residence time, the duration of flaming combustion at a given point, is largely determined by fuel
particles characteristic dimension, available fuel load, fuelbed compactness and moisture content (Cheney
1981). The heterogeneous fuel distribution characteristic of mallee-heath fuel complexes results in a wide
range of residence times within a given fire. Our residence time measuring grid was not accompanied by
the estimation of specific fuel complex characteristics in the vicinity of each measuring location, making it
difficult to directly relate the measured residence time with fuel properties. This limits an empirical-
based modelling approach attempting to predict residence time from fuel structure and fire
characteristics. As per the flame height and length, we choose to use our data to evaluate the adequacy
of an existent model, in this case the Nelson (2003) residence time model. This model is based on a
simplified description of essential processes determining the thermo-chemical properties of flame gases,
heat transfer and combustion rates. Evaluation against laboratory data yield positive outcomes (Nelson
2003) but its applicability to outdoor fire data is unverified.
58BStatistical evaluation
Statistical evaluation of the logistic regression models relied on the Nagelkerke R2 and the likelihood ratio
index (Nagelkerke 1991) to assess goodness of fit. Discrimination capacity was evaluated through

PROGRAM A :: REPORT NO. A.10.01
91
specificity (correct classification of self-extinguished fires) and sensitivity (correct classification of
sustained fires).
The performance of the various rate of fire spread regression equations and flame characteristics models
was evaluated by inspection of residuals and using statistical measures of agreement between observed
and predicted values, including the linear trend between the two expressed in terms of the multiple
correlation coefficient (R2). The deviation statistics used to quantify model adequacy were the root mean
square error (RMSE), mean absolute error (MAE), mean absolute percent error (MA%E), and mean bias error
(MBE).
30B6.3. RESULTS AND DISCUSSION In developing a system to predict fire behaviour in mallee-heath fuel complexes we recognize that model
users in distinct situations will need to conduct fire behaviour potential assessments with different types of
available input variables. We identified two situations where models can be used. In one situation fire
behaviour predictions are conducted in the office based on weather station data or forecasted weather.
Both these sources will provide wind speeds measured at 10-m in the open as per World Meteorological
Organization standards. The other situation regards the use of the models in a field setting where wind
measurements are made at eye-level (~ 2m high) within the mallee-heath stand. To minimize errors that
are introduced into the process of predicting fire behaviour when open to within stand wind conversions
need to be made, we decided to develop two groups of models. One group relies on 10-m open wind
speed information and the other on wind speeds measured at eye-level.
In developing several of the fire behaviour models we could identify a number of fuel characteristics that
were significantly related to fire properties. The description of fuel complexes characteristics available to
fire behaviour model users will depend on the situation. Fuel information for a particular area might be
comprehensive, encompassing fuel layers height and cover, fuel loads and visual hazard scores, or
restricted to one or two fuel characteristics. To extend the applicability of the mallee-heath models in
supporting fire management decision-making, alternative models were developed where distinct fuel input
variables were used.
59BSurface fire spread sustainability (go / no-go)
Two groups of models were developed to predict fire sustainability, one based on 10-m open wind speeds
(U10) and the other relying on winds measured at 2-m within the stand (U2). For each group a baseline
model considering solely wind speed and suspended dead fuels moisture content was developed (Table 6.1
and 6.2). These simpler models yield higher Log likelihood and slightly lower fit then the models
incorporating fuel input variables. For the U2 models in Table 6.1 all fuel complex variables were
moderately significant (0.05 < p < 0.1). Near-surface fuel layer variables were found to be the most
influential fuel complex variables in explaining sustainable propagation. Fig. 6.2a illustrates the combined
effect wind speed and near-surface PCS on the likelihood of fire sustainability. Other relevant variables
were overstorey height and cover. These two variables exert a negative effect on fire sustainability. As the
mallee stand matures, e.g., grow tall and density increases, higher fire spread potential conditions are
necessary to sustain fire propagation. Overall fuel complex bulk density was also found to be a significant
variable. Goodness of fit statistics (Log L and Nagelkerke R2), specificity and sensitivity were comparable
between these models.
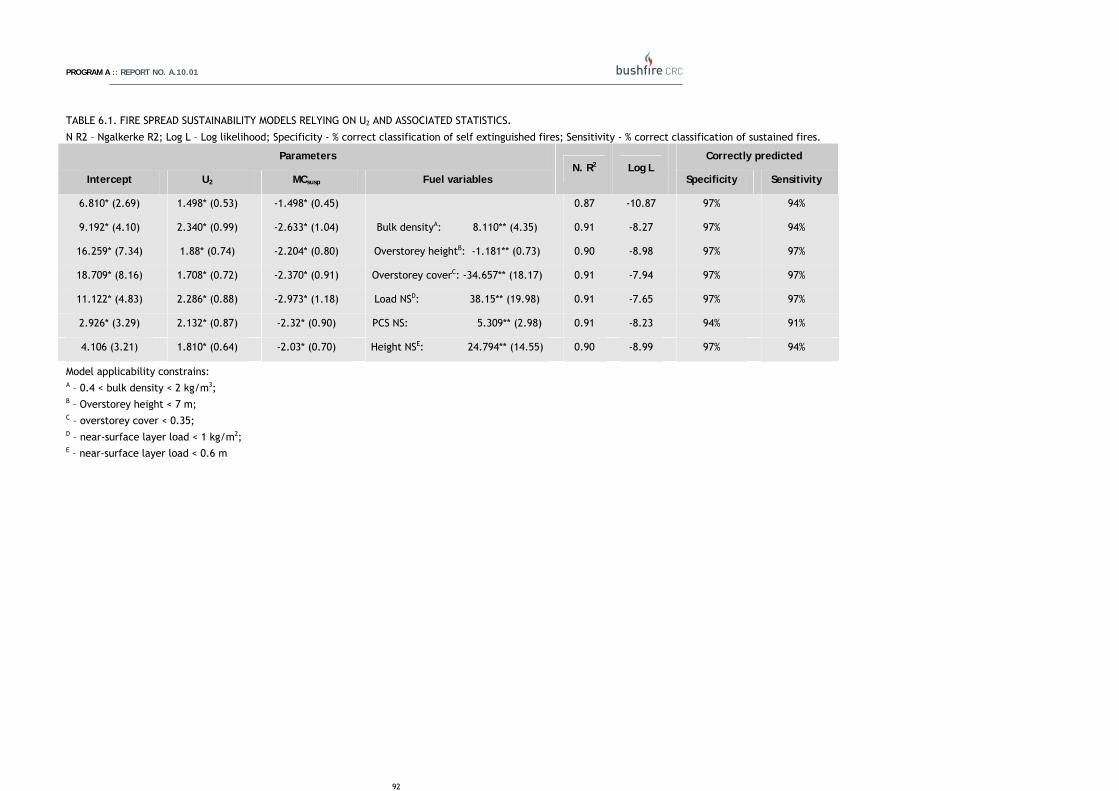
PROGRAM A :: REPORT NO. A.10.01
92
TABLE 6.1. FIRE SPREAD SUSTAINABILITY MODELS RELYING ON U2 AND ASSOCIATED STATISTICS. N R2 – Ngalkerke R2; Log L – Log likelihood; Specificity - % correct classification of self extinguished fires; Sensitivity - % correct classification of sustained fires.
Parameters Correctly predicted
Intercept U2 MCsusp Fuel variables N. R2 Log L
Specificity Sensitivity
6.810* (2.69) 1.498* (0.53) -1.498* (0.45) 0.87 -10.87 97% 94%
9.192* (4.10) 2.340* (0.99) -2.633* (1.04) Bulk densityA: 8.110** (4.35) 0.91 -8.27 97% 94%
16.259* (7.34) 1.88* (0.74) -2.204* (0.80) Overstorey heightB: -1.181** (0.73) 0.90 -8.98 97% 97%
18.709* (8.16) 1.708* (0.72) -2.370* (0.91) Overstorey coverC: -34.657** (18.17) 0.91 -7.94 97% 97%
11.122* (4.83) 2.286* (0.88) -2.973* (1.18) Load NSD: 38.15** (19.98) 0.91 -7.65 97% 97%
2.926* (3.29) 2.132* (0.87) -2.32* (0.90) PCS NS: 5.309** (2.98) 0.91 -8.23 94% 91%
4.106 (3.21) 1.810* (0.64) -2.03* (0.70) Height NSE: 24.794** (14.55) 0.90 -8.99 97% 94%
Model applicability constrains: A – 0.4 < bulk density < 2 kg/m3; B – Overstorey height < 7 m; C – overstorey cover < 0.35; D – near-surface layer load < 1 kg/m2; E – near-surface layer load < 0.6 m

PROGRAM A :: REPORT NO. A.10.01
93
TABLE 6.2. FIRE SPREAD SUSTAINABILITY MODELS RELYING ON U10 AND ASSOCIATED STATISTICS.
N R2 – Ngalkerke R2; Log L – Log likelihood; Specificity - % correct classification of self extinguished fires; Sensitivity - % correct classification of sustained fires.
Parameters Correctly predicted
Intercept Fuel type (heath) U10 MCsusp Fuel variables
N. R2 Log L
Specificity Sensitivity
8.097* (3.49) 7.642* (2.85) 0.618* (0.24) -1.70* (0.52) - 0.86 -11.48 97% 91%
20.007* (8.72) 8.675* (3.61) 0.780* (0.33) -2.519* (0.91) Overstorey height A : -1.541** (0.86) 0.90 -9.02 97% 94%
23.974* (10.10) 8.887* (4.18) 1.09* (0.49) -3.215* (1.28) Overstorey cover B : -51.432* (26.23) 0.91 -8.02 97% 94%
11.755* (5.18) 14.179* (5.57) 1.195* (0.55) -3.452* (1.31) Load NS C: 34.468** (18.12) 0.92 -7.00 97% 91%
0.673 (5.53) 24.251**(13.91) 2.361 (1.54) -5.500** (3.21) PCS NS: 13.097 (8.51) 0.94 -5.67 94% 94%
-0.055* (5.09) 11.180* (5.29) 1.188* (0.54) -2.705* (5.45) FHS NS: 5.445** (3.03) 0.90 -8.97 97% 94%
Model applicability constrains: A – Overstorey height < 7 m; B – overstorey cover < 0.35; C – near-surface layer load < 1 kg/m2;

PROGRAM A :: REPORT NO. A.10.01
94
Figure 6.2. Graphical comparison of the effect of input variables on the likelihood of sustained fire
propagation in mallee-heath fuels. (a) effect of 2-m wind speed and near-surface fuel layer PCS; (b) effect
of 10-m open wind speed, fuel type and near-surface fuel layer FHS. Suspended dead fuels moisture
content set at 11%.
Models relying on 10-m open wind speed as an input variable required the use of a design variable (D), fuel
type, that took the values: mallee (D = 0) or heath (D = 1). This variable was significant (p<0.05) for all
models but one (0.05 < p < 0.1). This is indicative of the different fire environment threshold conditions to
sustain fire propagation in mallee and heath fuel types. Mallee stands require drier/windier conditions to
achieve sustained fire propagation then heath shrublands (Fig. 6.2b). The effect of fuel moisture was
incorporated in the model through the use of suspended dead fuel moisture content. This variable was
found to better discriminate sustainable from self-extinguished fires then litter fuel moisture content. The
fuel complex variables with a significant effect on the onset of surface fire propagation were near-surface
fuel layer descriptors (load, PCS and FHS) and the overstorey structure (mallee cover and average height).
Goodness of fit statistics for the U10 based models were comparable to the U2 models. Nagelkerke R2
varied between 0.86 for the simplest model, that requires as inputs the fuel type, U10 and suspended dead
fuel moisture content, and 0.94 for the model that adds the effect of near-surface PCS to those three
variables. The models performed well at discriminating sustainable from self extinguishing fires in the
dataset. Specificity, the correct classification of self-extinguished fires varied between 94 and 97%,
whereas sensitivity, the correct classification of sustained fires, varied between 91 and 97.
Analysis of model parameters and behaviour provides insight into the mechanisms determining fire
sustainability in mallee-heath fuels. Examination of the various models parameters identifies fuel moisture
content as the main variable discriminating sustainable from self-extinguishing fires. This corroborates
McCaw (1997) research findings that identified the dryness of fine litter dead fuels as the strongest
influence on the likelihood of fire propagation in WA mallee-heath fuels. Noteworthy, our results gave fuel
moisture content of dead suspended fuels a higher explanatory power over litter fuels moisture content.
This disagreement between the two studies might arise from differences in the litter and near-surface fuel
layers characteristics of the two experimental sites. The significant control that dead fuel moisture
content exert on fire sustainability has been found in other fuel types (Beverly and Wotton 2007;
Fernandes et al. 2008)
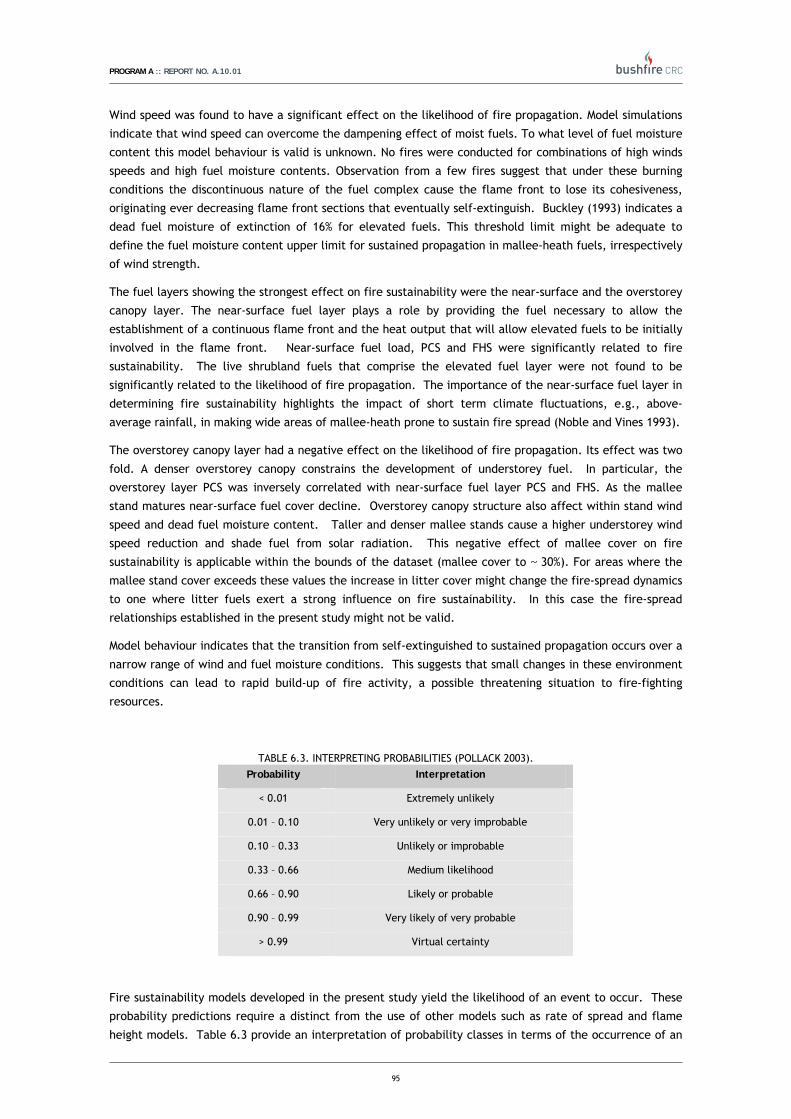
PROGRAM A :: REPORT NO. A.10.01
95
Wind speed was found to have a significant effect on the likelihood of fire propagation. Model simulations
indicate that wind speed can overcome the dampening effect of moist fuels. To what level of fuel moisture
content this model behaviour is valid is unknown. No fires were conducted for combinations of high winds
speeds and high fuel moisture contents. Observation from a few fires suggest that under these burning
conditions the discontinuous nature of the fuel complex cause the flame front to lose its cohesiveness,
originating ever decreasing flame front sections that eventually self-extinguish. Buckley (1993) indicates a
dead fuel moisture of extinction of 16% for elevated fuels. This threshold limit might be adequate to
define the fuel moisture content upper limit for sustained propagation in mallee-heath fuels, irrespectively
of wind strength.
The fuel layers showing the strongest effect on fire sustainability were the near-surface and the overstorey
canopy layer. The near-surface fuel layer plays a role by providing the fuel necessary to allow the
establishment of a continuous flame front and the heat output that will allow elevated fuels to be initially
involved in the flame front. Near-surface fuel load, PCS and FHS were significantly related to fire
sustainability. The live shrubland fuels that comprise the elevated fuel layer were not found to be
significantly related to the likelihood of fire propagation. The importance of the near-surface fuel layer in
determining fire sustainability highlights the impact of short term climate fluctuations, e.g., above-
average rainfall, in making wide areas of mallee-heath prone to sustain fire spread (Noble and Vines 1993).
The overstorey canopy layer had a negative effect on the likelihood of fire propagation. Its effect was two
fold. A denser overstorey canopy constrains the development of understorey fuel. In particular, the
overstorey layer PCS was inversely correlated with near-surface fuel layer PCS and FHS. As the mallee
stand matures near-surface fuel cover decline. Overstorey canopy structure also affect within stand wind
speed and dead fuel moisture content. Taller and denser mallee stands cause a higher understorey wind
speed reduction and shade fuel from solar radiation. This negative effect of mallee cover on fire
sustainability is applicable within the bounds of the dataset (mallee cover to ~ 30%). For areas where the
mallee stand cover exceeds these values the increase in litter cover might change the fire-spread dynamics
to one where litter fuels exert a strong influence on fire sustainability. In this case the fire-spread
relationships established in the present study might not be valid.
Model behaviour indicates that the transition from self-extinguished to sustained propagation occurs over a
narrow range of wind and fuel moisture conditions. This suggests that small changes in these environment
conditions can lead to rapid build-up of fire activity, a possible threatening situation to fire-fighting
resources.
TABLE 6.3. INTERPRETING PROBABILITIES (POLLACK 2003).
Probability Interpretation
< 0.01 Extremely unlikely
0.01 – 0.10 Very unlikely or very improbable
0.10 – 0.33 Unlikely or improbable
0.33 – 0.66 Medium likelihood
0.66 – 0.90 Likely or probable
0.90 – 0.99 Very likely of very probable
> 0.99 Virtual certainty
Fire sustainability models developed in the present study yield the likelihood of an event to occur. These
probability predictions require a distinct from the use of other models such as rate of spread and flame
height models. Table 6.3 provide an interpretation of probability classes in terms of the occurrence of an
PROGRAM A :: REPORT NO. A.10.01
96
event. Probabilities lower than 0.1 and higher than 0.9 are strong indicators respectively of failure to
spread and sustainable propagation. The medium likelihood class (0.33 – 0.66) can be seen as a class where
uncertainty regarding whether a fire will sustain propagation is highest.
Ignition method and pattern is known to have an impact on fire sustainability in marginal burning
conditions (Tolhurst and Cheney 1999). Our study did not consider ignition method/pattern as a variable.
All fires were initiated with a line ignition using handheld drip torches. Variation in the ignition method,
e.g., point, short segments or perimeter ignition, will give fire managers a further control over the
likelihood of fire propagation. The extent that the use of a stronger ignition method, flame thrower or
mass ignition will increase the likelihood that fire will spread under conditions that the models indicate
failure to do so also depends on fuel structure. Mature fuels, e.g., with a larger mallee overstorey
component, are expected to be necessary to build up the energy release required to maintain the
momentum that will allow fire to spread under relatively marginal conditions. As such, managers can
increase the likelihood of successful burn when model predictions are within the improbable or medium
likelihood by using ignition patterns (e.g., mass ignition or perimeter ignition) that maximize fire build-up
and development.
The fire sustainability models developed in this study are based on a dataset covering a limited range of
fuel complex structures. The analysis showed that the effect of fuel age in fire behaviour is not linear. As
mallee stands mature, competition constrain the extent (e.g., cover) of the near-surface and elevated fuel
layers. In some scenarios fuel characteristics will significantly depart from the fuels sampled in the
present study. As an example, the near-surface fuel layer can dramatically expand after abundant spring
rainfalls (Noble and Vines 1993). The higher fuel continuity that arises from this situation can have an
impact on fire sustainability that is not captured in the simplified models. Use of the models should be
should be preceded by an analysis of how a particular simulation scenario fits the model application
bounds (Gill et al. 1995). Interpretation of model results should consider the uncertainty that arise from
applying the model under conditions not, or only marginally, covered in the dataset upon the model is
built.
The present study emphasis was on fire behaviour in mallee-heath fuels with a minor spinifex component
(cover < 3%). Mallee-spinifex associations were not included in the present study. The surface fuel
stratum (litter, near-surface and elevated layers) of mallee-spinifex fuel complexes departs considerably
from the mallee-heath fuels used to develop our fire sustainability models. It is unknown how the models
developed in this study would perform in mallee-spinifex fuel complexes. Other models exist that might be
more appropriate. Burrows et al. (2009) develop a fire sustainability model for WA spinifex grassland that
relies on the effect of wind speed, hummock moisture content and fuel load or fuel cover and height.
Although this model consider spinifex stands without a overstorey component, its application taking into
account eye-level wind speeds might yield a better fit to mallee-spinifex fuel types then adapting the
mallee-heath models.
60BRate of surface fire spread
Exploratory analysis of surface fire spread data and preliminary modelling attempts indicate that fire
spread rate responds to changes in weather and fuel variables distinctly in mallee and heath fuels types.
From this we decided to separate the fire spread datasets and model rate of fire spread for each fuel type
independently. The rate of spread dataset comprised 10 fire in heath and 13 in mallee fuels. This can be
seen as an restricted dataset to attempt to develop an empirical based fire spread model for each fuel
type. Modelling attempts base on linear regression analysis, with or without logarithmic transformed
variables, failed to identify wind speed (typically p > 0.2) and fuel moisture content (typically p > 0.2) as
significant predictors of rate of fire spread. Mean absolute percent errors (MA%E) were larger then 70%.
Nonlinear regression analysis assuming wind speed effect to follow a power function and dead fuel

PROGRAM A :: REPORT NO. A.10.01
97
moisture content a exponential decay function produce sensible (i.e., within the range of previous
comparable modelling approaches) but non significant parameters. These outcomes arise from the limited
size of the dataset, the variability of fire behaviour in mallee-heath fuel types and lack of orthogonality.
To overcome this limitation we decided to model fire spread by constraining the effect of wind speed and
fuel moisture content through predetermined functions, and then find the effect of fuel complex variables
through least squares analysis. Previous fire behaviour research results in shrubland (McCaw 1997;
Fernandes et al. 2000, Catchpole et al. 2002) and other fuel types (Cheney et al. 1998; Cruz et al. 2005)
were used as guidance for functional relationships.
We assumed wind speed to affect fire spread through a power function (R ∝ Ub) with an exponent of 1.1 –
1.2. Dead fuel moisture was assumed to exert an exponential decay effect (R∝ exp-c×MC) with a coefficient
of -0.11. We then tested for the effect of fuel complex characteristics. Various candidate equation forms
were evaluated to describe the effect of a fuel function (χF). The best results were obtained for a power
function of the form:
ΦF = β0 ⋅ xFβ1 (6.4)
where χF is a fuel variable and β0 and β1 are regression constants determined through least squares
methods.
For each fuel type, heath or mallee, two groups of models were developed based on the wind measuring
height to be used as input. Tables 6.4 and 6.5 presents the two model families for heath fuels. The height
of the surface layer, integrating the near-surface and elevated fuels, produced the best fit for both U2 and
U10 models. The model incorporating this variable explained 93% of the variation in the dataset, yielding a
mean absolute percent error of 38%. Two models based on elevated fuel layer FHS and PCS yield
moderately significant parameters (0.5 < p < 0.1). These models had lower R2 (0.86) and a mean absolute
error of 51%. All models had a slight underprediction bias around -1m/min. In relative terms, these biases
were 5% of the observed average rate of fire spread prediction.
TABLE 6.4. PARAMETER VALUES AND MODEL FIT STATISTICS FOR HEATH RATE OF SPREAD MODEL BASED ON FIXED 2- M
WIND (1.2) AND FUEL MOISTURE (-0.11) PARAMETERS.
Model form: RH = β0 ⋅U21.2 ⋅ Exp(−0.11⋅ MCsusp ) ⋅ xF
β1 xF – fuel parameter; R2 – Coefficient of determination; Adj. R2 – Adjusted coefficient of determination. RMSE – root mean square error.
MAE – mean absolute error. MA%E – mean absolute percent error. MBE – mean bias error.
Fuel characteristic Parameters Statistics
β0 β1 R2 Adj. R2 RMSE MAE MA%E MBE
FHS elevated 2.455* (0.85) 0.899** (0.46) 0.86 0.82 10.91 9.02 51 -1.06
PCS elevated 2.455* (0.85) 0.90** (0.46) 0.86 0.82 10.91 9.02 51 -1.06
TABLE 6.5. PARAMETER VALUES AND MODEL FIT STATISTICS FOR HEATH RATE OF SPREAD MODEL BASED ON FIXED 10-M
OPEN WIND (1.2) AND FUEL MOISTURE (-0.11) PARAMETERS.
Model form: RH = β0 ⋅U101.2 ⋅ Exp(−0.11⋅ MCsusp ) ⋅ xF
β1 xF – fuel parameter; RMSE – root mean square error. MAE – mean absolute error. MA%E – mean absolute percent error. MBE – mean
bias error.
Fuel characteristic Parameters Statistics
β0 β1 R2 Adj. R2 RMSE MAE MA%E MBE
Fuelbed volume A 0.793 (0.65) -1.129 (0.67) 0.81 0.76 9.96 7.82 45 -1.36
PCS elevated 1.399* (0.62) 1.156** (0.56) 0.82 0.78 10.71 9.53 52 -0.41 Model applicability constrains: A – Fuelbed volume (fuel cover x fuel height) < 1.5 m.

PROGRAM A :: REPORT NO. A.10.01
98
Model fits for rate of surface fire spread in heath fuels based on U10 were comparable to the U2 models
(Fig. 6.3a and b). The best fit for the 10-m open wind speed models relied on elevated fuel layer PCS as
input variable, explaining 78% of the variation in the original dataset with a MA%E of 52%. Similar statistics
were obtained by using fuelbed volume as a predictor. Bias was negligible in these models (between 2 and
6% of the mean observed value).
Models for fire rate of spread in mallee stands relied on a fuel function that incorporates two variables, an
understorey fuel layer variable and a mallee overstorey descriptor. Two models based on eye-level wind
speed inputs were developed (Table 6.6). Significant fuel predictors were overstorey height, elevated fuel
layer FHS and FSC. The two models produced comparable statistics, with similar Adjusted R2 and mean
error. The underprediction bias averaged 7.5% of the mean observed rate of spread. Models relying on the
10-m open wind speed (Table 6.6) produced better fit then the eye-level wind based models (Fig. 6.4.a
and b). Four models were developed with mallee overstorey height being a common variable to all models.
Understorey variables found to be significant predictors of surface fire rate of spread were fuel cover, FCS,
and elevated fuel layer FHS and PCS. Adjusted R2 varied between 0.87 and 0.94. These models produced
relatively low MA%E, varying between 30 and 32%, and no definite bias trend (bias varied between -0.15 to
0.99 m/min, respectively 1 and 5% of the mean observed rate of spread.
TABLE 6.6. PARAMETER VALUES AND MODEL FIT STATISTICS FOR MALLEE RATE OF SPREAD MODELS BASED ON FIXED 2- M
WIND (1.1) AND FUEL MOISTURE (-0.11) PARAMETERS.
Model form: RM = β0 ⋅U21.1 ⋅ Exp(−0.11⋅ MCsusp ) ⋅ xF1
β1 ⋅ xF 2β 2
xF1 and xF2 – fuel parameters; R2 – Coefficient of determination; Adj. R2 – Adjusted coefficient of determination. RMSE – root mean square error. MAE – mean absolute error. MA%E – mean absolute percent error. MBE – mean bias error.
Parameters Statistics
β0 β1 β2 R2 Adj. R2 RMSE MAE MA%E MBE
6.675** (3.20) FHS elevated
1.281** (0.66)
OS height A
-0.715 (0.41) 0.85 0.80 9.3 7.01 35 -1.83
2.053 (1.89) FSC
0.951** (0.45)
OS height A
-0.973** (0.50) 0.85 0.81 8.33 6.65 36 -1.41
Model applicability constrains: A – overstorey height < 7 m.
TABLE 6.7. PARAMETER VALUES AND MODEL FIT STATISTICS FOR MALLEE RATE OF SPREAD MODELS BASED ON FIXED 10-M
OPEN WIND (1.1) AND FUEL MOISTURE (-0.11) PARAMETERS.
Model form: RM = β0 ⋅U101.1 ⋅ Exp(−0.11⋅ MCsusp ) ⋅ xF1
β1 ⋅ xF 2β 2
xF1 and xF2– fuel parameters; R2 – Coefficient of determination; Adj. R2 – Adjusted coefficient of determination. RMSE – root mean square error. MAE – mean absolute error. MA%E – mean absolute percent error. MBE – mean bias error.
Parameters Statistics
β0 β1 β2 R2 Adj. R2 RMSE MAE MA%E MBE
131.901 (97.71) Fuel cover A
4.572* (1.11)
OS height B
-1.871* (0.49)
0.92 0.89 7.79 5.55 32 0.99
0.408 (0.24) FCS
1.771* (0.30)
OS height
-2.092* (0.40)
0.94 0.92 5.62 4.17 32 0.87
1.448* (0.60) PCS elevated
4.148* (0.83)
OS height
-1.416* (0.32)
0.93 0.91 6.69 5.1 30 -0.15
3.318* (1.31) FHS elevated
2.059* (0.529)
OS height
-1.271* (0.38)
0.90 0.87 8.16 6.14 31 -0.48
Model applicability constrains: A – fuel cover < 0.75; B – overstorey height < 7 m.

PROGRAM A :: REPORT NO. A.10.01
99
Figure 6.3. Predicted versus observed rates of surface fire spread in heath fuels. (a) prediction based on
model incorporating 2-m wind speed, moisture content of dead suspended fuels and elevated fuel layer
FHS. (b) prediction based on model incorporating 10-m open wind speed, moisture content of dead
suspended fuels and elevated fuel layer PCS.
Figure 6.4. Predicted versus observed rates of surface fire spread in mallee fuels. (a) prediction based on
model incorporating 2-m wind speed, moisture content of dead suspended fuels and elevated fuel layer
FHS. (b) prediction based on model incorporating 10-m open wind speed, moisture content of dead
suspended fuels and elevated fuel layer FHS.
The elevated fuel layer was found to be most related to the rate of fire spread. Of the 10 alternative of
surface fire rate of spread models developed seven were directly dependent on elevated fuel layer
characteristics. The use of fuel characteristics surrogates such as PCS, FHS and FCS (Gould et al. 2007)
yield better results then physical fuel descriptors such as fuel load, height or bulk density. This is possibly

PROGRAM A :: REPORT NO. A.10.01
100
because the visual hazard score assessments allow to integrate a number of fuel characteristics into a
single number whereas each one of the physical fuel descriptors only quantify one specific aspect of the
fuel structure. The height of the elevated layer and surface fuel stratum were found to be the best
predictors of rate of fire spread in both heath and mallee. Nonetheless, the least square analysis yield a
large effect of these variables possibly due the dataset limitation mentioned above. These models gave
what was believed unreasonable results when simulations were conducted in fuel complexes with taller
shrub layers than the ones found in the experimental area. Due to the possibility of producing highly
erroneous results when the models were used in these situations we removed these models from the
analysis.
BOX. 6.1. ACCURACY OF FIRE SPREAD MODELS
Models are simplified representations of real phenomenon and error is an inherent part of its
behaviour. How accurate should fire spread models be? No clear statement based on the required
accuracy for fire spread models has been put forward by the fire management and research
communities. Part of this is because such definition of acceptable error depends on the values at risk
and user requirements (Andrews 1980, and Alexander and Cruz 2006). Independently of their
limitations and associated errors, fire behaviour models have been shown to be of great value in
planning prescribed burn operations and supporting fire suppression decision making (Andrews et al.
2007).
How accurate are fire spread models? The statistics in Tables B6.1 and 2 can be seen as indicative of
the uncertainty in predicting fire rate of spread with current models. The results suggest that a mean
absolute percent error in the range of 25 to 50% is the best that can be achieved in fire behaviour
estimation. Given adequate description of fuels and weather conditions this is the level of uncertainty
that users should expect from current fire spread models.
TABLE B6.1. MODEL EVALUATION STATISTICS FOR STUDIES EVALUATING FIRE BEHAVIOUR MODELS WITH INDEPENDENT
DATA FROM EXPERIMENTAL AND/OR PRESCRIBED FIRES.
Study Range in rate of fire spread
(m/min) RMSE
MAE
(m/min) MA%E (%)
% within
+/-25% error
Experimental and/or prescribed fires
[1] 1.1 – 8.7 0.93 0.79 27 67
[2] 0.9 – 150.9 17.9 13 22 73
[3] 1.9 – 14.2 1.78 1.5 26 42
[4] 2.4 – 53.4 7.18 6.17 30 57
[5] 22.3 – 70.1 14.5 11.4 35 50
[6] 0.2 – 61.0 10.8 3.4 53 38
[7] 0.2 – 4.5 0.903 0.59 57 44
[8] 3.35 – 15.8 5.9 5.2 79 18
[9] 2.5 – 60.1 10.1 8.4 86 30
Wildfire case studies
[10] 66.7 – 383.3 60 51.4 33 33
[11] 10.7 - 107 19.2 14.6 49 47
[12] 13.7 – 80.5 18.2 15.7 61 36
[1] - Marsden-Smedley and Catchpole (1995); [2] - Hefner data in Rothermel and Rinehart 1983); [3] - Hough and
Albini (1978); [4] - Van Wilgen et al. (1985); [5] - Cruz et al. (2005) against ICFME data (Stocks et al. 2004); [6] -
Sneeuwjagt and Frandsen (1977); [7] - Bevins data in Rothermel and Rinehart 1983); [8] - Cruz et al. (2005) for
passive crown fires; [9] - Van Wilgen and Wills (1988); [10] - Cheney et al. (1998); [11] -Alexander and Cruz (2006)
Canadian wildfires; [12] - Alexander and Cruz (2006) US wildfires.

PROGRAM A :: REPORT NO. A.10.01
101
Overstorey height was the other fuel complex variable with a strong effect on the rate of fire spread in
mallee stands. This variable was inversely related with fire rate of spread, i.e., the taller the stands, the
slower the fire would spread. This effect is applicable to burning conditions where fire spread is driven by
the surface fuel stratum. In this case the mallee overstorey component determine the wind profile
attenuation and understorey dead fuel moisture content. As the fire transitions from a surface fire or
passive crown fire into an active crown fire this effect is no longer present (see Crown fire behaviour
section bellow).
The rate of spread models yield mean absolute percent errors between 45 to 52% for heath and 30 to 36%
for mallee fuels. These errors are relatively large, particularly for the heath fuels, but within the range of
mean absolute percent errors obtained in other fire behaviour modelling studies (Box 6.1). It is interesting
to note that the highest error is associated with the simplest fuel type, heath. The extent of these errors
might be attributable to the variability in fire spread that characterizes fire behaviour in these fuel types.
The detailed measurement of fire rate of spread in seven of the experimental fires revealed large
variability. The ratio between maximum and average measured rate of spread varied between 1.8 and 5.9,
with the standard deviation averaging 104% of the mean, i.e., for these fires the standard deviation was
almost identical to the mean rate of spread. This level of fire spread variability is larger then observed in
grassland fires (Cheney and Gould 1995) and surface and crown fires in conifer forests (Taylor et al. 2004;
McRae et al. 2005). It is unknown the reason for the level of unsteady fire behaviour observed in our
experimental fires. It might result from fuel heterogeneity, openness of the fuel complex to wind speed
and the turbulent conditions under which the most intense burns were carried out. The implication of this
fire spread variability is that sampling fire spread in mallee heath fuels might require longer runs then the
ones used in the current study (between 100 and 400 m) to estimate the average rate of spread
representative of a given set of burning conditions.
61BCrown fire behaviour
The involvement of mallee canopy fuels in combustion processes is a common feature of fire spread in
mallee fuel complexes. This arises due to a combination of factors: relatively high rates of spread and
intensity necessary to sustain coherent flame front in the heterogeneous fuel complex; low canopy base
height, varying typically between 2 and 4 meters; high amount of litter and ladder fuel under canopy
clumps (Bradstock and Gill 1993); and the presence of ladder fuel layer comprising hanging bark strips and
dead branches under the mallee canopy. Some kind of crown fire activity was observed in all sustained
fires and also in some self-extinguished ones.
Modelling crown fire behaviour focused in describing the conditions that would allow an active crown fire
to propagate and its associated rate of fire spread. The likelihood of active crown fire occurrence was
modelled through logistic regression analysis. An univariate logistic model relying on 10-m open wind speed
(Fig. 6.5a) produced a Negalkerke R2 of 0.78 and predicted correctly 92% of the surface fires and 71% of
the crown fires, for an overall accuracy of 85% (Table 6.8). The use of other possible fire environment and
behaviour characteristics as explanatory variables, namely fuel moisture content, fuel characteristics or
fireline intensity did not result in an improvement of model fit. The model in Table 6.8 is applicable to
mature mallee stands with cover approximating or larger then 20% and when suspended fuel moisture
contents are below 8%. Under this conditions active crown fire propagation is likely to occur when 10-m
open wind speeds are higher then 20 km/h.
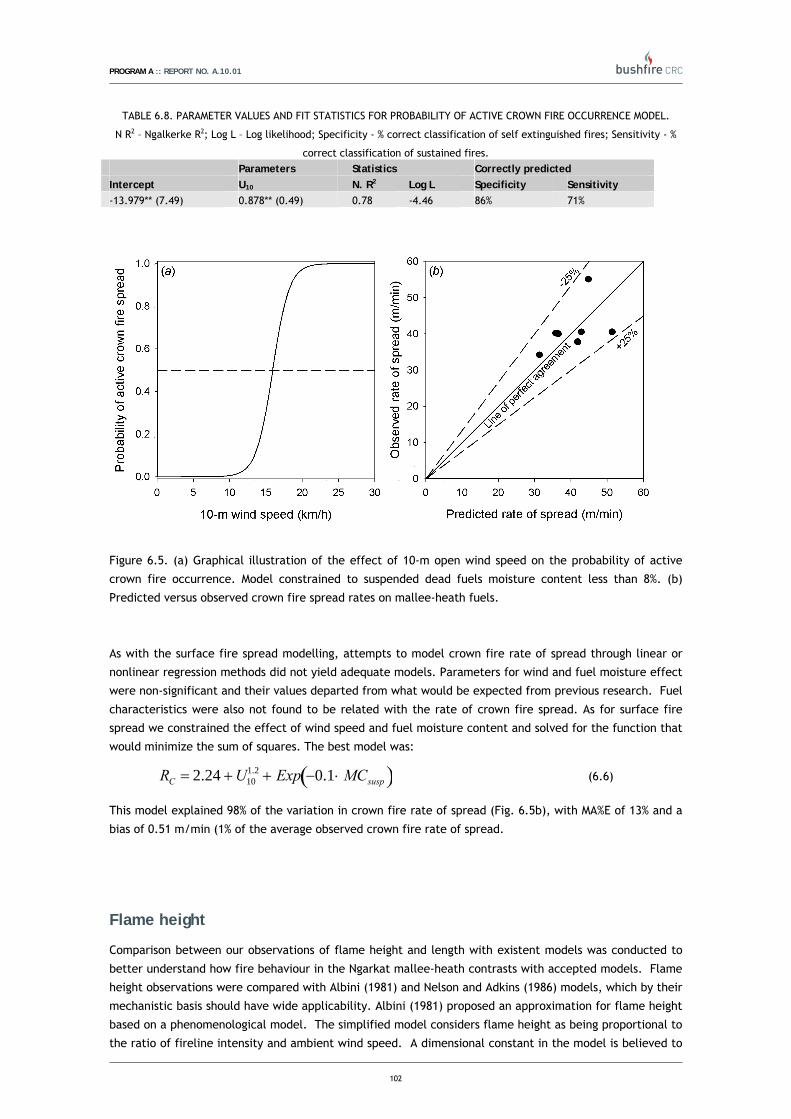
PROGRAM A :: REPORT NO. A.10.01
102
TABLE 6.8. PARAMETER VALUES AND FIT STATISTICS FOR PROBABILITY OF ACTIVE CROWN FIRE OCCURRENCE MODEL.
N R2 – Ngalkerke R2; Log L – Log likelihood; Specificity - % correct classification of self extinguished fires; Sensitivity - %
correct classification of sustained fires. Parameters Statistics Correctly predicted Intercept U10 N. R2 Log L Specificity Sensitivity -13.979** (7.49) 0.878** (0.49) 0.78 -4.46 86% 71%
Figure 6.5. (a) Graphical illustration of the effect of 10-m open wind speed on the probability of active
crown fire occurrence. Model constrained to suspended dead fuels moisture content less than 8%. (b)
Predicted versus observed crown fire spread rates on mallee-heath fuels.
As with the surface fire spread modelling, attempts to model crown fire rate of spread through linear or
nonlinear regression methods did not yield adequate models. Parameters for wind and fuel moisture effect
were non-significant and their values departed from what would be expected from previous research. Fuel
characteristics were also not found to be related with the rate of crown fire spread. As for surface fire
spread we constrained the effect of wind speed and fuel moisture content and solved for the function that
would minimize the sum of squares. The best model was:
RC = 2.24 + U101.2 + Exp −0.1⋅ MCsusp( ) (6.6)
This model explained 98% of the variation in crown fire rate of spread (Fig. 6.5b), with MA%E of 13% and a
bias of 0.51 m/min (1% of the average observed crown fire rate of spread.
62BFlame height
Comparison between our observations of flame height and length with existent models was conducted to
better understand how fire behaviour in the Ngarkat mallee-heath contrasts with accepted models. Flame
height observations were compared with Albini (1981) and Nelson and Adkins (1986) models, which by their
mechanistic basis should have wide applicability. Albini (1981) proposed an approximation for flame height
based on a phenomenological model. The simplified model considers flame height as being proportional to
the ratio of fireline intensity and ambient wind speed. A dimensional constant in the model is believed to

PROGRAM A :: REPORT NO. A.10.01
103
be dependent on fuelbed characteristics. Albini and Stocks (1986) estimated it as 0.005 m3/kJ for a set of
crown fires in young pine plantations (Albini 1996). Nelson and Adkins (1986) proposed a slightly lower
constant, 0.0028 m3/kJ, based on the analysis of flame data measured of laboratory and field experimental
fires.
Flame height was measured considering the base of the flame to coincide with the ground. Theory
considers that it is above the fuelbed that mixing of the fuel volatiles with air will approach an optimum,
and the rate of thermal energy release is higher. Mechanistic models are based on this assumption and
consider flame height as being measured from the top of the fuelbed (e.g. Thomas and Scott 1963, Albini
1981, Alexander 1982). Taking this into account, we added the average fuel bed height to the modelled
flame height to obtain a value consistent with our observations.
Albini’s (1981) model tended to overpredict (mean bias error of -0.83 m) the observed flame heights (Fig.
6.6a). Nelson and Adkins (1986) parameterization yield good predictions of the observed flame heights
(Fig. 6.6a) with a mean absolute percent error of 39%, albeit with a slight under prediction bias of 0.3 m
(Table 6.9). The simulations validate the soundness of Albini (1981) theory. These results suggest that for
mallee-heath fuels the model constant should be somewhat between what was found for crown fires
(0.005, Albini and Stocks (1986) and moderate intensity surface fires (0.0028, Nelson and Adkins 1986).
Flame length data was compared with Byram (1959) and McCaw (1997) models. Byram’s (1959) proposed a
relationship between flame length and fireline intensity (Table 6.9). This relationship is nonetheless
depended on fuel structure (Cheney 1990) and a large number of parameterisations of the original
equation exist for different fuel types (Alexander 1998). McCaw (1997) develop a flame length model for
mallee heath stands structurally similar to the 19-year old mallee found in our study. This model (Table
6.9) relies on a linear relationship found by McCaw between rate of spread and flame height.
Figure 6.6. Observed vs predicted (a) flame height and (b) flame length for mallee-heath experimental
fires.
The direct application of Byram’s (1959) flame length model to our data yields acceptable results for
observed flame lengths < 4 m, and an underprediction bias for longer flames (Fig. 6.6b). All flames with
length larger then 4 m were underpredicted, with the level of error increasing with observed flame length.
Byram’s points out that for high-intensity crown fires the model will underpredict because much of the
fuel is within the canopy space. He suggests a simple correction by adding one half of the mean stand
height to the model output. Application of such correction to the data would correct the underprediction

PROGRAM A :: REPORT NO. A.10.01
104
bias evident for the high intensity fires. Byram’s model predictions had a lower error and bias then McCaw
(1997) model. The application of the WA mallee flame model to Ngarkat mallee and heath fuels yield an
mean absolute error of 81%, and a overprediction bias of 1.74 m.
TABLE 6.9. EVALUATION STATISTICS FOR FLAME HEIGHT (FH) AND LENGTH MODELS (FL) APPLIED TO MALLEE-HEATH FIRES.
RMSE – root mean square error. MAE – mean absolute error. MA%E – mean absolute percent error. MBE – mean bias error.
Model Source: RMSE MAE MA%E MBE
FH =0.005 ⋅ IB
U
Albini (1981) 1.2 0.93 53.9 -0.83
FH =0.0028 ⋅ IB
U
Nelson and Adkins (1986) 1.01 0.81 39 0.32
FL = 0.775 ⋅ IB0.46
Byram (1959) 2.12 1.45 45.6 0.27
FL = 0.53 +13.06 ⋅ R McCaw (1997) 3.27 2.4 81.4 -1.74
Comparison of measured flame heights with outputs from simplified physically based flame height models
indicated general agreement between observations and predictions. Overall average absolute errors were
below 1 meter. This can be seen as a tolerable error for fire management applications given the transient
nature of flames and the difficulty in visually estimating flame heights. Byram’s (1959) flame height model
predicted adequately flame lengths lower then 5-6 meters. For longer flames, typically crown fire flames
the model underpredicted flame lengths if a correction for canopy height was not introduced. Byram
(1959) suggest adding one half of the stand height to the prediction of flame lengths in crown fires. The
use of this rule of thumb removes the underprediction bias observed for the higher intensity fires in our
evaluation.
63BResidence time
The use of averaged plot level fuel structural descriptions limited the evaluation of Nelson (2003)
residence time model. We could not evaluate the residence time model based on the individual
measurements, as we did not characterize fuel structure at each residence time measurement location.
Evaluation of Nelson (2003) residence time model against the average plot level mallee – heath data reveal
a large uncertainty (Fig. 6.7). The predicted residence time values were well within the range of variation
found in the experimental fires. The mean absolute error was 11.8 sec, 40% of the mean observed
residence time. No bias was observed (MBE = 2 sec). A regression of predicted vs. observed residence time
values was not significant, resulting on a coefficient of determination of 0.05. This is indicative of a lack
of relationship between observed and predicted values.

PROGRAM A :: REPORT NO. A.10.01
105
Figure 6.7. Observed vs predicted residence time for mallee-heath fuel complexes.
Evaluation of Nelson (2003) residence time model revealed a low overall error but a poor fit the observed
mallee-heath experimental data. We were not able to evaluate other models (e.g., Anderson 1969,
Burrows (2001). These models rely on the input of an effective fuel particle diameter or surface area to
volume ratio. The high diversity of species in the Ngarkat CP mallee – heath fuel types made it impractical
to conduct such detailed structural measurements.
From the limited evaluation of existent models and the variability in flame residence time within a fire
mallee-heath fuels it is unclear if the use of existent models will be an advance over considering the
average residence time data per fuel type/age given in Table 5.17. These average values provide first
approximation to residence time as a function of age in semi-arid mallee and heath fuel types and might
suffice for current fuel management applications.
31B6.4. CONCLUDING REMARKS Fire behaviour in semi-arid mallee-heath fuels is characterized by non-linear behaviour, i.e., abrupt
changes in fire behaviour, and high variability. Fuel complex heterogeneity, namely lack of horizontal and
vertical continuity, dominates this fire dynamics. Sudden changes in fire characteristics occur when the
burning conditions meet the minimum threshold for fire spread in a given fuel layer. At a first stage of fire
propagation this occurs when the environment conditions allow the development of a flame front that is
able to overcome horizontal discontinuity in the surface fuel stratum. This allows for the spread of a
surface fire. If the potential for high intensity fire increases, the surface fire flame front will transition
into the canopy layer. If conditions are such to allow the combustion outputs of the canopy layer to
dominate fire propagation, an active crown fire develop. Each of these transitions causes sudden increases
in fireline intensity and rate of fire spread. To encompass this dynamics a model system was developed to
predict fire behaviour in mallee-heath fuel types. The system describes the likelihood that a sustained fire

PROGRAM A :: REPORT NO. A.10.01
106
will occur, what type of fire spread (surface vs. crown) will ensue, its rate of fire spread and associated
flame characteristics. A number of models with distinct inputs were developed to address each of these
fire propagation aspects. This allows model users greater flexibility in model usage. Users can select the
most appropriate, or available, inputs for a given situation. Optional variables include the choice between
use of 10-m open wind speed or within stand, 2-m wind speed. The likelihood of sustained fire
propagation and its rate of fire spread were best predicted from wind speed, suspended dead fuel moisture
content, and one or two fuel variables.
Fuel variables used as predictors of fire sustainability were those describing the near-surface fuel layer
(load, height, PCS and FHS) and the overstorey mallee canopy (height and cover). Models had a high
discriminatory power, predicting correctly more then 90% of the cases in the dataset.
Exploratory analysis and preliminary modelling attempts revealed distinct fire spread controls for heath
and mallee-heath stands. Rate of surface fire spread was then modelled separately for heath and mallee-
heath stands. These models incorporate the effect of wind speed, suspended dead fuel moisture content
and one (in the heath) or two (in mallee-heath) fuel variables. Elevated fuel layer characteristics had most
influence on surface fire rate of spread in both fuel types. In the mallee-heath fuel complexes overall
model fit was improved by the inclusion of the height of the overstorey mallee clumps as an input variable.
Model fit varied from acceptable for the heath models (R2 between 0.76 and 0.82; mean absolute percent
error between 45 and 52%) to good for the mallee-heath models (R2 between 0.85 and 0.93; mean absolute
percent error between 30 and 36%).
Active crown fire propagation was observed in a number of fires. This level of fire activity was observed to
be accompanied extensive short range spotting. These two fire dependent mechanisms were observed to
be linked, i.e., one would not occur without the other, and have a large control over overall fire
propagation. Two simple models were developed to predict the onset of active crown fire propagation and
the associated rate of fire spread. The onset of active crowning was found to be a function of 10-m open
wind speed alone, constrained to situations where suspended fuel moisture content was lower then 8%.
Crown fire rate of spread was modelled as a function of wind speed and the moisture content of dead
suspended fuels. This model produced an excellent fit, explaining 98% of the variation in rate of fire
spread. Nonetheless, the dataset available for modelling purposes was limited and the results should be
seen as a first approximation.
Flame geometry and residence time data was used to evaluate the adequacy of existent simplified physical
models to mallee heath fuels. Existent flame height and length models were deemed adequate to predict
flame dimensions for prescribed burning decision-making. Model errors were within the level of uncertainty
associated with the estimation of flame dimensions in the field. Available residence time models did not
predict well the observed residence time variation with stand age.

PROGRAM A :: REPORT NO. A.10.01
107
8BREFERENCES Aguado, I., Chuvieco, E., Boren, R., Nieto, H., (2007) Estimation of dead fuel moisture content from
meteorological data in Mediterranean areas. Applications in fire danger assessment. Int. J. Wildland Fire. 16, 390-397.
Albini, F.A., Stocks, B.J. (1986) Predicted and observed rates of spread of crown fires in immature jack pine. Combustion Science and Technology 48: 65–76.
Albini, F.A. (1983) Potential spotting distanced from wind-driven surface fires. USDA For. Serv. Gen. Res. Pap. INT-309, Intermountain For. and Range Exp. Stn., Ogden Utah, 27p.
Albini, F.A. (1985) A model for fire spread in wildland fuels by radiation. Combust. Sci. and Tech., 42:229-258.
Albini, F.A. 1981. Spot fire distance from isolated sources - extensions from a predictive model. USDA For. Serv. Res. Note INT-309, Intermountain For. and Range Exp. Stn., Ogden Utah, 31p.
Alexander, M.E. 1982. Calculating and interpreting forest fire intensities. Can. J. Bot. 60:349-357.
Amiro, B.D. (1990) Comparison of turbulence statistics within three boreal forest canopies. Boundary-Layer Meteorology 51:99-121.
Amiro, B.D., Davis, P.A. (1988) Statistics of atmospheric turbulence within a natural black spruce forest canopy. Boundary-Layer Meteorology 44:267-283.
Anderson H.E. (1969) Heat transfer and Fire spread. USDA Forest Service; Res Pap INT-69.
Anderson, H.E. (1982) Aids to determining fuel models for estimating fire behavior. USDA For. Serv. Res. Pap. INT-122, Intermountain For. and Range Exp. Stn., Ogden Utah, 22 p.
Anderson, H.E., (1990) Predicting equilibrium moisture content of some foliar forest litter in the northern Rocky Mountains. USDA Forest Service Research Paper INT-429, Ogden, UT.
Andrews, P. L.; Bevins, C.D.; Seli, R.C. (2005) BehavePlus fire modeling system, version 3.0: User's Guide Gen. Tech. Rep. RMRS-GTR-106WWW Revised. Ogden, UT: Department of Agriculture, Forest Service, Rocky Mountain Research Station. 132p.
Beggs, B.J. (1973) Forest fire danger tables. For. Dept., Western Australia, 27 p.
Bergen, J.D. (1971) Vertical profiles of wind speed in a pine stand. For. Sci. 17(3):314-321.
Beverly J.L., Wotton , B.M. (2007). Modelling the probability of sustained flaming in Canadian fuel types: predictive value of fire weather index components compared with observations of site weather and fuel moisture conditions. International Journal of Wildland Fire, 16(2), 161-173.
Billing, P.R. (1981) Hazard reduction burning in the Big Desert. For. Comm. Vic., Melbourne, Victoria. Fire Res. Branch rep. Nº 9. 4 p.
Bird R.E., Hulstrom R.L. (1981) 'A simplified clear sky model for direct and diffuse insolation on horizontal surfaces'. U.S. Department of Energy, Solar Research Institute Technical Report SERI/TR-642-761. ( Golden, Colorado).
Bradstock R.A. (1989) Dynamics of a perennial understorey. Inn: Mediterranean landscapes in Australia: Mallee Ecosystems and their Management (eds J.C. Noble and R.A. Bradstock). Pp. 141-154. CSIRO, Melbourne.
Bradstock R.A., Auld, T.D., Ellis, M.E., Cohn, J.S. (1992). Soil temperatures during bushfires in semi-arid, mallee shrublands. Australian Journal of Ecology 17:433-440.
Bradstock R.A., Cohn J.S. (2002) Fire regimes and biodiversity in semi-arid mallee ecosystems. In Flammable Australia: the fire regimes and biodiversity of a continent. (Eds R.A. Bradstock, J.E. Williams and A.M. Gill) pp. 238-258. Cambridge University Press: Cambridge, UK.
Bradstock R.A., Gill, A.M. (1993) Fire in semi-arid Mallee shrublands: size of flames from discrete fuel arrays and their role in the spread of fire. Int. J. Wildland Fire 3:3-12.
Burrows, N.D. (1994) Experimental development of a fire management model for jarrah (Eucalyptus marginata Donn ex Sm.) forest. Aust. Natl. Univ., Canberra, Australian capital Territory. Ph.D. thesis. 293 p.

PROGRAM A :: REPORT NO. A.10.01
108
Burrows, N.D., McCaw, W.L. (1989) Fuel characteristics and bushfire control in Banksia woodlands in Western Australia. Journal of Environmental Management 31(3):229-236.
Burrows, N.D., Ward B., Robinson A. (2009) Fuel dynamics and fire spread in spinifex grasslands of the western desert. Pages 69-76 in (Tran C. Ed.) the Proceedings of the Royal Society of Queensland – Bushfire 2006 conference. Brisbane 6-9 June 2006.
Burrows, N.D., Ward, B., Robinson, A. (1988) Aspects of fire behaviour and fire suppression in a Pinus pinaster plantation. West. Aust. Dep. Conserv. Land Manage. Landnote 2/99.
Burrows, N.D., Ward, B., Robinson, A. (1990) Fire behaviour in Spinifex fuels on the Gibson Desert Nature Reservem Western Australia. Journal of Arid Environments 20:189-204.
Byram, G. M., Jemison, G.M., (1943) Solar radiation and forest fuel moisture. J. Agr. Res. 67, 149-176.
Byram, G.M. (1959) Combustion of forest fuels. In K.P. Davis (ed.). Forest Fire: Control and Use. McGraw-Hill Book Company, New York. pp. 61-89, 554-555.
Campbell, G.S., Norman, J.M. (1998) An introduction to environment biophysics. Second Edition. Springer. 286 pp.
Canfield, R.H. (1941) Application of the line intersect method in sampling range vegetation. J. Forestry 39:388-394.
Catchpole et al. (1998) Cooperative development of equations fore heathland fire behaviour. Pages 631-645 in the Proceedings of 3rd International Conference on Forest Fire Research – 14th Conference on Fire and Forest Meteorology, Luso - Coimbra, Portugal - 16/20 November 1998.
Catchpole, E. A., Catchpole, W.R., Viney, N.R., McCaw, W.L.,Marsden-Smedley, J.B., (2001) Estimating fuel response time and predicting fuel moisture content from field data. Int. J. Wildland Fire. 10, 215-222.
Catchpole, W.R., Wheeler, C.J. (1992) Estimating plant biomass: A review of techniques. Australian Journal of Ecology 17:121-131.
Catchpole, WR. (2001) Fire properties and burn patterns in heterogeneous landscapes. In: Bradstock, R.A., Williams, J.E., Gill, M.A. (Eds.) Flammable Australia: the fire regimes and biodiversity of a continent, Cambridge University Press, Cambridge, UK.
Cheney N.P., Gould J., McCaw L. (2001) The dead-man zone – a neglected area of firefighter safety. Australian Forestry 64(1):45 – 50.
Cheney, N.P. (1981) Fire behaviour. Pages 151-175 in Fire and the Australian Biota, edited by Gill, A.M., Groves, R.H., Noble, I.R., Australian Academy of Sciences, Canberra.
Cheney, N.P. (1983) Behaviour of fire in Australian forests. Pages A1-A12 in Life Safety and Escape form Fire – Proceedings of the Ninth National Conference. Aust Fire Prot. Assoc., Sudney, New South Wales.
Cheney, N.P. (1990) Quantifying bushfires. Mathl. Comput. Modelling 13(12):9-15.
Cheney, N.P., Bary, G.A.V. (1969) The propagation of mass conflagrations in a standing eucalypt forest by the spotting process. Paper A6 in Collected Papers, Mass fire Symposium, Vol. I., W. Aust., defence Standards Lab., Maribyrnong, Victoria. 18 p.
Cheney, N.P., Gould, J.S. (1995) Fire growth in grassland fuels. Int. J. Wildland Fire 5(4):237-247.
Cheney, N.P., Gould, J.S., Catchpole, W.R. (1998) Prediction of fire spread in grasslands.. Int. J. Wildland Fire 8(1):1-15.
Cruz, M.G., Alexander, M.E., and Wakimoto, R.H. (2005) Development and testing of models for predicting crown fire rate of spread in conifer forest stands. Can. J. For. Res. 35:1626-1639.
Cruz, M.G., Alexander, M.E., Fernandes, P. (2008) Development of a model system to predict wildfire behaviour in pine plantations. Australian Forestry 71(2):113-121.
Cruz, M.G, Butler, BW, Viegas, D.X., Palheiro, P. Characterization of flame radiant het fluxes in shrubland fires. Submitted to Combustion and Flame.
Ellis P.F. (2000). The aerodynamic and combustion characteristics of eucalypt bark – a firebrand study. Ph.D. Thesis, Australian National University, Canberra, Australia. 187 p.

PROGRAM A :: REPORT NO. A.10.01
109
Eriksson, I., Teketay, D., Anders Granström, A., (2003) Response of plant communities to fire in an Acacia woodland and a dry Afromontane forest, southern Ethiopia. Forest Ecol. Manag. 177, 39-50.
Fernandes, P.A.M., (2001) Fire spread prediction in shrub fuels in Portugal. Forest Ecol. Manag. 144, 67-74.
Fernandes, P.A.M., Catchpole, W.R., Rego, F.C., (2000) Shrubland fire behaviour modelling with microplot data. Can. J. Forest Res. 30, 889-899.
Fernandes, P.M., Botelho, H., Rego, F.C. Loureiro, C. (2008) Using fuel and weather variables to predict the sustainability of surface fire spread in maritime pine stands. Can. J. For. Res. 38:190-201.
Fernandes, P.M., Loureiro, C., Botelho, H.S. (2004) Fire behaviour and severity in a maritime pine stand under differing fuel conditions. Ann. For. Sci. 61:537-544.
Finnigan, J.J., (2000) Turbulence in plant canopies. Annu. Rev. Fluid Mech. 32, 519-571.
Gill A.M., Burrows, N.D., Bradstock, R.A. (1995) Fire modelling and fire weather in and Australian Desert. CalmScience Supplement 4:29-34.
Gould J.S. (2003) Fire behaviour: integrating science and management. In Cary G., Lindenmayer D., Dovers S. (eds) Australia Burning: Fire ecology, policy and management issues. CSIRO Publishing.
Gould J.S., McCaw W.L., Cheney N.P., Ellis P.F., Knight I.K., Sullivan AL (2007) 'Project Vesta : fire in dry eucalypt forest : fuel structure, fuel dynamics and fire behaviour.' (Ensis-CSIRO, Canberra ACT, and Department of Environment and Conservation, Perth WA)
Grace, J. (1977) Plants response to wind. Academic Press. 204 pp.
Hosmer, D.W., Lemeshow, S. (2000) Applied logistic regression. Second edition, John Wiley & Sons, Inc. 375 p.
Johnson, E.A. and Miyanishi, K. (1995) The need for consideration of fire behavior and effects in prescribed burning. Restoration Ecology. 3(4):271-278.
Kautz, J. (1997) Appendix C — insulated boxes for protecting video cameras. In Surviving fire entrapments: comparing conditions inside vehicles and fire shelters. Edited by R. Mangan. USDA For. Serv. Missoula Tech. Dev. Cent. Tech. Rep. 9751-2817-MTDC. pp. 39–40.
Marsden-Smedley, J., Catchpole, W.R. (2001) Fire modelling in Tasmanian Buttongrass Moorlands. IV. Sustaining versus non-sustaining fires. Int. J. Wildland Fire 10:255-262.
Matthews S, McCaw WL (2006). A next-generation fuel moisture model. Forest Ecology and Management. 234S, S91.
Matthews S, Gould JG, McCaw WL, (2010) Simple models for predicting dead fuel moisture in Eucalyptus forests. Int. J. Wildland Fire, in press.
Matthews, S, (2010) Effect of drying temperature on fuel moisture content measurements, Int. J. Wildland Fire, in press.
Matthews, S., (2006) A process-based model of fine fuel moisture. Int. J. Wildland Fire. 15, 155-168.
Matthews, S., McCaw, W.L., Neal, J., Smith, R., (2007) Testing a process-based fine fuel moisture model in two forest types. Can. J. Forest Res. 37, 23-35.
McArthur A.G. (1966) Weather and grassland Fire behaviour. Forest Research Institute, Forest and Timber Bureau of Australia; 1966. Leaflet No. 100.
McArthur A.G. (1967) Fire behaviour in eucalyptus forests. Forest Research Institute, Forest and Timber Bureau of Australia; Leaflet No. 107.
McArthur, A.G. (1973) Forest Fire Danger Meter Mk V, Forest Research Institute, Forestry and Timber Bureau, Canberra, Australia.
McCarthy, G.J., Tolhurst, K.G. Chatt, K. (1998) Overall fuel hazard guide. Fire Management, Dept of Natural Resources & Environment, Vic. 32 p.
McCaw, L.W. (1995) Predicting fire spread in Western Australian Mallee-heath. CalmScience Suplement 4:35-42.
McCaw, W.L., (1997) Predicting fire spread in Western Australian mallee-heath shrublands. PhD thesis, University College, University of New South Wales, Australia.

PROGRAM A :: REPORT NO. A.10.01
110
McRae DJ, Jin J.-Z, Conard SG, Sukhinin AI, Ivanova GA, Blake TW (2005) Infrared characterization of fine-scale variability in behavior of boreal forest fires. Canadian Journal of Forest Research 35: 2194-2206.
Monteith, J.L., (1975) Principles of environmental physics. Arnold, London, UK.
Nelson, R. M., (1991) A model of diurnal moisture change in dead forest fuels. In: Potts, D.F. (Ed.) Proceedings of the 11th conference on fire and forest meteorology, 16-19 April 1991, Missoula, MO. Society of American Foresters, Bethesda, MD.
Nelson, R.M. Jr. (2003) Reaction times and burning rates for wind tunnel headfires. Int. J. Wildland Fire 12:195-211.
Nelson, R.M., (1983) A model for sorption of water vapor by cellulosic materials. Wood Fiber Sci. 15, 8-22.
Nelson, R.M., Adkins, C.W. (1986) Flame characteristics of wind driven fires. Can. J. For. Res. 16:1293-1300.
Nelson, R.M., Adkins, C.W. (1988) A dimensionless correlation for the spread of wind driven fires. Can. J. For. Res. 18:391-397.
Noble J.C., (1986) Prescribed fire in mallee rangelands and the potential role of aerial ignition, Australian Rangeland Journal. 8:118-130.
Noble, J.C., Vines, R.G. (1993) Fire studies in mallee (Eucalyptus spp.) communities of western New South Wales: grass fuel dynamics and associated weather patterns. Rangeland J. 15(2):270-297.
Pastor, E., Pérez, Y., Cubells M., Planas, E., Plucinski, P., Gould J., (2010) Quantifiable assessment of aerial suppression tactics in wildland fires by IR monitoring. Submitted to 6th ICFFR.
Pippen, B, (2007) Predicting factors affecting fire behaviour in heathland vegetation, Ph D Thesis, University of NSW.
Plucinski, M. (2003) The investigation of factors governing ignition and development of fires in heathland vegetation. PhD thesis, University College, University of New South Wales, Australia.
Plucinski, M. Factors affecting containment area and time of Australian forest fires featuring aerial suppression. In preparation.
Plucinski, M.P., Cruz, M.G., Gould, J., Pastor, E., Perez, Y., Planas, E., McCarthy G. (2010) Project FuSE Aerial Suppression experiments. Bushfire CRC Report NO.A.XX.XX. Bushfire Cooperative Research Centre, Melbourne, Victoria, Australia. XX pp.
Pollack H.N. (2003) ‘Uncertain Science...Uncertain World’. Cambridge University Press. 256 pp.
Porté, A., Huard, F., Dreyfus, P., (2004) Microclimate beneath pine plantation, semi-mature pine plantation and mixed broadleaved-pine forest. Agric. For. Meteor. 126, 175-182.
Reinhardt, E.D., Keane, R.E., Brown, J.K. (1999) Modeling fire effects. Int. J. Wildland Fire 10:373-380.
Rothermel R.C. (1972) A mathematical model for predicting Fire spread in wildland fuels. USDA Forest Service; Res Pap INT-115.
Rothermel, R.C. (1983) How to predict the spread and intensity of forest and range fires. Gen. Tech. Rep. INT-143, Ogden, UT: U.S. Department of Agriculture, Forest Service, Intermountain Forest and Range Experiment Station. 161 p.
Rothermel, R.C. (1991) Predicting behavior and size of crown fires in the Northern Rocky Mountains. Gen. Tech. Rep. INT-438. Ogden, UT: U.S. Department of Agriculture, Forest Service, Intermountain Research Station. 46 p.
Rothermel, R.C., Rinehart, G. C. (1983) Field procedures for verification and adjustment of fire behavior predictions. Res. Pap. INT-142. Ogden, UT: U.S. Department of Agriculture, Forest Service, Intermountain Forest and Range Experiment Station. 25 p.
Sandell P., Tolhurst K., Dalton, J., Scott, B., Smith, M., (2006) Fire management prescriptions for the Victorian mallee parks. Proceedings Royal Society of Victoria V.188(2):395-411.
Silberstein, R., Held, A., Hatton, T., Viney, N.R., Sivapalan, M., (2001) Energy balance of natural jarrah (Eucalyptus marginata) forest in Western Australia: measurements during spring and summer. Agric. For. Meteor. 109, 79-104.

PROGRAM A :: REPORT NO. A.10.01
111
Silvani X., Morandini F. (2009) Fire spread experiments in the field: Temperature and heat fluxes measurements. Fire Safety Journal 44:279-285.
Simard, A.J., Eenigenburg, J.E., Adams, K.B., Nissen, R.L., Deacon, A.G. (1984) A general procedure for sampling and analyzing wildland fire spread. Forest science 30(1):50-64.
Sneeuwjagt, R.J., Peet, G.B., (1998) Forest fire behaviour tables for western Australia. Department of Conservation and Land Management. 59 p.
Specht, R.L., Rayson, P. (1957) Dark Island Heath (Ninety-mile Plain, South Australia). I. Definition of the ecosystem. Aust. J. Bot. 5, 52-85.
Spetch R.L. (1966) The growth and distribution of mallee-broombush (eucalyptus incrassate-melaleuca uncinata association) and heath vegetation near Dark island Soak, Ninety-mile plain, South Australia. Aust. J. Bot. 14:361-371.
Spetch R.L. (1981) Resposes to fires in ehathlands and related shrublands. In: Fire and the Australian Biota (eds. A.M Gill, R.H. Groves and I.R. Noble), pp.395-415.Australian Academy of Science, Canberra.
Taylor, S.W.; Wotton, B.M.; Alexander, M.E.; Dalrymple, G.N. (2004) Variation in wind and crown fire behaviour in a northern jack pine – black spruce forest. Canadian Journal of Forest Research 34: 1561-1576.
Thomas, P.H., Scott, R. (1963) Research on forest fires. Report on Forest Research 1962, 116-119.
Tolhurst K.G., Cheney N.P. (1999) Synopsis of the knowledge used in prescribed burning in Victoria. Dept. of Natural Resources and Environment, Victoria.
Tolhurst K.G., McCarthy, G.J., Chatto, K. (1996) Estimating overall fuel hazard for forest fuels. . Dept. of Conservation and Natural Resources, Victoria. Unpublished report.
Tran, C., Pyrke, A. (1999) Wind speed reduction factors in a heathy woodland In Pages 391-400 of Australian Bushfire Conference. Albury 7-9 July 1999.
Van Wagner, C.E. (1977) Conditions for the start and spread of crown fire. Canadian Journal of Forest Research 7:23-34.
Van Wagner, C.E. (1978) Metric units and conversion factors for forest fire quantities. Canadian Forestry Service. Inf. Rep. PS-X-71, Ottawa, Canada.
Van Wagner, C.E. (1993) Prediction of crown fire behavior in two stands of Jack pine. Can. J. For. Res. 23:442-449.
Viegas, D.X. (2006) Parametric study of eruptive fire behavior. Int. J. Wildland Fire 15:169-177.
Viney, N.R. (1992) Modelling fine fuel moisture content. Doctoral thesis. Department of Mathematics, University of New South Wales.
Viney, NR., (1991) A review of fine fuel moisture modelling. Int. J. Wildland Fire. 1, 215-234.
Walker, J. (1981) Fuel dynamics in Australian vegetation. In Fire and the Australian Biota, edited by Gill, A.M., Groves, R.H., Noble, I.R., Australian Academy of Sciences, Canberra.
Wilson, A.A.G. (1992) Eucalypt bark hazard guide. Dep. Conserv. Environ., Fire Management Branch, Melbourne, Victoria. Res. Rep. Nº32.
Wilson, A.A.G. (1993) Elevated fuel guide. Dep. Conserv. Environ., Fire Management Branch, Melbourne, Victoria. Res. Rep. Nº35. 22 p.

PROGRAM A :: REPORT NO. A.10.01
112

PROGRAM A :: REPORT NO. A.10.01
113
9BAPPENDIX 1 – FUEL DATA
TABLE A1.1. FUEL LAYER AND BARE GROUND COVER PER PLOT.
Cover
Plot Bare ground Litter Near-surface Elevated Overstorey
AS1 0.19 0.22 0.20 0.33 0.06
AS2 0.18 0.15 0.17 0.37 0.13
AS3 0.19 0.10 0.17 0.36 0.18
B 0.29 0.26 0.11 0.32 0.02
J 0.38 0.17 0.13 0.17 0.16
K 0.32 0.06 0.22 0.22 0.19
N 0.15 0.22 0.09 0.38 0.16
O 0.15 0.20 0.17 0.44 0.02
R 0.21 0.28 0.15 0.31 0.04
U 0.21 0.22 0.13 0.21 0.23
W 0.24 0.09 0.24 0.38 0.06
X 0.16 0.08 0.17 0.40 0.20
ZB 0.22 0.23 0.13 0.18 0.24
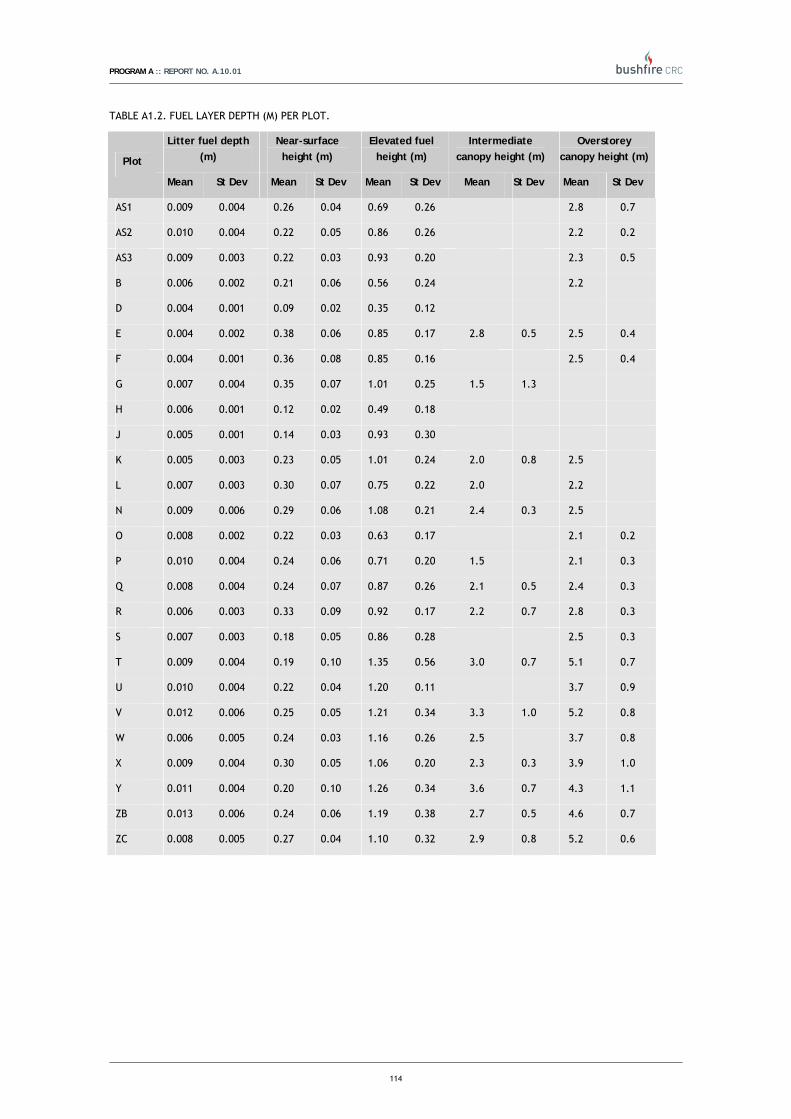
PROGRAM A :: REPORT NO. A.10.01
114
TABLE A1.2. FUEL LAYER DEPTH (M) PER PLOT.
Litter fuel depth (m)
Near-surface height (m)
Elevated fuel height (m)
Intermediate canopy height (m)
Overstorey canopy height (m) Plot
Mean St Dev Mean St Dev Mean St Dev Mean St Dev Mean St Dev
AS1 0.009 0.004 0.26 0.04 0.69 0.26 2.8 0.7
AS2 0.010 0.004 0.22 0.05 0.86 0.26 2.2 0.2
AS3 0.009 0.003 0.22 0.03 0.93 0.20 2.3 0.5
B 0.006 0.002 0.21 0.06 0.56 0.24 2.2
D 0.004 0.001 0.09 0.02 0.35 0.12
E 0.004 0.002 0.38 0.06 0.85 0.17 2.8 0.5 2.5 0.4
F 0.004 0.001 0.36 0.08 0.85 0.16 2.5 0.4
G 0.007 0.004 0.35 0.07 1.01 0.25 1.5 1.3
H 0.006 0.001 0.12 0.02 0.49 0.18
J 0.005 0.001 0.14 0.03 0.93 0.30
K 0.005 0.003 0.23 0.05 1.01 0.24 2.0 0.8 2.5
L 0.007 0.003 0.30 0.07 0.75 0.22 2.0 2.2
N 0.009 0.006 0.29 0.06 1.08 0.21 2.4 0.3 2.5
O 0.008 0.002 0.22 0.03 0.63 0.17 2.1 0.2
P 0.010 0.004 0.24 0.06 0.71 0.20 1.5 2.1 0.3
Q 0.008 0.004 0.24 0.07 0.87 0.26 2.1 0.5 2.4 0.3
R 0.006 0.003 0.33 0.09 0.92 0.17 2.2 0.7 2.8 0.3
S 0.007 0.003 0.18 0.05 0.86 0.28 2.5 0.3
T 0.009 0.004 0.19 0.10 1.35 0.56 3.0 0.7 5.1 0.7
U 0.010 0.004 0.22 0.04 1.20 0.11 3.7 0.9
V 0.012 0.006 0.25 0.05 1.21 0.34 3.3 1.0 5.2 0.8
W 0.006 0.005 0.24 0.03 1.16 0.26 2.5 3.7 0.8
X 0.009 0.004 0.30 0.05 1.06 0.20 2.3 0.3 3.9 1.0
Y 0.011 0.004 0.20 0.10 1.26 0.34 3.6 0.7 4.3 1.1
ZB 0.013 0.006 0.24 0.06 1.19 0.38 2.7 0.5 4.6 0.7
ZC 0.008 0.005 0.27 0.04 1.10 0.32 2.9 0.8 5.2 0.6

PROGRAM A :: REPORT NO. A.10.01
115
TABLE A1.3. FUEL LAYER AND TOTAL FUEL LOAD (KG/M2) PER PLOT.
Litter dead Near-surf. live Near-surf. dead Elevated live Elevated dead Total fuel Plot
Mean St.Dev Mean St.Dev Mean St.Dev Mean St.Dev Mean St.Dev Mean St.Dev
AS1 0.25 0.25 0.05 0.04 0.10 0.05 0.10 0.07 0.02 0.02 0.52 0.25
AS2 0.07 0.09 0.02 0.01 0.04 0.03 0.14 0.10 0.03 0.02 0.30 0.20
AS3 0.08 0.06 0.01 0.01 0.06 0.06 0.16 0.10 0.03 0.01 0.35 0.11
B 0.09 0.09 0.02 0.01 0.04 0.01 0.13 0.12 0.04 0.04 0.32 0.24
D 0.09 0.22 0.14 0.16 0.04 0.05 0.17 0.14 0.01 0.02 0.46 0.37
E 0.23 0.10 0.06 0.03 0.17 0.05 0.12 0.15 0.02 0.03 0.59 0.18
F 0.19 0.07 0.14 0.04 0.20 0.07 0.05 0.05 0.02 0.02 0.60 0.16
G 0.18 0.06 0.10 0.05 0.17 0.11 0.15 0.10 0.04 0.03 0.64 0.28
H 0.19 0.14 0.02 0.03 0.05 0.03 0.27 0.14 0.06 0.06 0.59 0.26
J 0.16 0.13 0.02 0.02 0.06 0.06 0.36 0.31 0.03 0.04 0.63 0.38
K 0.10 0.16 0.10 0.05 0.07 0.04 0.21 0.29 0.08 0.12 0.56 0.53
L 0.13 0.14 0.09 0.08 0.15 0.06 0.01 0.02 0.01 0.03 0.40 0.24
N 0.28 0.17 0.11 0.05 0.10 0.04 0.25 0.18 0.08 0.06 0.82 0.34
O 0.29 0.12 0.03 0.01 0.07 0.03 0.16 0.07 0.04 0.02 0.59 0.17
P 0.24 0.19 0.06 0.06 0.10 0.05 0.13 0.06 0.06 0.05 0.59 0.35
Q 0.18 0.15 0.12 0.08 0.11 0.08 0.16 0.19 0.04 0.04 0.60 0.35
R 0.27 0.10 0.10 0.04 0.15 0.09 0.29 0.19 0.03 0.03 0.84 0.24
S 0.19 0.18 0.03 0.02 0.07 0.07 0.09 0.05 0.03 0.02 0.41 0.16
T 0.44 0.49 0.02 0.03 0.08 0.09 0.22 0.22 0.07 0.11 0.83 0.74
U 0.28 0.37 0.02 0.03 0.05 0.04 0.09 0.08 0.03 0.02 0.47 0.34
V 0.38 0.22 0.06 0.06 0.05 0.03 0.14 0.27 0.01 0.02 0.65 0.30
W 0.22 0.24 0.03 0.03 0.05 0.03 0.12 0.10 0.05 0.04 0.47 0.26
X 0.47 0.46 0.04 0.04 0.07 0.06 0.02 0.03 0.01 0.02 0.61 0.46
Y 0.37 0.39 0.03 0.04 0.09 0.08 0.08 0.10 0.08 0.13 0.63 0.41
ZB 0.15 0.07 0.03 0.03 0.06 0.04 0.03 0.02 0.02 0.01 0.29 0.09
ZC 0.15 0.16 0.06 0.03 0.07 0.03 0.12 0.19 0.06 0.10 0.47 0.43
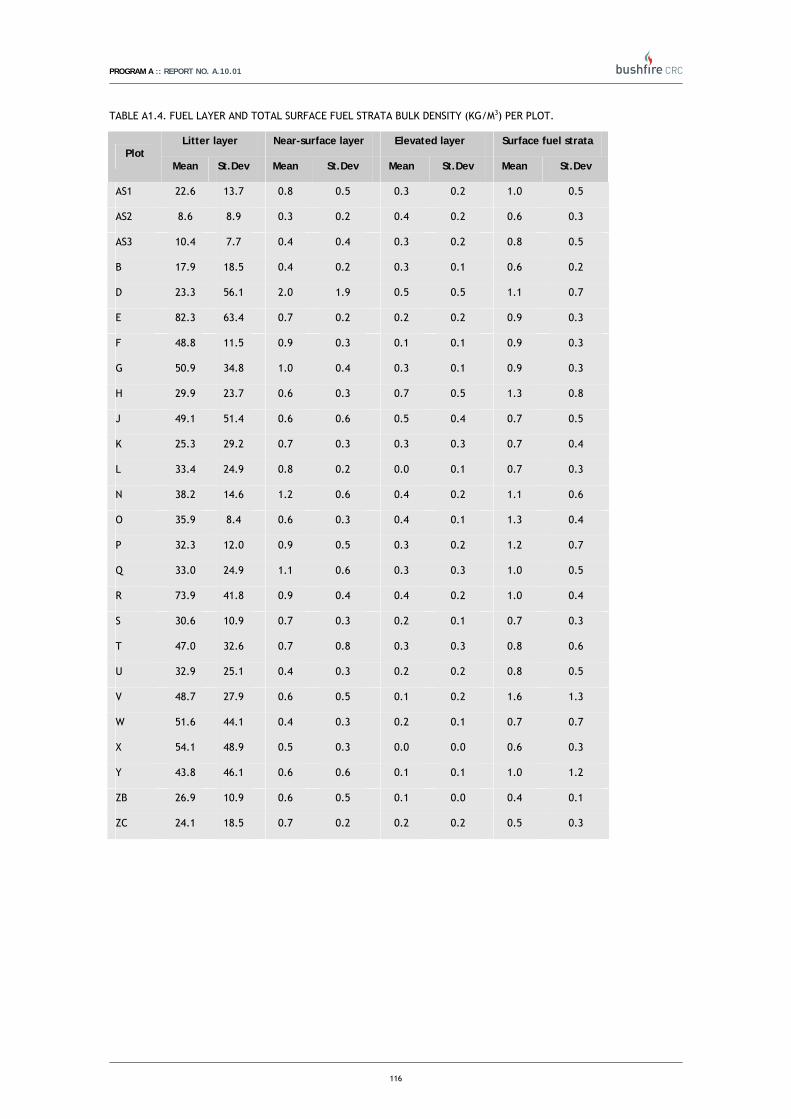
PROGRAM A :: REPORT NO. A.10.01
116
TABLE A1.4. FUEL LAYER AND TOTAL SURFACE FUEL STRATA BULK DENSITY (KG/M3) PER PLOT.
Litter layer Near-surface layer Elevated layer Surface fuel strata Plot
Mean St.Dev Mean St.Dev Mean St.Dev Mean St.Dev
AS1 22.6 13.7 0.8 0.5 0.3 0.2 1.0 0.5
AS2 8.6 8.9 0.3 0.2 0.4 0.2 0.6 0.3
AS3 10.4 7.7 0.4 0.4 0.3 0.2 0.8 0.5
B 17.9 18.5 0.4 0.2 0.3 0.1 0.6 0.2
D 23.3 56.1 2.0 1.9 0.5 0.5 1.1 0.7
E 82.3 63.4 0.7 0.2 0.2 0.2 0.9 0.3
F 48.8 11.5 0.9 0.3 0.1 0.1 0.9 0.3
G 50.9 34.8 1.0 0.4 0.3 0.1 0.9 0.3
H 29.9 23.7 0.6 0.3 0.7 0.5 1.3 0.8
J 49.1 51.4 0.6 0.6 0.5 0.4 0.7 0.5
K 25.3 29.2 0.7 0.3 0.3 0.3 0.7 0.4
L 33.4 24.9 0.8 0.2 0.0 0.1 0.7 0.3
N 38.2 14.6 1.2 0.6 0.4 0.2 1.1 0.6
O 35.9 8.4 0.6 0.3 0.4 0.1 1.3 0.4
P 32.3 12.0 0.9 0.5 0.3 0.2 1.2 0.7
Q 33.0 24.9 1.1 0.6 0.3 0.3 1.0 0.5
R 73.9 41.8 0.9 0.4 0.4 0.2 1.0 0.4
S 30.6 10.9 0.7 0.3 0.2 0.1 0.7 0.3
T 47.0 32.6 0.7 0.8 0.3 0.3 0.8 0.6
U 32.9 25.1 0.4 0.3 0.2 0.2 0.8 0.5
V 48.7 27.9 0.6 0.5 0.1 0.2 1.6 1.3
W 51.6 44.1 0.4 0.3 0.2 0.1 0.7 0.7
X 54.1 48.9 0.5 0.3 0.0 0.0 0.6 0.3
Y 43.8 46.1 0.6 0.6 0.1 0.1 1.0 1.2
ZB 26.9 10.9 0.6 0.5 0.1 0.0 0.4 0.1
ZC 24.1 18.5 0.7 0.2 0.2 0.2 0.5 0.3

PROGRAM A :: REPORT NO. A.10.01
117
TABLE A1.5. NEAR-SURFACE AND ELEVATED FUEL LAYERS DEAD/LIVE (D/L) RATIO PER PLOT.
Near-surface layer d/l ratio Elevated layer d/l ratio
Plot Mean St. Dev Mean St. Dev
AS1 2.6 2.0 0.3 0.3
AS2 2.7 0.8 0.3 0.2
AS3 6.6 6.4 0.3 0.3
B 2.1 0.5 0.3 0.1
D 1.4 2.9 0.1 0.1
E 3.2 1.8 0.5 0.8
F 1.4 0.5 0.4 0.0
G 1.9 1.0 0.3 0.3
H 4.4 4.0 0.3 0.5
J 3.2 2.5 0.2 0.4
K 0.7 0.2 0.6 1.0
L 3.1 2.5 1.0 0.9
N 1.1 0.9 0.4 0.3
O 2.3 0.6 0.3 0.3
P 2.0 0.7 0.5 0.4
Q 0.9 0.3 0.3 0.3
R 1.4 0.5 0.1 0.1
S 2.3 1.2 0.4 0.5
T 8.4 14.6 0.8 2.5
U 4.9 6.8 0.3 0.2
V 2.5 5.9 0.1 0.1
W 2.8 3.1 0.6 0.6
X 2.3 2.9 0.7 0.5
Y 2.1 0.7 2.0 3.3
ZB 2.3 2.0 2.1 3.9
ZC 1.3 0.7 0.5 0.2

PROGRAM A :: REPORT NO. A.10.01
118
TABLE A1.6. FUEL LAYER PERCENT COVER SCORES (PCS) PER PLOT.
Plot Litter layer Near-surface layer Elevated layer Overstorey canopy
AS1 1.07 1.80 1.73 .667
AS2 .59 1.24 1.76 .706
AS3 .89 1.44 1.89 1.22
B .13 1.00 2.00 .125
D .03 1.06 1.92 .000
E .97 2.52 1.11 .656
F .78 2.34 1.53 .875
G 1.06 2.00 1.25 .000
H 1.00 1.11 2.67 .000
J .17 1.44 1.36 .000
K .47 1.48 1.55 .063
L .39 2.86 1.03 .031
N .97 1.64 1.92 .031
O 1.00 1.75 2.00 .625
P 1.25 1.88 2.00 .875
Q .90 1.76 1.40 .452
R .97 2.11 1.34 .469
S 1.25 1.25 1.75 1.00
T 1.01 1.28 2.00 .179
U 1.00 1.50 1.67 1.167
V 1.19 1.46 1.23 .827
W 1.00 1.86 1.71 .857
X .75 1.88 1.63 1.00
Y 1.15 1.24 1.24 1.03
ZB .88 1.63 1.00 1.00
ZC .56 1.91 1.39 .391

PROGRAM A :: REPORT NO. A.10.01
119
TABLE A1.7. FUEL LAYER FUEL HAZARD SCORES (PCS) PER PLOT.
Plot Litter layer Near-surface layer Elevated fuel layer Overstorey canopy bark
AS1 1.40 2.93 1.67 1.2667
AS2 1.65 3.00 2.12 1.4118
AS3 2.33 3.00 2.11 2.0000
B 1.13 3.00 1.88 .1250
D 1.00 1.67 1.31 .0000
E 1.02 2.61 1.22 .6563
F 1.06 2.56 1.44 .8438
G 1.47 2.25 1.50 .0000
H 1.86 2.25 2.00 .0000
J 1.06 1.69 1.19 .0000
K 1.02 1.48 1.47 .0313
L 1.06 2.30 1.08 .0313
N 1.61 1.95 1.92 .0313
O 1.13 2.38 2.13 1.2500
P 1.63 2.63 1.75 2.7500
Q 1.74 1.63 1.35 .3548
R 1.34 2.28 1.26 .4375
S 1.63 2.13 1.88 1.8750
T 1.68 1.85 1.81 .1343
U 1.50 1.83 1.50 2.1667
V 1.96 1.73 1.46 .5000
W 1.57 3.00 2.00 2.7143
X 1.13 3.50 2.50 3.2500
Y 1.96 1.80 1.56 1.0882
ZB 2.25 3.00 1.88 2.7500
ZC 1.38 2.00 1.53 .3750

PROGRAM A :: REPORT NO. A.10.01
120
10BAPPENDIX 2. VISUAL ASSESSMENT SCORING KEY
TABLE A2.1. LITTER LAYER PCS AND FHS ASSESSMENT SCORING KEY
Litter Layer Percent Cover Score (PCS):
Estimate litter cover within 5 m radius from the sample point
0 1 (25 - 75%) 2 (75 - 90%) 3 (90 - 95%) 4 (95%+)
- litter is very
sparse or in small
isolated patches
within 5 m plot
radius,
- > 75 % of the 5 m
plot radius is bare
soil or rock
outcrops.
- scattered patches
of litter between
bare soil or rock
outcrops,
- over 25 % of the 5
m plot radius is
bare soil or rock
- scattered, discontinuous and light cover of litter,
- more than 10 % of
the 5 m radius plot is
bare soil or rock
outcrops, ie. > 8 m2 of
bare soil or rack within
the plot.
- large patches of
continuous cover of
litter,
- < 10 % of the 5 m
plot is bare soil or rock
outcrop, ie. Between
4 and 8 m2 of bare soil
or rack outcrop within
5 m plot radius.
- continuous cover of
litter fuel within 5 m
plot radius,
- < 5% of the plot
areas is bare soil or
rock outcrop ie. < 4
m2 of bare soil or
rack outcrops within
5 m plot radius
Litter Layer Fuel Hazards Score (FHS) :
Description of stages of accession and decomposition of litter fuels
0 1 2 3 4
Absent - very thin layer of
litter on forest
floor,
- litter depth < 10
mm.
- established litter
cover with no signs of
decomposition,
- litter depth 10-20
mm.
- established litter
cover with
decomposition
present,
- litter depth 15-25
mm.
- very thick layer of
litter on forest floor
with a duff layer
underneath litter
layer,
- litter depth > 25
mm.
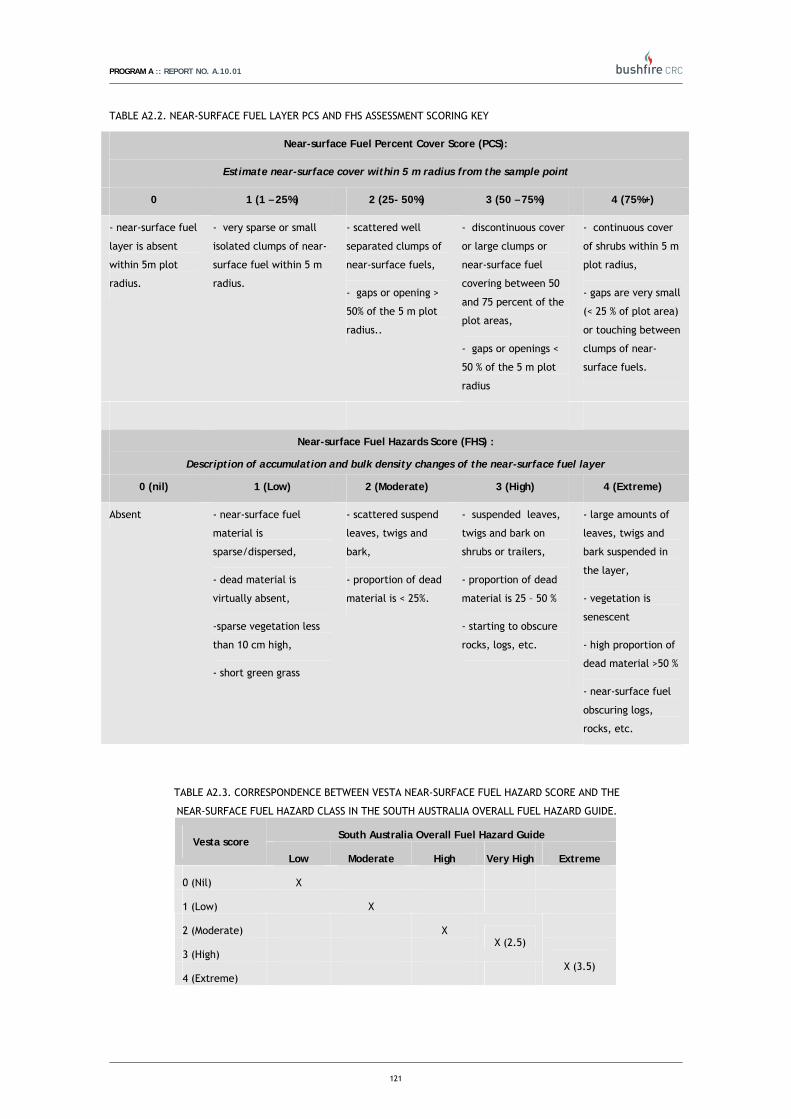
PROGRAM A :: REPORT NO. A.10.01
121
TABLE A2.2. NEAR-SURFACE FUEL LAYER PCS AND FHS ASSESSMENT SCORING KEY
Near-surface Fuel Percent Cover Score (PCS):
Estimate near-surface cover within 5 m radius from the sample point
0 1 (1 – 25%) 2 (25- 50%) 3 (50 – 75%) 4 (75%+)
- near-surface fuel
layer is absent
within 5m plot
radius.
- very sparse or small
isolated clumps of near-
surface fuel within 5 m
radius.
- scattered well
separated clumps of
near-surface fuels,
- gaps or opening >
50% of the 5 m plot
radius..
- discontinuous cover
or large clumps or
near-surface fuel
covering between 50
and 75 percent of the
plot areas,
- gaps or openings <
50 % of the 5 m plot
radius
- continuous cover
of shrubs within 5 m
plot radius,
- gaps are very small
(< 25 % of plot area)
or touching between
clumps of near-
surface fuels.
Near-surface Fuel Hazards Score (FHS) :
Description of accumulation and bulk density changes of the near-surface fuel layer
0 (nil) 1 (Low) 2 (Moderate) 3 (High) 4 (Extreme)
Absent - near-surface fuel
material is
sparse/dispersed,
- dead material is
virtually absent,
-sparse vegetation less
than 10 cm high,
- short green grass
- scattered suspend
leaves, twigs and
bark,
- proportion of dead
material is < 25%.
- suspended leaves,
twigs and bark on
shrubs or trailers,
- proportion of dead
material is 25 – 50 %
- starting to obscure
rocks, logs, etc.
- large amounts of
leaves, twigs and
bark suspended in
the layer,
- vegetation is
senescent
- high proportion of
dead material >50 %
- near-surface fuel
obscuring logs,
rocks, etc.
TABLE A2.3. CORRESPONDENCE BETWEEN VESTA NEAR-SURFACE FUEL HAZARD SCORE AND THE
NEAR-SURFACE FUEL HAZARD CLASS IN THE SOUTH AUSTRALIA OVERALL FUEL HAZARD GUIDE.
South Australia Overall Fuel Hazard Guide Vesta score
Low Moderate High Very High Extreme
0 (Nil) X
1 (Low) X
2 (Moderate) X
3 (High) X (2.5)
4 (Extreme) X (3.5)

PROGRAM A :: REPORT NO. A.10.01
122
TABLE A2.4. ELEVATED FUEL LAYER PCS AND FHS ASSESSMENT SCORING KEY
Elevated Fuel Layer Percent Cover Score (PCS):
Estimate canopy cover within 5 m radius from the sample point
0 1 (1 – 25%) 2 (25- 50%) 3 (50 – 75%) 4 (75%+)
- elevated fuel is
absent within 5 m
plot radius.
- shrubs are very sparse
or in small isolated
clumps within 5 m plot
radius.
- scattered shrubs
or well separated
clumps,
- gaps or openings
>50% of the 5 m
plot radius.
- discontinuous shrub
cover or clumps,
- gaps or openings <
50 % of the 5 m plot
radius.
- continuous cover of
shrubs within 5 m
plot radius,
- shrub crowns are
touching or
overlapping.
Elevated Fuel Layer Fuel Hazards Score (FHS):
Description of fuel density and morphological development of plant
0 (nil) 1 (Low) 2 (Moderate) 3 (High) 4 (Extreme)
Absent - patches of sparse /
dispersed shrubs,
- easy to walk through,
but vegetation does
brush against legs
occasionally,
- elevated material is
sparse/dispersed,
- dead material is
virtually absent
- sparse shrub
vegetation
- vigorous new green
growth form shoots or
sprouts.
- moderate easy to
walk through, but
brush against or
step over vegetation
most of time,
-proportion of dead
material is <25%,
-not much fine dead
fuel present at base
of shrubs.
-difficult to walk
through, need to
carefully select pat or
step high,
- proportion of dead
material is 25-50 %.
-very difficult to see
where your are
walking, need to use
arm to push through
vegetation,
- up to 3 m tall,
- plants are
senescent and
collapsing,
-high proportion of
dead material >50%,
-very fine fuel
present from top to
bottom of the
vegetation.
TABLE A2.5. CORRESPONDENCE BETWEEN VESTA ELEVATED FUEL HAZARD SCORE AND THE
ELEVATED FUEL HAZARD CLASS IN THE SOUTH AUSTRALIA OVERALL FUEL HAZARD GUIDE.
South Australia Overall Fuel Hazard Guide Vesta score
Low Moderate High Very High Extreme
0 (Nil) X
1 (Low) X
2 (Moderate) X
3 (High) X
4 (Extreme) X

PROGRAM A :: REPORT NO. A.10.01
123
TABLE A2.6. INTERMEDIATE CANOPY FUEL LAYER PCS AND FHS ASSESSMENT SCORING KEY
Intermediate Fuel Layer Percent Cover Score (PCS):
Estimate canopy cover within 10 m radius from the sample point
0 1 (1 – 25%) 2 (25- 50%) 3 (50 – 75%) 4 (75%+)
Intermediate tree
canopy cover absent.
No vertical projection
of live canopy onto
the ground
Very sparse /
isolated crowns.
< 25% of skylight is
intercepted by crown
foliage, i.e., > 75%
gaps in the canopy
Well separated
crowns;
25 – 50% of skylight is
intercepted by crown
foliage, i.e., >50%
gaps in the canopy
Clear to slight
separation of crowns
50-75% of skylight is
intercepted by crown
foliage, i.e., <50%
gaps in the canopy
Close or dense
canopy;
All canopies are
touching or
overlapping;
>75% of skylight is
intercepted by crown
foliage, i.e., <25%
gaps in the canopy.
Intermediate Fuel Layer Fuel Hazards Score (FHS):
Description of the intermediate trees bark type and bark fuels
0 (nil) 1 (Low) 2 (Moderate) 3 (High) 4 (Extreme)
- No bark present that
could contribute to
fire behaviour
- Stringy bark where
bark is well charred
and tightly held on
whole trunk;
- Ironbarks with very
tight, platy or fibrous
bark;
- Smooth barks,
which do not
produce long ribbons
of bark.
- Stringy barks where
most of bark is black
on the lower trunk,
few pieces of bark
are loosely attached
to trunks;
- bloodwood with
tight fibrous bark
which has not been
burnt for many
years;
- smooth / candle
bark which shed long
ribbons of bark but
have smooth bark
down to ground
level.
- Stringy barks where
<50% of surface area
of the trees is black;
- Upper pats of trunk
may not be charred;
- Smooth / candle
barks with long
ribbons of bark which
are loose;
- Fibrous or platy
bark on lower trunk,
not burnt for many
years
- Stringy bark with
large flakes of bark
that can be easily
dislodged;
- Large amounts of
bark are available for
spotting;
- outer bark on the
trees is attached
weakly;
- Minimal evidence of
charring (complete
grey appearance on
trunks)

PROGRAM A :: REPORT NO. A.10.01
124
TABLE A2.7. OVERSTOREY CANOPY FUEL LAYER PCS AND FHS ASSESSMENT SCORING KEY
Overstorey Fuel Layer Percent Cover Score (PCS):
Estimate canopy cover within 10 m radius from the sample point
0 1 (1 – 25%) 2 (25- 50%) 3 (50 – 75%) 4 (75%+)
overstorey tree
canopy cover
absent.
No vertical
projection of live
canopy onto the
ground
Very sparse / isolated
crowns.
< 25% of skylight is
intercepted by crown
foliage, i.e., > 75%
gaps in the canopy
Well separated
crowns;
25 – 50% of skylight is
intercepted by crown
foliage, i.e., >50%
gaps in the canopy
Clear to slight
separation of crowns
50-75% of skylight is
intercepted by crown
foliage, i.e., <50%
gaps in the canopy
Close or dense
canopy;
All canopies are
touching or
overlapping;
>75% of skylight is
intercepted by crown
foliage, i.e., <25%
gaps in the canopy.
Overstorey Fuel Layer Fuel Hazards Score (FHS):
Description of the overstorey trees bark type and bark fuel
0 (nil) 1 (Low) 2 (Moderate) 3 (High) 4 (Extreme)
- No bark present
that could
contribute to fire
behaviour
- Stringy bark where
bark is well charred
and tightly held on
whole trunk;
- Ironbarks with very
tight, platy or fibrous
bark;
- Smooth barks,
which do not produce
long ribbons of bark.
- Stringy barks where
most of bark is black
on the lower trunk,
few pieces of bark
are loosely attached
to trunks;
- bloodwood with
tight fibrous bark
which has not been
burnt for many years;
- smooth / candle
bark which shed long
ribbons of bark but
have smooth bark
down to ground level.
- Stringy barks where
<50% of surface area
of the trees is black;
- Upper pats of trunk
may not be charred;
- Smooth / candle
barks with long
ribbons of bark which
are loose;
- Fibrous or platy
bark on lower trunk,
not burnt for many
years
- Stringy bark with
large flakes of bark
that can be easily
dislodged;
- Large amounts of
bark are available for
spotting;
- outer bark on the
trees is attached
weakly;
- Minimal evidence of
charring (complete
grey appearance on
trunks)

PROGRAM A :: REPORT NO. A.10.01
125
11BAPPENDIX 3 – FUEL MICROCLIMATE
To understand measurements of fuel moisture presented in Chapter X, especially with two fuel types in
close proximity, it is useful to understand the processes which link weather with fuel moisture. Firstly, the
structure of the vegetation affects the microclimate of the fuels by, for example, modifying the wind
speed near the ground (Finnigan 2000) and the amount of solar radiation incident on the fuel (Monteith
1975). Secondly, the arrangement of the fuel has an effect on fuel moisture. For example, deep layers of
fuel dry more slowly after rain than shallower layers (Matthews et al. 2007). Finally, the geometrical and
chemical properties of the fuels affect the rate at which moisture enters and leaves the fuel (Nelson
1983)� and the equilibrium moisture content to which fuel moisture tends at a given temperature and
humidity (Catchpole et al. 2001, Anderson 1990). This appendix investigates microclimate in shrublands in
Ngarkat Conservation Park in South Australia.
32BA.3.1. METHODS Microclimate measurements were made using purpose built weather stations in an area of mixed
vegetation that was last burned in 1986. The plot was on flat ground with a mixture of open heath and
small mallee stands. Each stand was approximately 5 – 10 m diameter and stands were separated by 10 –
30 m. Two sets of simultaneous microclimate measurements were made, one in heath fuel and the other
in a 7 m diameter stand of mallee. Heath at this location was on average 0.7 m tall. Surface fuel cover
was 40%. Average depth of surface fuel was 4 mm but depths of up to 12 mm were observed under banksia
shrubs. The Mallee stand consisted of multiple individuals, each with multiple stems. The canopy height
of the mallee stand was 2 m. Surface fuel cover was 100% and average depth was 10 mm.
The weather stations included instruments to measure solar radiation and net radiation at 1.2 m above
ground, rainfall, air temperature at 1.2 m above ground and in the surface fuels, relative humidity at 1.2
m above ground and in the surface fuel, wind speed at 1.5 m above ground, soil moisture, and leaf and soil
temperatures at five locations. Henceforth the instruments at 1.2 m are referred to as screen level and
those in the surface fuel as litter level. Instruments were sampled using a programmable data logger at 10
second intervals and averages logged every 10 minutes. Air temperature and humidity instruments at
screen level were housed in a radiation screen. Air temperature and humidity instruments at litter level
were shielded from the sun by inserting these horizontally into the litter layer, in contact with the soil.
Because the heath needle and twig litter was too fine to provide an adequate shield, Banksia leaves were
used to shelter the instrument. Thermocouples were inserted into the soil at depths of 2 cm and 5 cm.
One thermocouple was attached to suspended fuel and two were attached to surface fuel. The
thermocouples were attached to the litter using clear sticky tape. The stations were deployed for 15 days
from 11 to 25 April 2007. The station in heath operated successfully for the entire measurements period
but as a result of problems with a data logger only 8 days of data were collected in the mallee. In
addition, standard meteorological measurements, including wind speed at 10 m height, were available
from a weather station situated in the open in a grass paddock 200 m to the east of the study area.
Observations from all days when all the stations were operational were averaged to give mean time series
at 1 h resolution for each of the three weather stations .

PROGRAM A :: REPORT NO. A.10.01
126
33BA.3.2. RESULTS As there were gaps between the heath plants and the structure of the plants was open, most of the heath
fuels were in full sunlight for much of the day and thus received most of the solar radiation measured
above the canopy (Fig. A3.1). The mallee canopy provided some shading, although the open nature of the
canopy and the canopy gaps meant that a significant amount of fuel was unshaded for much of the day.
Average radiation under the mallee canopy was 50.0% of that measured above the heath
Fig. A3.1. Global solar radiation at screen level in mallee and heath plots. Average of 8 days of
measurements.
Wind speed during the experiment followed a typical diurnal pattern with higher winds during the day due
to enhanced convective mixing driven by surface heating. Wind speeds were consistently lower under the
mallee during the day than above the heath (Fig. A3.2). There was no significant difference during the
night. As average nocturnal wind speeds were lower than the 0.4 m s-1 stopping speed of the anemometers
used, it is likely that night time wind speeds were slightly underestimated as very light winds will have
been recorded as zero. The average ratio of 1.5 m to weather station 10 m wind during the day was 0.25
for mallee and 0.35 for heath.

PROGRAM A :: REPORT NO. A.10.01
127
Fig. A3.2. Wind speed at screen level in mallee and heath plots. Average of 8 days of measurements.
The diurnal temperature range at screen level in mallee was smaller than in heath by 4 °C but there was
not a significant difference in mean temperature (Fig. A3.3a). Night time air temperatures were 1-2 °C
warmer in the mallee litter than in heath, possibly because the deeper litter layer provided more
insulation, or because the mallee canopy reduced radiative cooling. During the day air temperatures were
3 °C higher in the heath litter than in the mallee litter due to higher incident solar radiation.

PROGRAM A :: REPORT NO. A.10.01
128
Fig. A3.3. Air temperature (a) and relative humidity (b) measured at litter level and at screen level in
mallee and heath plots. c) Fuel temperature minus air temperature at screen level. d) Fuel relative
humidity minus air relative humidity, calculated using Eqn 2. See text for details. Average of 8 days of
measurements.
Specific humidity in both heath and mallee litter layers was significantly higher during the day than at
screen level (Fig. A3.4). During the night specific humidity was very slightly lower in the litter layer than
at screen level. These results indicate the presence of a water vapour source at ground level, which is
active only during the day. There is possibly also a weak sink during the night, although these results are
marginal. As soil moisture, measured by oven drying was 0.4%, the water vapour source may have been
located within the litter layer.
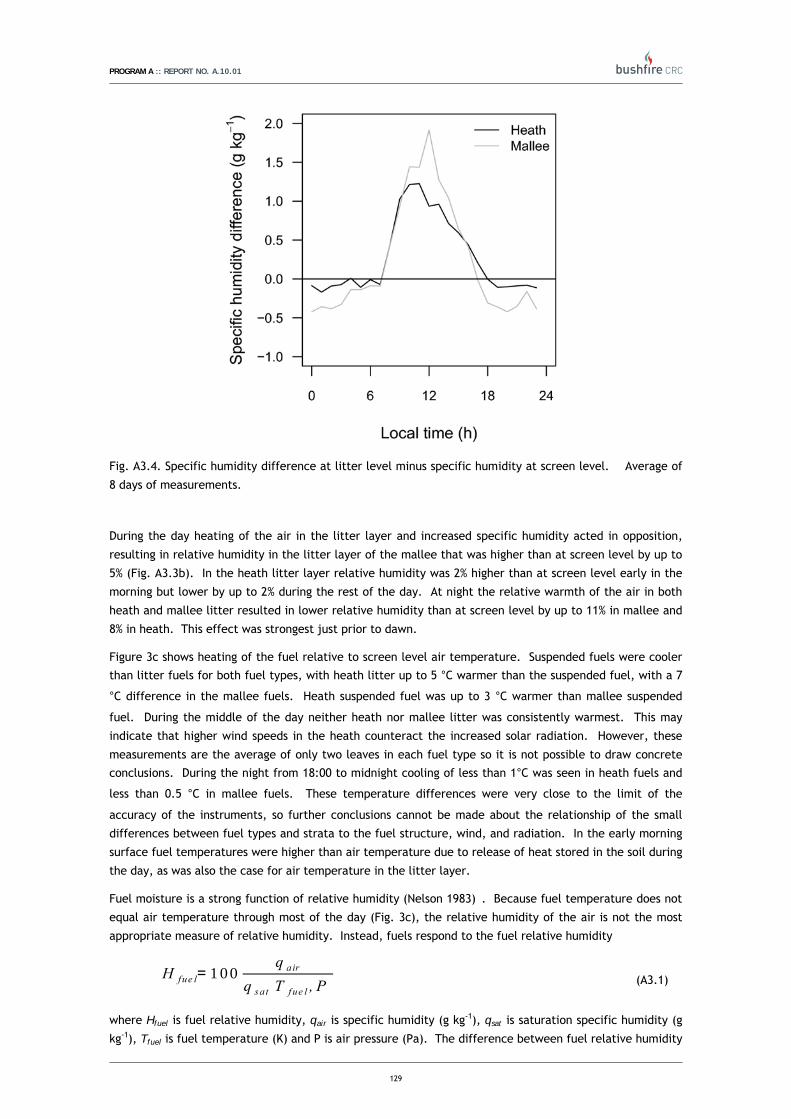
PROGRAM A :: REPORT NO. A.10.01
129
Fig. A3.4. Specific humidity difference at litter level minus specific humidity at screen level. Average of
8 days of measurements.
During the day heating of the air in the litter layer and increased specific humidity acted in opposition,
resulting in relative humidity in the litter layer of the mallee that was higher than at screen level by up to
5% (Fig. A3.3b). In the heath litter layer relative humidity was 2% higher than at screen level early in the
morning but lower by up to 2% during the rest of the day. At night the relative warmth of the air in both
heath and mallee litter resulted in lower relative humidity than at screen level by up to 11% in mallee and
8% in heath. This effect was strongest just prior to dawn.
Figure 3c shows heating of the fuel relative to screen level air temperature. Suspended fuels were cooler
than litter fuels for both fuel types, with heath litter up to 5 °C warmer than the suspended fuel, with a 7
°C difference in the mallee fuels. Heath suspended fuel was up to 3 °C warmer than mallee suspended
fuel. During the middle of the day neither heath nor mallee litter was consistently warmest. This may
indicate that higher wind speeds in the heath counteract the increased solar radiation. However, these
measurements are the average of only two leaves in each fuel type so it is not possible to draw concrete
conclusions. During the night from 18:00 to midnight cooling of less than 1°C was seen in heath fuels and
less than 0.5 °C in mallee fuels. These temperature differences were very close to the limit of the
accuracy of the instruments, so further conclusions cannot be made about the relationship of the small
differences between fuel types and strata to the fuel structure, wind, and radiation. In the early morning
surface fuel temperatures were higher than air temperature due to release of heat stored in the soil during
the day, as was also the case for air temperature in the litter layer.
Fuel moisture is a strong function of relative humidity (Nelson 1983)�. Because fuel temperature does not
equal air temperature through most of the day (Fig. 3c), the relative humidity of the air is not the most
appropriate measure of relative humidity. Instead, fuels respond to the fuel relative humidity
H fue l= 1 00q air
q sat�T fue l , P � (A3.1)
where Hfuel is fuel relative humidity, qair is specific humidity (g kg-1), qsat is saturation specific humidity (g
kg-1), Tfuel is fuel temperature (K) and P is air pressure (Pa). The difference between fuel relative humidity
PROGRAM A :: REPORT NO. A.10.01
130
and relative humidity at screen level is shown in Fig. A3.3d. As noted above, specific humidity varies
through the depth of the litter layer. The curves in Fig. A3.3d are calculated using specific humidity at
screen level, assumed to be the same as specific humidity at the very top of the litter layer. This is done
because the fuel moisture samples were taken from the surface of the litter layer. Relative humidity at
the bottom of the litter layer was higher because the fuel was cooler and the specific humidity was higher.
For the present study, measured litter level relative humidity is the same as fuel relative humidity at the
bottom of the litter layer. This is one reason that surface fuel moisture is consistently observed to be
lower than the moisture content of the entire litter layer, even in dry conditions (Matthews 2006)�.
Fuel relative humidity differed markedly from air relative humidity. Because there were only small
differences in screen level specific humidity between the mallee and heath (not shown) the fuel relative
humidity results mirrored the fuel heating results. Fuel relative humidity was lowest in surface fuels
during the day. The fuel relative humidity of the suspended heath fuels was only slightly higher than the
surface fuels, while for mallee it was up to 5% higher, due to the lesser heating of the mallee fuel. Results
at night were mixed. Cooling of suspended heath fuel from 18:00 to midnight resulted in fuel relative
humidity up to 4% above screen level humidity. The fuel relative humidity of the surface fuels began to
drop below screen level humidity early in the morning. This was due to the relative warmth of the
surface.
34BA.3.3. DISCUSSION Although the microclimate observations were typical of those seen in similarly structured vegetation types
(Porté et al. 2004, Silberstein et al. 2001, McCaw 1997), there were some aspects of particular interest
when understanding the effect of microclimate on fuel moisture. Firstly, specific humidity in the litter
layer was higher than at screen level, indicating the presence of a water vapour source near the ground.
As soil moisture in the top 5 cm was 0.4%, we hypothesise that the vapour source was the litter itself, with
the desorbing fuel releasing water vapour faster than it could be mixed up into the atmosphere. This
hypothesis requires further testing but if true it indicates that the litter plays a more complex role in
determining its own microclimate than previously thought. This would also violate the commonly used
assumption that in dry conditions specific humidity in the litter layer is the same as at screen level (Byram
and Jemison 1943, Nelson 1991). Because it was necessary to shelter the instruments from solar radiation
the humidity probes were placed at the bottom of the litter layers in both fuel types. This means that the
increase in specific humidity in Fig. 4 is the extreme value. At the top of the litter layer specific humidity
would be very close to the screen level value as water vapour released from the fuel can be immediately
mixed into the air above the litter. Absorption of solar radiation by the fuels increased their temperature
above air temperature. This heating was less for the suspended than litter fuels due to the greater surface
area available for heat loss by radiation and convection relative to the litter fuels, and also due to the
greater wind speed at screen level than ground level. These results indicate that the interactions of litter
heating/cooling and water vapour fluxes mean that it is not correct to simply assume screen level
measurements of air temperature and humidity can be applied directly to fuels.
In both the microclimate and fuel moisture measurements there were larger differences between surface
and suspended fuels than between fuel types. The biggest differences were seen for radiation and
suspended fuel temperatures. Because the suspended fuel temperatures were taken from single
thermocouples there is uncertainty in the representativeness of these measurements. Similar results were
found in pine forest by Porté et al. (2004) who found significant differences for radiation between stands
with differing basal areas but not for other microclimate measurements.

PROGRAM A :: REPORT NO. A.10.01
131
The microclimate and fuel moisture observations presented here show similar characteristics to those
measured in mallee-heath in Western Australia (McCaw 1997)� and heath in New South Wales (Plucinski
2003). McCaw observed moisture in Eucalyptus pachyloma Benth. litter to be up to 4% lower than that of
dead suspended Drosera drummondii Lehm. leaves. Plucinski observed that litter moisture contents in
several heath species were lower than suspended fuels during dry conditions but higher after rain, as was
the case in the present study. Although dead fuel moisture contents have been measured in shrublands for
fire behaviour experiments on other continents (Eriksson et al. 2003�, Fernandes et al. 2000�) the
measurements have not been presented in sufficient detail to allow a comparison with the present study.
However, it is expected that the microclimatic processes and differences in fuel moisture between litter
and suspended fuels observed in this study would be observed in all shrublands.

PROGRAM A :: REPORT NO. A.10.01
132
12BAPPENDIX 4 – VERTICAL WIND PROFILE A fluid flowing along a surface is subjected to viscous forces in the interface area between the fluid and
the surface. When considering wind flow, this interaction causes shearing forces to occur which will
determine a boundary layer where wind speed is reduced as proximity to the surface diminishes. The
knowledge of this vertical wind profile, as determined by physical characteristics of the surface, is
necessary to better understand fire dynamics. Information relative to wind ratios (10-m open wind
speed/eye-level (or mid-flame) wind speed) in different vegetation types is necessary to the accurate
prediction of fire behaviour.
The wind profile in a forest stand is complex and it is best described if divided into three different zones:
(1) above the canopy; (2) within the canopy sub-canopy space until a certain height above the surface (3)
from the bottom of the previous region until the surface. The partition of the profile into these three
different regions is due to the different profile shapes in these regions. Under neutral conditions, the wind
profile above the canopy and above the surface can be assumed logarithmic and be explained through the
following equation (Amiro and Davis 1988):
⎟⎟⎠
⎞⎜⎜⎝
⎛ −=
0
* lnz
dzku
u [A4.1]
Where u is the u(z) is the windspeed at height z, u* is the friction velocity, a characteristic velocity in the
turbulent boundary layer, k is the von Karman constant, d is the zero plane displacement height, and z0
the roughness length, a measure of the aerodynamic roughness of the surface. In equation [A4.1] there are
three unknowns, u*, z0 and d, with the additional complexity that they have some not well understood
dependence on wind speed, as wind distort and smooth the canopy (Grace 1977). The dependence of z0
and d on windspeed is rarely taken into account (Campbell and Norman 1998).
Within the canopy and upper sub-canopy space the wind is subject to a stronger wind shear and the
resulting profile can be described through an exponential relationship (Cionco 1965):
⎥⎦
⎤⎢⎣
⎡⎟⎠⎞
⎜⎝⎛ −= 1exp
hzss h α [A4.2]
Where sh is the wind velocity at the top of the canopy (h), and α the attenuation coefficient. In certain
stands there might occur a secondary wind maximum within the sub-canopy space (e.g. Bergen 1971,
Amiro 1990), which further complicates the definition of the wind profile. The attenuation coefficient is an
empirical coefficient dependent on a mean drag coefficient, leaf area index and a transfer coefficient for
momentum (Grace 1977).
The objective of the present appendix is to provide a simplified analysis of the vertical wind profiles found
in South Australia semi-arid mallee heath fuel types.
35BA.4.1. METHODS To characterize the vertical wind profiles in mallee–heath fuel types we sample wind speed variation with
height above ground through the use of a vertical array of five 2-D sonic anemometers (WindSonic 1, Gill
Instruments Ltd). The anemometers were typically positioned at 2-, 3-, 5-, 7- and 10-m above ground.
Wind profiles were sampled in four distinct fuel types: 1958 mallee; 1986 mallee; 1999 mallee and 1999
heath. Preliminary sampling in 2007 was restricted to one sample location per plot (plots D, M, N and P;
Table A4.1). In 2008 a sampling protocol was used where a 150 m long transect was established and wind
systematically sampled at three locations (0, 75 and 150 m) along the transect. This method was applied to

PROGRAM A :: REPORT NO. A.10.01
133
the mature mallee stands (plot AS1 and ZA). Vegetation cover and height was characterized at each
sample point. Data was acquired at 1 Hz. In order to smooth fluctuations the collected time series data
was smoothed using a 10-s moving average.
TABLE A4.1. DISTRIBUTION OF WIND SPEED PROFILE SAMPLES BY FUEL TYPE AND AGE.
Nominal fuel age
Fuel type 8 21 49
Mallee M AS1, AS2, AS3, N, P ZA1, ZA2, ZA3
Heath D - -
36BA.4.2. RESULTS The wind data was divided into three wind speed classes: low (5 < U10-m < 10 km/h), moderate (10 < U10-m <
20 km/h) and high (U10-m > 20 km/h). Data relative to calm conditions, typically U10-m < 5 km/h, was
removed from the analysis. The structure of lower wind profile is under this conditions is dominated by
small-scale turbulence and the data not amenable to the kind of analysis we are attempting here. The
wind speed data for the various measurement heights was normalized as a ratio function of the wind
measured at 10-m above the ground. Tests were conducted to verify if there were significant differences
between wind ratios for each wind speed class. Only 8 of the tested 147 wind ratios showed a significant
effect of wind speed class on wind ratio. From these results it was decided to disregard a possible effect of
wind speed on the wind normalized wind ratios.
Figure A4.1 shows the effect of stand structure on the vertical wind profiles. Wind attenuation is small in
the younger stands where canopy is absent (9-year heath) or of reduced height (1.5 m tall in the 9-year
mallee). The U2 (eye-level wind speed) - U10-m ratio (U2/U10-m) was above 0.8 in the 9-year heath and about
0.6 in the 9-year mallee. The various sampled wind profiles in the mature stands allowed to capture the
variability in wind ratios for a given fuel type. Wind profiles were found to be more variable in the 21-year
old fuels. This was attributed to the higher heterogeneity in fuel spatial distribution found in the sampled
21-year stands. For these stands the U2/U10-m wind ratios varied between 0.2, in areas characterize by a
high density of mallee clumps, to 0.5 in larger gaps between mallee clumps.

PROGRAM A :: REPORT NO. A.10.01
134
Figure A4.1. Measured wind ratios in SA mallee heath fuel types.
Table A4.2. presents approximate U2/U10-m wind ratios for the sampled fuel types/ages. These ratios can
be used as simplified rules-of-thumb that allow the conversion of the forecasted 10-m open wind speeds
into eye-level or midflame wind speeds driving surface fire propagation in mallee heath fuel types. These
results are consistent with U2/U10-m wind ratios obtained by McCaw (1997) and Tran and Pyrke (1999).
TABLE A4.2. U2/U10-m WIND RATIOS FOR MALLEE-HEATH FUEL TYPES.
Nominal fuel age
Fuel type 8 21 49
Mallee 0.61 0.42 0.33
Heath 0.83 - -