Embed Size (px)
Citation preview
SAFETY AND TRANSPORT
Fire Behaviors and smoke transportation law of tunnel fires under confined portal boundaries
Yongzheng Yao
RISE Rapport 2019:58
Preface This report contains a copy of the translated version of Yongzheng Yao’s PhD thesis. He has been educated at both University of Science and Technology of China and RISE Research Institutes of Sweden. On 26 Oct, 2019, he has successfully defended his thesis. His formal thesis in Chinese has been published by University of Science and Technology of China. The thesis consists of a significant amount of work that Yao conducted at RISE. To facilitate wider use of the results, he has translated it into this English version, which is published here as a RISE report. Haukur Ingason, Ying Zhen Li RISE Research Institutes of Sweden Borås, Sweden RISE Research Institutes of Sweden RISE Rapport 2019:58 ISBN 978-91-88907-85-1 ISSN 0284-5172 Borås 2019
RISE Research Institutes of Sweden
and
University of Science and Technology of China
A dissertation for doctor’s degree
Fire Behaviors and smoke transportation law of tunnel fires under confined portal boundaries
Author’s Name: Yongzheng Yao
Speciality: Safety Science and Engineering
Swedish supervisor: Prof. Haukur Ingason, Dr. Ying Zhen Li
Chinese supervisor: Prof. Heping Zhang, A.P. Xudong Cheng
Finished Time: May 15th, 2019
Abstract
I
Abstract
An increasing number of tunnels have been built around the world. They play
an important role to relieve traffic congestions and facilitate goods transportation.
However, in the event of a fire in tunnels, the consequences can be serious due to its
narrow-long structure. The previous studies about tunnel fire dynamics and
mitigation measures are mostly based on good ventilation conditions in tunnels, such
as longitudinal ventilation and natural ventilation with the premise that a tunnel has
two open portals. However, the studies about the characteristics of tunnel fires under
confined portal boundaries with complete or incomplete sealing at both portals are
rare. Typical fire scenarios can appear in a subway train, a building corridor, an
underground utility tunnel, a mining tunnel, a tunnel during construction and the
application of sealing tunnel portals for fighting large tunnel fires and so on. The
knowledge of tunnel fire dynamics for tunnels under good ventilation conditions is
probably not applicable to the scenarios of tunnel fires under confined portal
boundaries. Conducting the studies of tunnel fires under confined portal boundaries
is of great significance for better understanding the characteristics of this type of
tunnel fires and developing tunnel fire mitigation measures. Therefore, by combining
model-scale tunnel experiments and theoretical analyses, this thesis studies the fire
behaviors and smoke transportation law of tunnel fires under confined portal
boundaries. The main research contents include:
1.Scaling effects of mass loss rate per unit area (MLRPUA) for well-ventilated
pool fires are studied by summarizing large amounts of experimental data from the
literature together with theoretical analyses. As a further extension of tunnel fire
similarity theory, it provides the basis and reference for later model/medium-scale
tunnel experiments. Results show that when a small-scale pool fire (D<1 m) occurs
in the open, increasing wind velocity tends to increase the MLRPUA, especially for
pools with D<0.2 m. This is because the ventilation significantly increases the
conductive and convective heat feedbacks (leading role). But when small-scale pool
fires occurs in tunnels with a short distance between the pool surface and ceiling
(Hef/D<3), the radiative heat feedback from the tunnel ceiling is probably dominating,
leading to a much higher MLRPUA than that in the free burn. When subjected to
longitudinal flows, the MLRPUA decreases due to the reduced radiation effect from
Abstract
II
the ceiling. With the increase of pool diameter, the influence of wind on the
MLRPUA decreases gradually, no matter whether the pool occurs in the open or in a
tunnel. Finally, when the pool diameter exceeds 1 m, the radiation from flame itself
is probably predominant. The MLRPUA is not significantly affected by increasing
wind velocity and most likely fluctuates within 30% for a wide range of wind
velocities based on the test data collected.
2.The flame behaviors and the maximum gas temperature rise beneath the
ceiling in an enclosed tunnel are studied using a model-scale tunnel. Results show
that when a fire (small fire) is not located at the tunnel center, the flame inclines
towards the closer tunnel end due to the asymmetric flow field on both sides of the
flame. The flame inclination angle keeps increasing when the fire is moving away
from the tunnel center. Furthermore, when a fire is in Region I (0< d ≤0.64), the
maximum gas temperature rise decreases with the increasing dimensionless fire
distance due to the increasing flame inclination angle. When a fire is in Region II
(0.64 d 1), the maximum gas temperature rise increases with the increasing
dimensionless fire distance due to the heat feedback of returned hot smoke bounced
from the end wall. By introducing a concept of equivalent ventilation velocity based
on the flame inclination mechanism, a prediction model of maximum gas
temperature rise beneath the ceiling in Region I is developed. Beyond that, an extra
correction factor is proposed to the improved model in Region II with a
consideration of heat feedback of returned hot smoke bounced from the end wall.
Besides, further dimensional analysis indicates that the normalized maximum gas
temperature rise follows an exponential attenuation law with the dimensionless fire
distance.
3.The coupling control effects of sealing ratio and initial sealing time on the
fire development (large fire) are studied using a model-scale tunnel. Results show
that sealing tunnel portals can decrease the mass loss rate of fuel and gas temperature
inside the tunnel, no matter whether the sealing is complete or incomplete. The
earlier the initial sealing time is, the better the fire can be controlled. For the
incomplete sealing, when the sealing is implemented during the violent burning
stage, the sealing not only does not limit the fire growth but also exacerbates the
tunnel fire, producing an extremely high CO concentration at tunnel portals and a
longer ceiling flame jet. This will result in a huge threat to the rescue service at
tunnel portals. Besides, if the tunnel portals are sealed incompletely, it will leave a
Abstract
III
small area for the exchange of smoke and air. The smoke will not continue to spread
horizontally after leaving the tunnel portals under the action of inertial forces. In
order to maintain the combustion of fuel, the fresh air from external environment
flows into the tunnel vigorously and quickly from the gap and then uplifts the smoke
out of the tunnel portals, which is also an important phenomenon for firefighters and
needs to draw their attentions.
4.The critical conditions for the occurrence of under-ventilated tunnel fires and
the combustion mechanisms under confined portal boundaries are studied by using
both model-scale and medium-scale tunnels. Results show that the critical
equivalence ratio for the occurrence of under-ventilated tunnel fires is within 0.53 -
0.6, which is less than the theoretical value of 1. This is related to the occurrence of
vitiation, consequently reducing the level of oxygen around the flame by diluting the
O2 concentration. The low ventilation rate and vitiation result in a low O2 volume
fraction around the flame, and then the MLRPUA starts to decrease and at the same
time the air mass flow into the tunnel becomes almost constant. Also, an oscillating
MLRPUA and lifted flame are observed in the model-scale tests. Consequently, the
ventilation rate approaches and even reaches the amount required for complete
combustion of vaporized fuel. This means that the insufficient combustion in early
under-ventilated tunnel fires has converted to sufficient combustion (from the
perspective of the change of equivalence ratio, the fire has converted from
under-ventilated to well-ventilated). As a result, no significant increase in CO
production in under-ventilated fires is observed in both test series.
5.The critical conditions for the occurrence of self-extinguishment and
influencing factors in under-ventilated tunnel fires are studied in a model-scale
tunnel during construction. The tunnel consists of an inclined access tunnel and a
horizontal main tunnel. Results show that when a fire is in the horizontal main tunnel,
the critical equivalence ratio for self-extinguishment is within 0.28 - 1.38 for the
propane gas burner and 1.11 - 3.6 for the fibre board soaked with heptane. The
difference is related to the burning behavior of the different fuels used. Moreover,
the critical O2 volume fraction is about within 12 - 15% when the fires
self-extinguish. When a fire is at the closed end of the horizontal main tunnel, the
stratification of smoke is destroyed after hitting the closed end, and then the smoke
seems to spread over the entire cross section of the tunnel. The smoke spread
velocity is proportional to the ventilation rate. However, when a fire occurs at the
Abstract
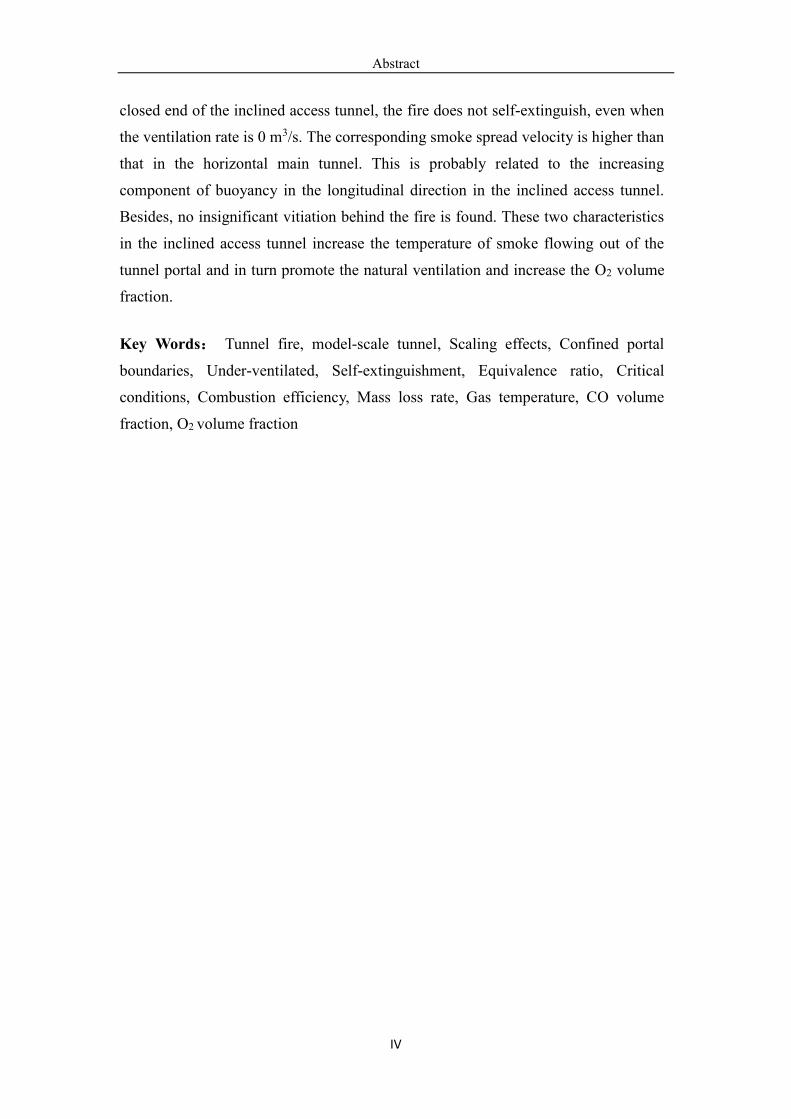
IV
closed end of the inclined access tunnel, the fire does not self-extinguish, even when
the ventilation rate is 0 m3/s. The corresponding smoke spread velocity is higher than
that in the horizontal main tunnel. This is probably related to the increasing
component of buoyancy in the longitudinal direction in the inclined access tunnel.
Besides, no insignificant vitiation behind the fire is found. These two characteristics
in the inclined access tunnel increase the temperature of smoke flowing out of the
tunnel portal and in turn promote the natural ventilation and increase the O2 volume
fraction.
Key Words: Tunnel fire, model-scale tunnel, Scaling effects, Confined portal
boundaries, Under-ventilated, Self-extinguishment, Equivalence ratio, Critical
conditions, Combustion efficiency, Mass loss rate, Gas temperature, CO volume
fraction, O2 volume fraction
Content
V
Content
Abstract .......................................................................................................................... 1
Content .......................................................................................................................... V
Chapter 1 Introduction ................................................................................................ 1
1.1 Background ....................................................................................................... 1
1.1.1 Characteristics and hazards of tunnel fires ................................................. 1
1.1.2 Tunnel fire control ...................................................................................... 5
1.2 Research status .................................................................................................. 7
1.2.1 Main research works in tunnels .................................................................. 7
1.2.2 Tunnel fires with confined portal boundaries ........................................... 14
1.3 Outline of this thesis ....................................................................................... 17
Nomenclature in this chapter ................................................................................... 19
Chapter 2 Tunnel fire similarity theory and scaling effects of pool fires ................. 21
2.1 Tunnel fire similarity theory ........................................................................... 21
2.1.1 Concept of similarity ................................................................................ 22
2.1.2 Scaling Techniques ................................................................................... 24
2.1.3 General Froude scaling ............................................................................. 25
2.1.4 Tunnel experiment platforms involved in this thesis ................................ 28
2.2 Scaling effects of pool fires ............................................................................ 29
2.2.1 Theoretical analysis .................................................................................. 31
2.2.1.1 Basical theory ..................................................................................... 31
2.2.1.2 Simplified calculation ......................................................................... 32
2.2.2 Experimental data collected ...................................................................... 38
2.2.3 Discussion ................................................................................................. 39
2.2.3.1 Comparison of MLRPUAs of different-scale pool fires in the open .. 39
2.2.3.2 Scaling effects of the MLRPUA under different wind velocities ....... 41
2.2.3.3 Comparison of MLRPUAs of different-scale pool fires in tunnels .... 42
Content
VI
2.2.3.4 Effects of radiation from tunnel boundaries ....................................... 44
2.3 Summary ......................................................................................................... 48
Nomenclature in this chapter ................................................................................... 49
Chapter 3 Maximum gas temperature rise beneath the ceiling in an enclosed tunnel
under different fire locations ........................................................................................ 51
3.1 Introduction ..................................................................................................... 51
3.2 Experiment and design .................................................................................... 53
3.3 Results and discussion .................................................................................... 55
3.3.1 Flame inclination ...................................................................................... 55
3.3.2 Maximum gas temperature ....................................................................... 56
3.3.3 Theoretical analysis for maximum gas temperaure rise ........................... 58
3.3.3.1 Equivalent longitudinal ventilation velocity ...................................... 58
3.3.3.2 Determination of coefficients ............................................................. 61
3.3.4 Dimensional analysis for maximum gas temperature rise ........................ 64
3.3.4.1 Dimensional analysis .......................................................................... 64
3.3.4.2 Determination of coefficients ............................................................. 65
3.4 Summary ......................................................................................................... 68
Nomenclature in this chapter ................................................................................... 69
Chaper 4 Application of sealing tunnel portals for fighting large tunnel fires ......... 71
4.1 Introduction ..................................................................................................... 71
4.2 Experiment and design .................................................................................... 72
4.2.1 Combustion system ................................................................................... 72
4.2.2 Measurement system ................................................................................ 73
4.2.3 Experimental scenarios ............................................................................. 75
4.3 Results and discussion .................................................................................... 76
4.3.1 Mass loss rate of fuel ................................................................................ 76
4.3.2 Gas temperature beneath the ceiling ......................................................... 78
4.3.3 Longitudinal temperature distribution ...................................................... 80
4.3.4 CO concentration at the tunnel portal ....................................................... 81
Content
VII
4.3.5 Gas temperature at the tunnel portal ......................................................... 83
4.4 Summary ......................................................................................................... 85
Chapter 5 The critical conditions for the occurrence of under-ventilated tunnel fires
and combustion mechanisms ....................................................................................... 87
5.1 Introduction ..................................................................................................... 87
5.2 Experiment and design .................................................................................... 88
5.2.1 Model-scale tunnel tests .............................................................................. 88
5.2.2 Medium-scale tunnel tests ........................................................................... 90
5.3 Results and discussion .................................................................................... 93
5.3.1 Mass loss rate per unit area ....................................................................... 93
5.3.2 Flame characteristics ................................................................................ 95
5.3.3 Equivalence ratio ...................................................................................... 96
5.3.4 O2 volume fraction and optical density .................................................... 97
5.3.5 Carbon monoxide (CO) and carbon dioxide (CO2) .................................. 99
5.3.6 Combustion efficiency ............................................................................ 101
5.4 Summary ....................................................................................................... 104
Nomenclature in this chapter ................................................................................. 105
Chapter 6 The critical conditions for the occurrence of self-extinguishment and
influencing factors in tunnel fires .............................................................................. 107
6.1 Introduction ................................................................................................... 107
6.2 Experiment and design .................................................................................. 108
6.2.1 Model-scale tunnel during construction ................................................. 108
6.2.2 Combustion system ................................................................................. 109
6.2.3 Ventilation system .................................................................................. 111
6.2.4 Measurement system .............................................................................. 112
6.3 Results and discussions ................................................................................. 115
6.3.1 Pre-test in the cone calorimeter .............................................................. 115
6.3.2 Self-extinguished fires ............................................................................ 116
6.3.2.1 Equivalence ratio .............................................................................. 117
6.3.2.2 The influence of fuel type in Tunnel B ............................................. 117
Content
VIII
6.3.2.3 The influence of fire location in Tunnel B ....................................... 122
6.3.2.4 The influence of slope in Tunnel A .................................................. 124
6.3.2.5 Other influencing factors .................................................................. 128
6.3.3 Smoke spread and descent ...................................................................... 130
6.3.3.1 Fire in the end of Tunnel B ............................................................... 131
6.3.3.2 Fire in the end of Tunnel A ............................................................... 136
6.4 Summary ....................................................................................................... 138
Chapter 7 Conclusions and future works ................................................................... 140
7.1 Conclusions ................................................................................................... 140
7.2 Innovation points .......................................................................................... 144
7.3 Future works ................................................................................................. 145
References .............................................................................................................. 146
Acknowledgement ................................................................................................. 156
Research achievements and awards during doctoral study .................................... 157
Chapter 1 Introduction
1
Chapter 1
Introduction
1.1 Background
With the rapid development of global economy and the gradual increase of
urban population, especially in developing countries[1-3], a large number of road
tunnels, subway tunnels and railway tunnels have been built or are being built
around the world. The use of tunnel relieves the traffic pressure and facilitates the
daily travel. Also, it improves the efficiency of long-distance travel and
transportation for passengers and goods, shortening time cost and creating economic
value. Together with the conveniences and benefits that tunnels bring to us, more
and more tunnel fire accidents have been reported. For different types of vehicles in
tunnels, e.g. the cars, buses, trucks, heavy goods vehicles, oil tankers, subway trains
and railway trains, they carry more or less combustible materials, which could
produce a fire heat release rate from several megawatts to hundreds of megawatts or
even higher. In the event of a tunnel fire caused by an electrical failure, an arson, a
physical collision and a fuel leakage, etc, the consequence could become
catastrophic. Therefore, the issue of tunnel fires has been a major concern for a long
time for transportation authorities around the world.
1.1.1 Characteristics and hazards of tunnel fires
Road tunnel, subway tunnel and railway tunnel are the main forms of traffic
tunnels. As they are all narrow and long structure, the basic characteristics of tunnel
fires are similar[4]. First, in a tunnel fire, large amounts of high-temperature smoke
and poisonous gas will be produced. Li et al.[5] found that the maximum ceiling
excess temperature in tunnel fires can reach 1350℃. The concrete structure will
experience a strength reduction and the concrete surfaces will fall off at high
temperature[6, 7]. Results from many fire accidents demonstrate that compared with
the direct heat injury caused by the flame and hot smoke, the consequences resulted
from the inhalation of poisonous gas (mainly including carbon monoxide, CO) are
more serious, which accounts for 75 - 85% of deaths in building fires. Second, the
Chapter 1 Introduction
2
smoke and poisonous gas can’t be discharged immediately after a tunnel fire. They
spread quickly along the tunnel ceiling under the action of buoyancy and thus
expands the fire hazards. Third, as the smoke descends gradually, the visibility in the
tunnel decreases, which may create panic for users. At the same time, the narrow
spaces and the complex road conditions further restrict the evacuation and rescue
service, and the stampede accident probably occurs, which occurs a secondary injury.
In reality, each type of tunnel has differences in use function, therefore their fire
characteristics are slightly different in some aspects, which produce different levels
of fire hazards.
(1) Road tunnel
Road tunnel has a high utilization rate and there are a large number of vehicles
running in road tunnels every day. The management of vehicles used the tunnels is
thus difficult, and road tunnel fires occurs more frequently than other tunnels. The
width of road tunnel is generally wider than that of subway tunnel and railway tunnel.
In addition, the length of road tunnel in urban areas is normally shorter, so the degree
of smoke accumulation inside the tunnel is lower, which provides more possibilities
for evacuation in case of a fire. In road tunnel fires, heavy goods vehicles and oil
tankers have the highest fire hazards[8]. They have a heat release rate level of
hundreds of megawatts, which may cause serious casualties and damage to the
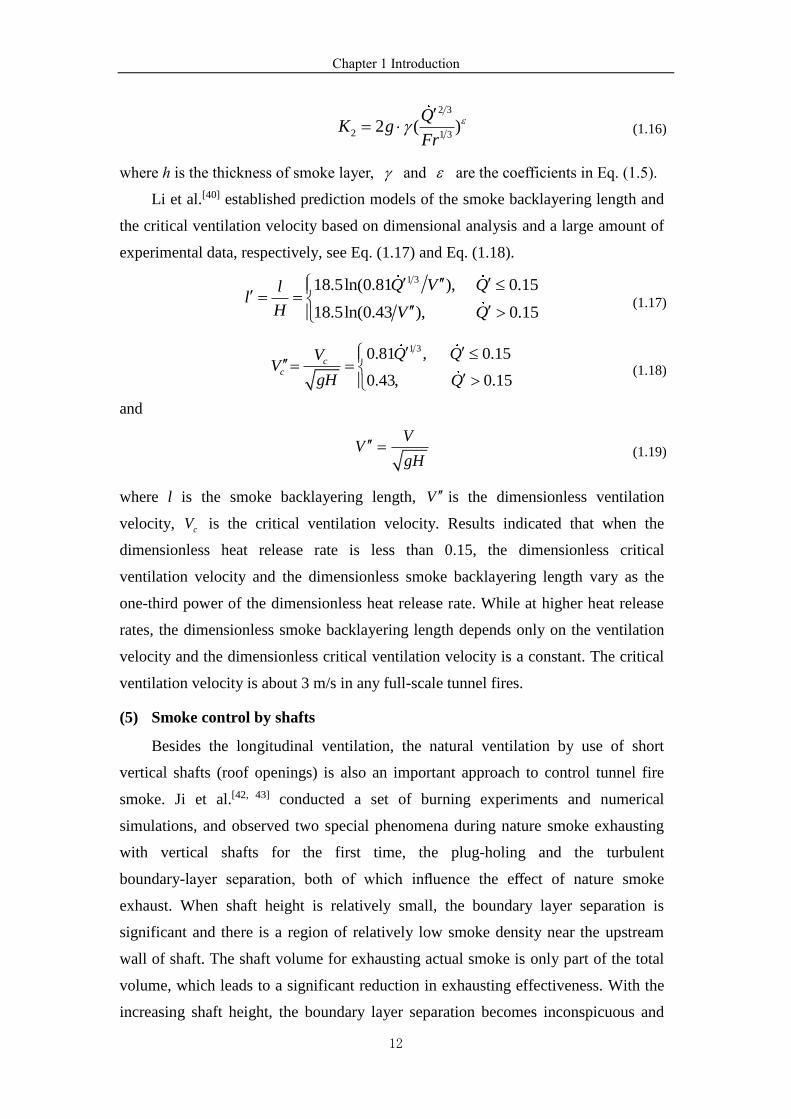
tunnel structure. A typical example is the Yanhou road tunnel fire in Shanxi, China
in 2014. Two oil tankers loaded with methanol collided in the tunnel, resulting in a
fire starting from the leaked methanol. The methanol fire spreads towards the low
side of the terrain, successively causing over 30 vehicles, including coal trucks, to
burn. At the same time, a large vehicle containing liquid natural gas exploded in the
tunnel. This tunnel fire accident resulted in 40 deaths, 12 injuries and damage of 42
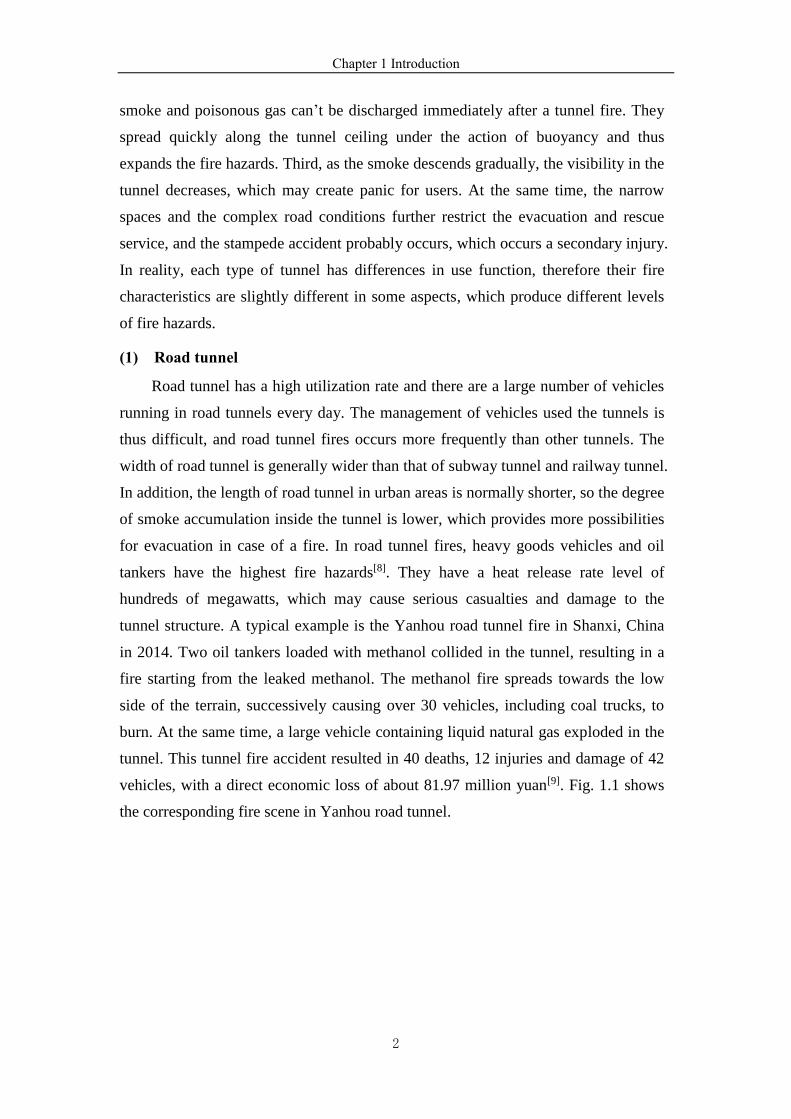
vehicles, with a direct economic loss of about 81.97 million yuan[9]. Fig. 1.1 shows
the corresponding fire scene in Yanhou road tunnel.
Chapter 1 Introduction
3
Figure 1.1 Yanhou road tunnel fire in Shanxi of China [9].
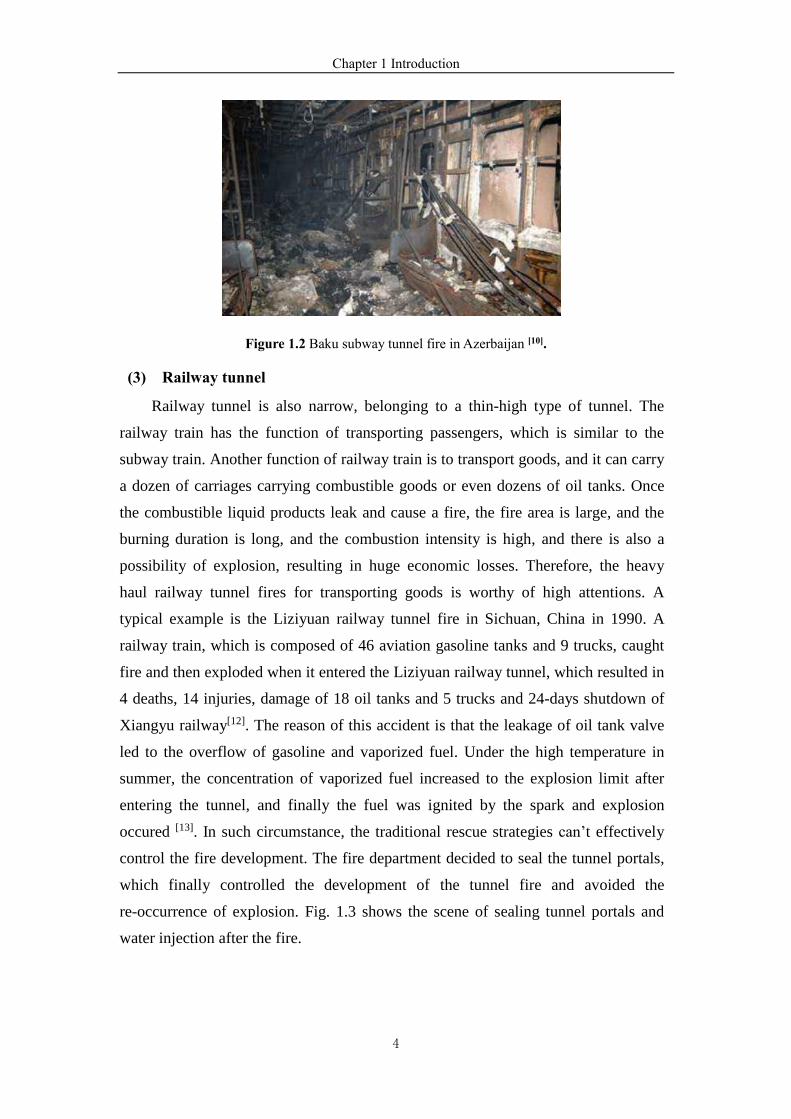
(2) Subway tunnel
The number of fires in subway tunnels is less than that in road tunnels, while
its fire hazards can be much higher. The subway trains mostly operate under the
ground, and both the running tunnel and the platform are relatively closed spaces,
with limited connections to the outside, so the smoke and poisonous gas produced
by the fire are difficult to be discharged. Besides, both the trains and platforms are
assembly occupancies, and the cross section of the running tunnels are normally
much smaller than the other vehicle tunnels. These characteristics make it difficult
for users to evacuate. Therefore, once a fire occurs in the subway tunnel, it is very
likely to cause a serious fire accident with a high number of casualties. The
reasons for the occurrence of a fire in the subway tunnel include electrical and
mechanical failures of vehicles, smoking, arson and terrorist attack[10]. A typical
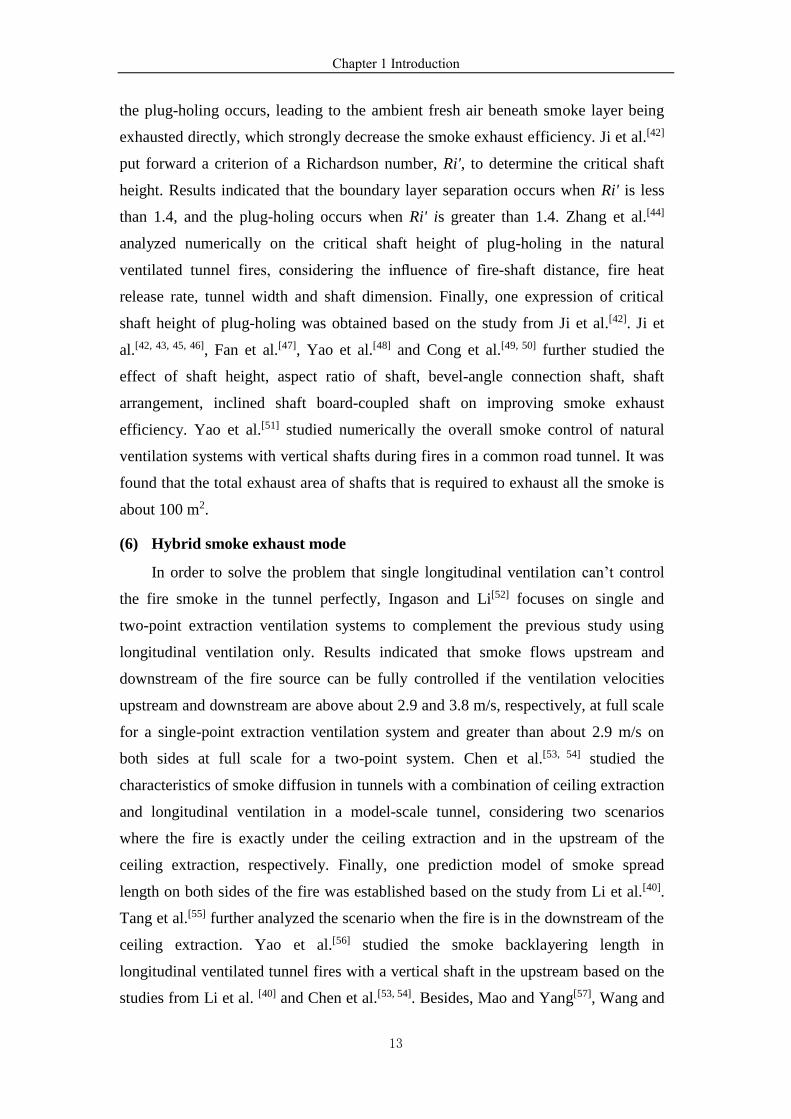
example is the Baku subway tunnel fire in Azerbaijan in 1995. When a subway
train carried with passengers just left the platform 200 m, all the lights in the train
were suddenly turned off due to the electrical failure. After that, a fire occurred
and then surrounded the passengers. At the same time, the doors and windows of
the train could not be opened and it was very dark in the train. Consequently,
many people were immersed in the flames and poisonous gas. This tunnel fire
accident resulted in 558 deaths and 269 injuries[11]. Fig. 1.2 shows the
corresponding fire scene in Baku subway tunnel.
Chapter 1 Introduction
4
Figure 1.2 Baku subway tunnel fire in Azerbaijan [10].
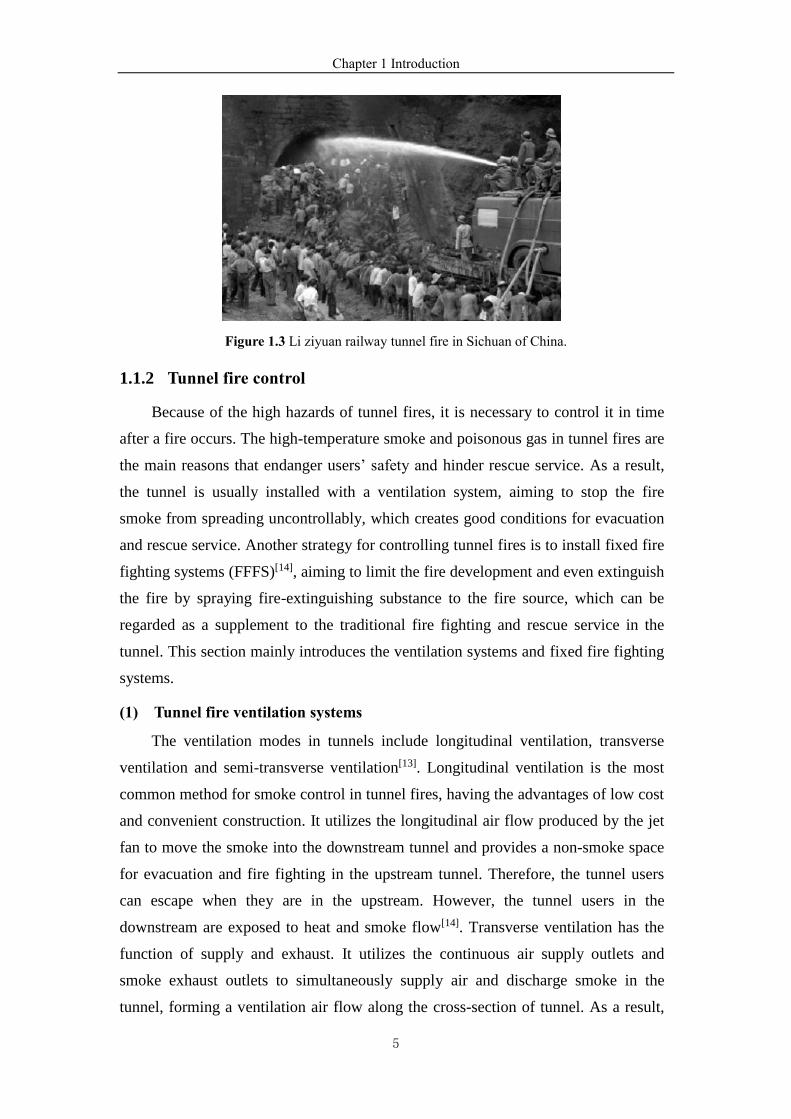
(3) Railway tunnel
Railway tunnel is also narrow, belonging to a thin-high type of tunnel. The
railway train has the function of transporting passengers, which is similar to the
subway train. Another function of railway train is to transport goods, and it can carry
a dozen of carriages carrying combustible goods or even dozens of oil tanks. Once
the combustible liquid products leak and cause a fire, the fire area is large, and the
burning duration is long, and the combustion intensity is high, and there is also a
possibility of explosion, resulting in huge economic losses. Therefore, the heavy
haul railway tunnel fires for transporting goods is worthy of high attentions. A
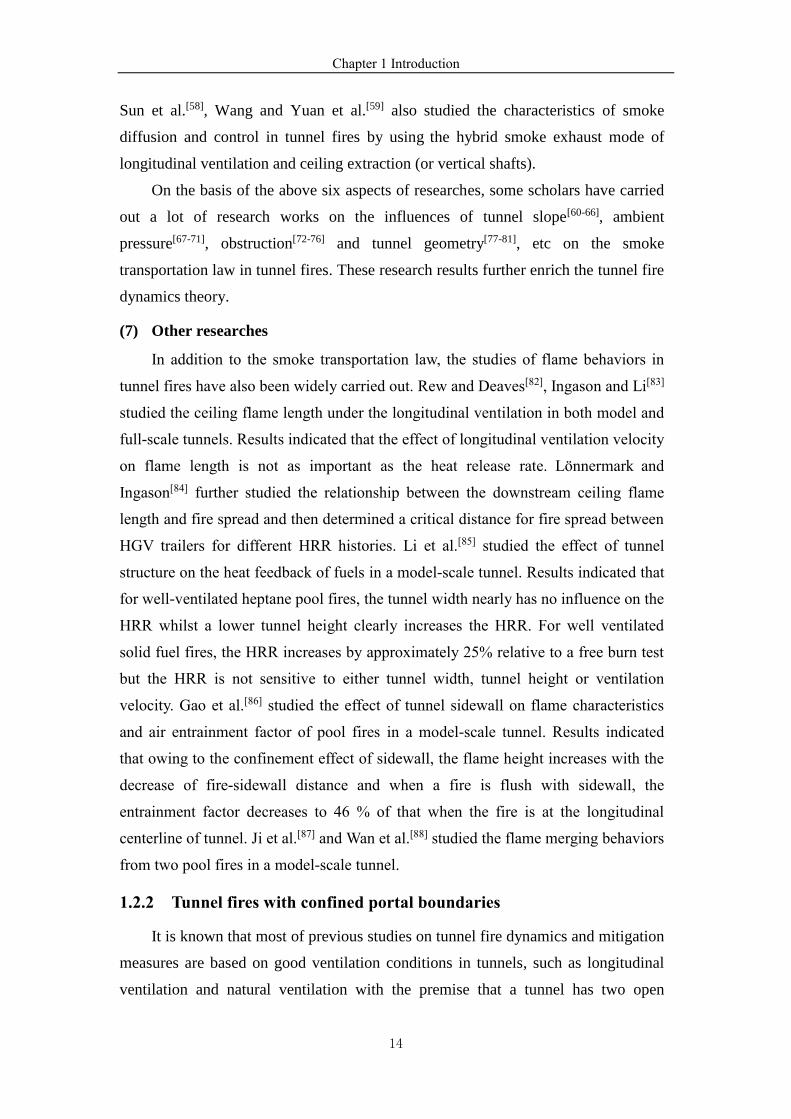
typical example is the Liziyuan railway tunnel fire in Sichuan, China in 1990. A
railway train, which is composed of 46 aviation gasoline tanks and 9 trucks, caught
fire and then exploded when it entered the Liziyuan railway tunnel, which resulted in
4 deaths, 14 injuries, damage of 18 oil tanks and 5 trucks and 24-days shutdown of
Xiangyu railway[12]. The reason of this accident is that the leakage of oil tank valve
led to the overflow of gasoline and vaporized fuel. Under the high temperature in
summer, the concentration of vaporized fuel increased to the explosion limit after
entering the tunnel, and finally the fuel was ignited by the spark and explosion
occured [13]. In such circumstance, the traditional rescue strategies can’t effectively
control the fire development. The fire department decided to seal the tunnel portals,
which finally controlled the development of the tunnel fire and avoided the
re-occurrence of explosion. Fig. 1.3 shows the scene of sealing tunnel portals and
water injection after the fire.
Chapter 1 Introduction
5
Figure 1.3 Li ziyuan railway tunnel fire in Sichuan of China.
1.1.2 Tunnel fire control
Because of the high hazards of tunnel fires, it is necessary to control it in time
after a fire occurs. The high-temperature smoke and poisonous gas in tunnel fires are
the main reasons that endanger users’ safety and hinder rescue service. As a result,
the tunnel is usually installed with a ventilation system, aiming to stop the fire
smoke from spreading uncontrollably, which creates good conditions for evacuation
and rescue service. Another strategy for controlling tunnel fires is to install fixed fire
fighting systems (FFFS)[14], aiming to limit the fire development and even extinguish
the fire by spraying fire-extinguishing substance to the fire source, which can be
regarded as a supplement to the traditional fire fighting and rescue service in the
tunnel. This section mainly introduces the ventilation systems and fixed fire fighting
systems.
(1) Tunnel fire ventilation systems
The ventilation modes in tunnels include longitudinal ventilation, transverse
ventilation and semi-transverse ventilation[13]. Longitudinal ventilation is the most
common method for smoke control in tunnel fires, having the advantages of low cost
and convenient construction. It utilizes the longitudinal air flow produced by the jet
fan to move the smoke into the downstream tunnel and provides a non-smoke space
for evacuation and fire fighting in the upstream tunnel. Therefore, the tunnel users
can escape when they are in the upstream. However, the tunnel users in the
downstream are exposed to heat and smoke flow[14]. Transverse ventilation has the
function of supply and exhaust. It utilizes the continuous air supply outlets and
smoke exhaust outlets to simultaneously supply air and discharge smoke in the
tunnel, forming a ventilation air flow along the cross-section of tunnel. As a result,
Chapter 1 Introduction
6
fire smoke can be controlled to a limited range. However, transverse ventilation has
the disadvantages of high cost and difficult installation. Semi-transverse ventilation
has half of the functions of transverse ventilation, including semi-transverse
ventilation for supply and semi-transverse ventilation for exhaust. Natural ventilation
by use of vertical shafts (roof openings) is a special form of semi-transverse
ventilation, which utilizes the stack effect to discharge the smoke through the shaft.
The natural ventilation shafts have been widely applied in road tunnels in the last
decades due to its advantages of without extra duct and power consumption.
(2) Fixed fire fighting systems
Common fixed fire fighting systems (FFFS) includes deluge water spray
systems, water mist systems, automatic sprinkler systems and foam systems[14].
Deluge water spray systems, water mist systems and automatic sprinkler system all
use water as the main extinguishing medium, and their differences mainly depend on
the operating pressure, the water droplet size and the activation way. Deluge water
spray systems are the most widely used fire fighting systems in tunnels, which
operate under low pressure (several atmospheric pressure). It is generally manually
activated and needs to use a lot of water to spray towards the fire area, consequently
extinguishing the fire in the way of surface cooling. Water mist systems operate
under high pressure (over 10 atm) with very small droplets, which can control the
fire in the way of cooling and oxygen asphyxiation. The amount of water required to
use is much less than that in deluge water spray systems. Automatic sprinkler
systems can be automatically activated when the temperature or heat flux reaches a
certain critical value, but it is seldom used in tunnels. Foam systems use foam as the
main extinguishing medium, which can extinguish the fire in the way of oxygen
asphyxiation, radiation isolation and cooling. Foam systems further include foam
water spray systems, high expansion foam systems and compressed air foam systems.
Foam water spray systems can control fires involving both flammable liquid spills
and solid material in tunnels. While high expansion foam systems and compressed
air foam systems are not applicable to tunnel fires as the foam may decrease the
visibility inside the tunnel[15].
Chapter 1 Introduction
7
1.2 Research status
The high hazards of tunnel fires attract high attentions of relevant stakeholders
around the world. In the past few decades, many scholars have been engaged in the
scientific research of tunnel fires, and have achieved great achievements, which
improve the understanding of tunnel fire dynamics and promote the development of
tunnel fire prevention and mitigation measures.
1.2.1 Main research works in tunnels
The poisonous gas is the main cause of casualties in tunnel fires. Therefore, the
studies of smoke transportation law are always the focus in the field of tunnel fires.
The specific research fields mainly include the following aspects:
(1) Smoke transportation, diffusion and stratification
Different from the free rise of fire plume in the open, the ceiling jet will be
formed after the fire plume reaches the ceiling in tunnel fires. Kunsch[16] divided the
fire plume in tunnels into five stages, i.e. rising plume, turning region near the
ceiling, radial spreading under the ceiling, transition from radial to one-dimensional
flow and one-dimensional flow under the ceiling parallel to the tunnel axis. Oka et
al.[17, 18] measured the vertical temperature and velocity distribution of smoke layer at
different longitudinal locations in a model-scale tunnel and then predicted the
velocity and temperature attenuation of a ceiling-jet. It was found that the thickness
of smoke layer is constant in the one-dimensional flow. Bailey et al.[19] developed
another prediction model for the spread velocity of smoke beneath the ceiling.
Results indicated that the velocity is proportional to the temperature rise of smoke
and the thickness of smoke layer. Newman[20] evaluated the fire-induced smoke
stratification in a medium-scale coal lane. Results indicated that three regions of
varying degrees of stratification can be identified in terms of specific Froude number
values. Region I is the buoyancy dominated temperature stratification where the gas
temperature near the floor is essentially ambient (Fr<0.9); and Region II is
dominated by strong interaction between imposed horizontal flow and buoyancy
forces. Although not severely stratified or layered, it has vertical temperature
gradients (0.9≤Fr≤10); and Region III has insignificant vertical temperature
gradients and consequently insignificant stratification (Fr>10). Yang et al.[21] studied
the effect of mechanical exhaust system on the buoyant flow stratification beneath
Chapter 1 Introduction
8
the ceiling in a model-scale tunnel. Results indicated that the thermal stratification
and the consequent flow patterns correlate well with the Richardson number. The
flow pattern can be divided into three categories, i.e. stable buoyant stratification
(Ri>0.9), stable buoyant flow stratification but with interfacial instability
(0.3<Ri<0.9), and unstable stratification (Ri<0.3). Ingason[22] measured the O2
volume fraction and gas temperature inside the smoke layer using different scale
tunnels. Results indicated that there is a correlation between the local temperature
and the O2 volume fraction.
(2) Maximum gas temperature rise beneath the ceiling
The maximum gas temperature rise beneath the ceiling is one of the most
important parameters in evaluating fire hazards and guiding fire detection. Alpert[23]
proposed a prediction model of maximum gas temperature rise of ceiling jet, which
is applied to specific scenarios that the distance from fire source to the nearest
vertical wall can’t be less than 1.8 times of ceiling height, see Eq. (1.1). That is, the
model doesn’t consider the smoke accumulation under the ceiling in tunnels.
2 3
max 5 316.9
ef
QT
H = (1.1)
where Q is the heat release rate and Hef is the effective tunnel height.
Kurioka[24] developed a prediction model of maximum gas temperature rise of
smoke layer by conducting both model and full-scale tunnel experiments. It is found
that the maximum gas temperature rise approaches infinity when the longitudinal
ventilation velocity approaches zero, which means the model doesn’t work when the
ventilation velocity is very low, see Eq. (1.2).
2 3
max
1 3
o
T Q
T Fr
=
(1.2)
where Q is the dimensionless heat release rate, see Eq. (1.3), Fr is the Froude
number, see Eq. (1.4).
1 2 5 2
o p oQ Q c T g H = (1.3)
2VFr
gH= (1.4)
Chapter 1 Introduction
9
where V is the longitudinal ventilation velocity, H is the tunnel height, oT is the
ambient air temperature, g is the gravity acceleration, o is the ambient air density
and pc is specific heat of air at constant pressure.
Values of and depend on:
2 3 1 3
2 3 1 3
1.35, 1.77, 6 5
1.35, 2.54, 0
Q Fr
Q Fr
= =
= = (1.5)
Li et al.[25] developed another prediction model of maximum temperature of
buoyancy-driven smoke flow beneath the ceiling based on a plume theory and a
large amount of experimental data, which considers the effect of ventilation velocity
on the flame behaviors, see Eq. (1.6). It is found that the influence is negligible when
the dimensionless ventilation velocity is less than 0.19, while the ventilation affects
the air entrainment and flame shape and therefore decreases the temperature when
the dimensionless ventilation velocity is greater than 0.19. Besides, Li et al.[5] found
that the maximum ceiling gas temperature can reach 1350°C by summarizing the
experimental data from large-scale experiments.
1 3 5 3
max 2 3
5 3
, 0.19
17.5 , 0.19
ef
ef
QV
Vb HT
QV
H
=
(1.6)
and
1 3
c
o p o
gQV V
b c T
=
(1.7)
where b is the radius of fire, V is the dimensionless longitudinal ventilation
velocity and cQ is the convective heat release rate.
These prediction models given by Alpert[23], Kurioka[24] and Li et al.[25] lay a
good foundation for further expanding the research scope of maximum gas
temperature rise in tunnel fires。
(3) Longitudinal temperature attenuation law
The longitudinal temperature attenuation beneath the ceiling is an important
characteristic in the process of smoke longitudinal diffusion, which reflects the heat
loss of smoke in the process of longitudinal diffusion in tunnels. Moreover, the
longitudinal temperature distribution along the tunnel can be obtained by combining
the maximum gas temperature rise with the temperature attenuation law. Evers and
Chapter 1 Introduction
10
Waterhouse[26], Delichatsios[27], Kim et al.[28], Bailey et al.[19], Hu et al.[29, 30], Gong
et al.[31], Zhao et al.[32] studied this issue successively. Delichatsios[27] studied the
longitudinal attenuation law of smoke temperature beneath the ceiling between two
vertical beams and established a prediction model, see Eq. (1.8).
1 31 3
6.672
max
0.492
x WSt
H HxT We
T H
−
=
(1.8)
where xT is the gas temperature rise beneath the ceiling at x m from the fire
source, maxT is the maximum gas temperature rise beneath the ceiling, W is the
tunnel width and St is the Stanton number.
Hu et al.[29] studied the attenuation law of longitudinal smoke temperature along
the tunnel by analyzing the continuity equation, energy square and heat transfer
equation in the process of longitudinal smoke diffussion, and established a
corresponding prediction model, see Eq. (1.9).
( )
max, max,
rK x xx x o
r r o
T T Te
T T T
− − −= =
− (1.9)
where max,rT is the maximum gas temperature rise beneath the ceiling at a
reference location, xr is the distance between the reference location and fire, and K is
the longitudinal temperature attenuation coefficient. Hu et al.[30] found that the
average temperature attenuation coefficient is 0.019 by conducting four groups of
full-scale tunnel experiments.
Gong et al.[31] established a thermal equilibrium equation by analyzing the heat
transfer process of longitudinal smoke diffusion, and then predicted the longitudinal
attenuation distribution using a double exponential function, see Eq. (1.10).
1 2
1 2
x a W x a Wx
o
TA e A e
T
− −= + (1.10)
where A1, A2, a1 and a2 is the fitting coefficient.
Zhao et al.[32] studied the effect of ventilation velocity on the longitudinal
temperature attenuation. Results indicated that the smoke temperature distribution in
the upstream seems to be much more sensitive to the ventilation velocity than that in
the downstream and finally a new modified temperature attenuation model at
upstream side of fire source was proposed.
Chapter 1 Introduction
11
(4) Smoke backlayering length and critical ventilation velocity
For the purpose of smoke control in tunnel fires, Thomas[33, 34], Heselden[35],
Danziger and Kennedy[36, 37], Oka and Atkinson[38], Wu and Bakar[39], Hu et al.[30]
and Li et al.[40] studied the smoke backlayering length and the critical ventilation
velocity successively. Thomas[33, 34] compared the buoyancy head of smoke flow and
the velocity head of fresh air flow, and defined the critical Froude number, see Eq.
(1.11).
2c
o c
gHFr
V
= (1.11)
Thomas suggested that the smoke backflow disappears when the critical Froude
number approaches 1. As a result, the prediction model of critical ventilation velocity
can be expressed as follows:
1 3
cc
o p
gQ HV
c TA
=
(1.12)
and
co
o p c
QT T
c AV= + (1.13)
where T is the gas temperature, A is the cross section area of tunnel. Based on the
experimental data from Lee et al.[41], it is found that the critical Froude number
varies from 4.5 to 6.7[40], while Kennedy[37] suggested that the critical Froude
number is 4.5.
Hu et al.[30] thought that the buoyancy should be equal to the inertial force when
the smoke front stops propagating, and then obtained a prediction model of the
smoke backlayering length by associating the static pressure difference and the
hydraulic pressure, see Eq. (1.14). Then a prediction model of the critical ventilation
velocity was further derived by setting the back-layering length to be 0, see Eq.
(1.15).
2 2ln[ ( )] / 0.019
hl K
V= (1.14)
1 2 2
2 3 32 ( )cV gh Q g H
+
= (1.15)
and
Chapter 1 Introduction
12
2 3
2 1 32 ( )
QK g
Fr
= (1.16)
where h is the thickness of smoke layer, and are the coefficients in Eq. (1.5).
Li et al.[40] established prediction models of the smoke backlayering length and
the critical ventilation velocity based on dimensional analysis and a large amount of
experimental data, respectively, see Eq. (1.17) and Eq. (1.18).
1 318.5ln(0.81 ), 0.15
18.5ln(0.43 ), 0.15
Q V Qll
H V Q
= =
(1.17)
1 30.81 , 0.15
0.43, 0.15
c
c
Q QVV
gH Q
= =
(1.18)
and
V
VgH
= (1.19)
where l is the smoke backlayering length, V is the dimensionless ventilation
velocity, cV is the critical ventilation velocity. Results indicated that when the
dimensionless heat release rate is less than 0.15, the dimensionless critical
ventilation velocity and the dimensionless smoke backlayering length vary as the
one-third power of the dimensionless heat release rate. While at higher heat release
rates, the dimensionless smoke backlayering length depends only on the ventilation
velocity and the dimensionless critical ventilation velocity is a constant. The critical
ventilation velocity is about 3 m/s in any full-scale tunnel fires.
(5) Smoke control by shafts
Besides the longitudinal ventilation, the natural ventilation by use of short
vertical shafts (roof openings) is also an important approach to control tunnel fire
smoke. Ji et al.[42, 43] conducted a set of burning experiments and numerical
simulations, and observed two special phenomena during nature smoke exhausting
with vertical shafts for the first time, the plug-holing and the turbulent
boundary-layer separation, both of which influence the effect of nature smoke
exhaust. When shaft height is relatively small, the boundary layer separation is
significant and there is a region of relatively low smoke density near the upstream
wall of shaft. The shaft volume for exhausting actual smoke is only part of the total
volume, which leads to a significant reduction in exhausting effectiveness. With the
increasing shaft height, the boundary layer separation becomes inconspicuous and
Chapter 1 Introduction
13
the plug-holing occurs, leading to the ambient fresh air beneath smoke layer being
exhausted directly, which strongly decrease the smoke exhaust efficiency. Ji et al.[42]
put forward a criterion of a Richardson number, Ri', to determine the critical shaft
height. Results indicated that the boundary layer separation occurs when Ri' is less
than 1.4, and the plug-holing occurs when Ri' is greater than 1.4. Zhang et al.[44]
analyzed numerically on the critical shaft height of plug-holing in the natural
ventilated tunnel fires, considering the influence of fire-shaft distance, fire heat
release rate, tunnel width and shaft dimension. Finally, one expression of critical
shaft height of plug-holing was obtained based on the study from Ji et al.[42]. Ji et
al.[42, 43, 45, 46], Fan et al.[47], Yao et al.[48] and Cong et al.[49, 50] further studied the
effect of shaft height, aspect ratio of shaft, bevel-angle connection shaft, shaft
arrangement, inclined shaft board-coupled shaft on improving smoke exhaust
efficiency. Yao et al.[51] studied numerically the overall smoke control of natural
ventilation systems with vertical shafts during fires in a common road tunnel. It was
found that the total exhaust area of shafts that is required to exhaust all the smoke is
about 100 m2.
(6) Hybrid smoke exhaust mode
In order to solve the problem that single longitudinal ventilation can’t control
the fire smoke in the tunnel perfectly, Ingason and Li[52] focuses on single and
two-point extraction ventilation systems to complement the previous study using
longitudinal ventilation only. Results indicated that smoke flows upstream and
downstream of the fire source can be fully controlled if the ventilation velocities
upstream and downstream are above about 2.9 and 3.8 m/s, respectively, at full scale
for a single-point extraction ventilation system and greater than about 2.9 m/s on
both sides at full scale for a two-point system. Chen et al.[53, 54] studied the
characteristics of smoke diffusion in tunnels with a combination of ceiling extraction
and longitudinal ventilation in a model-scale tunnel, considering two scenarios
where the fire is exactly under the ceiling extraction and in the upstream of the
ceiling extraction, respectively. Finally, one prediction model of smoke spread
length on both sides of the fire was established based on the study from Li et al.[40].
Tang et al.[55] further analyzed the scenario when the fire is in the downstream of the
ceiling extraction. Yao et al.[56] studied the smoke backlayering length in
longitudinal ventilated tunnel fires with a vertical shaft in the upstream based on the
studies from Li et al. [40] and Chen et al.[53, 54]. Besides, Mao and Yang[57], Wang and
Chapter 1 Introduction
14
Sun et al.[58], Wang and Yuan et al.[59] also studied the characteristics of smoke
diffusion and control in tunnel fires by using the hybrid smoke exhaust mode of
longitudinal ventilation and ceiling extraction (or vertical shafts).
On the basis of the above six aspects of researches, some scholars have carried
out a lot of research works on the influences of tunnel slope[60-66], ambient
pressure[67-71], obstruction[72-76] and tunnel geometry[77-81], etc on the smoke
transportation law in tunnel fires. These research results further enrich the tunnel fire
dynamics theory.
(7) Other researches
In addition to the smoke transportation law, the studies of flame behaviors in
tunnel fires have also been widely carried out. Rew and Deaves[82], Ingason and Li[83]
studied the ceiling flame length under the longitudinal ventilation in both model and
full-scale tunnels. Results indicated that the effect of longitudinal ventilation velocity
on flame length is not as important as the heat release rate. Lönnermark and
Ingason[84] further studied the relationship between the downstream ceiling flame
length and fire spread and then determined a critical distance for fire spread between
HGV trailers for different HRR histories. Li et al.[85] studied the effect of tunnel
structure on the heat feedback of fuels in a model-scale tunnel. Results indicated that
for well-ventilated heptane pool fires, the tunnel width nearly has no influence on the
HRR whilst a lower tunnel height clearly increases the HRR. For well ventilated
solid fuel fires, the HRR increases by approximately 25% relative to a free burn test
but the HRR is not sensitive to either tunnel width, tunnel height or ventilation
velocity. Gao et al.[86] studied the effect of tunnel sidewall on flame characteristics
and air entrainment factor of pool fires in a model-scale tunnel. Results indicated
that owing to the confinement effect of sidewall, the flame height increases with the
decrease of fire-sidewall distance and when a fire is flush with sidewall, the
entrainment factor decreases to 46 % of that when the fire is at the longitudinal
centerline of tunnel. Ji et al.[87] and Wan et al.[88] studied the flame merging behaviors
from two pool fires in a model-scale tunnel.
1.2.2 Tunnel fires with confined portal boundaries
It is known that most of previous studies on tunnel fire dynamics and mitigation
measures are based on good ventilation conditions in tunnels, such as longitudinal
ventilation and natural ventilation with the premise that a tunnel has two open
Chapter 1 Introduction
15
portals. However, in some special tunnel fire scenarios, the two tunnel portals are
incompletely or completely closed (which is defined as confined portal boundaries in
this thesis), and such examples include the fire in a subway train, a building corridor,
an underground utility tunnel, a mining tunnel, a tunnel during construction and the
application of sealing tunnel portals for fighting large tunnel fires and so on. Under
such conditions, the ventilation from the tunnel portals is confined significantly,
reducing the amount of air entrainment entering the tunnel, and limiting the exhaust
of smoke in the tunnel. As a result, the fire gas would be accumulated in the tunnel
and vitiate the combustion environment, and therefore the tunnel fire is probably
under-ventilated. In reality, the studies about the characteristics of tunnel fires under
confined portal boundaries are rare. The knowledge of tunnel fire dynamics for
tunnels under good ventilation conditions is probably not applicable to the scenarios
of tunnel fires under confined portal boundaries.
Ji et al.[89] studied the maximum gas temperature beneath the ceiling in a
model-scale tunnel with one portal closed and another portal opened. Results shown
that the maximum gas temperature rise increases exponentially with a shorter
distance (0.25 - 2 m) between the fire source and closed end wall, which results from
the heat feedback of returned hot gas bounced from the end wall. Ji [90] studied
numerically the sealing strategy in a full-scale heavy haul railway tunnel fires.
Results indicated that increasing the sealing ratio at two tunnel portals can
significantly decrease the temperature inside the tunnel, and after the sealing ratio
exceeds 70 % the temperature keeps almost constant. However, this conclusion is
obviously not applicable to all the tunnel fire scenarios of different heat release rates.
Chen et al.[91] further investigated the pool fire behaviors to different opening areas
by sealing at both tunnel portals in a model-scale tunnel. Results indicated that for a
given heat release rate, the temperature inside the tunnel first increases and then
decreases (under-ventilated) with the increase in sealing ratio. That is, there is a
critical sealing ratio where the temperature would reach the maximum. Chen et al.[92]
also studied the pool fire behaviors to asymmetrical sealing at both tunnel portals.
Results indicated that the hot smoke region shifts to the side not completely sealed,
and burning at the side with less sealing ratio is more violent with higher smoke
temperature. Huang et al.[93] studied numerically the effect of sealing ratio on the gas
temperature inside the tunnel by CFD simulation and given a corresponding
prediction model.
Chapter 1 Introduction
16
The equivalence ratio (ϕ) can be utilized to determine whether a fire is
well-ventilated (fuel-controlled) or under-ventilated (ventilation-controlled),
Tewarson[94] defined the expression of equivalence ratio see Eq. (1.20).
f
a
rm
m = (1.20)
where am is the air flow rate, fm is the mass loss rate of fuel and r is the
stoichiometric coefficient. Theoretically, it is thought that when ϕ < 1, the oxygen is
sufficient and the fire is well-ventilated, and the HRR is directly proportional to the
mass loss rate of fuel. When ϕ = 1, the combustion process is stoichiometric
(complete combustion). When ϕ > 1, the oxygen is not sufficient and the fire is
under-ventilated, and the HRR is directly proportional to the mass flow rate of air.
Ingason et al.[14] put forward an easy calculation method for the stoichiometric
coefficient. The chemical reaction equation between CHO fuel and ambient air can
be expressed as follows:
a b c 2 2 2 2 2
b c b b cC H O a (O 3.76N ) aCO H O a 3.76N
4 2 2 4 2
+ + − + → + + + −
(1.21)
where the molar ratio of nitrogen (N2) to oxygen (O2) in air is 3.76:1, and the molar
mass of air is 28.95g/mol, and (1+3.76)28.95=137.8. Therefore, the stoichiometric
coefficient (r) which gives the mass ratio of air to fuel required for stoichiometric
combustion of fuel to produce CO2 and H2O can be expressed as follows:
137.8(a b 4 c 2)
12a b 16cr
+ −=
+ + (1.22)
By associating the heat release rate ( Q ) and fm , Ingason et al[14] further given
another expression of the equivalence ratio, see Eq. (1.23).
3013
=a
Q
m (1.23)
Reviewing previous studies on tunnel fires, it is known that the studies about
the characteristics of tunnel fires under confined portal boundaries are rare.
Moreover, there are still some unsolved scientific questions, for example:
① The flame behaviors and maximum gas temperature rise beneath the ceiling
in an enclosed tunnel under different fire locations.
② The influences of initial sealing time on the fire development in the
application of sealing tunnel portals for fighting large tunnel fires.
Chapter 1 Introduction
17
③The characteristics of under-ventilated tunnel fires and self-extinguishment
and the critical conditions for the occurrence of under-ventilated tunnel fires and
self-extinguishment.
Therefore, by combining model/medium-scale tunnel experiments and
theoretical analyses, this thesis studies the fire behaviors and smoke transportation
law of tunnel fires under confined portal boundaries, considering the behaviors of
small fire in an enclosed tunnel for early detection, the development of large fires
under different sealing conditions for fire control, the characteristics of
under-ventilated tunnel fires and self-extinguishment for fire prediction. The purpose
of this study is to improve the understanding of tunnel fires under confined portal
boundaries and develop fire mitigation measures.
1.3 Outline of this thesis
There are seven chapters in this thesis:
The first chapter is the introduction. This chapter firstly introduces the
characteristics and mitigation measures of tunnel fires, and then gives a review of
tunnel fire researches, and finally introduces the outlines of this thesis.
The second chapter is about the tunnel fire similarity theory and scaling effects
of pool fires. This chapter first discusses the theoretical basis for conducting fire
experiments using model-scale tunnels and the scaling correlation of some important
fire parameters between different scales based on the Froude scaling. However, the
MLRPUA doesn’t comply with such as scaling. Therefore, through the theoretical
analysis and a large amount of experimental data collected, this chapter further
studies the scaling effects of pool fires, focusing on the coupling effects of wind
velocity, pool diameter and tunnel environment on the MLRPUA of pool fires. As a
further extension of tunnel fire similarity theory, it provides the basis and reference
for later model/medium-scale tunnel experiments.
The third chapter focuses on the maximum gas temperature rise beneath the
ceiling in an enclosed tunnel under different fire locations. When a fire occurs in an
enclosed tunnel, the flame behaviors are different from those in a normal tunnel. By
conducting model-scale tunnel experiments, the phenomenon of flame inclination
and the law of maximum gas temperature rise beneath the ceiling varying with
longitudinal fire location are observed. Then through the theoretical analysis and
Chapter 1 Introduction
18
dimensional analysis, the prediction model of maximum gas temperature rise is
developed, respectively. The outcomes are of great significance for understanding
the fire behaviors and guiding the early fire detection for enclosed tunnel fires.
The fourth chapter is on the application of sealing tunnel portals for fighting
large tunnel fires. After a tunnel fire increases to a large size, the traditional rescue
strategies may be unable to effectively control the development of the fire. In such
circumstances, sealing tunnel portals is an important strategy to control the fire in the
tunnel. By conducting model-scale tunnel experiments, some important fire
parameters were obtained and then the coupling control effects of sealing ratio and
initial sealing time on the fire development are studied. Moreover, some dangerous
scenarios that are adverse to rescue service during the sealing are also summarized.
The fifth chapter is about the critical conditions for the occurrence of
under-ventilated tunnel fires and combustion mechanisms. The combustion becomes
under-ventilated after sealing tunnel portals. By conducting model-scale and
medium-scale tunnel experiments, some important fire parameters were measured
and the critical conditions for the occurrence of under-ventilated tunnel fires are
quantified based on the equivalence ratio. Besides, the conversion mechanisms from
the insufficient combustion in early under-ventilated tunnel fires to sufficient
combustion are explained. The outcomes are of great significance for improving the
understanding of under-ventilated tunnel fires and guiding the fire control in tunnels.
The sixth chapter focuses on the critical conditions for the occurrence of
self-extinguishment and influencing factors in tunnel fires. In under-ventilated tunnel
fires, the fire will self-extinguish with a further decrease of ventilated rate (O2 level).
By conducting experiments in a model-scale tunnel during construction, the
influences of fuel type, fire location, and tunnel slope, etc on the fire development
are investigated, and the critical conditions for the occurrence of self-extinguishment
are quantified based on the equivalence ratio and O2 volume fraction. Finally, the
characteristics of smoke spread and descent in the tunnel with confined portal
boundaries are analyzed.
The seventh chapter includes the conclusions and future works. This chapter
first summarizes the main research conclusions of this thesis, and then introduces the
main innovation points, and finally puts forward the deficiencies of this thesis and
the prospects for future works.
Chapter 1 Introduction
19
The last parts of this thesis include the references, acknowledgment and the
published papers and awards of this author.
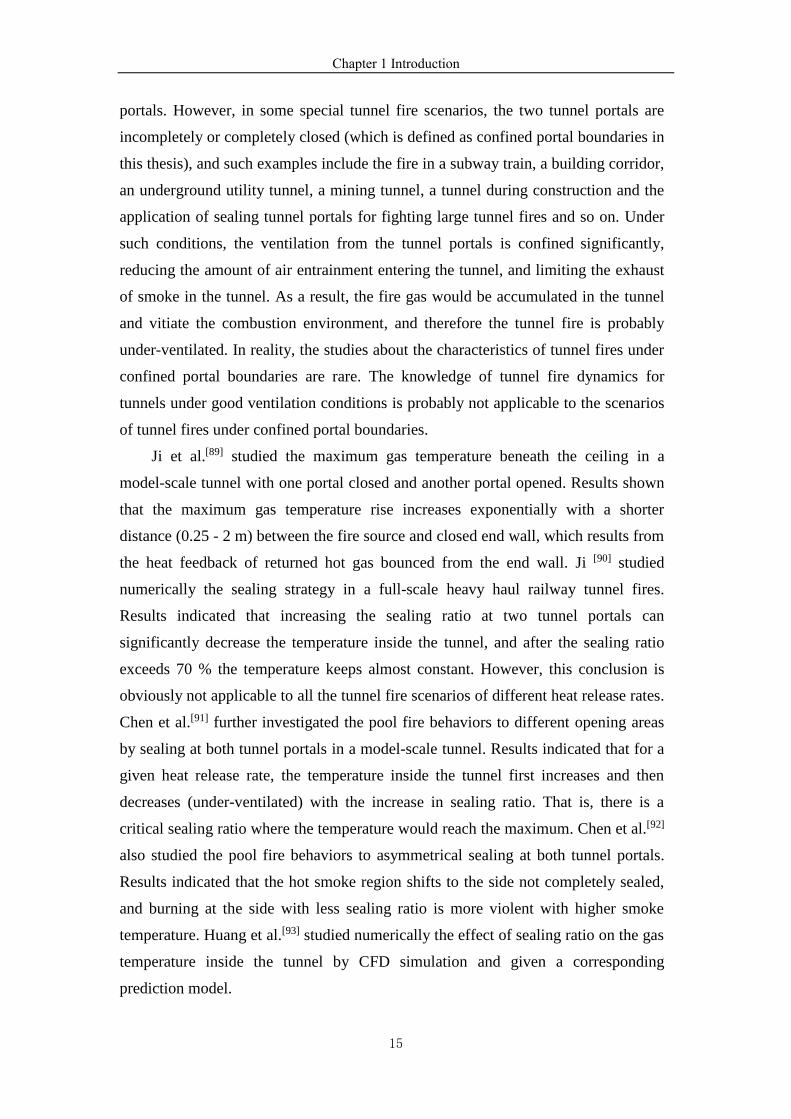
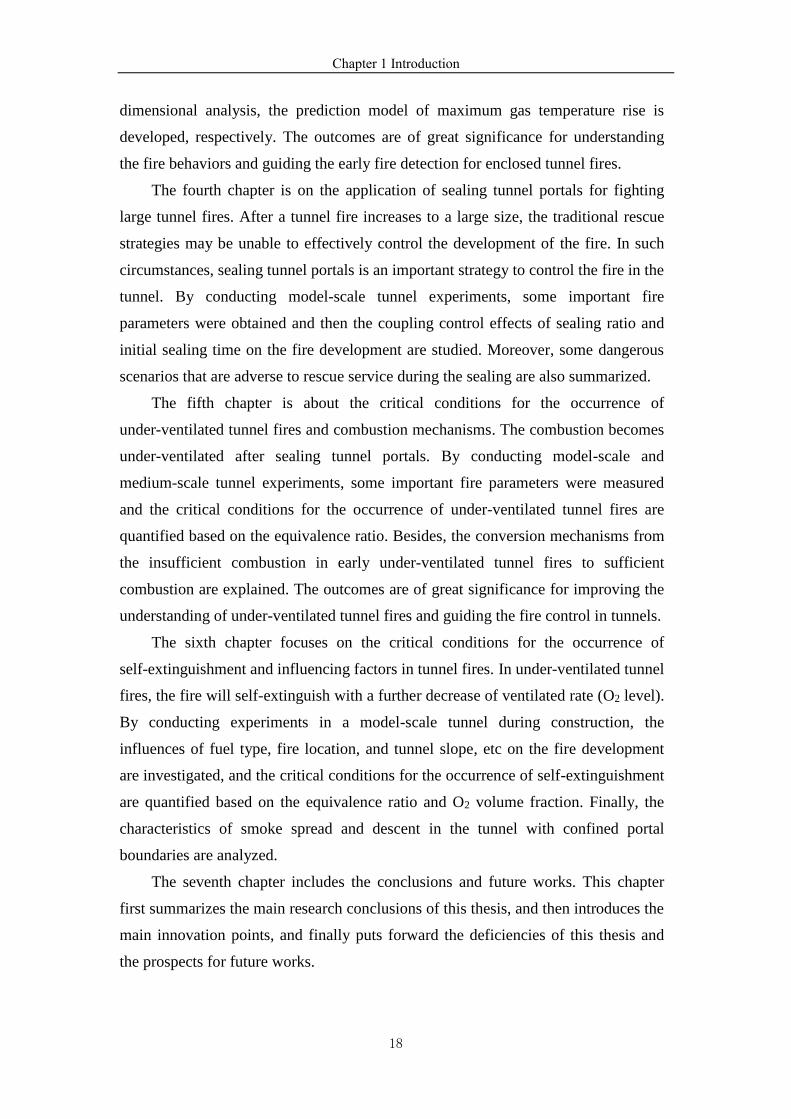
Figure 1.4 shows the technology roadmap of this thesis, which corresponds to
the content from the second chapter to the sixth chapter.
Figure 1.4 Technology roadmap of this thesis.
Nomenclature in this chapter
g: acceleration of gravity (m/s2)
cp: specific heat at constant pressure (kJ/(kg·K))
To: ambient air temperature (K)
T : gas temperature (K)
maxT : maximum gas temperature rise beneath the ceiling (K)
Small fire Early detection
Scaling effects of pool fires
Fire Behaviors and smoke transportation law of
tunnel fires under confined portal boundaries
Tunnel fire similarity theory
Model-scale tunnel Medium-scale tunnel
Maximum gas temperature rise beneath
the ceiling in an enclosed tunnel under
different fire locations
Application of sealing tunnel portals
for fighting large tunnel fires
Large fire Fire control
The critical conditions for the
occurrence of under-ventilated tunnel
fires and combustion mechanisms
Quantitative analysis Under-ventilated fires
The critical conditions for the
occurrence of self-extinguishment and
influencing factors in tunnel fires
Quantitative analysis Self-extinguishment
Chapter 1 Introduction
20
xT : gas temperature rise beneath the ceiling at x m from the fire source (K)
max,rT maximum gas temperature rise beneath the ceiling at reference location (K)
Q : heat release rate (kW)
Q : dimensionless heat release rate (-)
cQ : convective heat release rate (kW)
A: cross section area of tunnel(m2)
h: thickness of smoke layer (m2)
b: radius of fire (m)
H: tunnel height (m)
efH : effective tunnel height (m)
W: tunnel width (m)
l: smoke backlayering length (m)
l : dimensionless smoke backlayering length (-)
xr: distance between reference location and fire (m)
V: longitudinal ventilation velocity (m/s)
Vc: critical longitudinal ventilation velocity (m/s)
V : dimensionless longitudinal ventilation velocity (-)
V : dimensionless longitudinal ventilation velocity (-)
cV : dimensionless critical longitudinal ventilation velocity (-)
K: longitudinal temperature attenuation coefficient
Greek symbols
o : ambient air density (kg/m3)
and : coefficients in Eq. (1.5)
Chapter 2 Tunnel fire similarity theory and scaling effects of pool fires
21
Chapter 2
Tunnel fire similarity theory and scaling effects of pool fires
The ultimate goal of most large-scale pool fire tests is to obtain general
conclusions that can be applicable to actual fire scenarios. However, large-scale
fire tests are expensive so small-scale fire tests have been widely used in tunnel fire
researches. In this thesis, several series of model-scale tunnels were conducted to
investigate the research questions of this thesis. Therefore, this chapter discusses the
theoretical basis for conducting fire experiments using model-scale tunnels. The
conversion of experimental results for some important fire parameters (such as
velocity, temperature, time, heat release rate, etc) from model scale to full scale is
introduced combining with the Froude scaling. However, it is impossible to scale all
the fire parameters using scale technology between different scales. The mass loss
rate of unit area (MLRPUA) of pool fires is a typical example. The heat feedback
mechanisms on the pool surface vary greatly at different scales, and are affected by
the ventilation and tunnel environment, which complicates the predictions for the
MLRPUA. Therefore, this chapter further studies the scaling effects of
fuel-controlled pool fires, focusing on the coupling effects of wind velocity, pool
diameter and tunnel environment on the MLRPUA of pool fires.
2.1 Tunnel fire similarity theory
The large/full-scale tunnel fire experiments can provide the first-hand
information for the practical engineering applications, but it has shortcomings such
as long experimental period, high cost, complicated operation, inconvenient data
collection and poor repeatability, etc. These problems greatly limit the conduct of
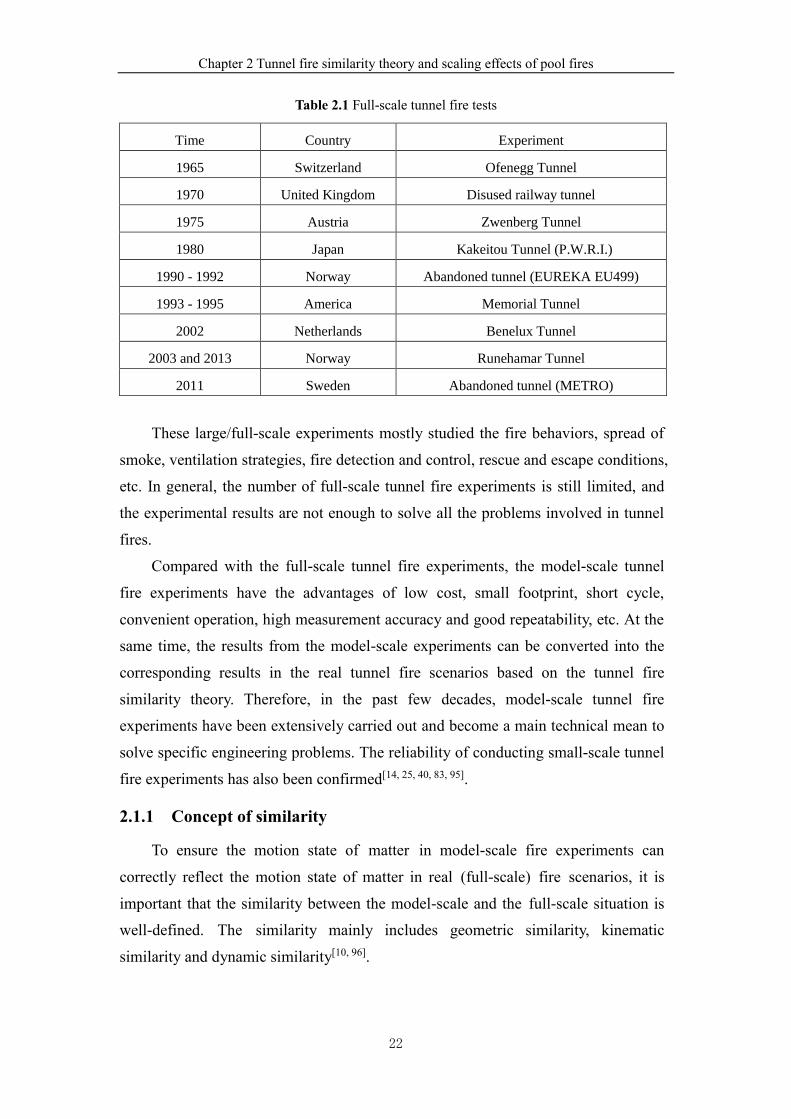
large/full-scale tunnel fire experiments. Several well-known full-scale tunnel fire
experiments in history are shown in Table 2.1[14].
Chapter 2 Tunnel fire similarity theory and scaling effects of pool fires
22
Table 2.1 Full-scale tunnel fire tests
Time Country Experiment
1965 Switzerland Ofenegg Tunnel
1970 United Kingdom Disused railway tunnel
1975 Austria Zwenberg Tunnel
1980 Japan Kakeitou Tunnel (P.W.R.I.)
1990 - 1992 Norway Abandoned tunnel (EUREKA EU499)
1993 - 1995 America Memorial Tunnel
2002 Netherlands Benelux Tunnel
2003 and 2013 Norway Runehamar Tunnel
2011 Sweden Abandoned tunnel (METRO)
These large/full-scale experiments mostly studied the fire behaviors, spread of
smoke, ventilation strategies, fire detection and control, rescue and escape conditions,
etc. In general, the number of full-scale tunnel fire experiments is still limited, and
the experimental results are not enough to solve all the problems involved in tunnel
fires.
Compared with the full-scale tunnel fire experiments, the model-scale tunnel
fire experiments have the advantages of low cost, small footprint, short cycle,
convenient operation, high measurement accuracy and good repeatability, etc. At the
same time, the results from the model-scale experiments can be converted into the
corresponding results in the real tunnel fire scenarios based on the tunnel fire
similarity theory. Therefore, in the past few decades, model-scale tunnel fire
experiments have been extensively carried out and become a main technical mean to
solve specific engineering problems. The reliability of conducting small-scale tunnel
fire experiments has also been confirmed[14, 25, 40, 83, 95].
2.1.1 Concept of similarity
To ensure the motion state of matter in model-scale fire experiments can
correctly reflect the motion state of matter in real (full-scale) fire scenarios, it is
important that the similarity between the model-scale and the full-scale situation is
well-defined. The similarity mainly includes geometric similarity, kinematic
similarity and dynamic similarity[10, 96].
Chapter 2 Tunnel fire similarity theory and scaling effects of pool fires
23
(1) Geometric similarity
If an object can coincide with another object after being uniformly changed,
these two objects are called to be geometric similarity. For example, the ratio of length,
width and height between the model-scale tunnel and the full-scale tunnel should be
the same. If the corresponding streamlines in two flow fields can coincide after
uniform deformation, these two flow fields are called to be geometric similarity.
Modellength
Full
lC
l= (2.1)
(2) Kinematic similarity
When two geometrically similar objects move, if the motion path of the
corresponding points is geometrically similar, and the ratio of the velocity of the
corresponding points is constant (the direction is also the same), these two objects
are called to be kinematic similarity. In two geometrically similar flow fields, if the
ratio of the velocity of the fluid on the corresponding flow line is constant (the
direction is also the same), the two flow fields are called to be kinematic similarity.
Modelvelocity
Full
uC
u= (2.2)
(3) Dynamic similarity
For two objects of geometrical and kinematic similarity, if the ratio of the force
of the corresponding points is constant (the direction is also the same), these two
objects are called to be dynamic similarity. For two flow fields of geometrical and
kinematic similarity, if the ratio of the force of the fluid on the corresponding flow
line is constant (the direction is also the same), the two flow fields are called to be
dynamic similarity.
ModelForce
Full
FoC
Fo= (2.3)
The forces involved in fluid mechanics mainly include inertial force, gravity,
viscous force, elastic force, pressure and surface tension. The ratios between the
inertial force and the gravity, viscous force, elastic force, pressure and surface
tension constitute different non-dimensional numbers (similarity criterion numbers),
respectively, i.e. Froude number ( 2Fr u gl= ), Reynolds number ( Re ul = ), Mach
number ( Ma u c= ), Euler number ( 2Eu p u= ) and Weber number
( 2We lu = )[10]. Therefore, if the ratio of each force in two flow fields is constant
Chapter 2 Tunnel fire similarity theory and scaling effects of pool fires
24
(dynamic similarity), that is, the two flow fields can preserve different
non-dimensional numbers, which plays an important role for conducting model-scale
tunnel fire experiments.
Generally, it is important to preserve all the non-dimensional numbers, e.g. the
Froude number, the Reynolds number, and the Richardson number. For perfect
scaling, all of these numbers should be the same in the model-scale and in the
full-scale. Clearly, it is neither necessary nor possible to preserve all the terms by
similarity theory simultaneously in model-scale experiments. The terms that are most
important and most related to the study should be preserved.
2.1.2 Scaling Techniques
(1) Pressure scaling
Pressure scaling technology needs to preserve both the Froude number and the
Reynold number by adjusting the environmental pressure in the test bed. In the
pressure scaling, the pressure scales as 3/2 power of the length scale. This implies
that the pressure needs to be adjusted to very high levels in model scale. This
technique is only applicable to the flow and combustion processes that are affected
significantly by Reynolds number or have a large change of pressure in system, such
as the leakage combustion of high-pressure combustible gases[8, 10, 14].
(2) Analog scaling
The analog scaling technology uses the density differences of two fluids to
simulate the smoke movement in a real fire scenario, which is in fact also a type of
Froude scaling. Common experimental media include the combination of air and
helium[97], as well as the combination of water and saturated salt water[98]. It is easier
to achieve the turbulent flow conditions due to the small viscosity for water.
However, the analog scaling technology can’t be used to study the heat transfer
between the smoke and tunnel wall, and the radiation of fire plume[99, 100], which
greatly limits its application in tunnel fires.
(3) Froude scaling
Froude scaling technology needs to preserve the Froude number. The driving
force of tunnel fire plume is the buoyancy and the Froude number characterizes the
ratio of inertial force to buoyancy. Therefore, when conducting model-scale tunnel
fire experiments, it is necessary to preserve the Froude number between different
scales. The Reynolds number is not preserved but the fluid mode should be kept the
Chapter 2 Tunnel fire similarity theory and scaling effects of pool fires
25
same to preserve the similarity in the fluid field[14]. The other similarity criterion
numbers are generally partially scaled or implicitly scaled. Section 2.1.3 of this
chapter provides a more detailed introduction about the application of Froude scaling
technology in developing scaling correlations.
2.1.3 General Froude scaling
The controlling equation method and dimensional analysis method are the most
common methods for obtaining scaling correlations. This section obtains some
important dimensionless numbers that affect the scaling correlations by using
controlling equation method, and then based on the Froude scaling, some important
scaling correlation expressions in tunnel fires are obtained. The dimensional analysis
method is used in the content of Section 3.3.4 of Chapter 3.
The smoke movement of tunnel fires is a complex unsteady three-dimensional
turbulent flow, and its flow satisfies the differential control equations of mass,
momentum and energy conservation. For simplification, only the one-dimensional
differential control equations of mass, momentum and energy conservation are
discussed here[14, 101, 102].
Mass conservation equation:
( )u
mt x
+ =
(2.4)
Component transport equation:
( )ii i
i i
uYY YN m
t x x x
+ = +
(2.5)
Momentum conservation equation:
( ) ( )
( )2
02
ˆ4
ˆ3
u uu u pg
t x x x
+ = − + −
(2.6)
Energy conservation equation:
( ) ( ) 2 2
2 2
4
3
p p
loss
c T uc T T u p pk Q Q
t x x x t x
+ = + − + + +
(2.7)
where is the density, t is the time,u is the velocity, T is the temperature, p
is the pressure, x is the axis, g is the gravitational acceleration, is the kinetic
viscosity, k is the heat conductivity, pc is the specific heat at constant pressure,
iY is the mass fraction for i-th species, iN is the mass diffusivity for i-th species,
Chapter 2 Tunnel fire similarity theory and scaling effects of pool fires
26
m is the mass flow rate per unit volume, Q is the heat release rate per unit
volume and lossQ is the heat loss rate per unit volume. The characteristic density
o ,
characteristic time to, characteristic velocity uo, characteristic temperature To,
characteristic pressure Po and characteristic length l are introduced as reference
values and then the corresponding parameters can be normalized with a
dimensionless form denoted by (^), i.e. ˆo = , ˆ
ot t t= , ˆou u u= , ˆ
oT T T= ,
ˆop p p= and x̂ x l= . As a result, the differential controlling equations group in a
dimensionless form can be expressed as follows:
Mass conservation equation:
( )ˆ ˆˆ
ˆ ˆo o o
o
uum
t t l x
+ =
(2.8)
Component transport equation:
( )
2
ˆ ˆˆˆ
ˆ ˆ ˆ ˆ
io i o o o i ii
o
uYY u D Ym
t t l x l x x
+ = +
(2.9)
Momentum conservation equation:
( ) ( )
( )2
2 2
ˆ ˆˆ ˆ ˆ ˆ ˆ4ˆ1
ˆ ˆ ˆ ˆ3
o o o o o o oo
o
u uuu u u u Pu pg
t t l x l x l x
+ = − + −
(2.10)
Energy conservation equation:
( ) ( ) 2 2
2 2 2 2
ˆ ˆˆ ˆ ˆ ˆ ˆ ˆ ˆ4ˆ
ˆ ˆˆ ˆ ˆ ˆ3
o p o o p o o o o o o oloss
o o
T uTc T c u T kT u P u PT u p pQ Q u
t t l x l x l x t t l x
+ = + − + + +
(2.11)
By deforming and arranging the coefficients of the above differential controlling
equations group, a new form of differential controlling equations group is given and
12 sets of dimensionless numbers are obtained:
Mass conservation equation:
( )
1 2
ˆ ˆˆ
ˆ ˆ
u
t x
+ =
(2.12)
Component transport equation:
( )
1 3 4
ˆ ˆˆˆ
ˆ ˆ ˆ ˆ
ii iuYY Y
t x x x
+ = +
(2.13)
Momentum conservation equation:
( ) ( )
( )2
1 5 6 72
ˆ ˆˆ ˆ ˆ ˆ ˆ4ˆ1
ˆ ˆ ˆ ˆ3
u uu u p
t x x x
+ = − + −
(2.14)
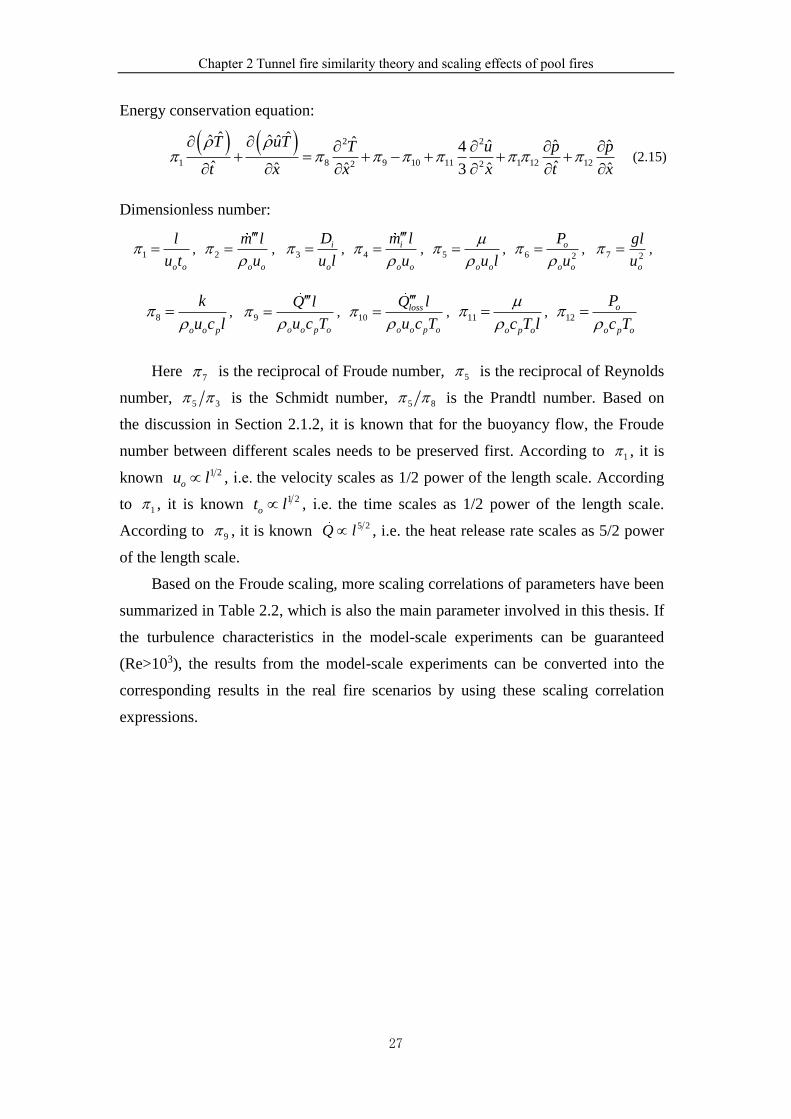
Chapter 2 Tunnel fire similarity theory and scaling effects of pool fires
27
Energy conservation equation:
( ) ( ) 2 2
1 8 9 10 11 1 12 122 2
ˆ ˆˆ ˆ ˆ ˆ ˆ ˆ ˆ4
ˆ ˆˆ ˆ ˆ ˆ3
T uT T u p p
t x x x t x
+ = + − + + +
(2.15)
Dimensionless number:
1
o o
l
u t = , 2
o o
m l
u
= , 3
i
o
D
u l = , 4
i
o o
m l
u
= , 5
o ou l
= , 6 2
o
o o
P
u
= , 7 2
o
gl
u = ,
8
o o p
k
u c l
= , 9
o o p o
Q l
u c T
= , 10
loss
o o p o
Q l
u c T
= , 11
o p oc T l
= , 12
o
o p o
P
c T
=
Here 7 is the reciprocal of Froude number, 5 is the reciprocal of Reynolds
number, 5 3 is the Schmidt number, 5 8 is the Prandtl number. Based on
the discussion in Section 2.1.2, it is known that for the buoyancy flow, the Froude
number between different scales needs to be preserved first. According to 1 , it is
known 1 2
ou l , i.e. the velocity scales as 1/2 power of the length scale. According
to 1 , it is known 1 2
ot l , i.e. the time scales as 1/2 power of the length scale.
According to 9 , it is known 5 2Q l , i.e. the heat release rate scales as 5/2 power
of the length scale.
Based on the Froude scaling, more scaling correlations of parameters have been
summarized in Table 2.2, which is also the main parameter involved in this thesis. If
the turbulence characteristics in the model-scale experiments can be guaranteed
(Re>103), the results from the model-scale experiments can be converted into the
corresponding results in the real fire scenarios by using these scaling correlation
expressions.
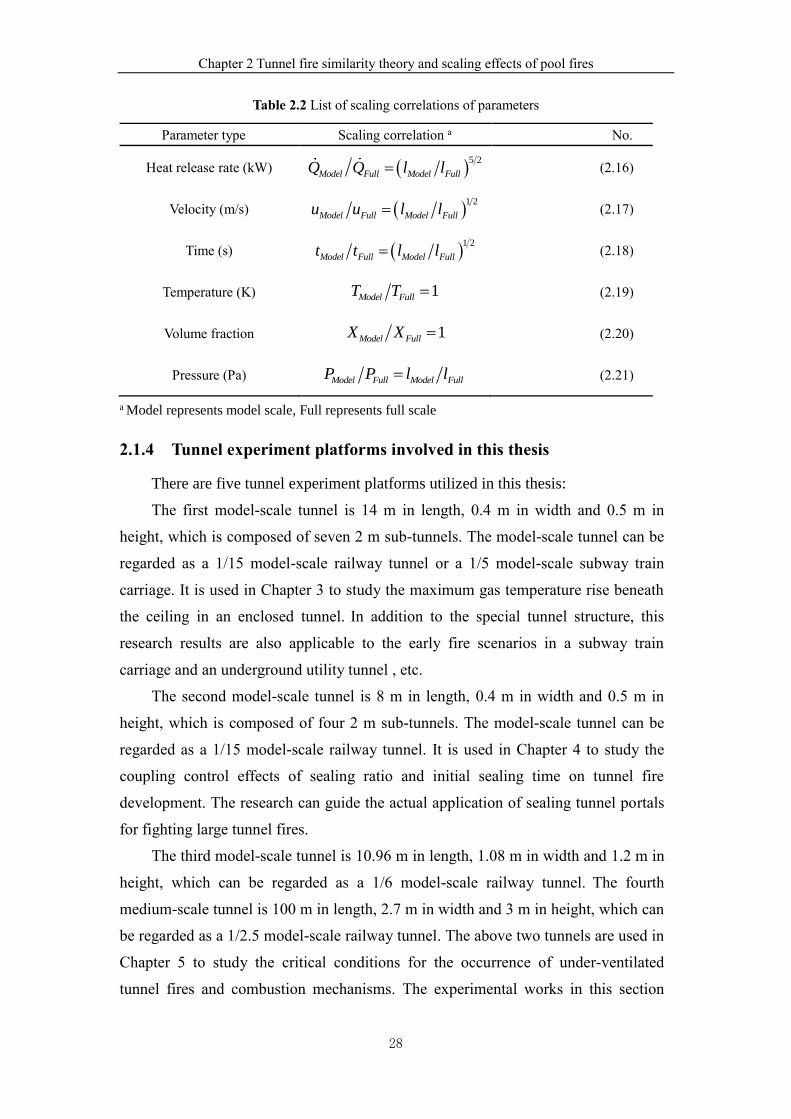
Chapter 2 Tunnel fire similarity theory and scaling effects of pool fires
28
Table 2.2 List of scaling correlations of parameters
Parameter type Scaling correlation a No.
Heat release rate (kW) ( )5 2
Model Full Model FullQ Q l l= (2.16)
Velocity (m/s) ( )1 2
Model Full Model Fullu u l l= (2.17)
Time (s) ( )1 2
Model Full Model Fullt t l l= (2.18)
Temperature (K) 1Model FullT T = (2.19)
Volume fraction 1Model FullX X = (2.20)
Pressure (Pa) Model Full Model FullP P l l= (2.21)
a Model represents model scale, Full represents full scale
2.1.4 Tunnel experiment platforms involved in this thesis
There are five tunnel experiment platforms utilized in this thesis:
The first model-scale tunnel is 14 m in length, 0.4 m in width and 0.5 m in
height, which is composed of seven 2 m sub-tunnels. The model-scale tunnel can be
regarded as a 1/15 model-scale railway tunnel or a 1/5 model-scale subway train
carriage. It is used in Chapter 3 to study the maximum gas temperature rise beneath
the ceiling in an enclosed tunnel. In addition to the special tunnel structure, this
research results are also applicable to the early fire scenarios in a subway train
carriage and an underground utility tunnel , etc.
The second model-scale tunnel is 8 m in length, 0.4 m in width and 0.5 m in
height, which is composed of four 2 m sub-tunnels. The model-scale tunnel can be
regarded as a 1/15 model-scale railway tunnel. It is used in Chapter 4 to study the
coupling control effects of sealing ratio and initial sealing time on tunnel fire
development. The research can guide the actual application of sealing tunnel portals
for fighting large tunnel fires.
The third model-scale tunnel is 10.96 m in length, 1.08 m in width and 1.2 m in
height, which can be regarded as a 1/6 model-scale railway tunnel. The fourth
medium-scale tunnel is 100 m in length, 2.7 m in width and 3 m in height, which can
be regarded as a 1/2.5 model-scale railway tunnel. The above two tunnels are used in
Chapter 5 to study the critical conditions for the occurrence of under-ventilated
tunnel fires and combustion mechanisms. The experimental works in this section
Chapter 2 Tunnel fire similarity theory and scaling effects of pool fires
29
were finished by Professor Ingason working at RISE Research Institutes of Sweden.
The author is responsible for the process and analysis of experimental data as well as
writing of research paper.
The fifth model-scale tunnel includes an access tunnel, which ends in a
T-junction, with the two arms having different lengths, which can be regarded as a
1/40 model-scale tunnel during construction. The system consists of three parts:
Tunnel A, Tunnel B and Tunnel C. Tunnels A and B are 3.0 m long while tunnel C is
1.5 m long. The height and width of all tunnels is 0.15 m. The model-scale tunnel is
used in Chapter 6 to study the critical conditions for the occurrence of
self-extinguishment and influencing factors. The experimental works in this section
were finished by Professor Lönnermark and Professor Ingason working at RISE
Research Institutes of Sweden. The author is responsible for the process and analysis
of experimental data as well as writing of research paper.
2.2 Scaling effects of pool fires
The scaling correlations of some important parameters obtained based on the
Froude scaling have been introduced in Section 2.1 of this chapter. For some
specified fire parameters, the full-scale results can be derived from the results of the
model-scale experiments, which further can serve and apply to the real fire scenarios.
While for some special burning parameters, such as the mass loss rate per unit area
(MLRPUA) of pool fires, it can’t be scaled from model-scale results to large-scale
results by using any scaling technology, especially in the presence of ventilation and
tunnel boundaries. There is no doubt that heat release rate (HRR) is one of the most
important parameters for characterizing fire hazard while the MLRPUA is one of the
most important parameters for assessing the heat release rate of pool fires. The
MLRPUA can then be given by Eq. (2.22).
( )
F L
v p boil l
q qm
L c T T
− =
+ − (2.22)
where Fq is the heat flux received by pool surface,
Lq is the heat loss through pool
surface, vL is the latent heat of evaporation, pc is the specific heat at constant pressure,
boilT is the boiling temperature of the liquid fuel and lT is the liquid temperature.
Pool fires may burn free burning conditions, in windy environments or in
enclosures such as tunnels. Blinov and Khudiakov[103] experimentally investigated the
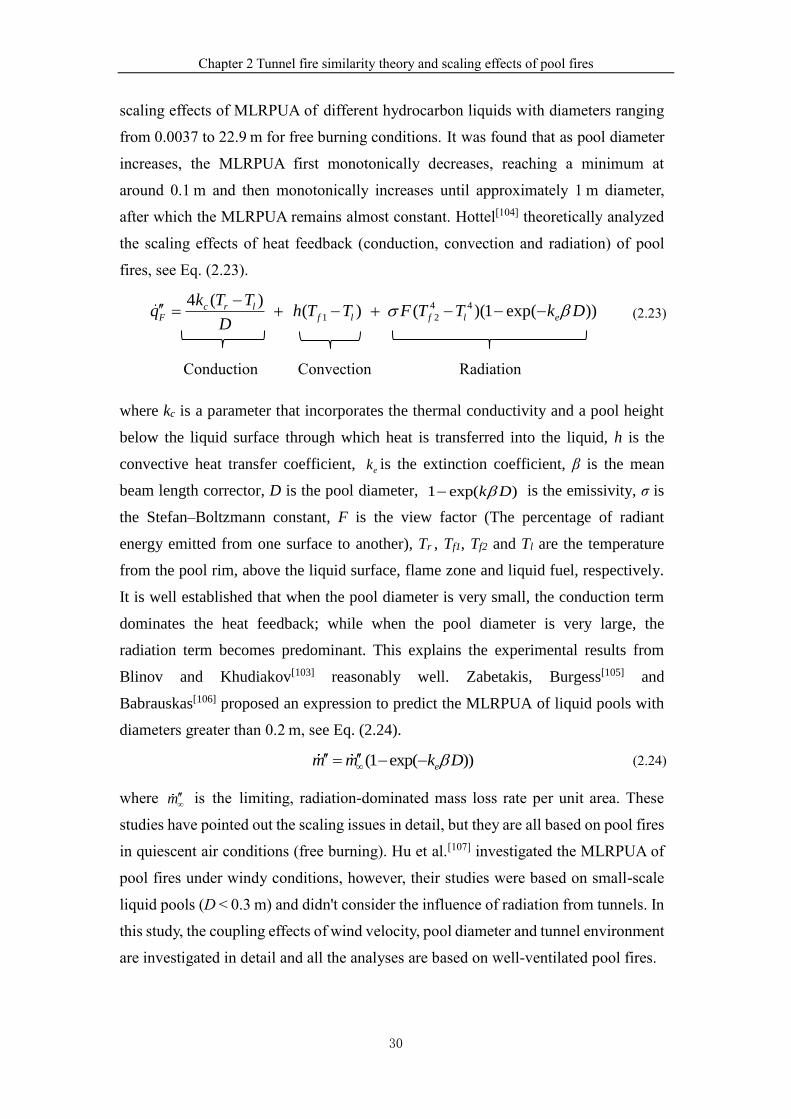
Chapter 2 Tunnel fire similarity theory and scaling effects of pool fires
30
scaling effects of MLRPUA of different hydrocarbon liquids with diameters ranging
from 0.0037 to 22.9 m for free burning conditions. It was found that as pool diameter
increases, the MLRPUA first monotonically decreases, reaching a minimum at
around 0.1 m and then monotonically increases until approximately 1 m diameter,
after which the MLRPUA remains almost constant. Hottel[104] theoretically analyzed
the scaling effects of heat feedback (conduction, convection and radiation) of pool
fires, see Eq. (2.23).
4 4
1 2
4 ( )( ) ( )(1 exp( ))c r l
F f l f l e
k T Tq h T T F T T k D
D
− = + − + − − − (2.23)
Conduction Convection Radiation
where kc is a parameter that incorporates the thermal conductivity and a pool height
below the liquid surface through which heat is transferred into the liquid, h is the
convective heat transfer coefficient, ek is the extinction coefficient, β is the mean
beam length corrector, D is the pool diameter, 1 exp( )k D− is the emissivity, σ is
the Stefan–Boltzmann constant, F is the view factor (The percentage of radiant
energy emitted from one surface to another), Tr , Tf1, Tf2 and Tl are the temperature
from the pool rim, above the liquid surface, flame zone and liquid fuel, respectively.
It is well established that when the pool diameter is very small, the conduction term
dominates the heat feedback; while when the pool diameter is very large, the
radiation term becomes predominant. This explains the experimental results from
Blinov and Khudiakov[103] reasonably well. Zabetakis, Burgess[105] and
Babrauskas[106] proposed an expression to predict the MLRPUA of liquid pools with
diameters greater than 0.2 m, see Eq. (2.24).
(1 exp( ))em m k D = − − (2.24)
where m is the limiting, radiation-dominated mass loss rate per unit area. These
studies have pointed out the scaling issues in detail, but they are all based on pool fires
in quiescent air conditions (free burning). Hu et al.[107] investigated the MLRPUA of
pool fires under windy conditions, however, their studies were based on small-scale
liquid pools (D < 0.3 m) and didn't consider the influence of radiation from tunnels. In
this study, the coupling effects of wind velocity, pool diameter and tunnel environment
are investigated in detail and all the analyses are based on well-ventilated pool fires.
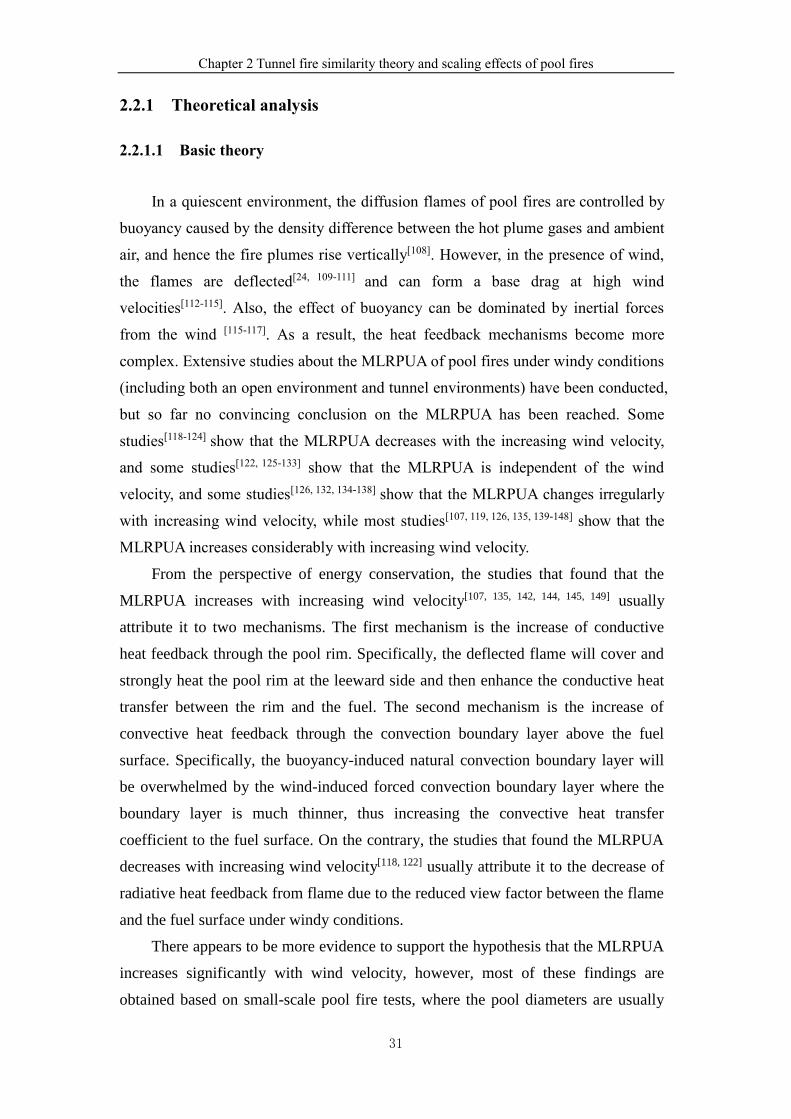
Chapter 2 Tunnel fire similarity theory and scaling effects of pool fires
31
2.2.1 Theoretical analysis
2.2.1.1 Basic theory
In a quiescent environment, the diffusion flames of pool fires are controlled by
buoyancy caused by the density difference between the hot plume gases and ambient
air, and hence the fire plumes rise vertically[108]. However, in the presence of wind,
the flames are deflected[24, 109-111] and can form a base drag at high wind
velocities[112-115]. Also, the effect of buoyancy can be dominated by inertial forces
from the wind [115-117]. As a result, the heat feedback mechanisms become more
complex. Extensive studies about the MLRPUA of pool fires under windy conditions
(including both an open environment and tunnel environments) have been conducted,
but so far no convincing conclusion on the MLRPUA has been reached. Some
studies[118-124] show that the MLRPUA decreases with the increasing wind velocity,
and some studies[122, 125-133] show that the MLRPUA is independent of the wind
velocity, and some studies[126, 132, 134-138] show that the MLRPUA changes irregularly
with increasing wind velocity, while most studies[107, 119, 126, 135, 139-148] show that the
MLRPUA increases considerably with increasing wind velocity.
From the perspective of energy conservation, the studies that found that the
MLRPUA increases with increasing wind velocity[107, 135, 142, 144, 145, 149] usually
attribute it to two mechanisms. The first mechanism is the increase of conductive
heat feedback through the pool rim. Specifically, the deflected flame will cover and
strongly heat the pool rim at the leeward side and then enhance the conductive heat
transfer between the rim and the fuel. The second mechanism is the increase of
convective heat feedback through the convection boundary layer above the fuel
surface. Specifically, the buoyancy-induced natural convection boundary layer will
be overwhelmed by the wind-induced forced convection boundary layer where the
boundary layer is much thinner, thus increasing the convective heat transfer
coefficient to the fuel surface. On the contrary, the studies that found the MLRPUA
decreases with increasing wind velocity[118, 122] usually attribute it to the decrease of
radiative heat feedback from flame due to the reduced view factor between the flame
and the fuel surface under windy conditions.
There appears to be more evidence to support the hypothesis that the MLRPUA
increases significantly with wind velocity, however, most of these findings are
obtained based on small-scale pool fire tests, where the pool diameters are usually
Chapter 2 Tunnel fire similarity theory and scaling effects of pool fires
32
less than 0.3 m (D < 0.3 m). In this range, the flames are in the transitional region
between laminar and turbulent, or they are even laminar for smaller pool diameters.
At the same time, the conductive and convective heat feedback plays an important
role in determining the MLRPUA. In large pool fires where the pool diameters can
reach several meters or even tens of meters, the flames become highly turbulent and
thereby the MLRPUA is mainly controlled by the radiation heat feedback of the
flame volume above the fuel surface. This difference between small-scale and
large-scale pool fires causes different responses of MLRPUA with wind velocity. In
other words, the data from small-scale pool fire tests can’t be used to draw general
conclusions for large-scale pool fires.
2.2.1.2 Simplified calculation
Concerning the MLRPUA, no good correlations can allow such small-scale
results to be directly applied to large-scale pool fires. While when the evolutions of
heat flux with wind velocity, including conductive, convective and radiative heat
feedback of a small scale fire, is provided, it is possible to achieve an approximate
calculation of MLRPUA of a large-scale fire based on Eq. (2.22) - (2.32).
Hu et al.[148] studied the evolutions of heat flux to the liquid fuel for a 0.15 m
heptane square pool fire in the open. The horizontal cross air flow ranges from 0 to 2.7
m/s. In their study, the variations of MLRPUA, conductive, convective and radiative
heat feedbacks versus time were provided. In this section, a correlation is developed as
an example of how results from the 0.15 m square heptane fires in 0 - 2.7 m/s
crosswinds studied previously by Hu et al.[148] might be used to estimate MLRPUA for
a heptane fire that is 10 times larger. The scenario to be estimated is that of a 1.5 m
square pool fires (large-scale pool fires) in cross air flows ranging from 0 to 8 m/s.
In Hu et al.’ studies[148], the conductive heat flux is calculated based on the
temperature difference between pool rim and liquid; the radiative heat flux is
measured by water-cooled radiation gauges; the convective heat flux is obtained by
subtracting the conductive and radiative heat flux from the total amount of heat flux
to pool surface. As shown in Fig. 2.1, with horizontal cross air flows ranging from 0
to 2.7 m/s, the conductive heat flux increases to 8.7 times the initial value
(eventually occupies 40% in total heat flux). The convective heat flux increases to
5.5 times the initial value (eventually occupies 55 % in total heat flux). While the
radiative heat flux decreases to half of the initial value (eventually occupies 5 % in
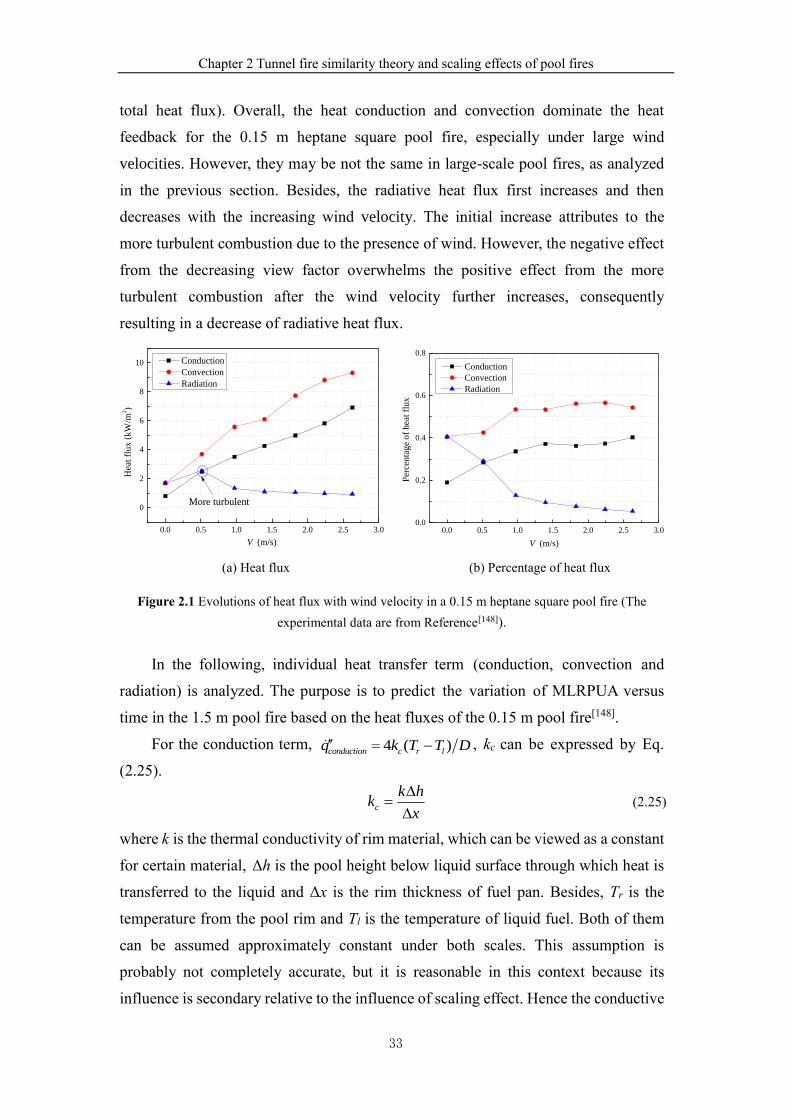
Chapter 2 Tunnel fire similarity theory and scaling effects of pool fires
33
total heat flux). Overall, the heat conduction and convection dominate the heat
feedback for the 0.15 m heptane square pool fire, especially under large wind
velocities. However, they may be not the same in large-scale pool fires, as analyzed
in the previous section. Besides, the radiative heat flux first increases and then
decreases with the increasing wind velocity. The initial increase attributes to the
more turbulent combustion due to the presence of wind. However, the negative effect
from the decreasing view factor overwhelms the positive effect from the more
turbulent combustion after the wind velocity further increases, consequently
resulting in a decrease of radiative heat flux.
0.0 0.5 1.0 1.5 2.0 2.5 3.0
0
2
4
6
8
10
More turbulent
Hea
t fl
ux (
kW
/m2)
V (m/s)
Conduction
Convection
Radiation
0.0 0.5 1.0 1.5 2.0 2.5 3.00.0
0.2
0.4
0.6
0.8
Per
cen
tag
e o
f h
eat
flu
x
V (m/s)
Conduction
Convection
Radiation
(a) Heat flux (b) Percentage of heat flux
Figure 2.1 Evolutions of heat flux with wind velocity in a 0.15 m heptane square pool fire (The
experimental data are from Reference[148]).
In the following, individual heat transfer term (conduction, convection and
radiation) is analyzed. The purpose is to predict the variation of MLRPUA versus
time in the 1.5 m pool fire based on the heat fluxes of the 0.15 m pool fire[148].
For the conduction term, 4 ( )conduction c r lq k T T D = − , kc can be expressed by Eq.
(2.25).
c
k hk
x
=
(2.25)
where k is the thermal conductivity of rim material, which can be viewed as a constant
for certain material, Δh is the pool height below liquid surface through which heat is
transferred to the liquid and Δx is the rim thickness of fuel pan. Besides, Tr is the
temperature from the pool rim and Tl is the temperature of liquid fuel. Both of them
can be assumed approximately constant under both scales. This assumption is
probably not completely accurate, but it is reasonable in this context because its
influence is secondary relative to the influence of scaling effect. Hence the conductive
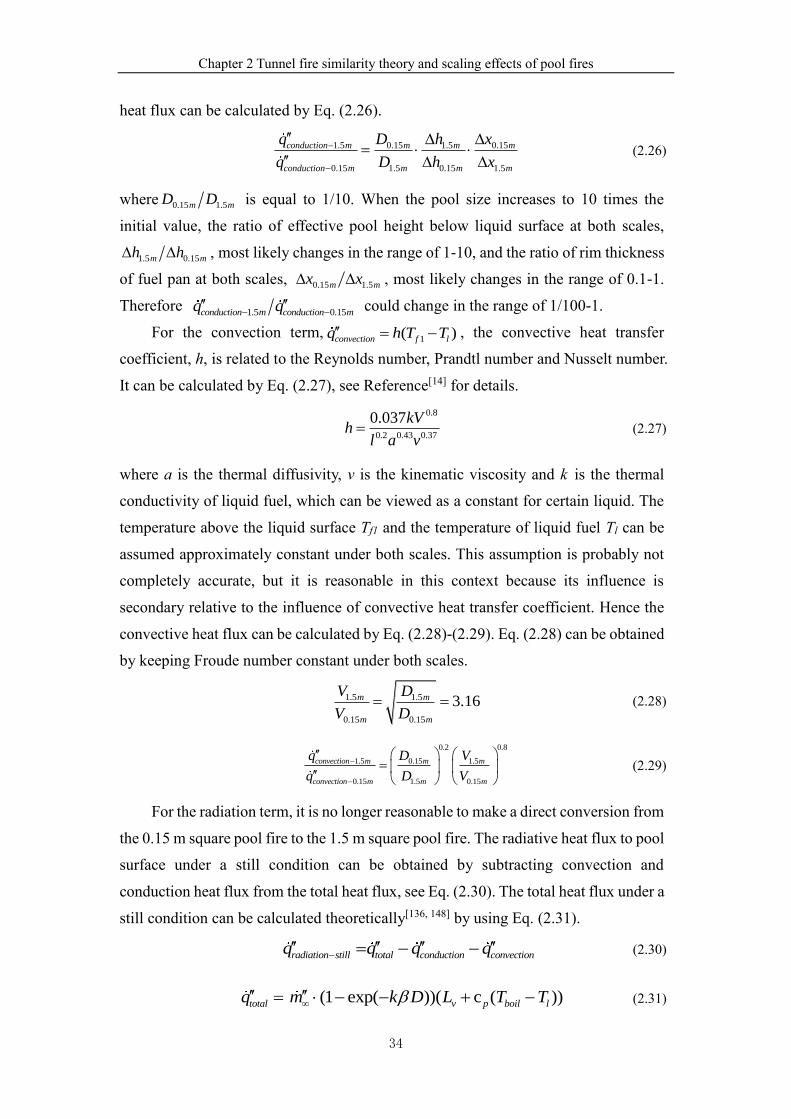
Chapter 2 Tunnel fire similarity theory and scaling effects of pool fires
34
heat flux can be calculated by Eq. (2.26).
1.5 0.15 1.5 0.15
0.15 1.5 0.15 1.5
conduction m m m m
conduction m m m m
q D h x
q D h x
−
−
=
(2.26)
where 0.15 1.5m mD D is equal to 1/10. When the pool size increases to 10 times the
initial value, the ratio of effective pool height below liquid surface at both scales,
1.5 0.15m mh h , most likely changes in the range of 1-10, and the ratio of rim thickness
of fuel pan at both scales, 0.15 1.5m mx x , most likely changes in the range of 0.1-1.
Therefore 1.5 0.15conduction m conduction mq q− −
could change in the range of 1/100-1.
For the convection term,1( )convection f lq h T T = − , the convective heat transfer
coefficient, h, is related to the Reynolds number, Prandtl number and Nusselt number.
It can be calculated by Eq. (2.27), see Reference[14] for details.
0.8
0.2 0.43 0.37
0.037kVh
l a v= (2.27)
where a is the thermal diffusivity, v is the kinematic viscosity and k is the thermal
conductivity of liquid fuel, which can be viewed as a constant for certain liquid. The
temperature above the liquid surface Tf1 and the temperature of liquid fuel Tl can be
assumed approximately constant under both scales. This assumption is probably not
completely accurate, but it is reasonable in this context because its influence is
secondary relative to the influence of convective heat transfer coefficient. Hence the
convective heat flux can be calculated by Eq. (2.28)-(2.29). Eq. (2.28) can be obtained
by keeping Froude number constant under both scales.
1.5 1.5
0.15 0.15
3.16m m
m m
V D
V D= = (2.28)
0.2 0.8
1.5 0.15 1.5
0.15 1.5 0.15
convection m m m
convection m m m
q D V
q D V
−
−
=
(2.29)
For the radiation term, it is no longer reasonable to make a direct conversion from
the 0.15 m square pool fire to the 1.5 m square pool fire. The radiative heat flux to pool
surface under a still condition can be obtained by subtracting convection and
conduction heat flux from the total heat flux, see Eq. (2.30). The total heat flux under a
still condition can be calculated theoretically[136, 148] by using Eq. (2.31).
radiation still total conduction convectionq q q q− = − − (2.30)
(1 exp( ))( c ( ))total v p boil lq m k D L T T = − − + − (2.31)
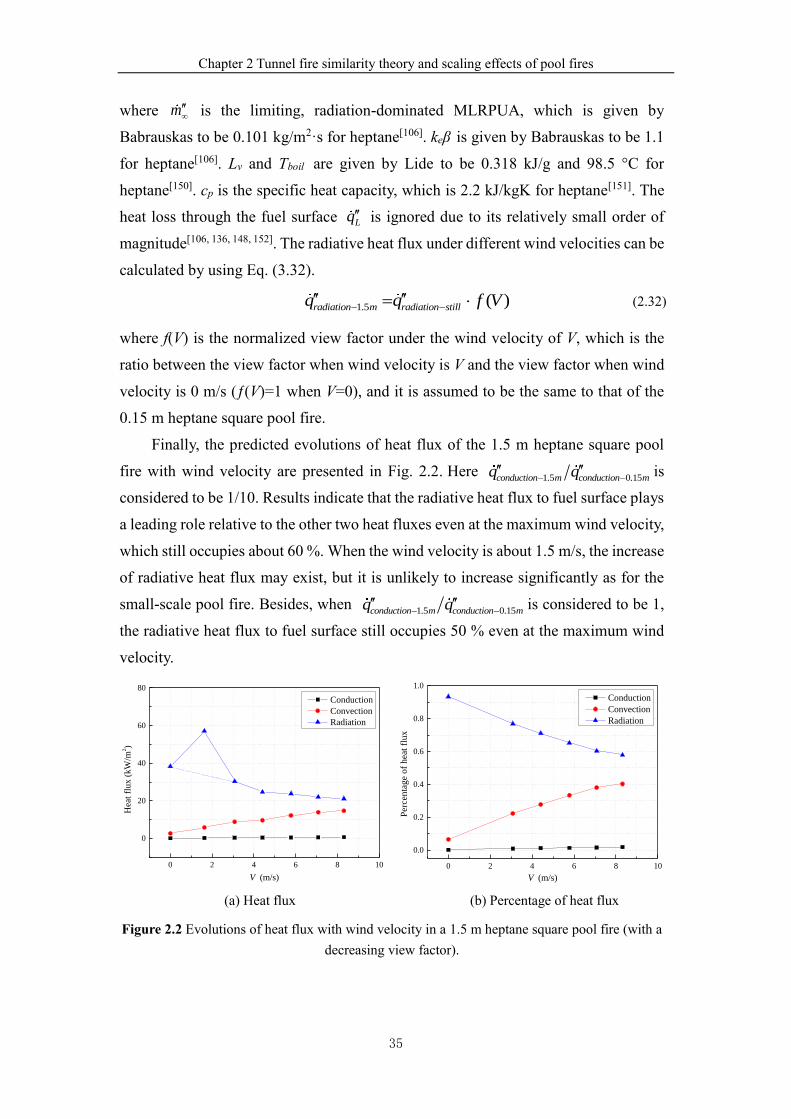
Chapter 2 Tunnel fire similarity theory and scaling effects of pool fires
35
where m is the limiting, radiation-dominated MLRPUA, which is given by
Babrauskas to be 0.101 kg/m2·s for heptane[106]. keβ is given by Babrauskas to be 1.1
for heptane[106]. Lv and Tboil are given by Lide to be 0.318 kJ/g and 98.5 °C for
heptane[150]. cp is the specific heat capacity, which is 2.2 kJ/kgK for heptane[151]. The
heat loss through the fuel surface Lq is ignored due to its relatively small order of
magnitude[106, 136, 148, 152]. The radiative heat flux under different wind velocities can be
calculated by using Eq. (3.32).
1.5 ( )radiation m radiation stillq q f V− − = (2.32)
where f(V) is the normalized view factor under the wind velocity of V, which is the
ratio between the view factor when wind velocity is V and the view factor when wind
velocity is 0 m/s (ƒ(V)=1 when V=0), and it is assumed to be the same to that of the
0.15 m heptane square pool fire.
Finally, the predicted evolutions of heat flux of the 1.5 m heptane square pool
fire with wind velocity are presented in Fig. 2.2. Here 1.5 0.15conduction m conduction mq q− −
is
considered to be 1/10. Results indicate that the radiative heat flux to fuel surface plays
a leading role relative to the other two heat fluxes even at the maximum wind velocity,
which still occupies about 60 %. When the wind velocity is about 1.5 m/s, the increase
of radiative heat flux may exist, but it is unlikely to increase significantly as for the
small-scale pool fire. Besides, when 1.5 0.15conduction m conduction mq q− −
is considered to be 1,
the radiative heat flux to fuel surface still occupies 50 % even at the maximum wind
velocity.
0 2 4 6 8 10
0
20
40
60
80
Conduction
Convection
Radiation
Hea
t fl
ux (
kW
/m2)
V (m/s) 0 2 4 6 8 10
0.0
0.2
0.4
0.6
0.8
1.0
Per
centa
ge
of
hea
t fl
ux
V (m/s)
Conduction
Convection
Radiation
(a) Heat flux (b) Percentage of heat flux
Figure 2.2 Evolutions of heat flux with wind velocity in a 1.5 m heptane square pool fire (with a
decreasing view factor).
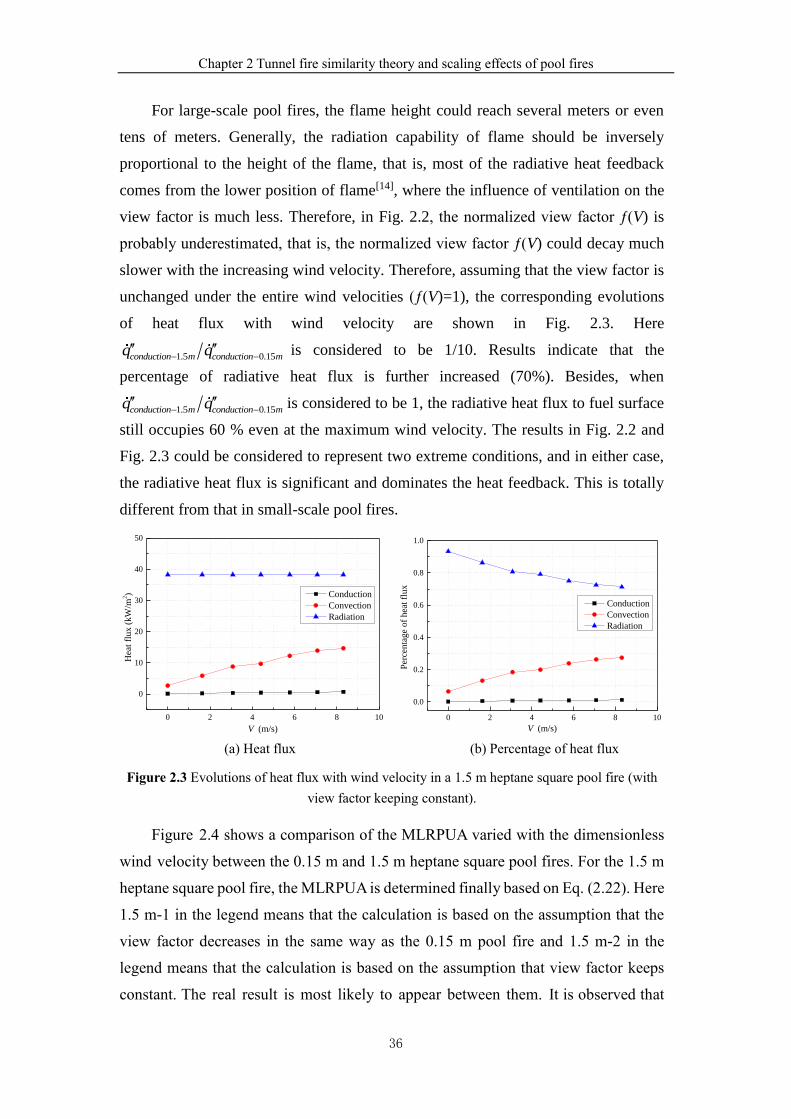
Chapter 2 Tunnel fire similarity theory and scaling effects of pool fires
36
For large-scale pool fires, the flame height could reach several meters or even
tens of meters. Generally, the radiation capability of flame should be inversely
proportional to the height of the flame, that is, most of the radiative heat feedback
comes from the lower position of flame[14], where the influence of ventilation on the
view factor is much less. Therefore, in Fig. 2.2, the normalized view factor ƒ(V) is
probably underestimated, that is, the normalized view factor ƒ(V) could decay much
slower with the increasing wind velocity. Therefore, assuming that the view factor is
unchanged under the entire wind velocities (ƒ(V)=1), the corresponding evolutions
of heat flux with wind velocity are shown in Fig. 2.3. Here
1.5 0.15conduction m conduction mq q− − is considered to be 1/10. Results indicate that the
percentage of radiative heat flux is further increased (70%). Besides, when
1.5 0.15conduction m conduction mq q− − is considered to be 1, the radiative heat flux to fuel surface
still occupies 60 % even at the maximum wind velocity. The results in Fig. 2.2 and
Fig. 2.3 could be considered to represent two extreme conditions, and in either case,
the radiative heat flux is significant and dominates the heat feedback. This is totally
different from that in small-scale pool fires.
0 2 4 6 8 10
0
10
20
30
40
50
Hea
t fl
ux (
kW
/m2)
V (m/s)
Conduction
Convection
Radiation
0 2 4 6 8 10
0.0
0.2
0.4
0.6
0.8
1.0
Per
centa
ge
of
hea
t fl
ux
V (m/s)
Conduction
Convection
Radiation
(a) Heat flux (b) Percentage of heat flux
Figure 2.3 Evolutions of heat flux with wind velocity in a 1.5 m heptane square pool fire (with
view factor keeping constant).
Figure 2.4 shows a comparison of the MLRPUA varied with the dimensionless
wind velocity between the 0.15 m and 1.5 m heptane square pool fires. For the 1.5 m
heptane square pool fire, the MLRPUA is determined finally based on Eq. (2.22). Here
1.5 m-1 in the legend means that the calculation is based on the assumption that the
view factor decreases in the same way as the 0.15 m pool fire and 1.5 m-2 in the
legend means that the calculation is based on the assumption that view factor keeps
constant. The real result is most likely to appear between them. It is observed that
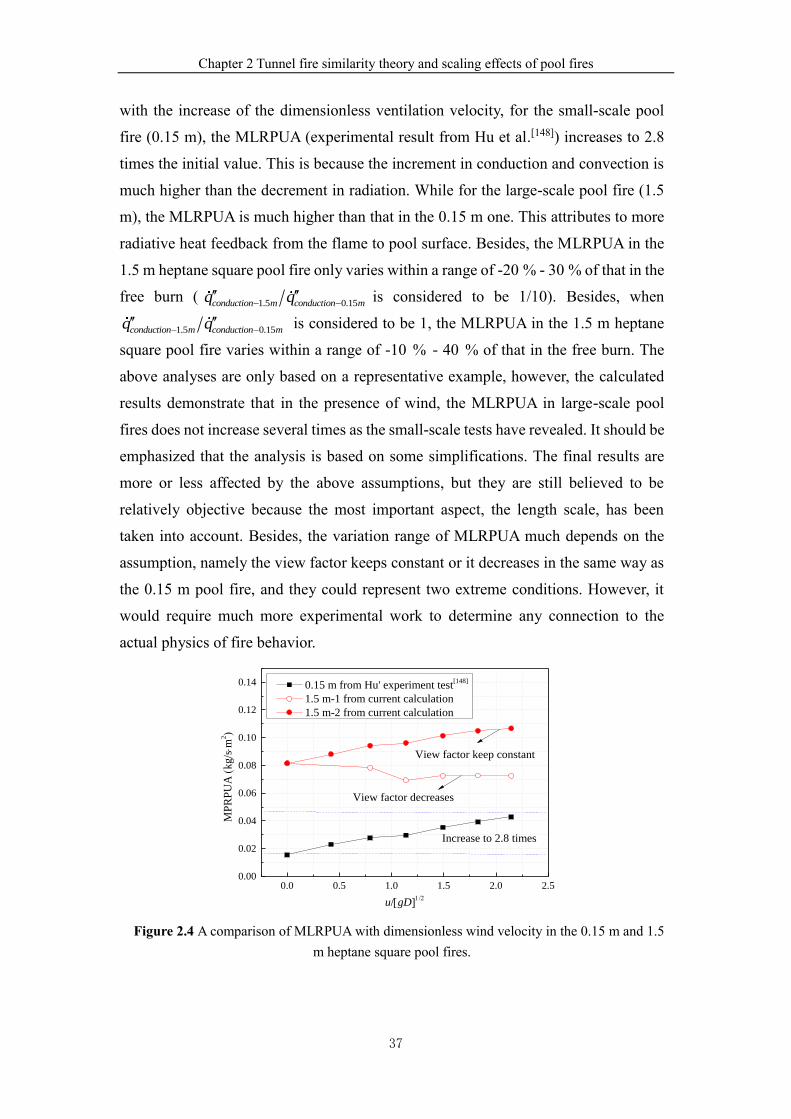
Chapter 2 Tunnel fire similarity theory and scaling effects of pool fires
37
with the increase of the dimensionless ventilation velocity, for the small-scale pool
fire (0.15 m), the MLRPUA (experimental result from Hu et al.[148]) increases to 2.8
times the initial value. This is because the increment in conduction and convection is
much higher than the decrement in radiation. While for the large-scale pool fire (1.5
m), the MLRPUA is much higher than that in the 0.15 m one. This attributes to more
radiative heat feedback from the flame to pool surface. Besides, the MLRPUA in the
1.5 m heptane square pool fire only varies within a range of -20 % - 30 % of that in the
free burn (1.5 0.15conduction m conduction mq q− −
is considered to be 1/10). Besides, when
1.5 0.15conduction m conduction mq q− − is considered to be 1, the MLRPUA in the 1.5 m heptane
square pool fire varies within a range of -10 % - 40 % of that in the free burn. The
above analyses are only based on a representative example, however, the calculated
results demonstrate that in the presence of wind, the MLRPUA in large-scale pool
fires does not increase several times as the small-scale tests have revealed. It should be
emphasized that the analysis is based on some simplifications. The final results are
more or less affected by the above assumptions, but they are still believed to be
relatively objective because the most important aspect, the length scale, has been
taken into account. Besides, the variation range of MLRPUA much depends on the
assumption, namely the view factor keeps constant or it decreases in the same way as
the 0.15 m pool fire, and they could represent two extreme conditions. However, it
would require much more experimental work to determine any connection to the
actual physics of fire behavior.
0.0 0.5 1.0 1.5 2.0 2.50.00
0.02
0.04
0.06
0.08
0.10
0.12
0.14
Increase to 2.8 times
View factor keep constant
View factor decreases
MP
RP
UA
(k
g/s
m2)
u/[gD]
0.15 m from Hu' experiment test[148]
1.5 m-1 from current calculation
1.5 m-2 from current calculation
Figure 2.4 A comparison of MLRPUA with dimensionless wind velocity in the 0.15 m and 1.5
m heptane square pool fires.
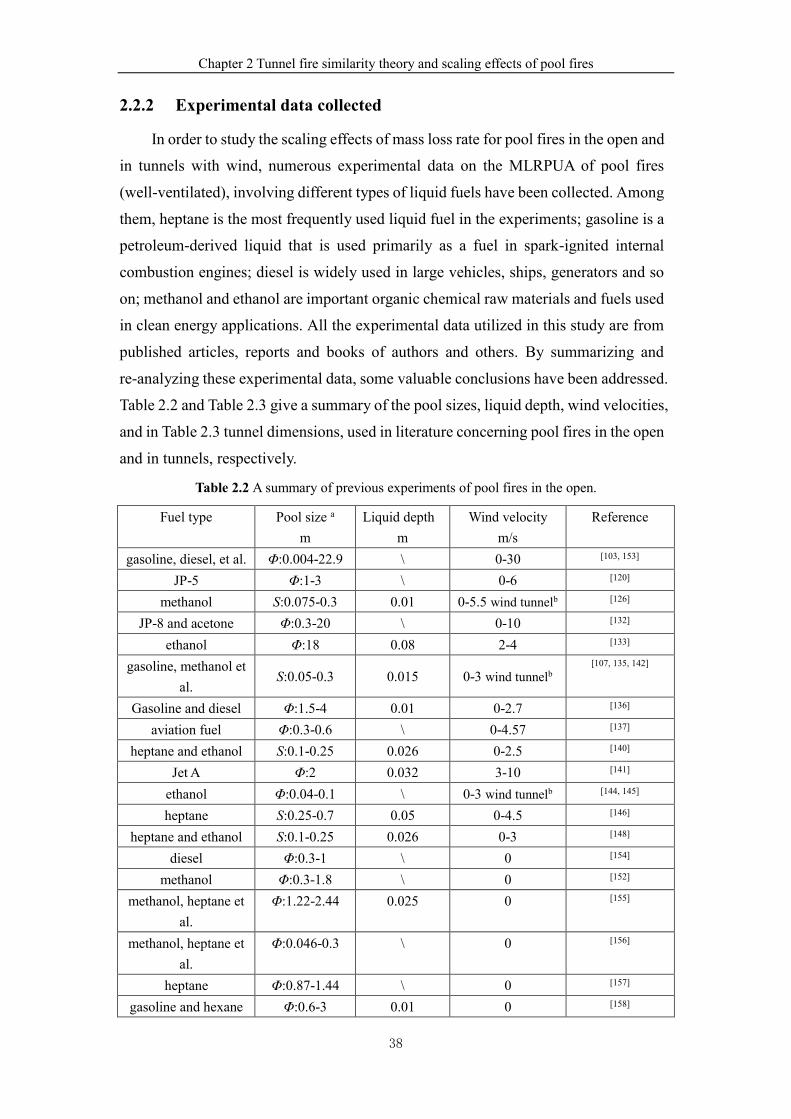
Chapter 2 Tunnel fire similarity theory and scaling effects of pool fires
38
2.2.2 Experimental data collected
In order to study the scaling effects of mass loss rate for pool fires in the open and
in tunnels with wind, numerous experimental data on the MLRPUA of pool fires
(well-ventilated), involving different types of liquid fuels have been collected. Among
them, heptane is the most frequently used liquid fuel in the experiments; gasoline is a
petroleum-derived liquid that is used primarily as a fuel in spark-ignited internal
combustion engines; diesel is widely used in large vehicles, ships, generators and so
on; methanol and ethanol are important organic chemical raw materials and fuels used
in clean energy applications. All the experimental data utilized in this study are from
published articles, reports and books of authors and others. By summarizing and
re-analyzing these experimental data, some valuable conclusions have been addressed.
Table 2.2 and Table 2.3 give a summary of the pool sizes, liquid depth, wind velocities,
and in Table 2.3 tunnel dimensions, used in literature concerning pool fires in the open
and in tunnels, respectively.
Table 2.2 A summary of previous experiments of pool fires in the open.
Fuel type Pool size a
m
Liquid depth
m
Wind velocity
m/s
Reference
gasoline, diesel, et al. Φ:0.004-22.9 \ 0-30 [103, 153]
JP-5 Φ:1-3 \ 0-6 [120]
methanol S:0.075-0.3 0.01 0-5.5 wind tunnelb [126]
JP-8 and acetone Φ:0.3-20 \ 0-10 [132]
ethanol Φ:18 0.08 2-4 [133]
gasoline, methanol et
al. S:0.05-0.3 0.015 0-3 wind tunnelb
[107, 135, 142]
Gasoline and diesel Φ:1.5-4 0.01 0-2.7 [136]
aviation fuel Φ:0.3-0.6 \ 0-4.57 [137]
heptane and ethanol S:0.1-0.25 0.026 0-2.5 [140]
Jet A Φ:2 0.032 3-10 [141]
ethanol Φ:0.04-0.1 \ 0-3 wind tunnelb [144, 145]
heptane S:0.25-0.7 0.05 0-4.5 [146]
heptane and ethanol S:0.1-0.25 0.026 0-3 [148]
diesel Φ:0.3-1 \ 0 [154]
methanol Φ:0.3-1.8 \ 0 [152]
methanol, heptane et
al.
Φ:1.22-2.44 0.025 0 [155]
methanol, heptane et
al.
Φ:0.046-0.3 \ 0 [156]
heptane Φ:0.87-1.44 \ 0 [157]
gasoline and hexane Φ:0.6-3 0.01 0 [158]
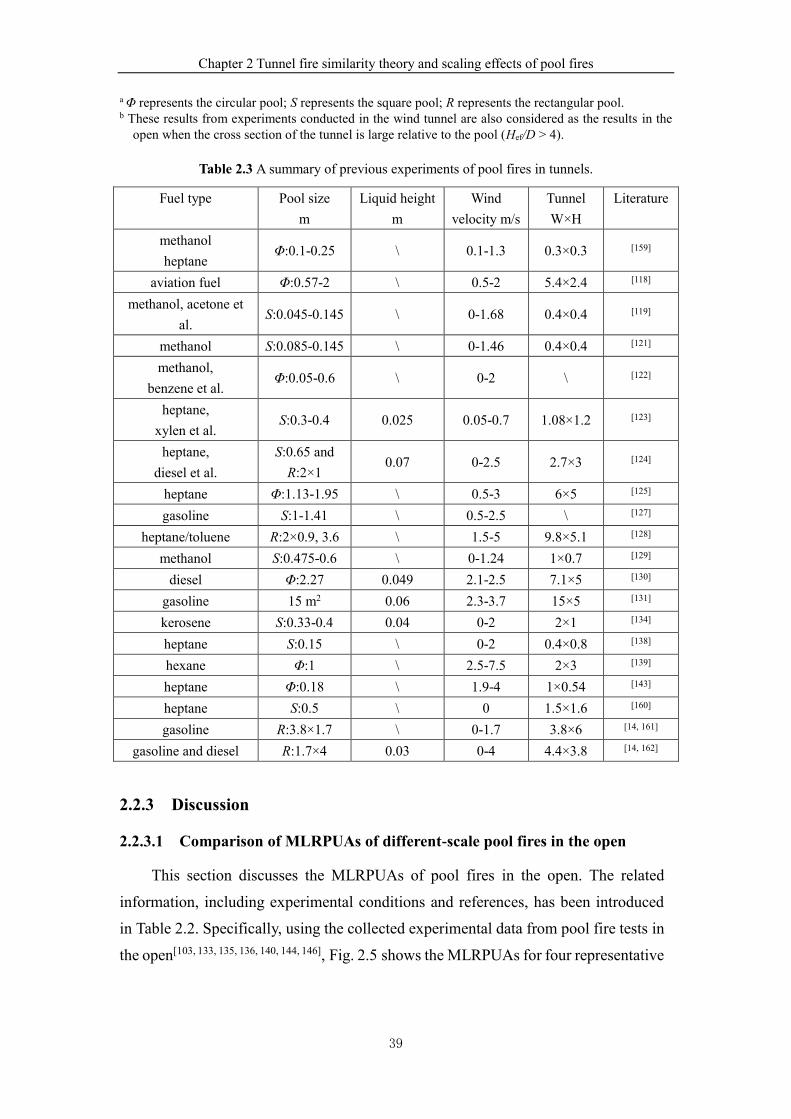
Chapter 2 Tunnel fire similarity theory and scaling effects of pool fires
39
a Φ represents the circular pool; S represents the square pool; R represents the rectangular pool. b These results from experiments conducted in the wind tunnel are also considered as the results in the
open when the cross section of the tunnel is large relative to the pool (Hef/D > 4).
Table 2.3 A summary of previous experiments of pool fires in tunnels.
Fuel type Pool size
m
Liquid height
m
Wind
velocity m/s
Tunnel
W×H
Literature
methanol
heptane Φ:0.1-0.25 \ 0.1-1.3 0.3×0.3 [159]
aviation fuel Φ:0.57-2 \ 0.5-2 5.4×2.4 [118]
methanol, acetone et
al. S:0.045-0.145 \ 0-1.68 0.4×0.4 [119]
methanol S:0.085-0.145 \ 0-1.46 0.4×0.4 [121]
methanol,
benzene et al. Φ:0.05-0.6 \ 0-2 \ [122]
heptane,
xylen et al. S:0.3-0.4 0.025 0.05-0.7 1.08×1.2 [123]
heptane,
diesel et al.
S:0.65 and
R:2×1 0.07 0-2.5 2.7×3 [124]
heptane Φ:1.13-1.95 \ 0.5-3 6×5 [125]
gasoline S:1-1.41 \ 0.5-2.5 \ [127]
heptane/toluene R:2×0.9, 3.6 \ 1.5-5 9.8×5.1 [128]
methanol S:0.475-0.6 \ 0-1.24 1×0.7 [129]
diesel Φ:2.27 0.049 2.1-2.5 7.1×5 [130]
gasoline 15 m2 0.06 2.3-3.7 15×5 [131]
kerosene S:0.33-0.4 0.04 0-2 2×1 [134]
heptane S:0.15 \ 0-2 0.4×0.8 [138]
hexane Φ:1 \ 2.5-7.5 2×3 [139]
heptane Φ:0.18 \ 1.9-4 1×0.54 [143]
heptane S:0.5 \ 0 1.5×1.6 [160]
gasoline R:3.8×1.7 \ 0-1.7 3.8×6 [14, 161]
gasoline and diesel R:1.7×4 0.03 0-4 4.4×3.8 [14, 162]
2.2.3 Discussion
2.2.3.1 Comparison of MLRPUAs of different-scale pool fires in the open
This section discusses the MLRPUAs of pool fires in the open. The related
information, including experimental conditions and references, has been introduced
in Table 2.2. Specifically, using the collected experimental data from pool fire tests in
the open[103, 133, 135, 136, 140, 144, 146], Fig. 2.5 shows the MLRPUAs for four representative
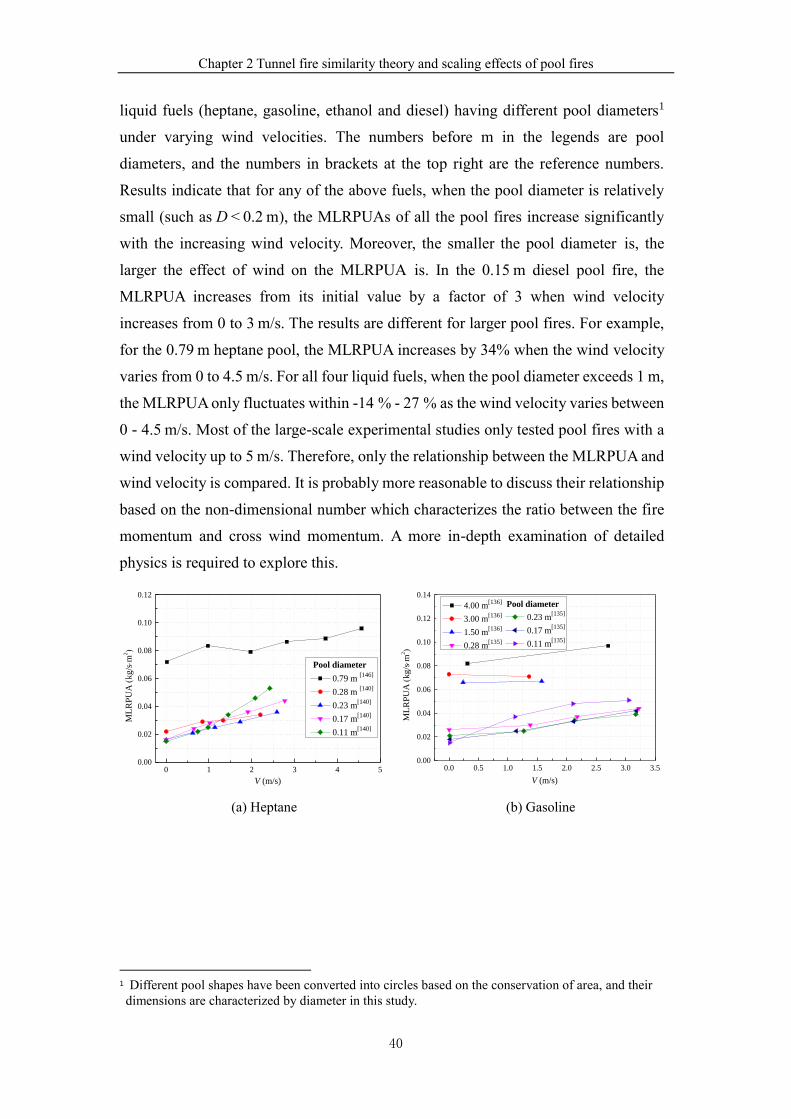
Chapter 2 Tunnel fire similarity theory and scaling effects of pool fires
40
liquid fuels (heptane, gasoline, ethanol and diesel) having different pool diameters1
under varying wind velocities. The numbers before m in the legends are pool
diameters, and the numbers in brackets at the top right are the reference numbers.
Results indicate that for any of the above fuels, when the pool diameter is relatively
small (such as D < 0.2 m), the MLRPUAs of all the pool fires increase significantly
with the increasing wind velocity. Moreover, the smaller the pool diameter is, the
larger the effect of wind on the MLRPUA is. In the 0.15 m diesel pool fire, the
MLRPUA increases from its initial value by a factor of 3 when wind velocity
increases from 0 to 3 m/s. The results are different for larger pool fires. For example,
for the 0.79 m heptane pool, the MLRPUA increases by 34% when the wind velocity
varies from 0 to 4.5 m/s. For all four liquid fuels, when the pool diameter exceeds 1 m,
the MLRPUA only fluctuates within -14 % - 27 % as the wind velocity varies between
0 - 4.5 m/s. Most of the large-scale experimental studies only tested pool fires with a
wind velocity up to 5 m/s. Therefore, only the relationship between the MLRPUA and
wind velocity is compared. It is probably more reasonable to discuss their relationship
based on the non-dimensional number which characterizes the ratio between the fire
momentum and cross wind momentum. A more in-depth examination of detailed
physics is required to explore this.
0 1 2 3 4 50.00
0.02
0.04
0.06
0.08
0.10
0.12
ML
RP
UA
(kg/s
m2)
V (m/s)
0.79 m [146]
0.28 m [140]
0.23 m[140]
0.17 m[140]
0.11 m[140]
Pool diameter
0.0 0.5 1.0 1.5 2.0 2.5 3.0 3.50.00
0.02
0.04
0.06
0.08
0.10
0.12
0.14
4.00 m[136]
3.00 m[136]
1.50 m[136]
0.28 m[135]
ML
RP
UA
(kg/s
m2)
V (m/s)
0.23 m[135]
0.17 m[135]
0.11 m[135]
Pool diameter
(a) Heptane (b) Gasoline
1 Different pool shapes have been converted into circles based on the conservation of area, and their
dimensions are characterized by diameter in this study.
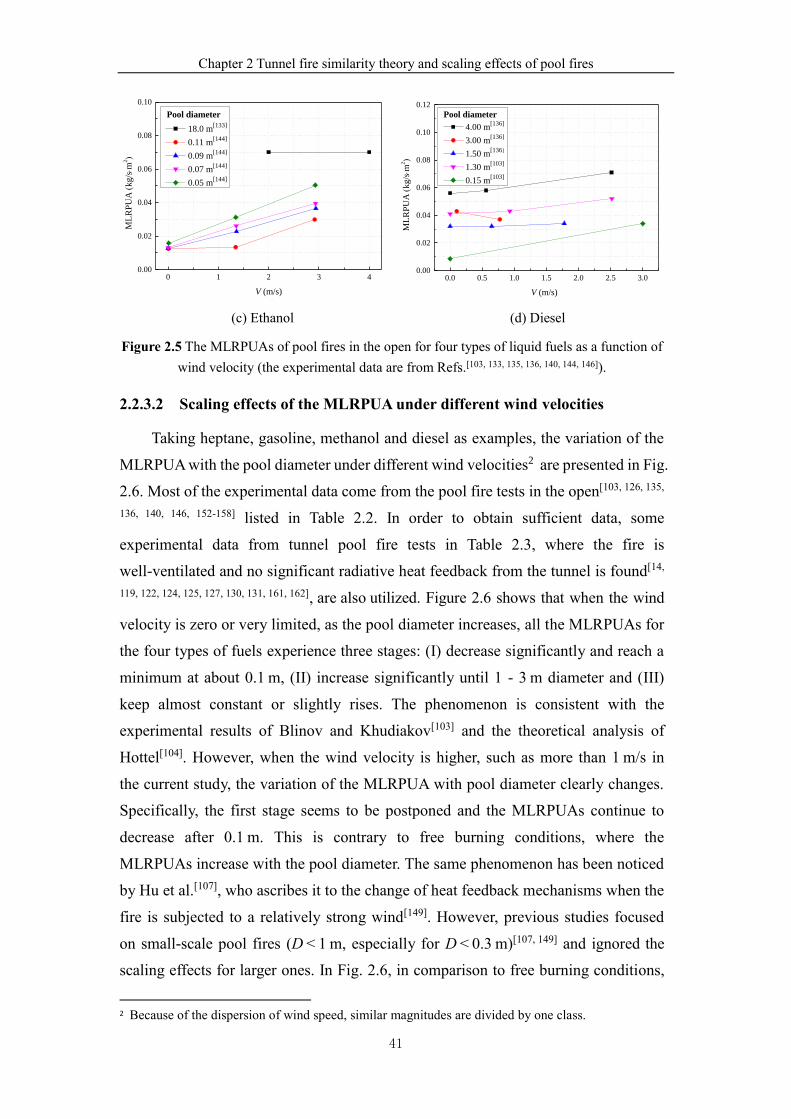
Chapter 2 Tunnel fire similarity theory and scaling effects of pool fires
41
0 1 2 3 40.00
0.02
0.04
0.06
0.08
0.10
ML
RP
UA
(k
g/s
m2)
V (m/s)
18.0 m[133]
0.11 m[144]
0.09 m[144]
0.07 m[144]
0.05 m[144]
Pool diameter
0.0 0.5 1.0 1.5 2.0 2.5 3.00.00
0.02
0.04
0.06
0.08
0.10
0.12
ML
RP
UA
(k
g/s
m2)
V (m/s)
4.00 m[136]
3.00 m[136]
1.50 m[136]
1.30 m[103]
0.15 m[103]
Pool diameter
(c) Ethanol (d) Diesel
Figure 2.5 The MLRPUAs of pool fires in the open for four types of liquid fuels as a function of
wind velocity (the experimental data are from Refs.[103, 133, 135, 136, 140, 144, 146]).
2.2.3.2 Scaling effects of the MLRPUA under different wind velocities
Taking heptane, gasoline, methanol and diesel as examples, the variation of the
MLRPUA with the pool diameter under different wind velocities2 are presented in Fig.
2.6. Most of the experimental data come from the pool fire tests in the open[103, 126, 135,
136, 140, 146, 152-158] listed in Table 2.2. In order to obtain sufficient data, some
experimental data from tunnel pool fire tests in Table 2.3, where the fire is
well-ventilated and no significant radiative heat feedback from the tunnel is found[14,
119, 122, 124, 125, 127, 130, 131, 161, 162], are also utilized. Figure 2.6 shows that when the wind
velocity is zero or very limited, as the pool diameter increases, all the MLRPUAs for
the four types of fuels experience three stages: (I) decrease significantly and reach a
minimum at about 0.1 m, (II) increase significantly until 1 - 3 m diameter and (III)
keep almost constant or slightly rises. The phenomenon is consistent with the
experimental results of Blinov and Khudiakov[103] and the theoretical analysis of
Hottel[104]. However, when the wind velocity is higher, such as more than 1 m/s in
the current study, the variation of the MLRPUA with pool diameter clearly changes.
Specifically, the first stage seems to be postponed and the MLRPUAs continue to
decrease after 0.1 m. This is contrary to free burning conditions, where the
MLRPUAs increase with the pool diameter. The same phenomenon has been noticed
by Hu et al.[107], who ascribes it to the change of heat feedback mechanisms when the
fire is subjected to a relatively strong wind[149]. However, previous studies focused
on small-scale pool fires (D < 1 m, especially for D < 0.3 m)[107, 149] and ignored the
scaling effects for larger ones. In Fig. 2.6, in comparison to free burning conditions,
2 Because of the dispersion of wind speed, similar magnitudes are divided by one class.
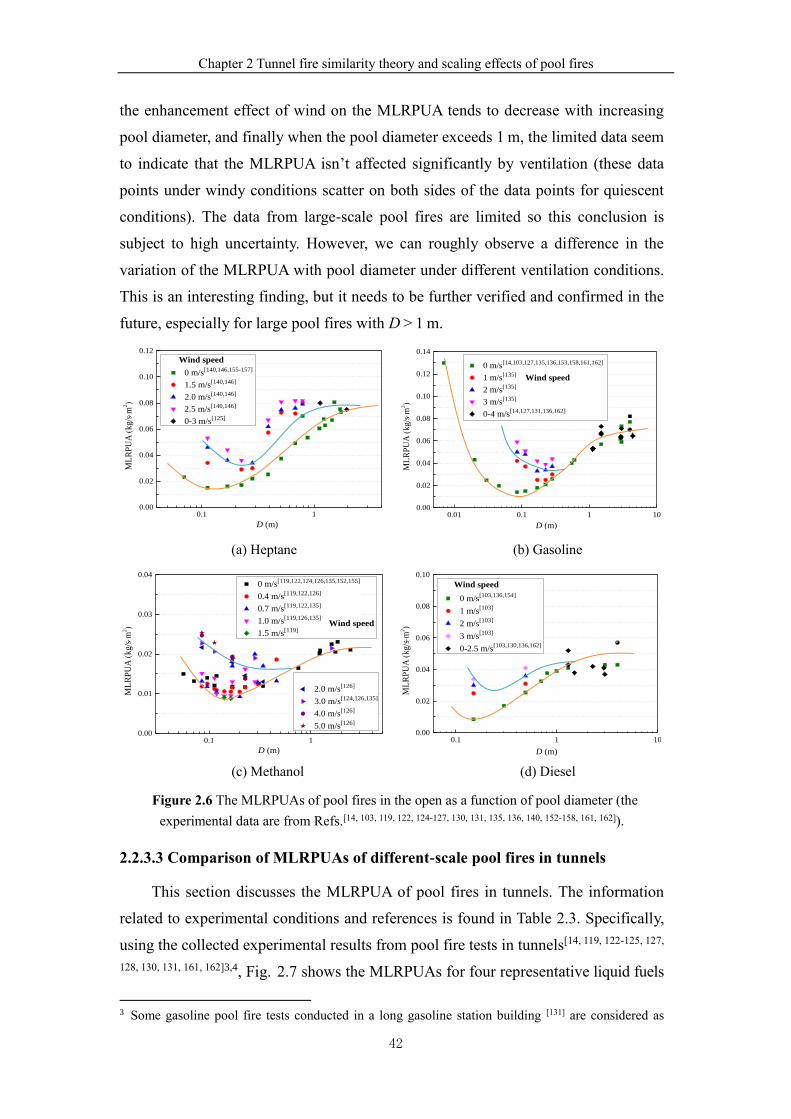
Chapter 2 Tunnel fire similarity theory and scaling effects of pool fires
42
the enhancement effect of wind on the MLRPUA tends to decrease with increasing
pool diameter, and finally when the pool diameter exceeds 1 m, the limited data seem
to indicate that the MLRPUA isn’t affected significantly by ventilation (these data
points under windy conditions scatter on both sides of the data points for quiescent
conditions). The data from large-scale pool fires are limited so this conclusion is
subject to high uncertainty. However, we can roughly observe a difference in the
variation of the MLRPUA with pool diameter under different ventilation conditions.
This is an interesting finding, but it needs to be further verified and confirmed in the
future, especially for large pool fires with D > 1 m.
0.1 10.00
0.02
0.04
0.06
0.08
0.10
0.12
0 m/s[140,146,155-157]
1.5 m/s[140,146]
2.0 m/s[140,146]
2.5 m/s[140,146]
0-3 m/s[125]
ML
RP
UA
(kg/s
m2)
D (m)
Wind speed
0.01 0.1 1 10
0.00
0.02
0.04
0.06
0.08
0.10
0.12
0.14
0 m/s[14,103,127,135,136,153,158,161,162]
1 m/s[135]
2 m/s[135]
3 m/s[135]
0-4 m/s[14,127,131,136,162]M
LR
PU
A (
kg
/sm
2)
D (m)
Wind speed
(a) Heptane (b) Gasoline
0.1 10.00
0.01
0.02
0.03
0.04
ML
RP
UA
(kg/s
m2)
D (m)
0 m/s[119,122,124,126,135,152,155]
0.4 m/s[119,122,126]
0.7 m/s[119,122,135]
1.0 m/s[119,126,135]
1.5 m/s[119]
2.0 m/s[126]
3.0 m/s[124,126,135]
4.0 m/s[126]
5.0 m/s[126]
Wind speed
0.1 1 10
0.00
0.02
0.04
0.06
0.08
0.10
0 m/s[103,136,154]
1 m/s[103]
2 m/s[103]
3 m/s[103]
0-2.5 m/s[103,130,136,162]
ML
RP
UA
(k
g/s
m2)
D (m)
Wind speed
(c) Methanol (d) Diesel
Figure 2.6 The MLRPUAs of pool fires in the open as a function of pool diameter (the
experimental data are from Refs.[14, 103, 119, 122, 124-127, 130, 131, 135, 136, 140, 152-158, 161, 162]).
2.2.3.3 Comparison of MLRPUAs of different-scale pool fires in tunnels
This section discusses the MLRPUA of pool fires in tunnels. The information
related to experimental conditions and references is found in Table 2.3. Specifically,
using the collected experimental results from pool fire tests in tunnels[14, 119, 122-125, 127,
128, 130, 131, 161, 162]3,4, Fig. 2.7 shows the MLRPUAs for four representative liquid fuels
3 Some gasoline pool fire tests conducted in a long gasoline station building [131] are considered as
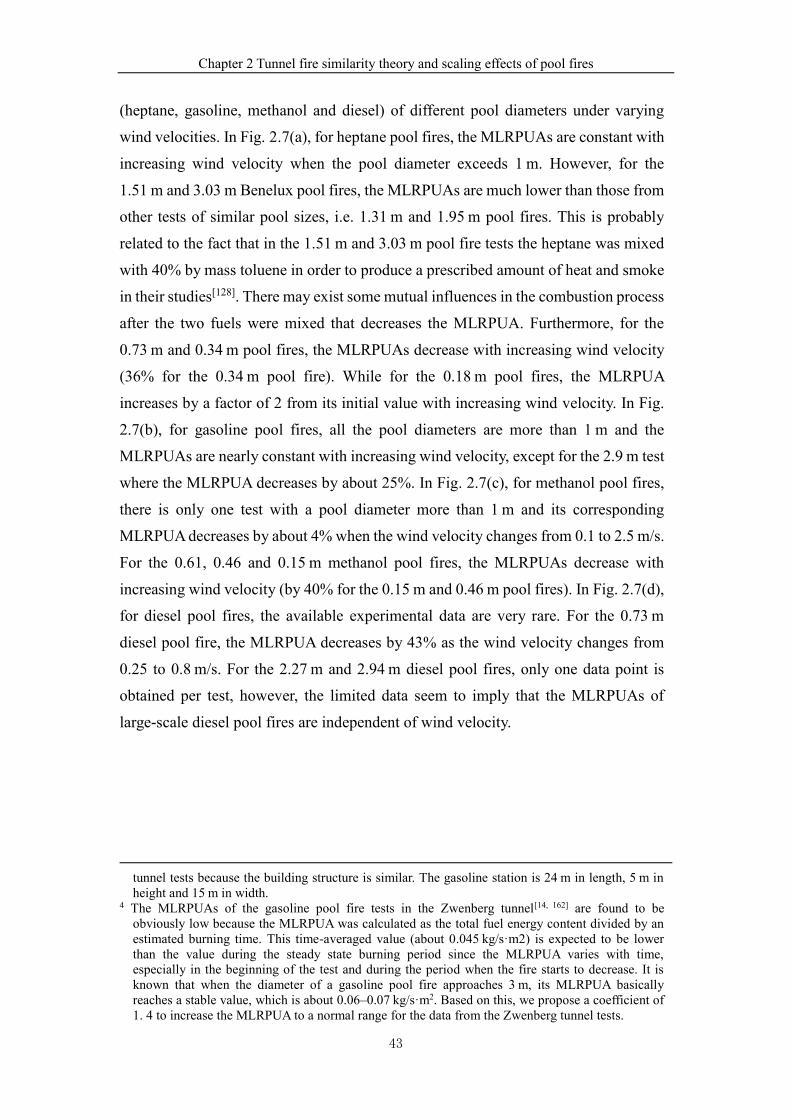
Chapter 2 Tunnel fire similarity theory and scaling effects of pool fires
43
(heptane, gasoline, methanol and diesel) of different pool diameters under varying
wind velocities. In Fig. 2.7(a), for heptane pool fires, the MLRPUAs are constant with
increasing wind velocity when the pool diameter exceeds 1 m. However, for the
1.51 m and 3.03 m Benelux pool fires, the MLRPUAs are much lower than those from
other tests of similar pool sizes, i.e. 1.31 m and 1.95 m pool fires. This is probably
related to the fact that in the 1.51 m and 3.03 m pool fire tests the heptane was mixed
with 40% by mass toluene in order to produce a prescribed amount of heat and smoke
in their studies[128]. There may exist some mutual influences in the combustion process
after the two fuels were mixed that decreases the MLRPUA. Furthermore, for the
0.73 m and 0.34 m pool fires, the MLRPUAs decrease with increasing wind velocity
(36% for the 0.34 m pool fire). While for the 0.18 m pool fires, the MLRPUA
increases by a factor of 2 from its initial value with increasing wind velocity. In Fig.
2.7(b), for gasoline pool fires, all the pool diameters are more than 1 m and the
MLRPUAs are nearly constant with increasing wind velocity, except for the 2.9 m test
where the MLRPUA decreases by about 25%. In Fig. 2.7(c), for methanol pool fires,
there is only one test with a pool diameter more than 1 m and its corresponding
MLRPUA decreases by about 4% when the wind velocity changes from 0.1 to 2.5 m/s.
For the 0.61, 0.46 and 0.15 m methanol pool fires, the MLRPUAs decrease with
increasing wind velocity (by 40% for the 0.15 m and 0.46 m pool fires). In Fig. 2.7(d),
for diesel pool fires, the available experimental data are very rare. For the 0.73 m
diesel pool fire, the MLRPUA decreases by 43% as the wind velocity changes from
0.25 to 0.8 m/s. For the 2.27 m and 2.94 m diesel pool fires, only one data point is
obtained per test, however, the limited data seem to imply that the MLRPUAs of
large-scale diesel pool fires are independent of wind velocity.
tunnel tests because the building structure is similar. The gasoline station is 24 m in length, 5 m in
height and 15 m in width. 4 The MLRPUAs of the gasoline pool fire tests in the Zwenberg tunnel[14, 162] are found to be
obviously low because the MLRPUA was calculated as the total fuel energy content divided by an
estimated burning time. This time-averaged value (about 0.045 kg/s·m2) is expected to be lower
than the value during the steady state burning period since the MLRPUA varies with time,
especially in the beginning of the test and during the period when the fire starts to decrease. It is
known that when the diameter of a gasoline pool fire approaches 3 m, its MLRPUA basically
reaches a stable value, which is about 0.06–0.07 kg/s·m2. Based on this, we propose a coefficient of
1. 4 to increase the MLRPUA to a normal range for the data from the Zwenberg tunnel tests.
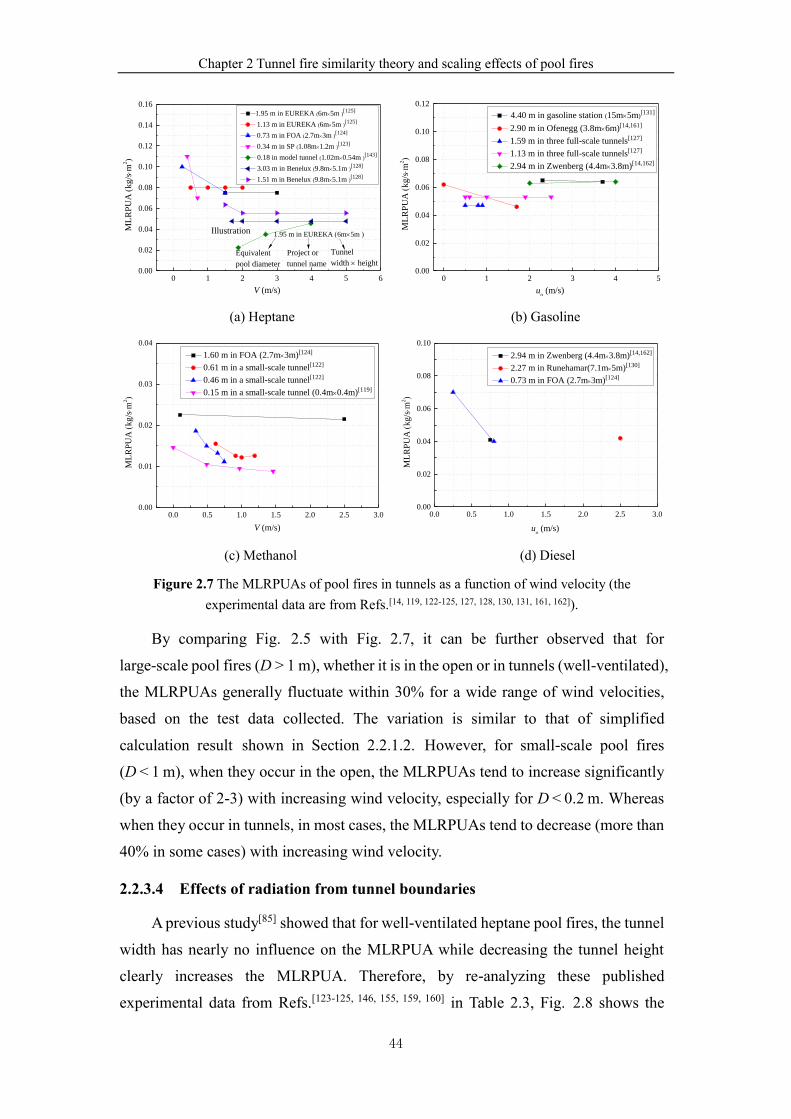
Chapter 2 Tunnel fire similarity theory and scaling effects of pool fires
44
0 1 2 3 4 5 60.00
0.02
0.04
0.06
0.08
0.10
0.12
0.14
0.16
ML
RP
UA
(kg/s
m2)
V (m/s)
1.95 m in EUREKA (6m5m )[125]
1.13 m in EUREKA (6m5m )[125]
0.73 m in FOA (2.7m3m )[124]
0.34 m in SP (1.08m1.2m )[123]
0.18 in model tunnel (1.02m0.54m )[143]
3.03 m in Benelux (9.8m5.1m )[128]
1.51 m in Benelux (9.8m5.1m )[128]
Illustration 1.95 m in EUREKA (6m5m )
Equivalent
pool diameter
Project or
tunnel name
Tunnel
width height
0 1 2 3 4 5
0.00
0.02
0.04
0.06
0.08
0.10
0.12
ML
RP
UA
(k
g/s
m2)
uo (m/s)
4.40 m in gasoline station (15m5m)[131]
2.90 m in Ofenegg (3.8m6m)[14,161]
1.59 m in three full-scale tunnels[127]
1.13 m in three full-scale tunnels[127]
2.94 m in Zwenberg (4.4m3.8m)[14,162]
(a) Heptane (b) Gasoline
0.0 0.5 1.0 1.5 2.0 2.5 3.00.00
0.01
0.02
0.03
0.04
ML
RP
UA
(k
g/s
m2)
V (m/s)
1.60 m in FOA (2.7m3m)[124]
0.61 m in a small-scale tunnel[122]
0.46 m in a small-scale tunnel[122]
0.15 m in a small-scale tunnel (0.4m0.4m)[119]
0.0 0.5 1.0 1.5 2.0 2.5 3.00.00
0.02
0.04
0.06
0.08
0.10
ML
RP
UA
(kg/s
m2)
uo (m/s)
2.94 m in Zwenberg (4.4m3.8m)[14,162]
2.27 m in Runehamar(7.1m5m)[130]
0.73 m in FOA (2.7m3m)[124]
(c) Methanol (d) Diesel
Figure 2.7 The MLRPUAs of pool fires in tunnels as a function of wind velocity (the
experimental data are from Refs.[14, 119, 122-125, 127, 128, 130, 131, 161, 162]).
By comparing Fig. 2.5 with Fig. 2.7, it can be further observed that for
large-scale pool fires (D > 1 m), whether it is in the open or in tunnels (well-ventilated),
the MLRPUAs generally fluctuate within 30% for a wide range of wind velocities,
based on the test data collected. The variation is similar to that of simplified
calculation result shown in Section 2.2.1.2. However, for small-scale pool fires
(D < 1 m), when they occur in the open, the MLRPUAs tend to increase significantly
(by a factor of 2-3) with increasing wind velocity, especially for D < 0.2 m. Whereas
when they occur in tunnels, in most cases, the MLRPUAs tend to decrease (more than
40% in some cases) with increasing wind velocity.
2.2.3.4 Effects of radiation from tunnel boundaries
A previous study[85] showed that for well-ventilated heptane pool fires, the tunnel
width has nearly no influence on the MLRPUA while decreasing the tunnel height
clearly increases the MLRPUA. Therefore, by re-analyzing these published
experimental data from Refs.[123-125, 146, 155, 159, 160] in Table 2.3, Fig. 2.8 shows the
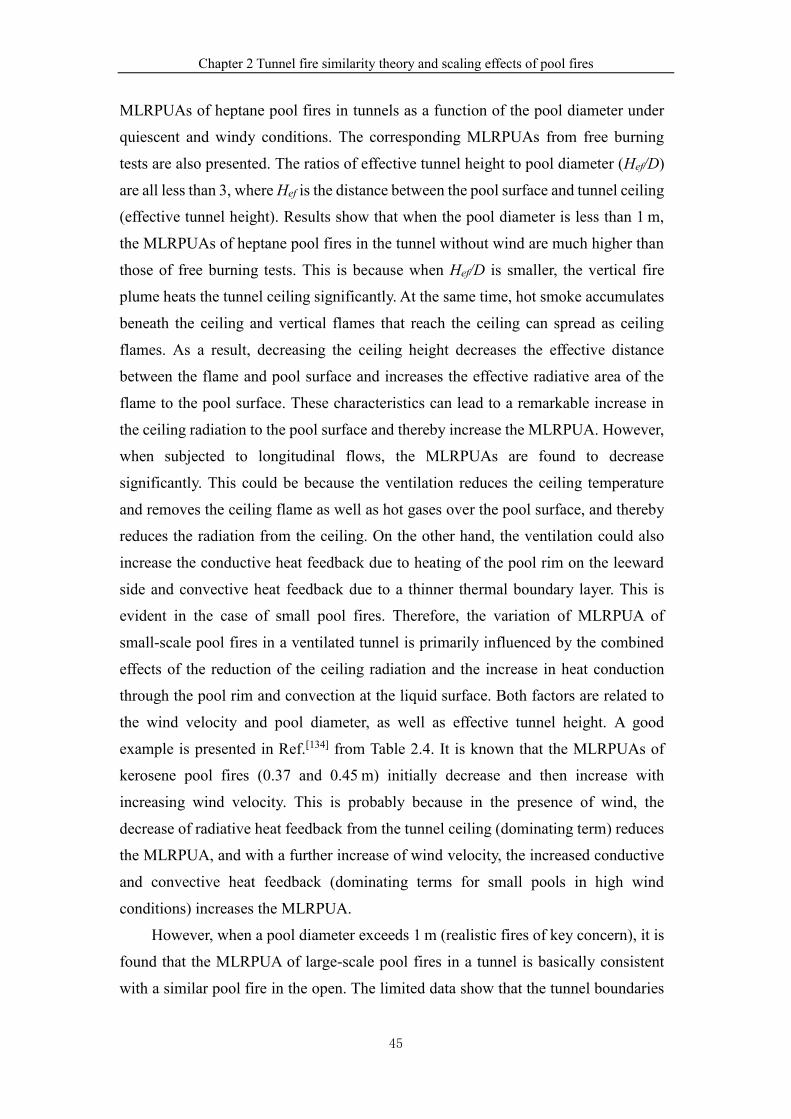
Chapter 2 Tunnel fire similarity theory and scaling effects of pool fires
45
MLRPUAs of heptane pool fires in tunnels as a function of the pool diameter under
quiescent and windy conditions. The corresponding MLRPUAs from free burning
tests are also presented. The ratios of effective tunnel height to pool diameter (Hef/D)
are all less than 3, where Hef is the distance between the pool surface and tunnel ceiling
(effective tunnel height). Results show that when the pool diameter is less than 1 m,
the MLRPUAs of heptane pool fires in the tunnel without wind are much higher than
those of free burning tests. This is because when Hef/D is smaller, the vertical fire
plume heats the tunnel ceiling significantly. At the same time, hot smoke accumulates
beneath the ceiling and vertical flames that reach the ceiling can spread as ceiling
flames. As a result, decreasing the ceiling height decreases the effective distance
between the flame and pool surface and increases the effective radiative area of the
flame to the pool surface. These characteristics can lead to a remarkable increase in
the ceiling radiation to the pool surface and thereby increase the MLRPUA. However,
when subjected to longitudinal flows, the MLRPUAs are found to decrease
significantly. This could be because the ventilation reduces the ceiling temperature
and removes the ceiling flame as well as hot gases over the pool surface, and thereby
reduces the radiation from the ceiling. On the other hand, the ventilation could also
increase the conductive heat feedback due to heating of the pool rim on the leeward
side and convective heat feedback due to a thinner thermal boundary layer. This is
evident in the case of small pool fires. Therefore, the variation of MLRPUA of
small-scale pool fires in a ventilated tunnel is primarily influenced by the combined
effects of the reduction of the ceiling radiation and the increase in heat conduction
through the pool rim and convection at the liquid surface. Both factors are related to
the wind velocity and pool diameter, as well as effective tunnel height. A good
example is presented in Ref.[134] from Table 2.4. It is known that the MLRPUAs of
kerosene pool fires (0.37 and 0.45 m) initially decrease and then increase with
increasing wind velocity. This is probably because in the presence of wind, the
decrease of radiative heat feedback from the tunnel ceiling (dominating term) reduces
the MLRPUA, and with a further increase of wind velocity, the increased conductive
and convective heat feedback (dominating terms for small pools in high wind
conditions) increases the MLRPUA.
However, when a pool diameter exceeds 1 m (realistic fires of key concern), it is
found that the MLRPUA of large-scale pool fires in a tunnel is basically consistent
with a similar pool fire in the open. The limited data show that the tunnel boundaries
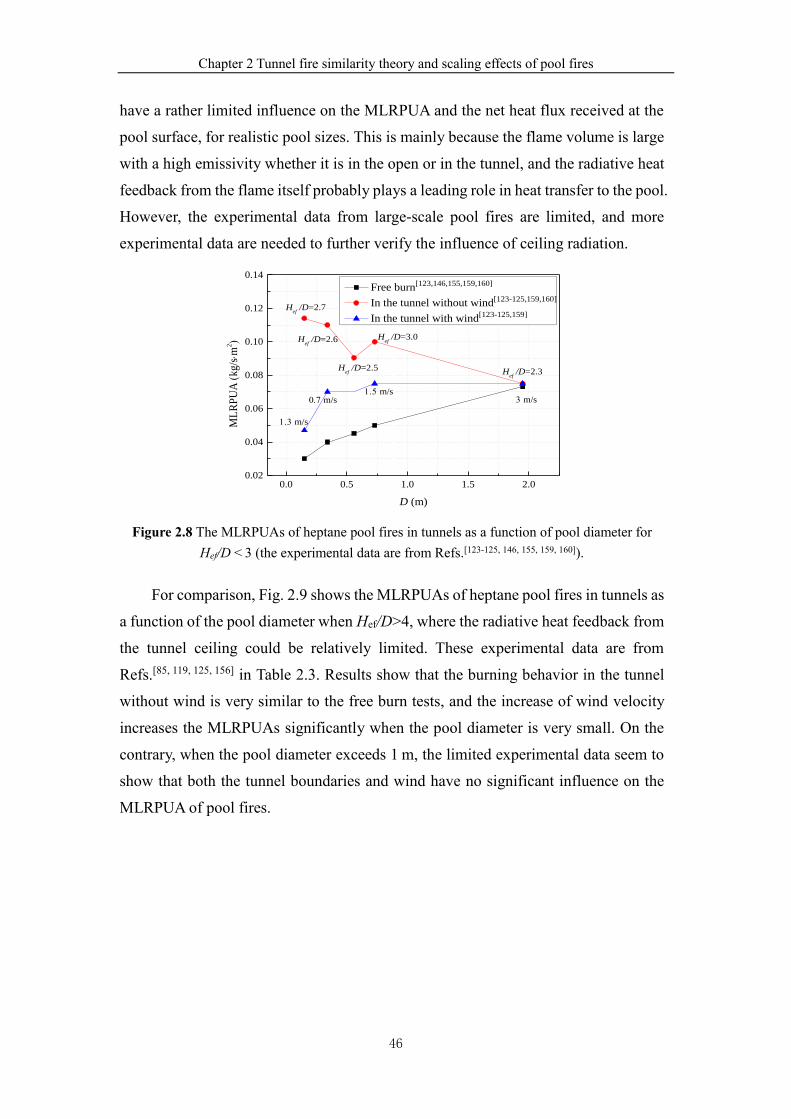
Chapter 2 Tunnel fire similarity theory and scaling effects of pool fires
46
have a rather limited influence on the MLRPUA and the net heat flux received at the
pool surface, for realistic pool sizes. This is mainly because the flame volume is large
with a high emissivity whether it is in the open or in the tunnel, and the radiative heat
feedback from the flame itself probably plays a leading role in heat transfer to the pool.
However, the experimental data from large-scale pool fires are limited, and more
experimental data are needed to further verify the influence of ceiling radiation.
0.0 0.5 1.0 1.5 2.00.02
0.04
0.06
0.08
0.10
0.12
0.14
m/s m/s
m/s
Hef /D=2.3
Hef /D=3.0
Hef /D=2.5
Hef /D=2.6
Hef /D=2.7
ML
RP
UA
(kg/s
m2)
D (m)
Free burn[123,146,155,159,160]
In the tunnel without wind[123-125,159,160]
In the tunnel with wind[123-125,159]
m/s
Figure 2.8 The MLRPUAs of heptane pool fires in tunnels as a function of pool diameter for
Hef/D < 3 (the experimental data are from Refs.[123-125, 146, 155, 159, 160]).
For comparison, Fig. 2.9 shows the MLRPUAs of heptane pool fires in tunnels as
a function of the pool diameter when Hef/D>4, where the radiative heat feedback from
the tunnel ceiling could be relatively limited. These experimental data are from
Refs.[85, 119, 125, 156] in Table 2.3. Results show that the burning behavior in the tunnel
without wind is very similar to the free burn tests, and the increase of wind velocity
increases the MLRPUAs significantly when the pool diameter is very small. On the
contrary, when the pool diameter exceeds 1 m, the limited experimental data seem to
show that both the tunnel boundaries and wind have no significant influence on the
MLRPUA of pool fires.
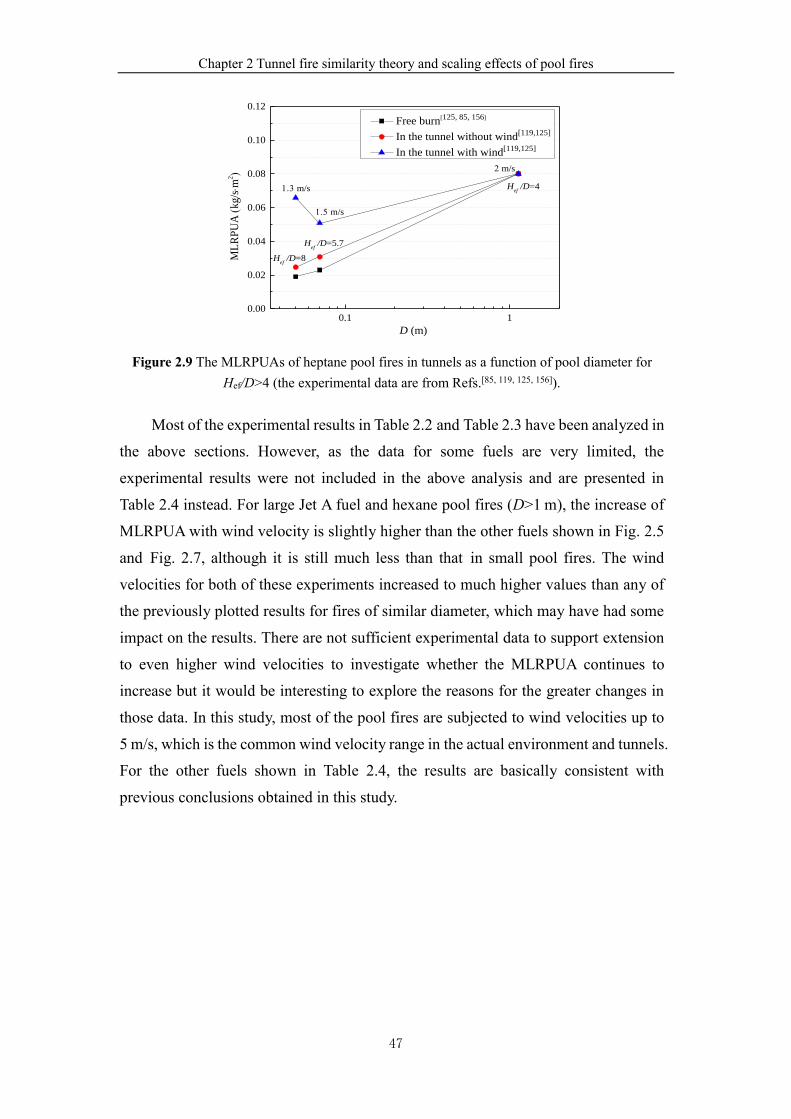
Chapter 2 Tunnel fire similarity theory and scaling effects of pool fires
47
0.1 10.00
0.02
0.04
0.06
0.08
0.10
0.12
m/s
m/s
Hef /D=5.7
Hef /D=4
Hef /D=8
ML
RP
UA
(kg/s
m2)
D (m)
Free burn[125, 85, 156]
In the tunnel without wind[119,125]
In the tunnel with wind[119,125]
m/s
Figure 2.9 The MLRPUAs of heptane pool fires in tunnels as a function of pool diameter for
Hef/D>4 (the experimental data are from Refs.[85, 119, 125, 156]).
Most of the experimental results in Table 2.2 and Table 2.3 have been analyzed in
the above sections. However, as the data for some fuels are very limited, the
experimental results were not included in the above analysis and are presented in
Table 2.4 instead. For large Jet A fuel and hexane pool fires (D>1 m), the increase of
MLRPUA with wind velocity is slightly higher than the other fuels shown in Fig. 2.5
and Fig. 2.7, although it is still much less than that in small pool fires. The wind
velocities for both of these experiments increased to much higher values than any of
the previously plotted results for fires of similar diameter, which may have had some
impact on the results. There are not sufficient experimental data to support extension
to even higher wind velocities to investigate whether the MLRPUA continues to
increase but it would be interesting to explore the reasons for the greater changes in
those data. In this study, most of the pool fires are subjected to wind velocities up to
5 m/s, which is the common wind velocity range in the actual environment and tunnels.
For the other fuels shown in Table 2.4, the results are basically consistent with
previous conclusions obtained in this study.
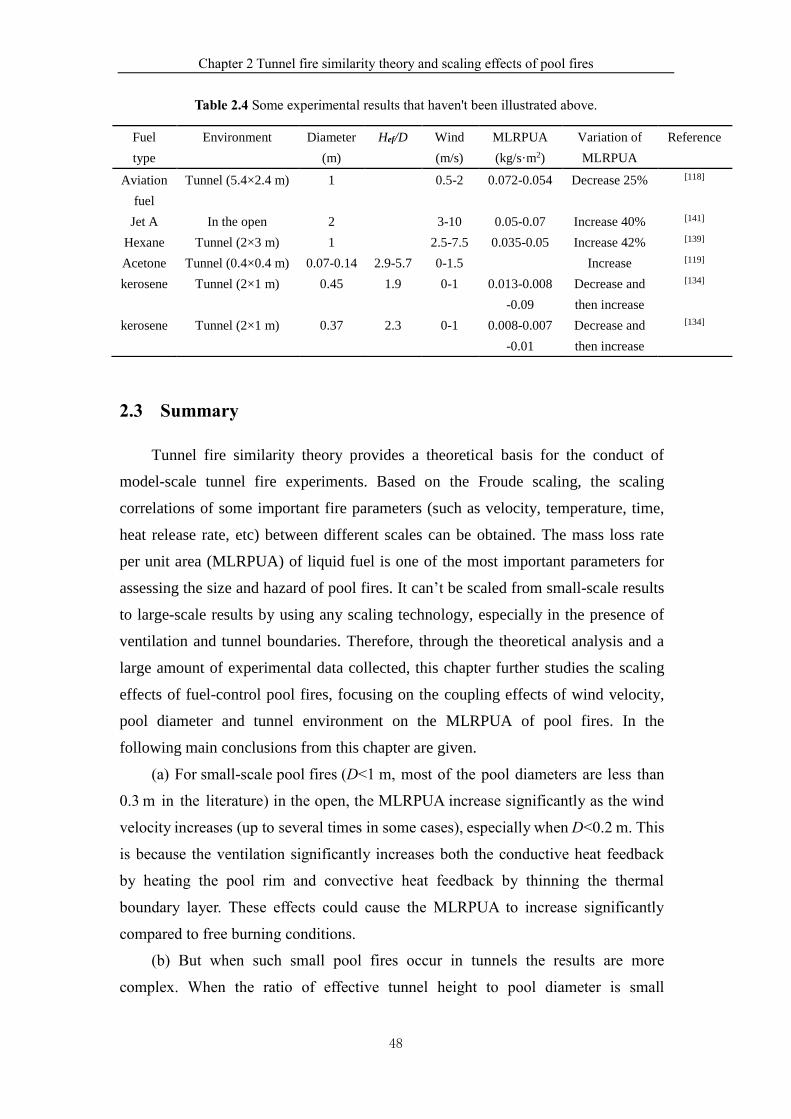
Chapter 2 Tunnel fire similarity theory and scaling effects of pool fires
48
Table 2.4 Some experimental results that haven't been illustrated above.
2.3 Summary
Tunnel fire similarity theory provides a theoretical basis for the conduct of
model-scale tunnel fire experiments. Based on the Froude scaling, the scaling
correlations of some important fire parameters (such as velocity, temperature, time,
heat release rate, etc) between different scales can be obtained. The mass loss rate
per unit area (MLRPUA) of liquid fuel is one of the most important parameters for
assessing the size and hazard of pool fires. It can’t be scaled from small-scale results
to large-scale results by using any scaling technology, especially in the presence of
ventilation and tunnel boundaries. Therefore, through the theoretical analysis and a
large amount of experimental data collected, this chapter further studies the scaling
effects of fuel-control pool fires, focusing on the coupling effects of wind velocity,
pool diameter and tunnel environment on the MLRPUA of pool fires. In the
following main conclusions from this chapter are given.
(a) For small-scale pool fires (D<1 m, most of the pool diameters are less than
0.3 m in the literature) in the open, the MLRPUA increase significantly as the wind
velocity increases (up to several times in some cases), especially when D<0.2 m. This
is because the ventilation significantly increases both the conductive heat feedback
by heating the pool rim and convective heat feedback by thinning the thermal
boundary layer. These effects could cause the MLRPUA to increase significantly
compared to free burning conditions.
(b) But when such small pool fires occur in tunnels the results are more
complex. When the ratio of effective tunnel height to pool diameter is small
Fuel
type
Environment Diameter
(m)
Hef/D Wind
(m/s)
MLRPUA
(kg/s·m2)
Variation of
MLRPUA
Reference
Aviation
fuel
Tunnel (5.4×2.4 m) 1 0.5-2 0.072-0.054 Decrease 25% [118]
Jet A In the open 2 3-10 0.05-0.07 Increase 40% [141]
Hexane Tunnel (2×3 m) 1 2.5-7.5 0.035-0.05 Increase 42% [139]
Acetone Tunnel (0.4×0.4 m) 0.07-0.14 2.9-5.7 0-1.5 Increase [119]
kerosene Tunnel (2×1 m) 0.45 1.9 0-1 0.013-0.008
-0.09
Decrease and
then increase
[134]
kerosene Tunnel (2×1 m) 0.37 2.3 0-1 0.008-0.007
-0.01
Decrease and
then increase
[134]
Chapter 2 Tunnel fire similarity theory and scaling effects of pool fires
49
(Hef/D < 3, based on collected experimental data), the radiative heat feedback from
the tunnel ceiling is probably the dominating influence, leading to a much higher
MLRPUA than that in free burning conditions (up to several times in some cases).
Under such conditions, if there is longitudinal ventilation in the tunnel, the ceiling is
cooled and the effective radiative area of flame and hot gas to the pool surface
decreases. As a result, the MLRPUA decreases due to the reduced radiation from the
ceiling. However, with a further increase of wind velocity, the conductive and
convective heat feedback probably become more important and thereby increase the
MLRPUA. When the ratio of effective tunnel height to pool diameter is relatively
large (Hef/D > 4, based on collected experimental data), the radiative heat feedback
from the tunnel ceiling could be limited and hence the burning characteristics of pool
fires in tunnels are similar to those in the open.
(c) The influence of wind on the MLRPUA decreases with increasing pool
diameter, no matter whether the pool is in the open or in a tunnel. When the pool
diameter exceeds 1 m, the flames are highly turbulent, optically-thick flames, and
thus the radiation from the flame itself is probably predominant, compared to
conduction through the pool rim and convection at the liquid surface as well as
possible ceiling radiation. The MLRPUA most likely fluctuates within 30% for a
wide range of wind velocities both in the open and in tunnels, according to the test
data collected. This value is far less than previous conclusions obtained solely from
small-scale pool fire experiments.
Nomenclature in this chapter
l: length (m)
D: pool diameter (m)
Hef: effective tunnel height (m)
Δx: rim thickness of fuel pan (m)
Δh: pool height below liquid surface (m)
x : axis coordinate (m)
t : time (s)
u : velocity (m/s)
V : ventilation velocity (m/s)
T : temperature (K)
p : pressure (Pa)
g : acceleration of gravity (m/s2)
: kinetic viscosity (kg/(m·s))
Chapter 2 Tunnel fire similarity theory and scaling effects of pool fires
50
v: kinematic viscosity (m2/s)
k: thermal conductivity (W/(m·K))
h : convective heat transfer coefficient (W/(m2·K))
ek : extinction coefficient (m-1)
a: thermal diffusivity (m2/s)
N : mass diffusivity (m2/s)
m : mass loss rate per unit area (kg/(s·m2))
m : mass flow rate per unit volume (kg/(s·m3))
m : limiting, radiation-dominated mass loss rate per unit area (kg/(s·m2))
Q : heat release rate (kW)
Q : heat release rate per unit volume (kJ/(s·m3))
lossQ : heat loss rate per unit volume (kJ/(s·m3))
Fq : heat flux received by pool surface per unit area (kW/m2)
Lq : heat loss through pool surface per unit area (kW/m2)
vL : latent heat of vaporization (kJ/g)
pc : specific heat at constant pressure (kJ/(kg·K))
oT : ambient air temperature (K)
boilT : boiling temperature (K)
lT : liquid temperature (K)
Tr: temperatures from the pool rim (K)
Tf1: temperatures above the liquid surface (K)
Tf2: temperatures from the flame zone (K)
Y : mass fraction (%)
X: volume fraction (%)
F: view factor
Corner mark
Model: model scale
Full: full scale
i: i-th species
o: characteristic quantity
: nondimensionalize
Greek symbols
: density (kg/m3)
0 : ambient air density (kg/m3)
β: mean beam length corrector (m)
σ : Stefan–Boltzmann constant (5.6710-8 W·m-2·K-4)
Chapter 3 Maximum gas temperature rise beneath the ceiling in an enclosed tunnel under different
fire locations
51
Chapter 3
Maximum gas temperature rise beneath the ceiling in an
enclosed tunnel under different fire locations
3.1 Introduction
Maximum gas temperature rise beneath the ceiling is one of the main concerns
in tunnel fire research[4, 8, 23-25]. This is because it is one of the most important
parameters in evaluating fire hazards and guiding fire detection. The hot gas inside
the tunnel not only threatens the inside users, but also affects the structural stability of
the tunnel. Most concretes experience a strength reduction above 300 °C, which
depends on the type of cement blend used in the mix[6]. The temperature at which the
concrete surface falls off is in a range of about 250 - 420 °C[7]. Alpert[23], Kurioka[24]
and Li et al.[25] developed classical prediction models of maximum gas temperature
rise beneath the ceiling, respectively. The prediction model proposed by Li et al.[25]
has a wider range for application, which considers the influence of different
longitudinal ventilation velocities on fire behaviors and maximum gas temperature,
see Eq. (3.1).
1 3 5 3
max 2 3
5 3
, 0.19
17.5 , 0.19
ef
ef
QV
Vb HT
QV
H
=
(3.1)
with
1 3
c
o p o
gQV V
b c T
=
(3.2)
where Q is the heat release rate, cQ is the convective heat release rate, V is the
longitudinal ventilation velocity, V is the dimensionless longitudinal ventilation
velocity, b is the radius of fire (m), efH is the effective tunnel height, oT is the
ambient air temperature, o is the ambient air density, g is the acceleration of
gravity, pc is the specific heat of air at constant pressure.
Based on the above studies, the influences of tunnel slope[62], vehicle
Chapter 3 Maximum gas temperature rise beneath the ceiling in an enclosed tunnel under different
fire locations
52
blockage[74], tunnel aspect ratio[79], ambient pressure[68] and natural ventilation
shaft[163] on the maximum gas temperature rise were also investigated. Currently, the
study about the influence of fire location on the maximum gas temperature rise has
attracted a lot of attentions[89, 164-166]. Gao et al.[164] studied the influence of transverse
fire location on fire behaviors in a model-scale tunnel. Results indicated that the
maximum gas temperature rise with fire located at the sidewall is much higher than
that for other transverse fire locations. Fan et al.[165] studied the influence of
longitudinal fire location on fire behaviors in a model-scale tunnel with both portals
opened. Results indicated that the maximum gas temperature rise is not much
affected by the fire location in longitudinal direction. Ji et al.[89] studied the
maximum gas temperature beneath the ceiling in a model-scale tunnel with one portal
closed and another portal opened. Results shown that the maximum gas temperature
rise increases exponentially with a shorter distance (0.25 - 2 m) between the fire
source and closed end wall, which results from the heat feedback of returned hot gas
bounced from the end wall.
Previous scholars mostly focused on the normal tunnel fires with both portals
opened, leaving very few studies on the fires in an enclosed tunnel. Different from
the normal tunnel fires, in an enclosed tunnel, the fire smoke can’t be discharged
through the tunnel portals and the fire can’t get fresh air supply from outside the
tunnel environment, resulting in a decrease in O2 concentration around the flame.
These characteristics probably cause different flame behaviors, which may be further
affected by the longitudinal fire location. The prediction models of maximum gas
temperature rise from normal tunnel fires are not applicable to the fire scenarios in
enclosed tunnels.
Therefore, this chapter studies the maximum gas temperature rise beneath the
ceiling in an enclosed tunnel with different fire locations. What this study focuses on
is the fire scenarios with a low heat release rate (i.e, the continuous flame doesn’t
reach the tunnel ceiling). In addition to the special tunnel structure, this study is also
applicable to the early fire scenarios in a subway train carriage and an underground
utility tunnel, etc. The outcomes are of great significance in understanding the fire
behaviors and guiding the early fire detection of this type of tunnel fires.
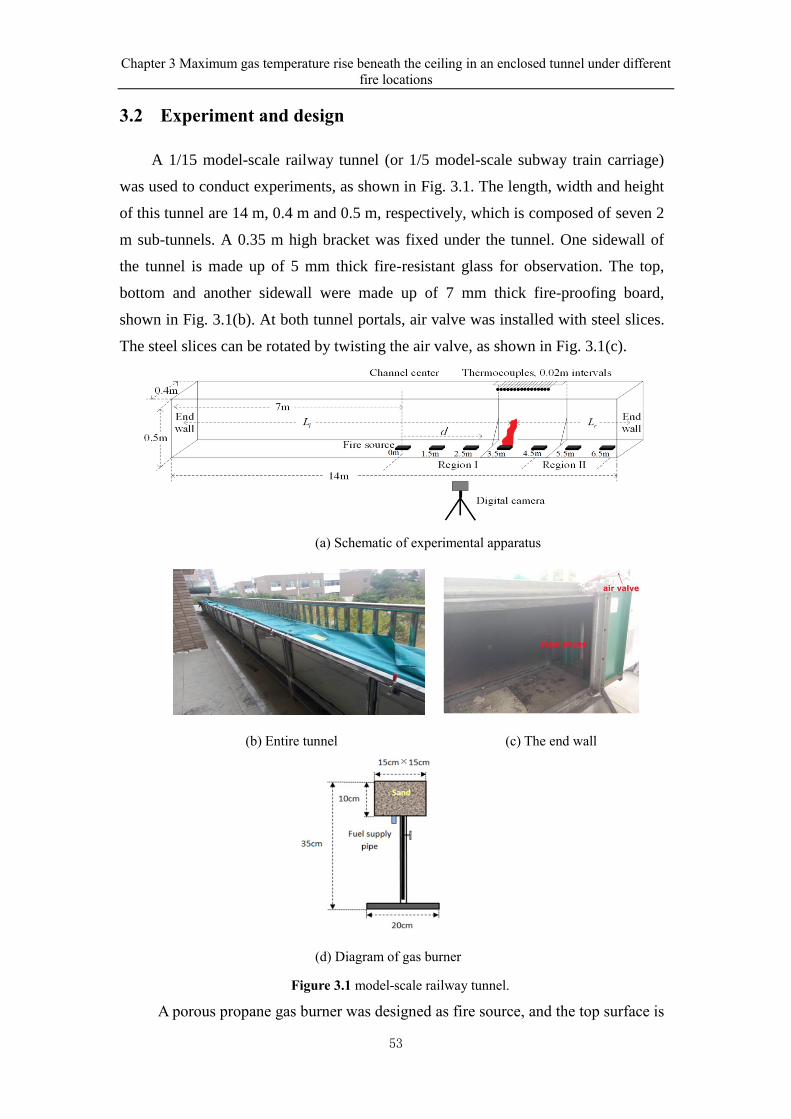
Chapter 3 Maximum gas temperature rise beneath the ceiling in an enclosed tunnel under different
fire locations
53
3.2 Experiment and design
A 1/15 model-scale railway tunnel (or 1/5 model-scale subway train carriage)
was used to conduct experiments, as shown in Fig. 3.1. The length, width and height
of this tunnel are 14 m, 0.4 m and 0.5 m, respectively, which is composed of seven 2
m sub-tunnels. A 0.35 m high bracket was fixed under the tunnel. One sidewall of
the tunnel is made up of 5 mm thick fire-resistant glass for observation. The top,
bottom and another sidewall were made up of 7 mm thick fire-proofing board,
shown in Fig. 3.1(b). At both tunnel portals, air valve was installed with steel slices.
The steel slices can be rotated by twisting the air valve, as shown in Fig. 3.1(c).
(a) Schematic of experimental apparatus
(b) Entire tunnel (c) The end wall
(d) Diagram of gas burner
Figure 3.1 model-scale railway tunnel.
A porous propane gas burner was designed as fire source, and the top surface is
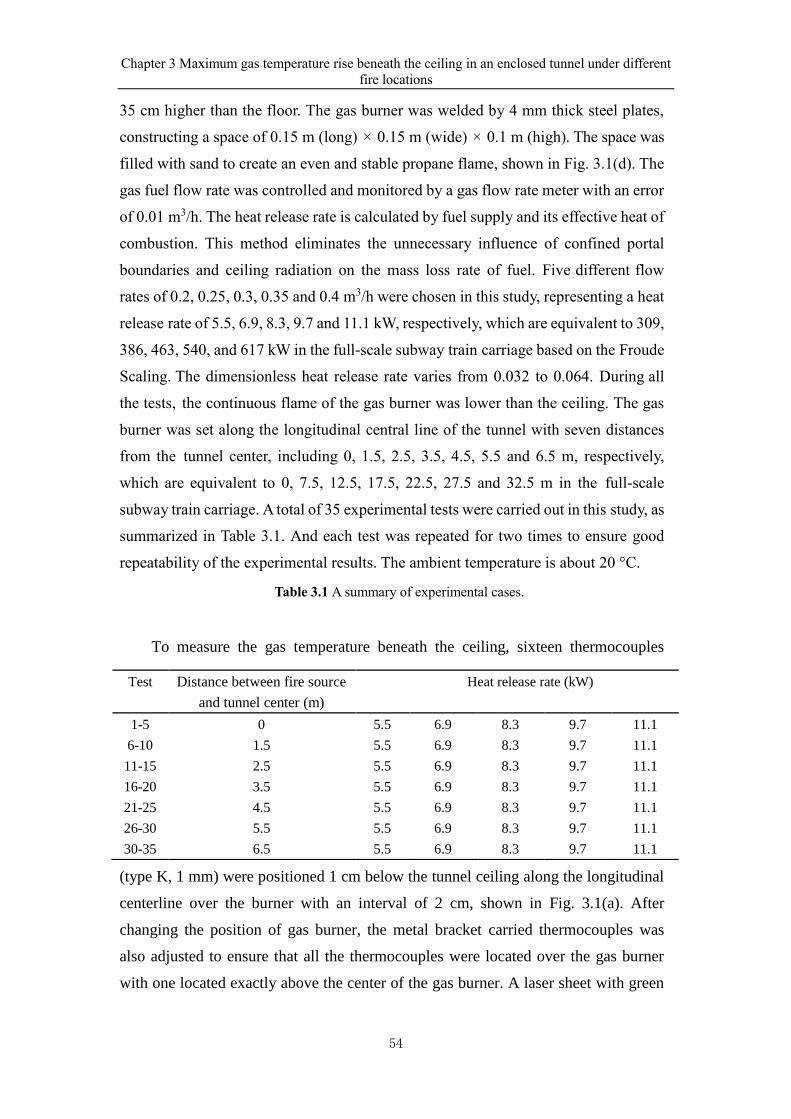
Chapter 3 Maximum gas temperature rise beneath the ceiling in an enclosed tunnel under different
fire locations
54
35 cm higher than the floor. The gas burner was welded by 4 mm thick steel plates,
constructing a space of 0.15 m (long) × 0.15 m (wide) × 0.1 m (high). The space was
filled with sand to create an even and stable propane flame, shown in Fig. 3.1(d). The
gas fuel flow rate was controlled and monitored by a gas flow rate meter with an error
of 0.01 m3/h. The heat release rate is calculated by fuel supply and its effective heat of
combustion. This method eliminates the unnecessary influence of confined portal
boundaries and ceiling radiation on the mass loss rate of fuel. Five different flow
rates of 0.2, 0.25, 0.3, 0.35 and 0.4 m3/h were chosen in this study, representing a heat
release rate of 5.5, 6.9, 8.3, 9.7 and 11.1 kW, respectively, which are equivalent to 309,
386, 463, 540, and 617 kW in the full-scale subway train carriage based on the Froude
Scaling. The dimensionless heat release rate varies from 0.032 to 0.064. During all
the tests, the continuous flame of the gas burner was lower than the ceiling. The gas
burner was set along the longitudinal central line of the tunnel with seven distances
from the tunnel center, including 0, 1.5, 2.5, 3.5, 4.5, 5.5 and 6.5 m, respectively,
which are equivalent to 0, 7.5, 12.5, 17.5, 22.5, 27.5 and 32.5 m in the full-scale
subway train carriage. A total of 35 experimental tests were carried out in this study, as
summarized in Table 3.1. And each test was repeated for two times to ensure good
repeatability of the experimental results. The ambient temperature is about 20 °C.
Table 3.1 A summary of experimental cases.
To measure the gas temperature beneath the ceiling, sixteen thermocouples
(type K, 1 mm) were positioned 1 cm below the tunnel ceiling along the longitudinal
centerline over the burner with an interval of 2 cm, shown in Fig. 3.1(a). After
changing the position of gas burner, the metal bracket carried thermocouples was
also adjusted to ensure that all the thermocouples were located over the gas burner
with one located exactly above the center of the gas burner. A laser sheet with green
Test Distance between fire source
and tunnel center (m)
Heat release rate (kW)
1-5 0
1.5
2.5
3.5
4.5
5.5 6.9 8.3 9.7 11.1
6-10 5.5 6.9 8.3 9.7 11.1
11-15 5.5 6.9 8.3 9.7 11.1
16-20 5.5 6.9 8.3 9.7 11.1
21-25 5.5 6.9 8.3 9.7 11.1
26-30
30-35
5.5
6.5
5.5
5.5
6.9
6.9
8.3
8.3
9.7
9.7
11.1
11.1
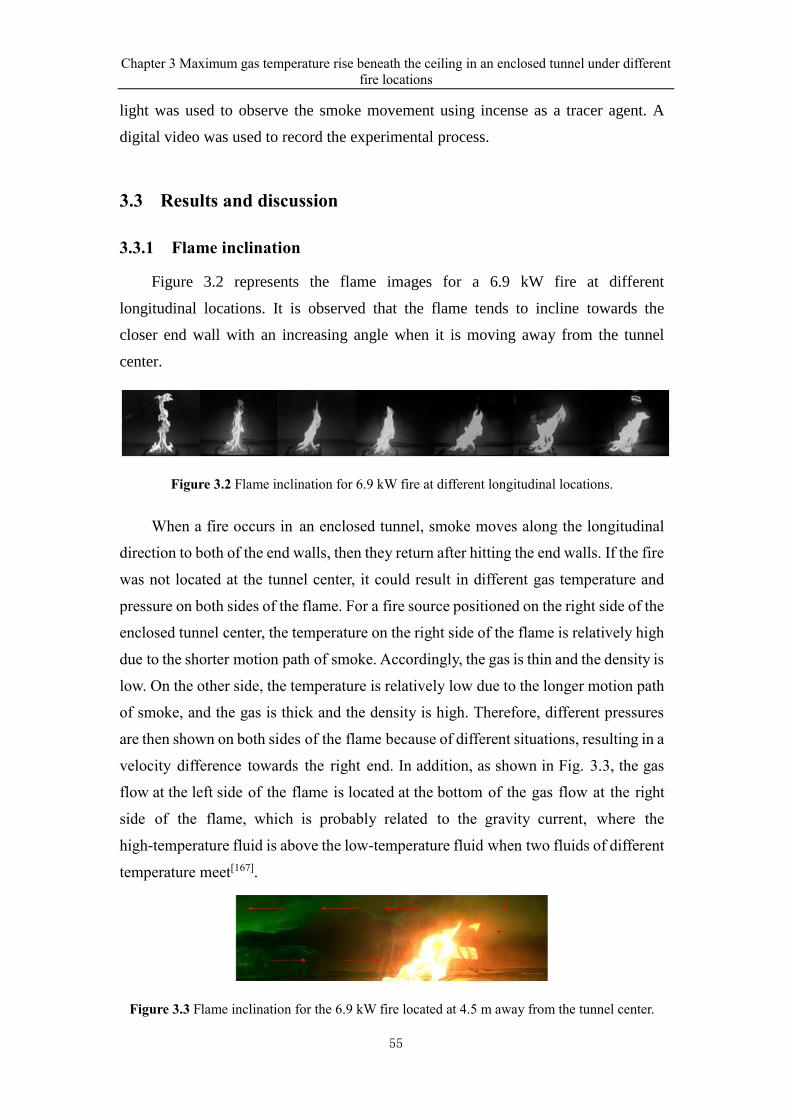
Chapter 3 Maximum gas temperature rise beneath the ceiling in an enclosed tunnel under different
fire locations
55
light was used to observe the smoke movement using incense as a tracer agent. A
digital video was used to record the experimental process.
3.3 Results and discussion
3.3.1 Flame inclination
Figure 3.2 represents the flame images for a 6.9 kW fire at different
longitudinal locations. It is observed that the flame tends to incline towards the
closer end wall with an increasing angle when it is moving away from the tunnel
center.
Figure 3.2 Flame inclination for 6.9 kW fire at different longitudinal locations.
When a fire occurs in an enclosed tunnel, smoke moves along the longitudinal
direction to both of the end walls, then they return after hitting the end walls. If the fire
was not located at the tunnel center, it could result in different gas temperature and
pressure on both sides of the flame. For a fire source positioned on the right side of the
enclosed tunnel center, the temperature on the right side of the flame is relatively high
due to the shorter motion path of smoke. Accordingly, the gas is thin and the density is
low. On the other side, the temperature is relatively low due to the longer motion path
of smoke, and the gas is thick and the density is high. Therefore, different pressures
are then shown on both sides of the flame because of different situations, resulting in a
velocity difference towards the right end. In addition, as shown in Fig. 3.3, the gas
flow at the left side of the flame is located at the bottom of the gas flow at the right
side of the flame, which is probably related to the gravity current, where the
high-temperature fluid is above the low-temperature fluid when two fluids of different
temperature meet[167].
Figure 3.3 Flame inclination for the 6.9 kW fire located at 4.5 m away from the tunnel center.
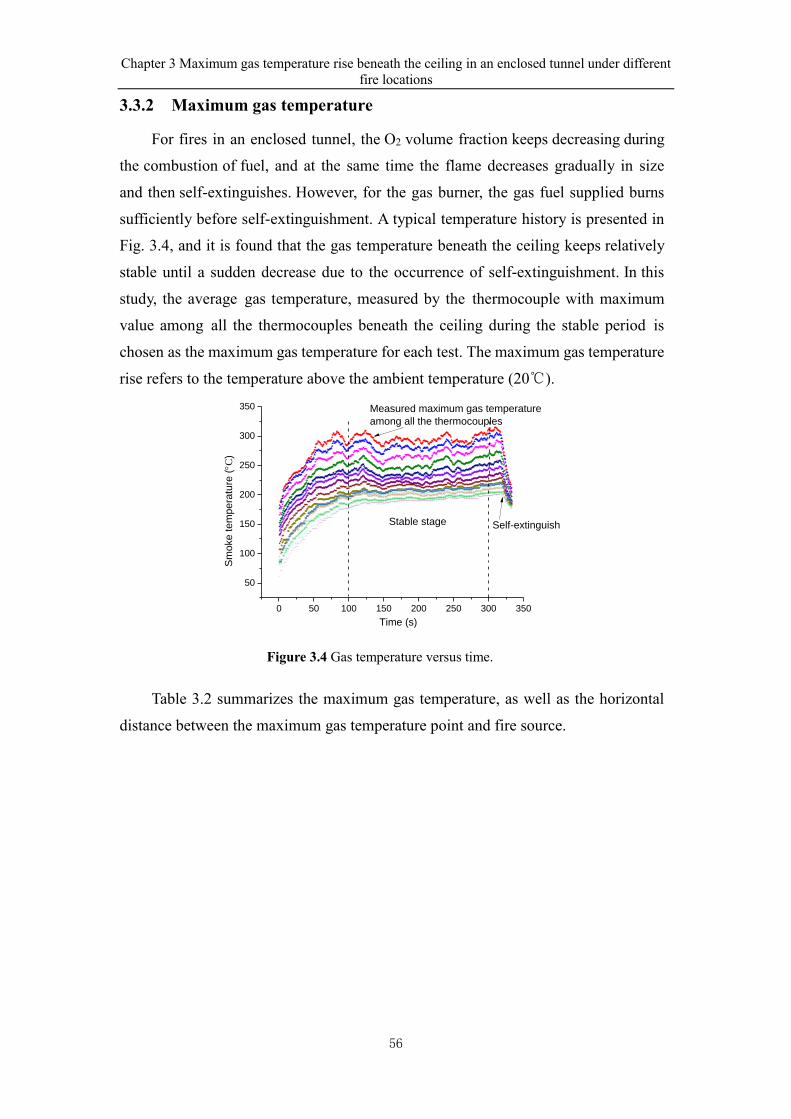
Chapter 3 Maximum gas temperature rise beneath the ceiling in an enclosed tunnel under different
fire locations
56
3.3.2 Maximum gas temperature
For fires in an enclosed tunnel, the O2 volume fraction keeps decreasing during
the combustion of fuel, and at the same time the flame decreases gradually in size
and then self-extinguishes. However, for the gas burner, the gas fuel supplied burns
sufficiently before self-extinguishment. A typical temperature history is presented in
Fig. 3.4, and it is found that the gas temperature beneath the ceiling keeps relatively
stable until a sudden decrease due to the occurrence of self-extinguishment. In this
study, the average gas temperature, measured by the thermocouple with maximum
value among all the thermocouples beneath the ceiling during the stable period is
chosen as the maximum gas temperature for each test. The maximum gas temperature
rise refers to the temperature above the ambient temperature (20℃).
0 50 100 150 200 250 300 350
50
100
150
200
250
300
350 Measured maximum gas temperature
among all the thermocouples
Self-extinguish
Sm
oke tem
pera
ture
(C
)
Time (s)
Stable stage
Figure 3.4 Gas temperature versus time.
Table 3.2 summarizes the maximum gas temperature, as well as the horizontal
distance between the maximum gas temperature point and fire source.
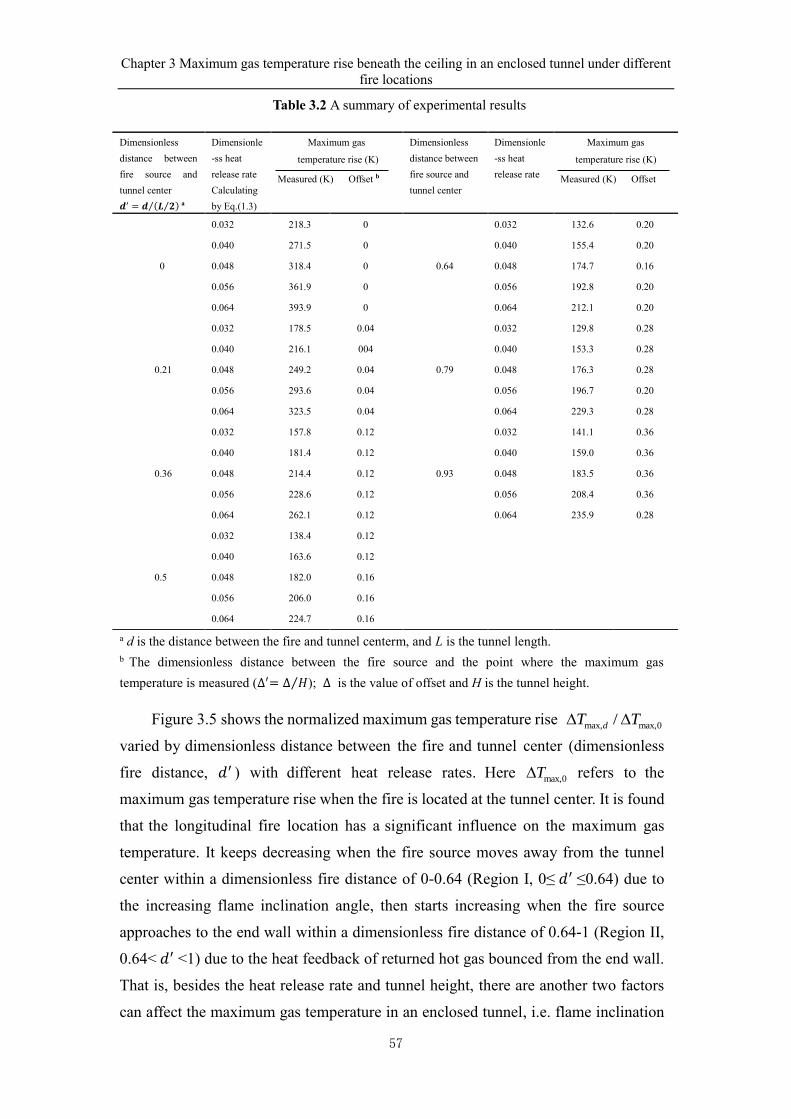
Chapter 3 Maximum gas temperature rise beneath the ceiling in an enclosed tunnel under different
fire locations
57
Table 3.2 A summary of experimental results
a d is the distance between the fire and tunnel centerm, and L is the tunnel length.
b The dimensionless distance between the fire source and the point where the maximum gas
temperature is measured (∆′= ∆ 𝐻⁄ ); ∆ is the value of offset and H is the tunnel height.
Figure 3.5 shows the normalized maximum gas temperature rise max, max,0/ dT T
varied by dimensionless distance between the fire and tunnel center (dimensionless
fire distance, 𝑑′ ) with different heat release rates. Here max,0T refers to the
maximum gas temperature rise when the fire is located at the tunnel center. It is found
that the longitudinal fire location has a significant influence on the maximum gas
temperature. It keeps decreasing when the fire source moves away from the tunnel
center within a dimensionless fire distance of 0-0.64 (Region I, 0≤ 𝑑′ ≤0.64) due to
the increasing flame inclination angle, then starts increasing when the fire source
approaches to the end wall within a dimensionless fire distance of 0.64-1 (Region II,
0.64< 𝑑′ <1) due to the heat feedback of returned hot gas bounced from the end wall.
That is, besides the heat release rate and tunnel height, there are another two factors
can affect the maximum gas temperature in an enclosed tunnel, i.e. flame inclination
Dimensionless
distance between
fire source and
tunnel center
𝒅′ = 𝒅 (𝑳 𝟐⁄ )⁄ a
Dimensionle
-ss heat
release rate
Calculating
by Eq.(1.3)
Maximum gas
temperature rise (K)
Measured (K) Offset b
Dimensionless
distance between
fire source and
tunnel center
Dimensionle
-ss heat
release rate
Maximum gas
temperature rise (K)
Measured (K) Offset
0
0.032 218.3 0
0.64
0.032 132.6 0.20
0.040 271.5 0 0.040 155.4 0.20
0.048 318.4 0 0.048 174.7 0.16
0.056 361.9 0 0.056 192.8 0.20
0.064 393.9 0 0.064 212.1 0.20
0.21
0.032 178.5 0.04
0.79
0.032 129.8 0.28
0.040 216.1 004 0.040 153.3 0.28
0.048 249.2 0.04 0.048 176.3 0.28
0.056 293.6 0.04 0.056 196.7 0.20
0.064 323.5 0.04 0.064 229.3 0.28
0.36
0.032 157.8 0.12
0.93
0.032 141.1 0.36
0.040 181.4 0.12 0.040 159.0 0.36
0.048 214.4 0.12 0.048 183.5 0.36
0.056 228.6 0.12 0.056 208.4 0.36
0.064 262.1 0.12 0.064 235.9 0.28
0.5
0.032 138.4 0.12
0.040 163.6 0.12
0.048 182.0 0.16
0.056 206.0 0.16
0.064 224.7 0.16
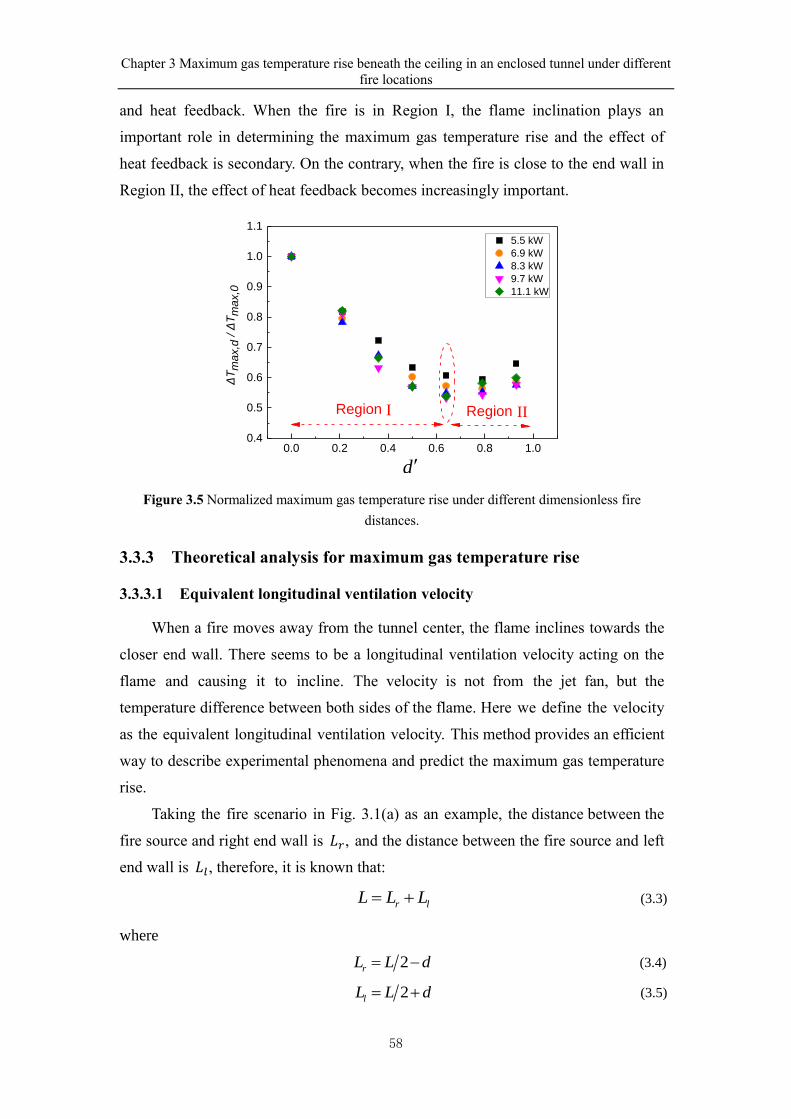
Chapter 3 Maximum gas temperature rise beneath the ceiling in an enclosed tunnel under different
fire locations
58
and heat feedback. When the fire is in Region I, the flame inclination plays an
important role in determining the maximum gas temperature rise and the effect of
heat feedback is secondary. On the contrary, when the fire is close to the end wall in
Region II, the effect of heat feedback becomes increasingly important.
0.0 0.2 0.4 0.6 0.8 1.00.4
0.5
0.6
0.7
0.8
0.9
1.0
1.1
d
5.5 kW
6.9 kW
8.3 kW
9.7 kW
11.1 kW
ΔT
ma
x,d
/ Δ
Tm
ax,0
Region I Region II
Figure 3.5 Normalized maximum gas temperature rise under different dimensionless fire
distances.
3.3.3 Theoretical analysis for maximum gas temperature rise
3.3.3.1 Equivalent longitudinal ventilation velocity
When a fire moves away from the tunnel center, the flame inclines towards the
closer end wall. There seems to be a longitudinal ventilation velocity acting on the
flame and causing it to incline. The velocity is not from the jet fan, but the
temperature difference between both sides of the flame. Here we define the velocity
as the equivalent longitudinal ventilation velocity. This method provides an efficient
way to describe experimental phenomena and predict the maximum gas temperature
rise.
Taking the fire scenario in Fig. 3.1(a) as an example, the distance between the
fire source and right end wall is 𝐿𝑟, and the distance between the fire source and left
end wall is 𝐿𝑙, therefore, it is known that:
r lL L L= + (3.3)
where
2rL L d= − (3.4)
2lL L d= + (3.5)
Chapter 3 Maximum gas temperature rise beneath the ceiling in an enclosed tunnel under different
fire locations
59
The temperature on both sides of the flame is considered as the temperature of
the returned hot gas bounced from the end wall. The temperature can be calculated by
referring to the prediction model of longitudinal temperature decay beneath the
ceiling proposed by Hu et al.[29, 30], as shown in Eq. (3.6).
0.019
max
xxTe
T
−=
(3.6)
where xT is the gas temperature rise beneath the ceiling at x m from the fire
source (K). Based on four full-scale tunnel fire tests(H≈7 m), Hu et al.[30] found the
average longitudinal temperature attenuation coefficient K is 0.019. If the tunnel
height is considered as the characteristic length, it is known 0.019Full
Ful
KK
H
= =
.
Based on the tunnel fire similarity theory in Chapter 2, it is known:
od
Full
M el ModelFull
lK K
H H l
=
(3.7)
and
0.26Model
Model
KK
H
= =
(3.8)
where K is the longitudinal temperature attenuation coefficient that includes scale
characteristics, K is the longitudinal temperature attenuation coefficient that
doesn’t include scale characteristics. The longitudinal temperature attenuation
coefficient in this model-scale tunnel is 0.26. The smoke will return to the fire after
hitting the end wall, and as a result the smoke motion path is assumed to be two
one-way trips between the fire source and end wall with a unified attenuation
coefficient. Therefore, the gas temperature on both sides of the flame can be
calculated as follows:
2
max max
r
KL
r or H
o
T TTe
T T T
−−= =
− (3.9)
2
max max
l
KL
l l o H
o
T T Te
T T T
− −= =
− (3.10)
where is the correction coefficient of the longitudinal temperature attenuation. In
an enclosed tunnel, the hot smoke will be accumulated inside the tunnel and the
cooling effect of the external air entrainment on the smoke layer disappears. These
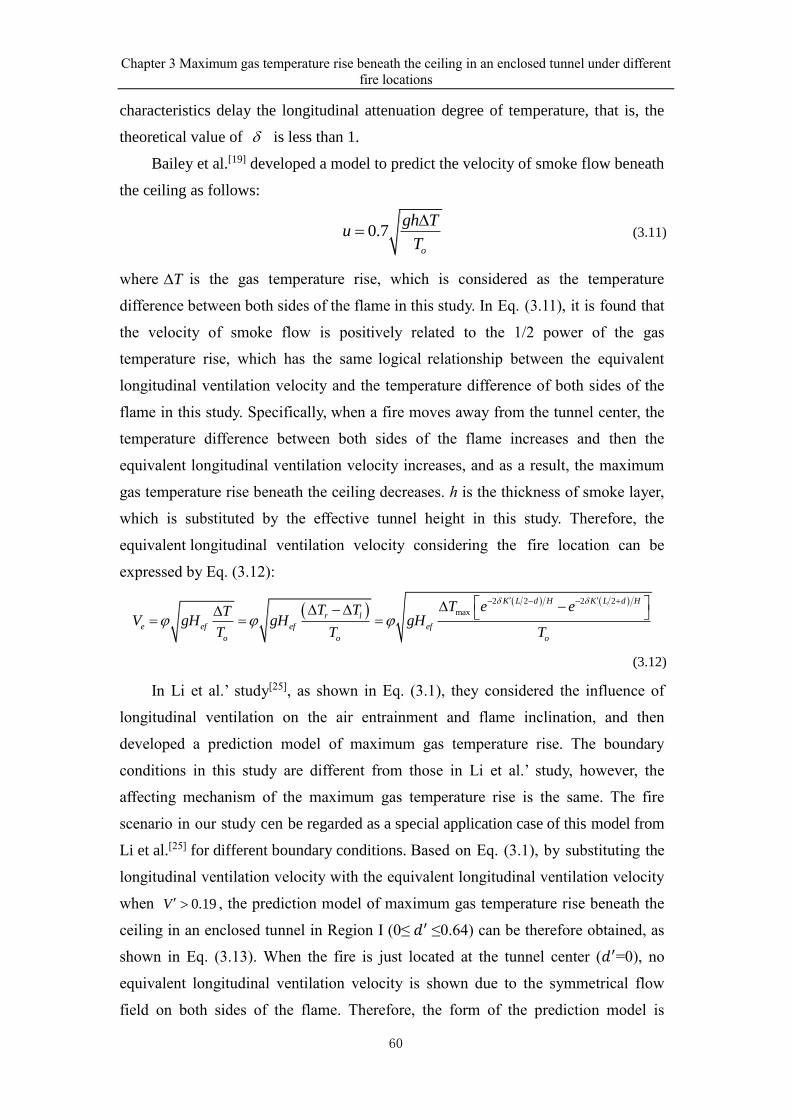
Chapter 3 Maximum gas temperature rise beneath the ceiling in an enclosed tunnel under different
fire locations
60
characteristics delay the longitudinal attenuation degree of temperature, that is, the
theoretical value of is less than 1.
Bailey et al.[19] developed a model to predict the velocity of smoke flow beneath
the ceiling as follows:
0.7o
gh Tu
T
= (3.11)
where T is the gas temperature rise, which is considered as the temperature
difference between both sides of the flame in this study. In Eq. (3.11), it is found that
the velocity of smoke flow is positively related to the 1/2 power of the gas
temperature rise, which has the same logical relationship between the equivalent
longitudinal ventilation velocity and the temperature difference of both sides of the
flame in this study. Specifically, when a fire moves away from the tunnel center, the
temperature difference between both sides of the flame increases and then the
equivalent longitudinal ventilation velocity increases, and as a result, the maximum
gas temperature rise beneath the ceiling decreases. h is the thickness of smoke layer,
which is substituted by the effective tunnel height in this study. Therefore, the
equivalent longitudinal ventilation velocity considering the fire location can be
expressed by Eq. (3.12):
( )
( ) ( )2 2 2 2
max
K L d H K L d H
r l
e ef ef ef
o o o
T e eT TTV gH gH gH
T T T
− − − + − − = = =
(3.12)
In Li et al.’ study[25], as shown in Eq. (3.1), they considered the influence of
longitudinal ventilation on the air entrainment and flame inclination, and then
developed a prediction model of maximum gas temperature rise. The boundary
conditions in this study are different from those in Li et al.’ study, however, the
affecting mechanism of the maximum gas temperature rise is the same. The fire
scenario in our study cen be regarded as a special application case of this model from
Li et al.[25] for different boundary conditions. Based on Eq. (3.1), by substituting the
longitudinal ventilation velocity with the equivalent longitudinal ventilation velocity
when 0.19V , the prediction model of maximum gas temperature rise beneath the
ceiling in an enclosed tunnel in Region I (0≤ 𝑑′ ≤0.64) can be therefore obtained, as
shown in Eq. (3.13). When the fire is just located at the tunnel center (𝑑′=0), no
equivalent longitudinal ventilation velocity is shown due to the symmetrical flow
field on both sides of the flame. Therefore, the form of the prediction model is
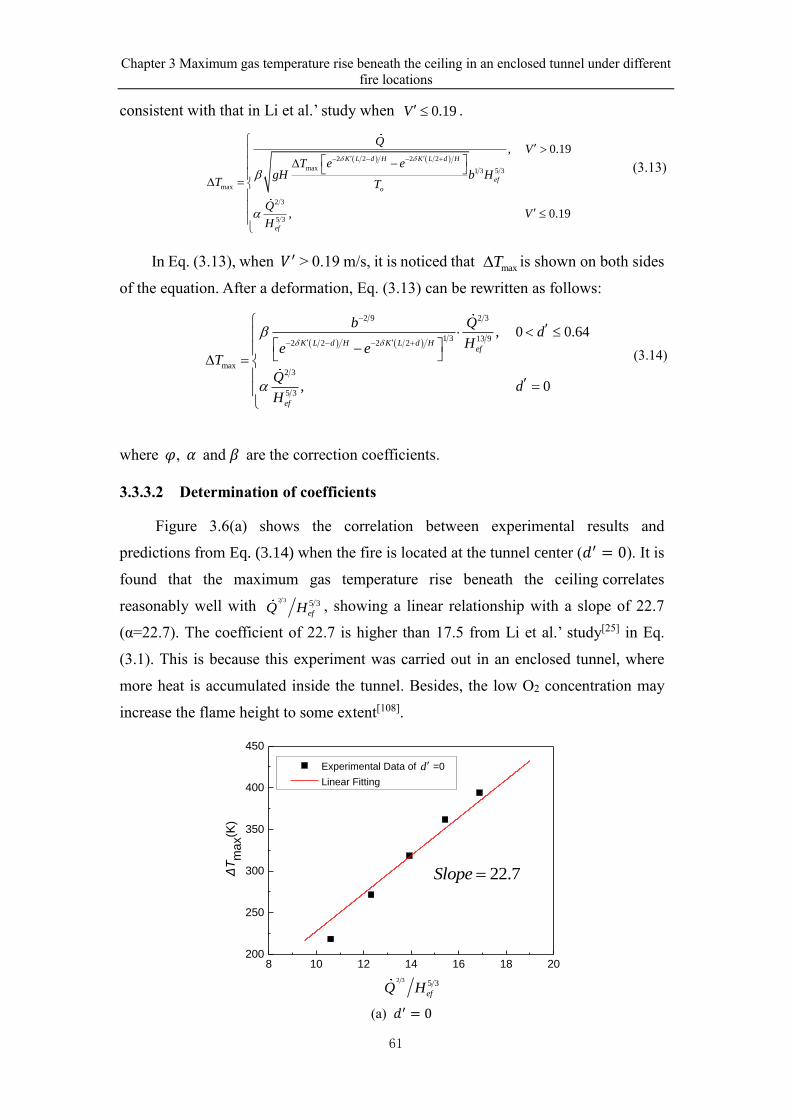
Chapter 3 Maximum gas temperature rise beneath the ceiling in an enclosed tunnel under different
fire locations
61
consistent with that in Li et al.’ study when 0.19 V .
( ) ( )2 2 2 2
max 1 3 5 3
max
2 3
5 3
, 0.19
, 0.19
K L d H K L d H
ef
o
ef
QV
T e egH b H
T T
QV
H
− − − +
−
=
(3.13)
In Eq. (3.13), when 𝑉′ > 0.19 m/s, it is noticed that maxT is shown on both sides
of the equation. After a deformation, Eq. (3.13) can be rewritten as follows:
( ) ( )
2 9 2 3
1 3 13 92 2 2 2
max2 3
5 3
, 0 0.64
, 0
K L d H K L d Hef
ef
b Qd
He eT
Qd
H
−
− − − +
− =
=
(3.14)
where 𝜑, 𝛼 and 𝛽 are the correction coefficients.
3.3.3.2 Determination of coefficients
Figure 3.6(a) shows the correlation between experimental results and
predictions from Eq. (3.14) when the fire is located at the tunnel center (𝑑′ = 0). It is
found that the maximum gas temperature rise beneath the ceiling correlates
reasonably well with 2 3 5 3
efQ H , showing a linear relationship with a slope of 22.7
(α=22.7). The coefficient of 22.7 is higher than 17.5 from Li et al.’ study[25] in Eq.
(3.1). This is because this experiment was carried out in an enclosed tunnel, where
more heat is accumulated inside the tunnel. Besides, the low O2 concentration may
increase the flame height to some extent[108].
(a) 𝑑′ = 0
8 10 12 14 16 18 20200
250
300
350
400
450
ΔT
max(K
)
Experimental Data of =0
Linear Fitting
2 3 5 3
efQ H
22.7Slope =
d
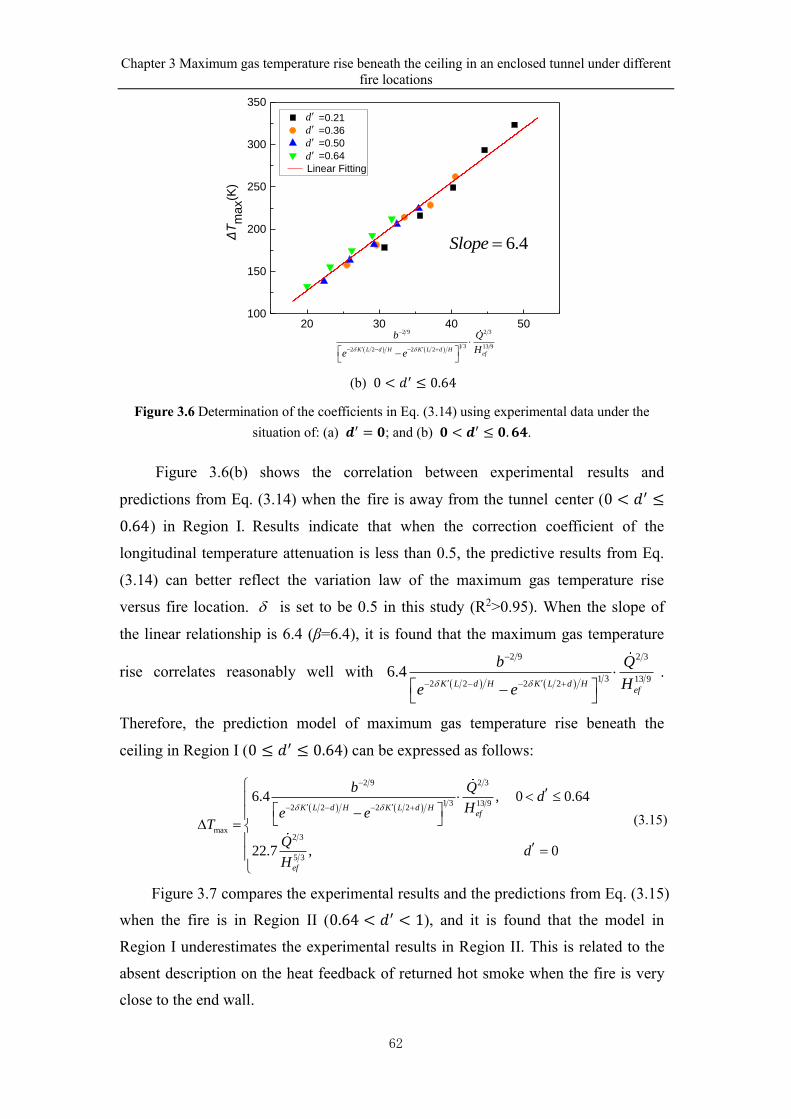
Chapter 3 Maximum gas temperature rise beneath the ceiling in an enclosed tunnel under different
fire locations
62
20 30 40 50100
150
200
250
300
350
=0.21
=0.36
=0.50
=0.64
Linear Fitting
ΔT
max(K
)
d
d
d
d
( ) ( )
2 9 2 3
1 3 13 92 2 2 2K L d H K L d H
ef
b Q
He e
−
− − − +
−
6.4Slope =
(b) 0 < 𝑑′ ≤ 0.64
Figure 3.6 Determination of the coefficients in Eq. (3.14) using experimental data under the
situation of: (a) 𝒅′ = 𝟎; and (b) 𝟎 < 𝒅′ ≤ 𝟎. 𝟔𝟒.
Figure 3.6(b) shows the correlation between experimental results and
predictions from Eq. (3.14) when the fire is away from the tunnel center (0 < 𝑑′ ≤
0.64) in Region I. Results indicate that when the correction coefficient of the
longitudinal temperature attenuation is less than 0.5, the predictive results from Eq.
(3.14) can better reflect the variation law of the maximum gas temperature rise
versus fire location. is set to be 0.5 in this study (R2>0.95). When the slope of
the linear relationship is 6.4 (β=6.4), it is found that the maximum gas temperature
rise correlates reasonably well with ( ) ( )
2 9 2 3
1 3 13 92 2 2 2
6.4K L d H K L d H
ef
b Q
He e
−
− − − +
−
.
Therefore, the prediction model of maximum gas temperature rise beneath the
ceiling in Region I (0 ≤ 𝑑′ ≤ 0.64) can be expressed as follows:
( ) ( )
2 9 2 3
1 3 13 92 2 2 2
max2 3
5 3
6.4 , 0 0.64
22.7 , 0
K L d H K L d Hef
ef
b Qd
He eT
Qd
H
−
− − − +
− =
=
(3.15)
Figure 3.7 compares the experimental results and the predictions from Eq. (3.15)
when the fire is in Region II (0.64 < 𝑑′ < 1), and it is found that the model in
Region I underestimates the experimental results in Region II. This is related to the
absent description on the heat feedback of returned hot smoke when the fire is very
close to the end wall.
Chapter 3 Maximum gas temperature rise beneath the ceiling in an enclosed tunnel under different
fire locations
63
75 100 125 150 175 200 225100
125
150
175
200
225
250
'
rL '
rL
( ) ( )
2 9 2 3
1 3 13 92 2 2 2
6.4K L d H K L d H
ef
b Q
He e
−
− − − +
−
=0.79
=0.93
Eq.(3.15)
ΔT
max(K
)
d
d
Figure 3.7 Comparison between experimental results and predictions from Eq. (3.15) when fire
is located at Region II.
By referring to the exponential correction factor proposed by Ji et al.[89], this
study introduces a correction factor ( ) that considers the heat feedback effect to
improve the prediction model in Region I and make it work in Region II. As a result,
the prediction model of maximum gas temperature rise beneath the ceiling in Region
II (0.64 < 𝑑′ < 1) can be expressed as follows:
( ) ( )
2 9 2 3
max 1 3 13 92 2 2 2
6.4 0.64 1K L d H K L d H
ef
b QT d
He e
−
− − − +
= −
(3.16)
where
( )0.7 2
0.8 1L d H
e− −
= + (3.17)
Figure 3.8 shows the comparison between experimental results and predictions
from Eq. (3.16) when the fire is in Region II. After introducing the correction factor
( ), it is found that the maximum gas temperature rise beneath the ceiling in Region
II can be well correlated by Eq. (3.16).
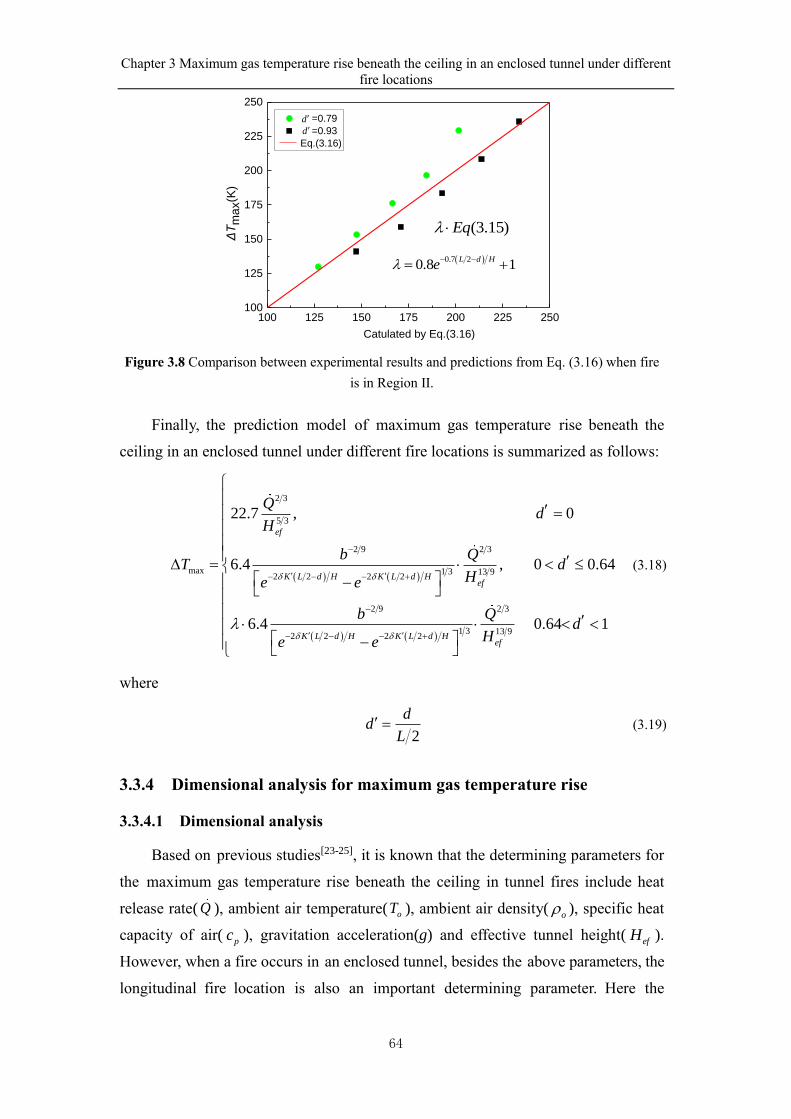
Chapter 3 Maximum gas temperature rise beneath the ceiling in an enclosed tunnel under different
fire locations
64
100 125 150 175 200 225 250100
125
150
175
200
225
250
=0.79
=0.93
Eq.(3.16)
ΔT
ma
x(K
)
d
d
Catulated by Eq.(3.16)
(3.15)Eq
( )0.7 20.8 1
L d He
− −= +
Figure 3.8 Comparison between experimental results and predictions from Eq. (3.16) when fire
is in Region II.
Finally, the prediction model of maximum gas temperature rise beneath the
ceiling in an enclosed tunnel under different fire locations is summarized as follows:
( ) ( )
( ) ( )
2 3
5 3
2 9 2 3
max 1 3 13 92 2 2 2
2 9 2 3
1 3 13 92 2 2 2
22.7 , 0
6.4 , 0 0.64
6.4 0.64
ef
K L d H K L d Hef
K L d H K L d Hef
Qd
H
b QT d
He e
b Qd
He e
−
− − − +
−
− − − +
=
= −
−
1
(3.18)
where
2
dd
L = (3.19)
3.3.4 Dimensional analysis for maximum gas temperature rise
3.3.4.1 Dimensional analysis
Based on previous studies[23-25], it is known that the determining parameters for
the maximum gas temperature rise beneath the ceiling in tunnel fires include heat
release rate( Q ), ambient air temperature( oT ), ambient air density(o ), specific heat
capacity of air( pc ), gravitation acceleration(g) and effective tunnel height( efH ).
However, when a fire occurs in an enclosed tunnel, besides the above parameters, the
longitudinal fire location is also an important determining parameter. Here the
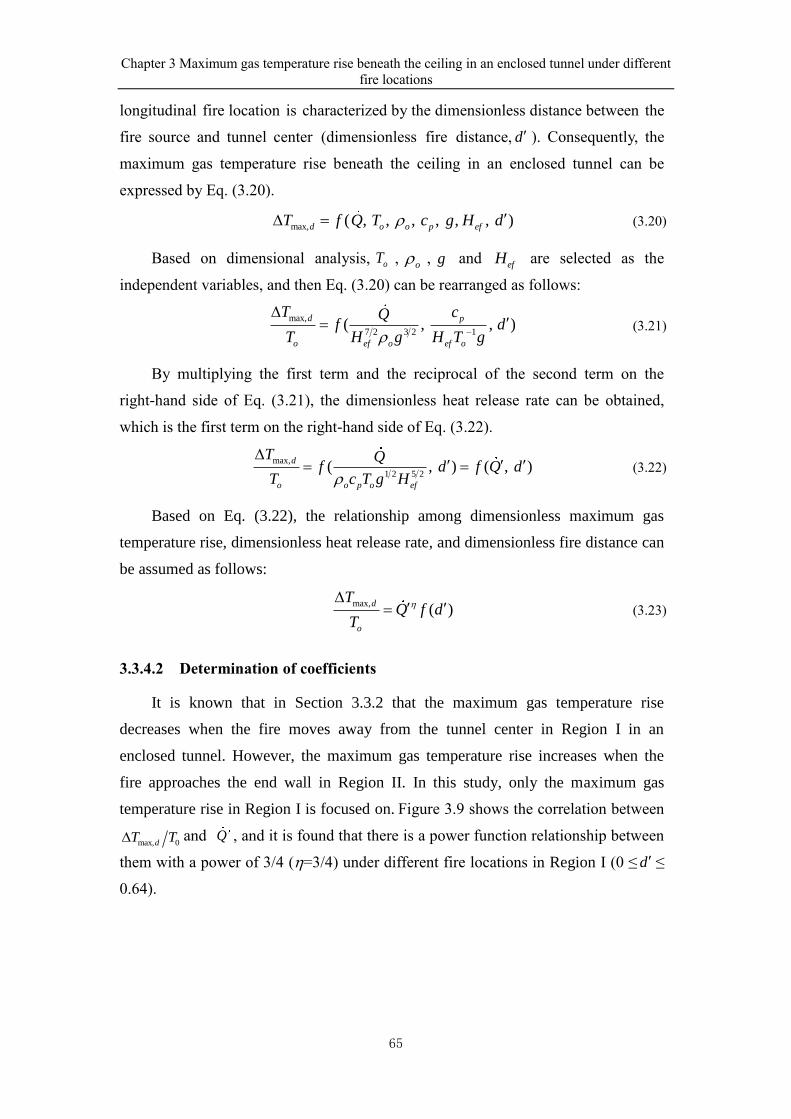
Chapter 3 Maximum gas temperature rise beneath the ceiling in an enclosed tunnel under different
fire locations
65
longitudinal fire location is characterized by the dimensionless distance between the
fire source and tunnel center (dimensionless fire distance, d ). Consequently, the
maximum gas temperature rise beneath the ceiling in an enclosed tunnel can be
expressed by Eq. (3.20).
max, , , , ,( ), ,d o p efoT Q T cf H dg = (3.20)
Based on dimensional analysis, oT ,o , g and efH are selected as the
independent variables, and then Eq. (3.20) can be rearranged as follows:
7 2 3 2
m x,
1
a( , , )
p
ef
d
o o ef o
cQf d
H gT H T
T
g −
=
(3.21)
By multiplying the first term and the reciprocal of the second term on the
right-hand side of Eq. (3.21), the dimensionless heat release rate can be obtained,
which is the first term on the right-hand side of Eq. (3.22).
1 2
max,
2 5( , ) ( , )
o p o ef
d
o
Qf d f Q d
c TT g H
T
= = (3.22)
Based on Eq. (3.22), the relationship among dimensionless maximum gas
temperature rise, dimensionless heat release rate, and dimensionless fire distance can
be assumed as follows:
max,
( )d
o
TQ f d
T
= (3.23)
3.3.4.2 Determination of coefficients
It is known that in Section 3.3.2 that the maximum gas temperature rise
decreases when the fire moves away from the tunnel center in Region I in an
enclosed tunnel. However, the maximum gas temperature rise increases when the
fire approaches the end wall in Region II. In this study, only the maximum gas
temperature rise in Region I is focused on. Figure 3.9 shows the correlation between
max, 0 dT T and Q , and it is found that there is a power function relationship between
them with a power of 3/4 (=3/4) under different fire locations in Region I (0 ≤ d ≤
0.64).
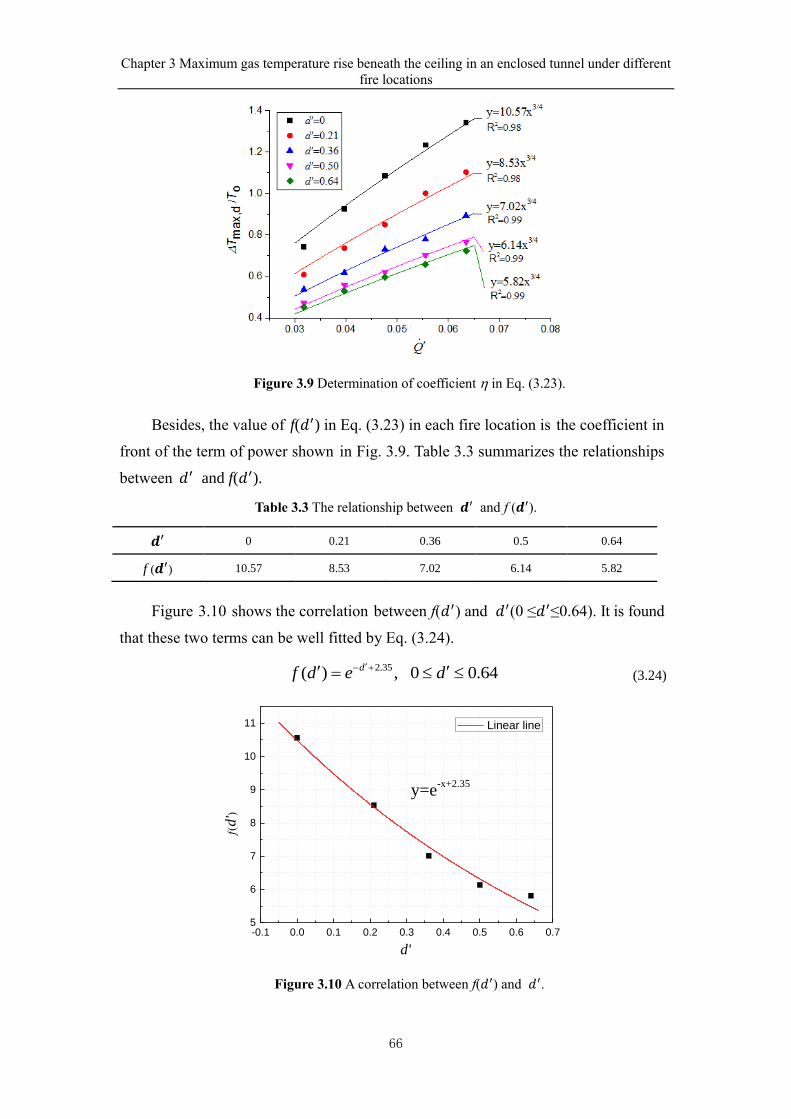
Chapter 3 Maximum gas temperature rise beneath the ceiling in an enclosed tunnel under different
fire locations
66
Figure 3.9 Determination of coefficient in Eq. (3.23).
Besides, the value of f(𝑑′) in Eq. (3.23) in each fire location is the coefficient in
front of the term of power shown in Fig. 3.9. Table 3.3 summarizes the relationships
between 𝑑′ and f(𝑑′).
Table 3.3 The relationship between 𝒅′ and f (𝒅′).
Figure 3.10 shows the correlation between f(𝑑′) and 𝑑′(0 ≤𝑑′≤0.64). It is found
that these two terms can be well fitted by Eq. (3.24).
2.35( ) , 0 0.64df d e d
− + = (3.24)
Figure 3.10 A correlation between f(𝑑′) and 𝑑′.
-0.1 0.0 0.1 0.2 0.3 0.4 0.5 0.6 0.75
6
7
8
9
10
11
ƒ(d
')
d'
Linear line
y=e-x+2.35
𝒅′ 0 0.21 0.36 0.5 0.64
f (𝒅′) 10.57 8.53 7.02 6.14 5.82
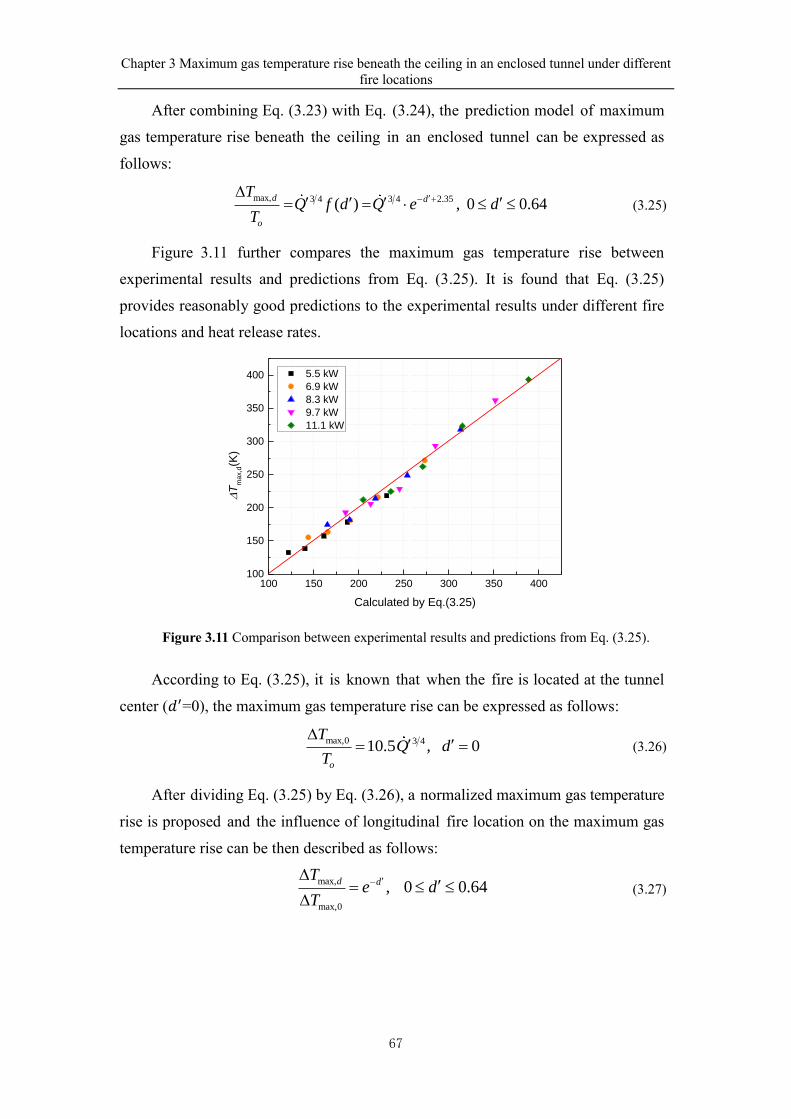
Chapter 3 Maximum gas temperature rise beneath the ceiling in an enclosed tunnel under different
fire locations
67
After combining Eq. (3.23) with Eq. (3.24), the prediction model of maximum
gas temperature rise beneath the ceiling in an enclosed tunnel can be expressed as
follows:
3 4 3 4 2.3ax, 5m( ) , 0 0.64dd
o
Q f d Q eT
dT
− +
= =
(3.25)
Figure 3.11 further compares the maximum gas temperature rise between
experimental results and predictions from Eq. (3.25). It is found that Eq. (3.25)
provides reasonably good predictions to the experimental results under different fire
locations and heat release rates.
100 150 200 250 300 350 400100
150
200
250
300
350
400
5.5 kW
6.9 kW
8.3 kW
9.7 kW
11.1 kW
T
ma
x,d(K
)
Calculated by Eq.(3.25)
Figure 3.11 Comparison between experimental results and predictions from Eq. (3.25).
According to Eq. (3.25), it is known that when the fire is located at the tunnel
center (𝑑′=0), the maximum gas temperature rise can be expressed as follows:
max 3 4,0
10.5 , 0o
T
TQ d=
= (3.26)
After dividing Eq. (3.25) by Eq. (3.26), a normalized maximum gas temperature
rise is proposed and the influence of longitudinal fire location on the maximum gas
temperature rise can be then described as follows:
max,
max,0
, 0 0.64d d
Te d
T
−
=
(3.27)
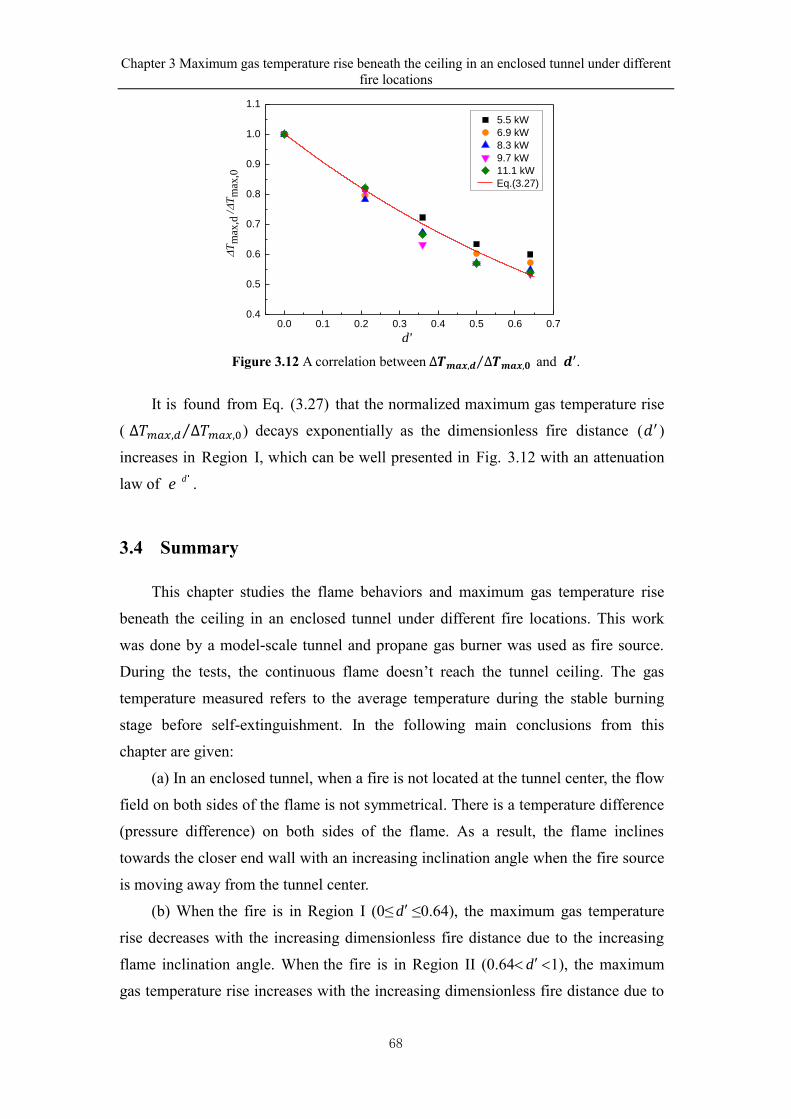
Chapter 3 Maximum gas temperature rise beneath the ceiling in an enclosed tunnel under different
fire locations
68
0.0 0.1 0.2 0.3 0.4 0.5 0.6 0.70.4
0.5
0.6
0.7
0.8
0.9
1.0
1.1
5.5 kW
6.9 kW
8.3 kW
9.7 kW
11.1 kW
Eq.(3.27)
T
max
,d /
T
max
,0
d'
Figure 3.12 A correlation between ∆𝑻𝒎𝒂𝒙,𝒅 ∆𝑻𝒎𝒂𝒙,𝟎⁄ and 𝒅′.
It is found from Eq. (3.27) that the normalized maximum gas temperature rise
( ∆𝑇𝑚𝑎𝑥,𝑑 ∆𝑇𝑚𝑎𝑥,0⁄ ) decays exponentially as the dimensionless fire distance (𝑑′ )
increases in Region I, which can be well presented in Fig. 3.12 with an attenuation
law of de .
3.4 Summary
This chapter studies the flame behaviors and maximum gas temperature rise
beneath the ceiling in an enclosed tunnel under different fire locations. This work
was done by a model-scale tunnel and propane gas burner was used as fire source.
During the tests, the continuous flame doesn’t reach the tunnel ceiling. The gas
temperature measured refers to the average temperature during the stable burning
stage before self-extinguishment. In the following main conclusions from this
chapter are given:
(a) In an enclosed tunnel, when a fire is not located at the tunnel center, the flow
field on both sides of the flame is not symmetrical. There is a temperature difference
(pressure difference) on both sides of the flame. As a result, the flame inclines
towards the closer end wall with an increasing inclination angle when the fire source
is moving away from the tunnel center.
(b) When the fire is in Region I (0≤ d ≤0.64), the maximum gas temperature
rise decreases with the increasing dimensionless fire distance due to the increasing
flame inclination angle. When the fire is in Region II (0.64 d 1), the maximum
gas temperature rise increases with the increasing dimensionless fire distance due to
Chapter 3 Maximum gas temperature rise beneath the ceiling in an enclosed tunnel under different
fire locations
69
the heat feedback of returned hot smoke bounced from the end wall.
(c) Based on the physical mechanism of flame inclination, a concept of
equivalent longitudinal ventilation velocity is proposed and then a prediction model
of maximum gas temperature rise beneath the ceiling in Region I is developed. By
introducing a correction factor that considers the heat feedback effect, a prediction
model of maximum gas temperature rise beneath the ceiling in Region II is given.
Maximum gas temperature rise can be predicted by:
( ) ( )
( ) ( )
2 3
5 3
2 9 2 3
max 1 3 13 92 2 2 2
2 9 2 3
1 3 13 92 2 2 2
22.7 , 0
6.4 , 0 0.64
6.4 0.64
ef
K L d H K L d Hef
K L d H K L d Hef
Qd
H
b QT d
He e
b Qd
He e
−
− − − +
−
− − − +
=
= −
−
1
(d) Based on the dimensional analysis, another prediction model of maximum
gas temperature rise in Region I is developed. The normalized maximum gas
temperature rise decays exponentially with the dimensionless fire distance with an
attenuation law of de .
Exponential attenuation law:
max,
max,0
, 0 0.64d d
Te d
T
−
=
Nomenclature in this chapter
g: acceleration of gravity (m/s2)
cp: specific heat at constant pressure (kJ/(kg·K))
To: ambient air temperature (K)
maxT : maximum gas temperature rise beneath the ceiling (K)
xT : gas temperature rise beneath the ceiling at x m from the fire source (K)
max,dT : maximum gas temperature rise when the distance between fire and tunnel center is d (K)
max,0T : maximum gas temperature rise when the fire is in the tunnel center (K)
rT : gas temperature rise on right side of the flame (K)
lT : gas temperature rise on left side of the flame (K)
Q : heat release rate (kW)
Q : dimensionless heat release rate (-)
cQ : convective heat release rate (kW)
Chapter 3 Maximum gas temperature rise beneath the ceiling in an enclosed tunnel under different
fire locations
70
b: radius of fire (m)
d: distance between fire and tunnel center (m)
d : dimensionless distance between fire and tunnel center (-)
H: tunnel height (m)
efH : effective tunnel height (m)
h: thickness of smoke layer (m)
L: tunnel length (m)
Lr: distance between fire and right end (m)
Ll: distance between fire and left end (m)
V: longitudinal ventilation velocity (m/s)
V : dimensionless longitudinal ventilation velocity (-)
Ve: equivalent longitudinal ventilation velocity (m/s)
u : velocity of smoke flow (m/s)
K : longitudinal temperature attenuation coefficient that includes scale characteristics
K : longitudinal temperature attenuation coefficient that doesn’t include scale characteristics
Greek symbols
o : ambient air density (kg/m3)
: correction factor of heat feedback effect in Eq. (3.16)
: correction coefficient of the longitudinal temperature attenuation in Eq. (3.9)
: coefficient in Eq. (3.12)
and : coefficients in Eq. (3.14)
: coefficient in Eq. (3.23)
Chapter 4 Application of sealing tunnel portals for fighting large tunnel fires
71
Chapter 4
Application of sealing tunnel portals for fighting large
tunnel fires
4.1 Introduction
For large tunnel fires, such as the railway tunnel fires caused by oil tank leakage,
the fire size is large and the fire hazard is high, and at the same time, the explosion
may probably occur during the fire burning stage. In such circumstances, the
traditional rescue strategies may be unable to effectively control the development of
fire. Sealing tunnel portals is an important strategy to fight large fires in the tunnel,
which can be achieved by blocking two tunnel portals after the evacuation. The
purpose is to make the tunnel fire become under-ventilated to control the development
of fire. In reality, the sealing process is very complex due to some uncertain factors,
such as the sealing ratio and initial sealing time. First, it is difficult to seal the tunnel
portals completely due to the high gas temperature and poisonous gas as well as
possible ceiling flame jet at tunnel portals[91, 168] after a tunnel fire occurs. Second, the
tunnel portals can’t be sealed immediately due to the existence of fire recognition and
personnel evacuation. There are several tunnel fires in history where the sealing
strategy was applied. Examples of such fires are the fire in Lizi yuan Tunnel in
Sichuan, China in 1990, fire in Chao yangba 2th Tunnel in Guizhou, China in 1998,
fire in Baocheng 109 Tunnel in Shanxi, China in 2008[12]. However, the studies about
the sealing strategy are rare from the academic point of view. Chen et al.[91, 92]
studied experimentally the development laws of tunnel fires under different sealing
ratios in a model-scale tunnel. Huang et al.[93] studied numerically the effect of
sealing ratio on the gas temperature inside the tunnel by CFD simulation. But, up to
now, no scholar has focused on another factor of initial sealing time. Therefore, this
chapter studies the coupling control effects of sealing ratio and initial sealing time on
the fire development using a model-scale railway tunnel. What this study focuses on
is the fire scenarios with a high heat release rate (i.e, the continuous flame reaches
the tunnel ceiling). The gas temperature, mass loss rate of fuel and CO concentration
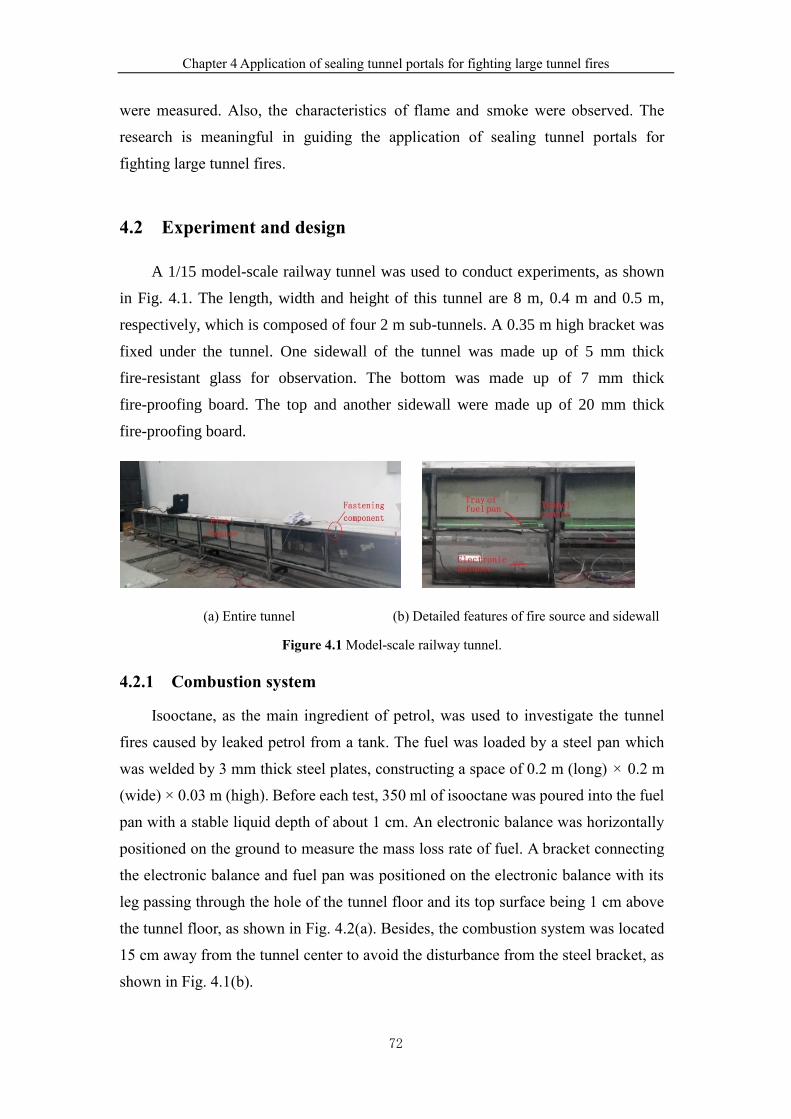
Chapter 4 Application of sealing tunnel portals for fighting large tunnel fires
72
were measured. Also, the characteristics of flame and smoke were observed. The
research is meaningful in guiding the application of sealing tunnel portals for
fighting large tunnel fires.
4.2 Experiment and design
A 1/15 model-scale railway tunnel was used to conduct experiments, as shown
in Fig. 4.1. The length, width and height of this tunnel are 8 m, 0.4 m and 0.5 m,
respectively, which is composed of four 2 m sub-tunnels. A 0.35 m high bracket was
fixed under the tunnel. One sidewall of the tunnel was made up of 5 mm thick
fire-resistant glass for observation. The bottom was made up of 7 mm thick
fire-proofing board. The top and another sidewall were made up of 20 mm thick
fire-proofing board.
(a) Entire tunnel (b) Detailed features of fire source and sidewall
Figure 4.1 Model-scale railway tunnel.
4.2.1 Combustion system
Isooctane, as the main ingredient of petrol, was used to investigate the tunnel
fires caused by leaked petrol from a tank. The fuel was loaded by a steel pan which
was welded by 3 mm thick steel plates, constructing a space of 0.2 m (long) × 0.2 m
(wide) × 0.03 m (high). Before each test, 350 ml of isooctane was poured into the fuel
pan with a stable liquid depth of about 1 cm. An electronic balance was horizontally
positioned on the ground to measure the mass loss rate of fuel. A bracket connecting
the electronic balance and fuel pan was positioned on the electronic balance with its
leg passing through the hole of the tunnel floor and its top surface being 1 cm above
the tunnel floor, as shown in Fig. 4.2(a). Besides, the combustion system was located
15 cm away from the tunnel center to avoid the disturbance from the steel bracket, as
shown in Fig. 4.1(b).
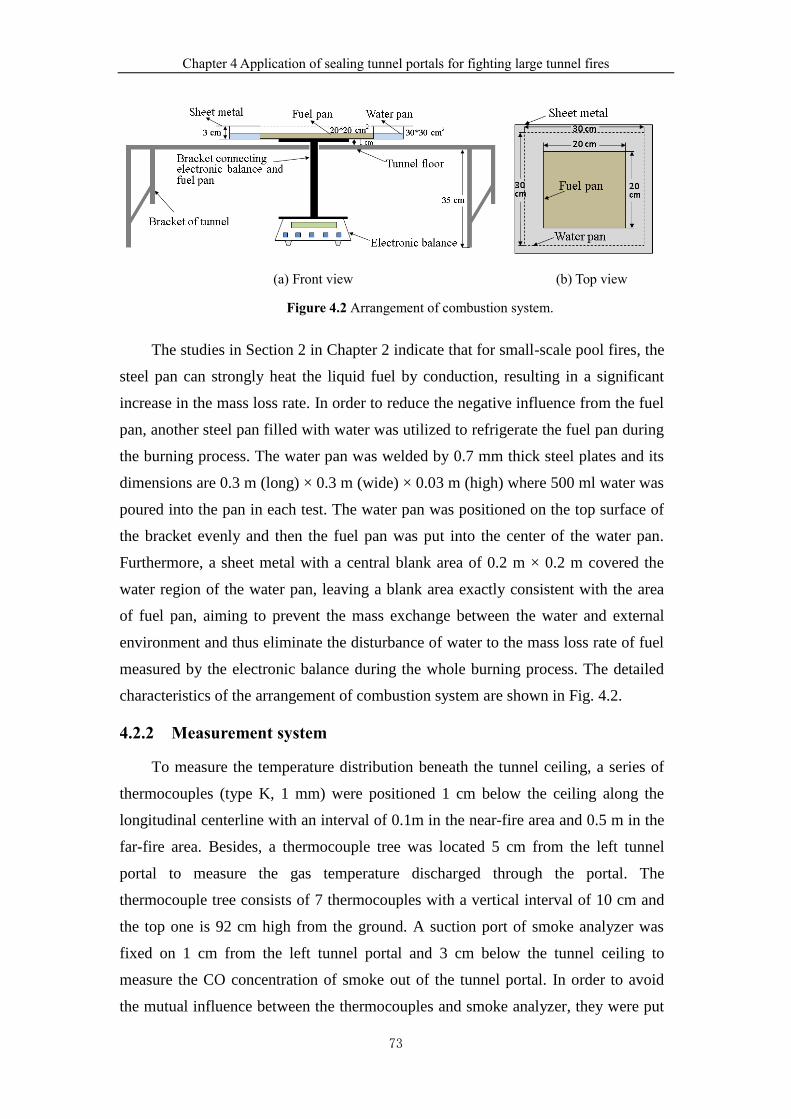
Chapter 4 Application of sealing tunnel portals for fighting large tunnel fires
73
(a) Front view (b) Top view
Figure 4.2 Arrangement of combustion system.
The studies in Section 2 in Chapter 2 indicate that for small-scale pool fires, the
steel pan can strongly heat the liquid fuel by conduction, resulting in a significant
increase in the mass loss rate. In order to reduce the negative influence from the fuel
pan, another steel pan filled with water was utilized to refrigerate the fuel pan during
the burning process. The water pan was welded by 0.7 mm thick steel plates and its
dimensions are 0.3 m (long) × 0.3 m (wide) × 0.03 m (high) where 500 ml water was
poured into the pan in each test. The water pan was positioned on the top surface of
the bracket evenly and then the fuel pan was put into the center of the water pan.
Furthermore, a sheet metal with a central blank area of 0.2 m × 0.2 m covered the
water region of the water pan, leaving a blank area exactly consistent with the area
of fuel pan, aiming to prevent the mass exchange between the water and external
environment and thus eliminate the disturbance of water to the mass loss rate of fuel
measured by the electronic balance during the whole burning process. The detailed
characteristics of the arrangement of combustion system are shown in Fig. 4.2.
4.2.2 Measurement system
To measure the temperature distribution beneath the tunnel ceiling, a series of
thermocouples (type K, 1 mm) were positioned 1 cm below the ceiling along the
longitudinal centerline with an interval of 0.1m in the near-fire area and 0.5 m in the
far-fire area. Besides, a thermocouple tree was located 5 cm from the left tunnel
portal to measure the gas temperature discharged through the portal. The
thermocouple tree consists of 7 thermocouples with a vertical interval of 10 cm and
the top one is 92 cm high from the ground. A suction port of smoke analyzer was
fixed on 1 cm from the left tunnel portal and 3 cm below the tunnel ceiling to
measure the CO concentration of smoke out of the tunnel portal. In order to avoid
the mutual influence between the thermocouples and smoke analyzer, they were put
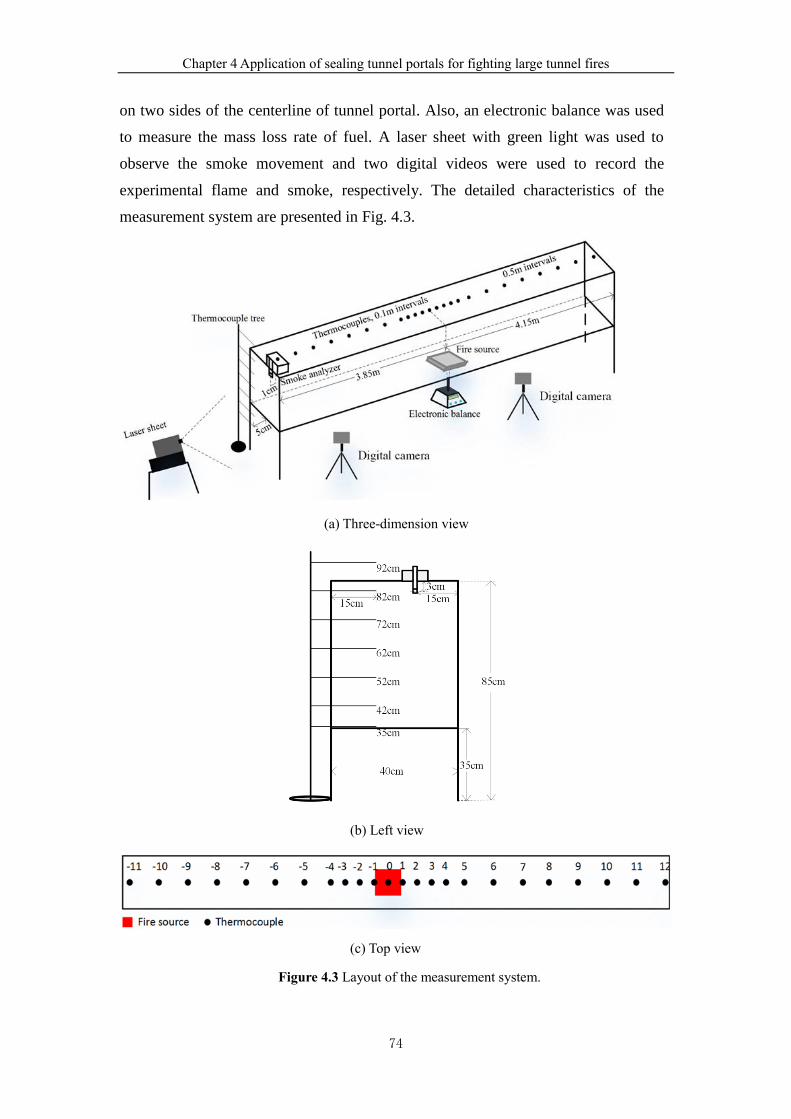
Chapter 4 Application of sealing tunnel portals for fighting large tunnel fires
74
on two sides of the centerline of tunnel portal. Also, an electronic balance was used
to measure the mass loss rate of fuel. A laser sheet with green light was used to
observe the smoke movement and two digital videos were used to record the
experimental flame and smoke, respectively. The detailed characteristics of the
measurement system are presented in Fig. 4.3.
(a) Three-dimension view
(b) Left view
(c) Top view
Figure 4.3 Layout of the measurement system.
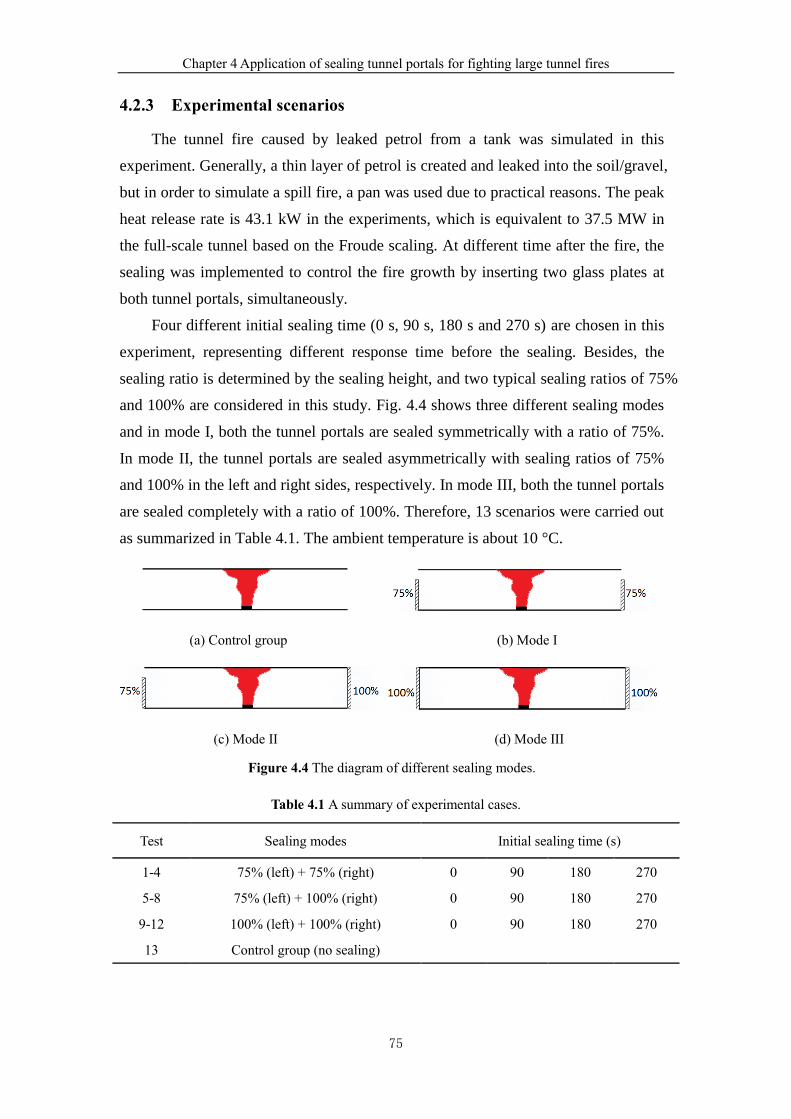
Chapter 4 Application of sealing tunnel portals for fighting large tunnel fires
75
4.2.3 Experimental scenarios
The tunnel fire caused by leaked petrol from a tank was simulated in this
experiment. Generally, a thin layer of petrol is created and leaked into the soil/gravel,
but in order to simulate a spill fire, a pan was used due to practical reasons. The peak
heat release rate is 43.1 kW in the experiments, which is equivalent to 37.5 MW in
the full-scale tunnel based on the Froude scaling. At different time after the fire, the
sealing was implemented to control the fire growth by inserting two glass plates at
both tunnel portals, simultaneously.
Four different initial sealing time (0 s, 90 s, 180 s and 270 s) are chosen in this
experiment, representing different response time before the sealing. Besides, the
sealing ratio is determined by the sealing height, and two typical sealing ratios of 75%
and 100% are considered in this study. Fig. 4.4 shows three different sealing modes
and in mode I, both the tunnel portals are sealed symmetrically with a ratio of 75%.
In mode II, the tunnel portals are sealed asymmetrically with sealing ratios of 75%
and 100% in the left and right sides, respectively. In mode III, both the tunnel portals
are sealed completely with a ratio of 100%. Therefore, 13 scenarios were carried out
as summarized in Table 4.1. The ambient temperature is about 10 °C.
(a) Control group (b) Mode I
(c) Mode II (d) Mode III
Figure 4.4 The diagram of different sealing modes.
Table 4.1 A summary of experimental cases.
Test Sealing modes Initial sealing time (s)
1-4 75% (left) + 75% (right)
75% (left) + 100% (right)
100% (left) + 100% (right)
Control group (no sealing)
0 90 180 270
5-8 0 90 180 270
9-12 0 90 180 270
13
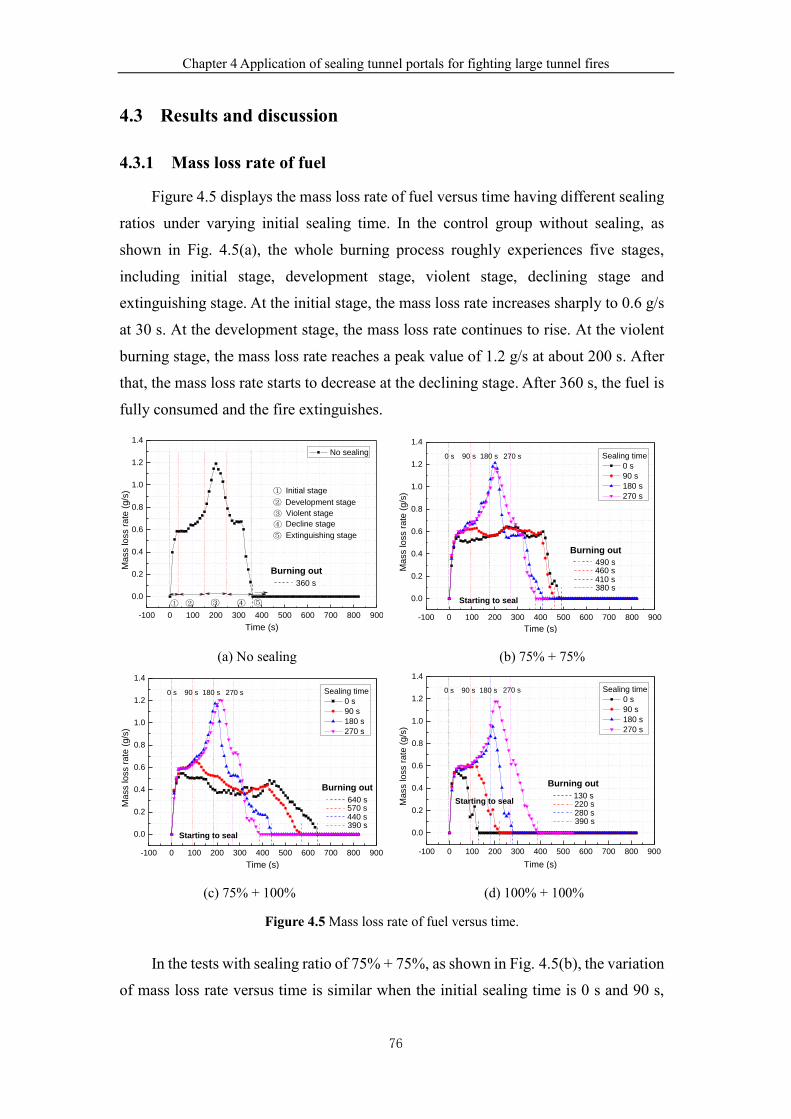
Chapter 4 Application of sealing tunnel portals for fighting large tunnel fires
76
4.3 Results and discussion
4.3.1 Mass loss rate of fuel
Figure 4.5 displays the mass loss rate of fuel versus time having different sealing
ratios under varying initial sealing time. In the control group without sealing, as
shown in Fig. 4.5(a), the whole burning process roughly experiences five stages,
including initial stage, development stage, violent stage, declining stage and
extinguishing stage. At the initial stage, the mass loss rate increases sharply to 0.6 g/s
at 30 s. At the development stage, the mass loss rate continues to rise. At the violent
burning stage, the mass loss rate reaches a peak value of 1.2 g/s at about 200 s. After
that, the mass loss rate starts to decrease at the declining stage. After 360 s, the fuel is
fully consumed and the fire extinguishes.
-100 0 100 200 300 400 500 600 700 800 900
0.0
0.2
0.4
0.6
0.8
1.0
1.2
1.4
⑤
④
③
②
①
⑤ ④ ① ③ ②
No sealing
Mass lo
ss r
ate
(g/s
)
Time (s)
Burning out
360 s
Initial stage
Development stage
Violent stage
Decline stage
Extinguishing stage
-100 0 100 200 300 400 500 600 700 800 900
0.0
0.2
0.4
0.6
0.8
1.0
1.2
1.4
Starting to seal
270 s180 s90 s0 s Sealing time
0 s
90 s
180 s
270 s
380 s410 s460 s
Mass loss r
ate
(g/s
)
Time (s)
Burning out
490 s
(a) No sealing (b) 75% + 75%
-100 0 100 200 300 400 500 600 700 800 900
0.0
0.2
0.4
0.6
0.8
1.0
1.2
1.4
Sealing time
0 s
90 s
180 s
270 s
Mass lo
ss r
ate
(g/s
)
Time (s)
640 s570 s440 s390 s
Burning out
0 s 90 s 180 s 270 s
Starting to seal
-100 0 100 200 300 400 500 600 700 800 900
0.0
0.2
0.4
0.6
0.8
1.0
1.2
1.4
Sealing time
0 s
90 s
180 s
270 s
Mass loss r
ate
(g/s
)
Time (s)
Burning out
130 s220 s280 s390 s
0 s 90 s 180 s 270 s
Starting to seal
(c) 75% + 100% (d) 100% + 100%
Figure 4.5 Mass loss rate of fuel versus time.
In the tests with sealing ratio of 75% + 75%, as shown in Fig. 4.5(b), the variation
of mass loss rate versus time is similar when the initial sealing time is 0 s and 90 s,
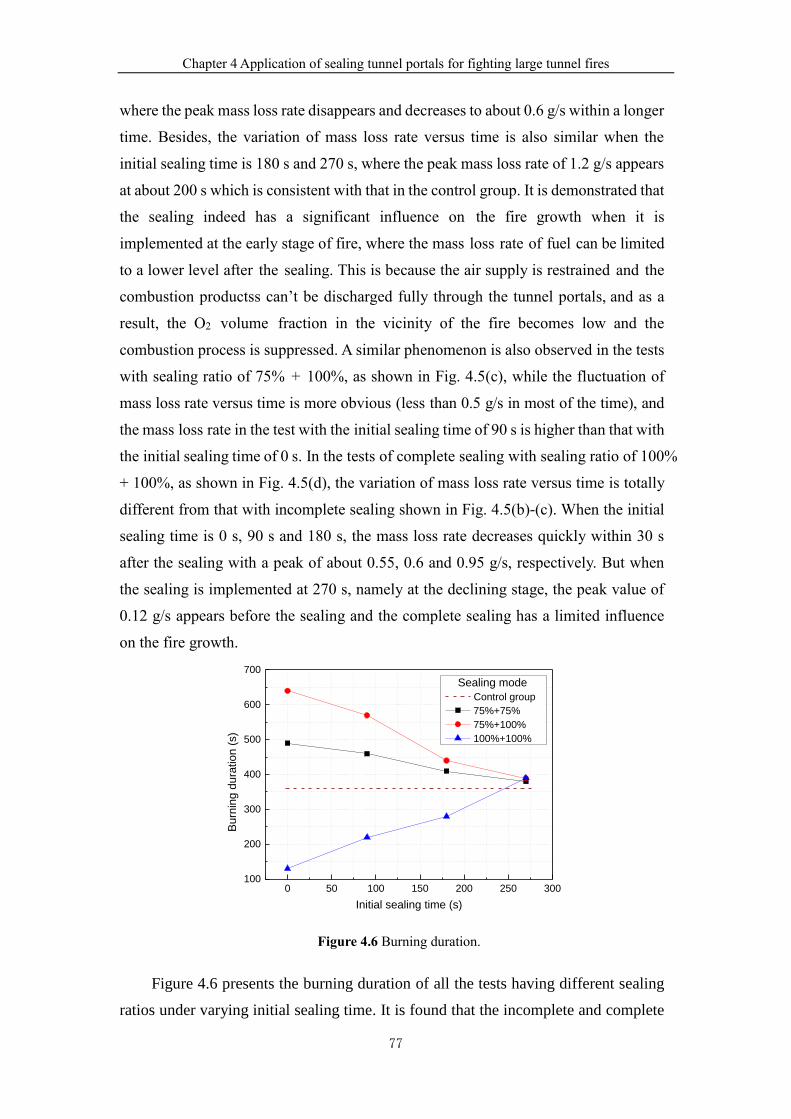
Chapter 4 Application of sealing tunnel portals for fighting large tunnel fires
77
where the peak mass loss rate disappears and decreases to about 0.6 g/s within a longer
time. Besides, the variation of mass loss rate versus time is also similar when the
initial sealing time is 180 s and 270 s, where the peak mass loss rate of 1.2 g/s appears
at about 200 s which is consistent with that in the control group. It is demonstrated that
the sealing indeed has a significant influence on the fire growth when it is
implemented at the early stage of fire, where the mass loss rate of fuel can be limited
to a lower level after the sealing. This is because the air supply is restrained and the
combustion productss can’t be discharged fully through the tunnel portals, and as a
result, the O2 volume fraction in the vicinity of the fire becomes low and the
combustion process is suppressed. A similar phenomenon is also observed in the tests
with sealing ratio of 75% + 100%, as shown in Fig. 4.5(c), while the fluctuation of
mass loss rate versus time is more obvious (less than 0.5 g/s in most of the time), and
the mass loss rate in the test with the initial sealing time of 90 s is higher than that with
the initial sealing time of 0 s. In the tests of complete sealing with sealing ratio of 100%
+ 100%, as shown in Fig. 4.5(d), the variation of mass loss rate versus time is totally
different from that with incomplete sealing shown in Fig. 4.5(b)-(c). When the initial
sealing time is 0 s, 90 s and 180 s, the mass loss rate decreases quickly within 30 s
after the sealing with a peak of about 0.55, 0.6 and 0.95 g/s, respectively. But when
the sealing is implemented at 270 s, namely at the declining stage, the peak value of
0.12 g/s appears before the sealing and the complete sealing has a limited influence
on the fire growth.
0 50 100 150 200 250 300100
200
300
400
500
600
700
Bu
rnin
g d
ura
tio
n (
s)
Initial sealing time (s)
Sealing mode
Control group
75%+75%
75%+100%
100%+100%
Figure 4.6 Burning duration.
Figure 4.6 presents the burning duration of all the tests having different sealing
ratios under varying initial sealing time. It is found that the incomplete and complete
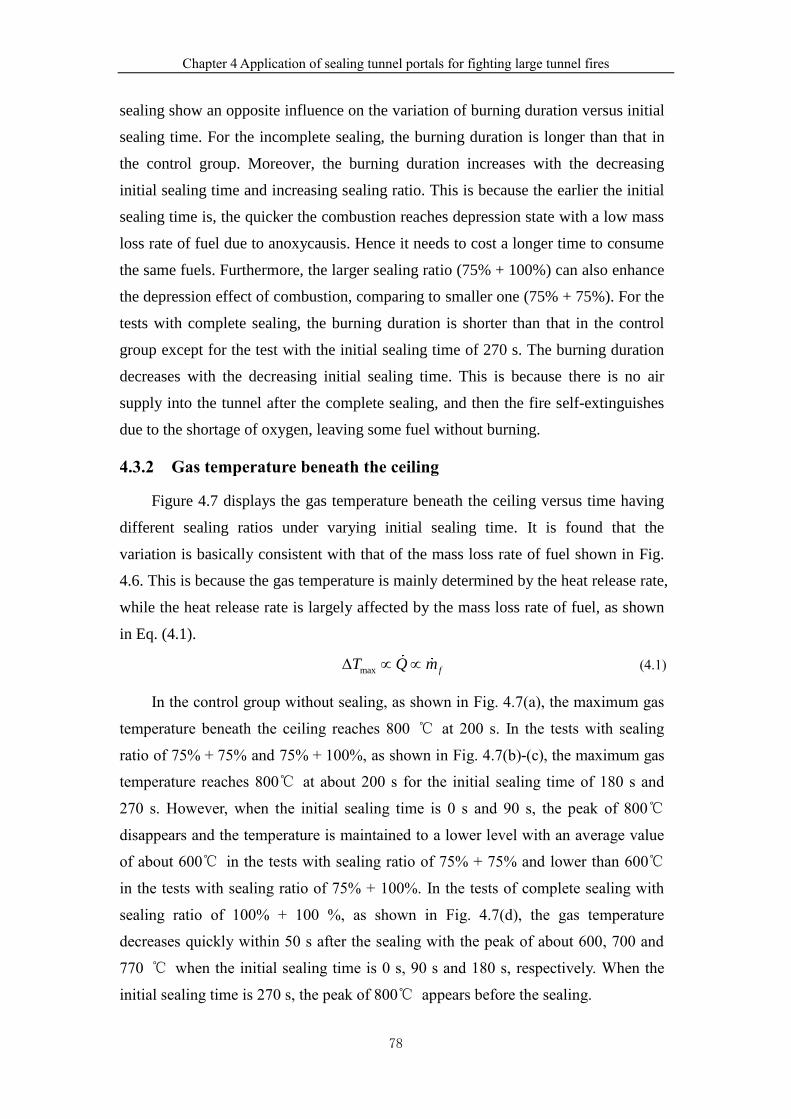
Chapter 4 Application of sealing tunnel portals for fighting large tunnel fires
78
sealing show an opposite influence on the variation of burning duration versus initial
sealing time. For the incomplete sealing, the burning duration is longer than that in
the control group. Moreover, the burning duration increases with the decreasing
initial sealing time and increasing sealing ratio. This is because the earlier the initial
sealing time is, the quicker the combustion reaches depression state with a low mass
loss rate of fuel due to anoxycausis. Hence it needs to cost a longer time to consume
the same fuels. Furthermore, the larger sealing ratio (75% + 100%) can also enhance
the depression effect of combustion, comparing to smaller one (75% + 75%). For the
tests with complete sealing, the burning duration is shorter than that in the control
group except for the test with the initial sealing time of 270 s. The burning duration
decreases with the decreasing initial sealing time. This is because there is no air
supply into the tunnel after the complete sealing, and then the fire self-extinguishes
due to the shortage of oxygen, leaving some fuel without burning.
4.3.2 Gas temperature beneath the ceiling
Figure 4.7 displays the gas temperature beneath the ceiling versus time having
different sealing ratios under varying initial sealing time. It is found that the
variation is basically consistent with that of the mass loss rate of fuel shown in Fig.
4.6. This is because the gas temperature is mainly determined by the heat release rate,
while the heat release rate is largely affected by the mass loss rate of fuel, as shown
in Eq. (4.1).
max fT Q m (4.1)
In the control group without sealing, as shown in Fig. 4.7(a), the maximum gas
temperature beneath the ceiling reaches 800 ℃ at 200 s. In the tests with sealing
ratio of 75% + 75% and 75% + 100%, as shown in Fig. 4.7(b)-(c), the maximum gas
temperature reaches 800℃ at about 200 s for the initial sealing time of 180 s and
270 s. However, when the initial sealing time is 0 s and 90 s, the peak of 800℃
disappears and the temperature is maintained to a lower level with an average value
of about 600℃ in the tests with sealing ratio of 75% + 75% and lower than 600℃
in the tests with sealing ratio of 75% + 100%. In the tests of complete sealing with
sealing ratio of 100% + 100 %, as shown in Fig. 4.7(d), the gas temperature
decreases quickly within 50 s after the sealing with the peak of about 600, 700 and
770 ℃ when the initial sealing time is 0 s, 90 s and 180 s, respectively. When the
initial sealing time is 270 s, the peak of 800℃ appears before the sealing.
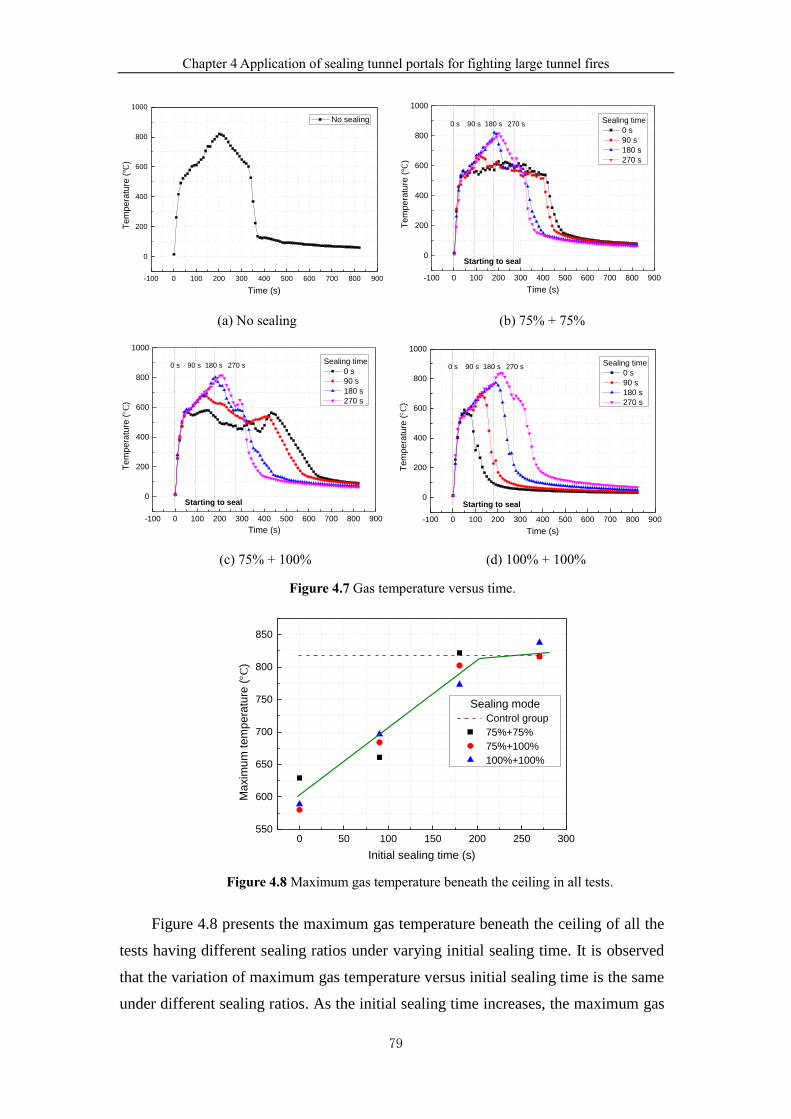
Chapter 4 Application of sealing tunnel portals for fighting large tunnel fires
79
-100 0 100 200 300 400 500 600 700 800 900
0
200
400
600
800
1000
No sealing
Tem
pe
ratu
re (
℃)
Time (s) -100 0 100 200 300 400 500 600 700 800 900
0
200
400
600
800
1000
Sealing time
0 s
90 s
180 s
270 s
Tem
pera
ture
(℃
)
Time (s)
0 s 90 s 180 s 270 s
Starting to seal
(a) No sealing (b) 75% + 75%
-100 0 100 200 300 400 500 600 700 800 900
0
200
400
600
800
1000
Sealing time
0 s
90 s
180 s
270 s
Tem
pera
ture
(C
)
Time (s)
0 s 90 s 180 s 270 s
Starting to seal
-100 0 100 200 300 400 500 600 700 800 900
0
200
400
600
800
1000
Sealing time
0 s
90 s
180 s
270 sT
em
pera
ture
(C
)
Time (s)
0 s 90 s 180 s 270 s
Starting to seal
(c) 75% + 100% (d) 100% + 100%
Figure 4.7 Gas temperature versus time.
0 50 100 150 200 250 300550
600
650
700
750
800
850
Sealing mode
Control group
75%+75%
75%+100%
100%+100%
Maxim
um
tem
pe
ratu
re (
C)
Initial sealing time (s)
Figure 4.8 Maximum gas temperature beneath the ceiling in all tests.
Figure 4.8 presents the maximum gas temperature beneath the ceiling of all the
tests having different sealing ratios under varying initial sealing time. It is observed
that the variation of maximum gas temperature versus initial sealing time is the same
under different sealing ratios. As the initial sealing time increases, the maximum gas
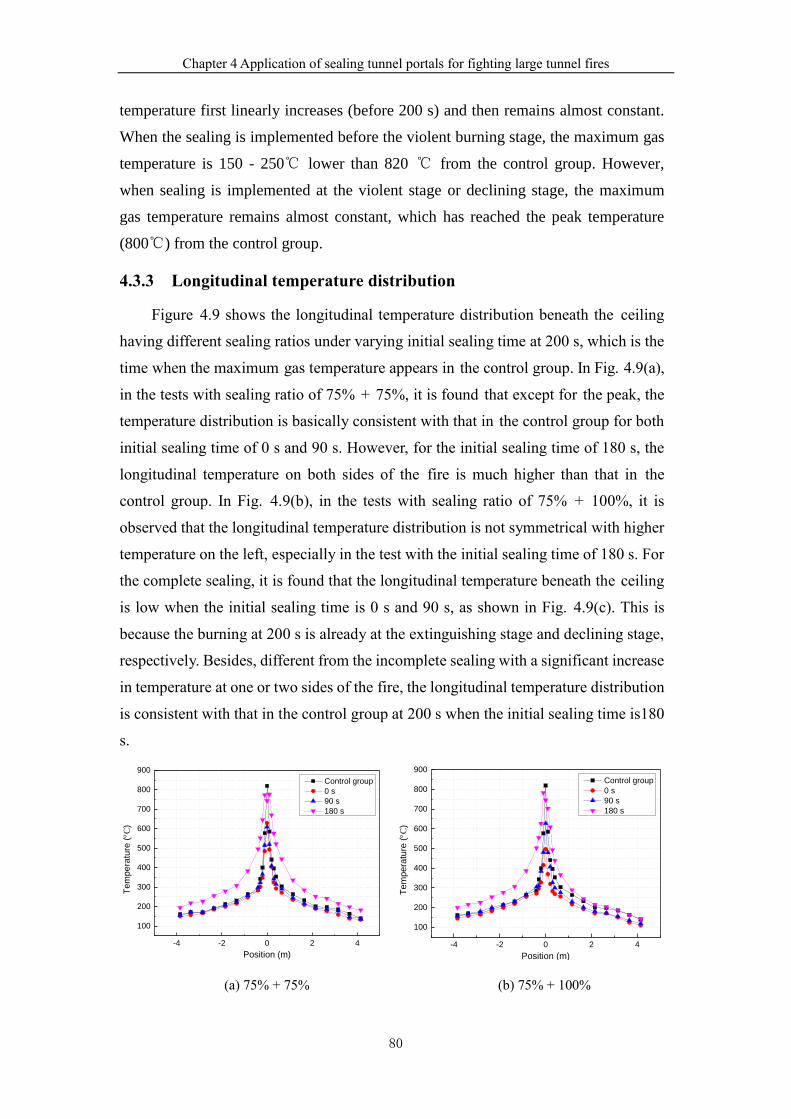
Chapter 4 Application of sealing tunnel portals for fighting large tunnel fires
80
temperature first linearly increases (before 200 s) and then remains almost constant.
When the sealing is implemented before the violent burning stage, the maximum gas
temperature is 150 - 250℃ lower than 820 ℃ from the control group. However,
when sealing is implemented at the violent stage or declining stage, the maximum
gas temperature remains almost constant, which has reached the peak temperature
(800℃) from the control group.
4.3.3 Longitudinal temperature distribution
Figure 4.9 shows the longitudinal temperature distribution beneath the ceiling
having different sealing ratios under varying initial sealing time at 200 s, which is the
time when the maximum gas temperature appears in the control group. In Fig. 4.9(a),
in the tests with sealing ratio of 75% + 75%, it is found that except for the peak, the
temperature distribution is basically consistent with that in the control group for both
initial sealing time of 0 s and 90 s. However, for the initial sealing time of 180 s, the
longitudinal temperature on both sides of the fire is much higher than that in the
control group. In Fig. 4.9(b), in the tests with sealing ratio of 75% + 100%, it is
observed that the longitudinal temperature distribution is not symmetrical with higher
temperature on the left, especially in the test with the initial sealing time of 180 s. For
the complete sealing, it is found that the longitudinal temperature beneath the ceiling
is low when the initial sealing time is 0 s and 90 s, as shown in Fig. 4.9(c). This is
because the burning at 200 s is already at the extinguishing stage and declining stage,
respectively. Besides, different from the incomplete sealing with a significant increase
in temperature at one or two sides of the fire, the longitudinal temperature distribution
is consistent with that in the control group at 200 s when the initial sealing time is180
s.
-4 -2 0 2 4
100
200
300
400
500
600
700
800
900
Tem
pe
ratu
re (
C)
Position (m)
Control group
0 s
90 s
180 s
-4 -2 0 2 4
100
200
300
400
500
600
700
800
900
Tem
pera
ture
(C
)
Position (m)
Control group
0 s
90 s
180 s
(a) 75% + 75% (b) 75% + 100%
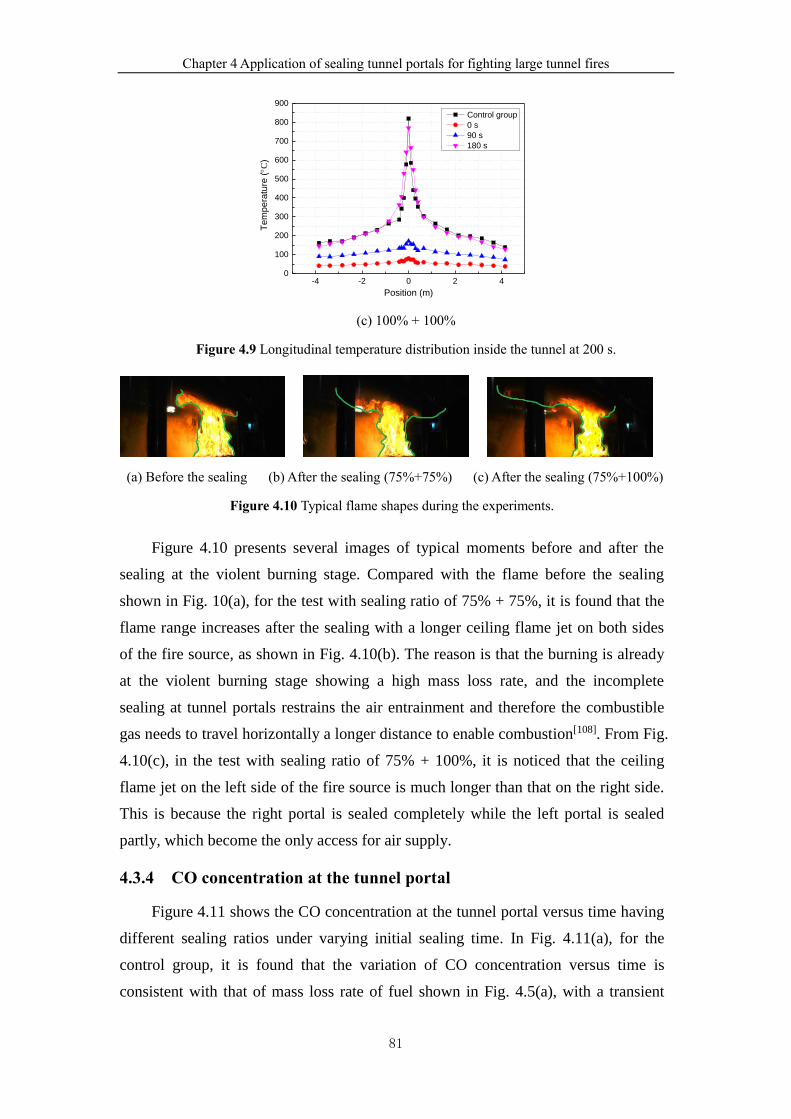
Chapter 4 Application of sealing tunnel portals for fighting large tunnel fires
81
-4 -2 0 2 40
100
200
300
400
500
600
700
800
900
Tem
pera
ture
(C
)
Position (m)
Control group
0 s
90 s
180 s
(c) 100% + 100%
Figure 4.9 Longitudinal temperature distribution inside the tunnel at 200 s.
(a) Before the sealing (b) After the sealing (75%+75%) (c) After the sealing (75%+100%)
Figure 4.10 Typical flame shapes during the experiments.
Figure 4.10 presents several images of typical moments before and after the
sealing at the violent burning stage. Compared with the flame before the sealing
shown in Fig. 10(a), for the test with sealing ratio of 75% + 75%, it is found that the
flame range increases after the sealing with a longer ceiling flame jet on both sides
of the fire source, as shown in Fig. 4.10(b). The reason is that the burning is already
at the violent burning stage showing a high mass loss rate, and the incomplete
sealing at tunnel portals restrains the air entrainment and therefore the combustible
gas needs to travel horizontally a longer distance to enable combustion[108]. From Fig.
4.10(c), in the test with sealing ratio of 75% + 100%, it is noticed that the ceiling
flame jet on the left side of the fire source is much longer than that on the right side.
This is because the right portal is sealed completely while the left portal is sealed
partly, which become the only access for air supply.
4.3.4 CO concentration at the tunnel portal
Figure 4.11 shows the CO concentration at the tunnel portal versus time having
different sealing ratios under varying initial sealing time. In Fig. 4.11(a), for the
control group, it is found that the variation of CO concentration versus time is
consistent with that of mass loss rate of fuel shown in Fig. 4.5(a), with a transient
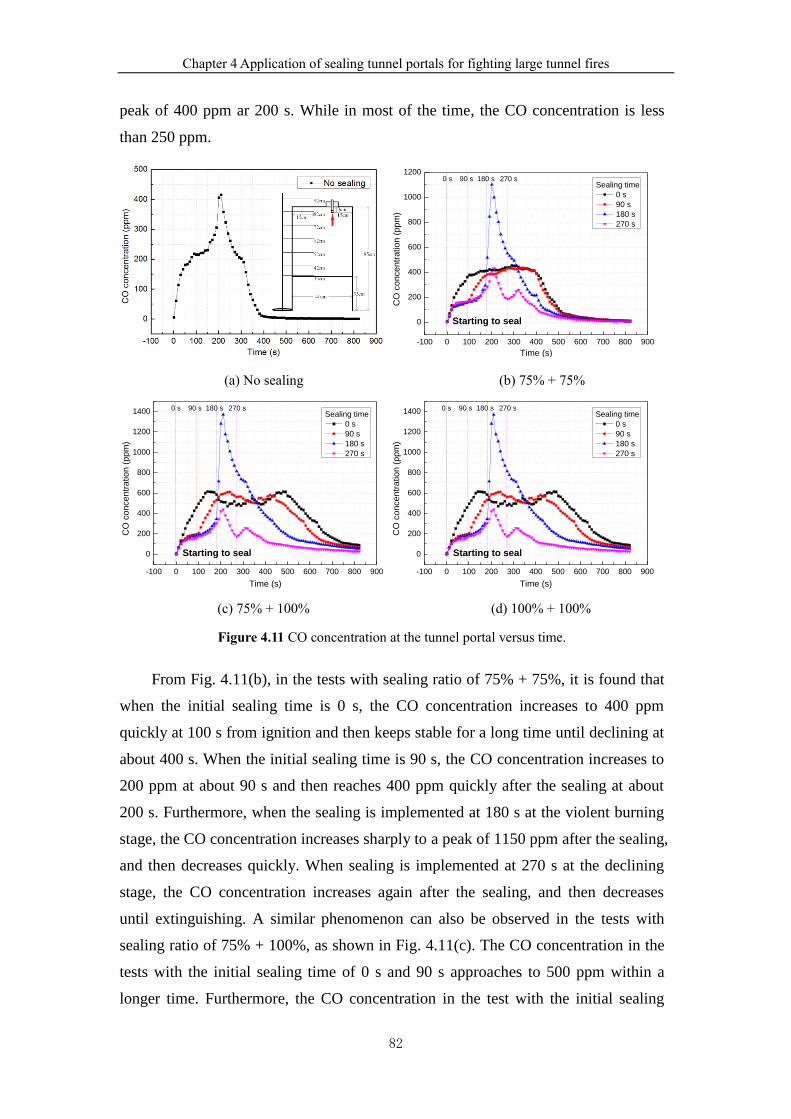
Chapter 4 Application of sealing tunnel portals for fighting large tunnel fires
82
peak of 400 ppm ar 200 s. While in most of the time, the CO concentration is less
than 250 ppm.
-100 0 100 200 300 400 500 600 700 800 900
0
200
400
600
800
1000
1200
Sealing time
0 s
90 s
180 s
270 s
CO
concentr
ation (
ppm
)
Time (s)
0 s 90 s 180 s 270 s
Starting to seal
(a) No sealing (b) 75% + 75%
-100 0 100 200 300 400 500 600 700 800 900
0
200
400
600
800
1000
1200
1400 Sealing time
0 s
90 s
180 s
270 s
CO
co
nce
ntr
atio
n (
pp
m)
Time (s)
0 s 90 s 180 s 270 s
Starting to seal
-100 0 100 200 300 400 500 600 700 800 900
0
200
400
600
800
1000
1200
1400 Sealing time
0 s
90 s
180 s
270 s
C
O c
once
ntr
atio
n (
pp
m)
Time (s)
0 s 90 s 180 s 270 s
Starting to seal
(c) 75% + 100% (d) 100% + 100%
Figure 4.11 CO concentration at the tunnel portal versus time.
From Fig. 4.11(b), in the tests with sealing ratio of 75% + 75%, it is found that
when the initial sealing time is 0 s, the CO concentration increases to 400 ppm
quickly at 100 s from ignition and then keeps stable for a long time until declining at
about 400 s. When the initial sealing time is 90 s, the CO concentration increases to
200 ppm at about 90 s and then reaches 400 ppm quickly after the sealing at about
200 s. Furthermore, when the sealing is implemented at 180 s at the violent burning
stage, the CO concentration increases sharply to a peak of 1150 ppm after the sealing,
and then decreases quickly. When sealing is implemented at 270 s at the declining
stage, the CO concentration increases again after the sealing, and then decreases
until extinguishing. A similar phenomenon can also be observed in the tests with
sealing ratio of 75% + 100%, as shown in Fig. 4.11(c). The CO concentration in the
tests with the initial sealing time of 0 s and 90 s approaches to 500 ppm within a
longer time. Furthermore, the CO concentration in the test with the initial sealing
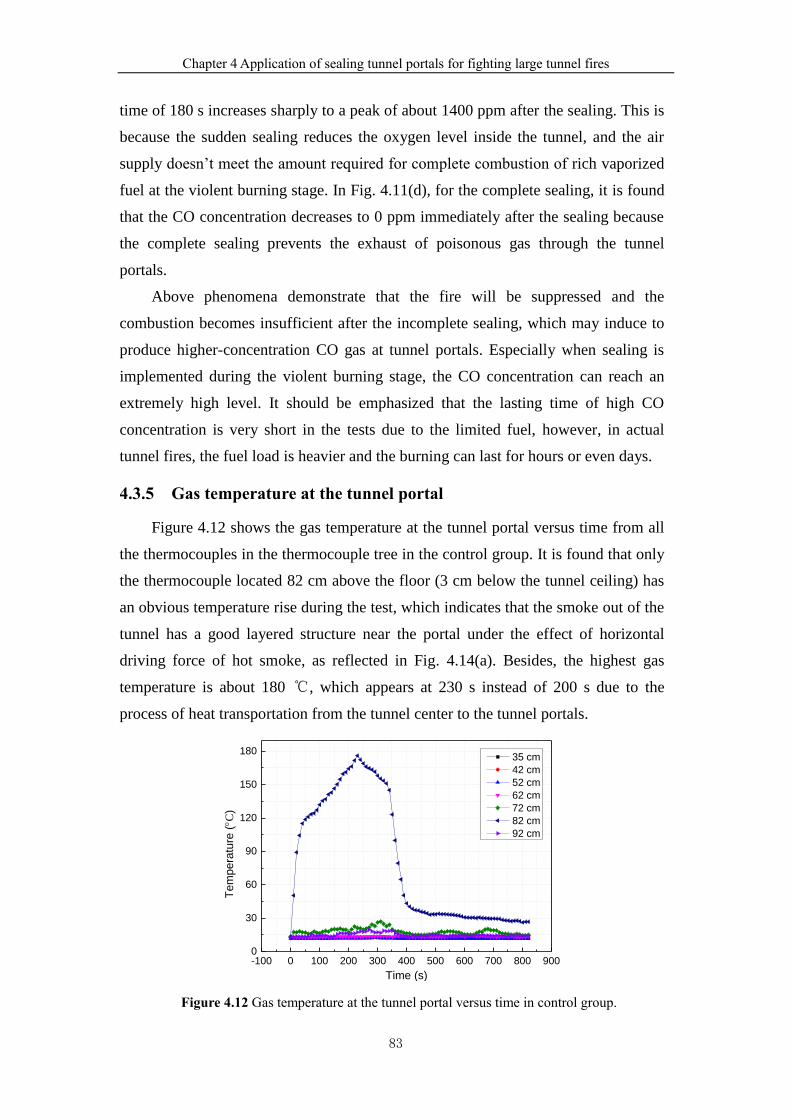
Chapter 4 Application of sealing tunnel portals for fighting large tunnel fires
83
time of 180 s increases sharply to a peak of about 1400 ppm after the sealing. This is
because the sudden sealing reduces the oxygen level inside the tunnel, and the air
supply doesn’t meet the amount required for complete combustion of rich vaporized
fuel at the violent burning stage. In Fig. 4.11(d), for the complete sealing, it is found
that the CO concentration decreases to 0 ppm immediately after the sealing because
the complete sealing prevents the exhaust of poisonous gas through the tunnel
portals.
Above phenomena demonstrate that the fire will be suppressed and the
combustion becomes insufficient after the incomplete sealing, which may induce to
produce higher-concentration CO gas at tunnel portals. Especially when sealing is
implemented during the violent burning stage, the CO concentration can reach an
extremely high level. It should be emphasized that the lasting time of high CO
concentration is very short in the tests due to the limited fuel, however, in actual
tunnel fires, the fuel load is heavier and the burning can last for hours or even days.
4.3.5 Gas temperature at the tunnel portal
Figure 4.12 shows the gas temperature at the tunnel portal versus time from all
the thermocouples in the thermocouple tree in the control group. It is found that only
the thermocouple located 82 cm above the floor (3 cm below the tunnel ceiling) has
an obvious temperature rise during the test, which indicates that the smoke out of the
tunnel has a good layered structure near the portal under the effect of horizontal
driving force of hot smoke, as reflected in Fig. 4.14(a). Besides, the highest gas
temperature is about 180 ℃, which appears at 230 s instead of 200 s due to the
process of heat transportation from the tunnel center to the tunnel portals.
-100 0 100 200 300 400 500 600 700 800 9000
30
60
90
120
150
180
Tem
pe
ratu
re (
C)
Time (s)
35 cm
42 cm
52 cm
62 cm
72 cm
82 cm
92 cm
Figure 4.12 Gas temperature at the tunnel portal versus time in control group.
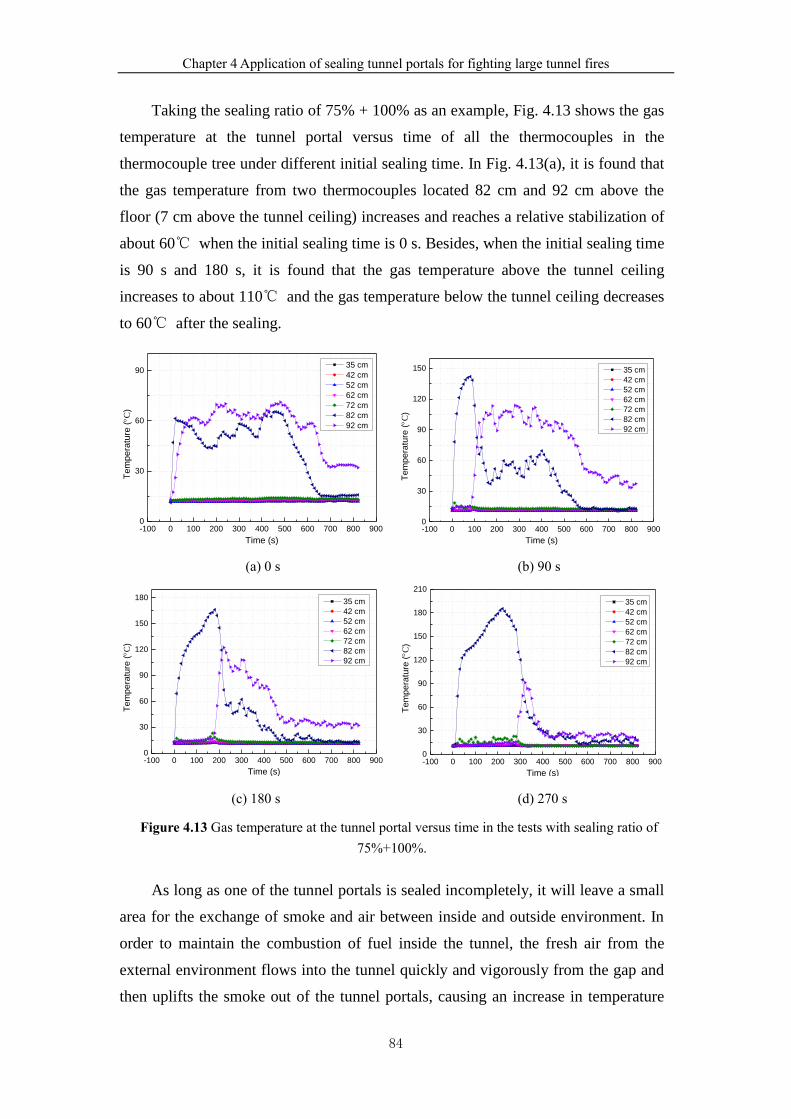
Chapter 4 Application of sealing tunnel portals for fighting large tunnel fires
84
Taking the sealing ratio of 75% + 100% as an example, Fig. 4.13 shows the gas
temperature at the tunnel portal versus time of all the thermocouples in the
thermocouple tree under different initial sealing time. In Fig. 4.13(a), it is found that
the gas temperature from two thermocouples located 82 cm and 92 cm above the
floor (7 cm above the tunnel ceiling) increases and reaches a relative stabilization of
about 60℃ when the initial sealing time is 0 s. Besides, when the initial sealing time
is 90 s and 180 s, it is found that the gas temperature above the tunnel ceiling
increases to about 110℃ and the gas temperature below the tunnel ceiling decreases
to 60℃ after the sealing.
-100 0 100 200 300 400 500 600 700 800 9000
30
60
90
Tem
pe
ratu
re (
C)
Time (s)
35 cm
42 cm
52 cm
62 cm
72 cm
82 cm
92 cm
-100 0 100 200 300 400 500 600 700 800 9000
30
60
90
120
150
Tem
pera
ture
(C
)
Time (s)
35 cm
42 cm
52 cm
62 cm
72 cm
82 cm
92 cm
(a) 0 s (b) 90 s
-100 0 100 200 300 400 500 600 700 800 9000
30
60
90
120
150
180
Tem
pe
ratu
re (
C)
Time (s)
35 cm
42 cm
52 cm
62 cm
72 cm
82 cm
92 cm
-100 0 100 200 300 400 500 600 700 800 9000
30
60
90
120
150
180
210
Tem
pe
ratu
re (
C)
Time (s)
35 cm
42 cm
52 cm
62 cm
72 cm
82 cm
92 cm
(c) 180 s (d) 270 s
Figure 4.13 Gas temperature at the tunnel portal versus time in the tests with sealing ratio of
75%+100%.
As long as one of the tunnel portals is sealed incompletely, it will leave a small
area for the exchange of smoke and air between inside and outside environment. In
order to maintain the combustion of fuel inside the tunnel, the fresh air from the
external environment flows into the tunnel quickly and vigorously from the gap and
then uplifts the smoke out of the tunnel portals, causing an increase in temperature
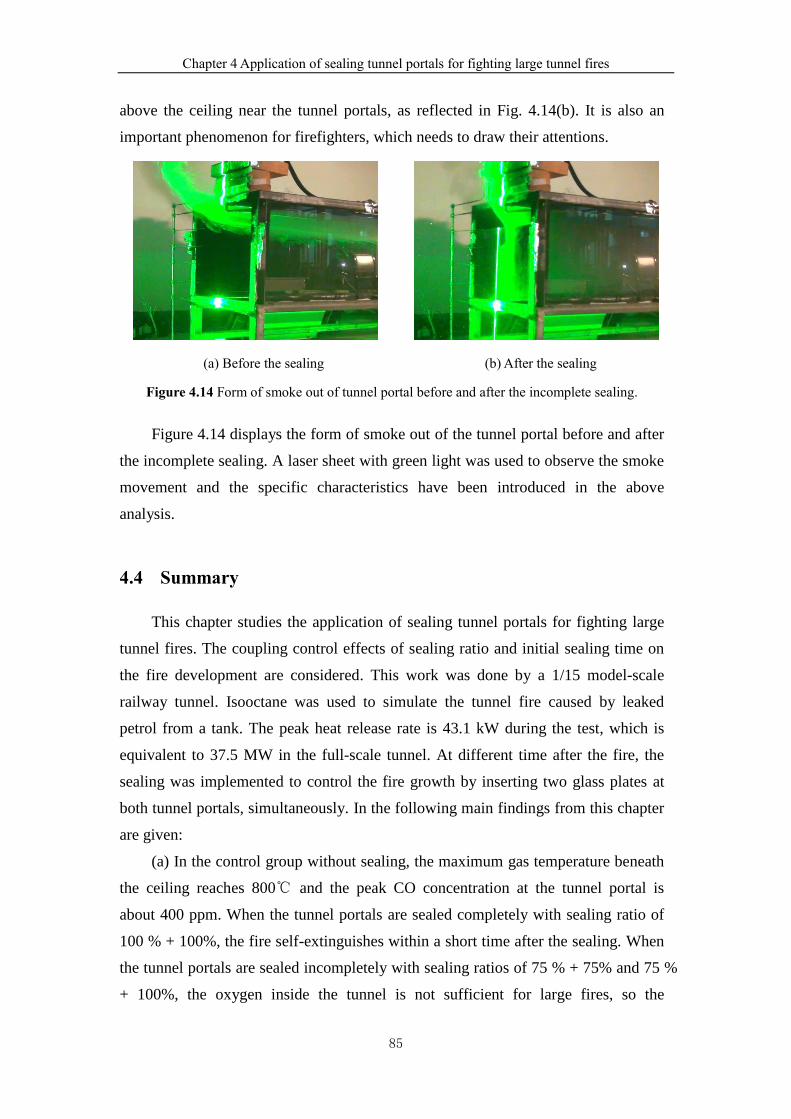
Chapter 4 Application of sealing tunnel portals for fighting large tunnel fires
85
above the ceiling near the tunnel portals, as reflected in Fig. 4.14(b). It is also an
important phenomenon for firefighters, which needs to draw their attentions.
(a) Before the sealing (b) After the sealing
Figure 4.14 Form of smoke out of tunnel portal before and after the incomplete sealing.
Figure 4.14 displays the form of smoke out of the tunnel portal before and after
the incomplete sealing. A laser sheet with green light was used to observe the smoke
movement and the specific characteristics have been introduced in the above
analysis.
4.4 Summary
This chapter studies the application of sealing tunnel portals for fighting large
tunnel fires. The coupling control effects of sealing ratio and initial sealing time on
the fire development are considered. This work was done by a 1/15 model-scale
railway tunnel. Isooctane was used to simulate the tunnel fire caused by leaked
petrol from a tank. The peak heat release rate is 43.1 kW during the test, which is
equivalent to 37.5 MW in the full-scale tunnel. At different time after the fire, the
sealing was implemented to control the fire growth by inserting two glass plates at
both tunnel portals, simultaneously. In the following main findings from this chapter
are given:
(a) In the control group without sealing, the maximum gas temperature beneath
the ceiling reaches 800℃ and the peak CO concentration at the tunnel portal is
about 400 ppm. When the tunnel portals are sealed completely with sealing ratio of
100 % + 100%, the fire self-extinguishes within a short time after the sealing. When
the tunnel portals are sealed incompletely with sealing ratios of 75 % + 75% and 75 %
+ 100%, the oxygen inside the tunnel is not sufficient for large fires, so the
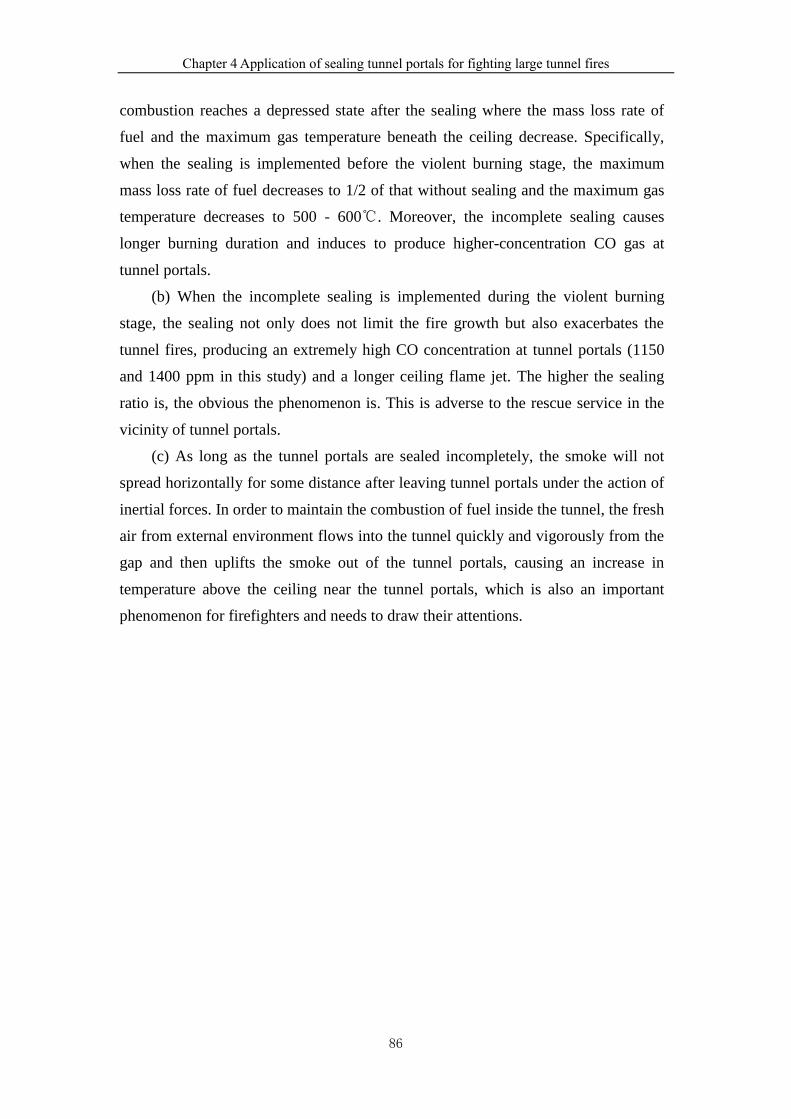
Chapter 4 Application of sealing tunnel portals for fighting large tunnel fires
86
combustion reaches a depressed state after the sealing where the mass loss rate of
fuel and the maximum gas temperature beneath the ceiling decrease. Specifically,
when the sealing is implemented before the violent burning stage, the maximum
mass loss rate of fuel decreases to 1/2 of that without sealing and the maximum gas
temperature decreases to 500 - 600℃. Moreover, the incomplete sealing causes
longer burning duration and induces to produce higher-concentration CO gas at
tunnel portals.
(b) When the incomplete sealing is implemented during the violent burning
stage, the sealing not only does not limit the fire growth but also exacerbates the
tunnel fires, producing an extremely high CO concentration at tunnel portals (1150
and 1400 ppm in this study) and a longer ceiling flame jet. The higher the sealing
ratio is, the obvious the phenomenon is. This is adverse to the rescue service in the
vicinity of tunnel portals.
(c) As long as the tunnel portals are sealed incompletely, the smoke will not
spread horizontally for some distance after leaving tunnel portals under the action of
inertial forces. In order to maintain the combustion of fuel inside the tunnel, the fresh
air from external environment flows into the tunnel quickly and vigorously from the
gap and then uplifts the smoke out of the tunnel portals, causing an increase in
temperature above the ceiling near the tunnel portals, which is also an important
phenomenon for firefighters and needs to draw their attentions.
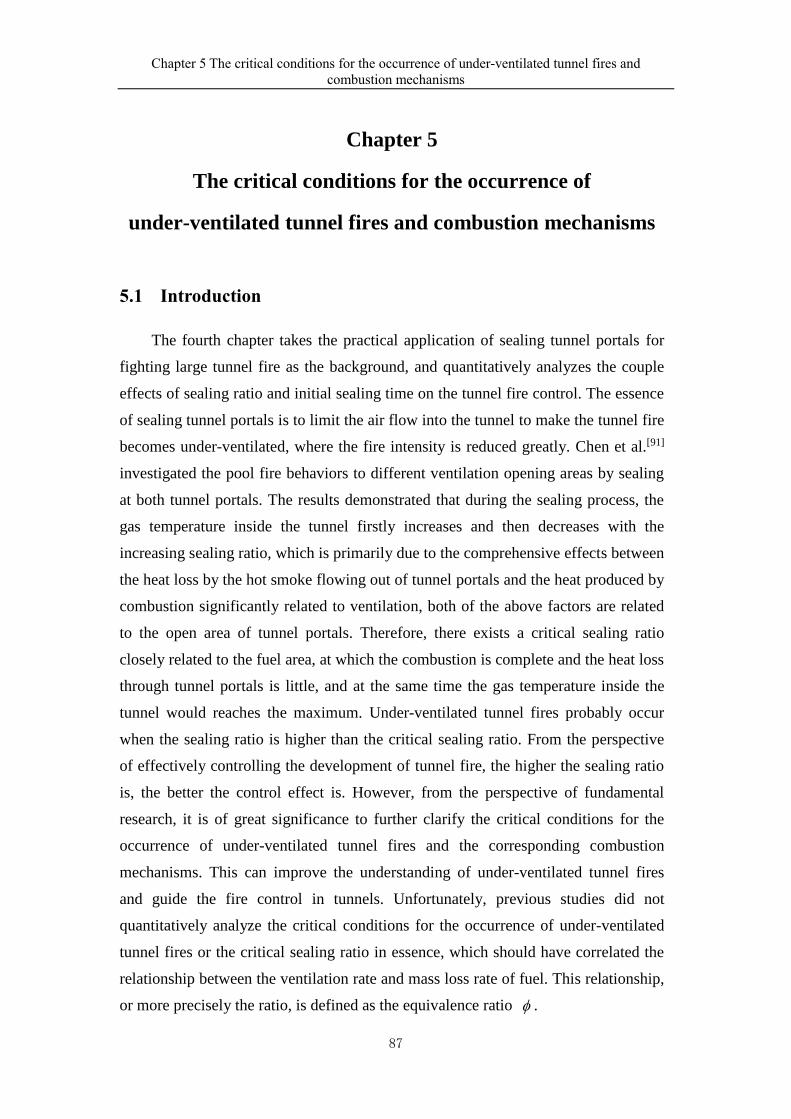
Chapter 5 The critical conditions for the occurrence of under-ventilated tunnel fires and
combustion mechanisms
87
Chapter 5
The critical conditions for the occurrence of
under-ventilated tunnel fires and combustion mechanisms
5.1 Introduction
The fourth chapter takes the practical application of sealing tunnel portals for
fighting large tunnel fire as the background, and quantitatively analyzes the couple
effects of sealing ratio and initial sealing time on the tunnel fire control. The essence
of sealing tunnel portals is to limit the air flow into the tunnel to make the tunnel fire
becomes under-ventilated, where the fire intensity is reduced greatly. Chen et al.[91]
investigated the pool fire behaviors to different ventilation opening areas by sealing
at both tunnel portals. The results demonstrated that during the sealing process, the
gas temperature inside the tunnel firstly increases and then decreases with the
increasing sealing ratio, which is primarily due to the comprehensive effects between
the heat loss by the hot smoke flowing out of tunnel portals and the heat produced by
combustion significantly related to ventilation, both of the above factors are related
to the open area of tunnel portals. Therefore, there exists a critical sealing ratio
closely related to the fuel area, at which the combustion is complete and the heat loss
through tunnel portals is little, and at the same time the gas temperature inside the
tunnel would reaches the maximum. Under-ventilated tunnel fires probably occur
when the sealing ratio is higher than the critical sealing ratio. From the perspective
of effectively controlling the development of tunnel fire, the higher the sealing ratio
is, the better the control effect is. However, from the perspective of fundamental
research, it is of great significance to further clarify the critical conditions for the
occurrence of under-ventilated tunnel fires and the corresponding combustion
mechanisms. This can improve the understanding of under-ventilated tunnel fires
and guide the fire control in tunnels. Unfortunately, previous studies did not
quantitatively analyze the critical conditions for the occurrence of under-ventilated
tunnel fires or the critical sealing ratio in essence, which should have correlated the
relationship between the ventilation rate and mass loss rate of fuel. This relationship,
or more precisely the ratio, is defined as the equivalence ratio .
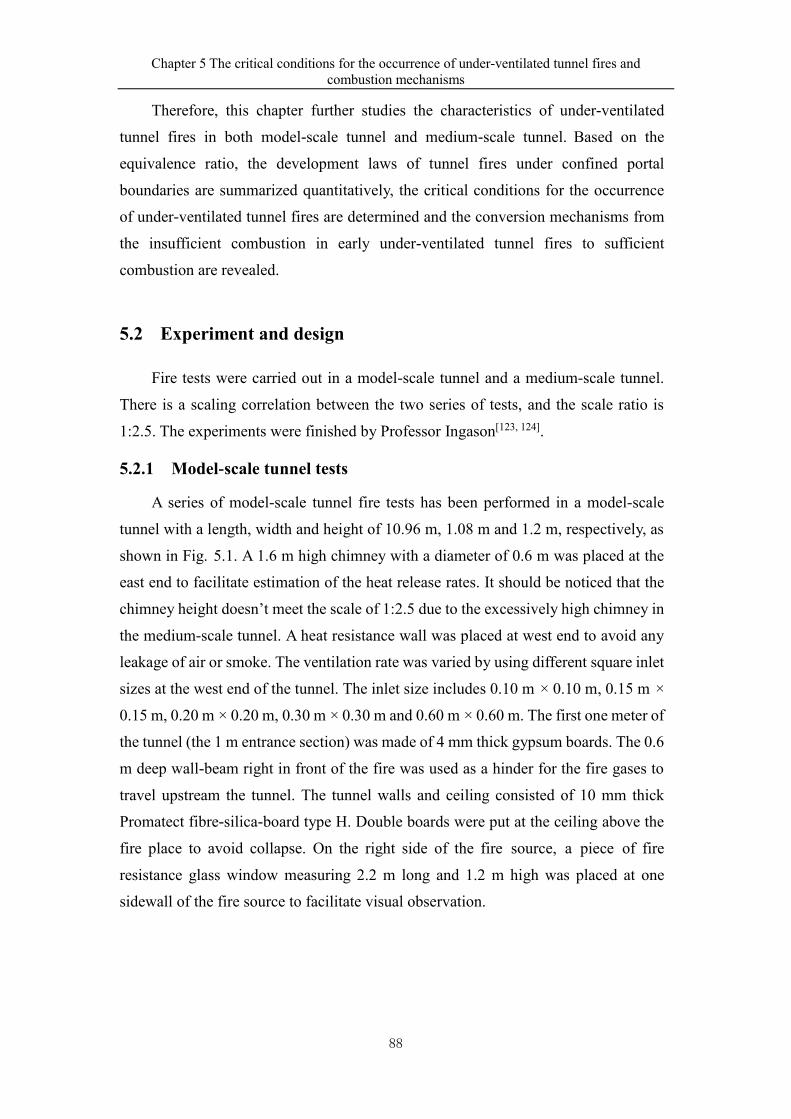
Chapter 5 The critical conditions for the occurrence of under-ventilated tunnel fires and
combustion mechanisms
88
Therefore, this chapter further studies the characteristics of under-ventilated
tunnel fires in both model-scale tunnel and medium-scale tunnel. Based on the
equivalence ratio, the development laws of tunnel fires under confined portal
boundaries are summarized quantitatively, the critical conditions for the occurrence
of under-ventilated tunnel fires are determined and the conversion mechanisms from
the insufficient combustion in early under-ventilated tunnel fires to sufficient
combustion are revealed.
5.2 Experiment and design
Fire tests were carried out in a model-scale tunnel and a medium-scale tunnel.
There is a scaling correlation between the two series of tests, and the scale ratio is
1:2.5. The experiments were finished by Professor Ingason[123, 124].
5.2.1 Model-scale tunnel tests
A series of model-scale tunnel fire tests has been performed in a model-scale
tunnel with a length, width and height of 10.96 m, 1.08 m and 1.2 m, respectively, as
shown in Fig. 5.1. A 1.6 m high chimney with a diameter of 0.6 m was placed at the
east end to facilitate estimation of the heat release rates. It should be noticed that the
chimney height doesn’t meet the scale of 1:2.5 due to the excessively high chimney in
the medium-scale tunnel. A heat resistance wall was placed at west end to avoid any
leakage of air or smoke. The ventilation rate was varied by using different square inlet
sizes at the west end of the tunnel. The inlet size includes 0.10 m × 0.10 m, 0.15 m ×
0.15 m, 0.20 m × 0.20 m, 0.30 m × 0.30 m and 0.60 m × 0.60 m. The first one meter of
the tunnel (the 1 m entrance section) was made of 4 mm thick gypsum boards. The 0.6
m deep wall-beam right in front of the fire was used as a hinder for the fire gases to
travel upstream the tunnel. The tunnel walls and ceiling consisted of 10 mm thick
Promatect fibre-silica-board type H. Double boards were put at the ceiling above the
fire place to avoid collapse. On the right side of the fire source, a piece of fire
resistance glass window measuring 2.2 m long and 1.2 m high was placed at one
sidewall of the fire source to facilitate visual observation.
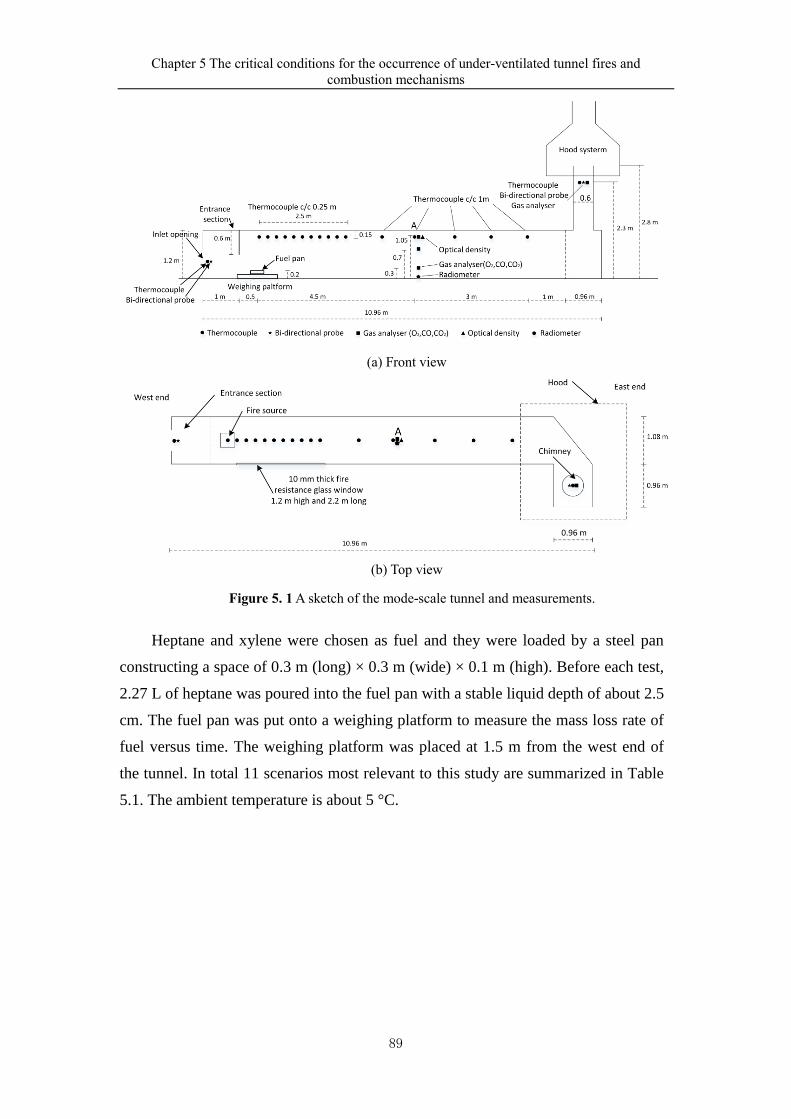
Chapter 5 The critical conditions for the occurrence of under-ventilated tunnel fires and
combustion mechanisms
89
(a) Front view
(b) Top view
Figure 5. 1 A sketch of the mode-scale tunnel and measurements.
Heptane and xylene were chosen as fuel and they were loaded by a steel pan
constructing a space of 0.3 m (long) × 0.3 m (wide) × 0.1 m (high). Before each test,
2.27 L of heptane was poured into the fuel pan with a stable liquid depth of about 2.5
cm. The fuel pan was put onto a weighing platform to measure the mass loss rate of
fuel versus time. The weighing platform was placed at 1.5 m from the west end of
the tunnel. In total 11 scenarios most relevant to this study are summarized in Table
5.1. The ambient temperature is about 5 °C.
Chapter 5 The critical conditions for the occurrence of under-ventilated tunnel fires and
combustion mechanisms
90
Table 5.1 A summary of experimental cases in model-scale tests (Finished by Professor
Ingason[123]).
Temperature was measured by K-type thermocouple. The velocity was computed
with aid of bi-directional probe and thermocouple by the following correlation:
1 2
( ) o o
PTu
k Re T
= (5.1)
where ΔP is the pressure difference, T is the gas temperature, o is the ambient air
density and oT is the ambient air temperature. (Re)k is a correction coefficient given
by McCaffrey and Heskestad[169] which is nearly a constant of 1.08 for Re >3800.
Gas volume fractions, including O2, CO and CO2, were measured by gas
analyzers located at instrument station A at three different heights of 0.3, 0.7 and
1.05 m above the floor, as well as 2.3 m inside the chimney. Each probe was held
open in 30 seconds and the data was recorded per 6 seconds. The optical density of
the smoke was measured by smoke meter at instrument stations A with a height of
1.05 m from the floor. The measuring principle is shown as follows:
OD=lg (I incident light /I transmitted light) (5.2)
The more detailed characteristics of the arrangement of measurement system
are shown in Fig. 5.1.
5.2.2 Medium-scale tunnel tests
The medium-scale tests were carried out in a 100 m long blasted rock tunnel with
a cross-section of about 2.7 m wide and 3 m high. The geometry of the cross section
varies slightly along the tunnel but these are average measured values. The tunnel is
open at the west end and has a 13.2 m high chimney at the east end with a diameter of
Test Fuel Fuel area
(m × m)
Amount of fuel
(L)
Opening size
(m)
1 Heptane 0.3 × 0.3 2.27 L 0.60 × 0.60
2 Heptane 0.3 × 0.3 2.27 L 0.30 × 0.30
3 Heptane 0.3 × 0.3 2.27 L 0.20 × 0.20
4 Heptane 0.3 × 0.3 2.27 L 0.15 × 0.15
5 Heptane 0.3 × 0.3 2.27 L 0.10 × 0.10
6 Xylene 0.3 × 0.3 2.27 L 0.30 × 0.30
7 Xylene 0.3 × 0.3 2.27 L 0.20 × 0.20
8 Xylene 0.3 × 0.3 2.27 L 0.15 × 0.15
9 Xylene 0.3 × 0.3 2.27 L 0.10 × 0.10
10 Heptane 0.3 × 0.3 2.27 In the open
11 Xylene 0.3 × 0.3 2.27 In the open
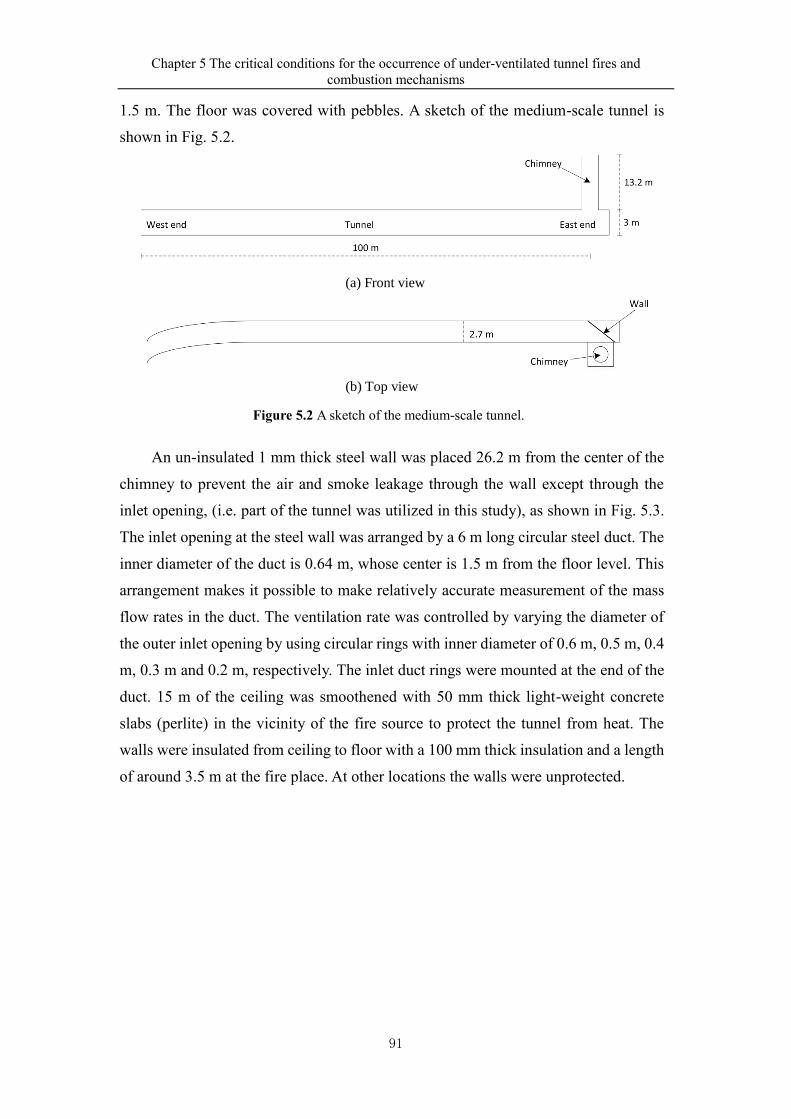
Chapter 5 The critical conditions for the occurrence of under-ventilated tunnel fires and
combustion mechanisms
91
1.5 m. The floor was covered with pebbles. A sketch of the medium-scale tunnel is
shown in Fig. 5.2.
(a) Front view
(b) Top view
Figure 5.2 A sketch of the medium-scale tunnel.
An un-insulated 1 mm thick steel wall was placed 26.2 m from the center of the
chimney to prevent the air and smoke leakage through the wall except through the
inlet opening, (i.e. part of the tunnel was utilized in this study), as shown in Fig. 5.3.
The inlet opening at the steel wall was arranged by a 6 m long circular steel duct. The
inner diameter of the duct is 0.64 m, whose center is 1.5 m from the floor level. This
arrangement makes it possible to make relatively accurate measurement of the mass
flow rates in the duct. The ventilation rate was controlled by varying the diameter of
the outer inlet opening by using circular rings with inner diameter of 0.6 m, 0.5 m, 0.4
m, 0.3 m and 0.2 m, respectively. The inlet duct rings were mounted at the end of the
duct. 15 m of the ceiling was smoothened with 50 mm thick light-weight concrete
slabs (perlite) in the vicinity of the fire source to protect the tunnel from heat. The
walls were insulated from ceiling to floor with a 100 mm thick insulation and a length
of around 3.5 m at the fire place. At other locations the walls were unprotected.
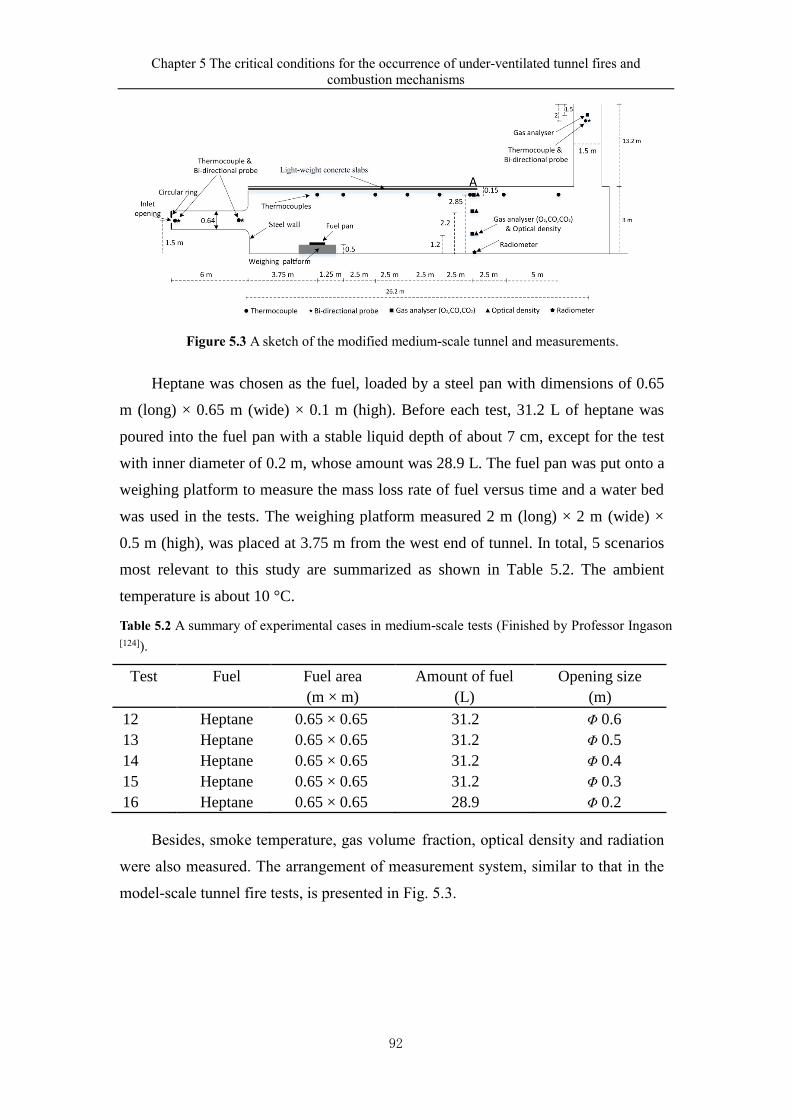
Chapter 5 The critical conditions for the occurrence of under-ventilated tunnel fires and
combustion mechanisms
92
Figure 5.3 A sketch of the modified medium-scale tunnel and measurements.
Heptane was chosen as the fuel, loaded by a steel pan with dimensions of 0.65
m (long) × 0.65 m (wide) × 0.1 m (high). Before each test, 31.2 L of heptane was
poured into the fuel pan with a stable liquid depth of about 7 cm, except for the test
with inner diameter of 0.2 m, whose amount was 28.9 L. The fuel pan was put onto a
weighing platform to measure the mass loss rate of fuel versus time and a water bed
was used in the tests. The weighing platform measured 2 m (long) × 2 m (wide) ×
0.5 m (high), was placed at 3.75 m from the west end of tunnel. In total, 5 scenarios
most relevant to this study are summarized as shown in Table 5.2. The ambient
temperature is about 10 °C.
Table 5.2 A summary of experimental cases in medium-scale tests (Finished by Professor Ingason
[124]).
Test Fuel Fuel area
(m × m)
Amount of fuel
(L)
Opening size
(m)
12 Heptane 0.65 × 0.65 31.2 Φ 0.6
13 Heptane 0.65 × 0.65 31.2 Φ 0.5
14 Heptane 0.65 × 0.65 31.2 Φ 0.4
15 Heptane 0.65 × 0.65 31.2 Φ 0.3
16 Heptane 0.65 × 0.65 28.9 Φ 0.2
Besides, smoke temperature, gas volume fraction, optical density and radiation
were also measured. The arrangement of measurement system, similar to that in the
model-scale tunnel fire tests, is presented in Fig. 5.3.
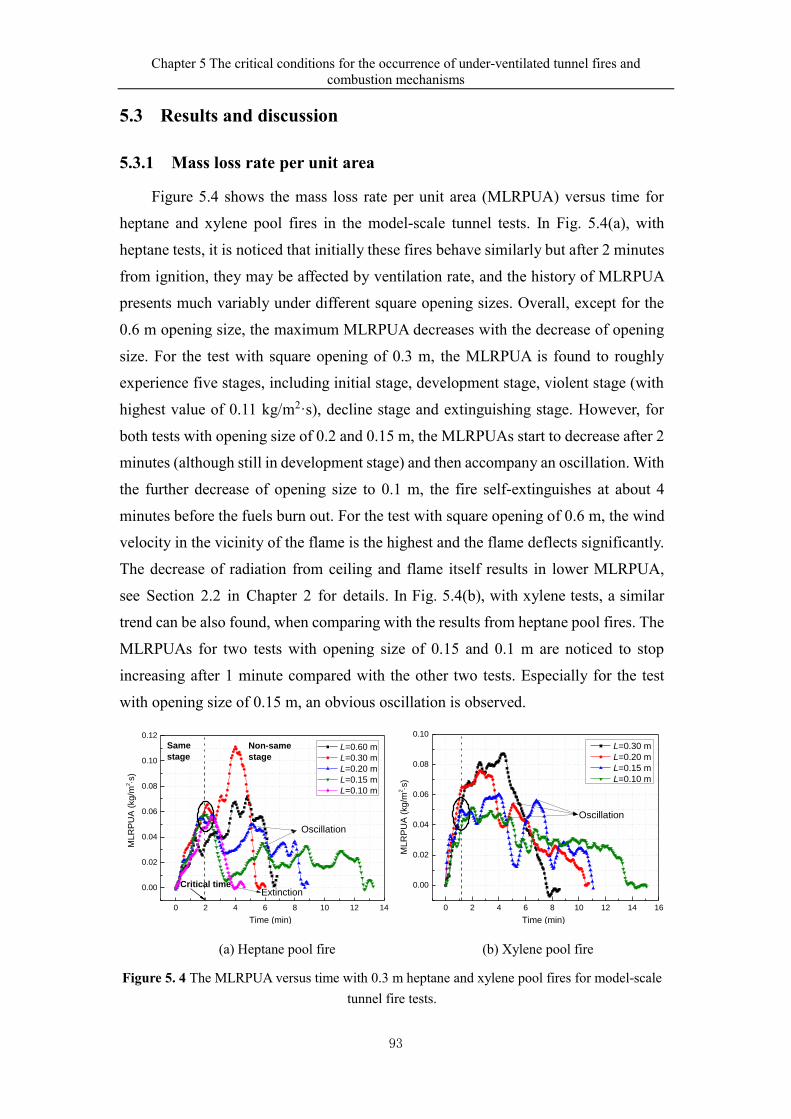
Chapter 5 The critical conditions for the occurrence of under-ventilated tunnel fires and
combustion mechanisms
93
5.3 Results and discussion
5.3.1 Mass loss rate per unit area
Figure 5.4 shows the mass loss rate per unit area (MLRPUA) versus time for
heptane and xylene pool fires in the model-scale tunnel tests. In Fig. 5.4(a), with
heptane tests, it is noticed that initially these fires behave similarly but after 2 minutes
from ignition, they may be affected by ventilation rate, and the history of MLRPUA
presents much variably under different square opening sizes. Overall, except for the
0.6 m opening size, the maximum MLRPUA decreases with the decrease of opening
size. For the test with square opening of 0.3 m, the MLRPUA is found to roughly
experience five stages, including initial stage, development stage, violent stage (with
highest value of 0.11 kg/m2·s), decline stage and extinguishing stage. However, for
both tests with opening size of 0.2 and 0.15 m, the MLRPUAs start to decrease after 2
minutes (although still in development stage) and then accompany an oscillation. With
the further decrease of opening size to 0.1 m, the fire self-extinguishes at about 4
minutes before the fuels burn out. For the test with square opening of 0.6 m, the wind
velocity in the vicinity of the flame is the highest and the flame deflects significantly.
The decrease of radiation from ceiling and flame itself results in lower MLRPUA,
see Section 2.2 in Chapter 2 for details. In Fig. 5.4(b), with xylene tests, a similar
trend can be also found, when comparing with the results from heptane pool fires. The
MLRPUAs for two tests with opening size of 0.15 and 0.1 m are noticed to stop
increasing after 1 minute compared with the other two tests. Especially for the test
with opening size of 0.15 m, an obvious oscillation is observed.
0 2 4 6 8 10 12 14
0.00
0.02
0.04
0.06
0.08
0.10
0.12
Non-same
stage
Extinction
L=0.60 m
L=0.30 m
L=0.20 m
L=0.15 m
L=0.10 m
MLR
PU
A (
kg
/m2s
)
Time (min)
Oscillation
Same
stage
Critical time
0 2 4 6 8 10 12 14 16
0.00
0.02
0.04
0.06
0.08
0.10
Oscillation
MLR
PU
A (
kg
/m2s
)
Time (min)
L=0.30 m
L=0.20 m
L=0.15 m
L=0.10 m
(a) Heptane pool fire (b) Xylene pool fire
Figure 5. 4 The MLRPUA versus time with 0.3 m heptane and xylene pool fires for model-scale
tunnel fire tests.
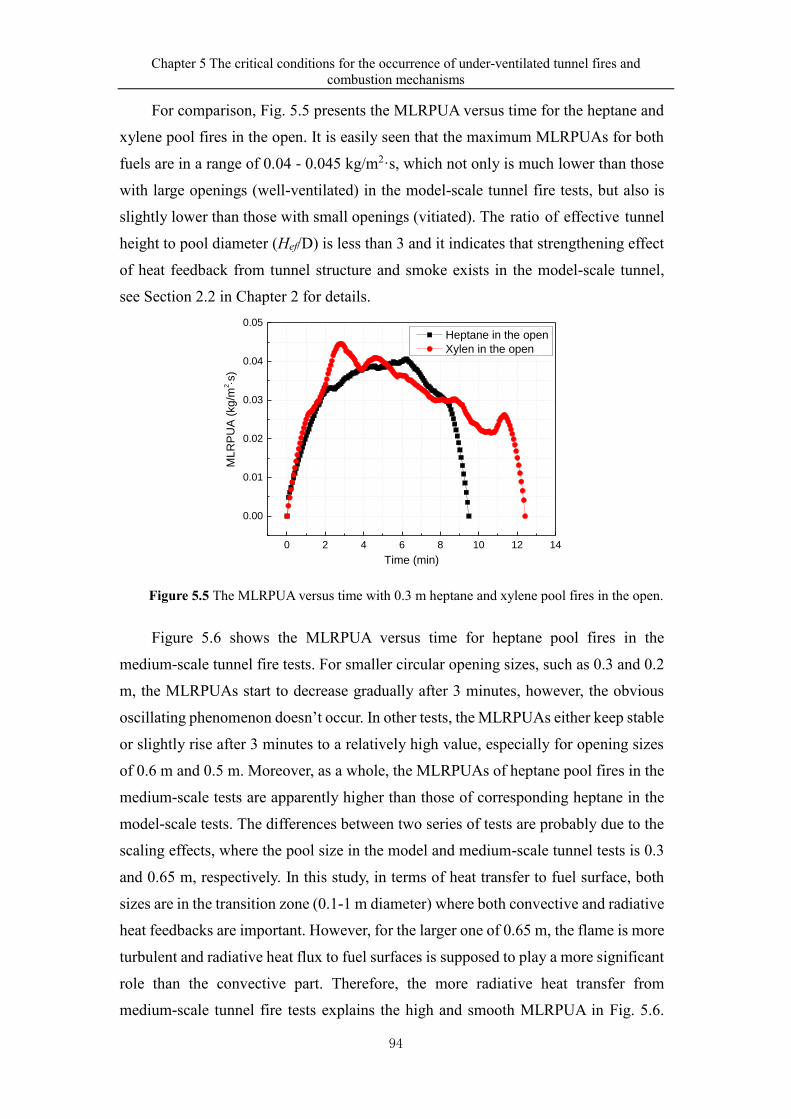
Chapter 5 The critical conditions for the occurrence of under-ventilated tunnel fires and
combustion mechanisms
94
For comparison, Fig. 5.5 presents the MLRPUA versus time for the heptane and
xylene pool fires in the open. It is easily seen that the maximum MLRPUAs for both
fuels are in a range of 0.04 - 0.045 kg/m2·s, which not only is much lower than those
with large openings (well-ventilated) in the model-scale tunnel fire tests, but also is
slightly lower than those with small openings (vitiated). The ratio of effective tunnel
height to pool diameter (Hef/D) is less than 3 and it indicates that strengthening effect
of heat feedback from tunnel structure and smoke exists in the model-scale tunnel,
see Section 2.2 in Chapter 2 for details.
0 2 4 6 8 10 12 14
0.00
0.01
0.02
0.03
0.04
0.05
MLR
PU
A (
kg
/m2s
)
Time (min)
Heptane in the open
Xylen in the open
Figure 5.5 The MLRPUA versus time with 0.3 m heptane and xylene pool fires in the open.
Figure 5.6 shows the MLRPUA versus time for heptane pool fires in the
medium-scale tunnel fire tests. For smaller circular opening sizes, such as 0.3 and 0.2
m, the MLRPUAs start to decrease gradually after 3 minutes, however, the obvious
oscillating phenomenon doesn’t occur. In other tests, the MLRPUAs either keep stable
or slightly rise after 3 minutes to a relatively high value, especially for opening sizes
of 0.6 m and 0.5 m. Moreover, as a whole, the MLRPUAs of heptane pool fires in the
medium-scale tests are apparently higher than those of corresponding heptane in the
model-scale tests. The differences between two series of tests are probably due to the
scaling effects, where the pool size in the model and medium-scale tunnel tests is 0.3
and 0.65 m, respectively. In this study, in terms of heat transfer to fuel surface, both
sizes are in the transition zone (0.1-1 m diameter) where both convective and radiative
heat feedbacks are important. However, for the larger one of 0.65 m, the flame is more
turbulent and radiative heat flux to fuel surfaces is supposed to play a more significant
role than the convective part. Therefore, the more radiative heat transfer from
medium-scale tunnel fire tests explains the high and smooth MLRPUA in Fig. 5.6.
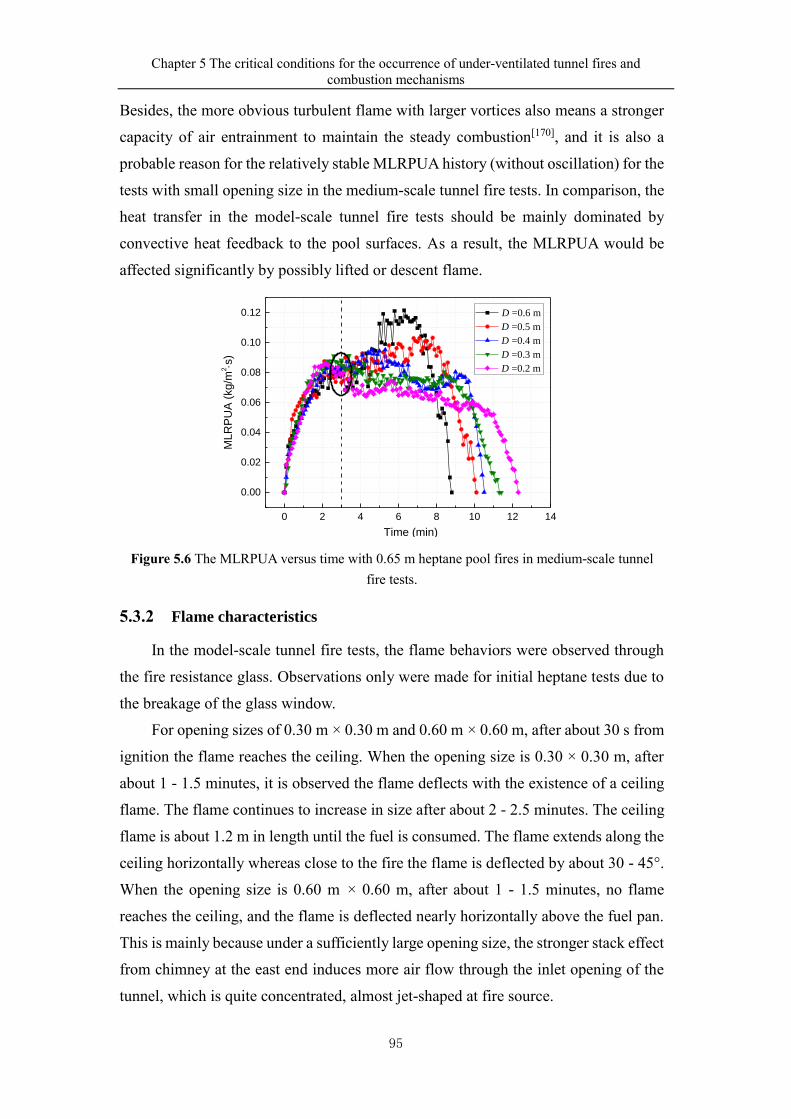
Chapter 5 The critical conditions for the occurrence of under-ventilated tunnel fires and
combustion mechanisms
95
Besides, the more obvious turbulent flame with larger vortices also means a stronger
capacity of air entrainment to maintain the steady combustion[170], and it is also a
probable reason for the relatively stable MLRPUA history (without oscillation) for the
tests with small opening size in the medium-scale tunnel fire tests. In comparison, the
heat transfer in the model-scale tunnel fire tests should be mainly dominated by
convective heat feedback to the pool surfaces. As a result, the MLRPUA would be
affected significantly by possibly lifted or descent flame.
0 2 4 6 8 10 12 14
0.00
0.02
0.04
0.06
0.08
0.10
0.12
MLR
PU
A (
kg/m
2s
)
Time (min)
D =0.6 m
D =0.5 m
D =0.4 m
D =0.3 m
D =0.2 m
Figure 5.6 The MLRPUA versus time with 0.65 m heptane pool fires in medium-scale tunnel
fire tests.
5.3.2 Flame characteristics
In the model-scale tunnel fire tests, the flame behaviors were observed through
the fire resistance glass. Observations only were made for initial heptane tests due to
the breakage of the glass window.
For opening sizes of 0.30 m × 0.30 m and 0.60 m × 0.60 m, after about 30 s from
ignition the flame reaches the ceiling. When the opening size is 0.30 × 0.30 m, after
about 1 - 1.5 minutes, it is observed the flame deflects with the existence of a ceiling
flame. The flame continues to increase in size after about 2 - 2.5 minutes. The ceiling
flame is about 1.2 m in length until the fuel is consumed. The flame extends along the
ceiling horizontally whereas close to the fire the flame is deflected by about 30 - 45°.
When the opening size is 0.60 m × 0.60 m, after about 1 - 1.5 minutes, no flame
reaches the ceiling, and the flame is deflected nearly horizontally above the fuel pan.
This is mainly because under a sufficiently large opening size, the stronger stack effect
from chimney at the east end induces more air flow through the inlet opening of the
tunnel, which is quite concentrated, almost jet-shaped at fire source.
Chapter 5 The critical conditions for the occurrence of under-ventilated tunnel fires and
combustion mechanisms
96
For opening sizes of 0.10 m × 0.10 m, 0.15 m × 0.15 m, and 0.20 m × 0.20 m, the
flame reduces dramatically in size after about 2 - 2.5 minutes from ignition. At the
same time, less smoke is produced. This is probably caused by the decreasing
MLRPUA, as shown in Fig. 5.4(a). At this moment, the flame height is about 2/3 of
the ceiling height. The flame starts to burn partly outside the fuel pan and they start to
flutter above the fuel pan. After about 3 minutes from ignition the flame occurs mainly
outside the pan and none directly above the pan. The flame can be characterized as
lifted flame travelling outside the pan, mainly on upstream side of the pan. This would
be similar phenomena as described by Foote[171] as “ghosting fire”.
5.3.3 Equivalence ratio
The concept of equivalence ratio (ϕ) is introduced in this section in order to
discuss the influence of ventilation conditions on combustion. The calculated method
of equivalence ratio is expressed as follows[14, 94, 172]:
f
a
rm
m = (5.2)
where
137.8(a 4 2)
(12a 16 )
b cr
b c
+ −=
+ + (5.3)
where am is the air flow rate through inlet opening of tunnel (ventilation rate) and
fm is the mass loss rate of fuel. r is the stoichiometric coefficient and the letter
index comes from a generic fuel (CaHbOc). Theoretically, it is thought that when the
equivalence ratio is less than 1, the oxygen is sufficient and the fire is well-ventilated
(fuel-controlled), and when the equivalence ratio is more than 1, the oxygen is not
sufficient and the fire is under-ventilated (ventilation-controlled).
Table 5.3 summarizes the trend of MLRPUA after the same stage separated by
dotted lines in Fig. 5.4 and Fig. 5.6, in relation to equivalence ratio at the transition
moment for all the tests. It should be pointed out that the equivalence ratio is not
constant during the combustion progress in each scenario and it much depends on the
change of mass loss rate per unit area of pool fires. The equivalence ratio in this study
is from the critical time at the early stage of fire. The results show that as long as is
less than 0.53, the MLRPUAs perform well and continue to increase during identical
periods, which represents a well-ventilated tunnel fire (fuel-controlled). However, for
other tests with exceeding 0.6, the MLRPUAs trend to decrease and even oscillate
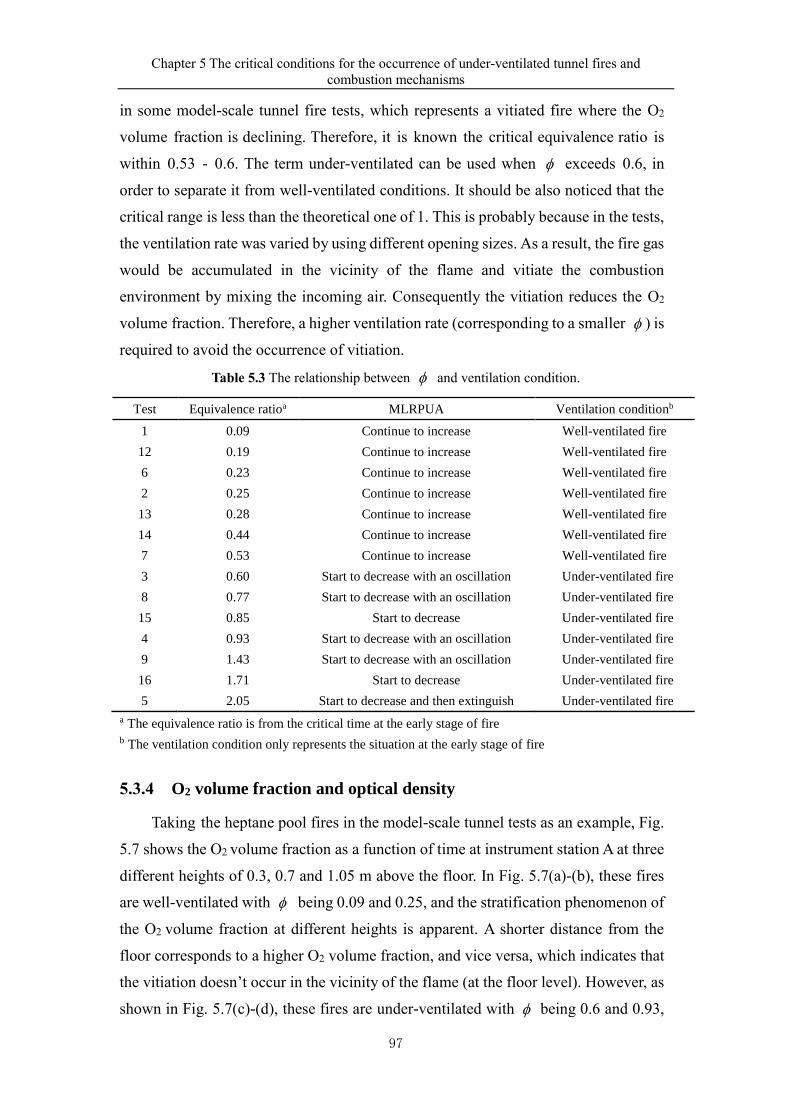
Chapter 5 The critical conditions for the occurrence of under-ventilated tunnel fires and
combustion mechanisms
97
in some model-scale tunnel fire tests, which represents a vitiated fire where the O2
volume fraction is declining. Therefore, it is known the critical equivalence ratio is
within 0.53 - 0.6. The term under-ventilated can be used when exceeds 0.6, in
order to separate it from well-ventilated conditions. It should be also noticed that the
critical range is less than the theoretical one of 1. This is probably because in the tests,
the ventilation rate was varied by using different opening sizes. As a result, the fire gas
would be accumulated in the vicinity of the flame and vitiate the combustion
environment by mixing the incoming air. Consequently the vitiation reduces the O2
volume fraction. Therefore, a higher ventilation rate (corresponding to a smaller ) is
required to avoid the occurrence of vitiation.
Table 5.3 The relationship between and ventilation condition.
Test Equivalence ratioa MLRPUA Ventilation conditionb
1 0.09 Continue to increase Well-ventilated fire
12 0.19 Continue to increase Well-ventilated fire
6 0.23 Continue to increase Well-ventilated fire
2 0.25 Continue to increase Well-ventilated fire
13 0.28 Continue to increase Well-ventilated fire
14 0.44 Continue to increase Well-ventilated fire
7 0.53 Continue to increase Well-ventilated fire
3 0.60 Start to decrease with an oscillation Under-ventilated fire
8 0.77 Start to decrease with an oscillation Under-ventilated fire
15 0.85 Start to decrease Under-ventilated fire
4 0.93 Start to decrease with an oscillation Under-ventilated fire
9 1.43 Start to decrease with an oscillation Under-ventilated fire
16 1.71 Start to decrease Under-ventilated fire
5 2.05 Start to decrease and then extinguish Under-ventilated fire a The equivalence ratio is from the critical time at the early stage of fire
b The ventilation condition only represents the situation at the early stage of fire
5.3.4 O2 volume fraction and optical density
Taking the heptane pool fires in the model-scale tunnel tests as an example, Fig.
5.7 shows the O2 volume fraction as a function of time at instrument station A at three
different heights of 0.3, 0.7 and 1.05 m above the floor. In Fig. 5.7(a)-(b), these fires
are well-ventilated with being 0.09 and 0.25, and the stratification phenomenon of
the O2 volume fraction at different heights is apparent. A shorter distance from the
floor corresponds to a higher O2 volume fraction, and vice versa, which indicates that
the vitiation doesn’t occur in the vicinity of the flame (at the floor level). However, as
shown in Fig. 5.7(c)-(d), these fires are under-ventilated with being 0.6 and 0.93,
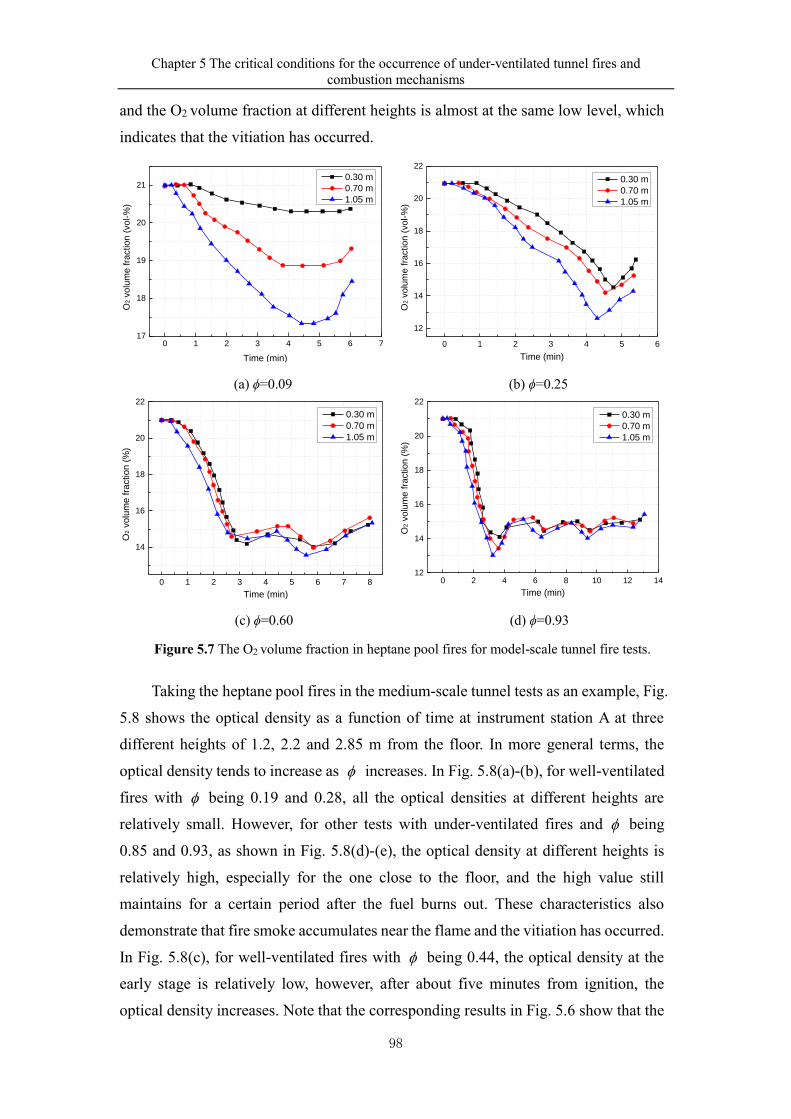
Chapter 5 The critical conditions for the occurrence of under-ventilated tunnel fires and
combustion mechanisms
98
and the O2 volume fraction at different heights is almost at the same low level, which
indicates that the vitiation has occurred.
0 1 2 3 4 5 6 717
18
19
20
21
O2 v
olu
me f
raction
(vo
l-%
)
Time (min)
0.30 m
0.70 m
1.05 m
0 1 2 3 4 5 6
12
14
16
18
20
22
O2 v
olu
me fra
ction
(vol-%
)
Time (min)
0.30 m
0.70 m
1.05 m
(a) ϕ=0.09 (b) ϕ=0.25
0 1 2 3 4 5 6 7 8
14
16
18
20
22
O2 v
olu
me fra
ction (
%)
Time (min)
0.30 m
0.70 m
1.05 m
0 2 4 6 8 10 12 1412
14
16
18
20
22
O2 v
olu
me f
raction
(%
)
Time (min)
0.30 m
0.70 m
1.05 m
(c) ϕ=0.60 (d) ϕ=0.93
Figure 5.7 The O2 volume fraction in heptane pool fires for model-scale tunnel fire tests.
Taking the heptane pool fires in the medium-scale tunnel tests as an example, Fig.
5.8 shows the optical density as a function of time at instrument station A at three
different heights of 1.2, 2.2 and 2.85 m from the floor. In more general terms, the
optical density tends to increase as increases. In Fig. 5.8(a)-(b), for well-ventilated
fires with being 0.19 and 0.28, all the optical densities at different heights are
relatively small. However, for other tests with under-ventilated fires and being
0.85 and 0.93, as shown in Fig. 5.8(d)-(e), the optical density at different heights is
relatively high, especially for the one close to the floor, and the high value still
maintains for a certain period after the fuel burns out. These characteristics also
demonstrate that fire smoke accumulates near the flame and the vitiation has occurred.
In Fig. 5.8(c), for well-ventilated fires with being 0.44, the optical density at the
early stage is relatively low, however, after about five minutes from ignition, the
optical density increases. Note that the corresponding results in Fig. 5.6 show that the
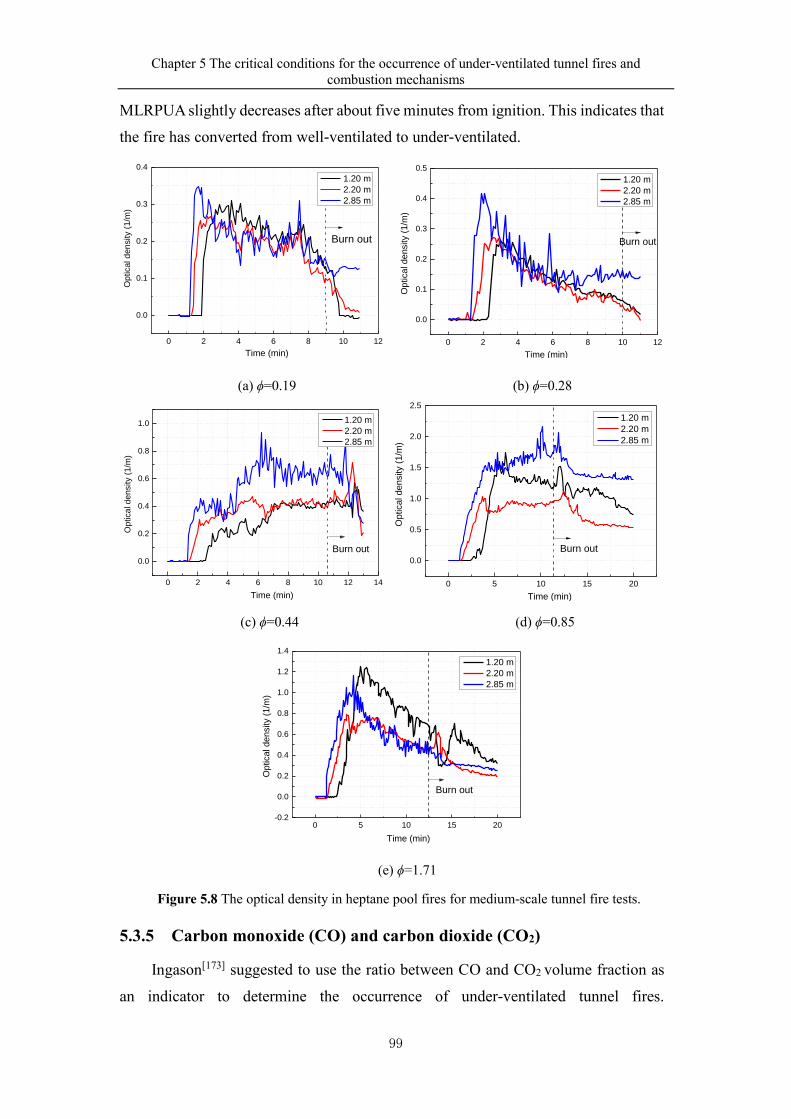
Chapter 5 The critical conditions for the occurrence of under-ventilated tunnel fires and
combustion mechanisms
99
MLRPUA slightly decreases after about five minutes from ignition. This indicates that
the fire has converted from well-ventilated to under-ventilated.
0 2 4 6 8 10 12
0.0
0.1
0.2
0.3
0.4
Optical density (
1/m
)
Time (min)
1.20 m
2.20 m
2.85 m
Burn out
0 2 4 6 8 10 12
0.0
0.1
0.2
0.3
0.4
0.5
Optical density (
1/m
)
Time (min)
1.20 m
2.20 m
2.85 m
Burn out
(a) ϕ=0.19 (b) ϕ=0.28
0 2 4 6 8 10 12 14
0.0
0.2
0.4
0.6
0.8
1.0
Burn out
Op
tica
l d
en
sity (
1/m
)
Time (min)
1.20 m
2.20 m
2.85 m
0 5 10 15 20
0.0
0.5
1.0
1.5
2.0
2.5
O
ptica
l de
nsity (
1/m
)
Time (min)
1.20 m
2.20 m
2.85 m
Burn out
(c) ϕ=0.44 (d) ϕ=0.85
0 5 10 15 20-0.2
0.0
0.2
0.4
0.6
0.8
1.0
1.2
1.4
Op
tica
l de
nsity (
1/m
)
Time (min)
1.20 m
2.20 m
2.85 m
Burn out
(e) ϕ=1.71
Figure 5.8 The optical density in heptane pool fires for medium-scale tunnel fire tests.
5.3.5 Carbon monoxide (CO) and carbon dioxide (CO2)
Ingason[173] suggested to use the ratio between CO and CO2 volume fraction as
an indicator to determine the occurrence of under-ventilated tunnel fires.
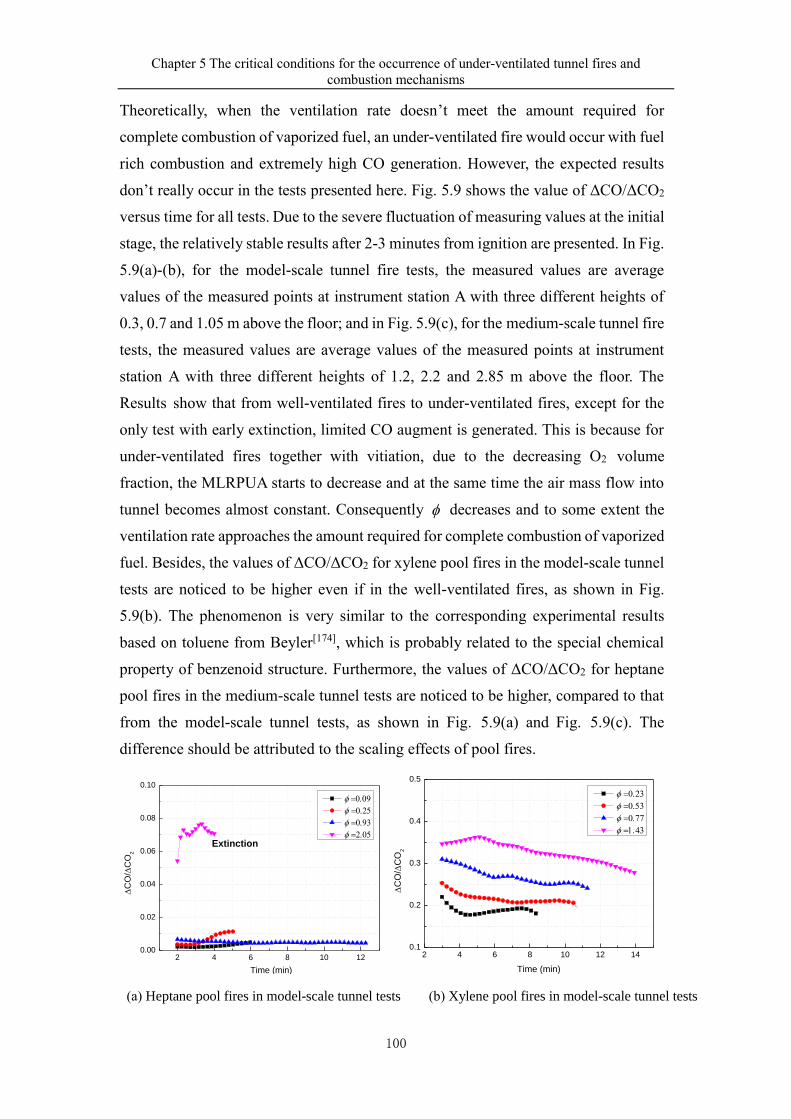
Chapter 5 The critical conditions for the occurrence of under-ventilated tunnel fires and
combustion mechanisms
100
Theoretically, when the ventilation rate doesn’t meet the amount required for
complete combustion of vaporized fuel, an under-ventilated fire would occur with fuel
rich combustion and extremely high CO generation. However, the expected results
don’t really occur in the tests presented here. Fig. 5.9 shows the value of ΔCO/ΔCO2
versus time for all tests. Due to the severe fluctuation of measuring values at the initial
stage, the relatively stable results after 2-3 minutes from ignition are presented. In Fig.
5.9(a)-(b), for the model-scale tunnel fire tests, the measured values are average
values of the measured points at instrument station A with three different heights of
0.3, 0.7 and 1.05 m above the floor; and in Fig. 5.9(c), for the medium-scale tunnel fire
tests, the measured values are average values of the measured points at instrument
station A with three different heights of 1.2, 2.2 and 2.85 m above the floor. The
Results show that from well-ventilated fires to under-ventilated fires, except for the
only test with early extinction, limited CO augment is generated. This is because for
under-ventilated fires together with vitiation, due to the decreasing O2 volume
fraction, the MLRPUA starts to decrease and at the same time the air mass flow into
tunnel becomes almost constant. Consequently decreases and to some extent the
ventilation rate approaches the amount required for complete combustion of vaporized
fuel. Besides, the values of ΔCO/ΔCO2 for xylene pool fires in the model-scale tunnel
tests are noticed to be higher even if in the well-ventilated fires, as shown in Fig.
5.9(b). The phenomenon is very similar to the corresponding experimental results
based on toluene from Beyler[174], which is probably related to the special chemical
property of benzenoid structure. Furthermore, the values of ΔCO/ΔCO2 for heptane
pool fires in the medium-scale tunnel tests are noticed to be higher, compared to that
from the model-scale tunnel tests, as shown in Fig. 5.9(a) and Fig. 5.9(c). The
difference should be attributed to the scaling effects of pool fires.
2 4 6 8 10 120.00
0.02
0.04
0.06
0.08
0.10
C
O/
CO
2
Time (min)
=
=
=
=Extinction
2 4 6 8 10 12 14
0.1
0.2
0.3
0.4
0.5
C
O/
CO
2
Time (min)
=
=
=
=
(a) Heptane pool fires in model-scale tunnel tests (b) Xylene pool fires in model-scale tunnel tests
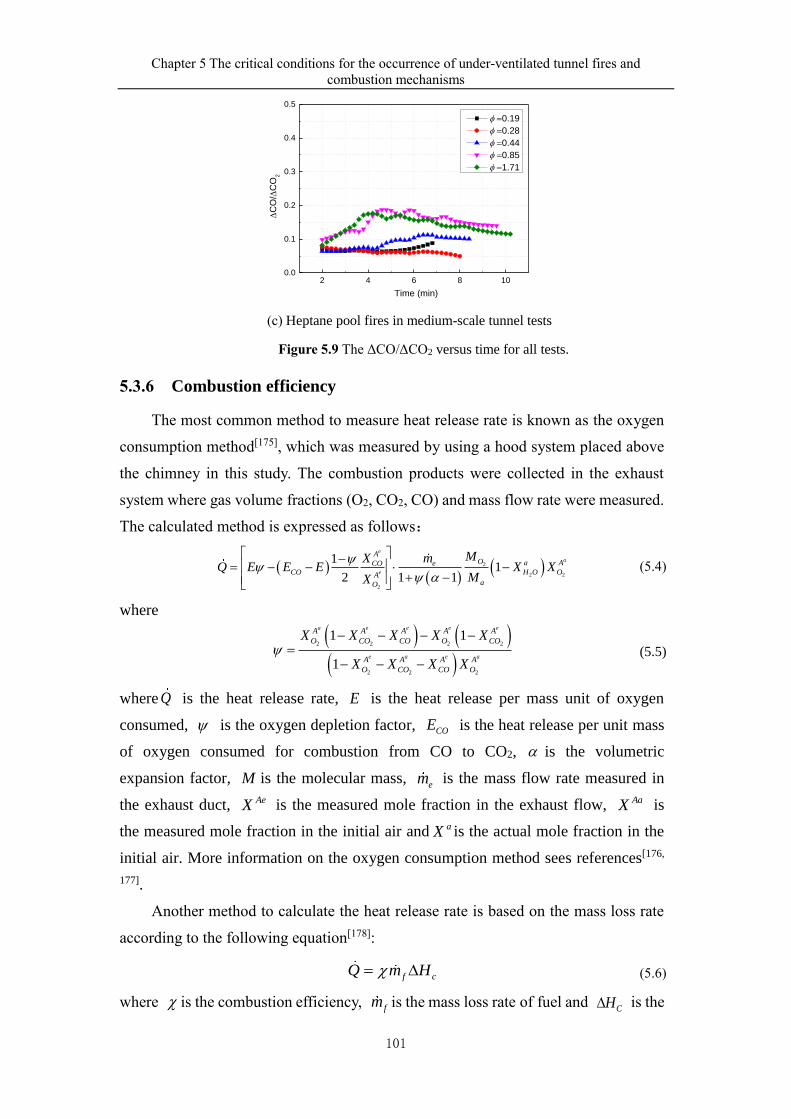
Chapter 5 The critical conditions for the occurrence of under-ventilated tunnel fires and
combustion mechanisms
101
2 4 6 8 10
0.0
0.1
0.2
0.3
0.4
0.5
C
O/
CO
2
Time (min)
=0.19
=0.28
=0.44
=0.85
=1.71
(c) Heptane pool fires in medium-scale tunnel tests
Figure 5.9 The ΔCO/ΔCO2 versus time for all tests.
5.3.6 Combustion efficiency
The most common method to measure heat release rate is known as the oxygen
consumption method[175], which was measured by using a hood system placed above
the chimney in this study. The combustion products were collected in the exhaust
system where gas volume fractions (O2, CO2, CO) and mass flow rate were measured.
The calculated method is expressed as follows:
( )( )
( )2
2 2
2
11
2 1 1
e
a
e
AO a ACO e
CO H O OAaO
MX mQ E E E X X
MX
− = − − −
+ −
(5.4)
where
( ) ( )( )
2 2 2 2
2 2 2
1 1
1
a e e e e
e a e a
A A A A A
O CO CO O CO
A A A A
O CO CO O
X X X X X
X X X X
− − − −=
− − − (5.5)
where Q is the heat release rate, E is the heat release per mass unit of oxygen
consumed, is the oxygen depletion factor, COE is the heat release per unit mass
of oxygen consumed for combustion from CO to CO2, is the volumetric
expansion factor, M is the molecular mass, em is the mass flow rate measured in
the exhaust duct, AeX is the measured mole fraction in the exhaust flow, AaX is
the measured mole fraction in the initial air and aX is the actual mole fraction in the
initial air. More information on the oxygen consumption method sees references[176,
177].
Another method to calculate the heat release rate is based on the mass loss rate
according to the following equation[178]:
f cQ m H= (5.6)
where is the combustion efficiency, fm is the mass loss rate of fuel and CH is the
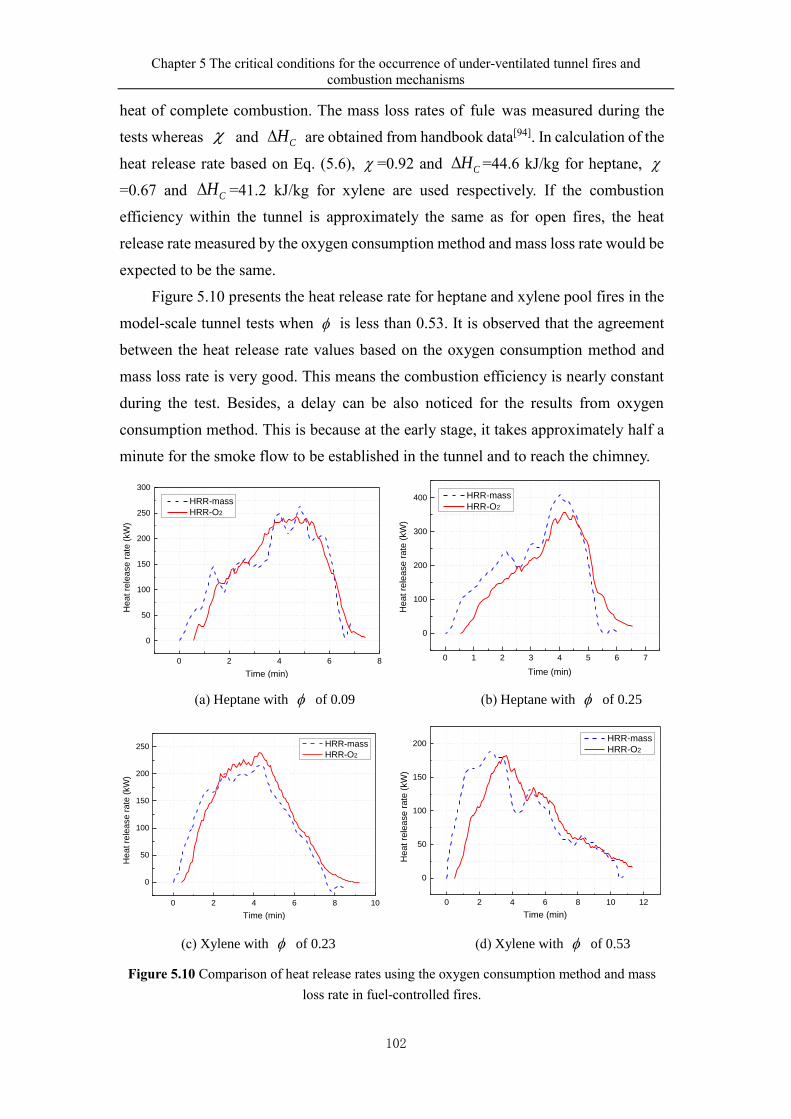
Chapter 5 The critical conditions for the occurrence of under-ventilated tunnel fires and
combustion mechanisms
102
heat of complete combustion. The mass loss rates of fule was measured during the
tests whereas and CH are obtained from handbook data[94]. In calculation of the
heat release rate based on Eq. (5.6), =0.92 and CH =44.6 kJ/kg for heptane,
=0.67 and CH =41.2 kJ/kg for xylene are used respectively. If the combustion
efficiency within the tunnel is approximately the same as for open fires, the heat
release rate measured by the oxygen consumption method and mass loss rate would be
expected to be the same.
Figure 5.10 presents the heat release rate for heptane and xylene pool fires in the
model-scale tunnel tests when is less than 0.53. It is observed that the agreement
between the heat release rate values based on the oxygen consumption method and
mass loss rate is very good. This means the combustion efficiency is nearly constant
during the test. Besides, a delay can be also noticed for the results from oxygen
consumption method. This is because at the early stage, it takes approximately half a
minute for the smoke flow to be established in the tunnel and to reach the chimney.
0 2 4 6 8
0
50
100
150
200
250
300
Heat re
lease r
ate
(kW
)
Time (min)
HRR-mass
HRR-O2
0 1 2 3 4 5 6 7
0
100
200
300
400
He
at re
lea
se r
ate
(kW
)
Time (min)
HRR-mass
HRR-O2
(a) Heptane with of 0.09 (b) Heptane with of 0.25
0 2 4 6 8 10
0
50
100
150
200
250
Heat re
lease r
ate
(kW
)
Time (min)
HRR-mass
HRR-O2
0 2 4 6 8 10 12
0
50
100
150
200
Heat re
lease r
ate
(kW
)
Time (min)
HRR-mass
HRR-O2
(c) Xylene with of 0.23 (d) Xylene with of 0.53
Figure 5.10 Comparison of heat release rates using the oxygen consumption method and mass
loss rate in fuel-controlled fires.
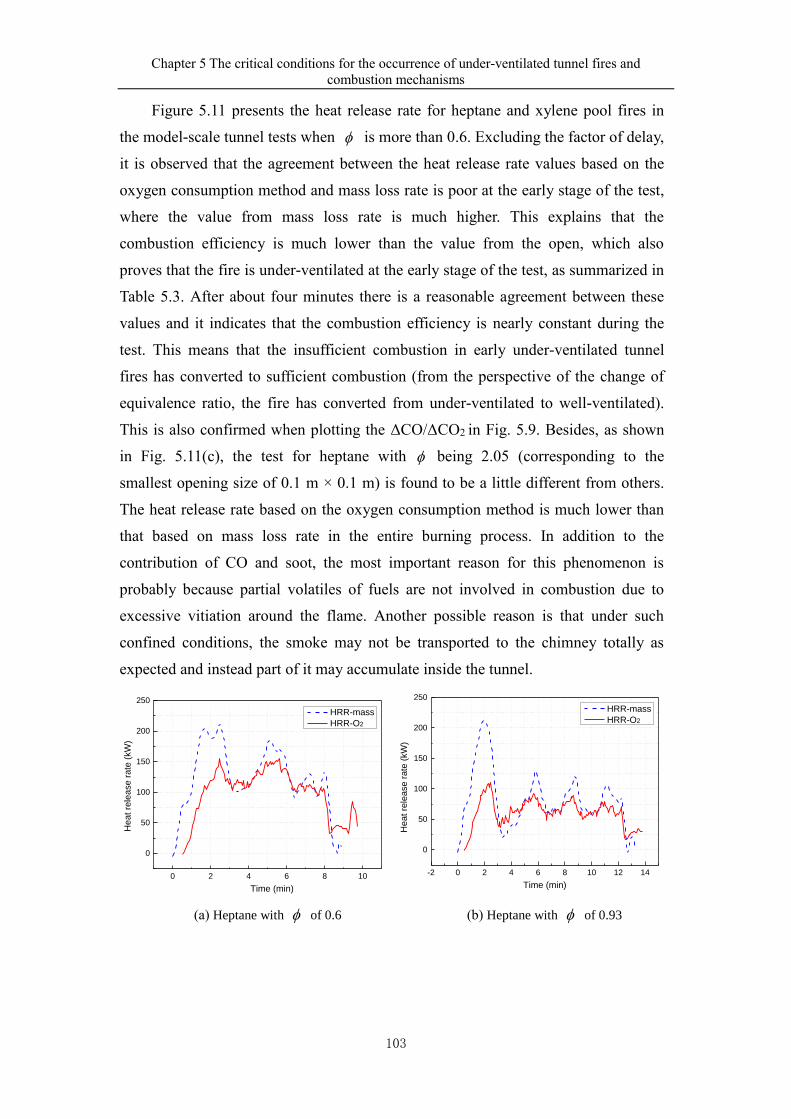
Chapter 5 The critical conditions for the occurrence of under-ventilated tunnel fires and
combustion mechanisms
103
Figure 5.11 presents the heat release rate for heptane and xylene pool fires in
the model-scale tunnel tests when is more than 0.6. Excluding the factor of delay,
it is observed that the agreement between the heat release rate values based on the
oxygen consumption method and mass loss rate is poor at the early stage of the test,
where the value from mass loss rate is much higher. This explains that the
combustion efficiency is much lower than the value from the open, which also
proves that the fire is under-ventilated at the early stage of the test, as summarized in
Table 5.3. After about four minutes there is a reasonable agreement between these
values and it indicates that the combustion efficiency is nearly constant during the
test. This means that the insufficient combustion in early under-ventilated tunnel
fires has converted to sufficient combustion (from the perspective of the change of
equivalence ratio, the fire has converted from under-ventilated to well-ventilated).
This is also confirmed when plotting the ΔCO/ΔCO2 in Fig. 5.9. Besides, as shown
in Fig. 5.11(c), the test for heptane with being 2.05 (corresponding to the
smallest opening size of 0.1 m × 0.1 m) is found to be a little different from others.
The heat release rate based on the oxygen consumption method is much lower than
that based on mass loss rate in the entire burning process. In addition to the
contribution of CO and soot, the most important reason for this phenomenon is
probably because partial volatiles of fuels are not involved in combustion due to
excessive vitiation around the flame. Another possible reason is that under such
confined conditions, the smoke may not be transported to the chimney totally as
expected and instead part of it may accumulate inside the tunnel.
0 2 4 6 8 10
0
50
100
150
200
250
Heat re
lease r
ate
(kW
)
Time (min)
HRR-mass
HRR-O2
-2 0 2 4 6 8 10 12 14
0
50
100
150
200
250
Heat re
lease r
ate
(kW
)
Time (min)
HRR-mass
HRR-O2
(a) Heptane with of 0.6 (b) Heptane with of 0.93
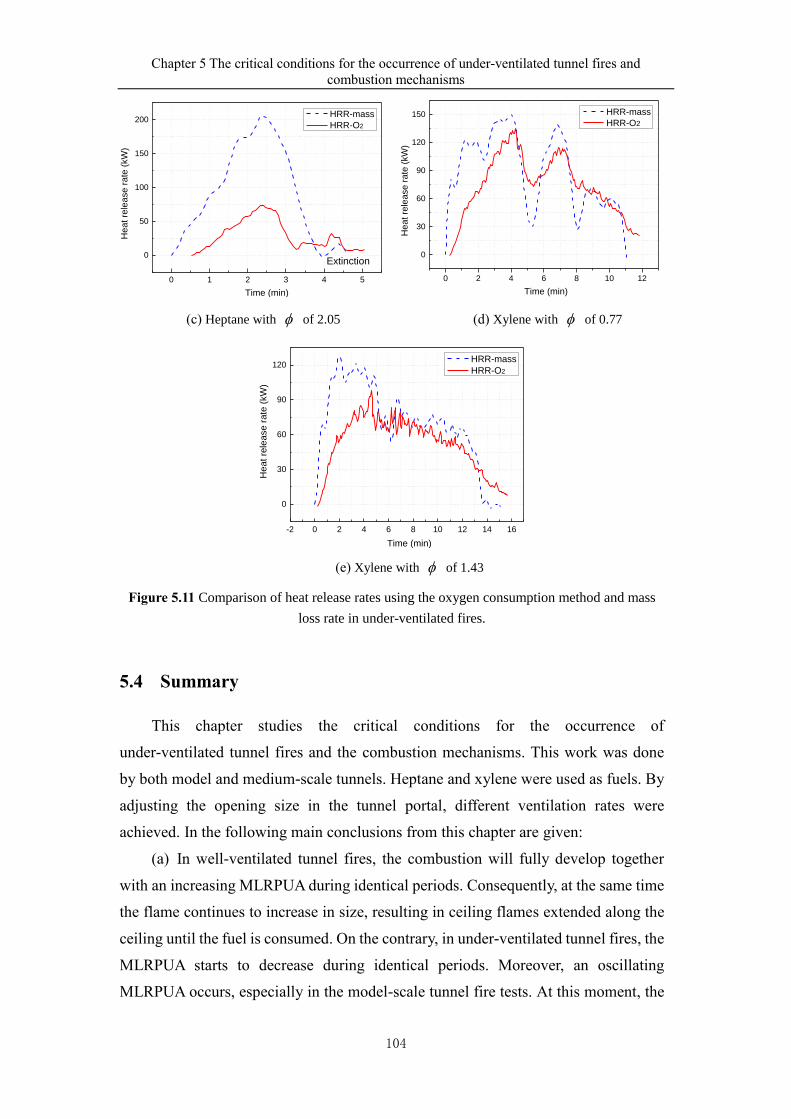
Chapter 5 The critical conditions for the occurrence of under-ventilated tunnel fires and
combustion mechanisms
104
0 1 2 3 4 5
0
50
100
150
200
Heat re
lease r
ate
(kW
)
Time (min)
HRR-mass
HRR-O2
Extinction
0 2 4 6 8 10 12
0
30
60
90
120
150
He
at re
lea
se r
ate
(kW
)
Time (min)
HRR-mass
HRR-O2
(c) Heptane with of 2.05 (d) Xylene with of 0.77
-2 0 2 4 6 8 10 12 14 16
0
30
60
90
120
Heat re
lease r
ate
(kW
)
Time (min)
HRR-mass
HRR-O2
(e) Xylene with of 1.43
Figure 5.11 Comparison of heat release rates using the oxygen consumption method and mass
loss rate in under-ventilated fires.
5.4 Summary
This chapter studies the critical conditions for the occurrence of
under-ventilated tunnel fires and the combustion mechanisms. This work was done
by both model and medium-scale tunnels. Heptane and xylene were used as fuels. By
adjusting the opening size in the tunnel portal, different ventilation rates were
achieved. In the following main conclusions from this chapter are given:
(a) In well-ventilated tunnel fires, the combustion will fully develop together
with an increasing MLRPUA during identical periods. Consequently, at the same time
the flame continues to increase in size, resulting in ceiling flames extended along the
ceiling until the fuel is consumed. On the contrary, in under-ventilated tunnel fires, the
MLRPUA starts to decrease during identical periods. Moreover, an oscillating
MLRPUA occurs, especially in the model-scale tunnel fire tests. At this moment, the
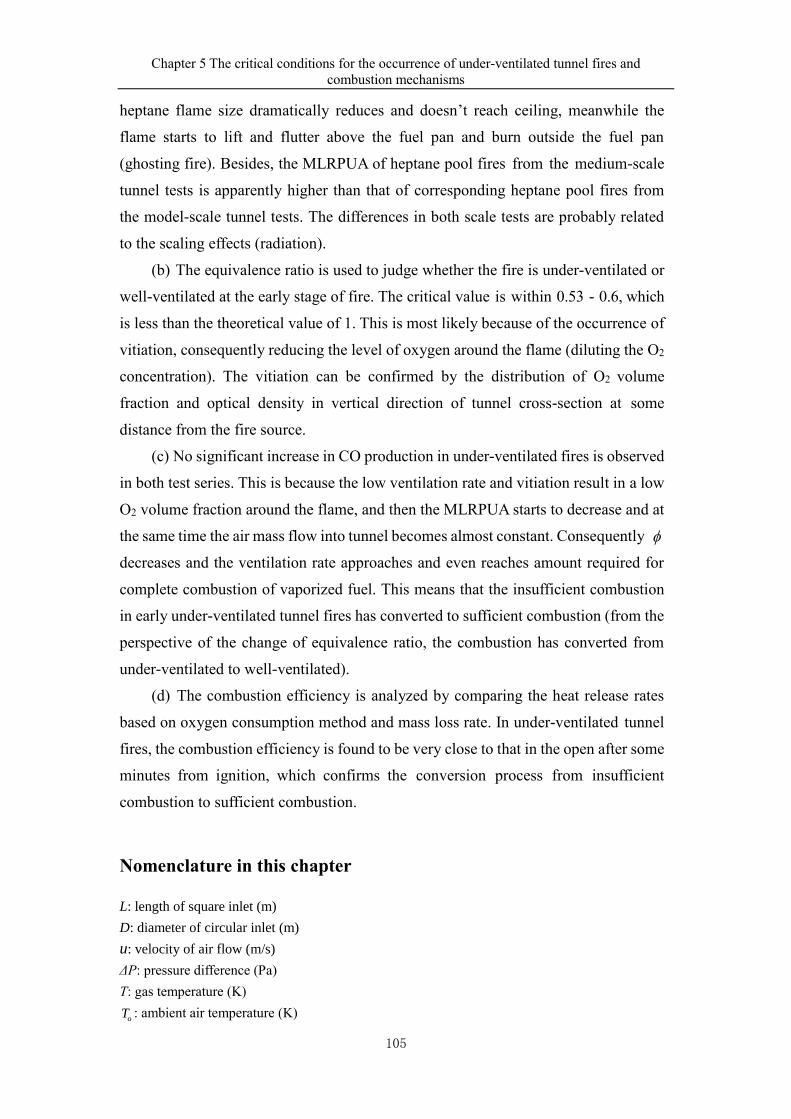
Chapter 5 The critical conditions for the occurrence of under-ventilated tunnel fires and
combustion mechanisms
105
heptane flame size dramatically reduces and doesn’t reach ceiling, meanwhile the
flame starts to lift and flutter above the fuel pan and burn outside the fuel pan
(ghosting fire). Besides, the MLRPUA of heptane pool fires from the medium-scale
tunnel tests is apparently higher than that of corresponding heptane pool fires from
the model-scale tunnel tests. The differences in both scale tests are probably related
to the scaling effects (radiation).
(b) The equivalence ratio is used to judge whether the fire is under-ventilated or
well-ventilated at the early stage of fire. The critical value is within 0.53 - 0.6, which
is less than the theoretical value of 1. This is most likely because of the occurrence of
vitiation, consequently reducing the level of oxygen around the flame (diluting the O2
concentration). The vitiation can be confirmed by the distribution of O2 volume
fraction and optical density in vertical direction of tunnel cross-section at some
distance from the fire source.
(c) No significant increase in CO production in under-ventilated fires is observed
in both test series. This is because the low ventilation rate and vitiation result in a low
O2 volume fraction around the flame, and then the MLRPUA starts to decrease and at
the same time the air mass flow into tunnel becomes almost constant. Consequently
decreases and the ventilation rate approaches and even reaches amount required for
complete combustion of vaporized fuel. This means that the insufficient combustion
in early under-ventilated tunnel fires has converted to sufficient combustion (from the
perspective of the change of equivalence ratio, the combustion has converted from
under-ventilated to well-ventilated).
(d) The combustion efficiency is analyzed by comparing the heat release rates
based on oxygen consumption method and mass loss rate. In under-ventilated tunnel
fires, the combustion efficiency is found to be very close to that in the open after some
minutes from ignition, which confirms the conversion process from insufficient
combustion to sufficient combustion.
Nomenclature in this chapter
L: length of square inlet (m)
D: diameter of circular inlet (m)
u: velocity of air flow (m/s)
ΔP: pressure difference (Pa)
T: gas temperature (K)
oT : ambient air temperature (K)
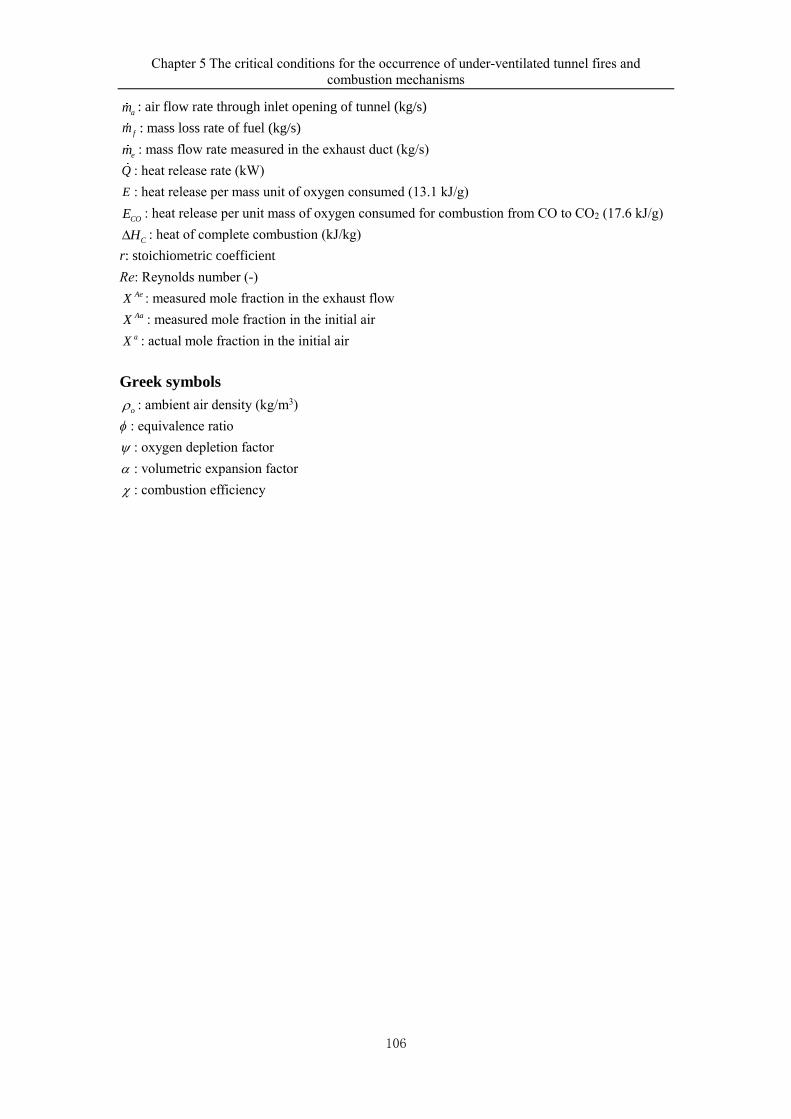
Chapter 5 The critical conditions for the occurrence of under-ventilated tunnel fires and
combustion mechanisms
106
am : air flow rate through inlet opening of tunnel (kg/s)
fm : mass loss rate of fuel (kg/s)
em : mass flow rate measured in the exhaust duct (kg/s)
Q : heat release rate (kW)
E : heat release per mass unit of oxygen consumed (13.1 kJ/g)
COE : heat release per unit mass of oxygen consumed for combustion from CO to CO2 (17.6 kJ/g)
CH : heat of complete combustion (kJ/kg)
r: stoichiometric coefficient
Re: Reynolds number (-) AeX : measured mole fraction in the exhaust flow AaX : measured mole fraction in the initial air aX : actual mole fraction in the initial air
Greek symbols
o : ambient air density (kg/m3)
ϕ : equivalence ratio
: oxygen depletion factor
: volumetric expansion factor
: combustion efficiency
Chapter 6 The critical conditions for the occurrence of self-extinguishment and influencing factors
in tunnel fires
107
Chapter 6
The critical conditions for the occurrence of
self-extinguishment and influencing factors in tunnel fires
6.1 Introduction
When constructing a tunnel, however, very often special access tunnels or
entrance tunnels are constructed. This access tunnel itself is not a part of the final
tunnel system but is needed to easy access to the tunnel system. The debris from the
blasting is also transported through the access tunnels. To limit the length of the
access tunnel it is often designed to be relatively steep. In reality, the slope of access
tunnel is usually different in per actual tunnel during construction and it also
depends on the geological conditions and ground conditions. It is known that during
construction of a tunnel, the only opening is from one side of the access tunnel that
connects to the ground at the same time both ends of the horizontal main tunnel are
closed until breakthrough[179].
For a tunnel fire during construction, the fire characteristics are probably
different from those in the completed tunnel. Meanwhile, the ways of evacuation and
fighting fire, as well as selections of safety equipments are also different. As a result,
the hazards of fires during construction of a tunnel can be higher those that during
the normal use of the complete tunnel[180]. The consequences of these fires depend
not only on where they occurs in the tunnel, but also on their intensity, the nature of
the fire, underground facilities complexity, response of the rescue service, and
resources in the form of personnel and equipment. Understanding the tunnel fire
characteristics during construction is of great importance for managing fire control
and evacuation. However, the available knowledge is limited[179-183]. One could
expect that the fire is more likely to be under-ventilated (ventilation-controlled) due
to the complex tunnel system and due to single portal opening.
Therefore, this chapter studies the characteristics of tunnel fires during
construction in a model-scale tunnel built by lönnermark et al[179]. The detailed
influences of ventilation rate, fuel type, fire size, fire location, tunnel slope and some
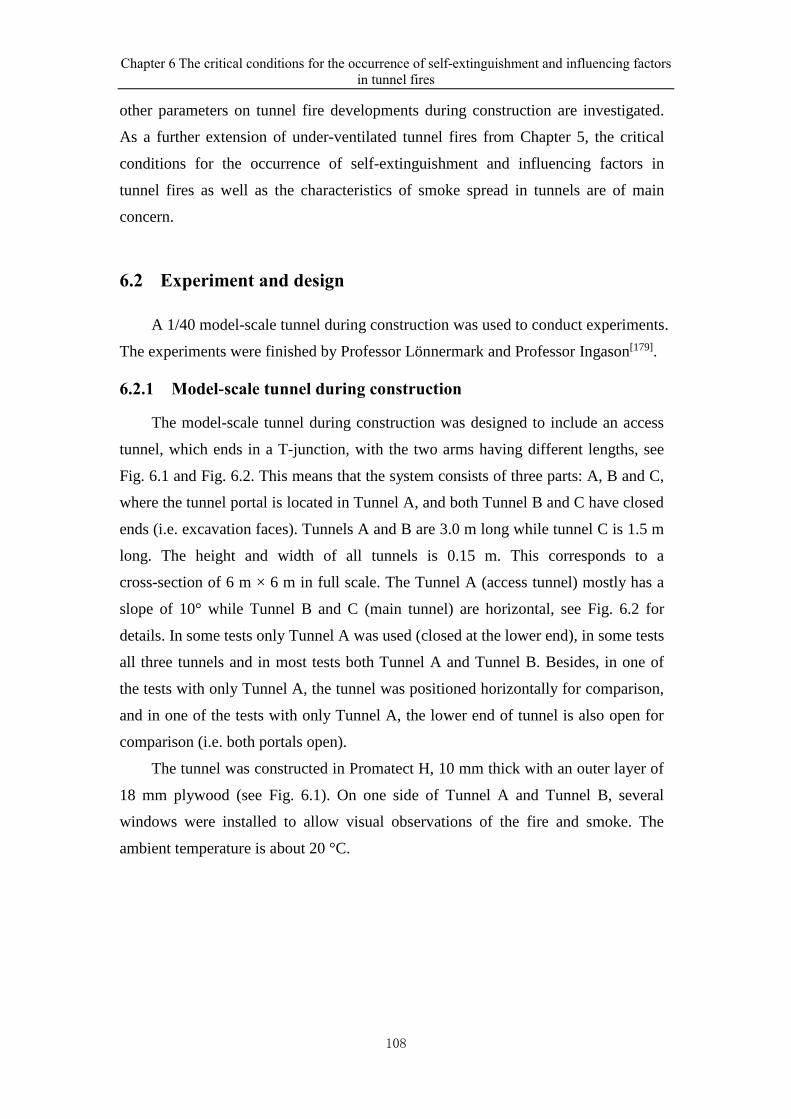
Chapter 6 The critical conditions for the occurrence of self-extinguishment and influencing factors
in tunnel fires
108
other parameters on tunnel fire developments during construction are investigated.
As a further extension of under-ventilated tunnel fires from Chapter 5, the critical
conditions for the occurrence of self-extinguishment and influencing factors in
tunnel fires as well as the characteristics of smoke spread in tunnels are of main
concern.
6.2 Experiment and design
A 1/40 model-scale tunnel during construction was used to conduct experiments.
The experiments were finished by Professor Lönnermark and Professor Ingason[179].
6.2.1 Model-scale tunnel during construction
The model-scale tunnel during construction was designed to include an access
tunnel, which ends in a T-junction, with the two arms having different lengths, see
Fig. 6.1 and Fig. 6.2. This means that the system consists of three parts: A, B and C,
where the tunnel portal is located in Tunnel A, and both Tunnel B and C have closed
ends (i.e. excavation faces). Tunnels A and B are 3.0 m long while tunnel C is 1.5 m
long. The height and width of all tunnels is 0.15 m. This corresponds to a
cross-section of 6 m × 6 m in full scale. The Tunnel A (access tunnel) mostly has a
slope of 10° while Tunnel B and C (main tunnel) are horizontal, see Fig. 6.2 for
details. In some tests only Tunnel A was used (closed at the lower end), in some tests
all three tunnels and in most tests both Tunnel A and Tunnel B. Besides, in one of
the tests with only Tunnel A, the tunnel was positioned horizontally for comparison,
and in one of the tests with only Tunnel A, the lower end of tunnel is also open for
comparison (i.e. both portals open).
The tunnel was constructed in Promatect H, 10 mm thick with an outer layer of
18 mm plywood (see Fig. 6.1). On one side of Tunnel A and Tunnel B, several
windows were installed to allow visual observations of the fire and smoke. The
ambient temperature is about 20 °C.
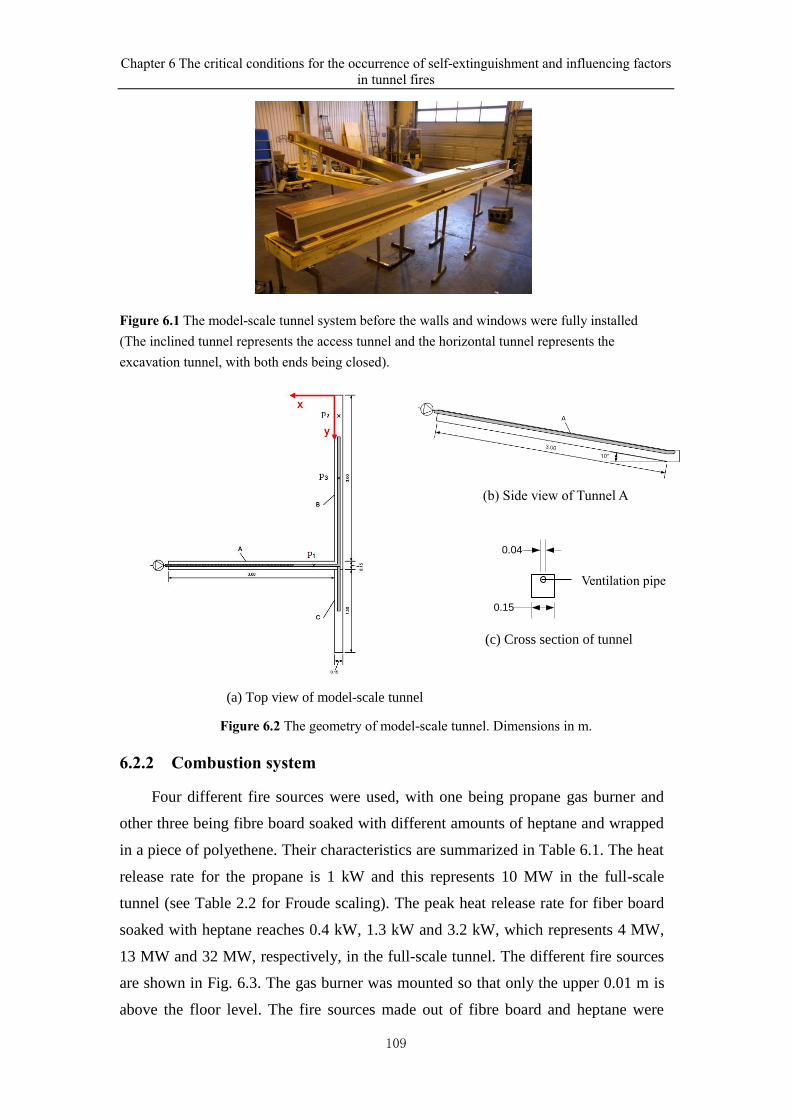
Chapter 6 The critical conditions for the occurrence of self-extinguishment and influencing factors
in tunnel fires
109
Figure 6.1 The model-scale tunnel system before the walls and windows were fully installed
(The inclined tunnel represents the access tunnel and the horizontal tunnel represents the
excavation tunnel, with both ends being closed).
(a) Top view of model-scale tunnel
Figure 6.2 The geometry of model-scale tunnel. Dimensions in m.
6.2.2 Combustion system
Four different fire sources were used, with one being propane gas burner and
other three being fibre board soaked with different amounts of heptane and wrapped
in a piece of polyethene. Their characteristics are summarized in Table 6.1. The heat
release rate for the propane is 1 kW and this represents 10 MW in the full-scale
tunnel (see Table 2.2 for Froude scaling). The peak heat release rate for fiber board
soaked with heptane reaches 0.4 kW, 1.3 kW and 3.2 kW, which represents 4 MW,
13 MW and 32 MW, respectively, in the full-scale tunnel. The different fire sources
are shown in Fig. 6.3. The gas burner was mounted so that only the upper 0.01 m is
above the floor level. The fire sources made out of fibre board and heptane were
(b) Side view of Tunnel A
(c) Cross section of tunnel
0.15
0.04
Ventilation pipe
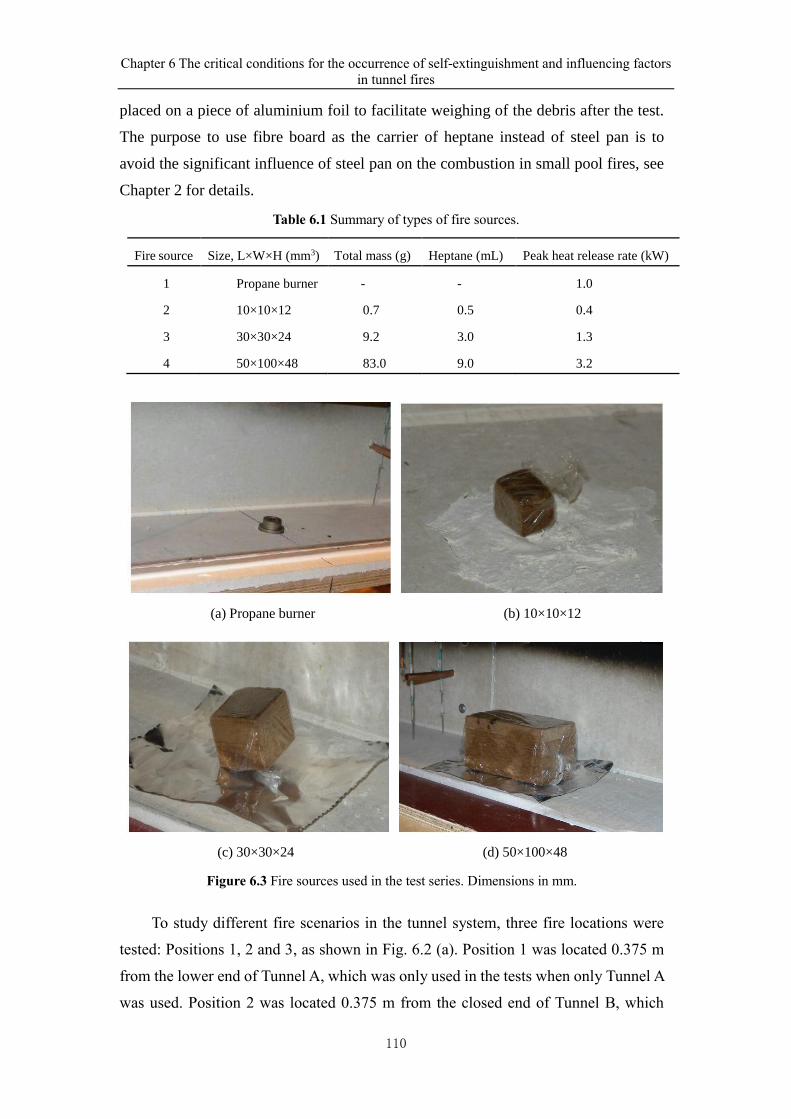
Chapter 6 The critical conditions for the occurrence of self-extinguishment and influencing factors
in tunnel fires
110
placed on a piece of aluminium foil to facilitate weighing of the debris after the test.
The purpose to use fibre board as the carrier of heptane instead of steel pan is to
avoid the significant influence of steel pan on the combustion in small pool fires, see
Chapter 2 for details.
Table 6.1 Summary of types of fire sources.
Fire source Size, L×W×H (mm3) Total mass (g) Heptane (mL) Peak heat release rate (kW)
1 Propane burner - - 1.0
2 10×10×12 0.7 0.5 0.4
3 30×30×24 9.2 3.0 1.3
4 50×100×48 83.0 9.0 3.2
(a) Propane burner (b) 10×10×12
(c) 30×30×24 (d) 50×100×48
Figure 6.3 Fire sources used in the test series. Dimensions in mm.
To study different fire scenarios in the tunnel system, three fire locations were
tested: Positions 1, 2 and 3, as shown in Fig. 6.2 (a). Position 1 was located 0.375 m
from the lower end of Tunnel A, which was only used in the tests when only Tunnel A
was used. Position 2 was located 0.375 m from the closed end of Tunnel B, which
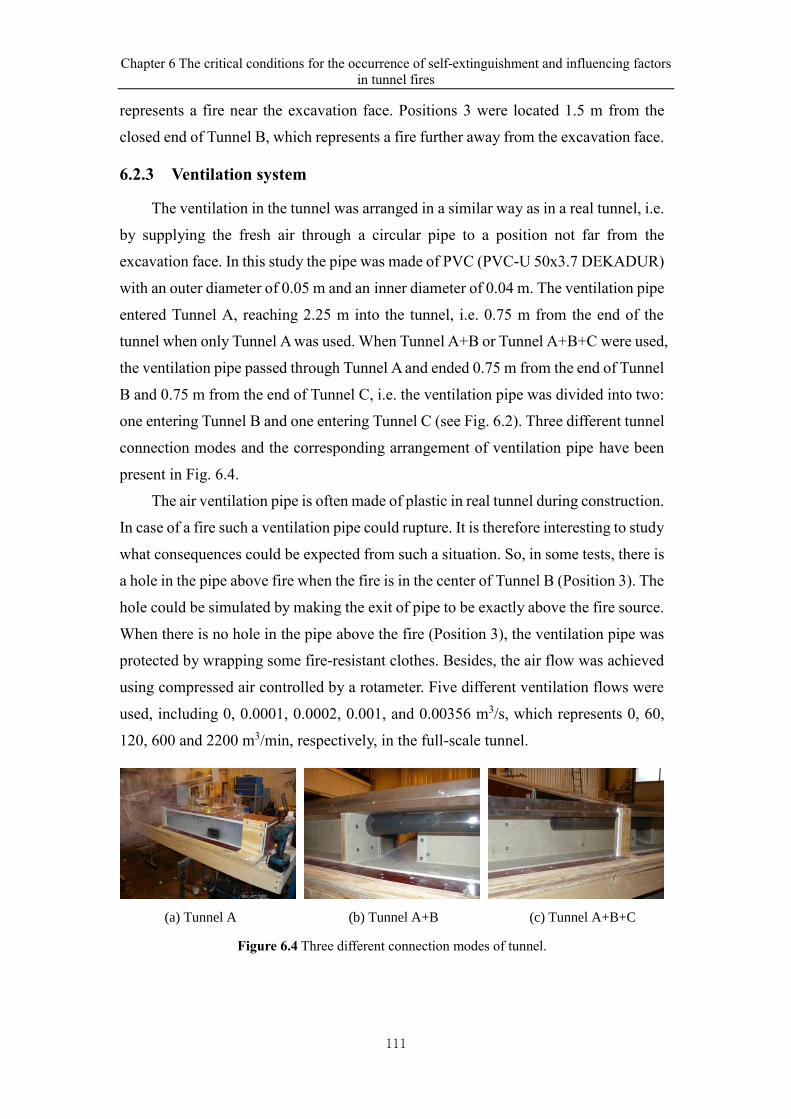
Chapter 6 The critical conditions for the occurrence of self-extinguishment and influencing factors
in tunnel fires
111
represents a fire near the excavation face. Positions 3 were located 1.5 m from the
closed end of Tunnel B, which represents a fire further away from the excavation face.
6.2.3 Ventilation system
The ventilation in the tunnel was arranged in a similar way as in a real tunnel, i.e.
by supplying the fresh air through a circular pipe to a position not far from the
excavation face. In this study the pipe was made of PVC (PVC-U 50x3.7 DEKADUR)
with an outer diameter of 0.05 m and an inner diameter of 0.04 m. The ventilation pipe
entered Tunnel A, reaching 2.25 m into the tunnel, i.e. 0.75 m from the end of the
tunnel when only Tunnel A was used. When Tunnel A+B or Tunnel A+B+C were used,
the ventilation pipe passed through Tunnel A and ended 0.75 m from the end of Tunnel
B and 0.75 m from the end of Tunnel C, i.e. the ventilation pipe was divided into two:
one entering Tunnel B and one entering Tunnel C (see Fig. 6.2). Three different tunnel
connection modes and the corresponding arrangement of ventilation pipe have been
present in Fig. 6.4.
The air ventilation pipe is often made of plastic in real tunnel during construction.
In case of a fire such a ventilation pipe could rupture. It is therefore interesting to study
what consequences could be expected from such a situation. So, in some tests, there is
a hole in the pipe above fire when the fire is in the center of Tunnel B (Position 3). The
hole could be simulated by making the exit of pipe to be exactly above the fire source.
When there is no hole in the pipe above the fire (Position 3), the ventilation pipe was
protected by wrapping some fire-resistant clothes. Besides, the air flow was achieved
using compressed air controlled by a rotameter. Five different ventilation flows were
used, including 0, 0.0001, 0.0002, 0.001, and 0.00356 m3/s, which represents 0, 60,
120, 600 and 2200 m3/min, respectively, in the full-scale tunnel.
(a) Tunnel A (b) Tunnel A+B (c) Tunnel A+B+C
Figure 6.4 Three different connection modes of tunnel.
Chapter 6 The critical conditions for the occurrence of self-extinguishment and influencing factors
in tunnel fires
112
6.2.4 Measurement system
In addition to visual observations, a number of measurements were performed
during the tests, including O2 and CO volume fractions, and gas temperature. The
probes for gas sampling were placed 0.188 m after and before the fire, i.e. 0.187 m and
0.563 m at the centerline, respectively, from the end of the tunnel when the fire is in
that position. In Tunnel B a third position 1.687 m from the end of the tunnel was used.
The height of the measurement is 0.075 m, i.e. half of the tunnel height. Temperatures
were measured with thermocouples (type K, 0.25 mm) both near the ceiling along the
tunnel (13 mm beneath the ceiling) and in thermocouple trees in selected positions.
The thermocouple trees have five thermocouples at heights: 13, 50, 75, 100 and 125
mm, measured from the ceiling (or 25, 50, 75, 100 and 137 mm from the floor). Due to
the existence of ventilation pipe along the centerline, most of the thermocouples were
placed on one side of the tunnel, which is described as “Left” side (by looking from
the fire towards the opening). These positions were located 50 mm from the centerline,
i.e., 25 mm from the wall. A detailed description of the measurement positions are
given in Table 6.2.
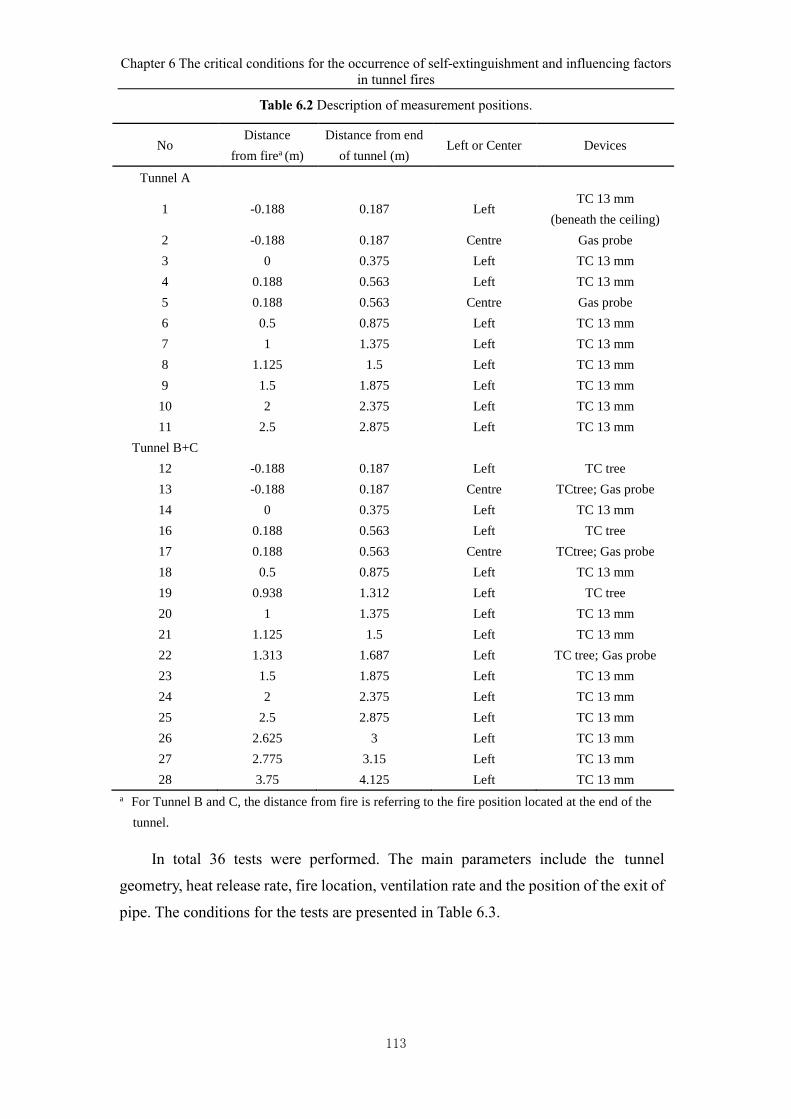
Chapter 6 The critical conditions for the occurrence of self-extinguishment and influencing factors
in tunnel fires
113
Table 6.2 Description of measurement positions.
No Distance
from firea (m)
Distance from end
of tunnel (m) Left or Center Devices
Tunnel A
1 -0.188 0.187 Left TC 13 mm
(beneath the ceiling)
2 -0.188 0.187 Centre Gas probe
3 0 0.375 Left TC 13 mm
4 0.188 0.563 Left TC 13 mm
5 0.188 0.563 Centre Gas probe
6 0.5 0.875 Left TC 13 mm
7 1 1.375 Left TC 13 mm
8 1.125 1.5 Left TC 13 mm
9 1.5 1.875 Left TC 13 mm
10 2 2.375 Left TC 13 mm
11 2.5 2.875 Left TC 13 mm
Tunnel B+C
12 -0.188 0.187 Left TC tree
13 -0.188 0.187 Centre TCtree; Gas probe
14 0 0.375 Left TC 13 mm
16 0.188 0.563 Left TC tree
17 0.188 0.563 Centre TCtree; Gas probe
18 0.5 0.875 Left TC 13 mm
19 0.938 1.312 Left TC tree
20 1 1.375 Left TC 13 mm
21 1.125 1.5 Left TC 13 mm
22 1.313 1.687 Left TC tree; Gas probe
23 1.5 1.875 Left TC 13 mm
24 2 2.375 Left TC 13 mm
25 2.5 2.875 Left TC 13 mm
26 2.625 3 Left TC 13 mm
27 2.775 3.15 Left TC 13 mm
28 3.75 4.125 Left TC 13 mm
a For Tunnel B and C, the distance from fire is referring to the fire position located at the end of the
tunnel.
In total 36 tests were performed. The main parameters include the tunnel
geometry, heat release rate, fire location, ventilation rate and the position of the exit of
pipe. The conditions for the tests are presented in Table 6.3.
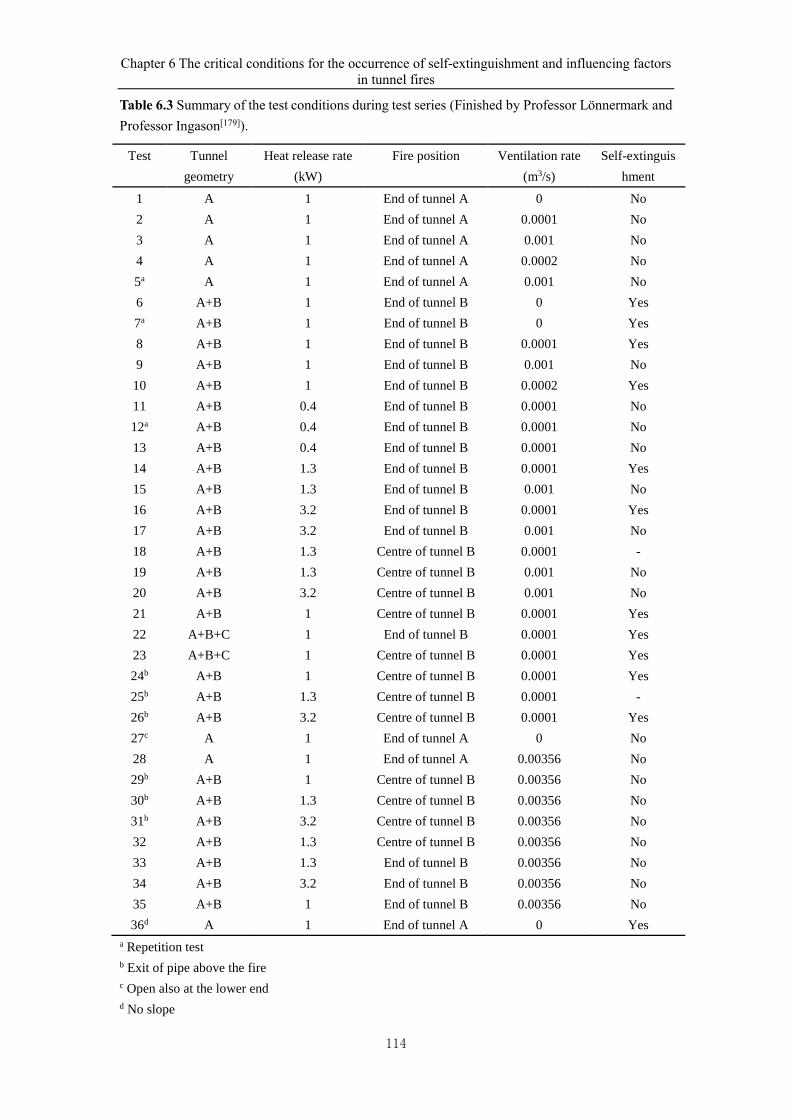
Chapter 6 The critical conditions for the occurrence of self-extinguishment and influencing factors
in tunnel fires
114
Table 6.3 Summary of the test conditions during test series (Finished by Professor Lönnermark and
Professor Ingason[179]).
Test Tunnel
geometry
Heat release rate
(kW)
Fire position Ventilation rate
(m3/s)
Self-extinguis
hment
1 A 1 End of tunnel A 0 No
2 A 1 End of tunnel A 0.0001 No
3 A 1 End of tunnel A 0.001 No
4 A 1 End of tunnel A 0.0002 No
5a A 1 End of tunnel A 0.001 No
6 A+B 1 End of tunnel B 0 Yes
7a A+B 1 End of tunnel B 0 Yes
8 A+B 1 End of tunnel B 0.0001 Yes
9 A+B 1 End of tunnel B 0.001 No
10 A+B 1 End of tunnel B 0.0002 Yes
11 A+B 0.4 End of tunnel B 0.0001 No
12a A+B 0.4 End of tunnel B 0.0001 No
13 A+B 0.4 End of tunnel B 0.0001 No
14 A+B 1.3 End of tunnel B 0.0001 Yes
15 A+B 1.3 End of tunnel B 0.001 No
16 A+B 3.2 End of tunnel B 0.0001 Yes
17 A+B 3.2 End of tunnel B 0.001 No
18 A+B 1.3 Centre of tunnel B 0.0001 -
19 A+B 1.3 Centre of tunnel B 0.001 No
20 A+B 3.2 Centre of tunnel B 0.001 No
21 A+B 1 Centre of tunnel B 0.0001 Yes
22 A+B+C 1 End of tunnel B 0.0001 Yes
23 A+B+C 1 Centre of tunnel B 0.0001 Yes
24b A+B 1 Centre of tunnel B 0.0001 Yes
25b A+B 1.3 Centre of tunnel B 0.0001 -
26b A+B 3.2 Centre of tunnel B 0.0001 Yes
27c A 1 End of tunnel A 0 No
28 A 1 End of tunnel A 0.00356 No
29b A+B 1 Centre of tunnel B 0.00356 No
30b A+B 1.3 Centre of tunnel B 0.00356 No
31b A+B 3.2 Centre of tunnel B 0.00356 No
32 A+B 1.3 Centre of tunnel B 0.00356 No
33 A+B 1.3 End of tunnel B 0.00356 No
34 A+B 3.2 End of tunnel B 0.00356 No
35 A+B 1 End of tunnel B 0.00356 No
36d A 1 End of tunnel A 0 Yes
a Repetition test
b Exit of pipe above the fire
c Open also at the lower end
d No slope
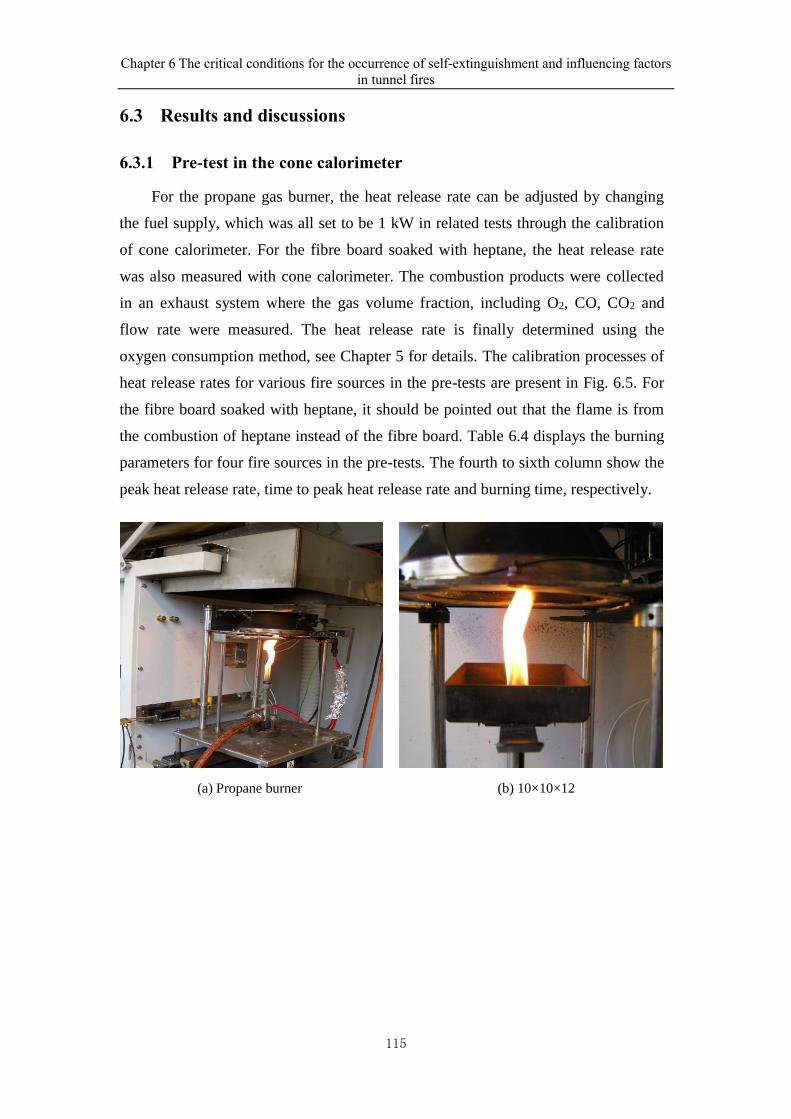
Chapter 6 The critical conditions for the occurrence of self-extinguishment and influencing factors
in tunnel fires
115
6.3 Results and discussions
6.3.1 Pre-test in the cone calorimeter
For the propane gas burner, the heat release rate can be adjusted by changing
the fuel supply, which was all set to be 1 kW in related tests through the calibration
of cone calorimeter. For the fibre board soaked with heptane, the heat release rate
was also measured with cone calorimeter. The combustion products were collected
in an exhaust system where the gas volume fraction, including O2, CO, CO2 and
flow rate were measured. The heat release rate is finally determined using the
oxygen consumption method, see Chapter 5 for details. The calibration processes of
heat release rates for various fire sources in the pre-tests are present in Fig. 6.5. For
the fibre board soaked with heptane, it should be pointed out that the flame is from
the combustion of heptane instead of the fibre board. Table 6.4 displays the burning
parameters for four fire sources in the pre-tests. The fourth to sixth column show the
peak heat release rate, time to peak heat release rate and burning time, respectively.
(a) Propane burner (b) 10×10×12
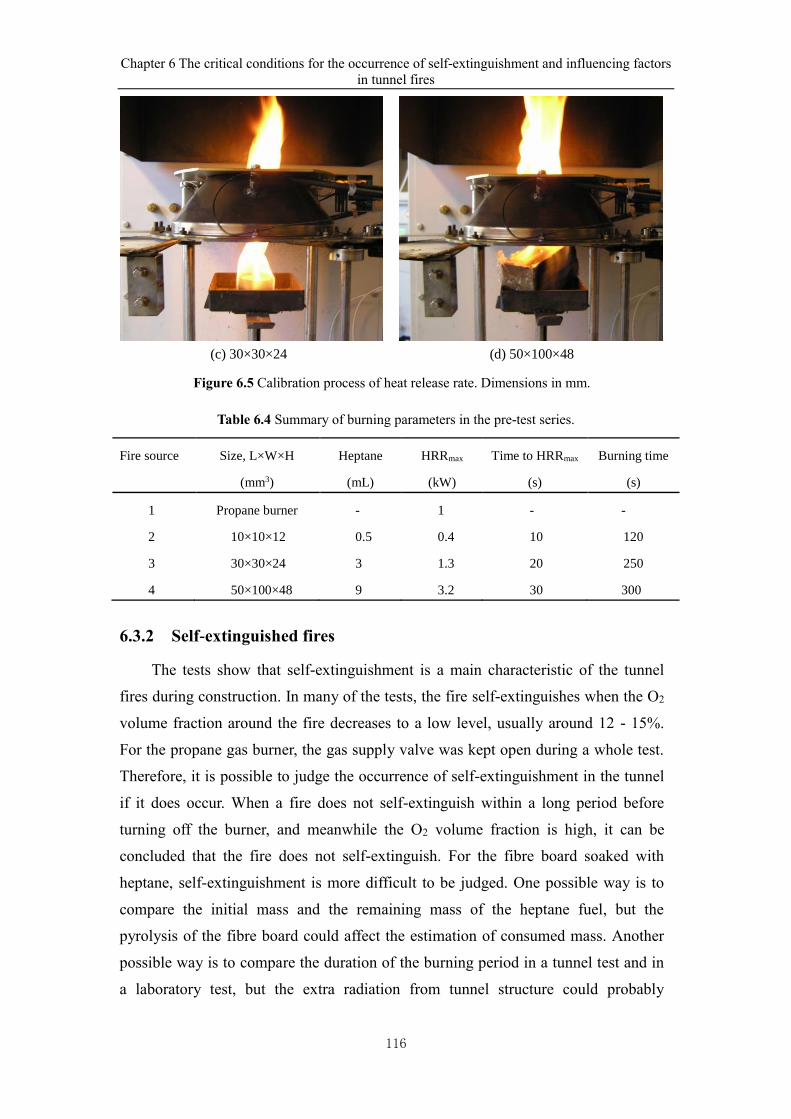
Chapter 6 The critical conditions for the occurrence of self-extinguishment and influencing factors
in tunnel fires
116
(c) 30×30×24 (d) 50×100×48
Figure 6.5 Calibration process of heat release rate. Dimensions in mm.
Table 6.4 Summary of burning parameters in the pre-test series.
Fire source Size, L×W×H
(mm3)
Heptane
(mL)
HRRmax
(kW)
Time to HRRmax
(s)
Burning time
(s)
1 Propane burner - 1 - -
2 10×10×12 0.5 0.4 10 120
3 30×30×24 3 1.3 20 250
4 50×100×48 9 3.2 30 300
6.3.2 Self-extinguished fires
The tests show that self-extinguishment is a main characteristic of the tunnel
fires during construction. In many of the tests, the fire self-extinguishes when the O2
volume fraction around the fire decreases to a low level, usually around 12 - 15%.
For the propane gas burner, the gas supply valve was kept open during a whole test.
Therefore, it is possible to judge the occurrence of self-extinguishment in the tunnel
if it does occur. When a fire does not self-extinguish within a long period before
turning off the burner, and meanwhile the O2 volume fraction is high, it can be
concluded that the fire does not self-extinguish. For the fibre board soaked with
heptane, self-extinguishment is more difficult to be judged. One possible way is to
compare the initial mass and the remaining mass of the heptane fuel, but the
pyrolysis of the fibre board could affect the estimation of consumed mass. Another
possible way is to compare the duration of the burning period in a tunnel test and in
a laboratory test, but the extra radiation from tunnel structure could probably
Chapter 6 The critical conditions for the occurrence of self-extinguishment and influencing factors
in tunnel fires
117
accelerate the burning velocity of heptane and thus shorten the duration. The
measured O2 volume fraction could also be used as an indicator for the judgment. In
any case, determination of the occurrence of self-extinguishment is difficult in the
tests with the fibre board soaked with heptane. For these tests, the occurrence of
self-extinguishment is thus judged carefully based on a comprehensive consideration
of the burning duration, consumption of fuel and O2 volume fraction. This process is
explained in detail in Table 6.5. If two or more of the three criteria are fulfilled, it
verifies the occurrence of self-extinguishment. A summary of the occurrence of
self-extinguishment in all 36 tests has been given in Table 6.3.
Table 6.5 Criteria of the occurrence of self-extinguishment for the fibre board soaked with heptane.
a The value refers to the results from the propane gas burner tests as shown in Fig. 6.6.
6.3.2.1 Equivalence ratio
Equivalence ratio is used to study the influence of ventilation condition on the
combustion behaviors. During the tests, due to the fact that the mass loss rate of fuel
was not measured, the calculated method of equivalence ratio is different from that
in Chapter 5. However, their essences are the same and the new expression is
displayed as follows[14]:
3013 a
Q
m = (6.1)
where am is the air flow rate through the circular pipe into the tunnel (ventilation rate)
and Q is the heat release rate.
6.3.2.2 The influence of fuel type in Tunnel B
There are two types of fuel in this study, i.e. one is propane gas burner and
another one is fibre board soaked with heptane. Table 6.6 presents a summary of the
ventilation rate, the equivalence ratio and the occurrence of self-extinguishment for
the gas burner in Tunnel B. Tunnel B was connected with Tunnel A in all the tests
while Tunnel C only in some tests. The critical equivalence ratio for the occurrence of
self-extinguishment is found to be within 0.28 -1.38. But no specific value can be
given as there are missing values within the range.
1 The burning time decreases, compared to the burning in the pre-test.
2 The mass consumed decreases, compared to the burning in the pre-test.
3 The O2 volume fraction around the fire decreases significantly and approaches 14 %a.
Chapter 6 The critical conditions for the occurrence of self-extinguishment and influencing factors
in tunnel fires
118
Table 6.6 The relationship between equivalence ratio and self-extinguishment for gas burner in
Tunnel B.
Test Tunnel
geometry
Heat release
rate (kW) Fire position
Ventilation
(m3/s)
Self-
extinguisheda
Equivalence
ratio
29 A+B 1 Centre of tunnel B 0.00356 No 0.08
35 A+B 1 End of tunnel B 0.00356 No 0.08
9 A+B 1 End of tunnel B 0.001 No 0.28
10 A+B 1 End of tunnel B 0.0002 Yes 1.38
8 A+B 1 End of tunnel B 0.0001 Yes 2.77
21 A+B 1 Centre of tunnel B 0.0001 Yes 2.77
22 A+B+C 1 End of tunnel B 0.0001 Yes 2.77
23 A+B+C 1 Centre of tunnel B 0.0001 Yes 2.77
24 A+B 1 Centre of tunnel B 0.0001 Yes 2.77
6 A+B 1 End of tunnel B 0 Yes ∞
7 A+B 1 End of tunnel B 0 Yes ∞
a Yes represents the occurrence of self-extinguishment and No represents the non-occurrence of
self-extinguishment.
Figure 6.6 shows the history of O2 volume fraction for all the gas burner tests in
Table 6.6. For the tests with fire located at Position 2 (end of Tunnel B), the O2 volume
fraction refers to the probe placed 0.188 m after the fire, i.e. 0.187 m from the end of
Tunnel B. For the tests with fire located at Position 3 (center of Tunnel B), the O2
volume fraction refers to the probe placed 0.187 m in front of the fire, i.e. 1.687 m
from the end of Tunnel B. Comparisons of Fig. 6.6 and Table 6.6 show that in all the
tests the fire would self-extinguish as long as the O2 volume fraction decreases to a
range of 14 % - 12 %, which is basically consistent with this conclusion from Beyler
that the flammable limit (critical O2 volume fraction) is approximately 13 % [184].
This also provides a reference criterion for the determination of self-extinguishment in
the tests of fibre board soaked with heptane. Such criteria are summarized in Table 6.5
to aid judgment.
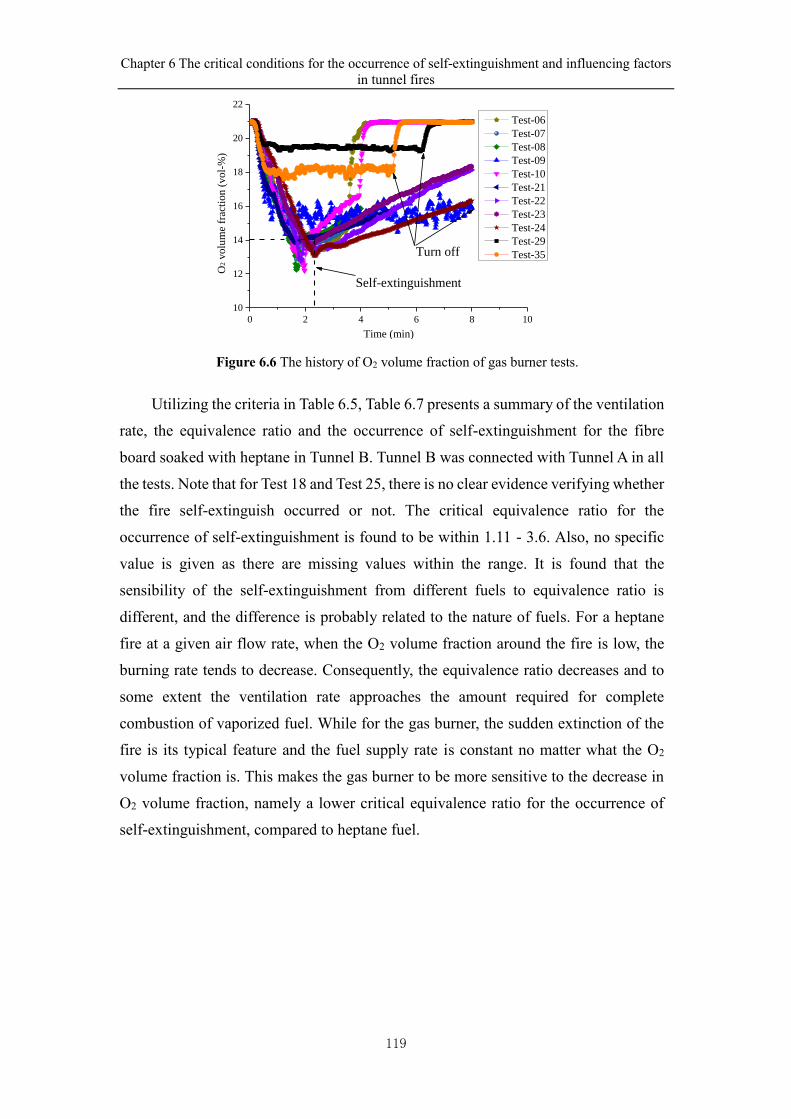
Chapter 6 The critical conditions for the occurrence of self-extinguishment and influencing factors
in tunnel fires
119
0 2 4 6 8 10
10
12
14
16
18
20
22
Turn off
O2 v
olu
me
frac
tion (
vol-
%)
Time (min)
Test-06
Test-07
Test-08
Test-09
Test-10
Test-21
Test-22
Test-23
Test-24
Test-29
Test-35
Self-extinguishment
Figure 6.6 The history of O2 volume fraction of gas burner tests.
Utilizing the criteria in Table 6.5, Table 6.7 presents a summary of the ventilation
rate, the equivalence ratio and the occurrence of self-extinguishment for the fibre
board soaked with heptane in Tunnel B. Tunnel B was connected with Tunnel A in all
the tests. Note that for Test 18 and Test 25, there is no clear evidence verifying whether
the fire self-extinguish occurred or not. The critical equivalence ratio for the
occurrence of self-extinguishment is found to be within 1.11 - 3.6. Also, no specific
value is given as there are missing values within the range. It is found that the
sensibility of the self-extinguishment from different fuels to equivalence ratio is
different, and the difference is probably related to the nature of fuels. For a heptane
fire at a given air flow rate, when the O2 volume fraction around the fire is low, the
burning rate tends to decrease. Consequently, the equivalence ratio decreases and to
some extent the ventilation rate approaches the amount required for complete
combustion of vaporized fuel. While for the gas burner, the sudden extinction of the
fire is its typical feature and the fuel supply rate is constant no matter what the O2
volume fraction is. This makes the gas burner to be more sensitive to the decrease in
O2 volume fraction, namely a lower critical equivalence ratio for the occurrence of
self-extinguishment, compared to heptane fuel.
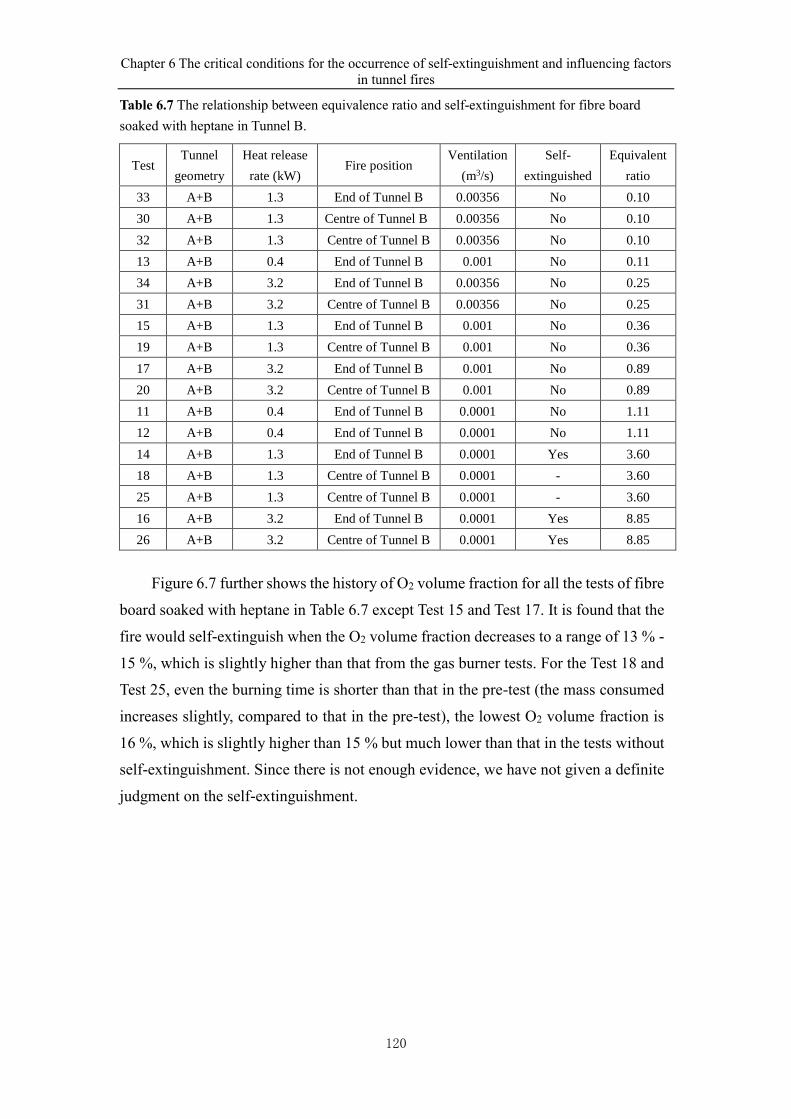
Chapter 6 The critical conditions for the occurrence of self-extinguishment and influencing factors
in tunnel fires
120
Table 6.7 The relationship between equivalence ratio and self-extinguishment for fibre board
soaked with heptane in Tunnel B.
Test Tunnel
geometry
Heat release
rate (kW) Fire position
Ventilation
(m3/s)
Self-
extinguished
Equivalent
ratio
33 A+B 1.3 End of Tunnel B 0.00356 No 0.10
30 A+B 1.3 Centre of Tunnel B 0.00356 No 0.10
32 A+B 1.3 Centre of Tunnel B 0.00356 No 0.10
13 A+B 0.4 End of Tunnel B 0.001 No 0.11
34 A+B 3.2 End of Tunnel B 0.00356 No 0.25
31 A+B 3.2 Centre of Tunnel B 0.00356 No 0.25
15 A+B 1.3 End of Tunnel B 0.001 No 0.36
19 A+B 1.3 Centre of Tunnel B 0.001 No 0.36
17 A+B 3.2 End of Tunnel B 0.001 No 0.89
20 A+B 3.2 Centre of Tunnel B 0.001 No 0.89
11 A+B 0.4 End of Tunnel B 0.0001 No 1.11
12 A+B 0.4 End of Tunnel B 0.0001 No 1.11
14 A+B 1.3 End of Tunnel B 0.0001 Yes 3.60
18 A+B 1.3 Centre of Tunnel B 0.0001 - 3.60
25 A+B 1.3 Centre of Tunnel B 0.0001 - 3.60
16 A+B 3.2 End of Tunnel B 0.0001 Yes 8.85
26 A+B 3.2 Centre of Tunnel B 0.0001 Yes 8.85
Figure 6.7 further shows the history of O2 volume fraction for all the tests of fibre
board soaked with heptane in Table 6.7 except Test 15 and Test 17. It is found that the
fire would self-extinguish when the O2 volume fraction decreases to a range of 13 % -
15 %, which is slightly higher than that from the gas burner tests. For the Test 18 and
Test 25, even the burning time is shorter than that in the pre-test (the mass consumed
increases slightly, compared to that in the pre-test), the lowest O2 volume fraction is
16 %, which is slightly higher than 15 % but much lower than that in the tests without
self-extinguishment. Since there is not enough evidence, we have not given a definite
judgment on the self-extinguishment.
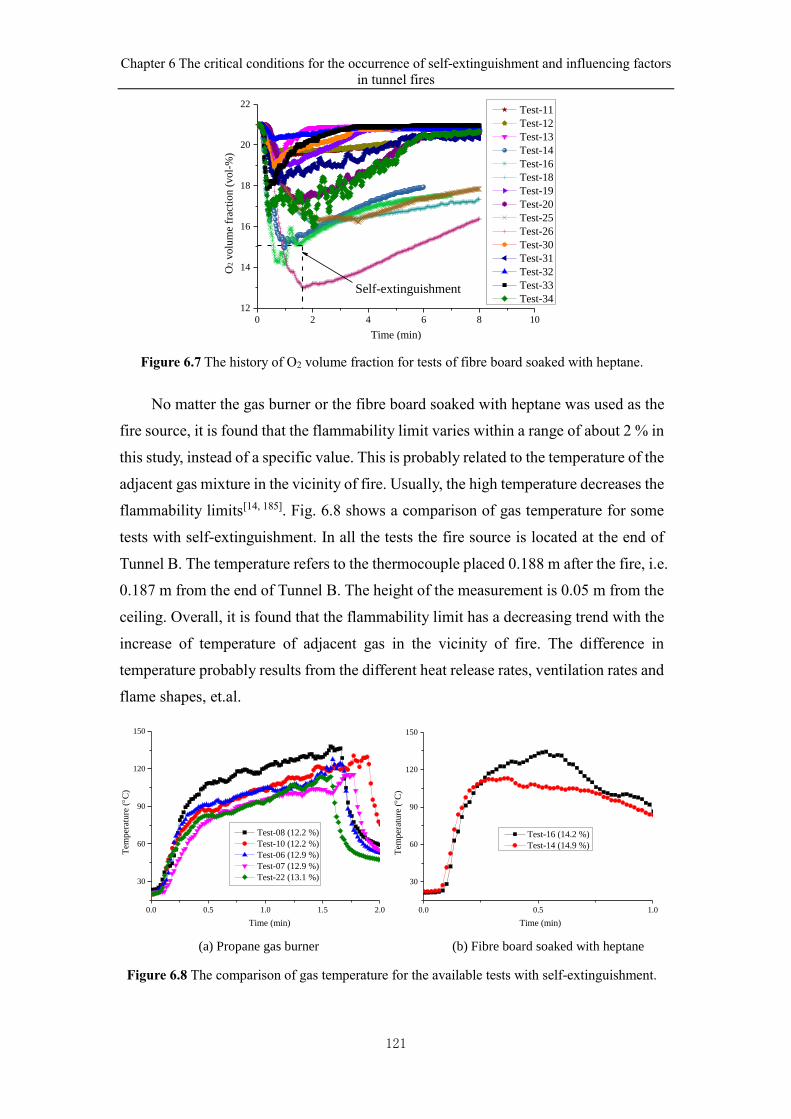
Chapter 6 The critical conditions for the occurrence of self-extinguishment and influencing factors
in tunnel fires
121
0 2 4 6 8 10
12
14
16
18
20
22
O2 v
olu
me
frac
tion (
vol-
%)
Time (min)
Test-11
Test-12
Test-13
Test-14
Test-16
Test-18
Test-19
Test-20
Test-25
Test-26
Test-30
Test-31
Test-32
Test-33
Test-34Self-extinguishment
Figure 6.7 The history of O2 volume fraction for tests of fibre board soaked with heptane.
No matter the gas burner or the fibre board soaked with heptane was used as the
fire source, it is found that the flammability limit varies within a range of about 2 % in
this study, instead of a specific value. This is probably related to the temperature of the
adjacent gas mixture in the vicinity of fire. Usually, the high temperature decreases the
flammability limits[14, 185]. Fig. 6.8 shows a comparison of gas temperature for some
tests with self-extinguishment. In all the tests the fire source is located at the end of
Tunnel B. The temperature refers to the thermocouple placed 0.188 m after the fire, i.e.
0.187 m from the end of Tunnel B. The height of the measurement is 0.05 m from the
ceiling. Overall, it is found that the flammability limit has a decreasing trend with the
increase of temperature of adjacent gas in the vicinity of fire. The difference in
temperature probably results from the different heat release rates, ventilation rates and
flame shapes, et.al.
0.0 0.5 1.0 1.5 2.0
30
60
90
120
150
Tem
per
ature
(C
)
Time (min)
Test-08 (12.2 %)
Test-10 (12.2 %)
Test-06 (12.9 %)
Test-07 (12.9 %)
Test-22 (13.1 %)
0.0 0.5 1.0
30
60
90
120
150
Tem
per
atu
re (
C)
Time (min)
Test-16 (14.2 %)
Test-14 (14.9 %)
(a) Propane gas burner (b) Fibre board soaked with heptane
Figure 6.8 The comparison of gas temperature for the available tests with self-extinguishment.
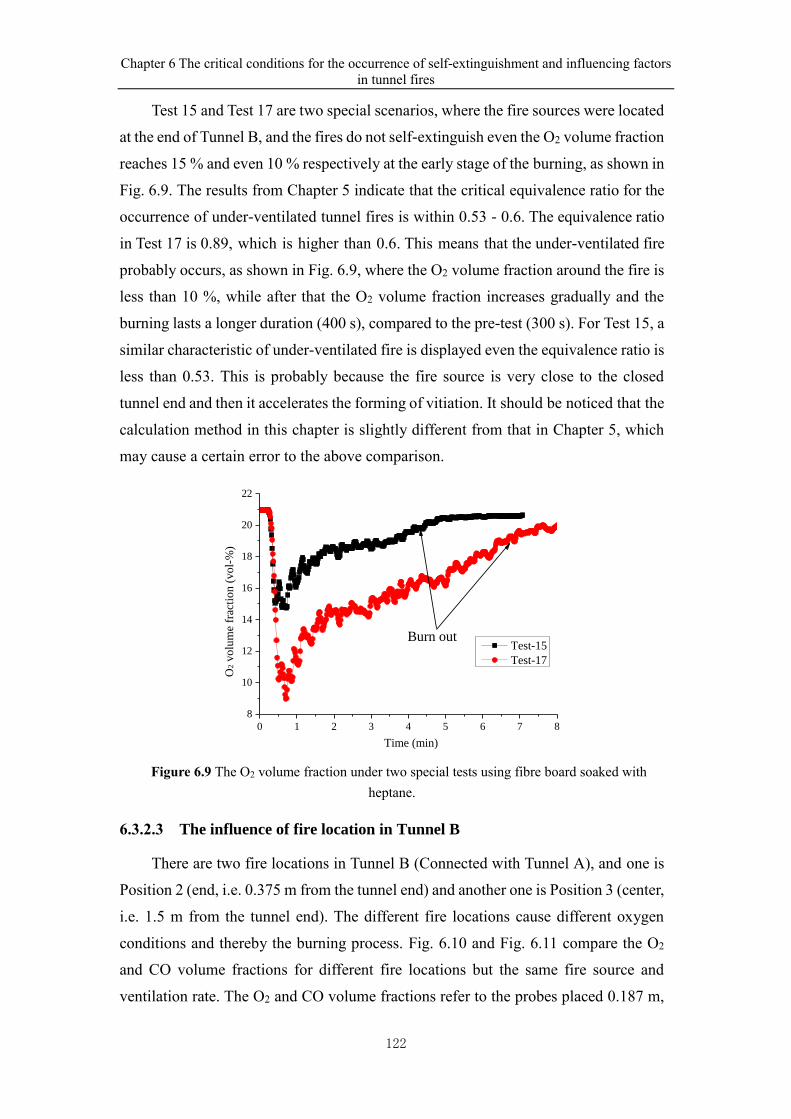
Chapter 6 The critical conditions for the occurrence of self-extinguishment and influencing factors
in tunnel fires
122
Test 15 and Test 17 are two special scenarios, where the fire sources were located
at the end of Tunnel B, and the fires do not self-extinguish even the O2 volume fraction
reaches 15 % and even 10 % respectively at the early stage of the burning, as shown in
Fig. 6.9. The results from Chapter 5 indicate that the critical equivalence ratio for the
occurrence of under-ventilated tunnel fires is within 0.53 - 0.6. The equivalence ratio
in Test 17 is 0.89, which is higher than 0.6. This means that the under-ventilated fire
probably occurs, as shown in Fig. 6.9, where the O2 volume fraction around the fire is
less than 10 %, while after that the O2 volume fraction increases gradually and the
burning lasts a longer duration (400 s), compared to the pre-test (300 s). For Test 15, a
similar characteristic of under-ventilated fire is displayed even the equivalence ratio is
less than 0.53. This is probably because the fire source is very close to the closed
tunnel end and then it accelerates the forming of vitiation. It should be noticed that the
calculation method in this chapter is slightly different from that in Chapter 5, which
may cause a certain error to the above comparison.
0 1 2 3 4 5 6 7 8
8
10
12
14
16
18
20
22
O2 v
olu
me
frac
tion (
vol-
%)
Time (min)
Test-15
Test-17
Burn out
Figure 6.9 The O2 volume fraction under two special tests using fibre board soaked with
heptane.
6.3.2.3 The influence of fire location in Tunnel B
There are two fire locations in Tunnel B (Connected with Tunnel A), and one is
Position 2 (end, i.e. 0.375 m from the tunnel end) and another one is Position 3 (center,
i.e. 1.5 m from the tunnel end). The different fire locations cause different oxygen
conditions and thereby the burning process. Fig. 6.10 and Fig. 6.11 compare the O2
and CO volume fractions for different fire locations but the same fire source and
ventilation rate. The O2 and CO volume fractions refer to the probes placed 0.187 m,
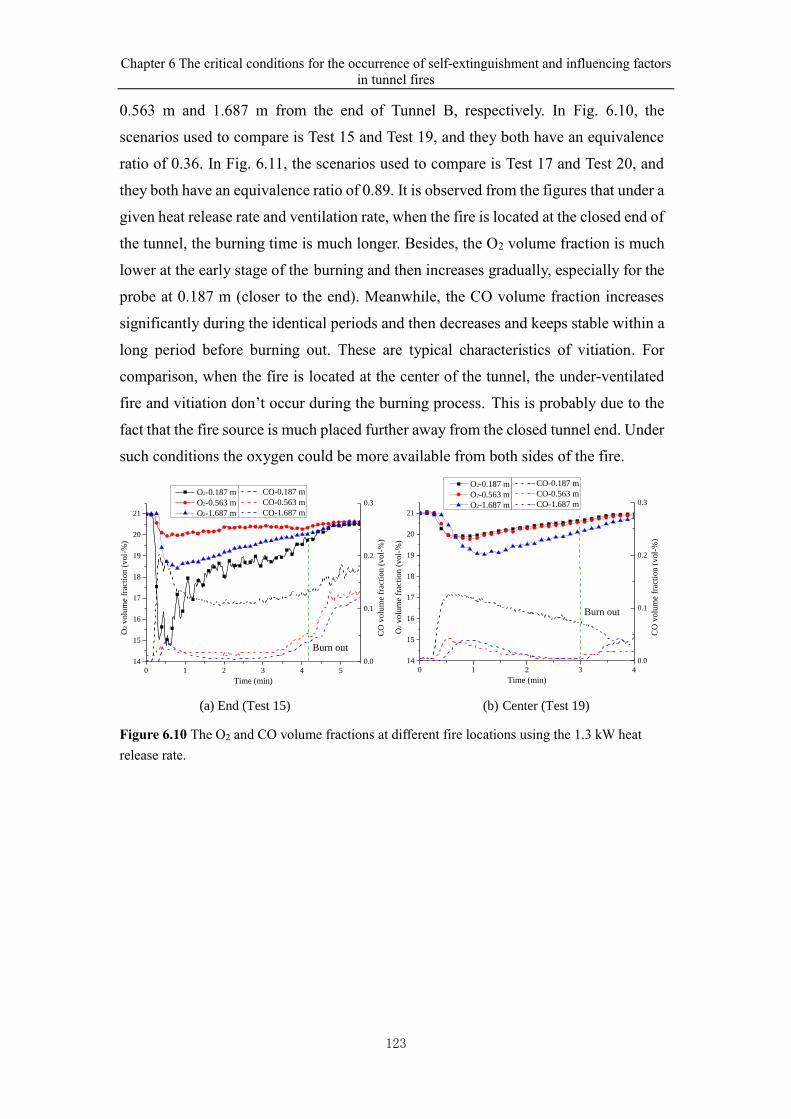
Chapter 6 The critical conditions for the occurrence of self-extinguishment and influencing factors
in tunnel fires
123
0.563 m and 1.687 m from the end of Tunnel B, respectively. In Fig. 6.10, the
scenarios used to compare is Test 15 and Test 19, and they both have an equivalence
ratio of 0.36. In Fig. 6.11, the scenarios used to compare is Test 17 and Test 20, and
they both have an equivalence ratio of 0.89. It is observed from the figures that under a
given heat release rate and ventilation rate, when the fire is located at the closed end of
the tunnel, the burning time is much longer. Besides, the O2 volume fraction is much
lower at the early stage of the burning and then increases gradually, especially for the
probe at 0.187 m (closer to the end). Meanwhile, the CO volume fraction increases
significantly during the identical periods and then decreases and keeps stable within a
long period before burning out. These are typical characteristics of vitiation. For
comparison, when the fire is located at the center of the tunnel, the under-ventilated
fire and vitiation don’t occur during the burning process. This is probably due to the
fact that the fire source is much placed further away from the closed tunnel end. Under
such conditions the oxygen could be more available from both sides of the fire.
0 1 2 3 4 5
14
15
16
17
18
19
20
21
O2 v
olu
me
frac
tio
n (
vo
l-%
)
Time (min)
O2-0.187 m
O2-0.563 m
O2-1.687 m
0.0
0.1
0.2
0.3
CO-0.187 m
CO-0.563 m
CO-1.687 m
CO
vo
lum
e fr
acti
on
(v
ol-
%)
Burn out
0 1 2 3 4
14
15
16
17
18
19
20
21
O2 v
olu
me
frac
tio
n (
vo
l-%
)
Time (min)
O2-0.187 m
O2-0.563 m
O2-1.687 m
Burn out
0.0
0.1
0.2
0.3
CO-0.187 m
CO-0.563 m
CO-1.687 m
CO
vo
lum
e fr
acti
on
(v
ol-
%)
(a) End (Test 15) (b) Center (Test 19)
Figure 6.10 The O2 and CO volume fractions at different fire locations using the 1.3 kW heat
release rate.
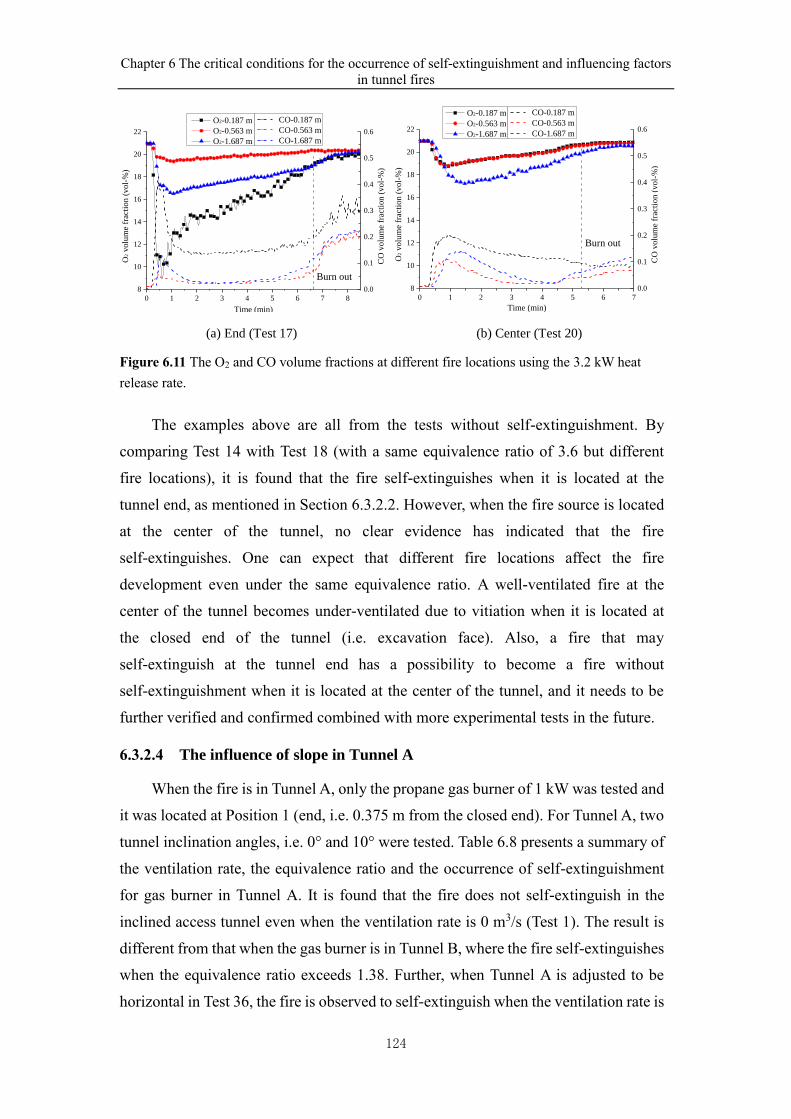
Chapter 6 The critical conditions for the occurrence of self-extinguishment and influencing factors
in tunnel fires
124
0 1 2 3 4 5 6 7 8
8
10
12
14
16
18
20
22O
2 v
olu
me
frac
tio
n (
vo
l-%
)
Time (min)
O2-0.187 m
O2-0.563 m
O2-1.687 m
Burn out
0.0
0.1
0.2
0.3
0.4
0.5
0.6
CO-0.187 m
CO-0.563 m
CO-1.687 m
CO
vo
lum
e fr
acti
on
(v
ol-
%)
0 1 2 3 4 5 6 7
8
10
12
14
16
18
20
22
O2 v
olu
me
frac
tion (
vol-
%)
Time (min)
O2-0.187 m
O2-0.563 m
O2-1.687 m
0.0
0.1
0.2
0.3
0.4
0.5
0.6
CO-0.187 m
CO-0.563 m
CO-1.687 m
CO
volu
me
frac
tion (
vol-
%)
Burn out
(a) End (Test 17) (b) Center (Test 20)
Figure 6.11 The O2 and CO volume fractions at different fire locations using the 3.2 kW heat
release rate.
The examples above are all from the tests without self-extinguishment. By
comparing Test 14 with Test 18 (with a same equivalence ratio of 3.6 but different
fire locations), it is found that the fire self-extinguishes when it is located at the
tunnel end, as mentioned in Section 6.3.2.2. However, when the fire source is located
at the center of the tunnel, no clear evidence has indicated that the fire
self-extinguishes. One can expect that different fire locations affect the fire
development even under the same equivalence ratio. A well-ventilated fire at the
center of the tunnel becomes under-ventilated due to vitiation when it is located at
the closed end of the tunnel (i.e. excavation face). Also, a fire that may
self-extinguish at the tunnel end has a possibility to become a fire without
self-extinguishment when it is located at the center of the tunnel, and it needs to be
further verified and confirmed combined with more experimental tests in the future.
6.3.2.4 The influence of slope in Tunnel A
When the fire is in Tunnel A, only the propane gas burner of 1 kW was tested and
it was located at Position 1 (end, i.e. 0.375 m from the closed end). For Tunnel A, two
tunnel inclination angles, i.e. 0° and 10° were tested. Table 6.8 presents a summary of
the ventilation rate, the equivalence ratio and the occurrence of self-extinguishment
for gas burner in Tunnel A. It is found that the fire does not self-extinguish in the
inclined access tunnel even when the ventilation rate is 0 m3/s (Test 1). The result is
different from that when the gas burner is in Tunnel B, where the fire self-extinguishes
when the equivalence ratio exceeds 1.38. Further, when Tunnel A is adjusted to be
horizontal in Test 36, the fire is observed to self-extinguish when the ventilation rate is
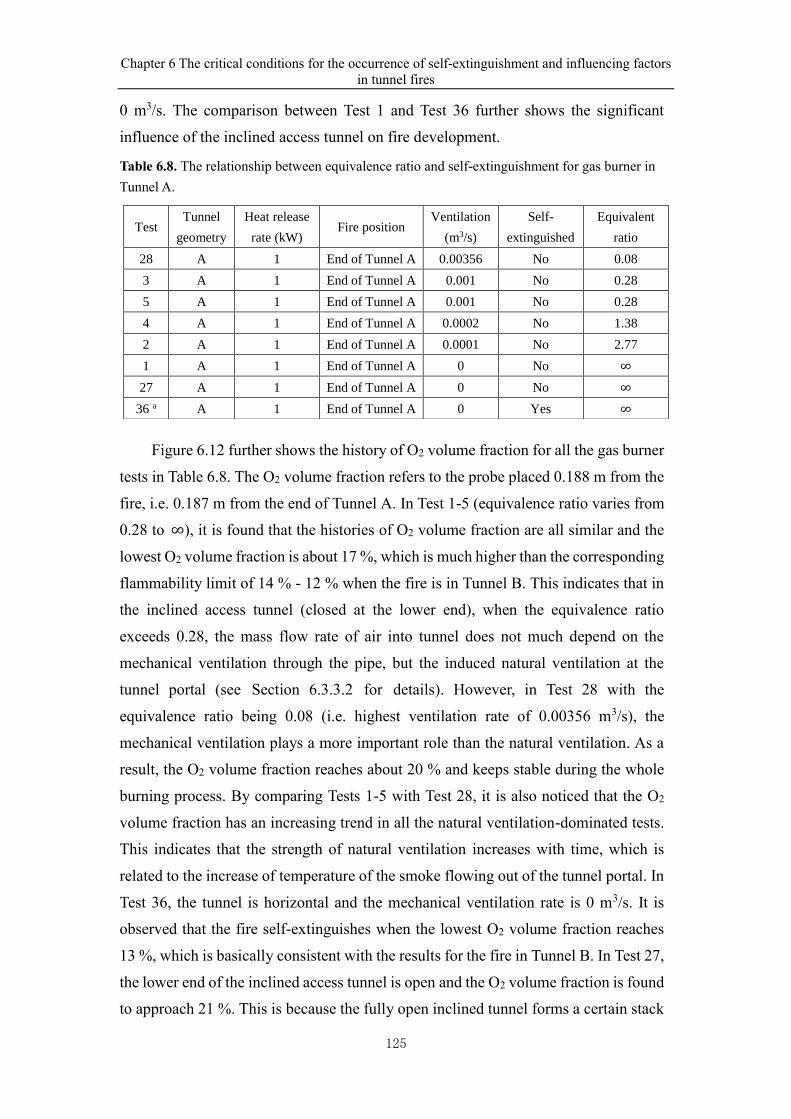
Chapter 6 The critical conditions for the occurrence of self-extinguishment and influencing factors
in tunnel fires
125
0 m3/s. The comparison between Test 1 and Test 36 further shows the significant
influence of the inclined access tunnel on fire development.
Table 6.8. The relationship between equivalence ratio and self-extinguishment for gas burner in
Tunnel A.
Figure 6.12 further shows the history of O2 volume fraction for all the gas burner
tests in Table 6.8. The O2 volume fraction refers to the probe placed 0.188 m from the
fire, i.e. 0.187 m from the end of Tunnel A. In Test 1-5 (equivalence ratio varies from
0.28 to ∞), it is found that the histories of O2 volume fraction are all similar and the
lowest O2 volume fraction is about 17 %, which is much higher than the corresponding
flammability limit of 14 % - 12 % when the fire is in Tunnel B. This indicates that in
the inclined access tunnel (closed at the lower end), when the equivalence ratio
exceeds 0.28, the mass flow rate of air into tunnel does not much depend on the
mechanical ventilation through the pipe, but the induced natural ventilation at the
tunnel portal (see Section 6.3.3.2 for details). However, in Test 28 with the
equivalence ratio being 0.08 (i.e. highest ventilation rate of 0.00356 m3/s), the
mechanical ventilation plays a more important role than the natural ventilation. As a
result, the O2 volume fraction reaches about 20 % and keeps stable during the whole
burning process. By comparing Tests 1-5 with Test 28, it is also noticed that the O2
volume fraction has an increasing trend in all the natural ventilation-dominated tests.
This indicates that the strength of natural ventilation increases with time, which is
related to the increase of temperature of the smoke flowing out of the tunnel portal. In
Test 36, the tunnel is horizontal and the mechanical ventilation rate is 0 m3/s. It is
observed that the fire self-extinguishes when the lowest O2 volume fraction reaches
13 %, which is basically consistent with the results for the fire in Tunnel B. In Test 27,
the lower end of the inclined access tunnel is open and the O2 volume fraction is found
to approach 21 %. This is because the fully open inclined tunnel forms a certain stack
Test Tunnel
geometry
Heat release
rate (kW) Fire position
Ventilation
(m3/s)
Self-
extinguished
Equivalent
ratio
28 A 1 End of Tunnel A 0.00356 No 0.08
3 A 1 End of Tunnel A 0.001 No 0.28
5 A 1 End of Tunnel A 0.001 No 0.28
4 A 1 End of Tunnel A 0.0002 No 1.38
2 A 1 End of Tunnel A 0.0001 No 2.77
1 A 1 End of Tunnel A 0 No ∞
27 A 1 End of Tunnel A 0 No ∞
36 a A 1 End of Tunnel A 0 Yes ∞
Chapter 6 The critical conditions for the occurrence of self-extinguishment and influencing factors
in tunnel fires
126
effect and then induces plenty of fresh air to flow from the lower portal to the higher
portal. The lowest O2 volume faction in the inclined tunnel (Test 1-5) is much higher
than that in the horizontal tunnel (Test 36). This seems to support to the conclusion
from Ip and Luo[186] and Ji et al.[64] that the smoke layer interface at upstream direction
(lower end) is almost parallel to the horizontal level. In other words, a relatively clean
space without vitiation under the smoke layer is formed behind the fire (i.e. between
the fire source and closed end wall) in the inclined access tunnel and it may aid the
combustion. The detailed characteristics of smoke spread are introduced in Section
6.3.3.
0 5 10 15 20
12
14
16
18
20
22
Turn off
O2 v
olu
me
frac
tio
n (
vo
l-%
)
Time (min)
Test-01
Test-02
Test-03
Test-04
Test-05
Test-27
Test-28
Test-36Self-extinguishment
Figure 6.12 The history of O2 volume fraction of gas burner tests in Tunnel A.
Table 6.9 compares the lowest O2 volume fraction between current study in
Tunnel A and previous study from Zhang et al.[187]. The tunnel in previous study is
an inclined tunnel with one end close and the other end open (without ventilation).
The slope of inclined tunnel changes from -10° (higher end is closed) to 10° (higher
end is open) to the horizontal. It is found that the O2 volume fraction trends to
increase with the increase of slope, which is consistent with our result. However, it is
also noted that the corresponding O2 volume fraction in current study is much lower
than that from previous study. This is mainly because in current study the probe was
placed 0.187 m from the closed end of tunnel, while in the previous study the probe
was placed 0.2 m from the open end of tunnel.
Chapter 6 The critical conditions for the occurrence of self-extinguishment and influencing factors
in tunnel fires
127
Table 6.9 Comparison of lowest O2 volume fraction between current study in Tunnel A and
previous study from Zhang et al.[187].
-10° -5° 0° 5° 10°
Current study - - 13.0 % (Test 36) - 16.1 % (Test 1)
Study from Zhang et
al.[187]
13.5 % 17.6 % 19.4 % 19.7 % 20.1 %
Figure 6.13 shows the typical flame shapes in four representative fire scenarios in
Tunnel A. In Test 27 (open at the lower end), the flame inclines significantly towards
the higher end of the tunnel and this further confirms the occurrence of stack effect. In
Test 36, before self-extinguishment, the flame is observed to burn partly outside the
burner and it starts to flutter above the burner. This would be a similar phenomenon as
described by Foote[171] as a “ghosting fire”. In Test 1 (closed at the lower end and
without mechanical ventilation), the flame inclines slightly towards the closed end of
the tunnel. This results from the asymmetrical pressure difference on both sides of fire
source, which have been analyzed in Chapter 3. In Test 28 (closed at the lower end and
with the highest mechanical ventilation rate of 0.00356 m3/s), it is interesting to find
out that the flame inclines towards the higher end of the tunnel, which is the opposite
direction of the incoming air flow from the ventilation pipe. Because of the strong
inertia force of air flow coming out of the ventilation pipe beneath the ceiling and the
decreasing component of gravity acceleration in the direction perpendicular to the
tunnel ceiling, the incoming air is not mixed evenly before reaching the flame.
Therefore, the incoming air flow probably hits the closed end of the tunnel and then
returns, thus blowing the flame towards the opposite direction. However, it should be
pointed out that when the fire occurs in the horizontal main tunnel, under the same
ventilation rate (Test 35), the flame would incline towards the closed end of the tunnel,
i.e. the same direction of incoming air flow from the ventilation pipe, as shown in Fig.
6.14.
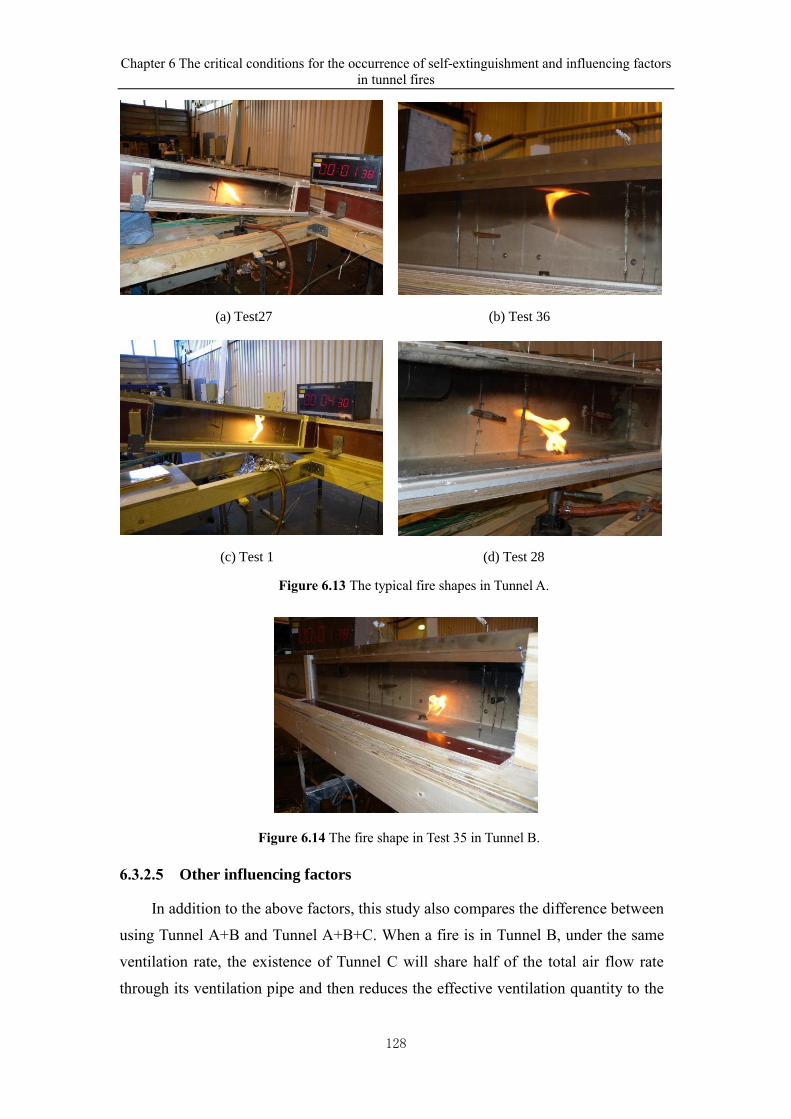
Chapter 6 The critical conditions for the occurrence of self-extinguishment and influencing factors
in tunnel fires
128
(a) Test27 (b) Test 36
(c) Test 1 (d) Test 28
Figure 6.13 The typical fire shapes in Tunnel A.
Figure 6.14 The fire shape in Test 35 in Tunnel B.
6.3.2.5 Other influencing factors
In addition to the above factors, this study also compares the difference between
using Tunnel A+B and Tunnel A+B+C. When a fire is in Tunnel B, under the same
ventilation rate, the existence of Tunnel C will share half of the total air flow rate
through its ventilation pipe and then reduces the effective ventilation quantity to the
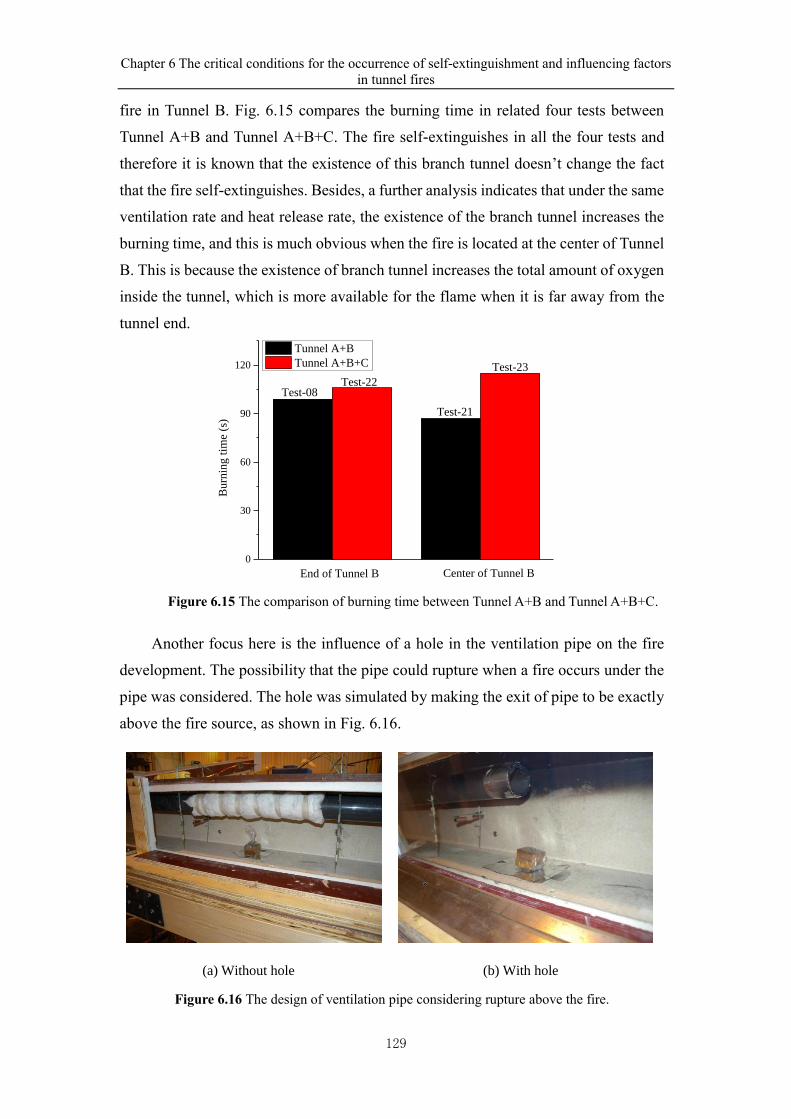
Chapter 6 The critical conditions for the occurrence of self-extinguishment and influencing factors
in tunnel fires
129
fire in Tunnel B. Fig. 6.15 compares the burning time in related four tests between
Tunnel A+B and Tunnel A+B+C. The fire self-extinguishes in all the four tests and
therefore it is known that the existence of this branch tunnel doesn’t change the fact
that the fire self-extinguishes. Besides, a further analysis indicates that under the same
ventilation rate and heat release rate, the existence of the branch tunnel increases the
burning time, and this is much obvious when the fire is located at the center of Tunnel
B. This is because the existence of branch tunnel increases the total amount of oxygen
inside the tunnel, which is more available for the flame when it is far away from the
tunnel end.
0
30
60
90
120 Test-23
Test-21
Test-22
Center of Tunnel BEnd of Tunnel B
Burn
ing t
ime
(s)
Tunnel A+B
Tunnel A+B+C
Test-08
Figure 6.15 The comparison of burning time between Tunnel A+B and Tunnel A+B+C.
Another focus here is the influence of a hole in the ventilation pipe on the fire
development. The possibility that the pipe could rupture when a fire occurs under the
pipe was considered. The hole was simulated by making the exit of pipe to be exactly
above the fire source, as shown in Fig. 6.16.
(a) Without hole (b) With hole
Figure 6.16 The design of ventilation pipe considering rupture above the fire.
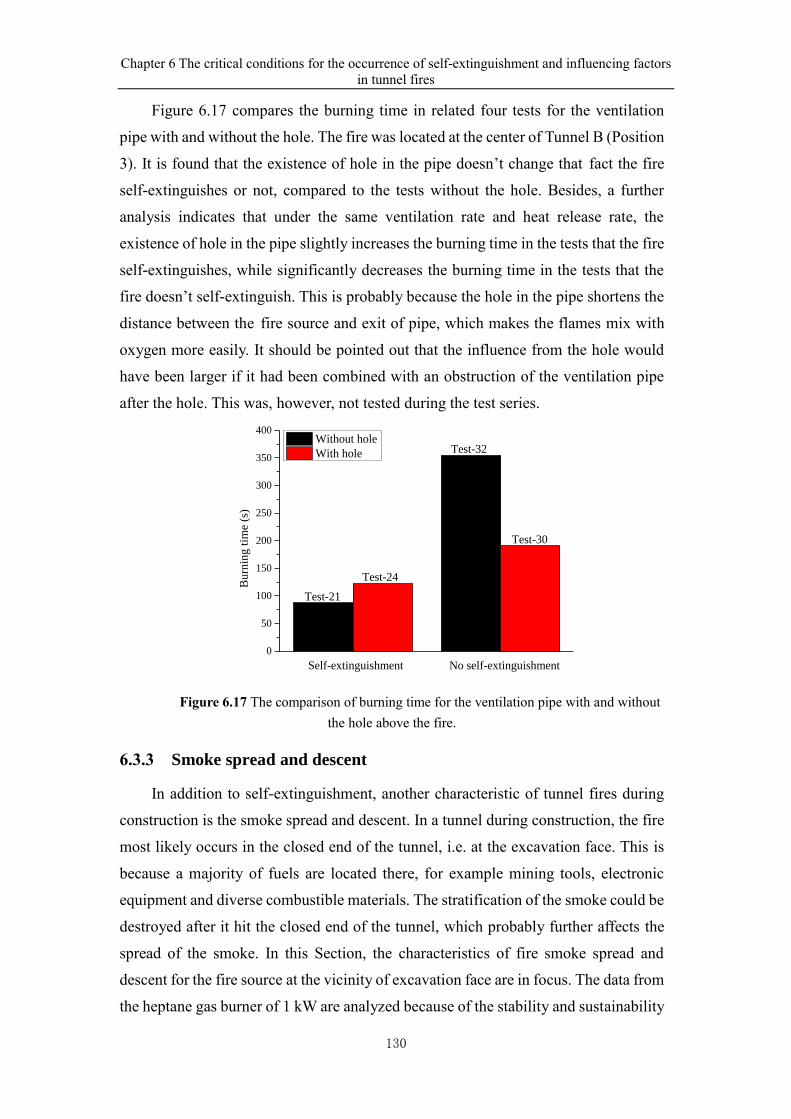
Chapter 6 The critical conditions for the occurrence of self-extinguishment and influencing factors
in tunnel fires
130
Figure 6.17 compares the burning time in related four tests for the ventilation
pipe with and without the hole. The fire was located at the center of Tunnel B (Position
3). It is found that the existence of hole in the pipe doesn’t change that fact the fire
self-extinguishes or not, compared to the tests without the hole. Besides, a further
analysis indicates that under the same ventilation rate and heat release rate, the
existence of hole in the pipe slightly increases the burning time in the tests that the fire
self-extinguishes, while significantly decreases the burning time in the tests that the
fire doesn’t self-extinguish. This is probably because the hole in the pipe shortens the
distance between the fire source and exit of pipe, which makes the flames mix with
oxygen more easily. It should be pointed out that the influence from the hole would
have been larger if it had been combined with an obstruction of the ventilation pipe
after the hole. This was, however, not tested during the test series.
0
50
100
150
200
250
300
350
400
Test-32
Test-30
Test-24
No self-extinguishmentSelf-extinguishment
Burn
ing t
ime
(s)
Without hole
With hole
Test-21
Figure 6.17 The comparison of burning time for the ventilation pipe with and without
the hole above the fire.
6.3.3 Smoke spread and descent
In addition to self-extinguishment, another characteristic of tunnel fires during
construction is the smoke spread and descent. In a tunnel during construction, the fire
most likely occurs in the closed end of the tunnel, i.e. at the excavation face. This is
because a majority of fuels are located there, for example mining tools, electronic
equipment and diverse combustible materials. The stratification of the smoke could be
destroyed after it hit the closed end of the tunnel, which probably further affects the
spread of the smoke. In this Section, the characteristics of fire smoke spread and
descent for the fire source at the vicinity of excavation face are in focus. The data from
the heptane gas burner of 1 kW are analyzed because of the stability and sustainability
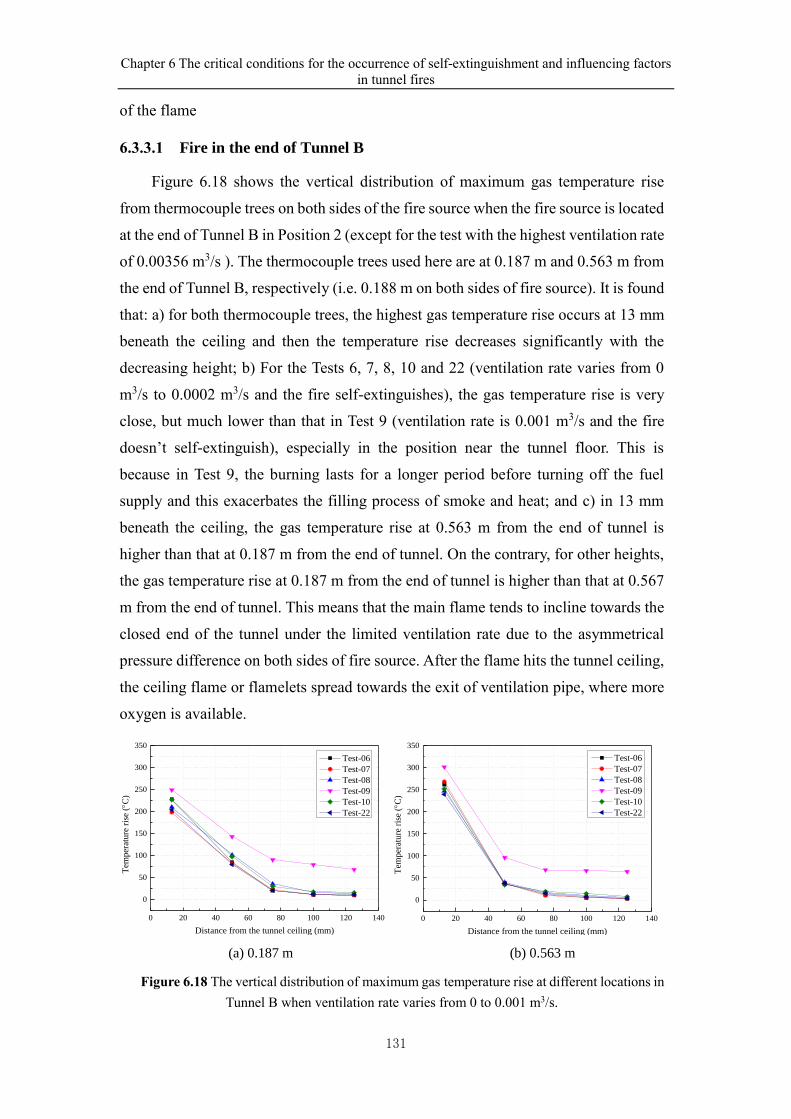
Chapter 6 The critical conditions for the occurrence of self-extinguishment and influencing factors
in tunnel fires
131
of the flame
6.3.3.1 Fire in the end of Tunnel B
Figure 6.18 shows the vertical distribution of maximum gas temperature rise
from thermocouple trees on both sides of the fire source when the fire source is located
at the end of Tunnel B in Position 2 (except for the test with the highest ventilation rate
of 0.00356 m3/s ). The thermocouple trees used here are at 0.187 m and 0.563 m from
the end of Tunnel B, respectively (i.e. 0.188 m on both sides of fire source). It is found
that: a) for both thermocouple trees, the highest gas temperature rise occurs at 13 mm
beneath the ceiling and then the temperature rise decreases significantly with the
decreasing height; b) For the Tests 6, 7, 8, 10 and 22 (ventilation rate varies from 0
m3/s to 0.0002 m3/s and the fire self-extinguishes), the gas temperature rise is very
close, but much lower than that in Test 9 (ventilation rate is 0.001 m3/s and the fire
doesn’t self-extinguish), especially in the position near the tunnel floor. This is
because in Test 9, the burning lasts for a longer period before turning off the fuel
supply and this exacerbates the filling process of smoke and heat; and c) in 13 mm
beneath the ceiling, the gas temperature rise at 0.563 m from the end of tunnel is
higher than that at 0.187 m from the end of tunnel. On the contrary, for other heights,
the gas temperature rise at 0.187 m from the end of tunnel is higher than that at 0.567
m from the end of tunnel. This means that the main flame tends to incline towards the
closed end of the tunnel under the limited ventilation rate due to the asymmetrical
pressure difference on both sides of fire source. After the flame hits the tunnel ceiling,
the ceiling flame or flamelets spread towards the exit of ventilation pipe, where more
oxygen is available.
0 20 40 60 80 100 120 140
0
50
100
150
200
250
300
350
Tem
per
atu
re r
ise
(C
)
Distance from the tunnel ceiling (mm)
Test-06
Test-07
Test-08
Test-09
Test-10
Test-22
0 20 40 60 80 100 120 140
0
50
100
150
200
250
300
350
Test-06
Test-07
Test-08
Test-09
Test-10
Test-22
Tem
per
ature
ris
e (
C)
Distance from the tunnel ceiling (mm)
(a) 0.187 m (b) 0.563 m
Figure 6.18 The vertical distribution of maximum gas temperature rise at different locations in
Tunnel B when ventilation rate varies from 0 to 0.001 m3/s.
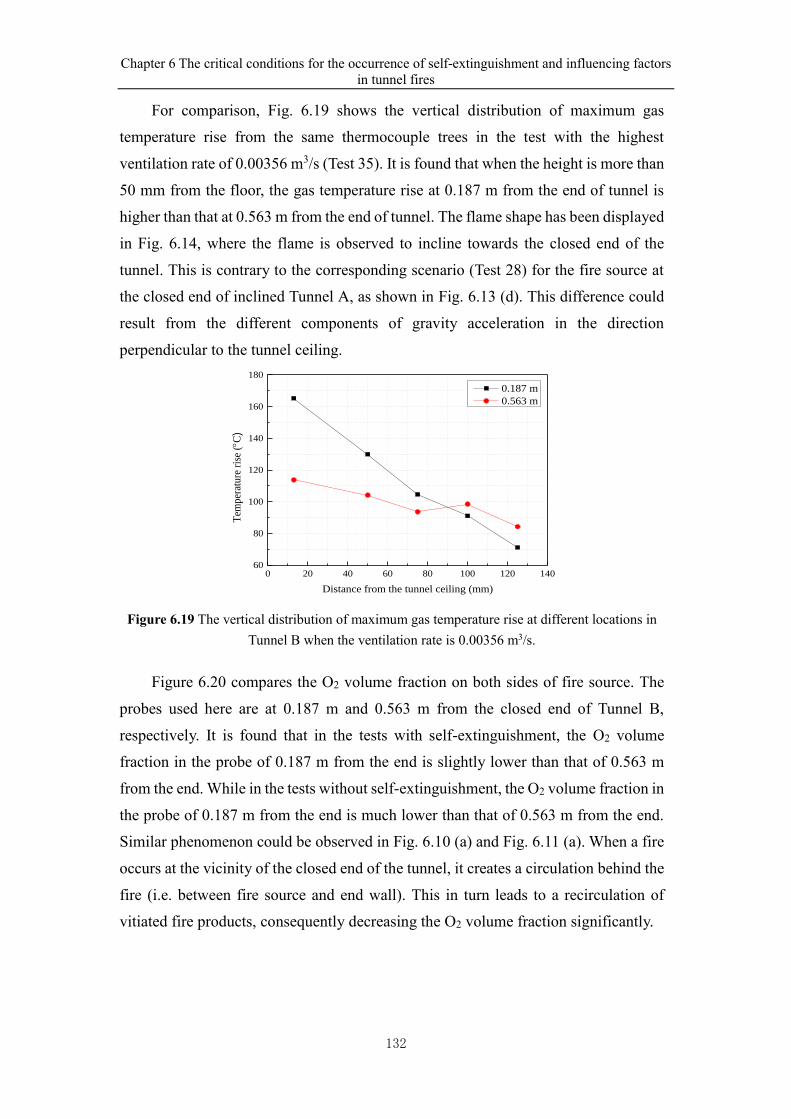
Chapter 6 The critical conditions for the occurrence of self-extinguishment and influencing factors
in tunnel fires
132
For comparison, Fig. 6.19 shows the vertical distribution of maximum gas
temperature rise from the same thermocouple trees in the test with the highest
ventilation rate of 0.00356 m3/s (Test 35). It is found that when the height is more than
50 mm from the floor, the gas temperature rise at 0.187 m from the end of tunnel is
higher than that at 0.563 m from the end of tunnel. The flame shape has been displayed
in Fig. 6.14, where the flame is observed to incline towards the closed end of the
tunnel. This is contrary to the corresponding scenario (Test 28) for the fire source at
the closed end of inclined Tunnel A, as shown in Fig. 6.13 (d). This difference could
result from the different components of gravity acceleration in the direction
perpendicular to the tunnel ceiling.
0 20 40 60 80 100 120 14060
80
100
120
140
160
180
Tem
per
ature
ris
e (
C)
Distance from the tunnel ceiling (mm)
0.187 m
0.563 m
Figure 6.19 The vertical distribution of maximum gas temperature rise at different locations in
Tunnel B when the ventilation rate is 0.00356 m3/s.
Figure 6.20 compares the O2 volume fraction on both sides of fire source. The
probes used here are at 0.187 m and 0.563 m from the closed end of Tunnel B,
respectively. It is found that in the tests with self-extinguishment, the O2 volume
fraction in the probe of 0.187 m from the end is slightly lower than that of 0.563 m
from the end. While in the tests without self-extinguishment, the O2 volume fraction in
the probe of 0.187 m from the end is much lower than that of 0.563 m from the end.
Similar phenomenon could be observed in Fig. 6.10 (a) and Fig. 6.11 (a). When a fire
occurs at the vicinity of the closed end of the tunnel, it creates a circulation behind the
fire (i.e. between fire source and end wall). This in turn leads to a recirculation of
vitiated fire products, consequently decreasing the O2 volume fraction significantly.
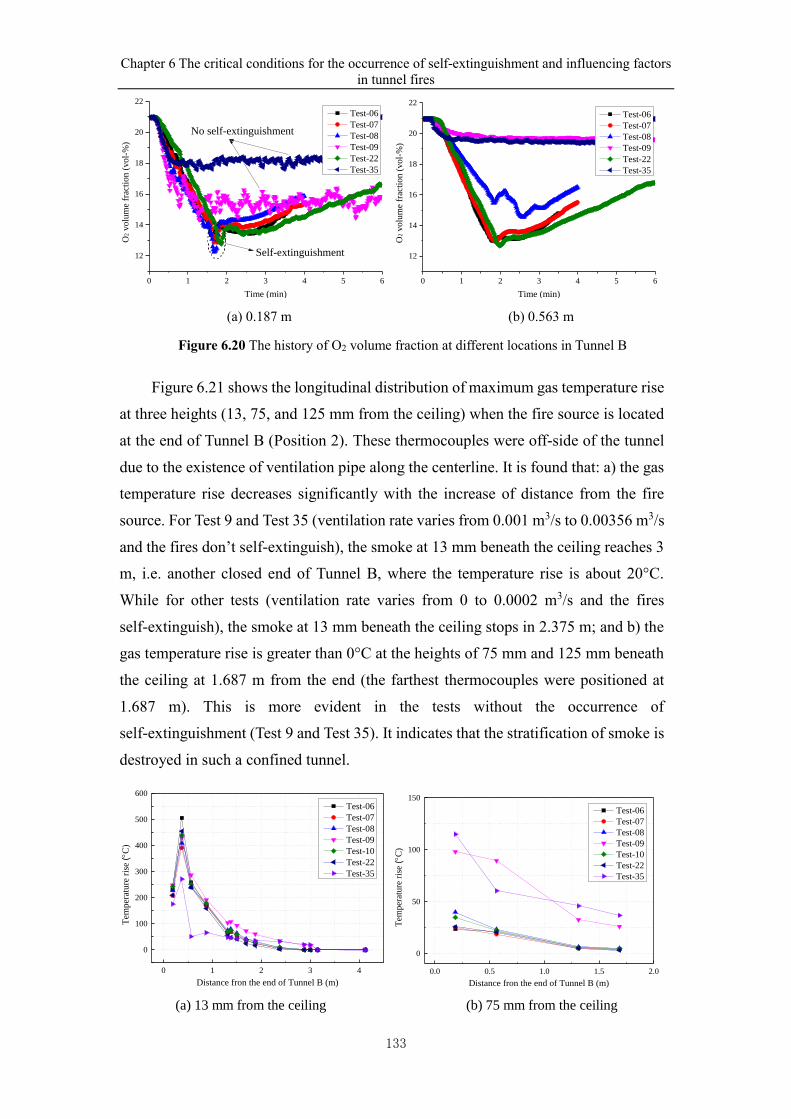
Chapter 6 The critical conditions for the occurrence of self-extinguishment and influencing factors
in tunnel fires
133
0 1 2 3 4 5 6
12
14
16
18
20
22
No self-extinguishment
Self-extinguishment
Test-06
Test-07
Test-08
Test-09
Test-22
Test-35
O2 v
olu
me
frac
tio
n (
vo
l-%
)
Time (min) 0 1 2 3 4 5 6
12
14
16
18
20
22
Test-06
Test-07
Test-08
Test-09
Test-22
Test-35
O2 v
olu
me
frac
tio
n (
vo
l-%
)
Time (min)
(a) 0.187 m (b) 0.563 m
Figure 6.20 The history of O2 volume fraction at different locations in Tunnel B
Figure 6.21 shows the longitudinal distribution of maximum gas temperature rise
at three heights (13, 75, and 125 mm from the ceiling) when the fire source is located
at the end of Tunnel B (Position 2). These thermocouples were off-side of the tunnel
due to the existence of ventilation pipe along the centerline. It is found that: a) the gas
temperature rise decreases significantly with the increase of distance from the fire
source. For Test 9 and Test 35 (ventilation rate varies from 0.001 m3/s to 0.00356 m3/s
and the fires don’t self-extinguish), the smoke at 13 mm beneath the ceiling reaches 3
m, i.e. another closed end of Tunnel B, where the temperature rise is about 20°C.
While for other tests (ventilation rate varies from 0 to 0.0002 m3/s and the fires
self-extinguish), the smoke at 13 mm beneath the ceiling stops in 2.375 m; and b) the
gas temperature rise is greater than 0°C at the heights of 75 mm and 125 mm beneath
the ceiling at 1.687 m from the end (the farthest thermocouples were positioned at
1.687 m). This is more evident in the tests without the occurrence of
self-extinguishment (Test 9 and Test 35). It indicates that the stratification of smoke is
destroyed in such a confined tunnel.
0 1 2 3 4
0
100
200
300
400
500
600
Test-06
Test-07
Test-08
Test-09
Test-10
Test-22
Test-35
Tem
per
ature
ris
e (
C)
Distance fron the end of Tunnel B (m) 0.0 0.5 1.0 1.5 2.0
0
50
100
150
Tem
per
ature
ris
e (
C)
Distance fron the end of Tunnel B (m)
Test-06
Test-07
Test-08
Test-09
Test-10
Test-22
Test-35
(a) 13 mm from the ceiling (b) 75 mm from the ceiling
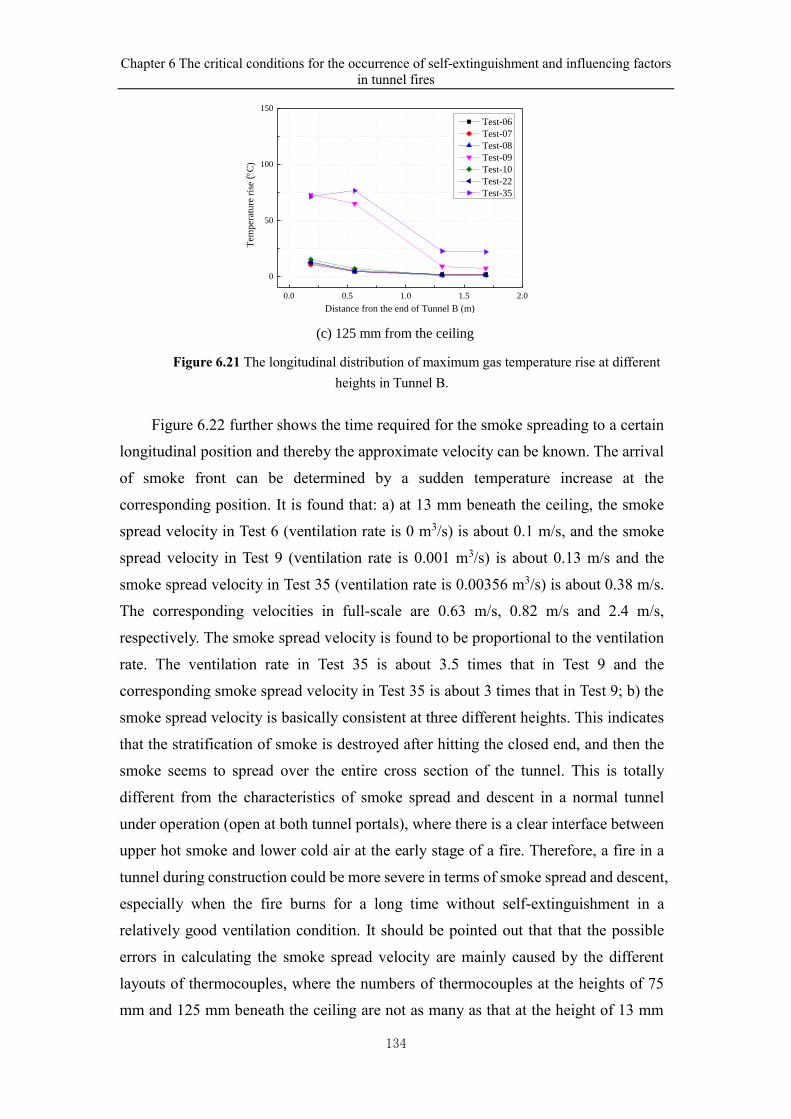
Chapter 6 The critical conditions for the occurrence of self-extinguishment and influencing factors
in tunnel fires
134
0.0 0.5 1.0 1.5 2.0
0
50
100
150
Tem
per
ature
ris
e (
C)
Distance fron the end of Tunnel B (m)
Test-06
Test-07
Test-08
Test-09
Test-10
Test-22
Test-35
(c) 125 mm from the ceiling
Figure 6.21 The longitudinal distribution of maximum gas temperature rise at different
heights in Tunnel B.
Figure 6.22 further shows the time required for the smoke spreading to a certain
longitudinal position and thereby the approximate velocity can be known. The arrival
of smoke front can be determined by a sudden temperature increase at the
corresponding position. It is found that: a) at 13 mm beneath the ceiling, the smoke
spread velocity in Test 6 (ventilation rate is 0 m3/s) is about 0.1 m/s, and the smoke
spread velocity in Test 9 (ventilation rate is 0.001 m3/s) is about 0.13 m/s and the
smoke spread velocity in Test 35 (ventilation rate is 0.00356 m3/s) is about 0.38 m/s.
The corresponding velocities in full-scale are 0.63 m/s, 0.82 m/s and 2.4 m/s,
respectively. The smoke spread velocity is found to be proportional to the ventilation
rate. The ventilation rate in Test 35 is about 3.5 times that in Test 9 and the
corresponding smoke spread velocity in Test 35 is about 3 times that in Test 9; b) the
smoke spread velocity is basically consistent at three different heights. This indicates
that the stratification of smoke is destroyed after hitting the closed end, and then the
smoke seems to spread over the entire cross section of the tunnel. This is totally
different from the characteristics of smoke spread and descent in a normal tunnel
under operation (open at both tunnel portals), where there is a clear interface between
upper hot smoke and lower cold air at the early stage of a fire. Therefore, a fire in a
tunnel during construction could be more severe in terms of smoke spread and descent,
especially when the fire burns for a long time without self-extinguishment in a
relatively good ventilation condition. It should be pointed out that that the possible
errors in calculating the smoke spread velocity are mainly caused by the different
layouts of thermocouples, where the numbers of thermocouples at the heights of 75
mm and 125 mm beneath the ceiling are not as many as that at the height of 13 mm
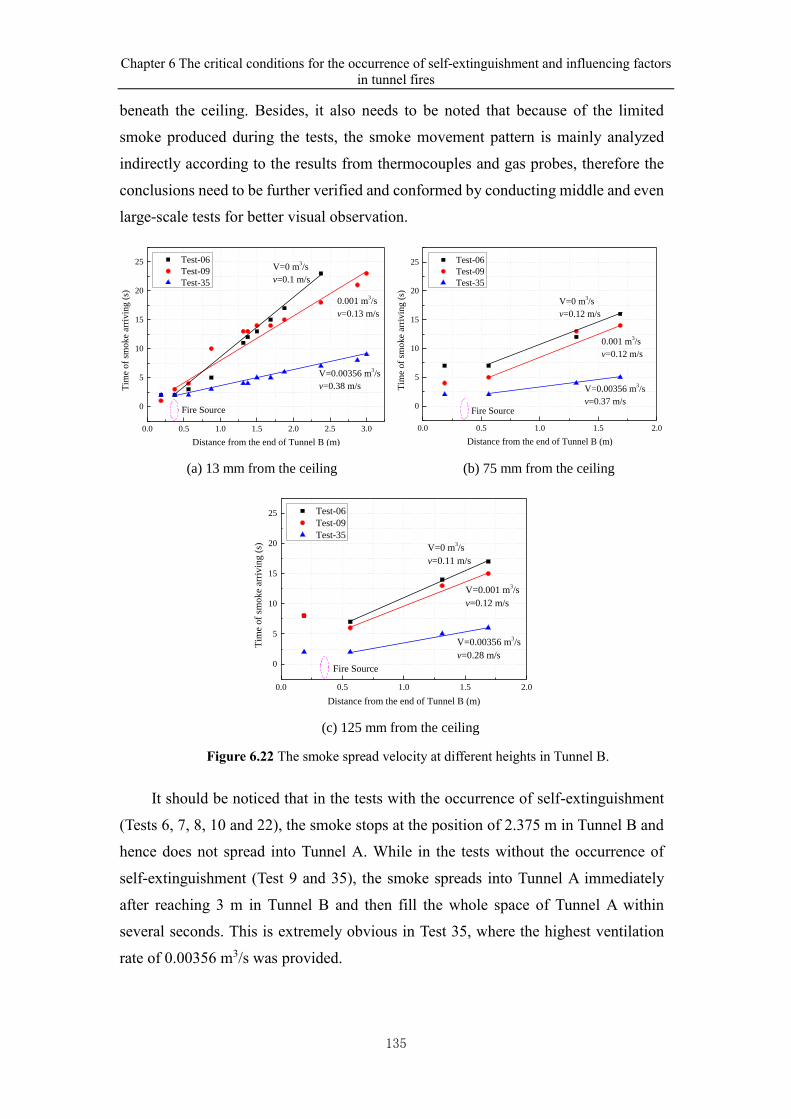
Chapter 6 The critical conditions for the occurrence of self-extinguishment and influencing factors
in tunnel fires
135
beneath the ceiling. Besides, it also needs to be noted that because of the limited
smoke produced during the tests, the smoke movement pattern is mainly analyzed
indirectly according to the results from thermocouples and gas probes, therefore the
conclusions need to be further verified and conformed by conducting middle and even
large-scale tests for better visual observation.
0.0 0.5 1.0 1.5 2.0 2.5 3.0
0
5
10
15
20
25V=0 m
3/s
v=0.1 m/s
0.001 m3/s
v=0.13 m/s
V=0.00356 m3/s
v=0.38 m/sTim
e of
smoke
arri
vin
g (
s)
Distance from the end of Tunnel B (m)
Test-06
Test-09
Test-35
Fire Source
0.0 0.5 1.0 1.5 2.0
0
5
10
15
20
25
Fire Source
Tim
e of
smoke
arri
vin
g (
s)
Distance from the end of Tunnel B (m)
Test-06
Test-09
Test-35
V=0 m3/s
v=0.12 m/s
0.001 m3/s
v=0.12 m/s
V=0.00356 m3/s
v=0.37 m/s
(a) 13 mm from the ceiling (b) 75 mm from the ceiling
0.0 0.5 1.0 1.5 2.0
0
5
10
15
20
25
V=0.00356 m3/s
v=0.28 m/s
V=0.001 m3/s
v=0.12 m/s
V=0 m3/s
v=0.11 m/s
Fire Source
Tim
e of
smoke
arri
vin
g (
s)
Distance from the end of Tunnel B (m)
Test-06
Test-09
Test-35
(c) 125 mm from the ceiling
Figure 6.22 The smoke spread velocity at different heights in Tunnel B.
It should be noticed that in the tests with the occurrence of self-extinguishment
(Tests 6, 7, 8, 10 and 22), the smoke stops at the position of 2.375 m in Tunnel B and
hence does not spread into Tunnel A. While in the tests without the occurrence of
self-extinguishment (Test 9 and 35), the smoke spreads into Tunnel A immediately
after reaching 3 m in Tunnel B and then fill the whole space of Tunnel A within
several seconds. This is extremely obvious in Test 35, where the highest ventilation
rate of 0.00356 m3/s was provided.
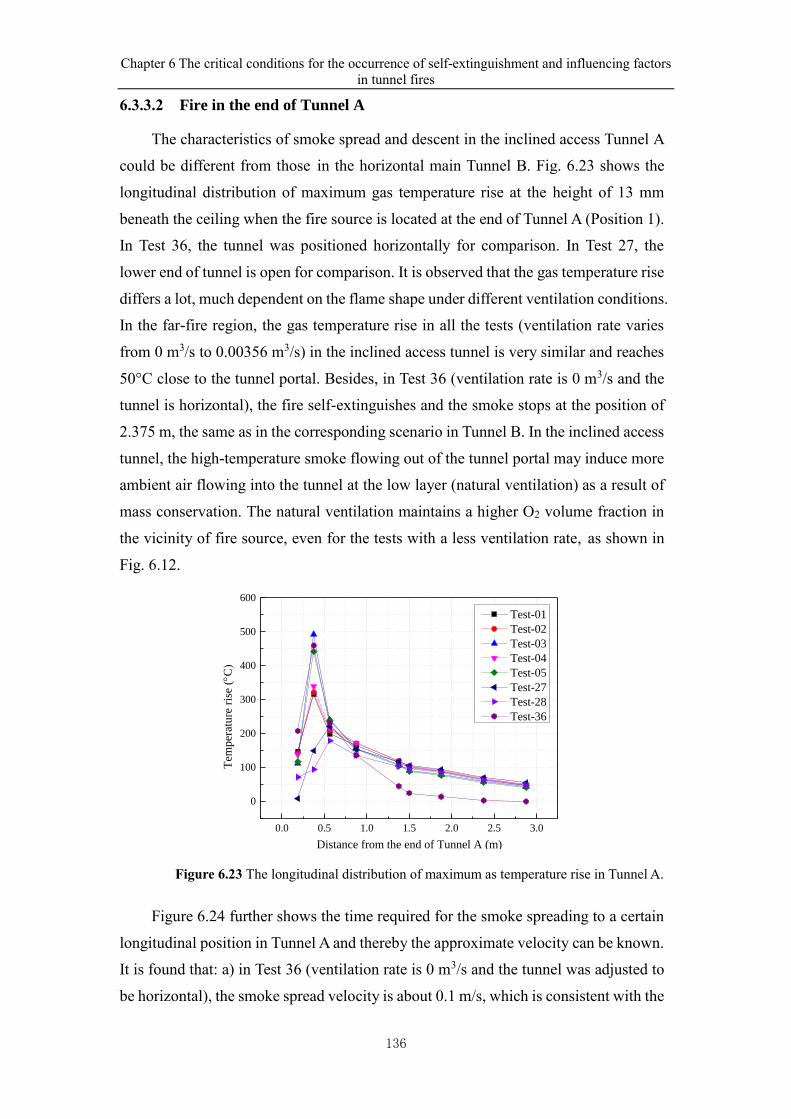
Chapter 6 The critical conditions for the occurrence of self-extinguishment and influencing factors
in tunnel fires
136
6.3.3.2 Fire in the end of Tunnel A
The characteristics of smoke spread and descent in the inclined access Tunnel A
could be different from those in the horizontal main Tunnel B. Fig. 6.23 shows the
longitudinal distribution of maximum gas temperature rise at the height of 13 mm
beneath the ceiling when the fire source is located at the end of Tunnel A (Position 1).
In Test 36, the tunnel was positioned horizontally for comparison. In Test 27, the
lower end of tunnel is open for comparison. It is observed that the gas temperature rise
differs a lot, much dependent on the flame shape under different ventilation conditions.
In the far-fire region, the gas temperature rise in all the tests (ventilation rate varies
from 0 m3/s to 0.00356 m3/s) in the inclined access tunnel is very similar and reaches
50°C close to the tunnel portal. Besides, in Test 36 (ventilation rate is 0 m3/s and the
tunnel is horizontal), the fire self-extinguishes and the smoke stops at the position of
2.375 m, the same as in the corresponding scenario in Tunnel B. In the inclined access
tunnel, the high-temperature smoke flowing out of the tunnel portal may induce more
ambient air flowing into the tunnel at the low layer (natural ventilation) as a result of
mass conservation. The natural ventilation maintains a higher O2 volume fraction in
the vicinity of fire source, even for the tests with a less ventilation rate, as shown in
Fig. 6.12.
0.0 0.5 1.0 1.5 2.0 2.5 3.0
0
100
200
300
400
500
600
Test-01
Test-02
Test-03
Test-04
Test-05
Test-27
Test-28
Test-36
Tem
per
ature
ris
e (
C)
Distance from the end of Tunnel A (m)
Figure 6.23 The longitudinal distribution of maximum as temperature rise in Tunnel A.
Figure 6.24 further shows the time required for the smoke spreading to a certain
longitudinal position in Tunnel A and thereby the approximate velocity can be known.
It is found that: a) in Test 36 (ventilation rate is 0 m3/s and the tunnel was adjusted to
be horizontal), the smoke spread velocity is about 0.1 m/s, which is consistent with the
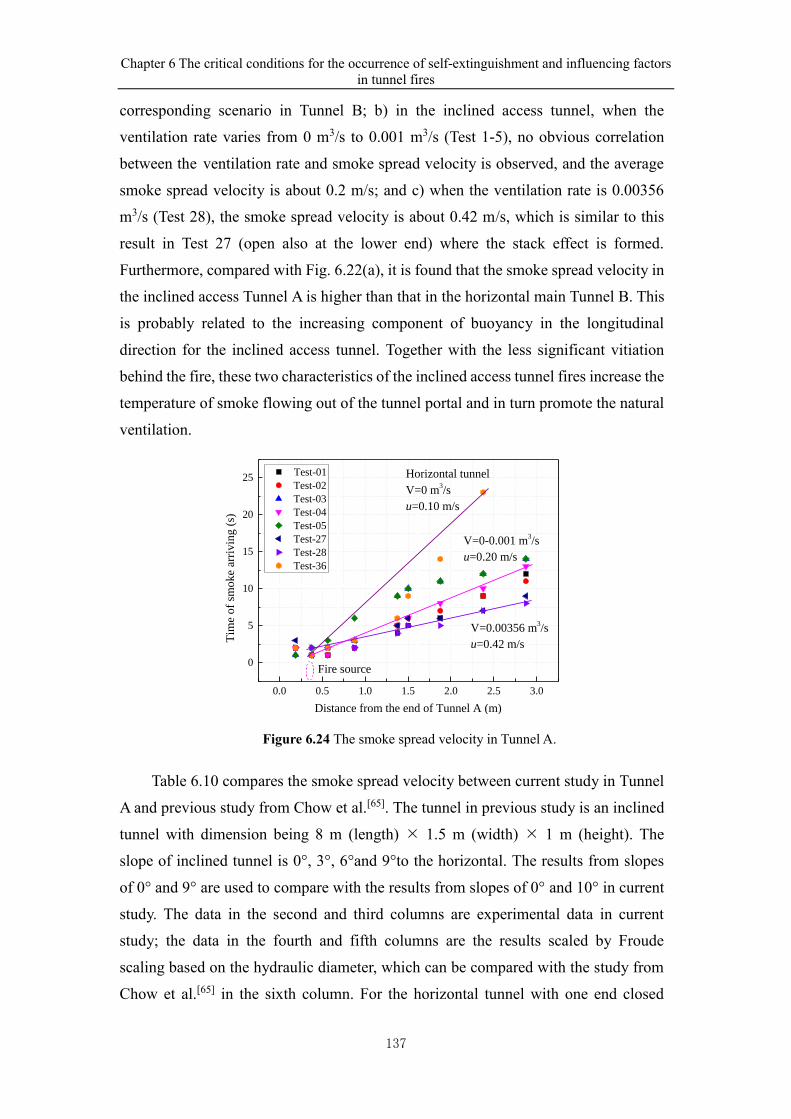
Chapter 6 The critical conditions for the occurrence of self-extinguishment and influencing factors
in tunnel fires
137
corresponding scenario in Tunnel B; b) in the inclined access tunnel, when the
ventilation rate varies from 0 m3/s to 0.001 m3/s (Test 1-5), no obvious correlation
between the ventilation rate and smoke spread velocity is observed, and the average
smoke spread velocity is about 0.2 m/s; and c) when the ventilation rate is 0.00356
m3/s (Test 28), the smoke spread velocity is about 0.42 m/s, which is similar to this
result in Test 27 (open also at the lower end) where the stack effect is formed.
Furthermore, compared with Fig. 6.22(a), it is found that the smoke spread velocity in
the inclined access Tunnel A is higher than that in the horizontal main Tunnel B. This
is probably related to the increasing component of buoyancy in the longitudinal
direction for the inclined access tunnel. Together with the less significant vitiation
behind the fire, these two characteristics of the inclined access tunnel fires increase the
temperature of smoke flowing out of the tunnel portal and in turn promote the natural
ventilation.
0.0 0.5 1.0 1.5 2.0 2.5 3.0
0
5
10
15
20
25 Test-01
Test-02
Test-03
Test-04
Test-05
Test-27
Test-28
Test-36
Fire source
V=0.00356 m3/s
u=0.42 m/s
V=0-0.001 m3/s
u=0.20 m/s
Horizontal tunnel
V=0 m3/s
u=0.10 m/s
Tim
e o
f sm
ok
e ar
riv
ing
(s)
Distance from the end of Tunnel A (m)
Figure 6.24 The smoke spread velocity in Tunnel A.
Table 6.10 compares the smoke spread velocity between current study in Tunnel
A and previous study from Chow et al.[65]. The tunnel in previous study is an inclined
tunnel with dimension being 8 m (length) 1.5 m (width) 1 m (height). The
slope of inclined tunnel is 0°, 3°, 6°and 9°to the horizontal. The results from slopes
of 0° and 9° are used to compare with the results from slopes of 0° and 10° in current
study. The data in the second and third columns are experimental data in current
study; the data in the fourth and fifth columns are the results scaled by Froude
scaling based on the hydraulic diameter, which can be compared with the study from
Chow et al.[65] in the sixth column. For the horizontal tunnel with one end closed
Chapter 6 The critical conditions for the occurrence of self-extinguishment and influencing factors
in tunnel fires
138
(Test 36), it is found that the smoke spread velocity (0.28 m/s) is much lower than
that without closed end (0.6 m/s). This is probably related to this fact that the fire
self-extinguished at the early stage in current study. Another possible reason is that
under such confined conditions, the destroyed stratification of smoke after hitting the
closed end decreases the smoke spread velocity to some extent. Besides, for the
inclined tunnel with lower end closed (Test 1), the smoke spread velocity (0.57 m/s)
is also much lower than that without closed end (1.3 m/s). This is because in the
inclined tunnel without closed end, the stack effect has been formed and the smoke
spread velocity is accelerated. However, when the lower end of the inclined tunnel is
open (Test 27), the smoke spread velocity (1.19 m/s) in current study is similar to
this corresponding result (1.3 m/s) from Chow et al.
Table 10. Comparison of smoke spread velocity between current study in Tunnel A and previous
study from Chow et al.[65].
Experiment results
(m/s)
Scaled by Froude scaling
(m/s)
Study from Chow
et al.[65] (m/s)
Boundary
conditions
Closed at
lower end
Open at
lower end
Closed at
lower end
Open at
lower end
Open at
lower end
0° 0.1 - 0.28 - 0.60
10°(9°) 0.2 0.42 0.57 1.19 1.30
6.4 Summary
This chapter studies the typical characteristics of tunnel fires during
construction in a model-scale tunnel. As a further extension of under-ventilated
tunnel fires from Chapter 5, the critical conditions for the occurrence of
self-extinguishment and influencing factors as well as the characteristics of smoke
spread in tunnels are of main concern. The tunnel consists of an inclined access
tunnel and a horizontal main tunnel during construction. The main tunnel has two
dead ends (excavation face) and the only opening is from one side of the access tunnel.
A ventilation system was provided through a ventilation pipe beneath the ceiling.
Propane gas burner and the fibre board soaked with the heptane were used as fuels. In
the following main conclusions from this chapter are given:
(a) In the horizontal main tunnel, the critical equivalence ratio for the
occurrence of self-extinguishment is within 0.28 - 1.38 for the propane gas burner
and 1.11 - 3.6 for the fibre board soaked with heptane. The difference is related to
Chapter 6 The critical conditions for the occurrence of self-extinguishment and influencing factors
in tunnel fires
139
the nature of different fuels. For the fibre board soaked with heptane, when the O2
volume fraction around the fire is low, the burning rate tends to decrease. While for
the gas burner, tthe fuel supply rate is constant during the test. Besides, the critical
O2 volume fraction for the occurrence of self-extinguishment varies from 12 % - 15 %
for both types of fuels.
(b) The fire location in the horizontal main tunnel has a significant influence on
the fire development. For the fire board soaked with heptane, a well-ventilated fire at
the center of the tunnel becomes under-ventilated due to vitiation when it is located
at the closed end of the tunnel (i.e. excavation face).
(c) For a typical tunnel fire that occurs at the closed end of the horizontal main
tunnel (i.e. excavation faces), the stratification of smoke is destroyed after hitting the
closed end, and then the smoke seems to spread over the entire cross section of the
tunnel, and the smoke spread velocity is proportional to the ventilation rate. Further,
for the fire with the occurrence of self-extinguishment, the smoke stops after
spreading over a distance and hence doesn’t reach the access tunnel. While for the
fire without the occurrence of self-extinguishment, the smoke spreads into the access
tunnel immediately after passing through the main tunnel and then fills the access
tunnel quickly.
(d) However, when a fire occurs at the closed end of the inclined access tunnel
(lower end), the fire does not self-extinguish even when the ventilation rate is 0 m3/s.
Moreover, the smoke spread velocity is higher than that in the horizontal main tunnel.
This is probably related to the increasing component of buoyancy in the longitudinal
direction in the inclined access tunnel. Together with the insignificant vitiation
behind the fire, these two characteristics in the inclined access tunnel increase the
temperature of smoke flowing out of the tunnel portal and in turn promote the
natural ventilation.
Chapter 7 Conclusions and future works
140
Chapter 7 Conclusions and future works
7.1 Conclusions
The previous studies about tunnel fire dynamics and mitigation measures are
mostly based on good ventilation conditions in tunnels, such as longitudinal
ventilation and natural ventilation with the premise that a tunnel has two open portals.
However, in some special fire scenarios in tunnels or channels, such as fires in a
subway train, a building corridor, an underground utility tunnel, a mining tunnel, a
tunnel during construction and the application of sealing tunnel portals for fighting
large tunnel fires, etc, both of the tunnel portals may be in an incomplete or even
completely closed or blocked state, which will significantly limit the ventilation
inside the tunnel. The studies about tunnel fires under confined portal boundaries are
rare. The knowledge of tunnel fire dynamics for tunnels under good ventilation
conditions is probably not applicable to the scenarios of tunnel fires under confined
portal boundaries. Therefore, by combining model/medium-scale tunnel experiments
and theoretical analyses, this thesis studies the fire behaviors and smoke transportation
law of tunnel fires under confined portal boundaries. The outcomings are of great
importance for improving the understanding of tunnel fires under confined portal
boundaries and developing fire mitigation measures. The main research contents and
conclusions include:
1. As a further extension of tunnel fire similarity theory, the scaling effects of
pool fires (well-ventilated) are studied by combining a large amount of
experimental data collected with theoretical analysis. Specifically, the
coupling effects of wind velocity, pool diameter and tunnel environment on
the MLRPUA of pool fires are revealed.
When a small-scale pool fire (D<1 m, especially for pools with D<0.2 m) occurs
in the open, the ventilation significantly increases the conductive and convective heat
feedbacks, which are the leading heat feedback mode. As a result, increasing wind
velocity tends to increase the MLRPUA. But when small-scale pool fires occurs in
tunnels, the radiative heat feedback from the tunnel ceiling is probably dominating if
the distance between the pool surface and ceiling is shorter (Hef/D<3). This results in
Chapter 7 Conclusions and future works
141
a much higher MLRPUA than that in the free burn. At this point, when subjected to
longitudinal flows, the MLRPUA decreases due to the reduced radiation from the
tunnel ceiling. However, with a further increase in wind velocity (at a higher wind
velocity level), the conductive and convective heat feedback probably become leading
and therefore increase the MLRPUA. If the distance between the pool surface and
ceiling is longer (Hef/D>4), the radiation from the ceiling is not significant and
therefore the burning characteristics of pool fires in tunnels are similar to those in the
open. With the increase of pool diameter, the influence of wind on the MLRPUA
decreases gradually, no matter whether the pool occurs in the open or in a tunnel.
Finally, when the pool diameter exceeds 1 m, the radiation from flame itself is
probably predominant. The MLRPUA is not affected significantly by increasing wind
velocity and most likely fluctuates within 30% for a wide range of wind velocities
based on the test data collected, which is far less than previous conclusions obtained
solely from small-scale pool fire experiments.
2. The flame behaviors and maximum gas temperature rise beneath the ceiling
in an enclosed tunnel are studied using a model-scale tunnel. A prediction
model of maximum gas temperature rise is finally developed.
The flame characteristics in an enclosed tunnel are different from those in a
normal tunnel (small fire, i.e. the continuous flame doesn’t reach the tunnel ceiling).
When a fire is not located at the tunnel center, there is a temperature (pressure)
difference on both sides of the flame resulted from the asymmetric flow field. As a
result, the flame inclines towards the closer tunnel end. When a fire is moving away
from the tunnel center, in Region I (0≤ d ≤0.64), the maximum gas temperature rise
decreases with the increasing dimensionless fire distance ( d ) due to the increasing
flame inclination angle. While in Region II (0.64 d 1), the maximum gas
temperature rise increases with the increasing dimensionless fire distance due to the
heat feedback of returned hot smoke bounced from the end wall. By introducing a
concept of equivalent ventilation velocity based on the flame inclination mechanism,
a prediction model of maximum gas temperature rise beneath the ceiling in Region I
is developed. Beyond that, an extra correction factor is proposed in Region II with a
consideration of heat feedback of returned hot smoke. Besides, further dimensional
analysis indicates that the normalized maximum gas temperature rise follows an
exponential attenuation law with the dimensionless fire distance.
Maximum gas temperature rise can be predicted by:
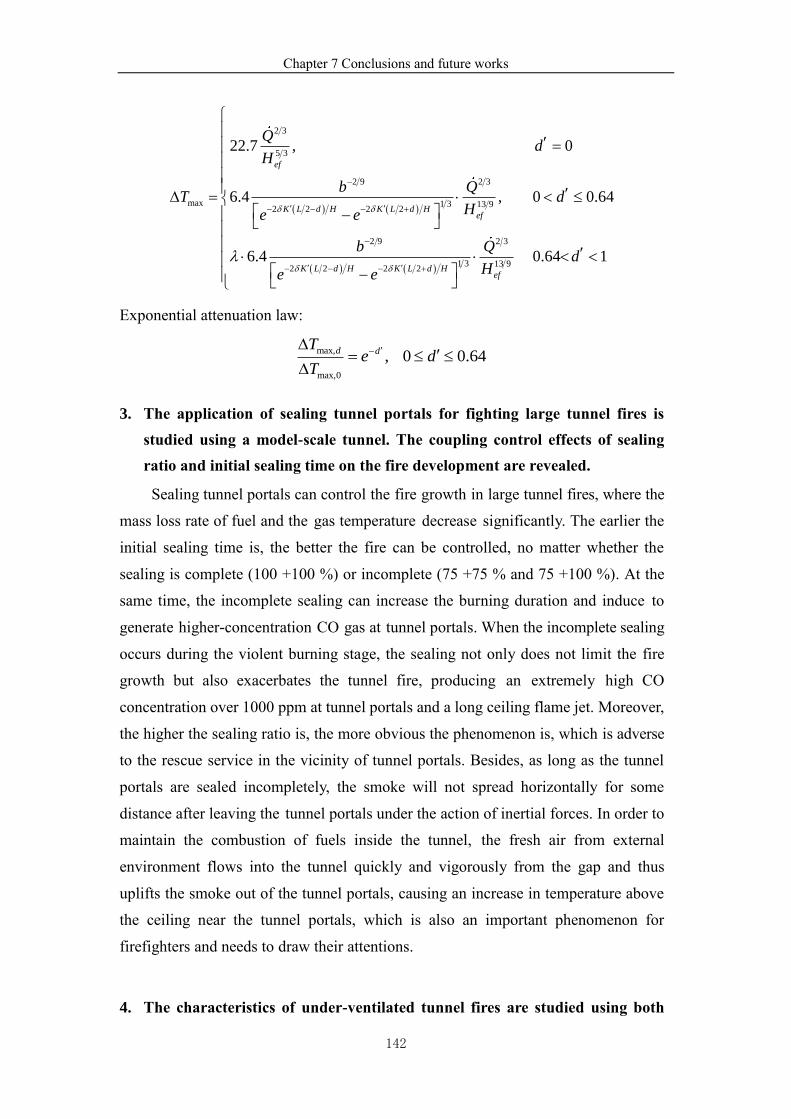
Chapter 7 Conclusions and future works
142
( ) ( )
( ) ( )
2 3
5 3
2 9 2 3
max 1 3 13 92 2 2 2
2 9 2 3
1 3 13 92 2 2 2
22.7 , 0
6.4 , 0 0.64
6.4 0.64
ef
K L d H K L d Hef
K L d H K L d Hef
Qd
H
b QT d
He e
b Qd
He e
−
− − − +
−
− − − +
=
= −
−
1
Exponential attenuation law:
max,
max,0
, 0 0.64d d
Te d
T
−
=
3. The application of sealing tunnel portals for fighting large tunnel fires is
studied using a model-scale tunnel. The coupling control effects of sealing
ratio and initial sealing time on the fire development are revealed.
Sealing tunnel portals can control the fire growth in large tunnel fires, where the
mass loss rate of fuel and the gas temperature decrease significantly. The earlier the
initial sealing time is, the better the fire can be controlled, no matter whether the
sealing is complete (100 +100 %) or incomplete (75 +75 % and 75 +100 %). At the
same time, the incomplete sealing can increase the burning duration and induce to
generate higher-concentration CO gas at tunnel portals. When the incomplete sealing
occurs during the violent burning stage, the sealing not only does not limit the fire
growth but also exacerbates the tunnel fire, producing an extremely high CO
concentration over 1000 ppm at tunnel portals and a long ceiling flame jet. Moreover,
the higher the sealing ratio is, the more obvious the phenomenon is, which is adverse
to the rescue service in the vicinity of tunnel portals. Besides, as long as the tunnel
portals are sealed incompletely, the smoke will not spread horizontally for some
distance after leaving the tunnel portals under the action of inertial forces. In order to
maintain the combustion of fuels inside the tunnel, the fresh air from external
environment flows into the tunnel quickly and vigorously from the gap and thus
uplifts the smoke out of the tunnel portals, causing an increase in temperature above
the ceiling near the tunnel portals, which is also an important phenomenon for
firefighters and needs to draw their attentions.
4. The characteristics of under-ventilated tunnel fires are studied using both
Chapter 7 Conclusions and future works
143
model-scale and medium-scale tunnels. Based on the equivalence ratio, the
critical conditions for the occurrence of under-ventilated tunnel fires are
quantitatively analyzed and the conversion mechanisms from the
insufficient combustion in early under-ventilated tunnel fires to sufficient
combustion are revealed.
The characteristics of under-ventilated tunnel fires are related to the pool scale.
For a smaller pool fire (0.3 m), the flame size dramatically reduces with a lifted and
fluttering flame and accompanies an oscillating MLRPUA. But this similar
phenomenon doesn’t occur in the larger pool fire (0.65 m). In tunnel fires with
confined portal boundaries, the fire gas is accumulated in the vicinity of the flame
and vitiates the combustion environment by mixing the incoming air. Consequently,
the vitiation reduces the O2 volume fraction. Therefore, the critical equivalence ratio
for the occurrence of under-ventilated tunnel fires is found to be within 0.53 - 0.6,
which is less than the theoretical value of 1. For under-ventilated tunnel fires, the
low ventilation rate and vitiation result in a low O2 volume fraction around the flame.
The MLRPUA starts to decrease with the decrease of O2 volume fraction.
Consequently, the ventilation rate approaches and even reaches the amount required
for sufficient combustion of vaporized fuel. This means that the insufficient
combustion in early under-ventilated tunnel fires has converted to sufficient
combustion (from the perspective of the change of equivalence ratio, the fire has
converted from under-ventilated to well-ventilated). As a result, no significant
increase in CO production in under-ventilated tunnel fires is observed in both test
series. Besides, the CO production is related to the scaling effects of pool fires and
fuel types.
5. The typical characteristics of tunnel fires during construction are studied
using a model-scale tunnel. As a further extension of under-ventilated tunnel
fires, the critical conditions for the occurrence of self-extinguishment and
influencing factors as well as the characteristics of smoke spread in tunnels
are of main concern.
When a fire occurs in the horizontal main tunnel (closed at both ends), the
critical equivalence ratio for the occurrence of self-extinguishment is within 0.28 -
1.38 for the propane gas burner and 1.11 - 3.6 for the fibre board soaked with
heptane. The difference is related to the burning behavior of the different fuels used.
Besides, the critical O2 volume fraction for the occurrence of self-extinguishment
Chapter 7 Conclusions and future works
144
varies within 12 % - 15 % for both types of fuels. When a fire occurs at the closed
end of the horizontal main tunnel (i.e. excavation face), the stratification of smoke is
destroyed after hitting the closed end and then the smoke seems to spread over the
entire cross section of the tunnel. The smoke spread velocity is proportional to the
ventilation rate. However, when a fire occurs at the closed end of the inclined access
tunnel (lower end), the fire does not self-extinguish even when the ventilation rate is
0 m3/s. Moreover, the smoke spread velocity is higher than that in the horizontal
main tunnel. This is probably related to the increasing component of buoyancy in the
longitudinal direction in the inclined access tunnel. Together with the insignificant
vitiation behind the fire, these two characteristics in the inclined access tunnel
increase the temperature of smoke flowing out of the tunnel portal and in turn
promote the natural ventilation and increase the O2 volume fraction.
7.2 Innovation points
1. Analyze the coupling effects of wind velocity, pool diameter and tunnel
environment on the MLRPUA of pool fires and reveal the scaling effects of mass
loss rate per unit area of pool fires.
2. Discover the phenomenon of flame inclination and the law of maximum gas
temperature rise beneath the ceiling varying with longitudinal fire location in an
enclosed tunnel. By introducing a concept of equivalent ventilation velocity
based on the flame inclination mechanism, a prediction model of maximum gas
temperature rise is developed.
3. Explore the application of sealing tunnel portals for fighting large tunnel fires
and reveal the coupling control effects of sealing ratio and initial sealing time on
the fire development. Find out some dangerous phenomena which may threaten
the rescue service.
4. Analyze the characteristics of under-ventilated tunnel fires and
self-extinguishment. Quantify the critical conditions for the occurrence of
under-ventilated tunnel fires and self-extinguishment. Explain the conversion
mechanisms from the insufficient combustion in early under-ventilated tunnel
fires to sufficient combustion.
Chapter 7 Conclusions and future works
145
7.3 Future works
1. The fourth chapter studies the application of sealing tunnel portals for
fighting large tunnel fires. Unsealing the tunnel after the sealing process is the next
step of the rescue service. Unreasonable unsealing may result in a re-ignition of the
flame or even explosion. Therefore, the unsealing time and unsealing measures
needs to be systematically studied in the future.
2. The sixth chapter uses the equivalence ratio to quantify the critical conditions
for the occurrence of self-extinguishment. But no specific value can be given as
there are missing values within the measurement range. Besides, due to the
limitation of experimental conditions, the calculation method of equivalence ratio is
slightly different from that in the fifth chapter. Therefore, the results will be further
optimized through experiments in the future.
References
146
References
[1] He J, Gao B, Xue T, Bai YB. Consideration on scientific maintenance mangement of highway
tunnel in China[J]. Tunnel Construction, 2018, 38: 51-57.
[2] Li J. Research on the mechanism and method of knowledge support for construction safety risk
management of urban rail transit [D]. Xuzhou: China University of Mining and Technology, 2018.
[3] Zhao Y, Tian SM. Data statistics of China railway tunnel[J]. Tunnel Construction, 2017, 37(5):
641-642.
[4] Fan CG. Studies on Characteristics of Tunnel Fire Development and Natural Ventilation Mode
Using Shafts[D]. Hefei: University of Science and Technology of China, 2015.
[5] Li YZ, Ingason H. The maximum ceiling gas temperature in a large tunnel fire[J]. Fire Safety
Journal, 2012, 48: 38-48.
[6] Khoury GA. Effect of fire on concrete and concrete structures[J]. Progress in Structural
Engineering and Materials, 2000, 2(4): 429-447.
[7] Connolly RJ. The spalling of concrete in fires[D]. Aston University, 1995.
[8] Gao ZH. Studies on characteristics of confined fire plumes and mechanism of natural smoke
exhaust by shaft in tunnel fires[D]. Hefei: University of Science and Technology of China, 2016.
[9] Lai JX, Zhou H, Cheng F, Wang H, Feng ZH. Statistical analysis of fire accident in highway
tunnels and countermeasures for disaster prevention and reduction[J]. Tunnel Construction, 2017,
37(4): 409-415.
[10] Zhang SG. Effect of subway train on the characteristics of back-flowed smoke in longitudinal
ventilated subway tunnel[D]. Hefei: University of Science and Technology of China, 2017.
[11] Wei PA. Lessons from the Baku subway fire [J]. Fire Technique and Products Information, 1996,
(8): 15.
[12] Li LB, Wang LX, Zhang YM. Application of plugging tactics in railway tunnel fire fighting and
rescue [J]. Fire Science and Technology, 2011, 30(10): 955-958.
[13] Hu LH. Studies on thermal physics of smoke movement in tunnel fires[D]. Hefei: University of
Science and Technology of China, 2006.
[14] Ingason H, Li YZ, Lönnermark A. Tunnel Fire Dynamics[M]. Springer, 2014.
[15] Mawhinney JR. Fixed fire protection systems in tunnels: issues and directions[J]. Fire
Technology, 2013, 49(2): 477-508.
[16] Kunsch J. Critical velocity and range of a fire-gas plume in a ventilated tunnel[J]. Atmospheric
Environment, 1998, 33(1): 13-24.
[17] Oka Y, Oka H, Imazeki O. Ceiling-jet thickness and vertical distribution along flat-ceilinged
horizontal tunnel with natural ventilation[J]. Tunnelling and Underground Space Technology, 2016,
53: 68-77.
[18] Oka Y, Oka H. Velocity and temperature attenuation of a ceiling-jet along a horizontal tunnel
with a flat ceiling and natural ventilation[J]. Tunnelling and Underground Space Technology, 2016, 56:
79-89.
[19] Bailey J, Forney GP, Tatem P, Jones W. Development and validation of corridor flow submodel
for CFAST[J]. Journal of Fire Protection Engineering, 2002, 12(3): 139-161.
[20] Newman JS. Experimental evaluation of fire-induced stratification[J]. Combustion and Flame,
References
147
1984, 57(1): 33-39.
[21] Yang D, Hu LH, Huo R, Jiang Y, Liu S, Tang F. Experimental study on buoyant flow
stratification induced by a fire in a horizontal channel[J]. Applied Thermal Engineering, 2010, 30(8-9):
872-878.
[22] Ingason H. Correlation between temperatures and oxygen measurements in a tunnel flow[J]. Fire
Safety Journal, 2007, 42(1): 75-80.
[23] Alpert RL. Calculation of response time of ceiling-mounted fire detectors[J]. Fire Technology,
1972, 8(3): 181-195.
[24] Kurioka H, Oka Y, Satoh H, Sugawa O. Fire properties in near field of square fire source with
longitudinal ventilation in tunnels[J]. Fire Safety Journal, 2003, 38(4): 319-340.
[25] Li YZ, Lei B, Ingason H. The maximum temperature of buoyancy-driven smoke flow beneath
the ceiling in tunnel fires[J]. Fire Safety Journal, 2011, 46(4): 204-210.
[26] Evers E, Waterhouse A. A complete model for analyzing smoke movement in buildings[R].
Building Research Establishment, 1978.
[27] Delichatsios MA. The flow of fire gases under a beamed ceiling[J]. Combustion and Flame, 1981,
43: 1-10.
[28] Kim MB, Han YS, Yoon MO. Laser-assisted visualization and measurement of corridor smoke
spread[J]. Fire Safety Journal, 1998, 31(3): 239-251.
[29] Hu LH, Huo R, Chow WK, Wang HB, Yang RX. Decay of buoyant smoke layer temperature
along the longitudinal direction in tunnel fires[J]. Journal of Applied Fire Science, 2004, 13(1): 53-77.
[30] Hu LH, Huo R, Chow WK. Studies on buoyancy-driven back-layering flow in tunnel fires[J].
Experimental Thermal and Fluid Science, 2008, 32(8): 1468-1483.
[31] Gong L, Jiang L, Li SY, Shen N, Zhang YC, Sun JH. Theoretical and experimental study on
longitudinal smoke temperature distribution in tunnel fires[J]. International Journal of Thermal
Sciences, 2016, 102: 319-328.
[32] Zhao SZ, Liu F, Wang F, Weng MC. Experimental studies on fire-induced temperature
distribution below ceiling in a longitudinal ventilated metro tunnel[J]. Tunnelling and Underground
Space Technology, 2018, 72: 281-293.
[33] Thomas PH. The movement of buoyant fluid against a stream and the venting of underground
fires[J]. Fire Safety Science, 1958, 351: 1-1.
[34] Thomas PH. The movement of smoke in horizontal passages against an air flow[J]. Fire Safety
Science, 1968, 723: 1-1.
[35] Heselden A. Studies of fire and smoke behaviour relevant to tunnel[C]. Proc of the 2nd Int Symp
Aerodynamics & Ventilation of Vehicle Tunnels, 1976.
[36] Danziger N. Longtitudinal ventilation analysis for the glenwood canyon tunnels[C]. Proc of the
4th Int Symp Aerodynamics & Ventilation of Vehicle Tunnels, 1982.
[37] Kennedy WD. Critical velocity: past, present and future[C]. One Day Seminar Smoke and
Critical Velocity in Tunnels, 1996.
[38] Oka Y, Atkinson GT. Control of smoke flow in tunnel fires[J]. Fire Safety Journal, 1995, 25(4):
305-322.
[39] Wu Y, Bakar MA. Control of smoke flow in tunnel fires using longitudinal ventilation systems–a
study of the critical velocity[J]. Fire Safety Journal, 2000, 35(4): 363-390.
[40] Li YZ, Lei B, Ingason H. Study of critical velocity and backlayering length in longitudinally
ventilated tunnel fires[J]. Fire safety journal, 2010, 45(6): 361-370.
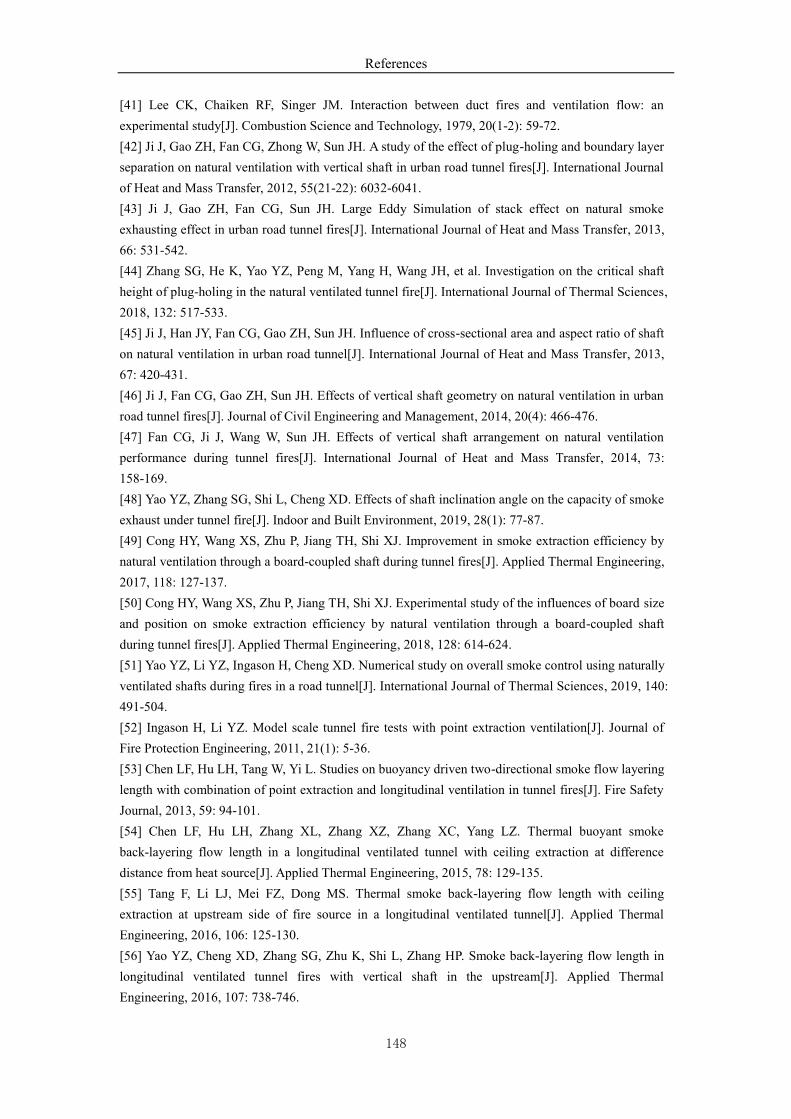
References
148
[41] Lee CK, Chaiken RF, Singer JM. Interaction between duct fires and ventilation flow: an
experimental study[J]. Combustion Science and Technology, 1979, 20(1-2): 59-72.
[42] Ji J, Gao ZH, Fan CG, Zhong W, Sun JH. A study of the effect of plug-holing and boundary layer
separation on natural ventilation with vertical shaft in urban road tunnel fires[J]. International Journal
of Heat and Mass Transfer, 2012, 55(21-22): 6032-6041.
[43] Ji J, Gao ZH, Fan CG, Sun JH. Large Eddy Simulation of stack effect on natural smoke
exhausting effect in urban road tunnel fires[J]. International Journal of Heat and Mass Transfer, 2013,
66: 531-542.
[44] Zhang SG, He K, Yao YZ, Peng M, Yang H, Wang JH, et al. Investigation on the critical shaft
height of plug-holing in the natural ventilated tunnel fire[J]. International Journal of Thermal Sciences,
2018, 132: 517-533.
[45] Ji J, Han JY, Fan CG, Gao ZH, Sun JH. Influence of cross-sectional area and aspect ratio of shaft
on natural ventilation in urban road tunnel[J]. International Journal of Heat and Mass Transfer, 2013,
67: 420-431.
[46] Ji J, Fan CG, Gao ZH, Sun JH. Effects of vertical shaft geometry on natural ventilation in urban
road tunnel fires[J]. Journal of Civil Engineering and Management, 2014, 20(4): 466-476.
[47] Fan CG, Ji J, Wang W, Sun JH. Effects of vertical shaft arrangement on natural ventilation
performance during tunnel fires[J]. International Journal of Heat and Mass Transfer, 2014, 73:
158-169.
[48] Yao YZ, Zhang SG, Shi L, Cheng XD. Effects of shaft inclination angle on the capacity of smoke
exhaust under tunnel fire[J]. Indoor and Built Environment, 2019, 28(1): 77-87.
[49] Cong HY, Wang XS, Zhu P, Jiang TH, Shi XJ. Improvement in smoke extraction efficiency by
natural ventilation through a board-coupled shaft during tunnel fires[J]. Applied Thermal Engineering,
2017, 118: 127-137.
[50] Cong HY, Wang XS, Zhu P, Jiang TH, Shi XJ. Experimental study of the influences of board size
and position on smoke extraction efficiency by natural ventilation through a board-coupled shaft
during tunnel fires[J]. Applied Thermal Engineering, 2018, 128: 614-624.
[51] Yao YZ, Li YZ, Ingason H, Cheng XD. Numerical study on overall smoke control using naturally
ventilated shafts during fires in a road tunnel[J]. International Journal of Thermal Sciences, 2019, 140:
491-504.
[52] Ingason H, Li YZ. Model scale tunnel fire tests with point extraction ventilation[J]. Journal of
Fire Protection Engineering, 2011, 21(1): 5-36.
[53] Chen LF, Hu LH, Tang W, Yi L. Studies on buoyancy driven two-directional smoke flow layering
length with combination of point extraction and longitudinal ventilation in tunnel fires[J]. Fire Safety
Journal, 2013, 59: 94-101.
[54] Chen LF, Hu LH, Zhang XL, Zhang XZ, Zhang XC, Yang LZ. Thermal buoyant smoke
back-layering flow length in a longitudinal ventilated tunnel with ceiling extraction at difference
distance from heat source[J]. Applied Thermal Engineering, 2015, 78: 129-135.
[55] Tang F, Li LJ, Mei FZ, Dong MS. Thermal smoke back-layering flow length with ceiling
extraction at upstream side of fire source in a longitudinal ventilated tunnel[J]. Applied Thermal
Engineering, 2016, 106: 125-130.
[56] Yao YZ, Cheng XD, Zhang SG, Zhu K, Shi L, Zhang HP. Smoke back-layering flow length in
longitudinal ventilated tunnel fires with vertical shaft in the upstream[J]. Applied Thermal
Engineering, 2016, 107: 738-746.
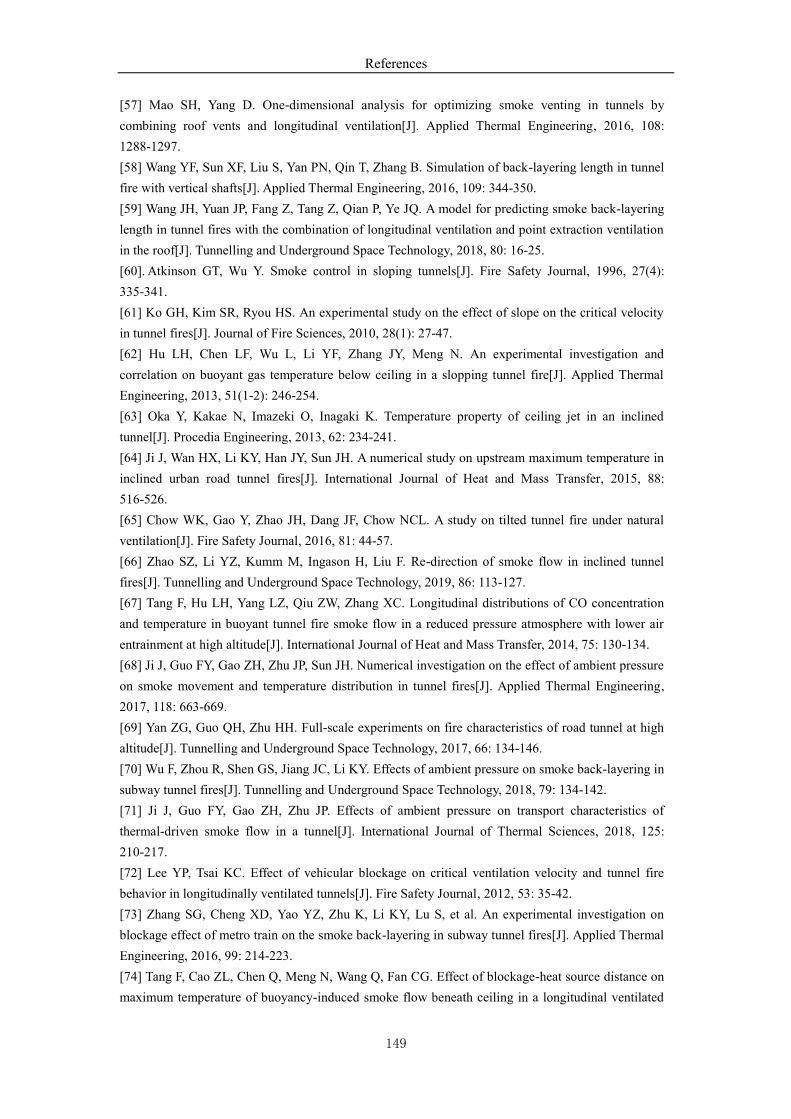
References
149
[57] Mao SH, Yang D. One-dimensional analysis for optimizing smoke venting in tunnels by
combining roof vents and longitudinal ventilation[J]. Applied Thermal Engineering, 2016, 108:
1288-1297.
[58] Wang YF, Sun XF, Liu S, Yan PN, Qin T, Zhang B. Simulation of back-layering length in tunnel
fire with vertical shafts[J]. Applied Thermal Engineering, 2016, 109: 344-350.
[59] Wang JH, Yuan JP, Fang Z, Tang Z, Qian P, Ye JQ. A model for predicting smoke back-layering
length in tunnel fires with the combination of longitudinal ventilation and point extraction ventilation
in the roof[J]. Tunnelling and Underground Space Technology, 2018, 80: 16-25.
[60]. Atkinson GT, Wu Y. Smoke control in sloping tunnels[J]. Fire Safety Journal, 1996, 27(4):
335-341.
[61] Ko GH, Kim SR, Ryou HS. An experimental study on the effect of slope on the critical velocity
in tunnel fires[J]. Journal of Fire Sciences, 2010, 28(1): 27-47.
[62] Hu LH, Chen LF, Wu L, Li YF, Zhang JY, Meng N. An experimental investigation and
correlation on buoyant gas temperature below ceiling in a slopping tunnel fire[J]. Applied Thermal
Engineering, 2013, 51(1-2): 246-254.
[63] Oka Y, Kakae N, Imazeki O, Inagaki K. Temperature property of ceiling jet in an inclined
tunnel[J]. Procedia Engineering, 2013, 62: 234-241.
[64] Ji J, Wan HX, Li KY, Han JY, Sun JH. A numerical study on upstream maximum temperature in
inclined urban road tunnel fires[J]. International Journal of Heat and Mass Transfer, 2015, 88:
516-526.
[65] Chow WK, Gao Y, Zhao JH, Dang JF, Chow NCL. A study on tilted tunnel fire under natural
ventilation[J]. Fire Safety Journal, 2016, 81: 44-57.
[66] Zhao SZ, Li YZ, Kumm M, Ingason H, Liu F. Re-direction of smoke flow in inclined tunnel
fires[J]. Tunnelling and Underground Space Technology, 2019, 86: 113-127.
[67] Tang F, Hu LH, Yang LZ, Qiu ZW, Zhang XC. Longitudinal distributions of CO concentration
and temperature in buoyant tunnel fire smoke flow in a reduced pressure atmosphere with lower air
entrainment at high altitude[J]. International Journal of Heat and Mass Transfer, 2014, 75: 130-134.
[68] Ji J, Guo FY, Gao ZH, Zhu JP, Sun JH. Numerical investigation on the effect of ambient pressure
on smoke movement and temperature distribution in tunnel fires[J]. Applied Thermal Engineering,
2017, 118: 663-669.
[69] Yan ZG, Guo QH, Zhu HH. Full-scale experiments on fire characteristics of road tunnel at high
altitude[J]. Tunnelling and Underground Space Technology, 2017, 66: 134-146.
[70] Wu F, Zhou R, Shen GS, Jiang JC, Li KY. Effects of ambient pressure on smoke back-layering in
subway tunnel fires[J]. Tunnelling and Underground Space Technology, 2018, 79: 134-142.
[71] Ji J, Guo FY, Gao ZH, Zhu JP. Effects of ambient pressure on transport characteristics of
thermal-driven smoke flow in a tunnel[J]. International Journal of Thermal Sciences, 2018, 125:
210-217.
[72] Lee YP, Tsai KC. Effect of vehicular blockage on critical ventilation velocity and tunnel fire
behavior in longitudinally ventilated tunnels[J]. Fire Safety Journal, 2012, 53: 35-42.
[73] Zhang SG, Cheng XD, Yao YZ, Zhu K, Li KY, Lu S, et al. An experimental investigation on
blockage effect of metro train on the smoke back-layering in subway tunnel fires[J]. Applied Thermal
Engineering, 2016, 99: 214-223.
[74] Tang F, Cao ZL, Chen Q, Meng N, Wang Q, Fan CG. Effect of blockage-heat source distance on
maximum temperature of buoyancy-induced smoke flow beneath ceiling in a longitudinal ventilated
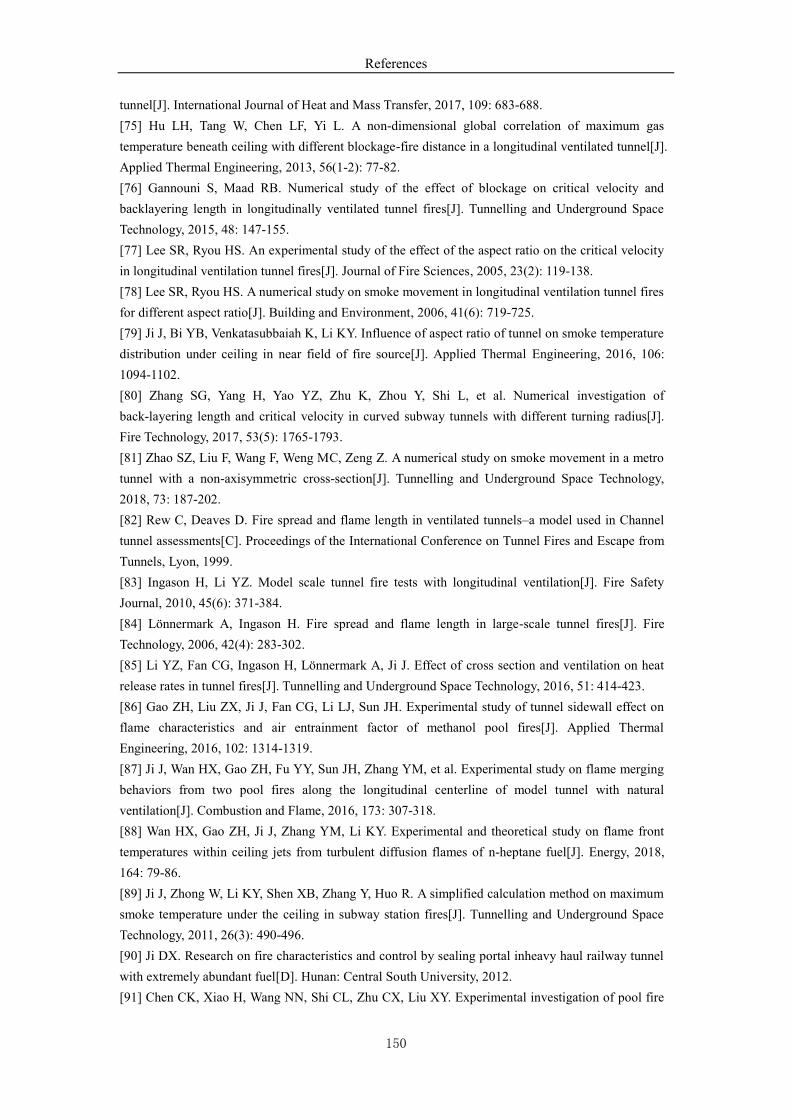
References
150
tunnel[J]. International Journal of Heat and Mass Transfer, 2017, 109: 683-688.
[75] Hu LH, Tang W, Chen LF, Yi L. A non-dimensional global correlation of maximum gas
temperature beneath ceiling with different blockage-fire distance in a longitudinal ventilated tunnel[J].
Applied Thermal Engineering, 2013, 56(1-2): 77-82.
[76] Gannouni S, Maad RB. Numerical study of the effect of blockage on critical velocity and
backlayering length in longitudinally ventilated tunnel fires[J]. Tunnelling and Underground Space
Technology, 2015, 48: 147-155.
[77] Lee SR, Ryou HS. An experimental study of the effect of the aspect ratio on the critical velocity
in longitudinal ventilation tunnel fires[J]. Journal of Fire Sciences, 2005, 23(2): 119-138.
[78] Lee SR, Ryou HS. A numerical study on smoke movement in longitudinal ventilation tunnel fires
for different aspect ratio[J]. Building and Environment, 2006, 41(6): 719-725.
[79] Ji J, Bi YB, Venkatasubbaiah K, Li KY. Influence of aspect ratio of tunnel on smoke temperature
distribution under ceiling in near field of fire source[J]. Applied Thermal Engineering, 2016, 106:
1094-1102.
[80] Zhang SG, Yang H, Yao YZ, Zhu K, Zhou Y, Shi L, et al. Numerical investigation of
back-layering length and critical velocity in curved subway tunnels with different turning radius[J].
Fire Technology, 2017, 53(5): 1765-1793.
[81] Zhao SZ, Liu F, Wang F, Weng MC, Zeng Z. A numerical study on smoke movement in a metro
tunnel with a non-axisymmetric cross-section[J]. Tunnelling and Underground Space Technology,
2018, 73: 187-202.
[82] Rew C, Deaves D. Fire spread and flame length in ventilated tunnels–a model used in Channel
tunnel assessments[C]. Proceedings of the International Conference on Tunnel Fires and Escape from
Tunnels, Lyon, 1999.
[83] Ingason H, Li YZ. Model scale tunnel fire tests with longitudinal ventilation[J]. Fire Safety
Journal, 2010, 45(6): 371-384.
[84] Lönnermark A, Ingason H. Fire spread and flame length in large-scale tunnel fires[J]. Fire
Technology, 2006, 42(4): 283-302.
[85] Li YZ, Fan CG, Ingason H, Lönnermark A, Ji J. Effect of cross section and ventilation on heat
release rates in tunnel fires[J]. Tunnelling and Underground Space Technology, 2016, 51: 414-423.
[86] Gao ZH, Liu ZX, Ji J, Fan CG, Li LJ, Sun JH. Experimental study of tunnel sidewall effect on
flame characteristics and air entrainment factor of methanol pool fires[J]. Applied Thermal
Engineering, 2016, 102: 1314-1319.
[87] Ji J, Wan HX, Gao ZH, Fu YY, Sun JH, Zhang YM, et al. Experimental study on flame merging
behaviors from two pool fires along the longitudinal centerline of model tunnel with natural
ventilation[J]. Combustion and Flame, 2016, 173: 307-318.
[88] Wan HX, Gao ZH, Ji J, Zhang YM, Li KY. Experimental and theoretical study on flame front
temperatures within ceiling jets from turbulent diffusion flames of n-heptane fuel[J]. Energy, 2018,
164: 79-86.
[89] Ji J, Zhong W, Li KY, Shen XB, Zhang Y, Huo R. A simplified calculation method on maximum
smoke temperature under the ceiling in subway station fires[J]. Tunnelling and Underground Space
Technology, 2011, 26(3): 490-496.
[90] Ji DX. Research on fire characteristics and control by sealing portal inheavy haul railway tunnel
with extremely abundant fuel[D]. Hunan: Central South University, 2012.
[91] Chen CK, Xiao H, Wang NN, Shi CL, Zhu CX, Liu XY. Experimental investigation of pool fire
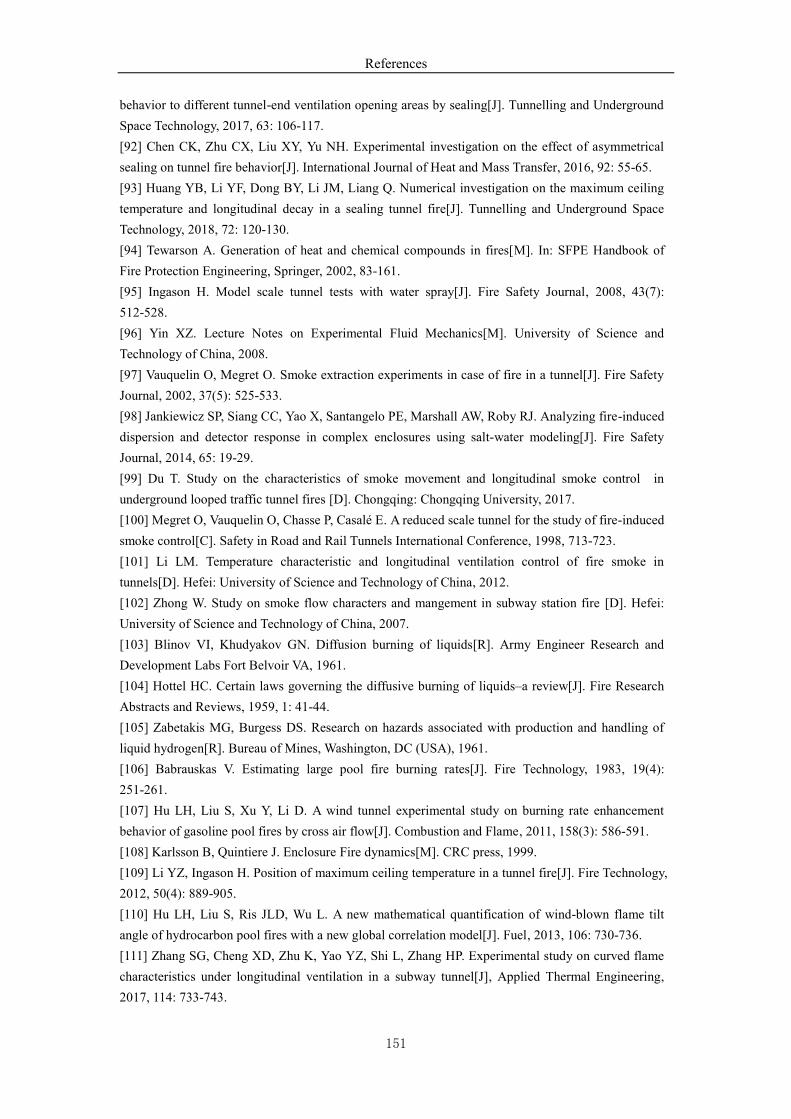
References
151
behavior to different tunnel-end ventilation opening areas by sealing[J]. Tunnelling and Underground
Space Technology, 2017, 63: 106-117.
[92] Chen CK, Zhu CX, Liu XY, Yu NH. Experimental investigation on the effect of asymmetrical
sealing on tunnel fire behavior[J]. International Journal of Heat and Mass Transfer, 2016, 92: 55-65.
[93] Huang YB, Li YF, Dong BY, Li JM, Liang Q. Numerical investigation on the maximum ceiling
temperature and longitudinal decay in a sealing tunnel fire[J]. Tunnelling and Underground Space
Technology, 2018, 72: 120-130.
[94] Tewarson A. Generation of heat and chemical compounds in fires[M]. In: SFPE Handbook of
Fire Protection Engineering, Springer, 2002, 83-161.
[95] Ingason H. Model scale tunnel tests with water spray[J]. Fire Safety Journal, 2008, 43(7):
512-528.
[96] Yin XZ. Lecture Notes on Experimental Fluid Mechanics[M]. University of Science and
Technology of China, 2008.
[97] Vauquelin O, Megret O. Smoke extraction experiments in case of fire in a tunnel[J]. Fire Safety
Journal, 2002, 37(5): 525-533.
[98] Jankiewicz SP, Siang CC, Yao X, Santangelo PE, Marshall AW, Roby RJ. Analyzing fire-induced
dispersion and detector response in complex enclosures using salt-water modeling[J]. Fire Safety
Journal, 2014, 65: 19-29.
[99] Du T. Study on the characteristics of smoke movement and longitudinal smoke control in
underground looped traffic tunnel fires [D]. Chongqing: Chongqing University, 2017.
[100] Megret O, Vauquelin O, Chasse P, Casalé E. A reduced scale tunnel for the study of fire-induced
smoke control[C]. Safety in Road and Rail Tunnels International Conference, 1998, 713-723.
[101] Li LM. Temperature characteristic and longitudinal ventilation control of fire smoke in
tunnels[D]. Hefei: University of Science and Technology of China, 2012.
[102] Zhong W. Study on smoke flow characters and mangement in subway station fire [D]. Hefei:
University of Science and Technology of China, 2007.
[103] Blinov VI, Khudyakov GN. Diffusion burning of liquids[R]. Army Engineer Research and
Development Labs Fort Belvoir VA, 1961.
[104] Hottel HC. Certain laws governing the diffusive burning of liquids–a review[J]. Fire Research
Abstracts and Reviews, 1959, 1: 41-44.
[105] Zabetakis MG, Burgess DS. Research on hazards associated with production and handling of
liquid hydrogen[R]. Bureau of Mines, Washington, DC (USA), 1961.
[106] Babrauskas V. Estimating large pool fire burning rates[J]. Fire Technology, 1983, 19(4):
251-261.
[107] Hu LH, Liu S, Xu Y, Li D. A wind tunnel experimental study on burning rate enhancement
behavior of gasoline pool fires by cross air flow[J]. Combustion and Flame, 2011, 158(3): 586-591.
[108] Karlsson B, Quintiere J. Enclosure Fire dynamics[M]. CRC press, 1999.
[109] Li YZ, Ingason H. Position of maximum ceiling temperature in a tunnel fire[J]. Fire Technology,
2012, 50(4): 889-905.
[110] Hu LH, Liu S, Ris JLD, Wu L. A new mathematical quantification of wind-blown flame tilt
angle of hydrocarbon pool fires with a new global correlation model[J]. Fuel, 2013, 106: 730-736.
[111] Zhang SG, Cheng XD, Zhu K, Yao YZ, Shi L, Zhang HP. Experimental study on curved flame
characteristics under longitudinal ventilation in a subway tunnel[J], Applied Thermal Engineering,
2017, 114: 733-743.
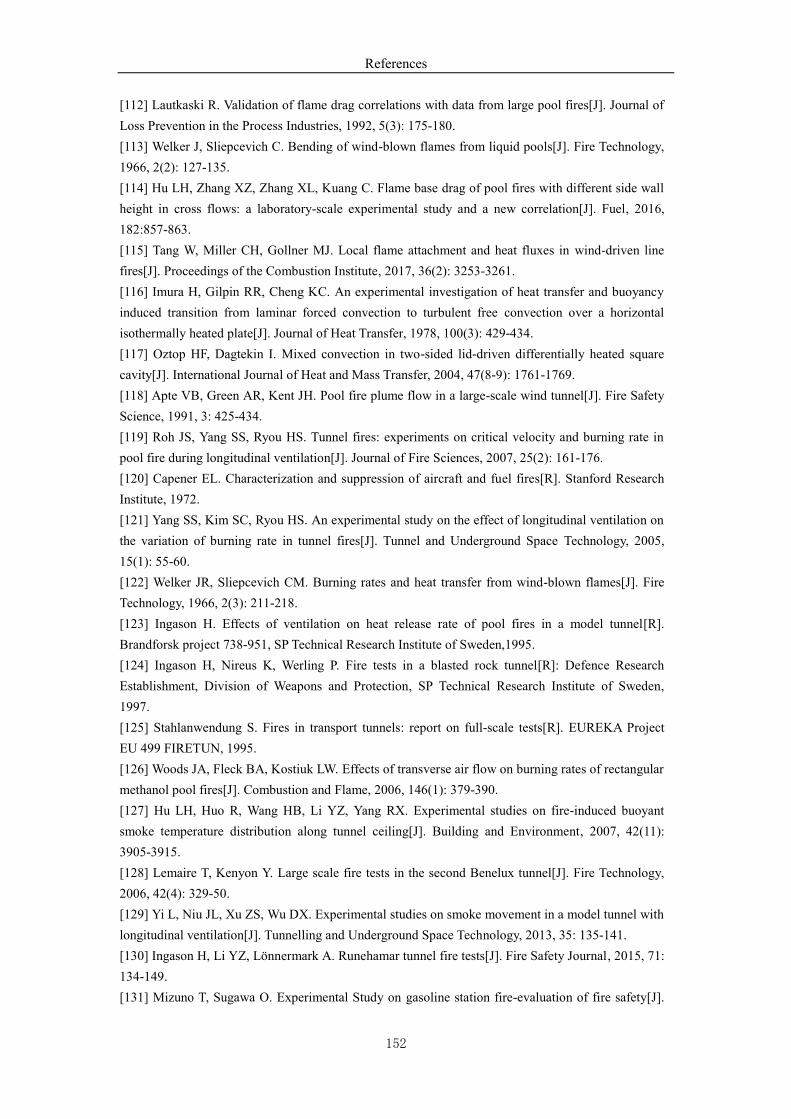
References
152
[112] Lautkaski R. Validation of flame drag correlations with data from large pool fires[J]. Journal of
Loss Prevention in the Process Industries, 1992, 5(3): 175-180.
[113] Welker J, Sliepcevich C. Bending of wind-blown flames from liquid pools[J]. Fire Technology,
1966, 2(2): 127-135.
[114] Hu LH, Zhang XZ, Zhang XL, Kuang C. Flame base drag of pool fires with different side wall
height in cross flows: a laboratory-scale experimental study and a new correlation[J]. Fuel, 2016,
182:857-863.
[115] Tang W, Miller CH, Gollner MJ. Local flame attachment and heat fluxes in wind-driven line
fires[J]. Proceedings of the Combustion Institute, 2017, 36(2): 3253-3261.
[116] Imura H, Gilpin RR, Cheng KC. An experimental investigation of heat transfer and buoyancy
induced transition from laminar forced convection to turbulent free convection over a horizontal
isothermally heated plate[J]. Journal of Heat Transfer, 1978, 100(3): 429-434.
[117] Oztop HF, Dagtekin I. Mixed convection in two-sided lid-driven differentially heated square
cavity[J]. International Journal of Heat and Mass Transfer, 2004, 47(8-9): 1761-1769.
[118] Apte VB, Green AR, Kent JH. Pool fire plume flow in a large-scale wind tunnel[J]. Fire Safety
Science, 1991, 3: 425-434.
[119] Roh JS, Yang SS, Ryou HS. Tunnel fires: experiments on critical velocity and burning rate in
pool fire during longitudinal ventilation[J]. Journal of Fire Sciences, 2007, 25(2): 161-176.
[120] Capener EL. Characterization and suppression of aircraft and fuel fires[R]. Stanford Research
Institute, 1972.
[121] Yang SS, Kim SC, Ryou HS. An experimental study on the effect of longitudinal ventilation on
the variation of burning rate in tunnel fires[J]. Tunnel and Underground Space Technology, 2005,
15(1): 55-60.
[122] Welker JR, Sliepcevich CM. Burning rates and heat transfer from wind-blown flames[J]. Fire
Technology, 1966, 2(3): 211-218.
[123] Ingason H. Effects of ventilation on heat release rate of pool fires in a model tunnel[R].
Brandforsk project 738-951, SP Technical Research Institute of Sweden,1995.
[124] Ingason H, Nireus K, Werling P. Fire tests in a blasted rock tunnel[R]: Defence Research
Establishment, Division of Weapons and Protection, SP Technical Research Institute of Sweden,
1997.
[125] Stahlanwendung S. Fires in transport tunnels: report on full-scale tests[R]. EUREKA Project
EU 499 FIRETUN, 1995.
[126] Woods JA, Fleck BA, Kostiuk LW. Effects of transverse air flow on burning rates of rectangular
methanol pool fires[J]. Combustion and Flame, 2006, 146(1): 379-390.
[127] Hu LH, Huo R, Wang HB, Li YZ, Yang RX. Experimental studies on fire-induced buoyant
smoke temperature distribution along tunnel ceiling[J]. Building and Environment, 2007, 42(11):
3905-3915.
[128] Lemaire T, Kenyon Y. Large scale fire tests in the second Benelux tunnel[J]. Fire Technology,
2006, 42(4): 329-50.
[129] Yi L, Niu JL, Xu ZS, Wu DX. Experimental studies on smoke movement in a model tunnel with
longitudinal ventilation[J]. Tunnelling and Underground Space Technology, 2013, 35: 135-141.
[130] Ingason H, Li YZ, Lönnermark A. Runehamar tunnel fire tests[J]. Fire Safety Journal, 2015, 71:
134-149.
[131] Mizuno T, Sugawa O. Experimental Study on gasoline station fire-evaluation of fire safety[J].
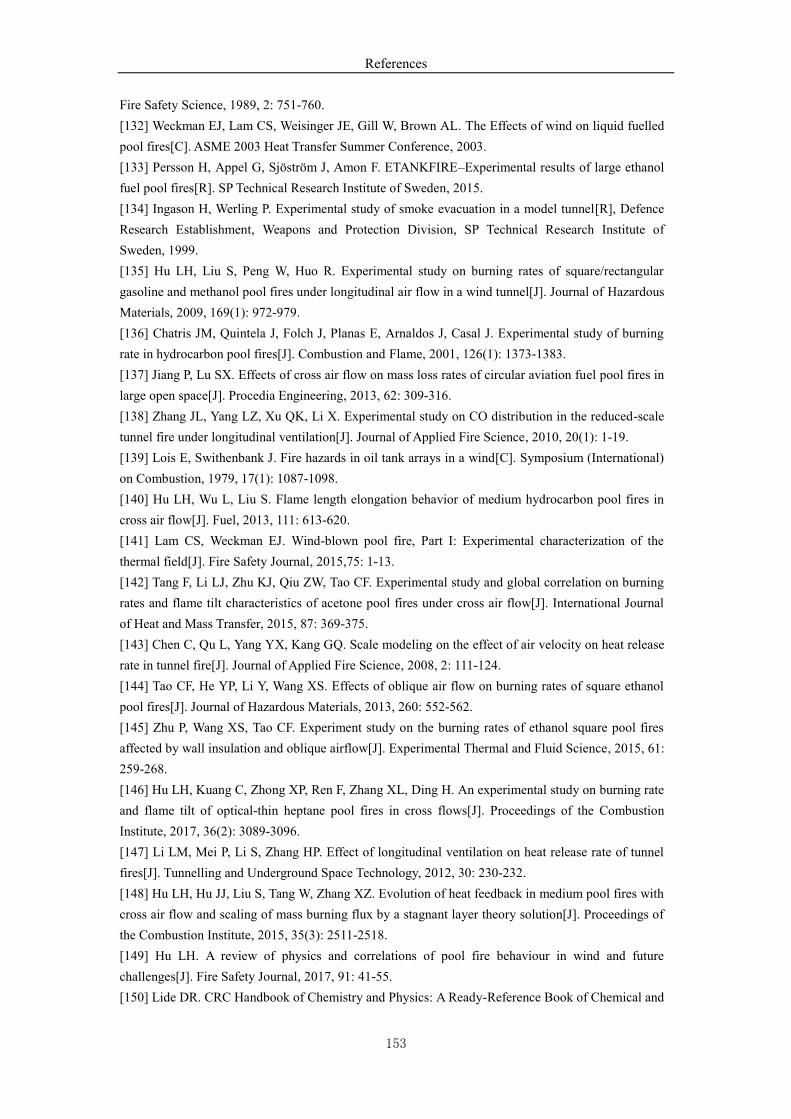
References
153
Fire Safety Science, 1989, 2: 751-760.
[132] Weckman EJ, Lam CS, Weisinger JE, Gill W, Brown AL. The Effects of wind on liquid fuelled
pool fires[C]. ASME 2003 Heat Transfer Summer Conference, 2003.
[133] Persson H, Appel G, Sjöström J, Amon F. ETANKFIRE–Experimental results of large ethanol
fuel pool fires[R]. SP Technical Research Institute of Sweden, 2015.
[134] Ingason H, Werling P. Experimental study of smoke evacuation in a model tunnel[R], Defence
Research Establishment, Weapons and Protection Division, SP Technical Research Institute of
Sweden, 1999.
[135] Hu LH, Liu S, Peng W, Huo R. Experimental study on burning rates of square/rectangular
gasoline and methanol pool fires under longitudinal air flow in a wind tunnel[J]. Journal of Hazardous
Materials, 2009, 169(1): 972-979.
[136] Chatris JM, Quintela J, Folch J, Planas E, Arnaldos J, Casal J. Experimental study of burning
rate in hydrocarbon pool fires[J]. Combustion and Flame, 2001, 126(1): 1373-1383.
[137] Jiang P, Lu SX. Effects of cross air flow on mass loss rates of circular aviation fuel pool fires in
large open space[J]. Procedia Engineering, 2013, 62: 309-316.
[138] Zhang JL, Yang LZ, Xu QK, Li X. Experimental study on CO distribution in the reduced-scale
tunnel fire under longitudinal ventilation[J]. Journal of Applied Fire Science, 2010, 20(1): 1-19.
[139] Lois E, Swithenbank J. Fire hazards in oil tank arrays in a wind[C]. Symposium (International)
on Combustion, 1979, 17(1): 1087-1098.
[140] Hu LH, Wu L, Liu S. Flame length elongation behavior of medium hydrocarbon pool fires in
cross air flow[J]. Fuel, 2013, 111: 613-620.
[141] Lam CS, Weckman EJ. Wind-blown pool fire, Part I: Experimental characterization of the
thermal field[J]. Fire Safety Journal, 2015,75: 1-13.
[142] Tang F, Li LJ, Zhu KJ, Qiu ZW, Tao CF. Experimental study and global correlation on burning
rates and flame tilt characteristics of acetone pool fires under cross air flow[J]. International Journal
of Heat and Mass Transfer, 2015, 87: 369-375.
[143] Chen C, Qu L, Yang YX, Kang GQ. Scale modeling on the effect of air velocity on heat release
rate in tunnel fire[J]. Journal of Applied Fire Science, 2008, 2: 111-124.
[144] Tao CF, He YP, Li Y, Wang XS. Effects of oblique air flow on burning rates of square ethanol
pool fires[J]. Journal of Hazardous Materials, 2013, 260: 552-562.
[145] Zhu P, Wang XS, Tao CF. Experiment study on the burning rates of ethanol square pool fires
affected by wall insulation and oblique airflow[J]. Experimental Thermal and Fluid Science, 2015, 61:
259-268.
[146] Hu LH, Kuang C, Zhong XP, Ren F, Zhang XL, Ding H. An experimental study on burning rate
and flame tilt of optical-thin heptane pool fires in cross flows[J]. Proceedings of the Combustion
Institute, 2017, 36(2): 3089-3096.
[147] Li LM, Mei P, Li S, Zhang HP. Effect of longitudinal ventilation on heat release rate of tunnel
fires[J]. Tunnelling and Underground Space Technology, 2012, 30: 230-232.
[148] Hu LH, Hu JJ, Liu S, Tang W, Zhang XZ. Evolution of heat feedback in medium pool fires with
cross air flow and scaling of mass burning flux by a stagnant layer theory solution[J]. Proceedings of
the Combustion Institute, 2015, 35(3): 2511-2518.
[149] Hu LH. A review of physics and correlations of pool fire behaviour in wind and future
challenges[J]. Fire Safety Journal, 2017, 91: 41-55.
[150] Lide DR. CRC Handbook of Chemistry and Physics: A Ready-Reference Book of Chemical and
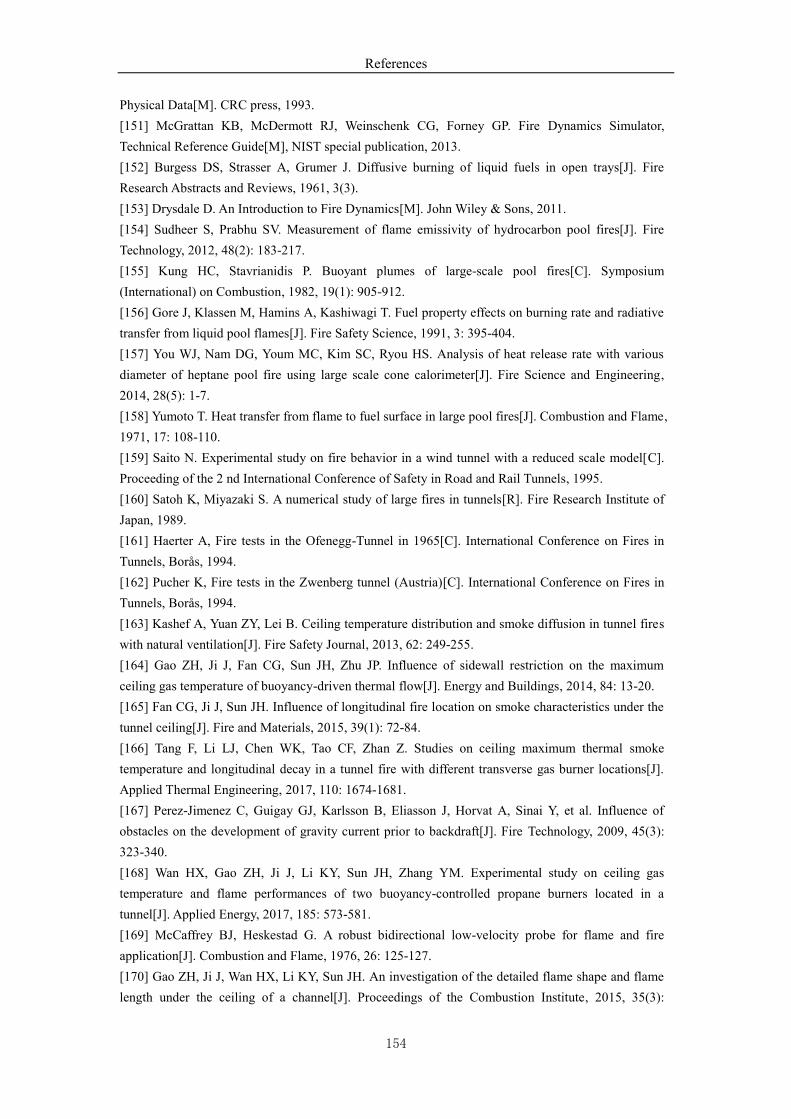
References
154
Physical Data[M]. CRC press, 1993.
[151] McGrattan KB, McDermott RJ, Weinschenk CG, Forney GP. Fire Dynamics Simulator,
Technical Reference Guide[M], NIST special publication, 2013.
[152] Burgess DS, Strasser A, Grumer J. Diffusive burning of liquid fuels in open trays[J]. Fire
Research Abstracts and Reviews, 1961, 3(3).
[153] Drysdale D. An Introduction to Fire Dynamics[M]. John Wiley & Sons, 2011.
[154] Sudheer S, Prabhu SV. Measurement of flame emissivity of hydrocarbon pool fires[J]. Fire
Technology, 2012, 48(2): 183-217.
[155] Kung HC, Stavrianidis P. Buoyant plumes of large-scale pool fires[C]. Symposium
(International) on Combustion, 1982, 19(1): 905-912.
[156] Gore J, Klassen M, Hamins A, Kashiwagi T. Fuel property effects on burning rate and radiative
transfer from liquid pool flames[J]. Fire Safety Science, 1991, 3: 395-404.
[157] You WJ, Nam DG, Youm MC, Kim SC, Ryou HS. Analysis of heat release rate with various
diameter of heptane pool fire using large scale cone calorimeter[J]. Fire Science and Engineering,
2014, 28(5): 1-7.
[158] Yumoto T. Heat transfer from flame to fuel surface in large pool fires[J]. Combustion and Flame,
1971, 17: 108-110.
[159] Saito N. Experimental study on fire behavior in a wind tunnel with a reduced scale model[C].
Proceeding of the 2 nd International Conference of Safety in Road and Rail Tunnels, 1995.
[160] Satoh K, Miyazaki S. A numerical study of large fires in tunnels[R]. Fire Research Institute of
Japan, 1989.
[161] Haerter A, Fire tests in the Ofenegg-Tunnel in 1965[C]. International Conference on Fires in
Tunnels, Borås, 1994.
[162] Pucher K, Fire tests in the Zwenberg tunnel (Austria)[C]. International Conference on Fires in
Tunnels, Borås, 1994.
[163] Kashef A, Yuan ZY, Lei B. Ceiling temperature distribution and smoke diffusion in tunnel fires
with natural ventilation[J]. Fire Safety Journal, 2013, 62: 249-255.
[164] Gao ZH, Ji J, Fan CG, Sun JH, Zhu JP. Influence of sidewall restriction on the maximum
ceiling gas temperature of buoyancy-driven thermal flow[J]. Energy and Buildings, 2014, 84: 13-20.
[165] Fan CG, Ji J, Sun JH. Influence of longitudinal fire location on smoke characteristics under the
tunnel ceiling[J]. Fire and Materials, 2015, 39(1): 72-84.
[166] Tang F, Li LJ, Chen WK, Tao CF, Zhan Z. Studies on ceiling maximum thermal smoke
temperature and longitudinal decay in a tunnel fire with different transverse gas burner locations[J].
Applied Thermal Engineering, 2017, 110: 1674-1681.
[167] Perez-Jimenez C, Guigay GJ, Karlsson B, Eliasson J, Horvat A, Sinai Y, et al. Influence of
obstacles on the development of gravity current prior to backdraft[J]. Fire Technology, 2009, 45(3):
323-340.
[168] Wan HX, Gao ZH, Ji J, Li KY, Sun JH, Zhang YM. Experimental study on ceiling gas
temperature and flame performances of two buoyancy-controlled propane burners located in a
tunnel[J]. Applied Energy, 2017, 185: 573-581.
[169] McCaffrey BJ, Heskestad G. A robust bidirectional low-velocity probe for flame and fire
application[J]. Combustion and Flame, 1976, 26: 125-127.
[170] Gao ZH, Ji J, Wan HX, Li KY, Sun JH. An investigation of the detailed flame shape and flame
length under the ceiling of a channel[J]. Proceedings of the Combustion Institute, 2015, 35(3):
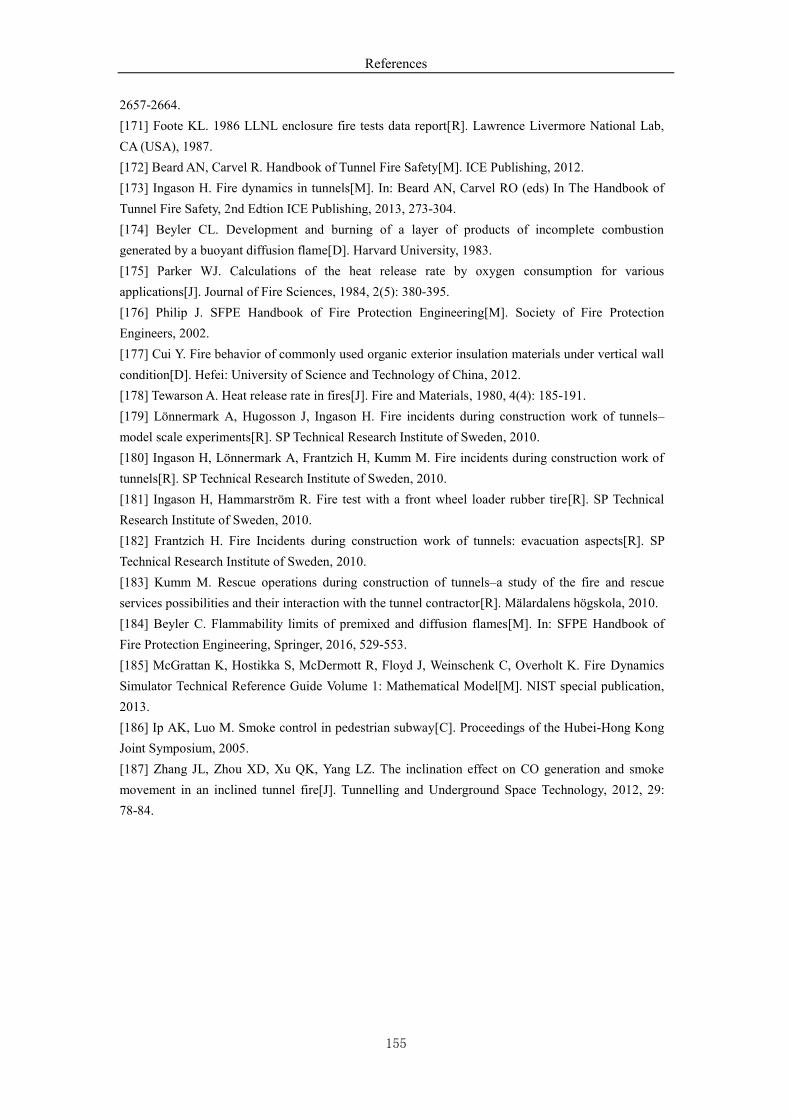
References
155
2657-2664.
[171] Foote KL. 1986 LLNL enclosure fire tests data report[R]. Lawrence Livermore National Lab,
CA (USA), 1987.
[172] Beard AN, Carvel R. Handbook of Tunnel Fire Safety[M]. ICE Publishing, 2012.
[173] Ingason H. Fire dynamics in tunnels[M]. In: Beard AN, Carvel RO (eds) In The Handbook of
Tunnel Fire Safety, 2nd Edtion ICE Publishing, 2013, 273-304.
[174] Beyler CL. Development and burning of a layer of products of incomplete combustion
generated by a buoyant diffusion flame[D]. Harvard University, 1983.
[175] Parker WJ. Calculations of the heat release rate by oxygen consumption for various
applications[J]. Journal of Fire Sciences, 1984, 2(5): 380-395.
[176] Philip J. SFPE Handbook of Fire Protection Engineering[M]. Society of Fire Protection
Engineers, 2002.
[177] Cui Y. Fire behavior of commonly used organic exterior insulation materials under vertical wall
condition[D]. Hefei: University of Science and Technology of China, 2012.
[178] Tewarson A. Heat release rate in fires[J]. Fire and Materials, 1980, 4(4): 185-191.
[179] Lönnermark A, Hugosson J, Ingason H. Fire incidents during construction work of tunnels–
model scale experiments[R]. SP Technical Research Institute of Sweden, 2010.
[180] Ingason H, Lönnermark A, Frantzich H, Kumm M. Fire incidents during construction work of
tunnels[R]. SP Technical Research Institute of Sweden, 2010.
[181] Ingason H, Hammarström R. Fire test with a front wheel loader rubber tire[R]. SP Technical
Research Institute of Sweden, 2010.
[182] Frantzich H. Fire Incidents during construction work of tunnels: evacuation aspects[R]. SP
Technical Research Institute of Sweden, 2010.
[183] Kumm M. Rescue operations during construction of tunnels–a study of the fire and rescue
services possibilities and their interaction with the tunnel contractor[R]. Mälardalens högskola, 2010.
[184] Beyler C. Flammability limits of premixed and diffusion flames[M]. In: SFPE Handbook of
Fire Protection Engineering, Springer, 2016, 529-553.
[185] McGrattan K, Hostikka S, McDermott R, Floyd J, Weinschenk C, Overholt K. Fire Dynamics
Simulator Technical Reference Guide Volume 1: Mathematical Model[M]. NIST special publication,
2013.
[186] Ip AK, Luo M. Smoke control in pedestrian subway[C]. Proceedings of the Hubei-Hong Kong
Joint Symposium, 2005.
[187] Zhang JL, Zhou XD, Xu QK, Yang LZ. The inclination effect on CO generation and smoke
movement in an inclined tunnel fire[J]. Tunnelling and Underground Space Technology, 2012, 29:
78-84.

Acknowledgement
156
Acknowledgment
At first, I would like to thank my Swedish supervisors, Prof. Haukur Ingason
and Dr. Ying Zhen Li. During the PhD joint training at RISE Research Institutes of
Sweden, they provided me with the best living and learning conditions, and at the
same time, they also made a detailed and thorough training plan for me. I discussed
and solved problems with Dr. Li almost every day, which deepens my understanding
to the purpose, systematicness and methodology of scientific research. I have gained
a lot at RISE and the experience benefits me for a lifetime. I would like to thank my
roommate Dr. Shengzhong Zhao for his concern and care for a long time. We helped
each other and jointly created a good living and learning environment. I would like
to thank Dr. Chen Huang, Dr. Lei Jiang, Prof. Anders Lönnermark, Dr. Qinghua Guo
and Dr. Yongqiang Liu for their help and support during the PhD joint training in
Sweden.
I would also like to thank my Chinese supervisors, Prof. Heping Zhang and A.P.
Xudong Cheng. Prof. Zhang is rigorous in scientific research and he teaches us that
scientific research needs to combine with practical problems and then solve practical
problems. His opinion points the research direction for my academic career. A.P.
Cheng is very considerate and responsible for my life and study. In each group
meeting, A.P. Cheng will point out important problems and put forward constructive
suggestions. It is this continuous accumulation that helps me achieve a long-term
progress.
Finally, I would like to thank China Scholarship Council for providing me with
the opportunity to study at Research Institutes of Sweden (RISE).
May 2019
Research achievements and awards during doctoral study
157
Research achievements and awards during doctoral study
Research achievements
1. Yongzheng Yao, Xudong Cheng, Shaogang Zhang, Kai Zhu, Long Shi, Heping
Zhang, Smoke back-layering flow length in longitudinal ventilated tunnel fires with
vertical shaft in the upstream. Applied Thermal Engineering, 107 (2016) 738-746.
2. Yongzheng Yao, Xudong Cheng, Shaogang Zhang, Kai Zhu, Heping Zhang, Long
Shi, Maximum smoke temperature beneath the ceiling in an enclosed channel with
different fire locations. Applied Thermal Engineering, 111 (2017) 30-38.
3. Yongzheng Yao, Xudong Cheng, Long Shi, Shaogang Zhang, Kun He, Min Peng,
Heping Zhang, Experimental study on the effects of initial sealing time on fire
behaviors in channel fires. International Journal of Thermal Sciences, 125 (2018)
273-282.
4. Yongzheng Yao, Ying Zhen Li, Haukur Ingason, Xudong Cheng, Numerical study
on overall smoke control using naturally ventilated shafts during fires in a road
tunnel. International Journal of Thermal Sciences, 140 (2019)491-504.
5. Yongzheng Yao, Kun He, Min Peng, Long Shi, Xudong Cheng, Heping Zhang,
Maximum gas temperature rise beneath the ceiling in a portals-sealed tunnel fire.
Tunnelling and Underground Space Technology, 80 (2018) 10-15.
6. Yongzheng Yao, Ying Zhen Li, Haukur Ingason, Xudong Cheng, The
characteristics of under-ventilated pool fires in both model and medium-scale
tunnels. Tunnelling and Underground Space Technology, 87 (2019) 27-40.
7. Yongzheng Yao, Ying Zhen Li, Anders Lönnermark, Haukur Ingason, Xudong
Cheng, Study of tunnel fires during construction using a model scale tunnel.
Tunnelling and Underground Space Technology, 89 (2019) 50-67.
8. Yongzheng Yao, Ying Zhen Li, Haukur Ingason, Xudong Cheng, Scale effect of
mass loss rates for pool fires in the open and in tunnels with wind. Fire safety
Journal, 105 (2019) 41-50.
9. Yongzheng Yao, Shaogang Zhang, Long Shi, Xudong Cheng, Effects of shaft
inclination angle on the capacity of smoke exhaust under tunnel fire. Indoor and
Built Environment, 28 (2019) 77-87.

Research achievements and awards during doctoral study
158
Awards
2016 National scholarship for graduate student (China)
2017 State-sponsored PhD Joint Training Program (China)
2019 Outstanding doctor graduate of University of Science and Technology of China
© RISE Research Institutes of Sweden
Through our international collaboration programmes with academia, industry, and the public sector, we ensure the competitiveness of the Swedish business community on an international level and contribute to a sustainable society. Our 2,200 employees support and promote all manner of innovative processes, and our roughly 100 testbeds and demonstration facilities are instrumental in developing the future-proofing of products, technologies, and services. RISE Research Institutes of Sweden is fully owned by the Swedish state. I internationell samverkan med akademi, näringsliv och offentlig sektor bidrar vi till ett konkurrenskraftigt näringsliv och ett hållbart samhälle. RISE 2 200 medarbetare driver och stöder alla typer av innovationsprocesser. Vi erbjuder ett 100-tal test- och demonstrationsmiljöer för framtidssäkra produkter, tekniker och tjänster. RISE Research Institutes of Sweden ägs av svenska staten.
RISE Research Institutes of Sweden Box 857, 501 15 BORÅS Telefon: 010-516 50 00 E-post: [email protected], Internet: www.sp.se / www.ri.se
Safety and Transport – Fire Research RISE Rapport 2019:58 ISBN 978-91-88907-85-1 ISSN 0284-5172