Embed Size (px)
Citation preview
Department of Forensic Medicine University of Helsinki
Finland
FINNISH POPULATION GENETICS IN A FORENSIC CONTEXT
Anu Neuvonen
ACADEMIC DISSERTATION
To be presented, with the permission of the Faculty of Medicine of the University of Helsinki, for public examination in the auditorium of the Department of Forensic
Medicine, on June 2nd, 2017, at 12 noon.
Helsinki 2017

SUPERVISORS Professor Antti Sajantila Department of Forensic Medicine University of Helsinki Helsinki, Finland Adjunct Professor Jukka Palo Department of Forensic Medicine University of Helsinki Helsinki, Finland REVIEWERS Professor Lutz Roewer Institute of Legal Medicine and Forensic Sciences Charité Medical School Berlin Berlin, Germany Professor Pekka Pamilo Department of Biosciences University of Helsinki Helsinki, Finland OPPONENT Professor António Amorim Institute of Molecular Pathology and Immunology University of Porto Porto, Portugal ISBN 978-951-51-3160-7 (paperback) ISBN 978-951-51-3161-4 (PDF) http://ethesis.helsinki.fi/ Unigrafia Helsinki 2017

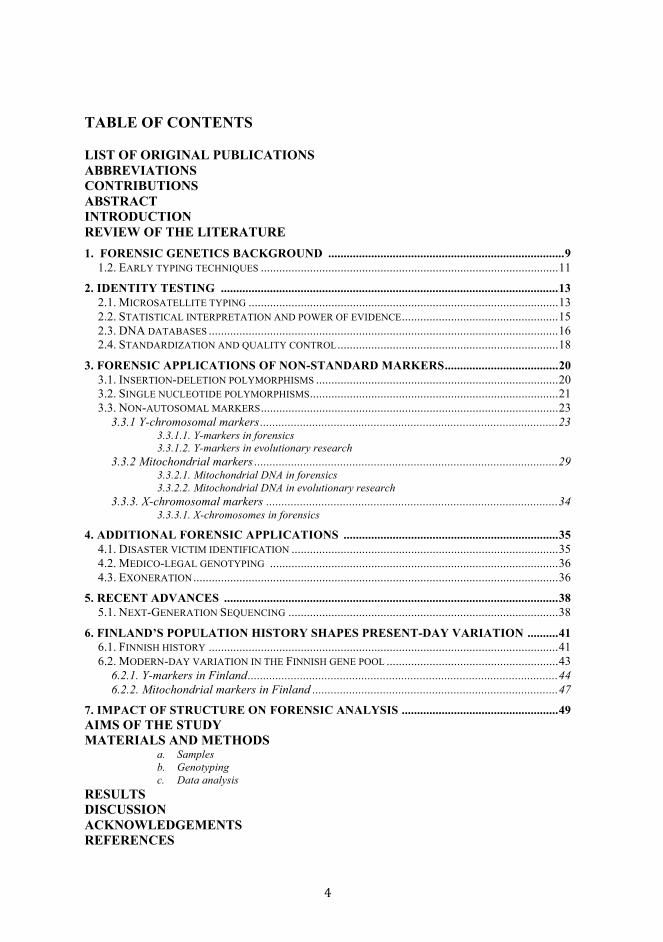
TABLE OF CONTENTS
LIST OF ORIGINAL PUBLICATIONS ABBREVIATIONS CONTRIBUTIONS ABSTRACT INTRODUCTION REVIEW OF THE LITERATURE 1. FORENSIC GENETICS BACKGROUND ............................................................................. 9
1.2. EARLY TYPING TECHNIQUES ................................................................................................. 11
2. IDENTITY TESTING .............................................................................................................. 13 2.1. MICROSATELLITE TYPING ..................................................................................................... 13 2.2. STATISTICAL INTERPRETATION AND POWER OF EVIDENCE ................................................... 15 2.3. DNA DATABASES .................................................................................................................. 16 2.4. STANDARDIZATION AND QUALITY CONTROL ........................................................................ 18
3. FORENSIC APPLICATIONS OF NON-STANDARD MARKERS ..................................... 20 3.1. INSERTION-DELETION POLYMORPHISMS ............................................................................... 20 3.2. SINGLE NUCLEOTIDE POLYMORPHISMS ................................................................................. 21 3.3. NON-AUTOSOMAL MARKERS ................................................................................................. 23
3.3.1 Y-chromosomal markers ................................................................................................. 23 3.3.1.1. Y-markers in forensics 3.3.1.2. Y-markers in evolutionary research
3.3.2 Mitochondrial markers ................................................................................................... 29 3.3.2.1. Mitochondrial DNA in forensics 3.3.2.2. Mitochondrial DNA in evolutionary research
3.3.3. X-chromosomal markers ............................................................................................... 34 3.3.3.1. X-chromosomes in forensics
4. ADDITIONAL FORENSIC APPLICATIONS ...................................................................... 35 4.1. DISASTER VICTIM IDENTIFICATION ....................................................................................... 35 4.2. MEDICO-LEGAL GENOTYPING .............................................................................................. 36 4.3. EXONERATION ....................................................................................................................... 36
5. RECENT ADVANCES ............................................................................................................. 38 5.1. NEXT-GENERATION SEQUENCING ........................................................................................ 38
6. FINLAND’S POPULATION HISTORY SHAPES PRESENT-DAY VARIATION .......... 41 6.1. FINNISH HISTORY .................................................................................................................. 41 6.2. MODERN-DAY VARIATION IN THE FINNISH GENE POOL ........................................................ 43
6.2.1. Y-markers in Finland ..................................................................................................... 44 6.2.2. Mitochondrial markers in Finland ................................................................................ 47
7. IMPACT OF STRUCTURE ON FORENSIC ANALYSIS ................................................... 49 AIMS OF THE STUDY MATERIALS AND METHODS
a. Samples b. Genotyping c. Data analysis
RESULTS DISCUSSION ACKNOWLEDGEMENTS REFERENCES

LIST OF ORIGINAL PUBLICATIONS This thesis is based on the following original publications. They are referred to in the text by their Roman numerals.
I Neuvonen AM, Putkonen M, Översti S, Sundell T, Onkamo P, Sajantila A, and Palo JU. (2015) Vestiges of an ancient border in the contemporary genetic diversity of North-Eastern Europe. PLOS One. 10(7): e0130331.
II Hedman M, Neuvonen AM, Sajantila A, and Palo JU. (2011) Dissecting the
Finnish male uniformity: the value of additional Y-STR loci. Forensic Sci Int Genet 5, 199-201.
III Neuvonen AM, Palo JU, Hedman M, Sajantila A. (2012) Discrimination power of Investigator DIPplex loci in Finnish and Somali populations. Forensic Sci Int Genet. 6(4): e99-102.
IV Neuvonen AM, Palo JU, and Sajantila A. (2011) Post-mortem ABCB1 genotyping
reveals an elevated toxicity for female digoxin users. Int J Legal Med 125, 265-269.
The original publications have been reproduced with permission of the copyright holders. Publication II is also included in the doctoral thesis of Dr. Minttu Hedman, University of Helsinki, 2011.

ABBREVIATIONS AAFS American Academy of Forensic Sciences ABCB1 ATP-binding cassette sub-family B member 1 ABI Applied Biosystems (Life Technologies, now Thermo-Fisher Scientific) aDNA ancient DNA AIM ancestry-informative marker Alu Arthrobacter luteus restriction endonuclease element bp base pair BP before present CE capillary electrophoresis CoD cause of death CODIS Combined DNA Index System DIP deletion-insertion polymorphism DNA deoxyribonucleic acid DP discrimination power DVI Disaster Victim Identification DYS DNA Y-chromosome segment EDNAP European DNA Profiling Group EMPOP European DNA Profiling Group Mitochondrial DNA Population Database ENFSI Network of European Forensic Science Institutes ESS European Standard Set EUROFORGEN-NoE European Forensic Genetics Network of Excellence EVC externally visible characteristic FBI Federal Bureau of Investigation FDH Finnish Disease Heritage HVR hypervariable region HWE Hardy-Weinberg equilibrium ICMP International Commission of Missing Persons IEC International Electrotechnical Commission IHGSC International Human Genome Sequencing Consortium indel insertion-deletion polymorphism INTERPOL The International Criminal Police Organization ISFG International Society of Forensic Genetics ISO International Organization for Standardization Kb kilobase LD linkage disequilibrium LINES long interspersed nuclear elements LR likelihood ratio Mb megabase MDR1 multi-drug resistance gene 1 MH Minimal Haplotype MMRCA mitochondrial most recent common ancestor MoD manner of death mRNA messenger RNA mtDNA mitochondrial DNA NDNAD National DNA Database Ne effective population size NGS next generation sequencing NIST National Institute of Standards and Technology PAR pseudo-autosomal region PCR polymerase chain reaction PE power of exclusion PI paternity index pM match probability rCRS revised Cambridge Reference Sequence RFLP restriction fragment length polymorphism RNA ribonucleic acid RSRS Reconstructed Sapiens Reference Sequence RT-PCR real-time PCR SINES short interspersed nuclear elements SNP single nucleotide polymorphism SRY sex-determining region Y STR short tandem repeat SWGDAM Scientific Working Group on DNA Analysis Methods TMRCA the most recent common ancestor VNTR variable number tandem repeats Y-SNP Y-chromosomal SNP Y-STR Y-chromosomal STR YCC Y-Chromosome Consortium YHRD Y Chromosome Haplotype Reference Database YMRCA Y-chromosomal most recent common ancestor
ABSTRACT The singularity of population structure observed in Finland is the ultimate result of a number of factors in history. Finland’s late emergence from the Pleistocene era coupled with its geographical isolation, low initial density of the breeding population and limited gene flow have ultimately contributed to genetic dissociation from the rest of Europe, post-expansion amplification of distinctive genes, and the retention of a homogenous character. This unusual history and resulting structure have a number of consequences for the practical applications of genetic testing in Finland today, including forensic analysis. The objective of this study was to characterize coding and noncoding genetic variation in the Finnish gene pool using forensic markers, in order to improve the efficiency of forensic testing in Finland while simultaneously broadening our understanding of its history. Finland is characterized by a clear genetic delineation between Eastern and Western regions of the country. The origins of this substructure in different marker classes have heretofore remained undetermined. Here, patterns of distribution observed in markers of prehistoric association suggest this delineation represents the vestiges of an ancient border between Mesolithic hunter-gatherer and Neolithic farmer populations, undetectable in other regions of Europe. This study provides further insight into the development of the current population structure and clarifies the resolution of uniparental marker variation in contemporary Finland, with implications for forensic applications such as ancestry-informative testing.
Since unusual population structures are known to affect the applicability of forensic testing, a variety of markers were tested in the Finnish population in order to ensure validity. Along with the aforementioned population stratification, Finland’s unusual history has also left its mark on the population in the form of reduced diversity, visible especially in the Y-chromosome. Unlike elsewhere in Europe, neither the standard 9-locus Y-microsatellite set, nor more powerful commercial multiplex kits are enough for satisfactory resolution of male profiles in Finland. In order to improve the efficiency of Finnish Y-profiling, novel multiplex panels of highly polymorphic Y-microsatellite markers were developed and evaluated. The new 7- and 24-locus Y-STR panels demonstrate improved suitability for practical forensic applications, with enhanced discrimination power and a reduction in regional subdivision compared to commercial sets. This study highlights the need for careful population-specific validation of commercial marker sets widely in use in forensics. Population-specific validation is especially necessary when adopting novel tools. In order to assess the applicability of a novel commercial panel of insertion-deletion markers in Finnish forensic profiling, the Investigator DIPplex kit was evaluated in the Finnish population. Earlier studies of the applicability of insertion/deletion polymorphisms as a tool of forensics had indicated that they were likely to be beneficial for casework analysis both in individual identification as well as the testing of familial relationships. The results of this study suggest that while these markers were well suited for individualization purposes, they were inefficient for paternity testing in the Finnish population. The genetic architecture of a population can also affect forensic disciplines outside the realm of individual identification, such as medico-legal investigations. Population bottlenecks can result in the enrichment of mutations, including those with clinical effects. The assessment of metabolic gene ABCB1 polymorphisms in Finns found increased frequency of these mutations in comparison to other populations. A further investigation performed on post-mortem samples revealed a positive correlation between mutation frequency and level of blood digoxin, suggesting that Finns may demonstrate an increased susceptibility to drug intoxication. These findings will aid forensic medicine by providing valuable additional evidence for molecular autopsies. A thorough understanding of underlying patterns of genetic variation and the history that created them is vital in recognizing the factors affecting practical forensic analysis today. In these studies, the deep genetic delineation between Eastern and Western regions of Finland was observed in a variety of forensic loci, and shown for the first time to extend also to mitochondrial markers, giving further evidence of its ancient history. The results of this thesis thus reveal new information about the history and demographics of the Finnish population while offering globally applicable improvements to forensic typing. The end result is more straightforward analysis and improved reliability for a spectrum of forensic applications ranging from individualization to cause of death determinations.

INTRODUCTION Forensic science is the application of science to the law. Today, modern legal proceedings are often supplemented with scientific examinations to aid the course of justice. In recent history, significant new developments in this field have allowed more informative forensic assessment through genetic profiling. Forensic genetics specializes in the analysis of hereditary markers, harnessing the natural variation between people for judicial purposes. As a result of its high level of discrimination, genetic testing has become a ubiquitous and vital part of legal proceedings and the administration of justice. Population-specific genetics can affect the interpretation of genetic data in forensic cases. Over its history, the long-term geographical isolation of Finland, its late colonization and subsequent historical events have moulded its national genetic profile, creating a contemporary picture of a distinctly singular nature. Past studies of Finnish genetic variation have provided an image of a population characterized, among other peculiarities, by a distinct disease profile in the autosomes, a significant lack of diversity and geographical substructure in the Y-chromosome, but mitochondrial variation indistinguishable from the rest of Europe. Many of these singular features shaped by history can affect the way that genetics is utilized in a forensic context in Finland. A singular structure such as this one, though informative from a historical perspective, can for example seriously confound the correct interpretation of results in the forensic discipline. The objective of my doctorate was to investigate Finnish population variation with multiform genetic markers, in order to better understand the underlying factors in the Finnish gene pool affecting the forensics as well as bringing insight into population history.
REVIEW OF THE LITERATURE 1. FORENSIC GENETICS BACKGROUND The general purpose of forensic science is to aid legal processes through scientific means. Forensic investigations can incorporate a variety of disciplines ranging from the empirical, such as pathology, anthropology and entomology, to comparative crime-scene investigation techniques such as blood spatter and trace analysis, fingerprint examination, ballistics, and document assessment. Regardless of the sub-discipline, the collective aim is to advance the delivery of justice to its highest level of validity through the best available technologies. Forensic genetics uses the genetic variation found between individuals to gather information for purposes pertaining to the law. The analysis of DNA (deoxyribonucleic acid) variation in a legal setting has revolutionized forensic science in terms of the power of evidence. In this section, I will describe the basic background and history involved in the development of forensic marker analysis to what it is today. The basic molecular structure of DNA consists of helical deoxyribose sugars held together with phosphodiester bonds to create a sugar-phosphate backbone. Nitrogenous bases attach to the backbone, with the complete unit formed by the base, the sugar, and the phosphate, together known as a nucleotide. Bases are composed of complementary pyrimidines cytosine (C) and thymine (T), and purines adenine (A) and guanine (G). Adenine is paired with thymine, and cytosine with guanine with two or three hydrogen bonds respectively. Winding around one another in a right-handed, anti-parallel spiral formation, the two strands create the double helix. The entirety of genetic information, the human genome, is composed of molecules of DNA housed within 46 tightly packaged units, 22 somatic pairs and two sex chromosomes, X and Y. Specific DNA regions on a chromosome are termed loci, and every autosomal locus has two alleles, each inherited randomly and independently from one parent. Together the two alleles compose what is known as the genotype. In addition, the single alleles of uniparental DNA are collectively termed the haplotype. The human genome in its entirety consists of over 3 billion base pairs worth of information and an estimated 19,000 to 20,000 genes; DNA sequences that code for proteins (International Human Genome Sequencing Consortium 2004; Ezkurdia et al. 2014). DNA is composed of both non-coding (introns) and coding (exon) sequences, with coding sequences estimated to make up between 7.1 – 9.2% of the genome (ENCODE Consortium, 2012; Rands et al. 2014). Genes are expressed through the rendering of DNA information into RNA (ribonucleic acid), specifically messenger RNA (mRNA) with the help of the RNA polymerase enzyme in a process known as transcription. Following transcription, introns are spliced out and exons ligated together to create mature mRNA transcripts. These are then translated by a
ribosome into chains of amino acids known as polypeptides. The polypeptide chain is folded and modified into a three-dimensional configuration, creating a functional protein. DNA is present in all nucleated cells, and is thus ubiquitous in human tissues. Modern technology is able to transform the smallest amount of sample material to a personal genetic fingerprint and an individual. Until recently routine analysis of the entire human genome was unfeasible, and DNA sequences were instead compared at spots where variation between individuals was likely to occur. In general, humans vary in only 0.1% of their genomes and the vast majority of this variation occurs within, and not between, populations (Barbujani et al. 1997; Rosenberg et al. 2002; Jorde & Wooding 2004). Of human genetic diversity, 85-90% is found within continental groups, and only 10-15% between them (Barbujani et al. 1997; Jorde et al. 2000; Rosenberg et al. 2002; Jorde & Wooding 2004). Today, forensic geneticists distinguish individual profiles by using a multitude of different types of variation found in the human genome.
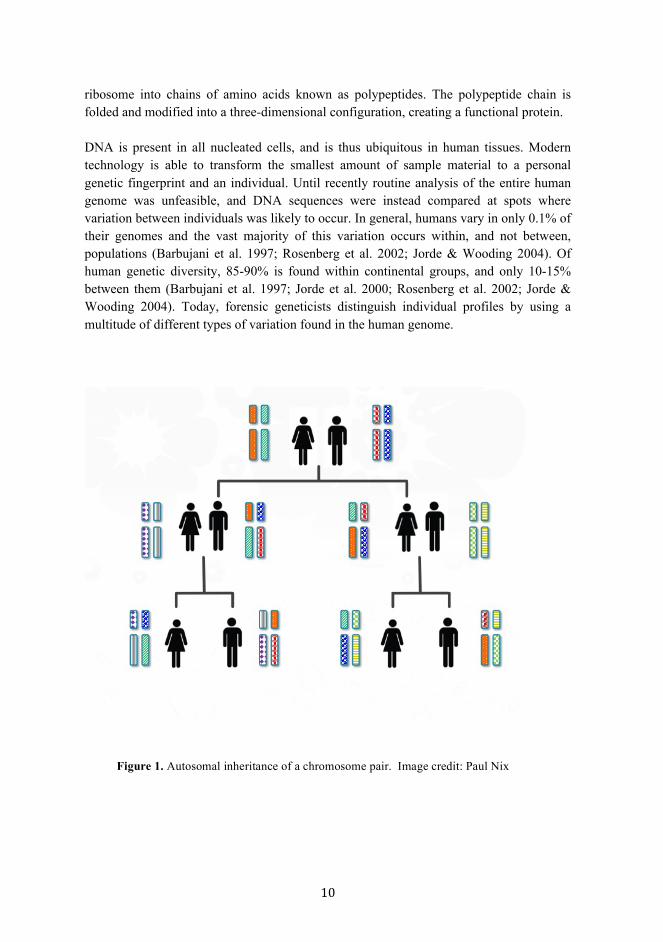
Figure 1. Autosomal inheritance of a chromosome pair. Image credit: Paul Nix
1.1. Early typing techniques Hereditary markers have been used in casework since the early 1900s. The power of evidence reached by molecular methods such as protein and blood group (serology) analysis was revolutionary at the time of their invention, allowing the identification of exclusions as well as differentiation between people when combined with other data. However, biological testing did not reach the level of individualization until 1985, when Alec Jeffreys of the University of Leicester discovered that a modified version of the previously developed restriction fragment length polymorphism (RFLP) detection technology could be used for forensic purposes (Jeffreys et al. 1985a; Jeffreys et al. 1985b; Jeffreys et al. 1985c). The original RFLP method identified interindividual differences between people by utilizing specialized bacterial restriction endonuclease enzymes that digest DNA at specific palindromic sites, resulting in fragments that are separated with agarose gel electrophoresis. The DNA strands are transferred onto a Southern blot membrane, and labeled probes attach to complementary sequences affixed to it. Individuals differ in the mutations of their restriction sites, resulting in fragments of variable lengths that are visualized with X-rays as differing cleavage patterns (Schneider 1997; Butler 2010; Roewer 2013). In Jeffrey’s variation of this method, multi-locus probes for highly variable sections of non-coding DNA termed variable number of tandem repeats (VNTRs) were used. VNTRs, also known as minisatellites, are short, repeating sections of DNA 6 - 100 base pairs (bp) in length. Instead of detecting variation in restriction site mutations like in basic RFLP, the VNTR method visualizes varying number of repeats between fixed restriction sites (Wyman & Whyte 1980; Jeffreys et al. 1985a; Budowle & Baechtel 1990; Jeffreys et al. 1991). In the genome, such repeat number variation can be found in both interspersed and tandem form. Interspersed repeats (LINEs; long interspersed nuclear elements and SINEs; short interspersed nuclear elements) are distributed throughout the genome and often have characteristics, such as high diversity and population-specificity, that are pragmatic for forensic applications (Singer 1982; Sajantila 1998; Ray et al. 2007). For instance, variation of a SINE known as an Alu insert has been used to tag human-specific DNA and identify the geographic origins of a sample (Batzer & Deininger 1991; Novick et al. 1993; Batzer et al. 1996; Mighell et al. 1997; Sajantila 1998; Batzer & Deininger 2002; Ray et al. 2007). In contrast to interspersed repeats, which are scattered through the genome, tandem repeats, aka satellite DNA, are found juxtaposed in long stretches. Minisatellites (VNTRs) and microsatellites (STRs), tandem repeats with short repeat lengths, are subclasses of satellite DNA. The visualization of VNTR probes resulted in highly variable bands of different repeat lengths, offering improvements in evidence power compared to RFLP systems due to high individual variation. This method also facilitated typing, as fragment lengths could be observed without time-consuming and labor-intensive sequencing (Jeffreys et al. 1985a; Jeffreys et al. 1985b; Gill et al. 1985; Schneider 1997). This genetic fingerprinting was first utilized for forensic purposes in 1985, in an immigration case that successfully

reunited a Ghanaian family with their son (Jeffreys et al. 1985c). Use of the technique soon expanded to criminal cases, and the first example of its use in a murder trial occurred in England in 1987. In this case, a blood sample from Leicestershire baker Colin Pitchfork was successfully matched to a sample of semen found at a murder scene. The DNA evidence was presented in court, and Pitchfork was convicted for two homicides and received a life sentence. This case was also noteworthy for being the first to exonerate a man with DNA evidence; a man who had confessed to the crime was released when his genetic profile did not match that found at the crime scene (Jeffreys et al. 1991; Roewer 2013). RFLP-typing can be used with single or multi-locus probes. Despite the success of the original multi-locus probe technique, it was soon replaced by the single-locus probe method, which was more efficient at mixture resolution and also more sensitive. Despite these advances, the minisatellite system continued to face severe limitations from a forensic perspective. Although quite effective in determining singular profiles for individuals, the method was tedious, impractically slow, and required a high amount of quality DNA, an obvious disadvantage for forensic assessments often involving DNA samples of sporadic condition and concentration (Schneider 1997; Roewer 2013; Decorte 2010). A new development around this time was the advent of polymerase chain reaction (PCR) technology. Developed by Kary Mullis in 1983, this genetic replication technique had the ability to amplify small amounts of DNA to usable concentrations, and opened up new opportunities for genetic testing. In addition to offering faster analysis and higher sensitivity, the method allowed an expanded range of markers to be considered for forensic casework (Saiki et al. 1985; Mullis et al. 1986; Sajantila 1992). For these reasons, minisatellites were subsequently overtaken in popularity by the smaller microsatellites (STRs). In comparison to earlier techniques, DNA testing offered improved resolution, raising the accuracy of biological sample testing to the individual level.
In terms of progress, the DNA typing field has grown at an explosive pace, graduating from earlier methods that were labor-intensive, time-consuming and expensive to cheaper, easier, faster and more sensitive analyses. The recent increase in the volume of data entered into various national databases brings novel concerns, including a higher risk of adventitious hits, increased requirements for improved infrastructure and data storage facilities, and the growing need for international cooperation and improved coordination (Ge et al. 2014). In the past few decades, the gathering of scientific evidence for legal purposes has become increasingly technical and organized, resulting in greatly improved resolution and accuracy, and the increased ubiquity of forensic investigations worldwide has translated to a growing impact and significance to society. The huge societal impact and responsibility in upholding the accuracy of justice makes strict quality control and constant improvement of techniques in forensic genetics crucially important. It also highlights the need for a profound understanding of contemporary genetic variation, and its evolution in the population of interest.

2. IDENTITY TESTING 2.1. Microsatellite typing The size of the human genome is 3 289 million DNA base pairs and is unique to each individual barring identical twins. DNA identification thus does not depend on the amount of data, but on the ability to reliably and effectively visualize this variation. Instead of sequence variation itself, the most widely applied forensic genetic marker class resolves variation in the number of repeat elements between individuals. Autosomal repeat markers (microsatellites, also known as short tandem repeats or STRs) are polymorphisms with short repeating units (2 - 7 bp). The testing range of multi-allelic microsatellites is about 5 - 20 repeats per locus for forensic purposes (Budowle & van
Figure 2. Timeline of hereditary markers used in casework. References: Wyman & White 1980; Jeffreys et al. 1985a, b, c; Gill et al. 1985; Mullis et al. 1986; Jeffreys et al. 1991; Schneider 1997; Budowle & van Daal 2008; Roewer 2013.
Daal 2008; Zietkiewicz et al. 2012). STRs exist in the millions in the human genome, making up as much as 3% of the entire sequence (International Human Genome Sequencing Consortium 2004). The adoption of these smaller, highly variable markers by crime laboratories globally was a beneficial development, as they fulfilled many of the practical requirements that had eluded earlier markers. By the end of the 1990s, microsatellites were the popular tool of choice for profiling and soon became the hallmark of DNA analysis (Schneider 1997; Gill 2002, Roewer 2013). Compared to minisatellites, microsatellites have a number of advantages. STRs are the most commonly used tool in identification testing because a relatively small amount of markers can provide a highly discriminating profile (Chakraborty et al. 1999; Gill 2002; Butler 2007). The ideally fit-for-purpose rate of mutation of STRs (10-4 to 10-3 per generation per locus) ensures high allele variability (Ellegren 2000). As the success of criminal investigations is often time-dependent, another significant advantage was the speed and ease of STR analysis. Microsatellites are typed using fast, relatively inexpensive and effortless standard methods that can be largely automated, such as CE (capillary electrophoresis). Several STR markers can be analyzed in the same reaction (multiplexed), further increasing analysis speed. Microsatellites also impose fewer demands on the amount and quality of DNA, often a crucial factor in forensic investigations. Although PCR technology had also been used to genotype minisatellites, typing from smaller microsatellite repeats was more reliable, especially for material exposed to degrading conditions because obstacles to effective interpretation such as polymerase error and allele dropout are both reduced. Another advantage of microsatellite testing is the simple and easily legible two-unit format, which makes data easy to store, exchange, and compare. In criminal casework, STR profiles obtained from evidence DNA are compared to either profiles of candidate persons, or those found in DNA databases. The practical chain of analysis in identification testing begins with the collecting of biological materials such as blood, saliva or semen from a crime scene or other source. DNA is then extracted and amplified to increase the copy number of target fragments. Amplified, fluorescently labeled DNA fragments are separated and analyzed using electrophoresis, and a profile composed of patterns of variation in the DNA is obtained. Nowadays, routine police laboratory work is generally performed using pre-prepared commercially available microsatellite sets. These standard kits contain primers, sequences that attach to the DNA in specific areas where variation is likely to occur. Such kits typically contain >15 primer pairs targeting different microsatellites in a single multiplexed reaction, in order to decrease the likelihood of a match to a random person in the population not involved in the crime. The markers in these sets are generally located either far apart from one another, or on separate chromosomes, ensuring independence. The individualizing properties of microsatellites are an advantage in a number of forensic applications. They are routinely utilized to help solve homicides, sexual assaults,

robberies, as well as other, more minor crimes in police investigations worldwide. Microsatellites are also frequently used in kinship testing, to verify or exclude biological relationships through DNA analysis. For example, paternity is assessed by comparing the DNA of a child to that of a candidate father to determine whether the profiles share enough alleles to confirm fatherhood. Paternity tests are generally performed using autosomal STRs; however, the confirmation of biological ties of extended family – important for instance in the reunification of relatives in the wake of conflicts and immigration – can be conducted using a variety of loci. Other forensic applications suited to autosomal microsatellite analysis include mass disaster victim identification, missing person searches, exoneration of wrongfully convicted prisoners, analysis of animal DNA, and the solving of historical cases. 2.2. Statistical Interpretation and Power of Evidence DNA investigations hinge on the matching of evidence to a reference sample, and on the strength, ie. power of the match. Unlike many other forensic comparisons such as those in ballistics or document analysis, in DNA testing the weight of evidence can be numerically estimated because probabilities are based on the frequency of alleles within a population. These tests can be applied in direct identification analyses, but are also applicable in any analysis where the strength of a match between a sample and a reference must be evaluated. In forensic terms an inclusion occurs when the profiles from an unknown and reference samples from a known contributor are identical, suggesting they originated from the same source. There are many different statistical methods for expressing the strength of evidentiary support in forensic genetics, most of which describe the probability of finding matching profiles by chance. One of the parameters used to express match power is random match probability (pM), which uses the occurrence of a combined marker set in the population to determine the likelihood that a profile will match that of another, random individual in the population. The strength of assessments relies on thorough knowledge of the frequency and distribution of alleles within the population. If the alleles occur in the population frequently, an obtained match is more likely to be coincidental; in other words, a false positive erroneously indicating that the evidence sample originated from the reference contributor. As the loci are independent, the locus-specific matching probabilities can be multiplied and the power of a “match” generally increases rapidly with each added locus. pM is also known as the power of inclusion. The power of exclusion in contrast calculates how efficient a multiplex is at excluding specific genotypes. Whereas discrimination power (see below) measures observed genotypes, exclusion power measures expected genotypes. This calculation is needed because not all genotypes are necessarily represented in the database. If only data from databases is used, the result may be an erroneous, non-representative estimate of genotype frequency.
Another forensic parameter is discrimination power (Pd), which is defined as the efficiency of the markers to distinguish between individuals. Discrimination power increases with each marker added. To determine the efficiency of markers to distinguish between individuals, discrimination power is calculated from match probability by subtracting the match probability value from one for one locus (1 - pM). For microsatellites, discrimination power can reach up to 1 in 1020 for standard sets, and higher with kits with more markers (e.g. Globalfiler) (Butler 2006). A valid statistical method commonly used to picture the strength of evidence in court testimony is the likelihood ratio (LR), a calculation in which the weight of evidence for and against a particular hypothesis is compared. In forensic science, this generally equates to the comparing of two scenarios, namely the odds that a sample originated from the suspect to the odds that it did not (i.e. someone other than the suspect has left the matching DNA profile). The LR method is often used to express the strength of evidence in situations such as paternity tests and DNA mixtures. A paternity index (PI) is a specialized example of a likelihood ratio that measures the probability of parenthood in a paternity scenario, specifically the likelihood that a candidate man is the biological father versus the likelihood that the father is a random man in the population. PI is assessed on a locus-by-locus basis, and the combined PI is the product of individual PIs. If the PI is less than one, a biological relationship is unlikely and some laboratory-specific limits are applied for reporting an inclusion (often PI > 10 000). As with match probability, assessment of likelihood ratios and paternity indices requires knowledge of the distribution and frequency of the alleles in the population. Errors in the assessment of allele frequency can lead to false estimates of the power of evidence and have serious consequences due to the judicial impact of forensic conclusions. The gravity of potential failings means that reliable estimates of polymorphism frequency have become a requirement for quality control (Carracedo et al. 2010). 2.3. DNA Databases In many countries, forensically relevant DNA information obtained by law enforcement is compiled and stored in national police databases, such as the UK National DNA Database (NDNAD). The first of its kind, the NDNAD register was established by the British Forensic Science Service in 1995 and is today run by the Home Office (Werrett 1997; Butler 2006). The marker sets used to collect the profiles for these national registers are multiplexes optimized to deliver high discrimination power. The core loci used for police profiling differ somewhat from country to country. The UK gathers profile information using 10 autosomal loci and amelogenin, a marker set known as SGM+ (Second Generation Multiplex) and containing loci D2S1338 and D19S433, FGA, TH01, VWA, D3S1358, D8S1179, D16S539, D18S51, and D21S11 (Kimpton et al. 1996; Cotton et al. 2000; Martin et al. 2001; Butler 2006). In 1999, the European Network of Forensic
Science Institutes (ENFSI) and the European DNA Profiling Group (EDNAP) created the first European Standard Set, the ESS loci, a set of core loci for collaborative European use originally consisting of seven autosomal markers (Leriche et al. 1998; Martin et al. 2001; Schneider & Martin 2001). In 2006, additional loci were included to create a kit consisting of 12 total markers: TH01, vWA, FGA, D21S11, D3S1358, D8S1179, D18S51, D10S1248, D14S1434, and D22S1045 (Gill et al. 2006; Schneider 2009; INTERPOL 2009). The American Combined DNA Index System (CODIS) database run by the United States Federal Bureau of Investigation (FBI) was established two years after the NDNAD, in 1997. The markers that comprise the FBI set are 13 microsatellites: D3S1358, D5S818, D7S820, D8S1179, D13S317, D16S539, D18S51, D21S11, CSF1PO, FGA, TH01, TPOX, vWA, and amelogenin, a marker for sex determination (Budowle et al. 1998; Butler 2006). In 2015, the set was expanded to include seven additional markers D1S1656, D2S441, D2S1338, D10S1248, D12S391, D19S433 and D22S1045 to create a set of 20 total core STRs for collecting DNA profiles (Hares 2015). It thus shares several of its loci with the current European standard sets, allowing for improved data sharing between nations (Butler 2006, Ge et al. 2014). Today, the National DNA Index System (NDIS) of the United States contains nearly 13 million offender profiles, about 4% of the US population (CODIS-NDIS 2017). In 2015, on its 20th anniversary, the NDNAD register contained approximately 5.7 million profiles, almost 9% of the UK’s population (National DNA Database UK 2015). The Finnish DNA register was created in 1999 and is quite substantial by average European standards, with 2.9% of the population represented compared to only about 0.9% of the population in Germany and the Netherlands (Santos et al. 2013; ENFSI DNA Working Group Report 2016). The largest DNA database in absolute numbers is maintained by China, with more than 20 million profiles (Roewer 2013; Ge et al. 2014). In addition to these standard sets, today there is a wide variety of commercial kits available, offering high discrimination power. These include for example STR kits 16-locus AmpFlSTR® Identifiler® Plus and 24-locus AmpFlSTR GlobalFiler® (Thermo-Fisher Scientific, Waltham, MA, USA), PowerPlex® FusionTM (Fusion, Promega Corporation, Madison, WI, USA), and Investigator® 24plex QS and GO! (QIAGEN GmbH, Hilden, Germany). Though mostly consisting of autosomal loci, some new STR kits also include a limited number of non-standard markers. There are also many kits available specifically for non-standard and uniparental markers. These include Powerplex Y23 (Promega) and 27-locus AmpFlSTR Yfiler® Plus (Thermo-Fisher Scientific) for Y-chromosomes and Investigator Argus X-12 (QIAGEN) for X-chromosomes. Insertion-deletions can be typed with the 30-locus Investigator DIPPlex kit (QIAGEN). Kits also exist for the typing of ancestry-informative and phenotypic markers (Budowle & van Daal 2009; Zietkiewicz et al. 2012). Uniparental and other non-standard markers are generally not included in official police STR databases such as CODIS. However, population databases, such as YHRD (Y-Chromosomal Short Tandem Repeat Haplotype Database)

and EMPOP (European DNA Profiling Group's Mitochondrial DNA Population Database Project) are also occasionally used to aid police investigations (Roewer et al. 2001; Parson & Dür 2007). 2.4. Standardization and Quality Control In order for forensic results to be accepted into the databases, all steps of the procedure must go through rigorous quality control. In the late 1980s, when single-locus probing was the most common method of profiling, the field of forensic genetics was significantly less standardized than it is today. The lack of consistent practices and quality control caused complications when comparing data between laboratories as well as in proving the validity of results in court (Martin et al. 2001; Schneider 2007; Roewer 2013). Compatibility between police, private, and research laboratories was also poor. To overcome these problems, a group consisting of eleven forensic laboratories came together in 1988 with the objective of standardizing forensic genetic practices in Europe. Together, these groups eventually formed EDNAP (the European DNA profiling group; a working group of the International Society for Forensic Genetics or ISFG) in 1991, creating a base for later, more comprehensive harmonization efforts. The main initiatives launched by EDNAP included the pioneering of collaborative method-validation exercises, and the publication of these results in scientific journals (Martin et al. 2001; Schneider & Martin 2001). The adoption of the SGM loci by the Forensic Science Service and the ensuing advent of large-scale marker set commercialization opened up the possibility of ready-made standard sets for laboratories worldwide. This facilitated marker standardization and thus also paved the way for the establishment of national DNA databases. By the end of the 90s, there were many further developments: the FBI had adopted its own core CODIS loci, and several European nations had established DNA registers for law enforcement, Finland among the first. In addition, the UK and the EU/INTERPOL had chosen their core loci for profiling purposes. In 1997, the open-borders initiative of the European Union further highlighted the urgency of establishing universal practices as well as a unified database network. As a result, the ENFSI working group was established to coordinate police laboratory activities and quality control (Martin et al. 2001; Schneider & Martin 2001). By 2004, the majority of European countries had national DNA registers, and most were using either the SGM+ or ESS set as their basis (Martin 2004; Gill et al. 2006). In 2005, the Treaty of Prüm allowed for improved international police cooperation and data exchange and today, EDNAP and ENFSI work together for harmonization and improvement of database practices (Gill et al. 2006; Schneider 2009). The overall aims of quality assurance and control are to ensure the integrity and validity of forensic results and to facilitate interlaboratory comparisons. To this end, meticulous protocols govern the collection, storage and analysis of evidence, as well as the interpretation and reporting of results. Adherence to standards is overseen with a variety of different measures, including training of staff according to proficiency requirements,

validation of standard methods and procedures, use of control samples, upkeep of equipment, and internal and external laboratory audits. Quality is maintained with periodic proficiency trials in which results are tested and compared between laboratories (Carracedo et al. 1997; Schneider 2007). For a forensic laboratory, legal responsibility and accountability mean that maintenance of an unbroken chain of custody and the prevention of contamination are priorities. The former confirms sample integrity through the tracing of evidence with careful documentation, while the latter entails a laboratory environment with separate post- and pre-amplification areas to prevent sample adulteration. Thus the movement of a piece of evidence from crime scene to courtroom is discernably monitored in order to ensure the incorruptibility of the item itself as well as the process by which is has been collected, stored, and analyzed. Another important consideration highlighted recently is the need for standardized guidelines for effective communication between scientific experts and the courts (ENFSI 2015; Amorim et al. 2016). In the forensic discipline, these systems of quality control are of the utmost importance as erroneous or faulty results could have massive consequences and literally be a matter of life and death. The International Organization for Standardization (ISO) has been the body governing these guidelines on quality management since 1987. In Europe, forensic biology laboratories specifically adhere to the standards of the International Society of Forensic Genetics (ISFG) (Schneider 2007b). In the United States, these standards are mandated by the National Institute of Standards and Technology (NIST), the National Research Council (NRC) of the Academy of Sciences of the United States and the American Academy of Forensic Sciences (AAFS) (Schneider 2007a). The specific ISO/IEC (International Organization for Standardization/ International Electrotechnical Commission) standard for testing and calibration laboratories is outlined in the ISO/IEC 17025 and ISO 18385: 2016 protocols. International law enforcement bodies such as the International Criminal Police Organization (INTERPOL) and the Federal Bureau of Investigation (FBI) also have an interest in unifying standards, in order to maintain the preparedness of forensic scientists for international mass disaster situations. In addition to facilitating data exchange, the 2005 Prüm Convention also allowed the establishment in 2006 of the INTERPOL DNA Gateway register, a centralized database created to facilitate police communication between member states. DNA Gateway requires a minimum of 6 STR loci for input and is accessible online at all times. By 2016, the database contained over 155,000 profiles contributed by 73 member countries (INTERPOL, 2016).
3. FORENSIC APPLICATIONS OF NON-STANDARD MARKERS The analysis of hereditary indicators can involve many different types of scenarios within a legal setting, and the requirements for marker type and complications faced vary in different situations. Non-straightforward cases often require the use of markers other than autosomal microsatellites. Insertion-deletion polymorphisms (indels or DIPs), single nucleotide polymorphisms (SNPs), and uniparental markers are all useful tools for analysis in situations that can be described as non-standard, ie. different from the basic identification and reference comparison that is generally performed with autosomal microsatellites. Their particular traits are advantageous in specialized scenarios. For example, forensic genetics often deals with samples that have not been preserved in ideal conditions. Human remains and samples may have been subjected to the degrading effects of time and elements of the environment, and may have deteriorated to the point that complete autosomal profiles cannot be obtained. The long amplicons of microsatellites and low initial copy number are not ideal for the analysis of this type of material. Lineage-specific markers can aid forensic investigations, for example in the confirmation of familial relationships through the tracing of maternal or paternal family trees. In addition, knowledge of their distribution within human populations is closely tied to forensic genetics as it serves to clarify long-term trees of ancestry, thus allowing the improved establishment of biogeographic links. These characteristics can provide crude but valuable investigative clues towards the geographic origins of sample donors in police cases. This has been demonstrated in practice for example in 2010, in a case where DNA from unidentified remains found in the woods in Finland indicated that the man was likely of German, Swiss or Northern Italian origin. He was finally identified as a 58-year old man of German descent. Other applications where non-standard markers are beneficial include the identification of phenotypic traits and the determination of cause of death in pathology. In this section, a variety of non-microsatellite markers, and their respective applications in forensic genetics will be explored. 3.1. Insertion-deletion polymorphisms Insertion-deletion polymorphisms are relative newcomers on the forensic scene, with the first paper of their large-scale characterization in different populations published in 2002 (Weber et al. 2002). In contrast to SNPs, which substitute one base for another while retaining the sum of nucleotides, in indels (insertion-deletion polymorphisms) the sequence length is changed as short sections are either inserted or deleted. Such shortened or elongated sections can range from one to hundreds of nucleotides, and are among the most abundant types of variation in the human genome with a distribution frequency of approximately one indel per 7.2 kb of DNA. They comprise from 16 to 25% of human sequence polymorphisms with an estimated frequency of over two million indels in total for the human population (Weber et al. 2002; Bhangale et al. 2005; Mills et al. 2006; Pereira et al. 2009; Mullaney et al. 2010; Pimenta & Pena 2010; Mills et al. 2011; Zidkova et al. 2013). Much of the indel variation in humans is produced by mobile genetic elements such as L1 and Alu retrotransposons (Mullaney et al. 2010).
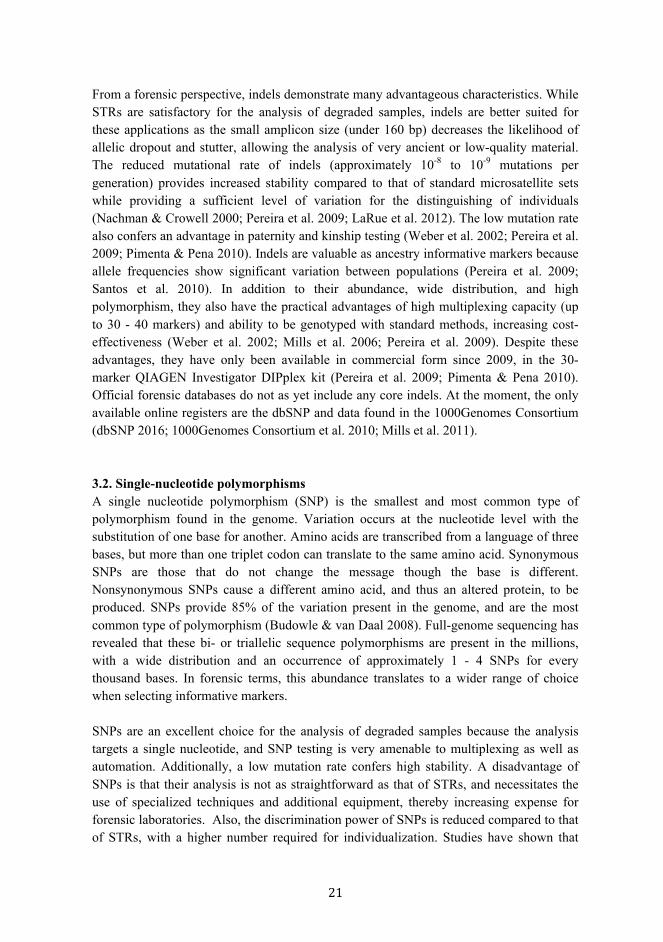
From a forensic perspective, indels demonstrate many advantageous characteristics. While STRs are satisfactory for the analysis of degraded samples, indels are better suited for these applications as the small amplicon size (under 160 bp) decreases the likelihood of allelic dropout and stutter, allowing the analysis of very ancient or low-quality material. The reduced mutational rate of indels (approximately 10-8 to 10-9 mutations per generation) provides increased stability compared to that of standard microsatellite sets while providing a sufficient level of variation for the distinguishing of individuals (Nachman & Crowell 2000; Pereira et al. 2009; LaRue et al. 2012). The low mutation rate also confers an advantage in paternity and kinship testing (Weber et al. 2002; Pereira et al. 2009; Pimenta & Pena 2010). Indels are valuable as ancestry informative markers because allele frequencies show significant variation between populations (Pereira et al. 2009; Santos et al. 2010). In addition to their abundance, wide distribution, and high polymorphism, they also have the practical advantages of high multiplexing capacity (up to 30 - 40 markers) and ability to be genotyped with standard methods, increasing cost-effectiveness (Weber et al. 2002; Mills et al. 2006; Pereira et al. 2009). Despite these advantages, they have only been available in commercial form since 2009, in the 30-marker QIAGEN Investigator DIPplex kit (Pereira et al. 2009; Pimenta & Pena 2010). Official forensic databases do not as yet include any core indels. At the moment, the only available online registers are the dbSNP and data found in the 1000Genomes Consortium (dbSNP 2016; 1000Genomes Consortium et al. 2010; Mills et al. 2011). 3.2. Single-nucleotide polymorphisms A single nucleotide polymorphism (SNP) is the smallest and most common type of polymorphism found in the genome. Variation occurs at the nucleotide level with the substitution of one base for another. Amino acids are transcribed from a language of three bases, but more than one triplet codon can translate to the same amino acid. Synonymous SNPs are those that do not change the message though the base is different. Nonsynonymous SNPs cause a different amino acid, and thus an altered protein, to be produced. SNPs provide 85% of the variation present in the genome, and are the most common type of polymorphism (Budowle & van Daal 2008). Full-genome sequencing has revealed that these bi- or triallelic sequence polymorphisms are present in the millions, with a wide distribution and an occurrence of approximately 1 - 4 SNPs for every thousand bases. In forensic terms, this abundance translates to a wider range of choice when selecting informative markers. SNPs are an excellent choice for the analysis of degraded samples because the analysis targets a single nucleotide, and SNP testing is very amenable to multiplexing as well as automation. Additionally, a low mutation rate confers high stability. A disadvantage of SNPs is that their analysis is not as straightforward as that of STRs, and necessitates the use of specialized techniques and additional equipment, thereby increasing expense for forensic laboratories. Also, the discrimination power of SNPs is reduced compared to that of STRs, with a higher number required for individualization. Studies have shown that
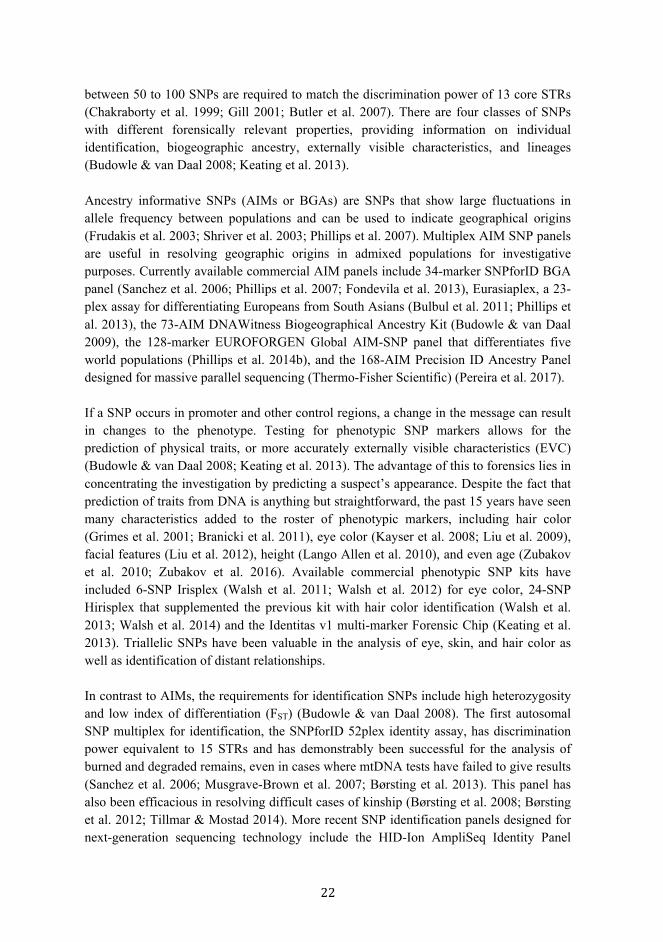
between 50 to 100 SNPs are required to match the discrimination power of 13 core STRs (Chakraborty et al. 1999; Gill 2001; Butler et al. 2007). There are four classes of SNPs with different forensically relevant properties, providing information on individual identification, biogeographic ancestry, externally visible characteristics, and lineages (Budowle & van Daal 2008; Keating et al. 2013). Ancestry informative SNPs (AIMs or BGAs) are SNPs that show large fluctuations in allele frequency between populations and can be used to indicate geographical origins (Frudakis et al. 2003; Shriver et al. 2003; Phillips et al. 2007). Multiplex AIM SNP panels are useful in resolving geographic origins in admixed populations for investigative purposes. Currently available commercial AIM panels include 34-marker SNPforID BGA panel (Sanchez et al. 2006; Phillips et al. 2007; Fondevila et al. 2013), Eurasiaplex, a 23-plex assay for differentiating Europeans from South Asians (Bulbul et al. 2011; Phillips et al. 2013), the 73-AIM DNAWitness Biogeographical Ancestry Kit (Budowle & van Daal 2009), the 128-marker EUROFORGEN Global AIM-SNP panel that differentiates five world populations (Phillips et al. 2014b), and the 168-AIM Precision ID Ancestry Panel designed for massive parallel sequencing (Thermo-Fisher Scientific) (Pereira et al. 2017). If a SNP occurs in promoter and other control regions, a change in the message can result in changes to the phenotype. Testing for phenotypic SNP markers allows for the prediction of physical traits, or more accurately externally visible characteristics (EVC) (Budowle & van Daal 2008; Keating et al. 2013). The advantage of this to forensics lies in concentrating the investigation by predicting a suspect’s appearance. Despite the fact that prediction of traits from DNA is anything but straightforward, the past 15 years have seen many characteristics added to the roster of phenotypic markers, including hair color (Grimes et al. 2001; Branicki et al. 2011), eye color (Kayser et al. 2008; Liu et al. 2009), facial features (Liu et al. 2012), height (Lango Allen et al. 2010), and even age (Zubakov et al. 2010; Zubakov et al. 2016). Available commercial phenotypic SNP kits have included 6-SNP Irisplex (Walsh et al. 2011; Walsh et al. 2012) for eye color, 24-SNP Hirisplex that supplemented the previous kit with hair color identification (Walsh et al. 2013; Walsh et al. 2014) and the Identitas v1 multi-marker Forensic Chip (Keating et al. 2013). Triallelic SNPs have been valuable in the analysis of eye, skin, and hair color as well as identification of distant relationships. In contrast to AIMs, the requirements for identification SNPs include high heterozygosity and low index of differentiation (FST) (Budowle & van Daal 2008). The first autosomal SNP multiplex for identification, the SNPforID 52plex identity assay, has discrimination power equivalent to 15 STRs and has demonstrably been successful for the analysis of burned and degraded remains, even in cases where mtDNA tests have failed to give results (Sanchez et al. 2006; Musgrave-Brown et al. 2007; Børsting et al. 2013). This panel has also been efficacious in resolving difficult cases of kinship (Børsting et al. 2008; Børsting et al. 2012; Tillmar & Mostad 2014). More recent SNP identification panels designed for next-generation sequencing technology include the HID-Ion AmpliSeq Identity Panel

124plex, which combines autosomal identification and Y-chromosomal lineage SNPs (Thermo-Fisher Scientific) and the 140-SNP forensic identification multiplex (QIAGEN). Large international initiatives such as the Human Genome Project and International HapMap Project have made efforts to map out SNP variation in human populations, resulting in the discovery of millions of novel polymorphisms. These have been catalogued in the extensive Human Genome Diversity Panel (HGDP-CEPH) (Keating et al. 2013).
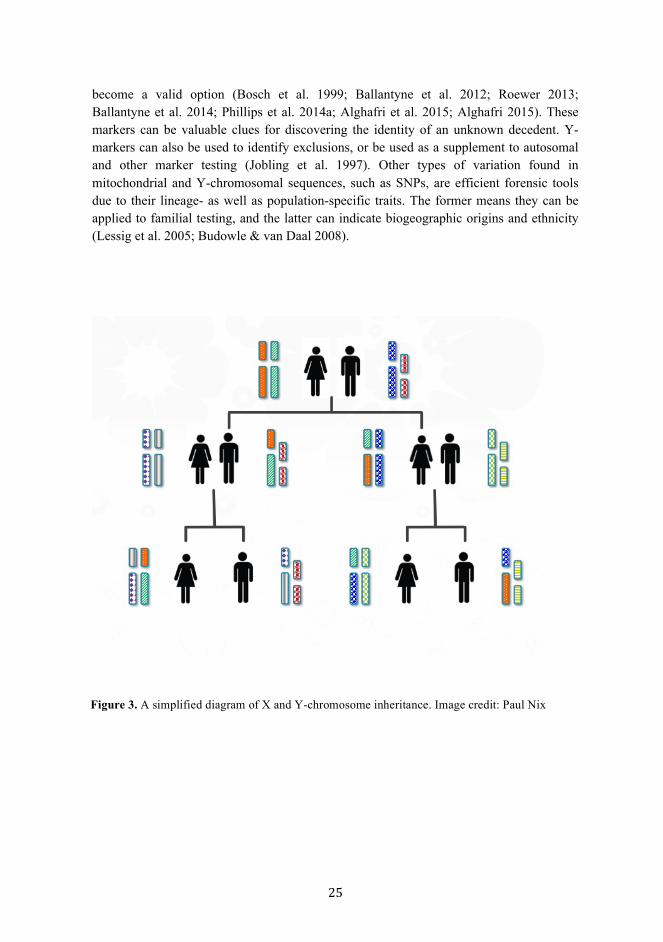
3.3. Non-autosomal markers The two human sex chromosomes, X and Y, are thought to have originated as autosomes and diverged from each other between 170 to 310 million years ago (Lahn & Page, 1999; Warren et al. 2008). The mechanism of divergence occurred with the accumulation of genes for sex-determination and the subsequent suppression of recombination, leading to retention of essential functions (Graves 1998; Graves 2006). The 60 Mb Y-chromosome shows significant degradation in comparison to other chromosomes with only 50 genes compared, for example, to the 1500 found on the 165Mb X-chromosome (IHGSC 2001). During meiosis, most of the Y-chromosome does not recombine, with the exception of the pseudo-autosomal regions (PAR) that cross over with homologous regions on the X-chromosome (Tilford et al. 2001). The non-recombining, or male-specific region (MSY) of the Y contains the sex-determining region (SRY), which houses genes for testes development (Foster et al. 1992; Jobling & Tyler-Smith 2003). The MSY contains three distinct sequence regions: X-transposed, X-degenerate, and ampliconic. The X-transposed region shows high homology (99%) with the X-chromosome (Skaletsky et al. 2003). Non-autosomal markers (those found in Y-chromosomes, X-chromosomes, and mitochondrial DNA) differ from autosomes in their pattern of inheritance, copy number, and mechanisms of variation. In humans, and most other mammals, females inherit one X-chromosome from each parent, and males receive an X-chromosome from the mother and a Y-chromosome from the father. Changes in the uniparental sequences of the Y-chromosomes and mitochondria occur only through mutation. Mitochondria are passed down maternally, while Y-chromosomes are inherited down the paternal line only, with no confounding of information through recombination. Uniparental loci are termed haplotype markers as they exist in only a single copy, as opposed to autosomal markers, which exist in two. Y-chromosomal and mitochondrial markers, and to a somewhat lesser extent X-chromosomal markers, have been used in forensic laboratories since the 1980s (Higuchi et al. 1988; Witt & Erickson 1989). Though possessing lower discrimination power than autosomal markers, they have other advantages in forensic terms. 3.3.1. Y- chromosomal markers 3.3.1.1. Y- markers in forensics When first identified in the 1990s, Y-STRs were found to have levels of polymorphism similar to autosomal STRs (Roewer et al. 1992; Ballantyne et al. 2010). In subsequent
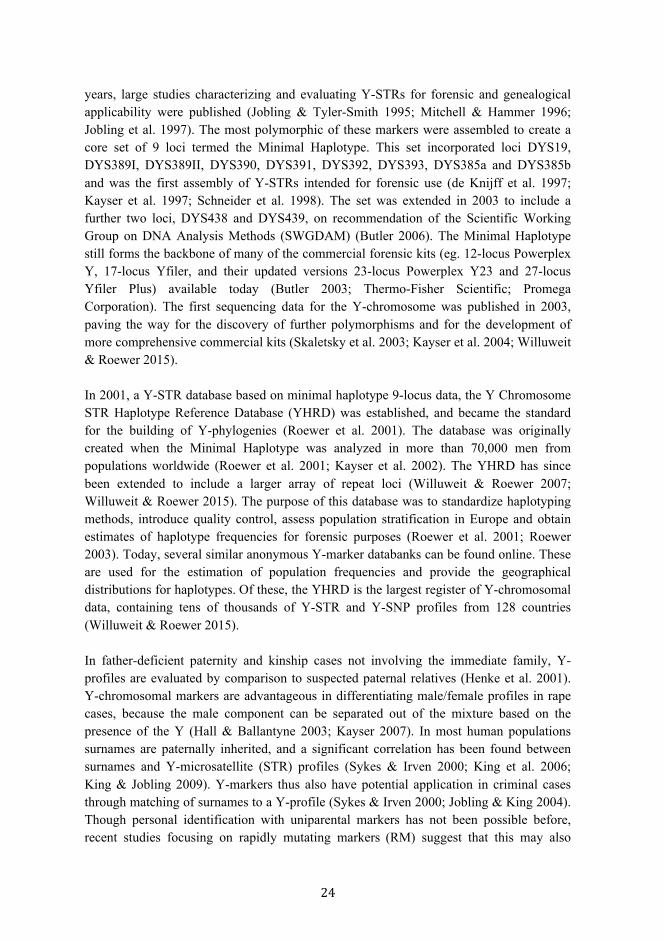
years, large studies characterizing and evaluating Y-STRs for forensic and genealogical applicability were published (Jobling & Tyler-Smith 1995; Mitchell & Hammer 1996; Jobling et al. 1997). The most polymorphic of these markers were assembled to create a core set of 9 loci termed the Minimal Haplotype. This set incorporated loci DYS19, DYS389I, DYS389II, DYS390, DYS391, DYS392, DYS393, DYS385a and DYS385b and was the first assembly of Y-STRs intended for forensic use (de Knijff et al. 1997; Kayser et al. 1997; Schneider et al. 1998). The set was extended in 2003 to include a further two loci, DYS438 and DYS439, on recommendation of the Scientific Working Group on DNA Analysis Methods (SWGDAM) (Butler 2006). The Minimal Haplotype still forms the backbone of many of the commercial forensic kits (eg. 12-locus Powerplex Y, 17-locus Yfiler, and their updated versions 23-locus Powerplex Y23 and 27-locus Yfiler Plus) available today (Butler 2003; Thermo-Fisher Scientific; Promega Corporation). The first sequencing data for the Y-chromosome was published in 2003, paving the way for the discovery of further polymorphisms and for the development of more comprehensive commercial kits (Skaletsky et al. 2003; Kayser et al. 2004; Willuweit & Roewer 2015). In 2001, a Y-STR database based on minimal haplotype 9-locus data, the Y Chromosome STR Haplotype Reference Database (YHRD) was established, and became the standard for the building of Y-phylogenies (Roewer et al. 2001). The database was originally created when the Minimal Haplotype was analyzed in more than 70,000 men from populations worldwide (Roewer et al. 2001; Kayser et al. 2002). The YHRD has since been extended to include a larger array of repeat loci (Willuweit & Roewer 2007; Willuweit & Roewer 2015). The purpose of this database was to standardize haplotyping methods, introduce quality control, assess population stratification in Europe and obtain estimates of haplotype frequencies for forensic purposes (Roewer et al. 2001; Roewer 2003). Today, several similar anonymous Y-marker databanks can be found online. These are used for the estimation of population frequencies and provide the geographical distributions for haplotypes. Of these, the YHRD is the largest register of Y-chromosomal data, containing tens of thousands of Y-STR and Y-SNP profiles from 128 countries (Willuweit & Roewer 2015). In father-deficient paternity and kinship cases not involving the immediate family, Y-profiles are evaluated by comparison to suspected paternal relatives (Henke et al. 2001). Y-chromosomal markers are advantageous in differentiating male/female profiles in rape cases, because the male component can be separated out of the mixture based on the presence of the Y (Hall & Ballantyne 2003; Kayser 2007). In most human populations surnames are paternally inherited, and a significant correlation has been found between surnames and Y-microsatellite (STR) profiles (Sykes & Irven 2000; King et al. 2006; King & Jobling 2009). Y-markers thus also have potential application in criminal cases through matching of surnames to a Y-profile (Sykes & Irven 2000; Jobling & King 2004). Though personal identification with uniparental markers has not been possible before, recent studies focusing on rapidly mutating markers (RM) suggest that this may also
become a valid option (Bosch et al. 1999; Ballantyne et al. 2012; Roewer 2013; Ballantyne et al. 2014; Phillips et al. 2014a; Alghafri et al. 2015; Alghafri 2015). These markers can be valuable clues for discovering the identity of an unknown decedent. Y-markers can also be used to identify exclusions, or be used as a supplement to autosomal and other marker testing (Jobling et al. 1997). Other types of variation found in mitochondrial and Y-chromosomal sequences, such as SNPs, are efficient forensic tools due to their lineage- as well as population-specific traits. The former means they can be applied to familial testing, and the latter can indicate biogeographic origins and ethnicity (Lessig et al. 2005; Budowle & van Daal 2008).
Figure 3. A simplified diagram of X and Y-chromosome inheritance. Image credit: Paul Nix

3.3.1.2. Y-markers in evolutionary research Uniparental Y-chromosomal and mitochondrial sequences are inherited whole and carried through generations intact, enabling the tracing of unchanged maternal and paternal lineages through time. Uniparental DNA variation is often characterized by clustering different haplotypes into haplogroups, groups of haplotypes that share an ancestral mutation. The organization of haplogroups into trees of ancestry (phylogenies) gives insights into evolutionary distances and timelines (Larmuseau et al. 2015). Such phylogenies are reconstructed based on the current variation by deducing changes through time, and since genetic mutations occur at specific rates, chronologies can be built based on the timing of these changes. Data on geographical distribution of the different variants and information on changes accumulated from the reconstructed ancestral state enables the determination of lineage origins, migrations, dispersal and admixture of human populations (Karafet et al. 2008; Chiaroni et al. 2009). The evidence from these markers can be combined with dating of cultural artifacts, associating genetic groups with specific cultures. Genetic and archaeological evidence collected in the past decades has established a history of anatomically modern humans (AMH), beginning from their point of origin on the African continent. Migration out of Africa occurred approximately 50 - 60 kya, followed by expansion and dispersal into other continents. Analysis of the Y-chromosome and mitochondrial DNA has shown that the most ancient lineages, earliest expansion times, and largest effective population sizes are all found in Sub-Saharan African populations. These findings are consistent with a model proposing a series of founder groups with roots in Africa (Cann et al. 1987, Hammer 1995; Mitchell & Hammer 1996; Underhill et al. 1997; Jorde et al. 2000; Hammer et al. 2001; Underhill et al. 2001; Underhill & Kivisild 2007; Karafet et al. 2008; Chiaroni et al. 2009; van Oven & Kayser 2009; Schuster et al. 2010; Shi et al. 2010; Cruciani et al. 2011; Fu et al. 2013; Poznik et al. 2013; Mendez et al. 2013; Hallast et al. 2014). The Y-chromosomal tree is rooted by comparison of Y-SNP ancestral states to primate genome sequences. Dating of the Y-chromosomal most recent common ancestor (YMRCA) is heavily dependent on mutation rate, and can thus vary greatly depending on the method used to calculate this value (Poznik et al. 2013). In 2013, an African-American Y-genome carrying the ancestral state for all known Y-SNPs was discovered. The lineage (named A00) was fixed as the new root and used to estimate the YMRCA at 338 kya (Mendez et al. 2013). The first full-coverage massively parallel sequencing of the Y-chromosomal MSY region covering most major clades was performed in 2014, discovering a vast amount of novel SNPs and bringing better resolution to the phylogeny (Hallast et al. 2014). This, the most exhaustive study to date, obtained high coverage of the Y-chromosome coupled with 448 samples from 17 worldwide populations. Rooting the tree in great ape sequences and using a mutation rate of 1.0 x 10⁻⁹/bp/year, a value attained with next-generation sequencing from Xue et al. 2009, a human YMRCA age of 126 kya was reached (Xue et al. 2009, Hallast et al. 2014). These studies are indicative of
the difficulties faced in establishing consensus methods for calibration and in calculating the precise age of ancient lineages. The original Y-SNP consensus phylogeny, published by the Y Chromosome Consortium, recognized 18 major haplogroups that were given letter codes from A to R (Hammer 1995; Mitchell & Hammer 1996). The locations of origin for each branch are inferred through the assessment of divergence from the ancestral state, and the counting of mutations accumulated through time. Sequencing of the Y-chromosome in 2003 allowed the discovery of many novel polymorphisms and the eventual updating of the tree with two additional haplogroups, S and T (Skaletsky et al. 2003; Jobling & Tyler-Smith 2003; Karafet et al. 2008). The complete phylogeny today includes major haplogroups A00-T, each branch identified with broad regional affinities (Karafet et al. 2008; Hallast et al. 2014). The longest and oldest branch of the Y-chromosomal tree, basal clade A, is found in Africa. Out of all branches of the phylogeny, this clade shows the greatest amount of genetic diversity (Underhill & Kivisild 2007; Hallast et al. 2014). Although the highest frequency of this haplogroup is found in southern Africa, the oldest subclades are present in Central and Northwest Africa and are thought to be between 200 to 300 thousand years old (Mendez et al. 2013; Hallast et al. 2014; Batini et al. 2015; Karmin et al. 2015; Trombetta et al. 2015). Clade B is also an African haplogroup, with a YMRCA of approximately 46 kya (Hallast et al. 2014). It is the second most diverse and also second oldest branch of the phylogeny. Other clades of the tree are younger, and have diverged from these post-migration out of Africa (Underhill et al. 2001; Wei et al. 2013; Hallast et al. 2014; Karmin et al. 2015). This bottleneck, and the following colonization of Eurasia, is dated to approximately 50 thousand years ago using both genetic and archeological evidence (Hallast et al. 2014; Karmin et al. 2015). Sequence analyses of ancient mtDNA genomes have suggested that divergence of African and non-African populations occurred circa 95 kya (Fu et al. 2013). Haplogroups C and D are associated with Asia, with YMRCAs of 39 and 34 kya respectively (Hallast et. al. 2014). Most of the world’s population is descended from haplogroup F. The origins of branches N and O (from parent group K) are in northwest and southeast Asia, respectively, and have dispersed widely. Haplogroup Q is found in Northeast Asia and is associated with migration into the Americas, while I and J are European branches. The youngest expansions include the clades R, Q, and S (Chiaroni et al. 2009; Hallast et al. 2014; Batini et al. 2015). All three of these haplogroups have coalescent times between 3.5 and 7.3 kya (Hallast et al. 2014; Batini et al. 2015; Karmin et al. 2015). N1c1, I1, and R1a are the most common subhaplogroups found in Finland (Lahermo et al. 1999; Lappalainen et al. 2006).

Until recently, the Y-Chromosome Consortium (YCC) was the main resource for scientists looking to assess Y-chromosomal haplogroups for forensic purposes. However, its most recent update was in 2008, and the rise of next-generation sequencing (NGS) technology since that time has led to an enormous influx of new Y-haplogroup data leading to constant reshuffling of SNP placement, disagreements over reliability, and calls for the establishment of validation procedures and a consensus nomenclature (van Oven et al. 2014). Trees of Y-chromosomal ancestry have different requirements for different disciplines. While population geneticists place more emphasis on the structure of the tree and the evolutionary and demographic mechanisms that created it, forensic scientists are generally more interested in finding accurate SNPs with high regional specificity and discrimination power. The placement of Y-markers within a phylogeny can be used in forensics to trace paternal lineages and male biogeographic ancestry (Larmuseau et al. 2015). Since the accuracy of phylogenies is essential for making valid forensic comparisons, reaching a consensus on the structure of the tree as well as standard nomenclatures is of utmost importance. To be forensically beneficial as a reference, the tree must have high discrimination between branches and restricted inclusion of only lineages that are globally informative. Other criteria for a forensically beneficial
Figure 4. Simplified phylogeny of Y-chromosomal haplogroups.

phylogeny include clarity, currency, and continuity with previous Y-trees. Recently, two major restructurings aimed to unite the wealth of new information gained from whole genome sequencing into abbreviated trees with maximum informativeness, the first for purposes of forensic science and the second for evolutionary studies (van Geystelen et al. 2013; van Oven et al. 2014; Larmuseau et al. 2015). Standardization of a tree will also have the added benefit of allowing further collection of Y-SNP frequency and distribution data into YHRD for forensic purposes (Larmuseau et al. 2015). Y-SNPs are now routinely entered into the YHRD database before publication in scientific journals, including loci from new kits Powerplex Y23 and Yfiler Plus (Willuweit & Roewer 2007; Willuweit & Roewer 2015). Most nations do not have separate Y-chromosomal police DNA databases, and the information collected for YHRD provides forensic scientists with information on the distribution and frequency of Y-chromosomal alleles worldwide, thus assisting with the determination of match probabilities and the weight of evidence for forensic purposes. The population data in YHRD is anonymous and cannot be used for direct identification. However, national registers of Y-chromosomal data have been incorporated into the YHRD and the high-quality information in them can be used in forensic studies to help in the LR-based resolution of male-female mixtures and can give indications of the geographical origins of a donor sample. Combining information from slow-mutating SNPs and fast-mutating STRs creates “compound haplotypes” that are more informative for evolutionary studies than either alone. (Mitchell & Hammer 1996; de Knijff 2000; Underhill & Kivisild 2007; Oliveira et al. 2014; Willuweit & Roewer 2015). Knowledge of the location of STRs within Y-chromosomal phylogenies can also be used to trace the geographical ancestry of donors in forensic studies and this method will be increasingly advantageous as more Y-markers become incorporated also into police databases worldwide (Ge 2014; Willuweit & Roewer 2015). 3.3.2. Mitochondrial DNA 3.3.2.1. Mitochondrial DNA and its use in forensics DNA is also found in the mitochondria, which are small organelles that produce energy. It is likely that the mitochondrion originated as a primordial prokaryote that, some two billion years ago, was engulfed by a eukaryotic cell. Instead of being digested, the prokaryote was retained within the cell and conferred to its host an evolutionary advantage in the form of efficient energy production (Sagan & Margulis 1987). Mitochondria contain a circular strand of DNA that is independent of the rest of the genome. This DNA exists in both sexes, but is only passed down through the maternal line because mitochondria present in the sperm are destroyed after fertilization (Giles et al. 1980; Sutovsky et al. 1999). The genomes of these organelles consist of a double-stranded, closed plasmid-like ring. Like those of their bacterial relatives, mitochondrial genomes are simple at 16.5 kb in size

and utilize a slightly different genetic code than the nuclear genome. They contain only 37 genes and are generally divided into two regions, a control and coding region. The control region is composed of non-coding DNA. As it is not translated, it has a higher rate of mutation than the rest of the genome. Within the coding region, the two areas of highest polymorphism are hypervariable region I (HVRI; 569 bp) and II (HVRII; 400 bp)(Anderson et al. 1981; Andrews et al. 1999). In the forensic discipline, the main application of mtDNA, in addition to kinship testing, is in the analysis of compromised material. When DNA is present in low amounts or is of a degraded quality, a profile is more likely to be obtained with mitochondrial analysis as its integrity is protected both by its non-nuclear location within the cell, as well as its high copy number. The analysis of compromised DNA is beneficial in finding the identity of badly damaged remains, and mtDNA testing has frequently been employed in cases of disaster victim identification, and decomposed materials (Budowle et al. 2005; Parson & Bandelt 2007). A limitation of mtDNA testing is that it represents single locus and can only provide comparisons for maternal lineages, reducing its discrimination power in
Figure 5. Mitochondrial plasmid structure.
comparison to autosomal microsatellites. Another disadvantage that must be taken into consideration in the analysis of mtDNA is the occurrence of heteroplasmy: the presence of multiple haplotypes within the same individual that may confound comparisons (Comas et al. 1995). Mitochondrial DNA was first sequenced in 1981, and first used in a forensic capacity in the 1990s. The mitochondrial genome is a simple one with a higher rate of change relative to the Y-chromosome. Its high diversity does not allow establishment of the ancestral state, and since 1999 variability in the genome was measured by comparison to the revised Cambridge Reference Sequence (rCRS), which represented the first sequenced complete human mitochondrial genome (Anderson et al. 1981; Andrews et al. 1999). The simplicity of this genome (16,569 bp) allowed mitochondrial profiles to be reported simply as the number of deviations from the rCRS. Though convenient originally, further exploration of the rCRS has shown that it is a non-ideal reference sequence for mitochondrial phylogeny construction. As the rCRS did not represent an ancestral lineage, but instead a distant branch of contemporary mtDNA phylogeny, it has complicated the establishment of nomenclature and phylogeny. The sequence belongs to the recently coalescing, modern European haplogroup H2a2a1 and as a result makes phylogenetic interpretation prone to errors. The Reconstructed Sapiens Reference Sequence (RSRS) is a more scientifically meaningful, computer-derived reconstruction representing an amalgamation of data from over 8,000 contemporary sequences. The study compared previously defined Sub-Saharan haplogroup L0 to six Neanderthal genomes, rooting the phylogeny with them, and establishing the new reference point. More than 18,000 complete mtDNA sequences were used to resolve the phylogeny, using the RSRS to create the most parsimonious tree. Although the RSRS would allow a more valid establishment of nomenclature and phylogeny, and would thus be beneficial also for other disciplines such as medical and forensic science, its adoption as a reference point has been somewhat controversial due to practical complications such as integration of the new data with that collected as comparisons to rCRS (Behar et al. 2012; Bandelt et al. 2013). The most commonly used mitochondrial database designed for forensic use is the EMPOP (European DNA Profiling mtDNA Population Database) register, launched in 2006 (Parson & Dür 2007). Originally containing 5173 sequences from five populations, since its introduction the database has expanded to contain tens of thousands of profiles representing various populations worldwide. Both EMPOP and YHRD content is regulated by SWGDAM (Scientific Working Group on DNA Analysis Methods) and ISFG guidelines which recommend typing, interpretation, nomenclature and reporting standards (Schneider 2007a; Schneider 2007b; Parson & Dür 2007; Parson et al. 2014).

3.3.2.2. Mitochondrial DNA in evolutionary research The mitochondrial MRCA (also known as “Mitochondrial Eve”), the root of the mtDNA tree, is the most recent shared matrilineal ancestor of all humans alive today. More precisely, it is the most recent common ancestor of all human mtDNA types. Until recently, the matrilinear MRCA was estimated to have lived approximately 200,000 ya (Soares et al. 2009; Behar et al. 2012). However, recent research has indicated that it may instead have been contemporaneous with the YMRCA (Cann 2013; Poznik et al. 2013). The mitochondrial genome does not have a consistent mutation rate throughout. Instead, the control region mutates at a rate about ten times faster than the coding region (van Oven & Kayser 2009; Behar et al. 2012). Like Y-chromosomal analyses, mitochondrial studies also have not reached a definitive consensus for either mutation rate or the date of the most recent common ancestor. A recent study of mtDNA mutation rate utilizing variable methods yielded values of 1.57 × 10⁻⁸ substitutions per site per year for the coding region and 2.67 × 10⁻⁸ substitutions per site per year for the whole molecule, calibrated from ancient human remains (Fu et al. 2013). Poznik et al. used the peopling of the Americas as a calibration point, yielding a mutation rate of 2.3 × 10⁻⁸/bp/year (Poznik et al. 2013). The former study obtained an estimate of 157 kya, while the latter indicated
Figure 6. Mitochondrial inheritance. Image credit: Paul Nix
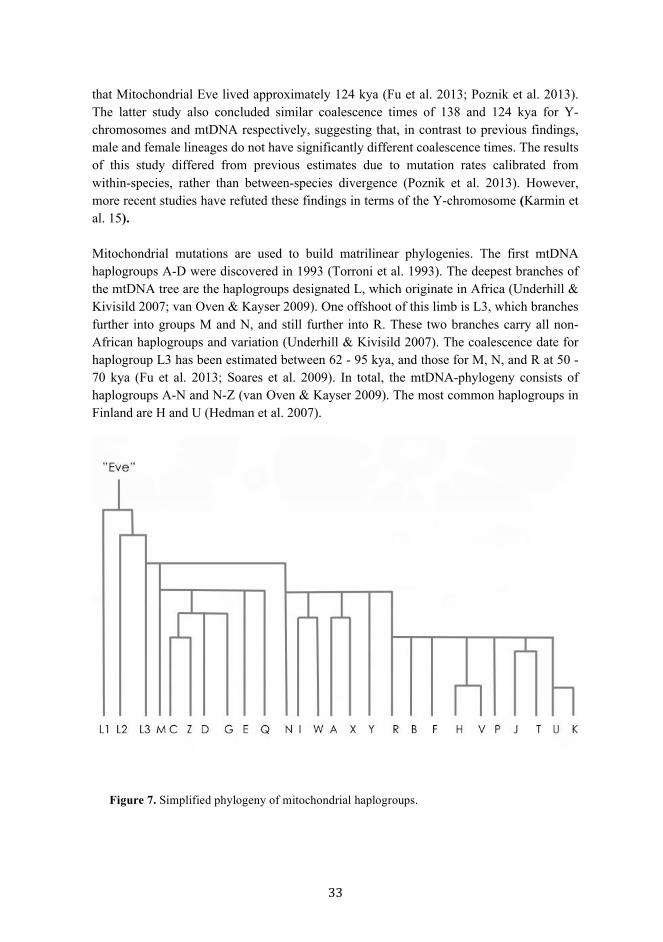
that Mitochondrial Eve lived approximately 124 kya (Fu et al. 2013; Poznik et al. 2013). The latter study also concluded similar coalescence times of 138 and 124 kya for Y-chromosomes and mtDNA respectively, suggesting that, in contrast to previous findings, male and female lineages do not have significantly different coalescence times. The results of this study differed from previous estimates due to mutation rates calibrated from within-species, rather than between-species divergence (Poznik et al. 2013). However, more recent studies have refuted these findings in terms of the Y-chromosome (Karmin et al. 15). Mitochondrial mutations are used to build matrilinear phylogenies. The first mtDNA haplogroups A-D were discovered in 1993 (Torroni et al. 1993). The deepest branches of the mtDNA tree are the haplogroups designated L, which originate in Africa (Underhill & Kivisild 2007; van Oven & Kayser 2009). One offshoot of this limb is L3, which branches further into groups M and N, and still further into R. These two branches carry all non-African haplogroups and variation (Underhill & Kivisild 2007). The coalescence date for haplogroup L3 has been estimated between 62 - 95 kya, and those for M, N, and R at 50 - 70 kya (Fu et al. 2013; Soares et al. 2009). In total, the mtDNA-phylogeny consists of haplogroups A-N and N-Z (van Oven & Kayser 2009). The most common haplogroups in Finland are H and U (Hedman et al. 2007).
Figure 7. Simplified phylogeny of mitochondrial haplogroups.

3.3.3. X-chromosomal markers 3.3.3.1. X-chromosomes in forensics The pattern of inheritance of the X-chromosome is somewhat more complex than that of mitochondrial or Y-chromosomal DNA. Females have two copies of the chromosome, only one of which is passed on to offspring. Males have one copy, which they pass on to daughters only. The chromosome is present in two copies, but only one copy is active; the other is inactivated (Szibor et al. 2003). X-chromosome sequences have a similar power of informativeness as autosomal markers. However, the power of discrimination is higher in female than male identification (Szibor 2007). The first forensically relevant marker to be detected on the X-chromosome was the XG blood group system, consisting of two antigens, discovered in 1962 (Mann et al. 1962). In the 1990s three X-STRs HPRTB, ARA and DXS981 were added to the roster of available markers (Szibor 2007). Commercial kits became available a decade later, beginning with the 2004 Mentype Argus X-UL containing 5 X-microsatellites and amelogenin. The most popular X-STR kit currently is the QIAGEN Investigator Argus-12, which contains amelogenin and 12 markers, DXS7132, DXS7423, DXS8378, DXS10074, DXS10079, DXS10101, DXS10103, DXS10134, DXS10135, DXS10146, DXS10148, and HPRTB (QIAGEN). Recently, efforts have been made to update the selection of X-STRs available for laboratory use, and for instance a 17-locus X-STR kit has been developed (Prieto-Fernandez et al. 2016). In 2003, The Forensic ChrX Research Group introduced the online ChrX-STR.org database (http://www.chrx-str.org) for use as a reference of population genetic data. This register currently includes 58 populations (Forensic ChrX Research Group, 2017). X-chromosomal analysis is mainly used in kinship cases to supplement autosomal and other uniparental marker testing. They are especially advantageous in solving complicated relationships, such as father-deficient paternity testing, or when testing kinship between a candidate father and daughter, or mother and son (Tillmar et al. 2008; Pinto et al. 2012). X-markers are also informative in family reunification cases where samples from some family members are absent, or where candidate fathers are closely related (Szibor et al. 2003). X-STRs can be used as a supplementary to other kinship markers when samples are degraded or very old, and to resolve female components of male-female and female-female mixtures (Szibor 2007). The Investigator Argus X-12 kit (QIAGEN) has also been used to resolve male lineages in cases where Y-haplotypes were identical (Szibor 2007; Cainé et al. 2011). X-SNPs and X-indels have also been explored as tools to supplement forensic analyses (Pereira et al. 2011; Pereira et al. 2012b).
4. ADDITIONAL FORENSIC APPLICATIONS OF DNA MARKERS 4.1. Disaster Victim Identification In the late 1970s, two passenger jets belonging to Pan American and Dutch KLM airlines collided on the runway in the Spanish Canary Islands, with several hundred fatalities. Subsequent efforts to identify the remains of the deceased ran into difficulties due to the lack of procedure guidelines for large-scale disasters in a multinational setting. Partly because of these difficulties, many victims remained unidentified, leading to the realization that major improvements to the coordination of international victim identification efforts were needed. As a response, DVI (Disaster Victim Identification) units composed of forensic and police experts were first established by INTERPOL in 1982, to prepare for and organize controlled measures in the event of such disasters (Prinz et al. 2007; Taylor 2009). In distinctive situations such as mass disasters, specialized markers are particularly useful. Such disasters may be either natural (eg. earthquakes, tsunamis, hurricanes) or man-made (eg. air crashes, terrorist acts, violent conflicts). Recent mass disaster cases where DNA has been used for identification include the 2015 Germanwings pilot suicide that resulted in the deaths of 144 people, and the 2014 shootdown of Malaysian Airlines MH17 over the Ukraine, with 298 victims. The main objective of any DVI investigation is the matching of independently collected AM (ante-mortem, “before death”) and PM (post-mortem, “after death”) data to establish the identity of the deceased. The quantity of unknown remains in mass disasters may be very large and ideally each separate fragment of biological tissue is DNA-tested in order to “reunite” relevant remains and to establish that all missing persons are accounted for. Most laboratories employ basic STR kits for standard typing in the interests of standardization and information exchange. However, mass disaster samples often constitute large amounts of intermingled and severely compromised, ie. very fragmented, contaminated, or otherwise adulterated remains and in these cases, the small size of SNPs, indels, and mtDNA is an advantage: tiny amplicons are more likely to be preserved in harsh circumstances. Small size allows increased resistance to degradation and also lessens the likelihood of complications such as allelic dropout and stutter in the amplification process, enabling more accurate genotyping with fewer errors (Budowle, Bieber & Eisenberg 2005; Prinz et al. 2007; Zietkiewicz et al. 2012). What markers are chosen for typing generally depends on the nature of the case and the reference samples available. In addition to retrieving a DNA profile from remains, a reference must also be obtained in order for a match to be validated. In mass disasters of any calibre, it may be difficult to determine who was involved, to whom profiles should be compared, or where to find reference material. PM data obtained from the deceased must comprise autopsy findings, dental information, fingerprints, DNA, and may also include personal effects. These can then be compared to AM information, such as dental or other medical records and

reference DNA obtained from a possible victim’s belongings. If such an item is not available, DNA can also be compared to family members of a missing person to establish a match by kinship (Gonzales et al. 2006). In practice, all of these identification means are used in parallel. The coordination and management of DVI procedures and the matching of AM and PM data involves complete documentation of the collection and storage of samples and background information, constant attention to international standards and quality control, and working exchange of information between different disciplines (Budowle, Bieber & Eisenberg 2005; Gonzales et al. 2006; Prinz et al. 2007; Zietkiewicz et al. 2012; INTERPOL 2014; ENFSI 2016). Mass disasters can happen anywhere and involve a number of nationalities, so effective international cooperation is essential. INTERPOL has been active in creating international training programs and standardized guidelines, and several DVI units now exist around the world and uphold preparedness in the event of catastrophes. A country met with a disaster can call in these international units to aid with identification and other procedures. DVI units have also helped to establish the identities of victims of conflicts such as the wars affecting the former Yugoslavian territory in the 1990s. The International Commission of Missing Persons (ICMP) was formed in 1996 with the objective of locating the 40,000 victims of these violent events. In addition to successfully identifying two-thirds of the victims, this project has generated far-reaching forensic benefits. A new collaboration between ICMP and INTERPOL has allowed the establishment of a resource to facilitate access of all governments to up-to-date forensic techniques and standards, for efficient, speedy and professional identification worldwide (INTERPOL 2014). 4.2. Exoneration through DNA analysis Another development in the forensic use of hereditary markers is large-scale exoneration of innocent prisoners through the Innocence Project, founded in 1992 (http://www.innocenceproject.org/). This project seeks to compare old scene evidence preserved from past crimes, often from the time before efficient testing was available, to DNA profiles of convicted persons. When no match is found between a known and unknown sample, the exclusion serves to rule out convicted persons as the perpetrator. The project has thus far exonerated over 340 persons in the US from crimes they did not commit, some from death row. Sometimes, comparison of old evidence profiles to databases serves also to find the true perpetrators that had until then evaded justice. Over 140 cases have been solved in this way (The Innocence Project 2017). 4.3. DNA markers in medico-legal investigations Analyses of genetic variation also have an application in the medical side of forensic science. In cases where detailed structural and toxicological analyses have proved inconclusive in determining both the cause of death (CoD) and manner of death (MoD), “molecular autopsies”, ie. post-mortem genotyping can aid in these examinations by

identifying genetic differences in, for instance, disease association and metabolic efficiency (Budowle & van Daal 2009; Sajantila et al. 2010). Two well-known disease-associated SNPs used to clarify CoD are long-QT and prothrombin indicators. Post-mortem genotyping of mutations affecting metabolic processing can help identify the manner of death e.g. by revealing heightened susceptibility to drug overdose and thus provide more evidence for medico-legal autopsies (Koski et al. 2007, Sajantila et al. 2010). A reliable determination of the manner of death between accident (accidental overdose) and suicide can be extremely valuable especially for the relatives of the deceased. Ultimately, such genotyping contributes to improved risk assessment of drug administration in living patients and thus helps to establish groundwork for more effective personalized medicine. While a range of genes has been investigated for metabolic effects, one of the most widely studied is ABCB1 (ATP-binding cassette B1), also known as MDR1 or the multidrug resistance gene. This gene encodes for the transporter P-glycoprotein, a major player in the drug processing chain. Mutations in this gene have been shown to reduce metabolic efficiency. Genotype is known to affect the efficiency of metabolism, and previous studies have found an association between polymorphisms of ABCB1 and disruptions in drug processing (Karlsson et al. 2013). In pathology investigations, the presence of a drug within the limits of toxicity can impede a decisive establishment of cause of death. Since the limits of toxicity may vary according to genotype, the identification of metabolic mutations such as those of ABCB1 in post-mortem samples can help pathologists to find links between genotype and xenobiotic levels, ultimately helping to determine the cause and manner of death more conclusively.
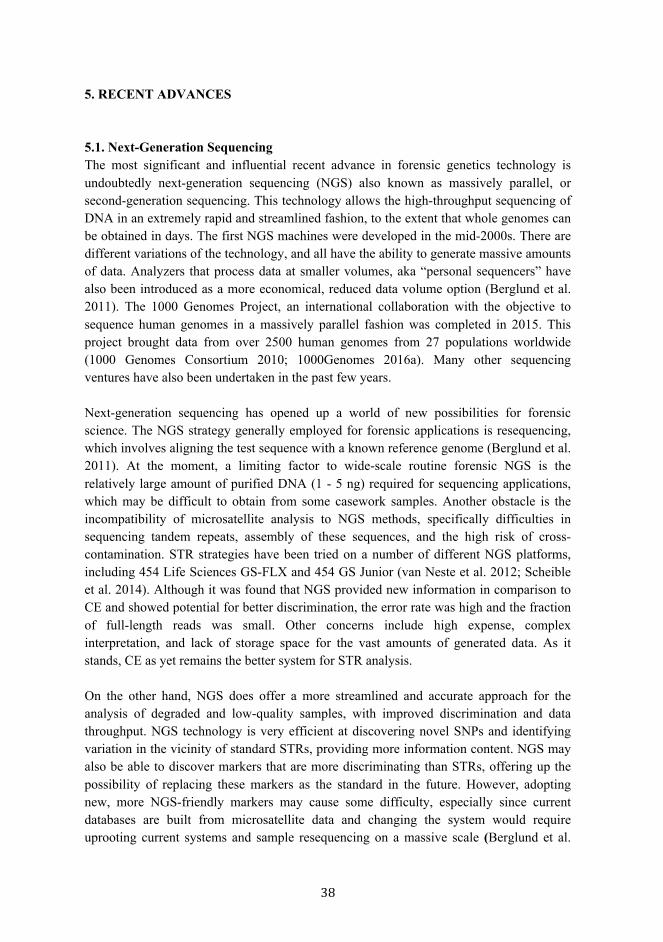
5. RECENT ADVANCES 5.1. Next-Generation Sequencing The most significant and influential recent advance in forensic genetics technology is undoubtedly next-generation sequencing (NGS) also known as massively parallel, or second-generation sequencing. This technology allows the high-throughput sequencing of DNA in an extremely rapid and streamlined fashion, to the extent that whole genomes can be obtained in days. The first NGS machines were developed in the mid-2000s. There are different variations of the technology, and all have the ability to generate massive amounts of data. Analyzers that process data at smaller volumes, aka “personal sequencers” have also been introduced as a more economical, reduced data volume option (Berglund et al. 2011). The 1000 Genomes Project, an international collaboration with the objective to sequence human genomes in a massively parallel fashion was completed in 2015. This project brought data from over 2500 human genomes from 27 populations worldwide (1000 Genomes Consortium 2010; 1000Genomes 2016a). Many other sequencing ventures have also been undertaken in the past few years. Next-generation sequencing has opened up a world of new possibilities for forensic science. The NGS strategy generally employed for forensic applications is resequencing, which involves aligning the test sequence with a known reference genome (Berglund et al. 2011). At the moment, a limiting factor to wide-scale routine forensic NGS is the relatively large amount of purified DNA (1 - 5 ng) required for sequencing applications, which may be difficult to obtain from some casework samples. Another obstacle is the incompatibility of microsatellite analysis to NGS methods, specifically difficulties in sequencing tandem repeats, assembly of these sequences, and the high risk of cross-contamination. STR strategies have been tried on a number of different NGS platforms, including 454 Life Sciences GS-FLX and 454 GS Junior (van Neste et al. 2012; Scheible et al. 2014). Although it was found that NGS provided new information in comparison to CE and showed potential for better discrimination, the error rate was high and the fraction of full-length reads was small. Other concerns include high expense, complex interpretation, and lack of storage space for the vast amounts of generated data. As it stands, CE as yet remains the better system for STR analysis. On the other hand, NGS does offer a more streamlined and accurate approach for the analysis of degraded and low-quality samples, with improved discrimination and data throughput. NGS technology is very efficient at discovering novel SNPs and identifying variation in the vicinity of standard STRs, providing more information content. NGS may also be able to discover markers that are more discriminating than STRs, offering up the possibility of replacing these markers as the standard in the future. However, adopting new, more NGS-friendly markers may cause some difficulty, especially since current databases are built from microsatellite data and changing the system would require uprooting current systems and sample resequencing on a massive scale (Berglund et al.
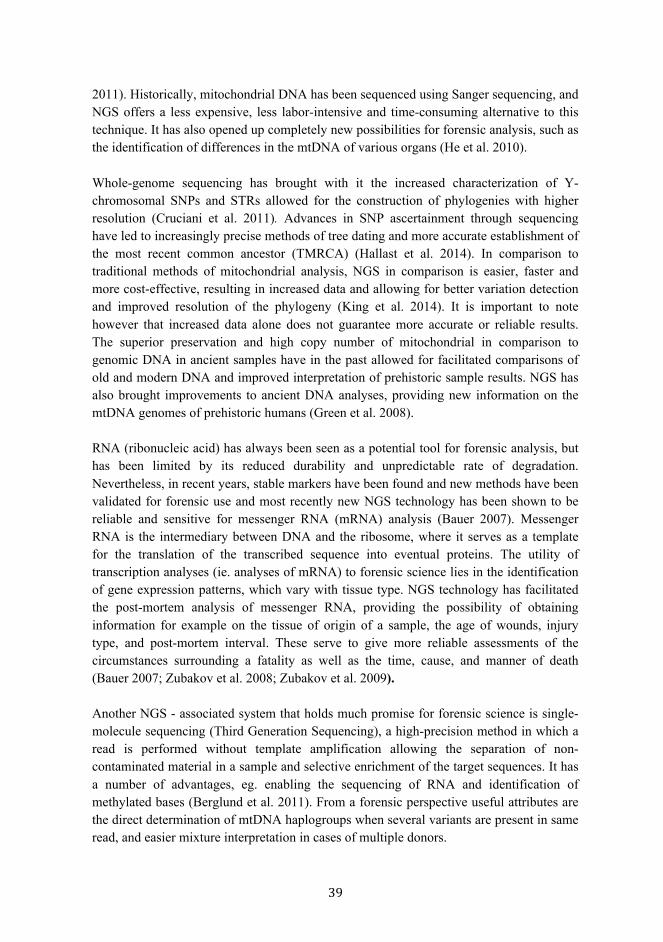
2011). Historically, mitochondrial DNA has been sequenced using Sanger sequencing, and NGS offers a less expensive, less labor-intensive and time-consuming alternative to this technique. It has also opened up completely new possibilities for forensic analysis, such as the identification of differences in the mtDNA of various organs (He et al. 2010). Whole-genome sequencing has brought with it the increased characterization of Y-chromosomal SNPs and STRs allowed for the construction of phylogenies with higher resolution (Cruciani et al. 2011). Advances in SNP ascertainment through sequencing have led to increasingly precise methods of tree dating and more accurate establishment of the most recent common ancestor (TMRCA) (Hallast et al. 2014). In comparison to traditional methods of mitochondrial analysis, NGS in comparison is easier, faster and more cost-effective, resulting in increased data and allowing for better variation detection and improved resolution of the phylogeny (King et al. 2014). It is important to note however that increased data alone does not guarantee more accurate or reliable results. The superior preservation and high copy number of mitochondrial in comparison to genomic DNA in ancient samples have in the past allowed for facilitated comparisons of old and modern DNA and improved interpretation of prehistoric sample results. NGS has also brought improvements to ancient DNA analyses, providing new information on the mtDNA genomes of prehistoric humans (Green et al. 2008). RNA (ribonucleic acid) has always been seen as a potential tool for forensic analysis, but has been limited by its reduced durability and unpredictable rate of degradation. Nevertheless, in recent years, stable markers have been found and new methods have been validated for forensic use and most recently new NGS technology has been shown to be reliable and sensitive for messenger RNA (mRNA) analysis (Bauer 2007). Messenger RNA is the intermediary between DNA and the ribosome, where it serves as a template for the translation of the transcribed sequence into eventual proteins. The utility of transcription analyses (ie. analyses of mRNA) to forensic science lies in the identification of gene expression patterns, which vary with tissue type. NGS technology has facilitated the post-mortem analysis of messenger RNA, providing the possibility of obtaining information for example on the tissue of origin of a sample, the age of wounds, injury type, and post-mortem interval. These serve to give more reliable assessments of the circumstances surrounding a fatality as well as the time, cause, and manner of death (Bauer 2007; Zubakov et al. 2008; Zubakov et al. 2009). Another NGS - associated system that holds much promise for forensic science is single-molecule sequencing (Third Generation Sequencing), a high-precision method in which a read is performed without template amplification allowing the separation of non-contaminated material in a sample and selective enrichment of the target sequences. It has a number of advantages, eg. enabling the sequencing of RNA and identification of methylated bases (Berglund et al. 2011). From a forensic perspective useful attributes are the direct determination of mtDNA haplogroups when several variants are present in same read, and easier mixture interpretation in cases of multiple donors.

In the future, NGS may bring changes to identification casework, offering up the possibility of replacing the current STR standard with more discriminating markers and multilocus kits. DVI and missing persons cases, often faced with difficult-to-analyse material, partial profiles, or complicated kinship analysis, may benefit greatly from NGS (Scheible et al. 2014). Mixture resolution abilities may also be improved with NGS technology (van Neste et al. 2012). NGS can be used to more readily identify mutations associated with fatal conditions. Improvements to personalized medicine would be achieved as the analysis of individual genomes would facilitate identification of association between sequence and phenotype, and tailor drug regimes to correlate with genotypes and reduce side effects (Hert et al. 2008). NGS-based microRNA expression analysis is currently being explored for its potential in body fluid, cell type, and tissue type identification (Sijen et al. 2015; Sauer et al. 2017; Sirker et al. 2017). Another potential application of whole-genome sequencing is in microbial forensics, the identification of micro-organisms and microbes associated with biological attacks (Budowle, Murch & Chakraborty 2005; Budowle & van Daal 2009; Berglund et al. 2011). NGS has also enabled the analysis of both minihaplotypes and microhaplotypes, defined by two or more SNPs found within a short molecular distance: less than 10kb for minihaplotypes and 200bp for microhaplotypes (Pakstis et al. 2012; Kidd et al. 2013). Microhaplotypes combine the practically advantageous traits of STRs and SNPs. They have been shown to have a higher PIC than STRs, and with the added potential for identification, combined with ancestry informativeness, kinship testing and mixture resolution, are a possible future replacement (Kidd et al. 2013). It is likely that in the coming years these technologies will be further developed for increased reliability.
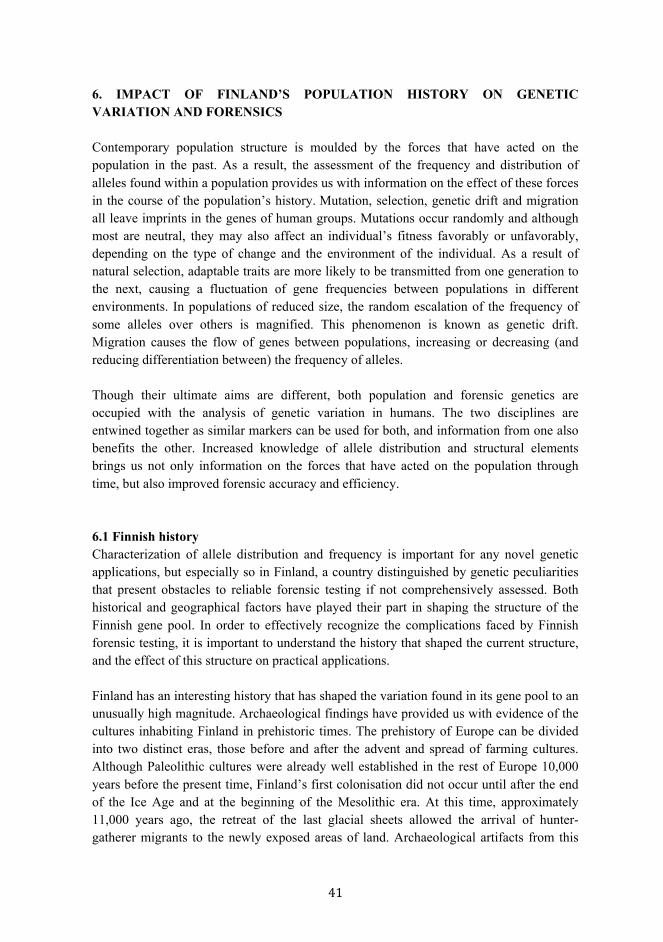
6. IMPACT OF FINLAND’S POPULATION HISTORY ON GENETIC VARIATION AND FORENSICS Contemporary population structure is moulded by the forces that have acted on the population in the past. As a result, the assessment of the frequency and distribution of alleles found within a population provides us with information on the effect of these forces in the course of the population’s history. Mutation, selection, genetic drift and migration all leave imprints in the genes of human groups. Mutations occur randomly and although most are neutral, they may also affect an individual’s fitness favorably or unfavorably, depending on the type of change and the environment of the individual. As a result of natural selection, adaptable traits are more likely to be transmitted from one generation to the next, causing a fluctuation of gene frequencies between populations in different environments. In populations of reduced size, the random escalation of the frequency of some alleles over others is magnified. This phenomenon is known as genetic drift. Migration causes the flow of genes between populations, increasing or decreasing (and reducing differentiation between) the frequency of alleles. Though their ultimate aims are different, both population and forensic genetics are occupied with the analysis of genetic variation in humans. The two disciplines are entwined together as similar markers can be used for both, and information from one also benefits the other. Increased knowledge of allele distribution and structural elements brings us not only information on the forces that have acted on the population through time, but also improved forensic accuracy and efficiency. 6.1 Finnish history Characterization of allele distribution and frequency is important for any novel genetic applications, but especially so in Finland, a country distinguished by genetic peculiarities that present obstacles to reliable forensic testing if not comprehensively assessed. Both historical and geographical factors have played their part in shaping the structure of the Finnish gene pool. In order to effectively recognize the complications faced by Finnish forensic testing, it is important to understand the history that shaped the current structure, and the effect of this structure on practical applications. Finland has an interesting history that has shaped the variation found in its gene pool to an unusually high magnitude. Archaeological findings have provided us with evidence of the cultures inhabiting Finland in prehistoric times. The prehistory of Europe can be divided into two distinct eras, those before and after the advent and spread of farming cultures. Although Paleolithic cultures were already well established in the rest of Europe 10,000 years before the present time, Finland’s first colonisation did not occur until after the end of the Ice Age and at the beginning of the Mesolithic era. At this time, approximately 11,000 years ago, the retreat of the last glacial sheets allowed the arrival of hunter-gatherer migrants to the newly exposed areas of land. Archaeological artifacts from this
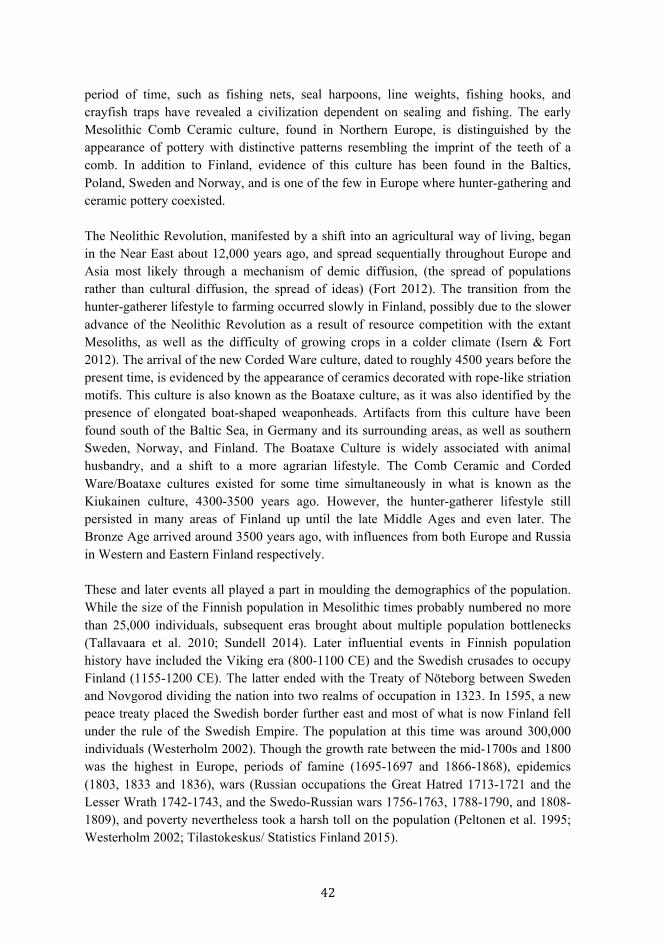
period of time, such as fishing nets, seal harpoons, line weights, fishing hooks, and crayfish traps have revealed a civilization dependent on sealing and fishing. The early Mesolithic Comb Ceramic culture, found in Northern Europe, is distinguished by the appearance of pottery with distinctive patterns resembling the imprint of the teeth of a comb. In addition to Finland, evidence of this culture has been found in the Baltics, Poland, Sweden and Norway, and is one of the few in Europe where hunter-gathering and ceramic pottery coexisted. The Neolithic Revolution, manifested by a shift into an agricultural way of living, began in the Near East about 12,000 years ago, and spread sequentially throughout Europe and Asia most likely through a mechanism of demic diffusion, (the spread of populations rather than cultural diffusion, the spread of ideas) (Fort 2012). The transition from the hunter-gatherer lifestyle to farming occurred slowly in Finland, possibly due to the slower advance of the Neolithic Revolution as a result of resource competition with the extant Mesoliths, as well as the difficulty of growing crops in a colder climate (Isern & Fort 2012). The arrival of the new Corded Ware culture, dated to roughly 4500 years before the present time, is evidenced by the appearance of ceramics decorated with rope-like striation motifs. This culture is also known as the Boataxe culture, as it was also identified by the presence of elongated boat-shaped weaponheads. Artifacts from this culture have been found south of the Baltic Sea, in Germany and its surrounding areas, as well as southern Sweden, Norway, and Finland. The Boataxe Culture is widely associated with animal husbandry, and a shift to a more agrarian lifestyle. The Comb Ceramic and Corded Ware/Boataxe cultures existed for some time simultaneously in what is known as the Kiukainen culture, 4300-3500 years ago. However, the hunter-gatherer lifestyle still persisted in many areas of Finland up until the late Middle Ages and even later. The Bronze Age arrived around 3500 years ago, with influences from both Europe and Russia in Western and Eastern Finland respectively. These and later events all played a part in moulding the demographics of the population. While the size of the Finnish population in Mesolithic times probably numbered no more than 25,000 individuals, subsequent eras brought about multiple population bottlenecks (Tallavaara et al. 2010; Sundell 2014). Later influential events in Finnish population history have included the Viking era (800-1100 CE) and the Swedish crusades to occupy Finland (1155-1200 CE). The latter ended with the Treaty of Nöteborg between Sweden and Novgorod dividing the nation into two realms of occupation in 1323. In 1595, a new peace treaty placed the Swedish border further east and most of what is now Finland fell under the rule of the Swedish Empire. The population at this time was around 300,000 individuals (Westerholm 2002). Though the growth rate between the mid-1700s and 1800 was the highest in Europe, periods of famine (1695-1697 and 1866-1868), epidemics (1803, 1833 and 1836), wars (Russian occupations the Great Hatred 1713-1721 and the Lesser Wrath 1742-1743, and the Swedo-Russian wars 1756-1763, 1788-1790, and 1808-1809), and poverty nevertheless took a harsh toll on the population (Peltonen et al. 1995; Westerholm 2002; Tilastokeskus/ Statistics Finland 2015).
Following the Finnish War (1808-1809), Finland became a Grand Duchy of Russia, gaining both autonomy and prosperity, with the population eventually growing to one million individuals in 1812 (Westerholm 2002). Finland achieved independence in 1917 in the wake of the Russian Revolution. The current population size is about 5.5 million individuals (Tilastokeskus/ Statistics Finland 2017). 6.2. Modern-day variation of the Finnish gene pool Until the mid-twentieth century, knowledge of Finnish population history was based mainly on evidence from archaeology and linguistics. This changed with the advent of genetic testing, which helped to bring fascinating new insights into the singular eccentricities of the population. In the 1950s, the discovery that a fatal kidney disease affecting children was overrepresented in the population was the springboard for the first large-scale autosomal marker studies in Finland. The origins of congenital nephrosis (CNF) were clarified through analyses of sufferers and their families, and the condition was found to derive from a recessive mutation. It was soon discovered that Finns revealed a distinctive profile not only in terms of CNF, but also for several other recessive conditions (Peltonen 1997; Peltonen et al. 1999; Peltonen et al. 2000; Peltonen & McKusick 2001; Kere 2001; Norio & Löytönen 2002; Norio 2003a; Norio 2003b; Kere 2010). Over 40 of these have been recognized to date, with examples encompassing a vast assortment of pathologies including aspartylglucosaminuria, familial chloride diarrhoea, and progressive myoclonus epilepsy (Peltonen et al. 1995; Peltonen 1997; Peltonen et al. 1999; Peltonen & McKusick 2001; Norio & Löytönen 2002). Together these conditions, encountered in Finland but either rare or completely absent elsewhere in Europe, came to be known as the Finnish Disease Heritage (FDH). Conversely, some diseases common in other areas of Europe (eg. albinism, cystic fibrosis of the liver, and phenylketonuria) are uncommon or nonexistent in Finland. The singular nature of the FDH prompted further incentive to research the national gene profile. The allele enrichment observed in FDH suggests historical population bottlenecks, and/or the founder effect subsequent to such bottlenecks (Peltonen et al. 1995; Sajantila et al. 1996; Norio 2003b). The known history of Finland lends further support, as multiple hardships such as famines and wars would also create reductions in population size and the subsequent increase in rare alleles. Geographical isolation of the population and the effects of genetic drift have also contributed (Peltonen et al. 1999). Thus the conspicuous enrichment of rare recessive alleles, the absence of disease genes extant elsewhere, and low diversity, all contrasting with the rest of Europe were the first indicators that the Finnish population was a genetic outlier. Evidence from autosomal SNPs and the Y-chromosome has revealed that the profile of the Finnish gene pool contrasts strikingly with that of the rest of Europe, and even its closest neighbors (Sajantila et al. 1992; Cavalli-Sforza et al. 1993; Roewer et al. 2005; Lao et al. 2008; Hannelius et al. 2008; Salmela et al. 2008). One of the singular features
subsequently recognized was a strong geographic subdivision within the country. It had long been recognized that in both a cultural as well as a biological sense, a curious division existed between Northeastern and Southwestern Finland. The border persisted in various manifestations of everyday life, such as agricultural tools and musical traditions, and consistently ran through approximately the same lines of division. Contemporary Finnish Y-chromosomes show clear differentiation between Northeastern and Southwestern territories (Hedman et al. 2004; Palo et al. 2007; Lappalainen et al. 2007; Palo et al. 2008). While this phenomenon is not readily observable in mitochondrial DNA, which shows uniform distribution, recent evidence from genome-wide SNPs has succeeded in uncovering regional duality also in autosomes (Hedman et al. 2007; Salmela et al. 2008). This study revealed that Finns of the Eastern and Western regions display greater divergence between them than Germans and Brits (Salmela et al. 2008). The disproportionate occurrence of the two main Y-chromosomal haplogroups N and I in separate regions is unlikely to be a product of drift alone, and is more probably a result of dual origins for these lineages (Kittles et al. 1998; Palo et al. 2007; Palo et al. 2009). In contrast to mitochondria, studies of the Y-chromosome showed not only a loss of diversity compared to elsewhere in Europe, but also a high level of geographical substructuring, with the greatest reduction in diversity observed in eastern Finland (Sajantila et al. 1996; Kittles et al. 1998; Kittles et al. 1999; Lahermo et al. 1999; Jorde et al. 2000; Hedman et al. 2004; Roewer et al. 2005; Hedman et al. 2007). 6.2.1. Y-markers in Finland Analysis of Y-chromosomal haplogroups has provided much information on the origins and migrations of the Finnish people. The oldest and most common lineages found in Finland belong to the N-haplogroup. A subhaplogroup of N, N1c1 and its branches, show distribution throughout the country, with highest frequencies in eastern Finland (Lappalainen et al. 2006). The occurrence of this haplogroup throughout Eurasia suggests origins in Central Asia about 12,000 years ago with expansion to Northern Europe 2000 years later. The N-haplogroup is associated with the Mesolithic Kunda and Comb Ceramic cultures and also with the non-Slavic ethnic groups of Russia, especially those with a Finno-Ugric or Uralic affinity, such as the Saami, Karelians and Mari (Lahermo et al. 1999; Laitinen et al. 2002; Lappalainen et al. 2006; Rootsi et al. 2007; Lappalainen et al. 2008; Cui et al. 2013;). Today, N-haplogroups show patterns of high occurrence in Northern Eurasia, with low frequencies in Central Europe and Scandinavia (Zerjal et al. 1997; Lahermo et al. 1999; Rosser et al. 2000; Raitio et al. 2001; Laitinen et al. 2002). Worldwide, the N-haplogroup has its highest occurrence in Finland, specifically Eastern Finland and Finnish Karelia (70.9%). Though distribution patterns of this haplogroup in Finland strongly indicate an eastern influence, N1c1 is virtually absent in most Slavic populations. Indeed, autosomal marker analysis and other evidence have suggested that Finno-Ugric peoples migrated to Finland long before Slavic ancestors are known to have inhabited Russia in the 6th and 7th centuries (Lahermo 1999; Salmela et al. 2008). Genetic and archeological records suggest the earliest post-Pleistocene colonizers of Finland
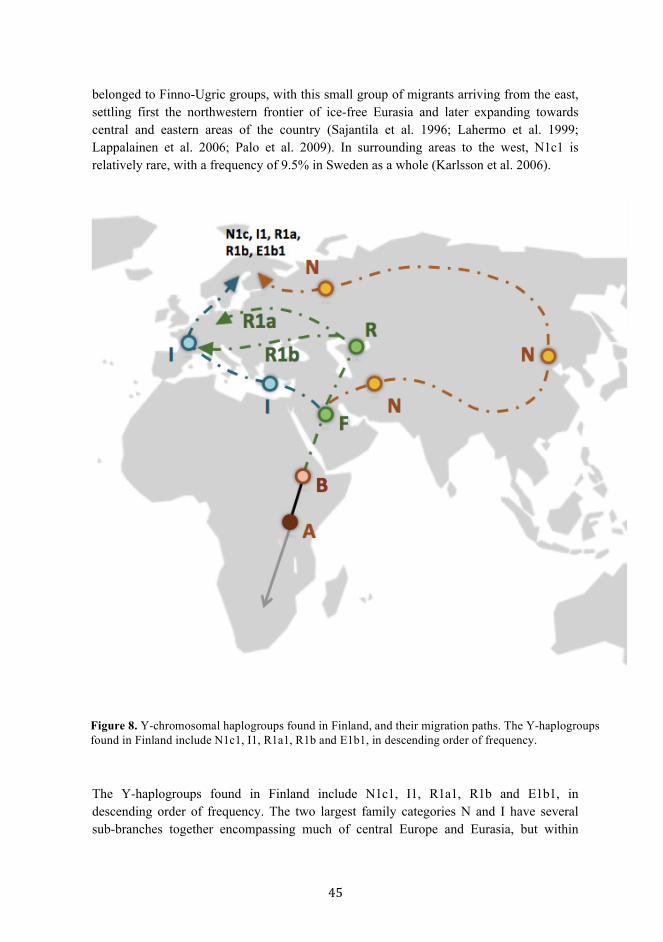
belonged to Finno-Ugric groups, with this small group of migrants arriving from the east, settling first the northwestern frontier of ice-free Eurasia and later expanding towards central and eastern areas of the country (Sajantila et al. 1996; Lahermo et al. 1999; Lappalainen et al. 2006; Palo et al. 2009). In surrounding areas to the west, N1c1 is relatively rare, with a frequency of 9.5% in Sweden as a whole (Karlsson et al. 2006).
The Y-haplogroups found in Finland include N1c1, I1, R1a1, R1b and E1b1, in descending order of frequency. The two largest family categories N and I have several sub-branches together encompassing much of central Europe and Eurasia, but within
Figure 8. Y-chromosomal haplogroups found in Finland, and their migration paths. The Y-haplogroups found in Finland include N1c1, I1, R1a1, R1b and E1b1, in descending order of frequency.

Finland they have been further narrowed down into subclades N1c1 and I1a. Through the two millennia following the emergence of the N-parent haplogroup M-231, its geographic movement occurred in a counterclockwise pattern through Asia, from southern China towards Siberia. The frequency of subclade N1c1-Tat (M-46) occurs in a gradient from Siberia to Europe, with greatest occurrence in Finland and the Central Siberian plateau with varying frequencies between. It is thought that this subclade experienced a period of expansion in Siberia and at length a migration towards northern Europe some 10,000 years ago. The I-haplogroup M-170 is thought to have arisen some 22,000 years ago in the Balkan area of Europe, after the last glacial maximum and well before the spread of the Neolithic culture into Europe from the Fertile Crescent 10,000 years ago. From the Balkans, carriers of Hg I migrated further into Europe, and arrived in the Nordic area via western Europe (Rootsi et al. 2004). The most common haplogroups in modern Europe (R1a, R1b and I) are in the minority in Finland (Lappalainen et al. 2006). The subhaplogroup I1-M253 and its further branches are most prominent in the Scandinavian countries and western Finland, with greatest frequency of I1-M253 in central Sweden (52%) (Karlsson et al. 2006; Lappalainen et al. 2009). In Finland I1 shows highest concentration in the western provinces (40%) and lowest in Eastern Finland (19%) (Lappalainen et al. 2006). The subhaplogroups observed in Finland are younger than those occurring in mainland Sweden, suggesting that migration occurred from the direction of Scandinavia to the coasts of western Finland. Thus current understanding of Nordic population history suggests that the I-haplogroup arrived to Finland from Scandinavia sometime after the colonization and dispersal of the N-haplogroup (Rootsi et al. 2004). This later immigration seems to have been limited mostly to the southwestern parts of the country. Although no DNA associated with the N-haplogroup has been recovered from ancient human remains, archeological evidence combined with genetic chronologies have indicated that this haplogroup is likely affiliated with Mesolithic cultures (Shi et al. 2013; Cui et al. 2013). Although data on prehistoric I-haplogroup samples is also very limited, samples from individuals belonging to haplogroup I2 have been recovered from Neolithic burial sites in Europe (Haak et al. 2010; Lacan et al. 2011a; Lacan et al. 2011b; Lee et al. 2012). These ancient DNA findings provide further support to the notion that the Neolithic culture was spread at least in part by groups carrying the I-haplogroup, but only after association with the original Neolithic migration from the Near East into the Balkans, the birthplace of this haplogroup. The frequency of HgI in the Near East is low, and it has been suggested that members of the I clades (eg. I2a1b-M423) adopted agriculture from migrants from the Anatolian area (Battaglia et al. 2009). NGS analysis of ancient samples recovered from Europe has indicated recent (3.5 - 7.5 kya) coalescent times for I1-M253, R1a-M198 and R1b-M269 (Batini et al. 2015). The arrival of the Corded Ware culture signaled the dawn of the agricultural lifestyle in Finland, and archeological finds from this era show the presence of domesticated animal bones in Åland (Storå 2000). The coalescence age of I1-M253 also supports a Neolithic arrival for this haplogroup into

Finland (Lappalainen et al. 2008). The two cultures eventually gave rise to the Kiukainen culture, a hybrid between earlier Comb Ceramic and the immigrant Corded Ware cultures. It is from this period that the first confirmed evidence of animal husbandry and cereal cultivation in Finland has been discovered (Bläuer & Kantanen 2013).
6.2.2. Mitochondrial markers in Finland In terms of diversity and genetic background, Finnish mitochondrial DNA is similar to other European populations, and showed nonstratified patterns of distribution (Sajantila et
Figure 9. Mitochondrial haplogroups found in Finland, and their migration paths. Haplogroups found in Finland include H (40%) and U (27.5%), with the remainder comprised of haplogroups N, I, W, X, J, and T (Hedman et al. 2007).
al. 1996; Hedman et al. 2007). The majority of Finnish mtDNA lineages fall into haplogroups H (40%) and U (27.5%), with the remainder comprised of haplogroups N, I, W, X, J, and T (Hedman et al. 2007). Haplogroup U is one of the oldest mtDNA haplogroups in Europe, with expansion into the continent likely having occurred between ~55 kya and ~30 kya (Soares et al. 2009; Fu et al. 2013). The subhaplogroup U5 is thought to be the oldest of the U subhaplogroups at approximately 30 thousand years old: a Mesolithic haplogroup predating the LGM (Soares et al. 2009; Behar et al. 2012; Fu et al. 2013; Olalde et al. 2014; Batini et al. 2015). Haplogroup H is thought to have originated over 14 kya and arrived in Europe after the LGM. Some subhaplogroups of H, eg. H1 and H3, are associated with the Neolithic lifestyle. Male-biased gene flow is suggested by the very different results seen for maternal and paternal markers (Hedman et al. 2007; Palo et al. 2009). Curiously, while the indigenous Saami population living in northern Finland shares a linguistic commonality with Finns, studies of autosomal and mitochondrial DNA have suggested that the Saami and Finns have different backgrounds and are two distinct, unrelated populations (Sajantila et al. 1995; Sajantila et al. 1996; Lahermo et al. 1999). Saami sequences present with a motif, U5b1b1, at a high frequency (47.6%) (Tambets et al. 2004). This signature arose about 10,000 years ago, has western affinities (U5b is shared with the Berbers) and is present only at low frequencies (6.7%) in Finns (Sajantila et al. 1995; Lahermo et al. 1996; Kittles et al. 1999; Tambets et al. 2004; Achilli et al. 2005; Hedman et al. 2007; Lappalainen et al. 2008;). Finns and Saami also present with different frequencies of Y-polymorphisms; only 25% of Saami have the N1c haplogroup in contrast to 52% of Finns. Although the presence of N1c1 in such a high frequency suggests partial east Asian ancestry for the Saami, differences in haplogroup frequencies implies the populations may have settled Finland in separate waves (Zerjal et al. 1997; Lahermo 1999; Raitio et al. 2001; Lappalainen et al. 2008). However, a European contribution is suggested by the prominence of the I1, R1a and R1b haplogroups (Tambets et al. 2004; Rootsi et al. 2004). The present composition is likely due to admixture of two separate founding lineages (Lahermo et al. 1999; Raitio et al. 2001; Tambets et al. 2004).

7. IMPACT OF STRUCTURE ON FORENSIC ANALYSIS The current unusual structure of the Finnish gene pool, moulded by its history, affects the way forensics is applied today. Failure to recognize stratification may lead to erroneous estimates of allele frequencies and resulting miscalculation of the power of evidence. The high levels of Y-chromosomal stratification in Finland thus necessitates either the analysis of a large amount of population data, the establishment of region-specific databases or the development of novel markers with the ability to compensate for the differentiation. Reduced diversity on the other hand presents complications in obtaining sufficient discrimination power between individuals, creating a requirement for markers with higher resolution power. Genetic differentiation from Europe requires separate validation procedures and identification of any unique population-specific factors that may affect forensics. Here, we have aimed to explore the Finnish gene pool using a variety of forensic markers, with the ultimate objective of overcoming the complications created by the unusual population structure, thereby improving forensic testing in Finland.

AIMS OF THE STUDY In this thesis we have aimed to characterize novel and extant forensic genetic markers in the Finnish population in order to ultimately improve the efficiency of Finnish forensic casework and broaden our understanding of population history. The detailed aims of this thesis were:
I. To elucidate the origins of the genetic delineation between Northeastern and Southwestern regions of Finland by characterizing the distribution of Y-chromosomal and mitochondrial haplogroups within the country.
II. To evaluate whether obstacles to efficient forensic profiling can be overcome with the development and evaluation of a new, high-resolution panel of Y-chromosome microsatellite markers in the Finnish population.
III. To evaluate the suitability of a new set of commercial insertion-deletion markers for Finnish forensic casework.
IV. To investigate the relationship between metabolic mutations and post-mortem drug concentration, in order to facilitate cause of death determinations in forensic medicine.

MATERIALS AND METHODS (Primers – Appendix I) (Amplification Protocols – Appendix II) a. SAMPLES The Finnish in-house sample set comprised of blood collected with informed consents from a group of 386 random, unrelated individuals. Different subsets of this sample set were used in: Study I to genotype Y-STR haplotypes and Y-SNP haplogroups. The Y-chromosomal data set combined Y-STR haplotype and haplogroup data (N = 584) from two different sources: 1) in-house data set (N = 330) and 2) data mining from the Family Tree website (N = 254). For the data mining set, 16 Y-STR loci and the haplogroup designation defined by SNP-information were included. In addition to the Y-data, Study I also used mtDNA HVR1+2 data obtained from Palo et al. 2009 (N = 832) and complete mtDNA sequences (N = 367) obtained from GenBank searches (N = 274) and the 1000Genomes-project (N = 93). Study II to characterize diversity of the novel 7plex panel in Finns (N = 255 males). This study also used Minimal Haplotype data collected from a separate set of Finnish male samples (N = 200) from the Finnish Red Cross (Hedman et al. 2004). Study III to determine genetic diversity as well as discrimination power for the DIPPlex indel set in the Finnish population (N = 151). For comparison, frequencies from 15 AmpFlSTR Identifiler STRs were used from the in-house sample set (N = 200). Study IV to determine the effect of single nucleotide polymorphisms on metabolic functions. In this study, the control group (N = 142) consisted of in-house samples. The case group (N = 112) consisted of post-mortem pathology samples collected at the Department of Forensic Medicine, University of Helsinki. Permission to perform genotyping studies on post-mortem samples was accorded by Finnish law and by the National Supervisory Authority for Welfare and Health. The effect of three ABCB1 SNPs on digoxin concentration was examined in two groups. The control group consisted of healthy individuals, genotyped to establish allele frequency at the general population level. The case subjects were individuals deceased between 2000 and 2009 with toxicology findings of digoxin in the blood. These subjects were divided into three groups (<2.6, >2.6, >7 nmol/L) by PM digoxin concentration. Under 2.6 nmol/L is the therapeutic dose, while any concentration above 7 nmol/L is considered a toxic dose. The samples consisted of blood stored on FTA (Flinders Technology Associates; Whatman, Florham Park, NJ, USA) paper, specifically blood collected from the femoral vein post-mortem, as this is least susceptible to PM changes such as redistribution.
b. GENOTYPING Samples were extracted using standard methods. The in-house sample set DNA (I, III, IV) was isolated either directly from gel using the EZNA silica binding column kit from VWR (Omega Bio-Tek, Norcross, USA) or by standard phenol-chloroform extraction. Chelex resin extraction (Bio-Rad, Hercules, USA) was employed for femoral blood stored on FTA paper (IV). For each isolation method, sample material was further concentrated with the QIAquick PCR purification kit (QIAGEN). Extracted DNA products were amplified using either a standard thermal cycler (I, III, IV) or a Real-Time PCR device (II, IV). Detailed PCR protocols are listed in Appendix II, with polymerase enzymes AmpliTaq Gold (I, II, IV) and JumpStart TAQ (III). Sequence-specific primers targeting short tandem repeat sequences (I), single nucleotide polymorphisms (I, IV) and indels (III) were self-designed, or ordered as commercial kits. STR typing Study I: The Y-STR data for the in-house samples (N= 330) were obtained by genotyping 17 loci (DYS456, DYS389I, DYS390, DYS389II, DYS458, DYS19, DYS385a/b, DYS393, DYS391, DYS439, DYS635, DYS392, Y_GATA_H4, DYS437, DYS438, DYS448) from 1.0 ng of DNA using the AmpFlSTR Yfiler kit (Thermo-Fisher Scientific).
The amplification products were resolved on ABI Prism ®3130xl capillary electrophoresis device (Thermo-Fisher Scientific) and analyzed using GeneMapper ID v. 3.2 software (Thermo-Fisher Scientific). Study II: To increase the discrimination power of Y-chromosomal markers in Finland, the diversity of 26 published Y-chromosomal microsatellites was tested in a pilot sample set of males (N = 53) with identical Minimal Haplotype profiles, collected with informed consents, from Hedman et al (Hedman et al. 2004). These samples were genotyped as described above (Study I). The loci were DYS435, DYS436, DYS446, DYS447, DYS449, DYS460, DYS464abcd, DYS481, DYS505, DYS522, DYS570, DYS576, DYS612, DYS614, DYS616, DYS622, DYS626, DYS627, DYS638, DYS641, DYS643, DYS644, DYF383S1 (Kayser et al. 2004; White et al. 1999; Ayub et al. 2000; Redd et al. 2002; Berger et al. 2003). In order to find the most informative loci, each was sequentially added to Y-filer data, creating 18-locus haplotypes. The haplotype diversities were calculated for each separate set, and compared. The loci with the highest diversities were assessed in the 53 males with identical haplotypes, until these were fully resolved after the addition of seven highly polymorphic loci. This seven-locus set (DYS449, DYS460, DYS505, DYS522, DYS576, DYS612, DYS627) was thus identified as the most powerful subset for discrimination. The new panel (7plex) was then optimized for multiplex amplification, and characterized in a separate sample set of Finnish males (N = 255). This larger sample set was partitioned into three groups by region (eastern, N = 90; south-western, N = 67; western, N = 98). Data obtained from the 7-locus set was combined with previously genotyped data, to form Y-STR sets corresponding to 9-locus (MH), 12-locus (PowerPlexY), 17- locus (Yfiler) and 24-locus (Yfiler + 7plex) data sets to allow
comparison of levels of genetic diversity, geographic subdivision and discrimination power. Mutation rates for 7plex were obtained from observation of 371 father-son pairs. SNP typing Study I: Y-chromosome haplogroup data for the in-house data set were obtained through both RT-PCR and sequencing. First, the Haplogroup Predictor program (http://www.hprg.com/hapest5/ Whit Athey) was used to classify individuals into rough haplogroups. SNP M46 was typed with Real-Time PCR, using a customized Genotyping Assay (rs34442126) and sequence-specific primers from Thermo-Fisher Scientific. This assay was used to set up half-volume reactions with Taqman SNP Genotyping Master Mix, including 20x SNP Assay with 5.625 uL of template DNA with 13 µl total volume. Thermo-Fisher Scientific Fast 7500 Real-Time SDS PCR software was used for allele calling and sequence analysis. The remaining Y-chromosomal SNPs in this study were called by sequencing as described in the relevant section below. Study IV: Real-Time PCR amplification was employed for SNP genotyping, with primer-probe sets designed to be adjacent to the targeted single-nucleotide polymorphism. The custom-ordered Genotyping Assays (Thermo-Fisher Scientific) contained Taqman Universal PCR Master Mix No AmpErase UNG, three sequence-specific forward and reverse primers used to detect ABCB1 SNPs 3435, 1236, and 2677, and two Taqman MGB (minor groove binder) probes, labeled with fluorescent dyes for detection of each allele. In order to quantify the extracted and purified DNA for SNP analysis, a standard curve was generated against template standards. Genotyping assays were diluted to 20x working stock with 1×TE buffer for genotyping on the 7500 Real-Time PCR System (Thermo-Fisher Scientific). Standard Taqman RT-PCR SNP Genotyping protocol instructions were followed, and genotyping occurred with allele calls at the endpoint read using RT-PCR SDS software (Thermo-Fisher Scientific). Subjects with polypharmacy were assessed with the SFINX drug-interaction database to identify potential interaction with digoxin. Indel typing Study III: For analysis of insertion-deletion polymorphisms, the protocol followed instructions outlined in the QIAGEN Investigator DIPplex Kit for multiplex amplification of 30 indels (DIPs) and amelogenin. To denature the DNA strands, the amplified sample was added to 600 Hi-Di Formamide and a GeneScan LIZ® 35-500 base pair fluorescent DNA size standard (Thermo-Fisher Scientific). The Thermo-Fisher Scientific Prism Genetic Analyzer 3130xl was used for allele calling, and a matrix of fluorescent-labeled primers (6-FAM, BTG, BTY and BTR) was generated. Genotype readouts were obtained using the Thermo-Fisher Scientific 3130xl capillary electrophoresis device and Genemapper ID 3.2 software, respectively. DIPSorter freeware (QIAGEN) was used for data analysis.

Sequencing Study I: Genotyping for M178, L550, L22, L258, L300 was performed with sequencing (amplification and post-amplification processing) using Thermo-Fisher Scientific BigDye® Terminator v1.1 Cycle Sequencing Kit. Reactions were analysed on Thermo-Fisher Scientific Prism Genetic Analyzer 3130xl and sequence readouts analysed with GeneCodes SEQUENCHER v. 4.10 software (GeneCodes Inc., Ann Arbor, MI, USA). Study II: A subset of samples were sequenced in order to identify repeat numbers for each allele, which were used to correctly divide alleles into “bins” for analysis of allele frequency. Sequencing was carried out with Thermo-Fisher Scientific BigDye® Terminator v1.1 Cycle Sequencing Kit and buffer, with one reverse or forward primer. Reactions were purified using Bigdye® XTerminator TM Purification Kit (Thermo-Fisher Scientific). Thermo-Fisher Scientific Big Dye Terminator v.1.1 was used for reaction termination. c. DATA ANALYSIS For all studies: For each dataset, basic diversity indices (allele frequency, genetic diversity, geographical differentiation, etc.) were obtained from these data using methods implemented in ARLEQUIN statistical software v. 3.1. - 3.11 (Excoffier et al. 2005)(I,II, III, IV). Statistical significance of the estimates was obtained by randomization (10,000 cycles). Promega POWERSTATS V. 12 (III) was used to determine forensic diversity parameters ie. match probability, discrimination power, polymorphic information content (PIC), typical paternity index (TPI), and power of paternity exclusion (PE) in order to evaluate casework suitability (III). Haplotype frequencies were estimated, and haplotypic differentiation between the random sample and PM sample groups were tested for statistical significance with PHASE V.2.1.1 (IV). Study I: All data for mtDNA and Y-chromosomes was grouped into 13 subpopulations based on place of residence. Basic diversity indices, ie. haplogroup frequency, number of unique haplotypes (A*) and haplotype diversity (Ĥ) were estimated. Geographic differentiation values (FST and ΦST) were obtained using ARLEQUIN. For mitochondrial data, haplogroups were first obtained through sequence inference using the mtDNA Tree Build 15. Haplogroups were then situated into the mtDNA phylogeny with the HAPLOGREP program (haplotypes) or visual inspection (HVR1+2 data) and through construction of maximum likelihood (ML) trees with MEGA V. 5.05 assuming Tamura-Nei+Γ substitution model with shape parameter α = 0.7. HVR 1+2 haplogroup data were grouped into two clusters based on their inferred association with 1) Mesolithic

hunter-gatherers (HUNT; hgs U and V), and 2) Neolithic farmers (FARM; hgs H, J, T and K). To infer historical changes in female population size between haplogroups H and U, Bayesian Skyline Plots (BSPs) were built with BEAST v. 1.7.4 software using six mutation models and three alternative parameter combinations. The mutation rate was set at 1.69 × 10⁻⁸ substitutions/site/year. All results were combined with LOGCOMBINER software and analysed with TRACER V. 1.5. Basic diversity indices and differentiation for Y-SNPs were analyzed with ARLEQUIN v. 3.5.1.3. Study II: For Y-STR data, the number of unique haplotypes, haplotype frequencies and the number of singletons present were estimated, as well as allele number and distribution at each locus. Gene diversity for each locus was calculated with the formula D = 1-ΣPi2 with Pi signifying haplotype frequency. Discrimination power of each panel was measured by counting the number of unique haplotypes in a sample set and dividing by total sample size. The sample set was separated into three distinct subpopulations, eastern (E), southwestern (SW), and western (W) Finland, and region-specific differences in allele distribution and haplotype distance were evaluated. The geographical differentiation between the three subpopulations was quantified by estimating pairwise genetic distances with both conventional haplotypic FST and ΦST calculations as described above. The generational rate of change in 371 proven (paternity index > 10,000) father/son pairs was calculated to obtain mutation rates for the novel loci. Change was calculated using a Bayesian method as described by Chandler, 2006. Study III: The 30 indels of the Investigator DIPplex set were genotyped in a sample of 151 Finns, and evaluated for basic diversity, forensic indices (match probability, polymorphic information content (PIC), typical paternity index (TPI), and power of paternity exclusion (PE), and discrimination power) and linkage disequilibrium as described above. In order to evaluate geographical substructuring, the total sample set was subdivided into two groups by region, namely Finns of western (NFW = 67) and eastern (NFE = 84) origin. Study IV: Diversity indices, deviations from Hardy-Weinberg equilibrium, and statistical significance were tested as described above. Allele frequencies of the control group were compared to published data from 14 other populations. For each case group, mutant frequency was investigated with males and females separated.
RESULTS Y-STRs To increase the discrimination power of Y-chromosomal markers in Finland, a new multiplex panel of 7 Y-STRs was characterized in the Finnish population. The new 7plex marker panel, when compared to available commercial Y-typing kits (9-locus Minimal Haplotype, 12-locus Powerplex Y and 17-locus Yfiler), were found to surpass these sets in discrimination power. The haplotype diversity of the new panel (H = 0.996+/-0.001) exceeded that of the Minimal Haplotype (H = 0.965+/-0.006) as expected, but notably also surpassed the more powerful Yfiler (H = 0.992+/-0.002) in polymorphism. In the Finnish sample set (N = 255), 194 unique haplotypes could be observed for the 7plex panel, with 160 (82.6%) being singletons. In comparison, 17-locus Yfiler presented 167 unique haplotypes and 129 singletons (77.0%). Discrimination power was further increased when the two most efficient sets were pooled to create a panel of 24 markers with markedly increased diversity (H = 0.999+/-0.001). This 24plex showed 237 unique haplotypes, with 224 singletons (94.5%). For these combined markers, the highest diversities were found at loci DYS460 (H = 0.512) and DYS612 (H = 0.855), both belonging to the novel 7-locus multiplex. Genetic differentiation analysis with pairwise haplotypic FST quantitation showed that regional substructuring was also diminished from that observed with other, less powerful markers, and was least evident when using the 24-locus panel. However despite this general reduction, distinct genetic borders separating the three subpopulations (Eastern, Western, and Southwestern Finns) could still be observed. Differentiation was highest between Eastern and Southwestern Finns. This was observed for both FST as well as an additional differentiation analysis (ΦST) taking into account differences between the haplotypes. Regional gene diversities were in concordance with previous studies, with variation highest in Western Finland (H = 0.9992), and lowest in the East (H = 0.9947). The novel markers of the Y7 panel were shown to have a high mutation rate. The rate of change in proven (paternity index > 10,000) father/son pairs was calculated to obtain mutation rates for the novel loci. These were higher than the reported standard (1.31 × 10⁻²
vs. 3.17 × 10⁻³), explaining their high diversity and discrimination power. The highest mutation rate 3.2 × 10⁻², an order of magnitude higher than the standard, was observed at DYS627.
Y-SNPs Previous studies had identified the major Y-chromosomal haplogroups present in Finland as N1c, I1, R1a, and R1b (Lappalainen et al. 06). In a combined set consisting of both in-house samples, and samples obtained from online databases (total N = 584), haplogroups were identified using a predictor algorithm based on haplotype alleles. Using this algorithm, 289 of the total were predicted to belong to haplogroup N1c (H = 0.966± 0.007) and 242 to haplogroup I1 (H = 0.970± 0.005). Haplogroups N1c1 (N = 289) and I1 (N = 242) represented 91% of total data. The number of unique haplotypes observed was 147 and 106 respectively. Other haplogroups (mainly R1a and R1b) were predicted for 53

samples. For 16 analyzed markers (Yfiler markers with DYS635 removed), Y-STR haplotypes showed overall diversity H = 0.986 ± 0.002. These results were in agreement with previous studies performed on a similar number of markers. The haplogroup N1c is associated with hunter-gatherers (HUNT) while I1 represents cultures linked to an agrarian lifestyle (FARM). The geographic distribution of haplogroups was assessed through separation of the data by region (NE; northeast and SW; southwest Finland; based on Palo et al. 2009). Frequencies of N1c and I1 showed great differences between regions. Haplogroup I1 showed increased prevalence in southwestern Finland and N1c frequencies were highest in the northeastern regions. In concordance with previous studies showing lower diversity in Northeastern areas of Finland, our data showed lowest overall haplotype diversity in Eastern (H = 0.973+/-0.006) compared to Western regions of the country (H = 0.987+/-0.002). While the lower diversity of northeastern Finland could be observed independently for the two haplogroups, both N1c and I1 showed similar overall diversities within regions. The parent haplogroups N1c and I1 were further dissected to identify terminal-branch SNPs present within these main clades. The most common subhaplogroups in Finland within N1c1 and I1 were N1c1a1a-L1026 and I1a-DF29. Nordic subhaplogroup I1a1b-L22 represented 71% of the I1 haplotypes. Finnish haplogroups include I1a1b3a-L287, I1a1b3a1-L258, I1a1b3a1a-L296, I1a1b4-L300, I1a2a-Z59, I1a2a1-Z60, and I1a3-Z63. Additionally I1a2a1b-Z73 is a haplogroup typical of the Nordic countries. Geographically, frequency ratio observed for the HUNT/FARM haplogroups show similarity to those seen in the ratio of mitochondrial HUNT/FARM Mesolithic and Neolithic haplogroup frequencies respectively. mtDNA The analysis of mitochondrial hypervariable regions I and II showed haplogroup distribution and genetic diversity similar to that observed in Western Europe. Altogether from this sample set (N = 832), 384 unique haplotypes were observed with overall diversity H = 0.993+/-0.001. The most frequently observed haplogroups were H and U. Other haplogroups observed included hgs D, HV, I, N, R, W, X and Z. As elsewhere in Western Europe, H is the most common haplogroup. U also has a high frequency. U5 is a haplogroup most common Northern Europe, and in this sample set it was the most common subhaplogroup of U. In Europe, it has highest frequency in Finland. Differentiation between geographical regions showed diversity greater in Southwestern (H = 0.994+/-0.001) than Northeastern Finland (H = 0.990+/-0.001). Regional specificity could be observed in the distribution of haplogroups, as northeastern Finland showed high frequencies of Mesolithic HUNT clades (U and V) while the frequency of Neolithic FARM clades (H, J, T, and K) was greater in the southwest. Overall, the HVR data showed a higher frequency of FARM (50.4%) than HUNT (27.9%) haplogroups in Finland, and distribution patterns observed between complete sequence and HVR data were similar. FARM groups had larger estimated effective population sizes than HUNT, and also early population growth, estimated at 9 kya with mutation rate 1.69 × 10⁻⁸. In contrast, HUNT shows a later population growth at 4 kya.

Indels Allele frequencies for the Finnish population largely coincided with reference data from European populations. Polymorphism for these loci in the Finnish population was high. For the parameter of observed heterozygosity per allele, the range for these markers was 0.336-0.580 (mean = 0.471). Polymorphic information content (PIC) values ranged from 0.309 to 0.375. All loci were found to be in Hardy-Weinberg equilibrium after Bonferroni correction, and no linkage disequilibrium was observed between DIPplex and AmpFISTR Identifiler locus pairs. Genetic diversity levels varied between Western (GD = 0.479; H = 0.488) and Eastern Finland (GD = 0.466, H = 0.458) with Eastern Finland showing lower heterozygosity, in agreement with previous findings. Also in concordance with earlier studies of autosomal markers in Finland, no substructuring between regions in Finland could be observed in this data (FST = 0.003, P = 0.051). The high combined discrimination power (CDP > 0.999) of these markers indicates usefulness of the Investigator DIPplex set in individual identification applications in the Finnish populations. The marker with highest discrimination power loci was rs2307652 (DP = 0.657). Findings for forensic suitability also showed match probability values (CMP = 3.54 × 10⁻¹³) comparable to those found in the German population (CMP = 2.83 × 10⁻¹³). However, compared to values obtained for similar numbers of STRs, exclusion probabilities and paternity indices showed reduced power (Finns: CPE = 0.996, TPI = 0.956) indicating these markers to be unfavorable for kinship testing applications.
Pharmacogenetics CONTROL GROUP The control group showed a high frequency of mutant alleles and TTT haplotypes in comparison to neighboring populations, in concordance with previous studies that have demonstrated Finland’s extreme outlier status within the European continent. Mutant frequencies for individual SNPs 3435C>T (0.661), 1236C>T (0.542), and 2677G>T (0.564) were all higher than the European average. Frequency between different regions was also compared, to assess whether divergence could be observed between southwestern and northeastern regions. Contrast was indeed found between alleles of eastern (0.615) and western (0.549) regional origin. The regional differentiation within Finland was statistically significant (P = 0.037). CASE GROUP The haplotype frequencies of the case group were similar to that of the control group (P = 0.414). Within the case group, subjects with the highest blood digoxin concentration showed a higher concentration of mutant ABCB1 alleles. The sample group with the lowest digoxin concentration (<2.6 nmol/L) displayed a frequency of wild type alleles (0.528) higher than that of the control (0.589), while frequencies in the middle group (2.6 - 6.9 nmol/L; 0.591) did not deviate significantly from those of the control. The high-concentration group (>7 nmol/L) showed a higher mutant allele frequency (0.649) than the control. The frequencies of each individual SNP reflected those observed for TTT haplotypes. Female subjects showed 24%, 28% and 40% TTT frequencies for <2.6, >2.6,

and >7 nmol/L concentrations respectively. Remarkably, this trend is strongly accentuated for female subjects in each SNP individually as well as for combined alleles. This trend is, however, not observed in the male subjects when they are analyzed separately. Significant deviation from the control group haplotype frequencies were observed in the >7 nmol/L group in total (P = 0.008) and the >7 nmol/L females (P = 0.025).
DISCUSSION The research for my doctorate builds on our previous studies of Finnish multiform genetic markers in both a forensic science and population genetic context. These two disciplines complement each other, as recognizing the underlying structure of the Finnish gene pool and the history of its formation are crucial to understanding the factors affecting practical forensics today.
Stratification Forensic systems within one state are generally based on genetic diversity patterns within one population. However, population borders seldom follow state borders. As a result, substructuring within a population, if unrecognized, can confound forensic testing through erroneous estimates of allele frequencies and match probability (Chakraborty & Kidd, 1991). In Finland, one of the complications facing forensic profiling is extensive population stratification (Hedman et al. 2004; Palo et al. 2009). The strongest manifestation of this stratification is found in the sharp genetic demarcation dividing Northeastern and Southwestern regions of the country, initially recognized in Y-chromosomal loci and confirmed here with both uniparental and autosomal, coding and non-coding markers (I, II, IV). Especially notable is the detection of this border for the first time also in matrilinear markers (I). Characterization of this delineation is important as it serves to further resolve the substructuring within the population and clarify the dynamics that create these singular patterns. The Northeast/Southwest divergence had previously been postulated to be the result of dual origins, an influx of colonizers from separate locations (Sajantila et al. 1996; Kittles et al. 1998). Although separate origins of the population should in theory show up in all marker classes, its more prominent manifestation in the Y-chromosome may indicate male-biased colonizing groups (Sajantila et al. 1996; Lahermo et al. 1999; Hedman et al. 2004; Palo et al. 2007). Interestingly, the newly discovered presence of the delineation also in mitochondria suggests female lineages were also to some degree subject to the same dynamics that strongly affected the Y-chromosome. Differences in population history between the sexes (eg. differential migration, patrilocality) or marker characteristics (different mutation rates or effective population size) may also have contributed to divergent patterns (Jobling & Tyler-Smith 2003; Lappalainen et al. 2006). In our study, the observed distribution of Y-chromosomal and mitochondrial haplogroups suggests the regional division is a result of ancient events, potentially dating back as far as the original Paleolithic founders and subsequent arrival of Neoliths from the west several thousand years later (I). The matrilinear border, observed here in the haplogroup distribution, had previously eluded haplotype-level analyses. The pattern of mitochondrial haplogroup distribution was similar to that observed in Y-chromosomal haplogroups, ie. older, Mesolithic groups showed clustering in eastern regions while Neolithic groups were more often observed in western Finland. The continued division in hunter-gatherer and
farmer livelihoods may have enabled the divergence to further persist to the extent as to be observable in the present day. Substantiation of this can also be seen in archeological evidence such as an east-west divergence between types of agrarian tools (Sundell 2014). It is likely that the patterns of hunter-farmer association have not been observed in the rest of Europe due to a) greater time for admixture b) more favourable conditions for farming and c) the slowdown of the Neolithic advance when reaching the furthest margins of the continent due to space competition with the Mesoliths (Isern et al. 2012; Isern & Fort 2012). It has previously been shown that while in the rest of Europe the Mesolithic lifestyle was swiftly replaced with the Neolithic as it advanced, in the Nordic countries the hunter-gatherer culture persisted far into the Middle Ages (Karttakeskus 2007). Knowledge of the distribution of rare polymorphisms in world populations is of forensic value beyond probability calculation. Clarifying the resolution of Y-chromosomal and mitochondrial phylogenetic trees is helpful to forensic scientists because they are used in daily work to determine the reliability of datasets and confirm results (Kayser 2007; van Geystelen et al. 2013; van Oven et al. 2014; Larmuseau et al. 2015). Phylogenies can also be used to link geographical locations to lineages, information which can be applied to migration studies but also has forensic application in the association of a biological sample to the origins of the donor. Global differences in allele distribution can help to pinpoint biogeographical association in forensic identification, and also separate out populations in mixed casework samples (Bulbul et al. 2011; Phillips et al. 2012) Phillips et al. 2013; Phillips et al. 2014b). Ancestry-informative markers can also give investigative clues towards the phenotype of a subject. Thus, it is evident that the assessment of the contemporary distribution of Y-chromosomal and mtDNA haplogroups and the building of accurate phylogenies is both historically and forensically informative. Reduced diversity Another obstacle affecting forensic analysis today is low diversity of the population. This loss of diversity is likely the result of limited post-Pleistocene immigration, coupled with ancient bottlenecks that have affected the size of the founding population. Geographical isolation and the magnified effects of genetic drift on a small population were likely additional contributors to reduced genetic diversity (Sajantila et al. 1996; Kittles et al. 1998; de Knijff et al. 2000; Lahermo et al. 1999; Zerjal et al. 2001; Hedman et al. 2004; Lappalainen et al. 2006). This scenario would also manifest as a magnification of recessive traits, as seen in the diseases of the Finnish Disease Heritage (Peltonen et al. 1995; Kere 2001; Norio 2003b). The loss of diversity is especially strong in the Y-chromosome (Jobling et al. 1996; Sajantila et al. 1996; Kittles et al. 1999; Lahermo et al. 1999; Hedman et al. 2004; Palo et al. 2009), suggesting a reduction in effective population size at some point during the history of colonization. One consequence of this loss of diversity is that forensic markers which display high discrimination power elsewhere in Europe have reduced efficiency in Finland (Hedman et al. 2004; Palo et al. 2007; Palo et al., 2008). In our study, new loci were added to the Finnish forensic roster through the characterization and evaluation of highly polymorphic Y-STR markers in this population.

The new 7- and 24-locus Y-STR panels demonstrated improved suitability for practical forensic applications, with enhanced discrimination power and a reduction in regional subdivision compared to available commercial sets. The high rate of change of the novel Y-STRs demonstrated their suitability for the elucidation of intrafamilial Y-diversity within Finland, and the panels are easily amplifiable in a single reaction, a considerable practical benefit. The findings complement earlier research by highlighting the importance of careful selection of markers, demonstrated by the unusually high gene diversity (0.996+/-0.001) found for relatively few loci, and by emphasizing that the addition of data can improve forensic resolution in homogenous populations.
Outlier status Although genetic differentiation of Finland from the rest of Europe is not apparent in all tested markers, evidence found in autosomal SNPs and the Y-chromosome does point to a degree of divergence from other populations in Northern and continental Europe (Sajantila et al. 1996; Kittles et al. 1998; Lao et al. 2008; Salmela et al. 2008). In our data, outlier status could be observed in Y-chromosomal and autosomal SNPs (I, IV) but not in mitochondria (I) or indels (III). The presence of this differentiation means that markers validated in populations with remarkably different gene distribution must be evaluated separately in Finland to ensure efficiency. Here, we evaluated the performance of the new Investigator DIPPlex indel kit in the Finnish population (III). Our study demonstrated that the Investigator DIPplex kit was applicable to forensic testing in Finns, albeit with some limitations. Discrimination power overall was shown to be quite high; however, the set demonstrated reduced power in paternity testing in comparison to autosomal STRs. Thus, while the characterization of this panel in Finns confirmed its applicability for individual identification, the limited paternity resolution suggests that in the case of kinship testing, these loci may serve best as a supplementary to existing sets. Clinical effects The differences in the genetic makeup of Finns also extend to medico-legal applications. We found that in the digoxin study control group, Finns displayed an increased occurrence of ABCB1 mutations compared to other worldwide populations (IV). Because these mutations are associated with disruptions in drug processing, the high frequency implies an increased susceptibility to intoxication for the Finnish population that, due to the versatile affinity of Pgp, may also extend beyond digoxin to many other pharmaceuticals. In our study of post-mortem samples, a correlation between increased presentation of ABCB1 mutations and heightened digoxin concentration could be observed, reaffirming a relationship between genotype and overdose vulnerability. These findings are in agreement with previous research suggesting that pharmacokinetics is dependent on genotype (Sakaeda et al. 2001; Sakaeda et al. 2002). At least three other studies have been published on the post-mortem effects of ABCB1 (Buchard et al. 2010; Karlsson et al. 2013; Niemeijer et al. 2015) since the publication of our results; these have similarly indicated that mutations in this gene negatively influence the function of Pgp causing a heightened risk of toxicity. In our study, the relationship between ABCB1 mutations and

post-mortem digoxin serum concentration was stronger in females, implying that women may be more prominently affected by mutations of metabolic genes. The exact mechanism for this difference is unknown, but it has previously been demonstrated that post-mortem digoxin concentration and mortality were higher in women in digoxin vs. placebo drug trials (Adams et al. 2005). These findings are valuable to forensic pathology as they help establish a link between genotype and increased overdose susceptibility, and thus provide more evidence for medico-legal cause- and manner- of death examinations. Future Prospects Though currently not in routine use, genetic toolkits containing non-standard loci such as indels and SNPs are being increasingly adopted by laboratories worldwide for more comprehensive assessment of crime scene and other forensic samples. These prospects are being significantly aided by advances in NGS technology, allowing for the fast sequencing of whole genomes, as well as the genotyping of several marker types in single multiplexes, providing higher informativeness and accuracy (Ge et al. 2014). The introduction of new markers with different capacities to the existing repertoire provides increased discrimination power, increases versatility by expanding the range of applications, and patches up the shortcomings of single-type genetic toolsets. The marker types (autosomal and uniparental STRs, mitochondrial DNA, insertion-deletion polymorphisms and single nucleotide polymorphisms) described here are ideal additions to any all-encompassing multilocus panels intended for casework. However, routine use of NGS technology in forensic laboratories is unlikely to be a reality for quite some time, due to practical issues of cost, time and the difficulty of reconciliation with the existing system of microsatellite databases.
NGS technology will also be able to bring new advances to forensic medicine. As with criminal casework markers, NGS would more readily allow the pharmacogenetic tools providing accuracy for CoD determination to be combined into a single multi-marker universal panel. Loci associated with metabolic functions, such as ABCB1, can be incorporated into panels for pathology, clinical studies and personalized medicine. As informative indicators of metabolic efficiency, future studies will likely incorporate ours and other metabolic markers as essential components of toolsets used to investigate and accurately assess the cause and manner of death, and aid in clinical trials and personalized medicine. However, additional studies are still required in order to fully stock the “molecular autopsy” toolkit available to pathologists (Karlsson et al. 2014). NGS technology has proven reliable and sensitive for the analysis of SNPs in messenger RNA extracted from PM samples, providing valuable information on the circumstances of death such as perimortem trauma, and can thus provide investigative clues on the manner and time of death as well as helping to accurately determine the cause (Zubakov et al. 2008; Zubakov et al. 2009; Zubakov et al. 2010; Zubakov et al. 2016). Analysis of mRNA could potentially also be used to analyze SNPs associated with pharmacokinetics and drug processing.

In recent years there has been a growing demand in forensic circles for more discriminating markers of the Y-chromosome, and for the addition of Y-STRs to police registers as Y-markers offer multiple benefits not provided by autosomal testing alone (Ge et al. 2014). The majority of European nations, including Finland, currently employ the 17-locus Yfiler STR kit for forensic profiling. The adoption of the novel 7plex loci into the repertoire of routine forensic tools would considerably increase the efficiency of Finnish profiling as well as eliminating the need for small, region-specific Y-STR databases. They offer a practical supplementary to commercial panels, with global applicability in regions of similarly low Y-chromosomal diversity. Four of the markers from the seven-marker panel characterized here (DYS449, DYS576, DYS612, and DYS627) have been incorporated into novel multiplexes developed for casework use, termed Rapidly Mutating (RM) panels and recommended for police use globally (Ballantyne et al. 2010; Ballantyne et al., 2012; Ballantyne et al. 2014; Alghafri 2015). In some countries, the establishment of national Y-STR databases to supplement existing autosomal STR registers has been advantageous, as these have contributed improved screening of potential hits via familial matching, the ability to find matches to distant paternal relatives, and a reduced chance of adventitious hits. Adding Y-STRs to the forensic toolbox also provides a wider range of references in missing persons cases, and improved male/female mixture interpretation (Butler 2006; Zietkiewicz et al. 2012; Roewer 2013; Ge et al. 2014). Finally, the addition of Y-chromosomal markers is beneficial in criminal analysis because most violent crimes such as homicides and rapes are committed by males (Ge et al. 2014). Currently, the FBI database only has one Y-STR added for gender testing purposes, while other countries, most notably China, have already employed Y-STR databases in routine casework with great success. In the future, it is likely that the addition of non-standard markers to police databases will be aided through NGS technology. This technology will also facilitate the addition of Y-chromosomal markers to future multi-marker kits (Ge et al. 2014).
Beginning with the introduction of the first commercial forensic insertion-deletion kit, indels have been considered the up-and-comers of the forensic world. They are superior to autosomal STRs in the analysis of degraded DNA, and also provide improved stability in paternity and kinship tests (Pereira et al. 2009). Like mitochondria and Y-chromosomal markers, indels also have ancestry-informative properties and in coming years, it is likely that they will become an important component of AIM and other forensic toolkits. An AIM-indel panel developed in 2012 showed greater ease-of-use compared to AIM-SNP panels while retaining high efficacy in resolution of ancestry (Pereira et al. 2012a). Since indels are often found in functionally significant gene regions and very abundant in the genome, they may have considerable future potential in personalized medicine (Mullaney et al. 2010). Another recent development in the field of indel testing is the combined use of DIP-STR profiling to obtain results from “unbalanced DNA mixtures”, ie. mixtures where one component overpowers another in concentration (Hall & Castella 2011; Castella et al. 2013). In the past, Y-STRs have been the preferred tool for identifying male

components in mixtures. However, these have been ineffective when mixtures have been composed of contributors of the same gender, or where the minor contributor has been a woman (Cereda et al. 2014). DIP-STR combinations are practical in this sense because they are able to identify contributors even in these difficult mixed-stain cases, and thus also have merit as a complement to Y-chromosomal markers (Hall & Castella 2011). IN CONCLUSION A thorough assessment of the genetic variation and structure of the Finnish population is important not only for illuminating events and dynamics in history, but also for the recognition of potential obstacles to practical applications. In forensic science unusual variation patterns can cause significant problems, but analysis of the gene pool from a forensic perspective can both alleviate these issues and offer significant improvements to existing methods. The results of this study have brought new and exciting insights into the history of the population, explaining the mechanisms that helped to mould the structure affecting forensic analysis today, as well as providing new information on the applicability of a variety of different forensic markers in casework. The results paint a picture of Finland as a country with some obstacles in regard to forensic profiling, but ones that can be ultimately overcome.

ACKNOWLEDGEMENTS This thesis was carried out at the Laboratory of Forensic Biology, Department of Forensic Medicine, University of Helsinki with the collaboration of several talented people to whom I am greatly indebted. I am deeply grateful to my supervisors Prof. Antti Sajantila and Dr. Jukka Palo for their encouragement and excellent scientific direction. Your valuable experience, insight and contagious enthusiasm have helped me develop a deeper understanding and appreciation of forensic science. I have especially appreciated the good advice in helping me develop as a writer, and the many inspired discussions, scientific and otherwise. Thank you both for your inspiring example and your belief in me. I would like to extend thanks to Professors Pekka Pamilo and Lutz Roewer, the reviewers of this thesis, for their constructive and insightful feedback. Many thanks also to my co-authors Päivi Onkamo, Tarja Sundell, Minttu Hedman, Mikko Putkonen, and Sanni Översti for their essential contributions. I would like to express my gratitude to all my colleagues and collaborators at the department. A special thanks to Evelyn Guevara, Mikko Putkonen, Anna-Liina Rahikainen and Terhi Keltanen, for all the scientific input, fascinating talks and friendship. It’s been quite a rollercoaster ride and I’m lucky to have had you as co-workers. I’m grateful also to Minttu Hedman and Katarina Lindroos for wise mentorship and to Kirsti Höök, Tiina Valonen, Teija Partanen and Eve Karvinen for guidance and technical support. This project would not have been possible without the financial support of the Doctoral Program of Population Health (University of Helsinki) and the Finnish Population Genetics Graduate School (University of Oulu). I am sincerely grateful to my friends and family for their unfailing encouragement. Thanks to my parents for teaching me persistence and always backing me on my academic path, and to my sister Mona for all her good advice and tireless support. Thank you to my dear friend Katja for her endless faith in me, your support is invaluable. A special mention also to former colleagues and friends at the Turku Center of Biotechnology for their endless encouragement of all my strange pursuits! Finally thank you to my husband Paul for always believing in me. It is all your love, patience, kind words, unconditional support, brilliant advice and good humor that have helped me get this far, and I look forward to future adventures! Helsinki, May 2017 Anu Neuvonen

REFERENCES Achilli, A. et al., 2005. Saami and Berbers — an unexpected mitochondrial DNA link.
American Journal of Human Genetics, 76, pp.883–886.
Adams, K.F. et al., 2005. Relationship of serum digoxin concentration to mortality and morbidity in women in the digitalis investigation group trial: A retrospective analysis. Journal of the American College of Cardiology, 46(3), pp.497–504.
Alghafri, R. et al., 2015. A novel multiplex assay for simultaneously analysing 13 rapidly mutating Y-STRs. Forensic Science International: Genetics, 17, pp.91–98.
Alghafri, R. 2015. An evaluation of rapidly mutating Y-STR multi-allelic markers. Forensic Science International: Genetics Supplement Series, 5, pp.e647–e649.
Amorim A. et al., 2016. Formulation and communication of evaluative forensic science expert opinion- a GHEP-ISFG contribution to the establishment of standards. Forensic Science International: Genetics, 25:210-213.
Anderson, S. et al., 1981. Sequence and organization of the human mitochondrial genome.
Nature, 290(5806), pp.457–465.
Andrews, R.M. et al., 1999. Reanalysis and revision of the Cambridge Reference Sequence for human mitochondrial DNA. Nature Genetics, 23(2), p.147.
Ayub Q. et al., 2000. Identification and characterisation of novel human Y-chromosomal microsatellites from sequence database information. Nucleic Acids Research, 28, e8. Ballantyne, K.N. et al., 2010. Mutability of Y-chromosomal microsatellites: rates,
characteristics, molecular bases, and forensic implications. American Journal of Human Genetics, 87(3), pp.341–353.
Ballantyne, K.N. et al., 2012. A new future of forensic Y-chromosome analysis: Rapidly mutating Y-STRs for differentiating male relatives and paternal lineages. Forensic Science International: Genetics, 6(2), pp.208–218.
Ballantyne, K.N. et al., 2014. Toward male individualization with rapidly mutating Y-chromosomal short tandem repeats. Human Mutation, 35(8), pp.1021–1032.
Bandelt, H.-J. et al., 2013. The case for the continuing use of the revised Cambridge Reference Sequence (rCRS) and the standardization of notation in human mitochondrial DNA studies. Journal of Human Genetics, 2013, pp.1–12.
Barbujani, G., Magagni A., Minch E., Cavalli-Sforza L.L., 1997. An apportionment of human HLA diversity. Proceedings of the National Academy of Sciences USA, 94, pp.4516–4519.
Batini, C. et al., 2015. Large-scale recent expansion of European patrilineages shown by population resequencing. Nature Communications, (6), p.7152.

Battaglia V., et al., 2009. Y-chromosomal evidence of the cultural diffusion of agriculture in Southeast Europe. European Journal of Human Genetics, 17(6):820-30. doi: 10.1038/ejhg.2008.249.
Batzer, M.A. & Deininger, P.L., 1991. A human-specific subfamily of Alu sequences.
Genomics, 9(3), pp.481–487.
Batzer, M.A. et al., 1996. Genetic variation of recent Alu insertions in human populations. Journal of Molecular Evolution. pp. 22–29.
Batzer, M. A. & Deininger, P.L., 2002. Alu repeats and human genomic diversity. Nature Reviews Genetics, 3(5), pp.370–379.
Bauer M. & Patzelt D., 2002. Evaluation of mRNA markers for the identification of menstrual blood. Forensic Science International, 47(6):1278–1282.
Bauer M., 2007. RNA in forensic science. Forensic Science International: Genetics, 1:69-74.
Behar, D.M. et al., 2012. A “Copernican” reassessment of the human mitochondrial DNA tree from its root. American Journal of Human Genetics, 90(4), pp.675–684.
Berger B. et al., 2003. Molecular characterization and Austrian Caucasian population data of the multi-copy Y-chromosomal STR DYS464. Forensic Science International,137, 221–230.
Berglund, E.C., Kiialainen, A. & Syvänen, A.-C., 2011. Next-generation sequencing technologies and applications for human genetic history and forensics. Investigative Genetics, 2(1), p.23.
Bhangale, T.R. et al., 2005. Comprehensive identification and characterization of diallelic insertion-deletion polymorphisms in 330 human candidate genes. Human Molecular Genetics, 14(1), pp.59–69.
Bläuer, A. & Kantanen, J., 2013. Transition from hunting to animal husbandry in Southern, Western and Eastern Finland: New dated osteological evidence. Journal of Archaeological Science, 40(4), pp.1646–1666.
Børsting C. et al., 2008. Performance of the SNPforID 52 SNP-plex assay in paternity testing. Forensic Science International: Genetics, 2(4):292-300. doi: 10.1016/j.fsigen.2008.03.007.
Børsting C., Mikkelsen M. & Morling N., 2012. Kinship analysis with diallelic SNPs - experiences with the SNPforID multiplex in an ISO17025 accreditated laboratory. Transfusion Medicine and Hemotherapy, 39(3):195-201.
Børsting, C., Mogensen, H.S. & Morling N., 2013. Forensic genetic SNP typing of low-template DNA and highly degraded DNA from crime case samples. Forensic Science International: Genetics, 7(3), pp.345–352.
Bosch, E. et al., 1999. Variation in short tandem repeats is deeply structured by genetic

background on the human Y chromosome. American Journal of Human Genetics, 65, pp.1623–1638.
Branicki, W. et al., 2011. Model-based prediction of human hair color using DNA variants. Human Genetics, 129(4), pp.443–454.
Buchard, A. et al., 2010. Postmortem blood concentrations of R- and S-enantiomers of methadone and EDDP in drug users: Influence of co-medication and P-glycoprotein genotype. Journal of Forensic Sciences, 55(2), pp.457–463.
Budowle, B. & Baechtel, F.S., 1990. Modifications to improve the effectiveness of restriction fragment length polymorphism typing. Applied and Theoretical Electrophoresis. 1: 181-187.
Budowle, B., Moretti T.R., Niezgoda S.J., Brown B., 1998. CODIS and PCR-based short
tandem repeat loci: law enforcement tools. Proceedings of the Second European Symposium on Human Identification, Innsbruck, Austria, June 1998. Madison, WI: Promega Corporation. 1998; 73-88.
Budowle, B., Bieber, F.R. & Eisenberg, A.J., 2005. Forensic aspects of mass disasters: Strategic considerations for DNA-based human identification. Legal Medicine, 7(4), pp.230–243.
Budowle, B., Murch, R. & Chakraborty, R., 2005. Microbial forensics: The next forensic challenge. International Journal of Legal Medicine, 119(6), pp.317–330.
Budowle, B. & van Daal, A., 2008. Forensically relevant SNP classes. BioTechniques, 44(5), pp.603–609.
Budowle, B. & van Daal, A., 2009. Extracting evidence from forensic DNA analyses: Future molecular biology directions. BioTechniques, 46(5), pp.339–350.
Bulbul, O. et al., 2011. A SNP multiplex for the simultaneous prediction of biogeographic ancestry and pigmentation type. Forensic Science International: Genetics Supplement Series, 3(1), pp.e500–e501.
Butler, J.M., 2003. Recent developments in Y-short tandem repeat and Y-single nucleotide polymorphism analysis. Forensic Science Review, 15(July), pp.91–111.
Butler, J.M., 2006. Genetics and genomics of core short tandem repeat loci used in human identity testing. Journal of Forensic Sciences, 51(2), pp.253–265.
Butler, J.M., 2007. Short tandem repeat typing technologies used in human identity testing. BioTechniques, 43(4).
Butler, J.M., Coble, M.D. & Vallone, P.M., 2007. STRs vs. SNPs: Thoughts on the future of forensic DNA testing. Forensic Science, Medicine, and Pathology, 3(3), pp.200–205.
Butler, J.M., 2010. Fundamentals of Forensic DNA Typing. Academic Press, Cambridge,

Massachusetts, USA. ISBN: 9780080961767.
Cainé, L. et al., 2011. Interest of X chromosome (Argus X-12 kit) in complex kinship analysis. Forensic Science International: Genetics Supplement Series, 3(1).
Cann, R.L., Stoneking, M. & Wilson, C., 1987. Mitochondrial DNA and human evolution. Nature, 325, pp.31–6.
Cann, R.L., 2013. Y weigh in again on modern humans. Science, 341(6145), pp.465–7.
Carracedo, A. et al., 1997. Forensic DNA analysis in Europe: Current situation and standardization efforts. Forensic Science International, 86(1-2), pp.87–102.
Carracedo, et al., 2010. Publication of population data for forensic purposes. Forensic Science International: Genetics, 4(3), pp.145–147.
Castella, V., Gervaix, J. & Hall, D., 2013. DIP-STR: Highly sensitive markers for the analysis of unbalanced genomic mixtures. Human Mutation, 34(4), pp.644–654.
Cavalli-Sforza, L.L., Menozzi, P. & Piazza, A., 1993. The history and geography of human genes. Princeton University Press, Princeton, New Jersey, USA. ISBN: 978-0691029054.
Cereda, G. et al., 2014. An investigation of the potential of DIP-STR markers for DNA
mixture analyses. Forensic Science International: Genetics, 11(1), pp.229–240.
Chakraborty, R. & Kidd, K.K., 1991. The utility of DNA typing in forensic work. Science, 254(5039), pp.1735–1739.
Chakraborty, R. et al., 1999. The utility of short tandem repeat loci beyond human identification: implications for development of new DNA typing systems. Electrophoresis, 20(8), pp.1682–1696.
Chandler J., 2006. Estimating Per-Locus Mutation Rates. Journal of Genetics Genealogy, 2, pp. 27-33.
Chiaroni, J., Underhill, P.A. & Cavalli-Sforza, L.L., 2009. Y chromosome diversity,
human expansion, drift, and cultural evolution. Proceedings of the National Academy of Sciences of the United States of America, 106(48), pp.20174–20179.
Combined DNA Index System-National DNA Index System (CODIS-NDIS) Statistics. https://www.fbi.gov/services/laboratory/biometric-analysis/codis/ndis-statistics. Accessed 3.5.2017.
Comas, D., Paabo, S. & Bertranpetit, J., 1995. Heteroplasmy in the control region of human mitochondrial DNA. Genome Research, 5(1), pp.89–90.
Cotton, E.A. et al., 2000. Validation of the AMPFlSTR® SGM Plus system for use in forensic casework. Forensic Science International, 112(2-3), pp.151–161.
Cruciani, F. et al., 2011. A revised root for the human Y chromosomal phylogenetic tree:

The origin of patrilineal diversity in Africa. American Journal of Human Genetics, 88(6), pp.814–818.
Cui, Y., Hongjie, L. & Chao, N., 2013. Y-chromosome analysis of prehistoric human populations in the West Liao River Valley, Northeast China. BMC Evolutionary Biology, 13.
Decorte, R., 2010. Genetic identification in the 21st century - current status and future developments. Forensic Science International, 201(1-3), pp.160–164.
Ellegren, H., 2000. Microsatellite mutations in the germline: Implications for evolutionary inference. Trends in Genetics, 16(12), pp.551–558.
The ENCODE Project Consortium, 2012. An integrated encyclopedia of DNA elements in the human genome. Nature. 489 (7414): 57-74.
ENFSI (European Network of Forensic Science Institutes), 2015. ENFSI Guideline for Evaluative Reporting in Forensic Science: strengthening the evaluation of forensic results across Europe. http://enfsi.eu/wp-content/. Accessed 3.5.2017.
ENFSI (European Network of Forensic Science Institutes) DNA Working Group, 2016.
DNA database management review and recommendations. http://enfsi.eu/wp-content/. Accessed 3.5.2017.
Excoffier, L., Laval, G. & Schneider, S., 2005. Arlequin (version 3.0): an integrated software package for population genetics data analysis. Evolutionary Bioinformatics Online, 1, pp.47–50.
Ezkurdia I, et al., 2014. Multiple evidence strands suggest that there may be as few as 19 000 human protein-coding genes. Human Molecular Genetics. 15;23(22):5866-78.
Federal Bureau of Investigation Combined DNA Index System (CODIS) Homepage;
http:// www.fbi.gov/hq/lab/codis/index1.htm.
Fondevila, M. et al., 2013. Revision of the SNPforID 34-plex forensic ancestry test: Assay enhancements, standard reference sample genotypes and extended population studies. Forensic Science International: Genetics, 7(1), pp.63–74.
Fort, J., 2012. Synthesis between demic and cultural diffusion in the Neolithic transition in Europe. Proceedings of the National Academy of Sciences of the United States of America, 109(46), pp.18669–73.
Foster, J.W. et al., 1992. Evolution of sex determination and the Y chromosome: SRY-related sequences in marsupials. Nature, 359(6395), pp.531–533.
Forensic ChrX Research Group, 2017. http://www.chrx-str.org/. Accessed 3.5.2017.
Frudakis, T. et al., 2003. A classifier for the SNP-based inference of ancestry. Journal of Forensic Sciences, 48(4), pp.771–782.

Fu, Q. et al., 2013. A revised timescale for human evolution based on ancient mitochondrial genomes. Current Biology, 23(7), pp.553–559.
Ge, J. et al., 2014. Future directions of forensic DNA databases. Croatian Medical Journal, 55: 163-166.
van Geystelen, A., Decorte, R. & Larmuseau, M.H.D., 2013. Updating the Y-chromosomal phylogenetic tree for forensic applications based on whole genome SNPs. Forensic Science International: Genetics, 7(6), pp.573–580.
Giles, R.E. et al., 1980. Maternal inheritance of human mitochondrial DNA. National Academy of Sciences, 77(11), pp.6715–6719.
Gill, P., Jeffreys, A.J. & Werrett, D.J., 1985. Forensic application of DNA “fingerprints.” Nature, 318(6046), pp.577–579.
Gill, P., 2001. An assessment of the utility of single nucleotide polymorphisms (SNPs) for forensic purposes. International Journal of Legal Medicine, 114(4-5), pp.204–210.
Gill, P., 2002. Role of short tandem repeat DNA in forensic casework in the UK--past, present, and future perspectives. BioTechniques, 32(2), pp.366–368, 370, 372.
Gill, P. et al., 2006. The evolution of DNA databases - recommendations for new European STR loci. Forensic Science International, 156(2-3), pp.242–244.
Gonzales, A.R., Schofield, R.B., & Schmitt G.R., 2006. Lessons learned From 9/11: DNA identification in mass fatality incidents. United States Department of Justice, Office of Justice Programs. Washington DC, USA.
Graves, J.A., 1998. Evolution of the mammalian Y chromosome and sex-determining genes. Journal of Experimental Zoology. pp. 472–481.
Graves, J.A., 2006. Sex chromosome specialization and degeneration in mammals. Cell, 124(5), pp.901–914.
Green, R.E. et al., 2008. Supplemental data: A complete Neanderthal mitochondrial genome sequence determined by high-throughput sequencing. Cell, 134(3), pp.416–426.
Grimes, E.A. et al., 2001. Sequence polymorphism in the human melanocortin 1 receptor gene as an indicator of the red hair phenotype. Forensic Science International, 122(2-3), pp.124–129.
Haak, W. et al., 2010. Ancient DNA from European early Neolithic farmers reveals their Near Eastern affinities. PLoS Biology, 8(11).
Hall, A. & Ballantyne, J., 2003. Novel Y-STR typing strategies reveal the genetic profile of the semen donor in extended interval post-coital cervicovaginal samples. Forensic Science International, 136(1-3), pp.58–72.
Hall, D. & Castella, V., 2011. DIP-STR: A new marker for resolving unbalanced DNA
mixtures. Forensic Science International: Genetics Supplement Series, 3(1).
Hallast, P. et al., 2014. The Y-chromosome tree bursts into leaf: 13,000 high-confidence SNPs covering the majority of known clades. Molecular Biology and Evolution, 32(3), pp.661–673.
Hammer, M.F., 1995. A recent common ancestry for human-Y-chromosomes. Nature, 378(6555), pp.376–378.
Hammer, M.F. et al., 2001. Hierarchical patterns of global human Y-chromosome diversity. Molecular Biology and Evolution, 18(7), pp.1189–1203.
Hares, D.R., 2015. Selection and implementation of expanded CODIS core loci in the United States. Forensic Science International Genetics, 17, pp. 33-34.
Hedman, M. et al., 2004. Analysis of 16 Y STR loci in the Finnish population reveals a local reduction in the diversity of male lineages. Forensic Science International, 142(1), pp.37–43.
Hedman, M. et al., 2007. Finnish mitochondrial DNA HVS-I and HVS-II population data. Forensic Science International, 172(2-3), pp.171–178.
He Y. et al., 2010. Heteroplasmic mitochondrial DNA mutations in normal and tumour cells. Nature, 464:610-614.
Henke, J. et al., 2001. Application of Y-chromosomal STR haplotypes to forensic genetics. Croatian Medical Journal, 42(3), pp.292–297.
Hert, D.G., Fredlake, C.P. & Barron, A.E., 2008. Advantages and limitations of next-generation sequencing technologies: A comparison of electrophoresis and non-electrophoresis methods. Electrophoresis, 29(23), pp.4618–4626.
Higuchi R., von Beroldingen C.H., Sensabaugh G.F., Erlich H.A., 1988. DNA typing from single hairs. Nature, 332, p. 543-546.
The Innocence Project, 2017. http://www.innocenceproject.org. Accessed 3.5.2017. International Human Genome Sequencing Consortium, 2001. Initial sequencing and
analysis of the human genome. Nature, 412, pp.860–921.
International Human Genome Sequencing Consortium, 2004. Finishing the euchromatic sequence of the human genome. Nature, 431(7011), pp.931–945.
INTERPOL (International Criminal Police Organization), 2009. Interpol handbook on DNA data exchange and practice. Interpol DNA Monitoring Expert Group, Lyon, France.
INTERPOL (International Criminal Police Organization), 2014. Disaster Victim Identification Guide. Interpol DNA Monitoring Expert Group, Lyon, France.
INTERPOL (International Criminal Police Organization), 2016. Organization website:

https://www.interpol.int/INTERPOL-expertise/Forensics/DNA. Accessed 3.5.2017.
Isern N., Fort J. & Vander Linden M., 2012. Space competition and time delays in human range expansions. Application to the Neolithic transition. PLoS ONE, 7(12). doi: 10.1371/journal.pone.0051106
Isern, N. & Fort, J., 2012. Modelling the effect of Mesolithic populations on the slowdown of the Neolithic transition. Journal of Archaeological Science, 39(12), pp.3671–3676.
Jeffreys, A.J., Wilson, V. & Thein, S.L., 1985a. Hypervariable “minisatellite” regions in human DNA. Nature, 314(6006), pp.67–73.
Jeffreys, A. J., Wilson, V. & Thein, S.L., 1985b. Individual-specific “fingerprints” of human DNA. Nature, 316(6023), pp.76–79.
Jeffreys, A. J., Brookfield, J.F. & Semeonoff, R., 1985c. Positive identification of an immigration test-case using human DNA fingerprints. Nature, 317, pp.818–819.
Jeffreys, A.J. et al., 1991. Principles and recent advances in human DNA fingerprinting. EXS, 58, pp.1–19.
Jobling, Mark A. & Tyler-Smith, C.,1995. Fathers and sons: The Y-chromosome and human evolution. TIG, 11(11).
Jobling, M.A. et al., 1996. Recurrent duplication and deletion polymorphisms on the long arm of the Y chromosome in normal males. Human Molecular Genetics, 5(11), pp.1767–1775.
Jobling, M. A., Pandya, A. & Tyler-Smith, C., 1997. The Y chromosome in forensic analysis and paternity testing. International Journal of Legal Medicine, 110(3), pp.118–124.
Jobling, M.A. & Tyler-Smith, C., 2003. The human Y chromosome: an evolutionary marker comes of age. Nature Reviews: Genetics, 4(8), pp.598–612.
Jobling, M.A. & King, T.E., 2004. The distribution of Y-chromosomal haplotypes: forensic implications. International Congress Series, 1261, pp.70–72.
Jorde, L. & Wooding, S., 2004. Genetic variation, classification and “race.” Nature Genetics, 36(11), pp.28–33.
Jorde, L.B. et al., 2000. The distribution of human genetic diversity: a comparison of mitochondrial, autosomal, and Y-chromosome data. American Journal of Human Genetics, 66(3), pp.979–88.
Karafet, T.M. et al., 2008. New binary polymorphisms reshape and increase resolution of the human Y chromosomal haplogroup tree. Genome Research, 18(5), pp.830–838.
Karlsson, A.O. et al., 2006. Y-chromosome diversity in Sweden – A long-time perspective. European Journal of Human Genetics, 14(8), pp.963–970.

Karlsson, L. et al., 2013. ABCB1 gene polymorphisms are associated with fatal intoxications involving venlafaxine but not citalopram. International Journal of Legal Medicine, 127(3), pp.579–586.
Karmin, M. et al., 2015. A recent bottleneck of Y chromosome diversity coincides with a global change in culture. Genome Research, 25(4), pp.459–466.
Kayser, M. et al., 1997. Evaluation of Y-chromosomal STRs: A multicenter study. International Journal of Legal Medicine, 110(3), pp.125–133.
Kayser, M. et al., 2002. Online Y-chromosomal short tandem repeat haplotype reference database (YHRD) for U.S. populations. Journal of Forensic Sciences, 47(3), pp.513–9.
Kayser, M. et al., 2004. A comprehensive survey of human Y-chromosomal microsatellites. American Journal of Human Genetics, 74(6), pp.1183–1197.
Kayser, M., 2007. Uni-parental markers in human identity testing including forensic DNA analysis. BioTechniques, 43(6), p.Sxv–Sxxi.
Kayser, M. et al., 2008. Three genome-wide association studies and a linkage analysis identify HERC2 as a human iris color gene. American Journal of Human Genetics, 82(2), pp.411–423.
Keating, B. et al., 2013. First all-in-one diagnostic tool for DNA intelligence: Genome-wide inference of biogeographic ancestry, appearance, relatedness, and sex with the Identitas v1 Forensic Chip. International Journal of Legal Medicine, 127(3), pp.559–572.
Kere, J., 2001. Human population genetics: Lessons from Finland. Annual Review of Genomics and Human Genetics, 2, pp. 69–101.
Kere, J., 2010. Genetics of complex disorders. Biochemical and Biophysical Research Communications, 396(1), pp.143–146.
Kidd K.K., et al., 2017. Evaluating 130 microhaplotypes across a global set of 83 populations. Forensic Sci Int Genet. 16;29:29-37. doi: 10.1016/j.fsigen.2017.03.014.
Kimpton, C.P. et al., 1996. Validation of highly discriminating multiplex short tandem
repeat amplification systems for individual identification. Electrophoresis, 17(8), pp.1283–1293.
King, J.L. et al., 2014. High-quality and high-throughput massively parallel sequencing of the human mitochondrial genome using the Illumina MiSeq. Forensic Science International: Genetics, 12, pp.128–135.
King, T.E. et al., 2006. Genetic signatures of coancestry within surnames. Current Biology, 16(4), pp.384–388.
King, T.E. & Jobling, M. A., 2009. Founders, drift, and infidelity: The relationship between Y chromosome diversity and patrilineal surnames. Molecular Biology and

Evolution, 26(5), pp.1093–1102.
Kittles, R.A. et al., 1998. Dual origins of Finns revealed by Y chromosome haplotype variation. American Journal of Human Genetics, 62(5), pp.1171–9.
Kittles, R.A. et al., 1999. Autosomal, mitochondrial, and Y chromosome DNA variation in Finland: Evidence for a male-specific bottleneck. American Journal of Physical Anthropology, 108(4), pp.381–399.
de Knijff, P. et al., 1997. Chromosome Y microsatellites: Population genetic and evolutionary aspects. International Journal of Legal Medicine, 110(3), pp.134–140.
de Knijff P., 2000. Messages through bottlenecks: on the combined use of slow and fast evolving polymorphic markers on the human Y chromosome. American Journal of Human Genetics, 2000 Nov;67(5):1055-61.
Koski A. et al., 2007. A fatal doxepin poisoning asociated with a defective CYP2D6
genotype. American Journal of Forensic Medicine and Pathology, 28 (3), pp. 259-261.
Lacan, M. et al., 2011a. Ancient DNA reveals male diffusion through the Neolithic Mediterranean route. Proceedings of the National Academy of Sciences of the United States of America, 108(24), pp.9788–9791.
Lacan, M. et al., 2011b. Ancient DNA suggests the leading role played by men in the Neolithic dissemination. Proceedings of the National Academy of Sciences, 108(45), pp.18255–18259.
Lahermo, P. et al., 1996. The genetic relationship between the Finns and the Finnish Saami (Lapps): analysis of nuclear DNA and mtDNA. American Journal of Human Genetics, 58(6), pp.1309–22.
Lahermo, P. et al., 1999. Y chromosomal polymorphisms reveal founding lineages in the Finns and the Saami. European Journal of Human Genetics, 7, pp.447–458.
Lahn, B. T. & Page, D. C., 1999. Four evolutionary strata on the human X chromosome. Science 286, 964–967.
Laitinen, V. et al., 2002. Y-chromosomal diversity suggests that Baltic males share
common Finno-Ugric-speaking forefathers. Human Heredity, 53(2), pp.68–78.
Lango Allen, H., Estrada, K. & Lettre et al., G., 2010. Hundreds of variants clustered in genomic loci and biological pathways affect human height. Nature, 467(7317), pp.832–838.
Lao, O. et al., 2008. Correlation between genetic and geographic structure in Europe. Current Biology, 18(16), pp.1241–1248.
Lappalainen, T. et al., 2006. Regional differences among the Finns: A Y-chromosomal perspective. Gene, 376(1-2), pp.207–215.
Lappalainen, T. et al., 2008. Migration waves to the Baltic Sea region. Annals of Human Genetics, 72(3), pp.337–348.
Lappalainen, T. et al., 2009. Population structure in contemporary Sweden -- a Y-chromosomal and mitochondrial DNA analysis. Annals of Human Genetics, 73(1), pp.61–73.
LaRue B.L. et al., 2012. A validation study of the Qiagen Investigator DIPplex kit; an INDEL-based assay for human identification, International Journal Legal Medicine, 126, 533–540. http://dx.doi.org/10.1007/s00414-012-0667-9.
Larmuseau, M.H.D. et al., 2015. Towards a consensus Y-chromosomal phylogeny and Y-SNP set in forensics in the next-generation sequencing era. Forensic Science International: Genetics, 15, pp.39–42.
Lee, E.J. et al., 2012. Emerging genetic patterns of the European Neolithic: Perspectives from a late Neolithic Bell Beaker burial site in Germany. American Journal of Physical Anthropology, 148(4), pp.571–579.
Lessig, R. et al., 2005. Y-SNP-genotyping - a new approach in forensic analysis. Forensic Science International, 154(2-3), pp.128–136.
Leriche, A. et al., 1998. Final report of the Interpol Working Party on DNA profiling. Proceedings from the 2nd European Symposium on Human Identification, Promega Corporation, Madison, WI, USA, 1998, pp. 48-54.
Liu, F. et al., 2009. Eye color and the prediction of complex phenotypes from genotypes. Current Biology, 19(5).
Liu, F. et al., 2012. A genome-wide association study identifies five loci influencing facial morphology in Europeans. PLoS Genetics, 8(9).
Mann, J. D. et al., 1962. A sex-linked blood group. Lancet, 279, pp.8–10.
Martin, P.D., Schmitter, H. & Schneider, P.M., 2001. A brief history of the formation of DNA databases in forensic science within Europe. Forensic Science International, 119(2), pp.225–231.
Martin, P.D., 2004. National DNA databases—practice and practicability. A forum for discussion. International Congress Series, 1261, pp.1–8.
Mendez, F.L. et al., 2013. An African American paternal lineage adds an extremely ancient root to the human Y chromosome phylogenetic tree. American Journal of Human Genetics, 92(3), pp.454–459.
Mighell, A.J., Markham, A.F. & Robinson, P.A., 1997. Alu sequences. FEBS Letters, 417(1), pp.1–5.
Mills, R.E. et al., 2006. An initial map of insertion and deletion ( INDEL ) variation in the human genome. Genome Research, 16(9), pp.1182–1190.
Mills, R.E. et al., 2011. Natural genetic variation caused by small insertions and deletions in the human genome. Genome Research, 21(6), pp.830–839.
Mitchell, R.J. & Hammer, M.F., 1996. Human evolution and the Y chromosome. Current Opinion in Genetics & Development, 6(6), pp.737–742.
Mullaney, J.M. et al., 2010. Small insertions and deletions (INDELs) in human genomes. Human Molecular Genetics, 19(R2), pp.131–136.
Mullis, K. et al., 1986. Specific enzymatic amplification of DNA in vitro: The polymerase chain reaction. Cold Spring Harbor Symposia on Quantitative Biology, 51(1), pp.263–273.
Musgrave-Brown, E. et al., 2007. Forensic validation of the SNPforID 52-plex assay. Forensic Science International: Genetics, 1(2), pp.186–190.
Nachman, M.W. & Crowell, S.L., 2000. Estimate of the mutation rate per nucleotide in humans. Genetics, 156(1), pp.297–304.
van Neste C. et al., 2012. Forensic STR analysis using massive parallel sequencing. Forensic Science International: Genetics, 6(6):810-8.
Niemeijer M.N. et al., 2015. ABCB1 gene variants, digoxin and risk of sudden cardiac
death in a general population. Heart.101(24):1973-9. Norio, R., 2003a. Finnish Disease Heritage I: characteristics, causes, background. Human
Genetics, 112(5-6), pp.441–56.
Norio, R., 2003b. Finnish Disease Heritage II: population prehistory and genetic roots of Finns. Human Genetics, 112(5-6), pp.457–69.
Norio, R. & Löytönen, M., 2002. The Finnish disease heritage III: the individual diseases, Human Genetics, 112(5-6), pp.470–526.
Novick, G.E. et al., 1993. The use of polymorphic Alu insertions in human DNA fingerprinting. EXS, 67, pp.283–91.
Olalde, I. et al., 2014. Derived immune and ancestral pigmentation alleles in a 7,000-year-old Mesolithic European. Nature, 507(7491), pp.225–228.
van Oven, M. & Kayser, M., 2009. Updated comprehensive phylogenetic tree of global human mitochondrial DNA variation. Human Mutation, 30(2), pp.386–394.
van Oven, M. et al., 2014. Seeing the wood for the trees: A minimal reference phylogeny for the human Y chromosome. Human Mutation, 35(2), pp.187–191.
Palo, J.U. et al., 2007. High degree of Y-chromosomal divergence within Finland - forensic aspects. Forensic Science International: Genetics, 1(2), pp.120–124.
Palo, J.U. et al., 2008. The effect of number of loci on geographical structuring and forensic applicability of Y-STR data in Finland. International Journal of Legal

Medicine, 122(6), pp.449–456.
Palo, J.U. et al., 2009. Genetic markers and population history: Finland revisited. European Journal of Human Genetics, 17(10), pp.1336–1346.
Pakstis A.J. et al., 2012. Mini-haplotypes as lineage informative SNPs (LISNPs) and ancestry inference SNPs (AISNPs), European Journal Human Genetics, 20; 1148–1154.
Parson, W. & Bandelt, H.J., 2007. Extended guidelines for mtDNA typing of population
data in forensic science. Forensic Science International: Genetics, 1(1), pp.13–19.
Parson, W. & Dür, A., 2007. EMPOP-A forensic mtDNA database. Forensic Science International: Genetics, 1(2), pp.88–92.
Parson W. et al., 2014. DNA Commission of the International Society for Forensic Genetics: revised and extended guidelines for mitochondrial DNA typing. Forensic Science International: Genetics, 13:134-42. doi: 10.1016/j.fsigen.
Peltonen, L., Pekkarinen, P. & Aaltonen, J., 1995. Messages from an isolate: lessons from
the Finnish gene pool. Biological Chemistry Hoppe-Seyler, 376, pp.697–704.
Peltonen, L., 1997. Molecular background of the Finnish Disease Heritage. Annals of Medicine, 29(6), pp.553–556.
Peltonen, L., Jalanko, A. & Varilo, T., 1999. Molecular genetics of the Finnish disease heritage. Human Molecular Genetics, 8(10), pp.1913–1923.
Peltonen, L., Palotie, A. & Lange, K., 2000. Use of population isolates for mapping complex traits. Nature Reviews Genetics, 1(3), pp.182–90.
Peltonen, L. & McKusick, V.A., 2001. Genomics and medicine: Dissecting human disease in the postgenomic era. Science, 291(5507), pp.1224–1229.
Pereira, R. et al., 2009. A new multiplex for human identification using insertion/deletion polymorphisms. Electrophoresis, 30(21), pp.3682–3690.
Pereira V. et al., 2011. Study of 25 X-chromosome SNPs in the Portuguese. Forensic Science International: Genetics, 5(4):336-8.
Pereira, R. et al., 2012a. Straightforward inference of ancestry and admixture proportions
through ancestry-informative insertion deletion multiplexing. PLoS ONE, 7(1).
Pereira R, et al., 2012b. A method for the analysis of 32 X chromosome insertion deletion polymorphisms in a single PCR. International Journal of Legal Medicine, 20;126(1):97-105. doi: 10.1007/s00414-011-0593-2.
Pereira V. et al., 2017. Evaluation of the Precision ID Ancestry Panel for crime case work:
A SNP typing assay developed for typing of 165 ancestral informative markers. Forensic Science International: Genetics, 28:138-145.

Phillips, C. et al., 2007. Inferring ancestral origin using a single multiplex assay of
ancestry-informative marker SNPs. Forensic Science International: Genetics, 1(3-4), pp.273–280.
Phillips, C., Fondevila, M. & Lareau, M.V., 2012. A 34-plex autosomal SNP single base extension assay for ancestry investigations. Methods in Molecular Biology, 830, pp.109–126.
Phillips, C. et al., 2013. Eurasiaplex: A forensic SNP assay for differentiating European and South Asian ancestries. Forensic Science International: Genetics, 7(3), pp.359–366.
Phillips, C. et al., 2014a. “New turns from old STaRs”: Enhancing the capabilities of forensic short tandem repeat analysis. Electrophoresis, 35(21-22), pp.3173–3187.
Phillips, C. et al., 2014b. Building a forensic ancestry panel from the ground up: The EUROFORGEN Global AIM-SNP set. Forensic Science International: Genetics, 11(1), pp.13–25.
Pimenta, J.R. & Pena, S.D., 2010. Efficient human paternity testing with a panel of 40 short insertion-deletion polymorphisms. Genetics and Molecular Research, 9(1), pp.601–607.
Pinto N. et al., 2011. X-chromosome markers in kinship testing: a generalization of the IBD approach identifying situations where their contribution is crucia. Forensic Science International: Genetics, 5(1):27-32.
Poznik, G.D. et al., 2013. Sequencing Y chromosomes resolves discrepancy in time to common ancestor of males versus females. Science, 341(6145), pp.562–5.
Prieto-Fernández E. et al., 2016. Development of a new highly efficient 17 X-STR multiplex for forensic purposes, Electrophoresis, 37 (2016) 1651–1658.
Prinz, M. et al., 2007. DNA Commission of the International Society for Forensic
Genetics (ISFG): Recommendations regarding the role of forensic genetics for disaster victim identification (DVI). Forensic Science International: Genetics, 1(1), pp.3–12.
Raitio, M. et al., 2001. Y-chromosomal SNPs in Finno-Ugric-speaking populations analyzed by minisequencing on microarrays. Genome Research, 11(3), pp.471–482.
Rands C.M. et al., 2014. 8.2% of the human genome is constrained: variation in rates of turnover across functional element classes in the human lineage. PLoS Genetics, 10(7): e1004525.
Ray, D. A., Walker, J. A. & Batzer, M. A., 2007. Mobile element-based forensic genomics. Mutation Research - Fundamental and Molecular Mechanisms of Mutagenesis, 616(1-2), pp.24–33.
Redd A.J. et al., 2002. Forensic value of 14 novel STRs on the human Y chromosome,

Forensic Sci. Int. 130, 97–111. Roewer L. et al., 1992. Simple repeat sequences on the human Y chromosome are equally
polymorphic as their autosomal counterparts. Human Genetics, 89(4), pp.389–94.
Roewer, L. et al., 2001. Online reference database of European Y-chromosomal short tandem repeat (STR) haplotypes. Forensic Science International, 118(2-3), pp.106–113.
Roewer, L., 2003. The Y-Short Tandem Repeat Haplotype Reference Database (YHRD) and male population stratification in Europe - impact on forensic genetics. Forensic Science Review, 15(2), pp.165–72.
Roewer, L. et al., 2005. Signature of recent historical events in the European Y-chromosomal STR haplotype distribution. Human Genetics, 116(4), pp.279–291.
Roewer, L., 2013. DNA fingerprinting in forensics: past, present, future. Investigative Genetics, 4(1), p.22.
Rootsi, S. et al., 2004. Phylogeography of Y-chromosome haplogroup I reveals distinct domains of prehistoric gene flow in Europe. American Journal of Human Genetics, 75(1), pp.128–37.
Rootsi, S. et al., 2007. A counter-clockwise northern route of the Y-chromosome haplogroup N from Southeast Asia towards Europe. European Journal of Human Genetics, 15(2), pp.204–11.
Rosenberg, N. A. et al., 2002. Genetic structure of human populations. Science, 298, pp.2381–2385.
Rosser Z.H. et al., 2000. Y-chromosomal diversity in Europe is clinal and influenced primarily by geography, rather than by language. American Journal of Human Genetics, 67(6):1526-43.
Sagan D. & Margulis L., 1987. Bacterial bedfellows: a microscopic menage a trois may be
responsible for a major step in evolution. Natural History, 96(3), pp.26–33.
Saiki, R. et al., 1985. Enzymatic amplification of beta-globin genomic sequences and restriction site analysis for diagnosis of sickle cell anemia. Science, 230(4732), pp.1350 – 1354.
Sajantila, A., 1992. DNA analysis in forensic medicine: Application of the polymerase chain reaction (PCR) to the identification of individuals. Kansanterveyslaitoksen julkaisuja.
Sajantila, A. et al., 1992. PCR amplification of alleles at the DIS80 locus: comparison of
a Finnish and a North American Caucasian population sample, and forensic casework evaluation. American Journal of Human Genetics, 50(4), pp.816–25.
Sajantila, A. et al., 1995. Genes and languages in Europe: an analysis of mitochondrial

lineages. Genome Research, 5(1), pp.42–52.
Sajantila, A. et al., 1996. Paternal and maternal DNA lineages reveal a bottleneck in the founding of the Finnish population. Proceedings of the National Academy of Sciences of the United States of America, 93(21), pp.12035–12039.
Sajantila, A., 1998. A world wide survey on human specific Alu insertion polymorphisms. Conference Proceedings: Promega, (8), pp.2–3.
Sajantila, A. et al., 2010. Pharmacogenetics in a medico-legal context. Forensic Science International, 203(1-3), pp.44–52.
Sakaeda, T. et al., 2001. Pharmacokinetics of digoxin after single oral administration in healthy Japanese subjects. Pharmaceutical Research, 18(10), pp.1400–1404.
Sakaeda, T., Nakamura, T. & Okumura, K., 2002. MDR1 genotype-related pharmacokinetics and pharmacodynamics. Biological & Pharmaceutical Bulletin, 25(11), pp.1391–1400.
Salmela, E. et al., 2008. Genome-wide analysis of single nucleotide polymorphisms uncovers population structure in Northern Europe. PLoS ONE, 3(10).
Sanchez, J.J. et al., 2006. A multiplex assay with 52 single nucleotide polymorphisms for human identification. Electrophoresis, 27(9), pp.1713–1724.
Santos, N. et al., 2010. Assessing individual interethnic admixture and population substructure using a 48-insertion-deletion (InDel) ancestry-informative marker (AIM) panel, Human Mutation, 31 (2) 184–190.
Santos, F., Machado, H. & Silva, S., 2013. Forensic DNA databases in European countries: Is size linked to performance? Life Sciences, Society and Policy, 9(12), pp.1–13.
Sauer E. et al., 2017. Identification of organ tissue types and skin from forensic samples by microRNA expression analysis. Forensic Science International: Genetics, 28: 99-110.
Scheible, M. et al., 2014. Short tandem repeat typing on the 454 platform: Strategies and
considerations for targeted sequencing of common forensic markers. Forensic Science International: Genetics, 12, pp.107–119.
Schneider, P.M., 1997. Basic issues in forensic DNA typing. Forensic Science International, 88(1), pp.17–22.
Schneider, P.M. et al., 1998. Tandem repeat structure of the duplicated Y-chromosomal STR locus DYS385 and frequency studies in the German and three Asian populations. Forensic Science International, 97(1), pp.61–70.
Schneider, P.M. & Martin, P.D., 2001. Criminal DNA databases: The European situation. Forensic Science International, 119(2), pp.232–238.

Schneider, P.M., 2007a. Scientific standards for studies in forensic genetics. Forensic Science International, 165(2-3), pp.238–243.
Schneider, P.M., 2007b. The ISFG – an introduction. Forensic Science International Genetics,1(1):76, doi: 10.1016/j.fsigen.2006.10.006. Schneider, P.M., 2009. The ESS loci expansion of the European Standard Set of DNA
database loci — the current situation the ESS loci. Profiles in DNA, (7), pp.6–7.
Schuster, S.C. et al., 2010. Complete Khoisan and Bantu genomes from southern Africa. Nature, 463(7283), pp.943–947.
Shi, W. et al., 2010. A worldwide survey of human male demographic history based on Y-SNP and Y-STR data from the HGDP-CEPH populations. Molecular Biology and Evolution, 27(2), pp.385–393.
Shi, H. et al., 2013. Genetic evidence of an East Asian origin and Paleolithic northward migration of Y-chromosome haplogroup N. PLoS ONE, 8(6), pp.1–9.
Shriver, M.D. et al., 2003. Skin pigmentation, biogeographical ancestry and admixture mapping. Human Genetics, 112(4), pp.387–399.
Sijen T, 2015. Molecular approaches for forensic cell type identification: on mRNA, miRNA, DNA methylation and microbial markers. Forensic Science International: Genetics, 18: 21-31.
Singer, M.F., 1982. SINEs and LINEs: Highly repeated short and long interspersed sequences in mammalian genomes. Cell, 28(3), pp.433–434.
Single Nucleotide Polymorphism Database: dbSNP. https://www.ncbi.nlm.nih.gov/projects/SNP/.
Sirker M. et al., 2017. Evaluating the forensic application of 19 target microRNAs as biomarkers in body fluid and tissue identification. Forensic Science International: Genetics, 27:41-49. doi: 10.1016/j.fsigen.
Skaletsky, H. et al., 2003. The male-specific region of the human Y chromosome is a mosaic of discrete sequence classes. Nature, 423(6942), pp.825–837.
Soares, P. et al., 2009. Correcting for purifying selection: an improved human mitochondrial molecular clock. American Journal of Human Genetics, 84(6), pp.740–759.
Storå, J., 2000. Sealing and animal husbandry in the Ålandic Middle and Late Neolithic. Fennoscandia Archaeologica, 16, pp.57–81.
Sundell, T., 2014. The past hidden in our genes: Combining archaeological and genetic methodology: Prehistoric population bottlenecks in Finland. University of Helsinki Press.
Karttakeskus, 2007. Suomen historian kartasto. Gummerus Kirjapaino Oy, Jyväskylä.
Sutovsky, P. et al., 1999. Ubiquitin tag for sperm mitochondria. Nature, 402(6760),
pp.371–372.
Sykes, B. & Irven, C., 2000. Surnames and the Y chromosome. The American Journal of Human Genetics, 66(4), pp.1417–1419.
Szibor, R. et al., 2003. Use of X-linked markers for forensic purposes. International Journal of Legal Medicine, 117(2), pp.67–74.
Szibor, R., 2007. X-chromosomal markers: Past, present and future. Forensic Science International: Genetics, 1(2), pp.93–99.
Tallavaara, M., Pesonen, P. & Oinonen, M., 2010. Prehistoric population history in eastern Fennoscandia. Journal of Archaeological Science, 37(2), pp.251–260.
Tambets, K. et al., 2004. The western and eastern roots of the Saami -- the story of genetic “outliers” told by mitochondrial DNA and Y chromosomes. American Journal of Human Genetics, 74(4), pp.661–682.
Taylor, J., 2009. A brief history of forensic odontology and disaster victim identification practices in Australia. Journal of Forensic Odonto-Stomatology, 27(2), pp.64–74.
Tilastokeskus/ Statistics Finland, 2017. Finland’s preliminary population figure. http://www.stat.fi/til/vamuu/2017/02/vamuu_2017_02_2017-03-30_tie_001_en.html. Accessed 3.5.2017.
Tilastokeskus/Statistics Finland, 2015. Väestönkehitys vuosina 1749-2050. https://www.stat.fi/org/tilastokeskus/vaestonkehitys.html. Accessed 3.5.2017.
Tilford, C. et al., 2001. A physical map of the human Y chromosome. Nature, 409(6822), pp.943–945.
Tillmar, A.O. et al., 2008. Analysis of linkage and linkage disequilibrium for eight X-STR markers. Forensic Science International: Genetics, 3(1), pp.37–41.
Tillmar, A.O. & Mostad, P., 2014. Choosing supplementary markers in forensic casework. Forensic Science International: Genetics, 13, pp.128–133.
Torroni, A. et al., 1993. Asian affinities and continental radiation of the 4 founding native-American mtDNAs. American Journal of Human Genetics, 53(3), pp.563–590.
Trombetta, B. et al., 2015. Regional differences in the accumulation of SNPs on the male-specific portion of the human Y chromosome replicate autosomal patterns: Implications for genetic dating. PLoS ONE, 10(7), pp.1–18.
UK National DNA Database (NDNAD) Statistics. https://www.gov.uk/government/statistics/national-dna-database-statistics. Accessed 3.5.2017.
Underhill, P.A. et al., 1997. Detection of numerous Y chromosome biallelic
polymorphisms by denaturing high-performance liquid chromatography. Genome Research, 7(10), pp.996–1005.
Underhill, P. A. et al., 2001. The phylogeography of Y chromosome binary haplotypes and the origins of modern human populations. Annals of Human Genetics, 65, pp.43–62.
Underhill, P. A. & Kivisild, T., 2007. Use of Y chromosome and mitochondrial DNA population structure in tracing human migrations. Annual Review of Genetics, 41, pp.539–564.
Walsh, S. et al., 2011. IrisPlex: A sensitive DNA tool for accurate prediction of blue and brown eye colour in the absence of ancestry information. Forensic Science International: Genetics, 5(3), pp.170–180.
Walsh, S. et al., 2012. DNA-based eye colour prediction across Europe with the IrisPlex system. Forensic Science International: Genetics, 6(3), pp.330–340.
Walsh, S. et al., 2013. The HIrisPlex system for simultaneous prediction of hair and eye colour from DNA. Forensic Science International: Genetics, 7(1), pp.98–115.
Walsh, S. et al., 2014. Developmental validation of the HIrisPlex system: DNA-based eye and hair colour prediction for forensic and anthropological usage. Forensic Science International: Genetics, 9(1), pp.150–161.
Warren W. C. et al, 2008. Genome analysis of the platypus reveals unique signatures of evolution. Nature, 453, 175-183.
Weber, J.L. et al., 2002. Human diallelic insertion / deletion polymorphisms. American Journal of Human Genetics, 71(4), pp.854–862.
Wei, W. et al., 2013. A calibrated human Y-chromosomal phylogeny based on resequencing. Genome Research, 23(2), pp.388–395.
Werrett, D.J., 1997. The National DNA Database. Forensic Science International. pp. 33–42.
Westerholm, J., 2002. Populating Finland. Fennia, 180(1-2), pp.123–140.
White P.S. et al., 1999. New, male-specific microsatellite markers from the human Y chromosome, Genomics 57, 433–437.
Willuweit, S. & Roewer, L., 2007. Y chromosome haplotype reference database (YHRD):
Update. Forensic Science International: Genetics, 1(2), pp.83–87.
Willuweit, S. & Roewer, L., 2015. The new Y chromosome haplotype reference database. Forensic Science International: Genetics, 15, pp.43–48.
Witt & Erickson, 1989. A rapid method for detection of Y-chromosomal DNA from dried blood specimens by the polymerase chain reaction. Human Genetics, 82: 271-274.
Wyman, A. R. & R. White, 1980. A highly polymorphic locus in human DNA. Proceedings of the National Academy of Sciences USA, 77: 6754-6758.
Xue Y. et al., 2009. Human Y chromosome base-substitution mutation rate measured by direct sequencing in a deep-rooting pedigree. Current Biology, 2009, 19:1453-1457.
Zerjal, T. et al., 1997. Genetic relationships of Asians and Northern Europeans, revealed by Y-chromosomal DNA analysis. American Journal of Human Genetics, 60(5), pp.1174–1183.
Zerjal T. et al., 2001. Geographical, linguistic, and cultural influences on genetic diversity: Y-chromosomal distribution in Northern European populations. Molecular Biology and Evolution, 18(6):1077-87.
Zidkova, A. et al., 2013. Application of the new insertion-deletion polymorphism kit for
forensic identification and parentage testing on the Czech population. International Journal of Legal Medicine, 127(1), pp.7–10.
Zietkiewicz, E. et al., 2012. Current genetic methodologies in the identification of disaster victims and in forensic analysis. Journal of Applied Genetics, 53(1), pp.41–60.
Zubakov, D. et al., 2008. Stable RNA markers for identification of blood and saliva stains revealed from whole genome expression analysis of time-wise degraded samples. International Journal of Legal Medicine, 122(2), pp.135–142.
Zubakov, D. et al., 2009. New markers for old stains: Stable mRNA markers for blood and saliva identification from up to 16-year-old stains. International Journal of Legal Medicine, 123(1), pp.71–74.
Zubakov, D. et al., 2010. Estimating human age from T-cell DNA rearrangements. Current Biology, 20(22), pp.R970–R971.
Zubakov, D. et al., 2016. Human age estimation from blood using mRNA, DNA, methylation, DNA rearrangement, and telomere length, Forensic Science International: Genetics, 24, 33–43
1000 Genomes Project Consortium et al., 2010. A map of human genome variation from population-scale sequencing. Nature, 467(7319), pp.1061–1073.
1000Genomes. http://www.1000genomes.org/. Accessed 3.5.2017.

APPENDIX I PRIMERS: STUDY I
Assay Primer/Probe Sequence Tat (T C) Forward primer CTTTGTCATTGATATGAAATATTGCCA Reverse primer TTACCCTTCTCTCTTGCTGTGCTC Consensus CTCTGAGTGTAGACTTGTGAATTCA[C/T]GTTGTTTTAATTTAATATTTCAGAG M178 (C T) Forward primer GCAGAGACTCCGAAAGTC Reverse primer CCCTGTCCCTGAATGAAA L550 (C T) Forward primer CTTATCCCAAGCAGCAGC
Reverse primer CACAGCTTTCTGCATGGC
L22 (A C) Forward primer CTCTTCTTTCTAGAATTGTGG Reverse primer CTGCCAGTCTCCAAGTTCTCTA L258(G A) L300 (T C) Forward primer ATACTCAGCTACACATCTCTTA Reverse primer GTCTGTATCTGGATAAGCGCTA
STUDY II
Name Forward primer Reverse Primer DYS460 GAGGAATCTGACACCTCTGACA TCCATATCATCTATCCTCTGCCTA DYS612 CCCCCATGCCAGTAAGAATA TGAGGGAAGGCAAAAGAAAA DYS449 TGGAGTCTCTCAAGCCTGTTC TTGCACCATTGCACTCTAGG DYS576 TTGGGCTGAGGAGTTCAATC GGCAGTCTCATTTCCTGGAG DYS522 CCTTTGAAATCATTCATAATGC TCATAAACAGAGGGTTCTGG DYS505 TCTGGCGAAGTAACCCAAAC TCGAGTCAGTTCACCAGAAGG DYS627 CTAGGTGACAGCGCAGGATT GGATAATGAGCAAATGGCAAG
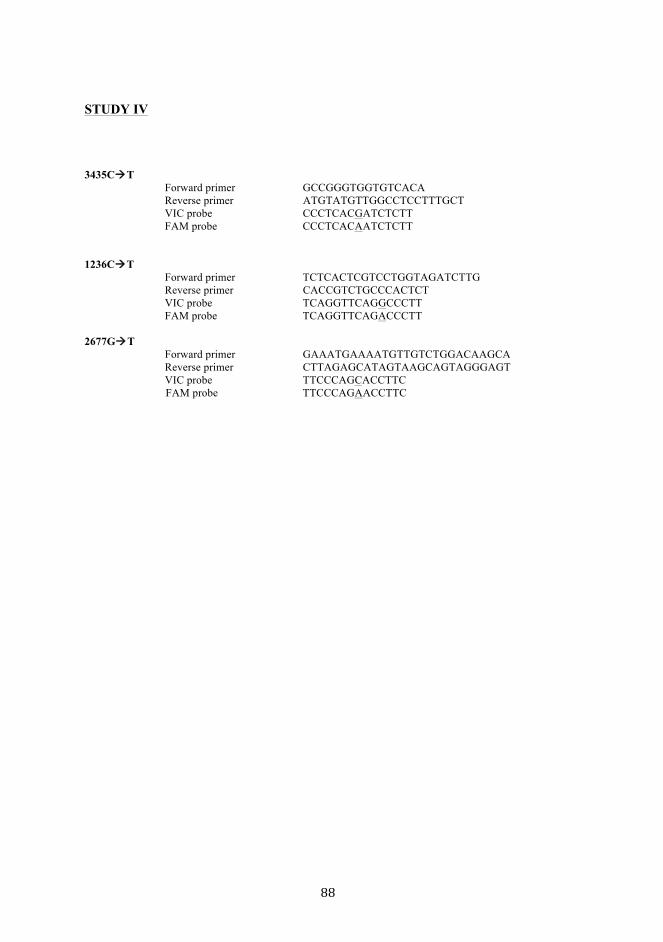
STUDY IV
3435C T
Forward primer GCCGGGTGGTGTCACA Reverse primer ATGTATGTTGGCCTCCTTTGCT VIC probe CCCTCACGATCTCTT FAM probe CCCTCACAATCTCTT
1236C T Forward primer TCTCACTCGTCCTGGTAGATCTTG Reverse primer CACCGTCTGCCCACTCT VIC probe TCAGGTTCAGGCCCTT FAM probe TCAGGTTCAGACCCTT
2677G T
Forward primer GAAATGAAAATGTTGTCTGGACAAGCA Reverse primer CTTAGAGCATAGTAAGCAGTAGGGAGT VIC probe TTCCCAGCACCTTC
FAM probe TTCCCAGAACCTTC
APPENDIX II AMPLIFICATION PROTOCOLS: Study I: Y-SNP RT-PCR: Cycling conditions consisted of a 10-min activation at 95°C, denaturing at 95°C for 15 s, and extension for 1 min at 60°C for 40 cycles. Y-SNP Sequencing1: Cycling conditions consisted of a 7-minute denaturation step at 95oC, followed by annealing and extension at 56oC and 68oC respectively for 33 cycles. Some sequences required a lower annealing temperature at 51.7oC. Y-SNP Sequencing2: denaturation at 96oC, annealing at 50oC and extension at 60oC for 26 cycles. Single nucleotide polymorphism Tat (M46, P105; subhaplogroup N1c1) was genotyped using Real Time PCR with Taqman SNP Genotyping Master Mix, with one custom-ordered Genotyping Assay (rs34442126) including sequence-specific primers from Applied Biosystems/Thermo-Fisher Scientific (Foster City, CA). The 40x commercial assay was diluted to 20x concentration with 1xTE buffer. A half-volume reaction of Taqman Master Mix and 20x SNP Assay with 5.625 uL of DNA was used with total run volume 13 uL. Cycling conditions consisted of a 10-min activation at 95°C, denaturing at 95°C for 15 s, and extension for 1 min at 60°C for 40 cycles. Genotyping for subhaplogroups N1c1a (single nucleotide polymorphism M178), N1c1a1a1 (L550), I1a2 (L22), I1a2c1 (L258), and I1a2d (L300) was performed with sequencing, with amplification conducted using 10x PCR buffer II (Applied Biosystems, Foster City, CA, USA), 1.5 mM MgCl2 (Promega, Biofellows), 200 μM dNTPs (Biofellows, Helsinki, Finland), 2.5 units AmpliTaq Gold polymerase (Applied Biosystems), 6.5 μg bovine serum albumin (Fermentas, Burlington, Canada), and primer pairs of 0.2 uM concentration. Template DNA was added to this master mix in a 1μL volume, containing approximately 10 μg of genomic DNA. The thermal cycler (BioRad Dyad Peltier) program employed for Finnish samples was carried out with a 7-minute denaturation step at 95oC, followed by annealing and extension at 56oC and 68oC respectively for 33 cycles. Some sequences required a lower annealing temperature at 51.7oC. Study II: 7-minute denaturation step at 95oC, followed by annealing and extension at 56oC and 68oC respectively for 33 cycles. Storage temperature rested at 4oC. Conclusive trials were conducted using 10x PCR buffer II (Applied Biosystems, Foster City, CA, USA), 1.5 mM MgCl2 (Applied Biosystems), 200 μM dNTPs (Biofellows, Helsinki, Finland), 2.5 units AmpliTaq Gold polymerase (Applied Biosystems), 6.5 μg bovine serum albumin (Fermentas, Burlington, Canada), and primer pairs in the following concentrations: 0.4 μM DYS449, 0.2 μM DYS460, 0.2 μM DYS505, 0.6 μM DYS522, 0.2 μM DYS576, 0.2 μM DYS612, and 0.4 μM DYS627. Template DNA was added to this master mix in a 1μL volume, containing approximately 10 μg of genomic DNA. The thermal cycler (BioRad Dyad Peltier) program employed for Finnish samples was carried out with a 7-minute denaturation step at 95oC, followed by annealing and extension at 56oC and 68oC respectively for 33 cycles. Storage temperature rested at 4oC. Study III: A thermal cycler (BioRad Dyad Peltier) was used for amplification, with 25 cycles of denaturing 94 oC 4 min 30 sec, annealing 61 oC 2 min, extension 72 oC 1 min 15 sec. (Elongation 68 oC 60 min.) A master mix was prepared according to Qiagen DIPplex manual instructions. The polymerization enzyme employed was JumpStart TAQ (Sigma-Aldrich). Template DNA was added to this master mix in a 1μL volume, containing approximately 10 μg of genomic DNA. Study IV: RT-PCR protocol consisted of 10 min. hold at 95oC for AmpliTaq Gold Enzyme activation, followed by denaturation at 92oC for 15 seconds and annealing/extension at 60oC for 1 minute, for 40 cycles.