Embed Size (px)
Citation preview
1
Q4 and Annual 2010 Earnings Release February 16, 2011
Finning reports solid fourth quarter results and expects growth in 2011
Q4 AND ANNUAL 2010 HIGHLIGHTS (from continuing operations)
Q4 Basic EPS of $0.29 was up 123% from Q4 2009 and included an impairment charge on investments of $0.04 per share.
Q4 EBIT of $79 million almost doubled from Q4 2009 and was in line with expectations
EBIT margin improved to 5.8% in Q4 2010 from 3.7% in Q4 2009 due to EBIT recovery in Canada
The Company generated $265 million in free cash flow in 2010, exceeding its target of $200 million. The net debt to total capital ratio was 33%, down from 39% at December 2009.
Vancouver, B.C. – Finning International Inc. (TSX: FTT) reported solid Q4 2010 results, which were in line with the Company‘s expectations and its positive medium-term outlook. Finning achieved Q4 2010 revenues of $1.4 billion, a 26% increase from Q4 2009. Earnings before interest and income taxes (EBIT) of $79 million doubled from Q4 2009 and EBIT margin of 5.8% was significantly higher than 3.7% in Q4 2009. The stronger results were primarily driven by improved profitability in Canada. Basic earnings per share (EPS) grew by 123% to $0.29 and included an impairment charge on investments of $0.04 per share and IT system implementation costs of $0.03 per share ($0.02 per share in Q4 2009).
For the full year 2010, Finning‘s revenues increased by 4% from 2009 to $4.6 billion, driven by record product support activity. Modestly higher annual revenues combined with higher gross margins and a streamlined cost structure resulted in improved operating leverage and an 11% increase in EBIT from 2009 to $275 million. EBIT margin improved to 5.9% from 5.5% in 2009. Basic EPS grew by 9% to $1.00 and included non-operational charges of $0.21 per share ($0.08 per share in 2009).
In May 2010, the Company completed the strategic realignment of its UK operations by selling Hewden, its UK rental business. This transaction resulted in an after-tax loss of $244 million or $1.43 per share. As a result, the total 2010 basic loss per share was $0.46 compared to $0.77 earnings per share in 2009. The results of operations of Hewden have been reclassified as discontinued operations for periods prior to sale. All numbers in this earnings release are from continuing operations and exclude the results of Hewden, including the loss on sale. The sale of Hewden positions our core UK dealership business for future success.
―The fourth quarter results were in line with expectations and provided a solid finish to a successful year. Free cash flow totaled $265 million for the year exceeding our target. Since the fourth quarter of 2008, the beginning of the recession, the Company has generated over $900 million in free cash flow, significantly strengthening the balance sheet,‖ said Mike Waites, president and CEO of Finning International Inc. ―We are well positioned to capitalize on growth opportunities. We expect good top line growth in 2011 and beyond, reflecting robust commodity markets. And we are continuing to invest in our product line up and service capability to support customer demand. I am confident that we will drive margin expansion and achieve our EBIT growth projections.‖
Order activity continued to be strong in the fourth quarter resulting in a consolidated order backlog of $1.3 billion, 6% higher than at September 30, 2010. Led by mining and a continued increase in new orders from the construction sector, the consolidated backlog increased in each consecutive quarter in 2010 and more than doubled from the end of 2009. The significantly higher backlog in each operation provides improved visibility into 2011 and beyond and supports the Company‘s expectation for a strong medium-term outlook.
Consolidated revenues are projected to grow on average at 10 percent per annum over the next three years. In 2011, mining deliveries are scheduled towards the latter part of the year, which are expected to drive stronger results in the second half.
Consolidated earnings growth is forecast to outpace revenue growth. The Company expects to make ongoing progress towards achieving a 10 percent consolidated EBIT margin in the medium term.
Finning International Inc. Annual 2010 Results
2
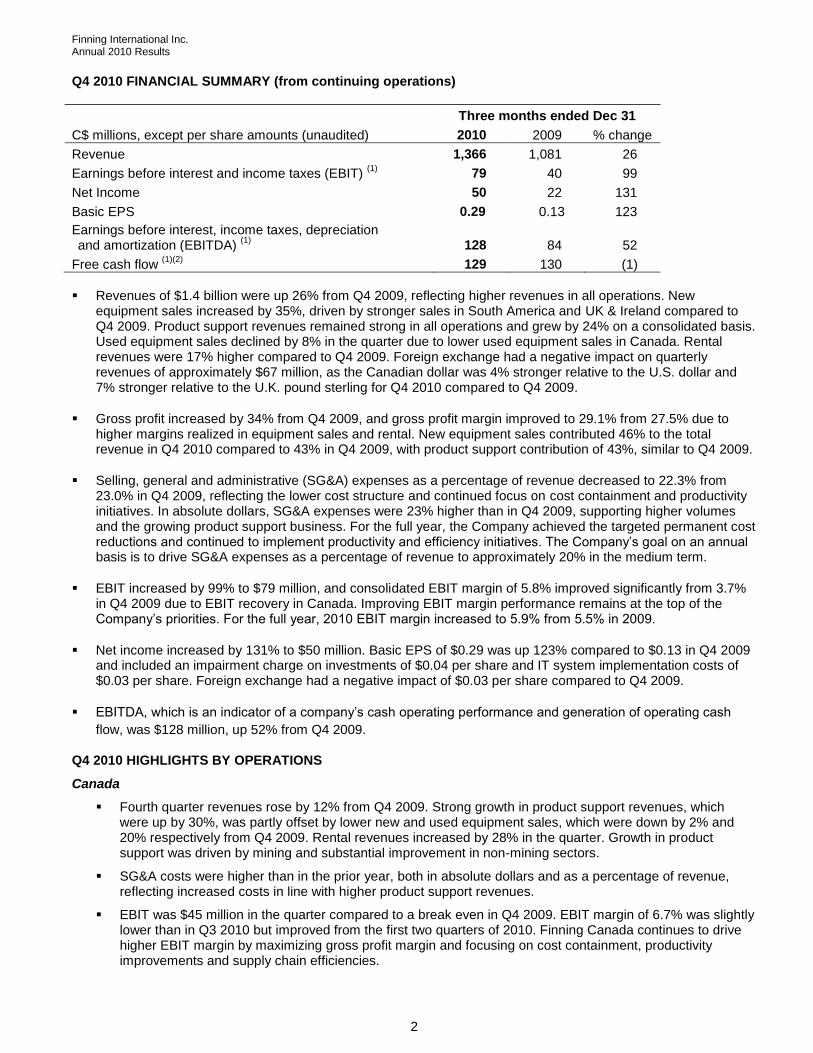
Q4 2010 FINANCIAL SUMMARY (from continuing operations)
Three months ended Dec 31
C$ millions, except per share amounts (unaudited) 2010 2009 % change
Revenue 1,366 1,081 26
Earnings before interest and income taxes (EBIT) (1)
79 40 99
Net Income 50 22 131
Basic EPS 0.29 0.13 123
Earnings before interest, income taxes, depreciation and amortization (EBITDA)
(1)
128
84
52
Free cash flow (1)(2)
129 130 (1)
Revenues of $1.4 billion were up 26% from Q4 2009, reflecting higher revenues in all operations. New
equipment sales increased by 35%, driven by stronger sales in South America and UK & Ireland compared to Q4 2009. Product support revenues remained strong in all operations and grew by 24% on a consolidated basis. Used equipment sales declined by 8% in the quarter due to lower used equipment sales in Canada. Rental revenues were 17% higher compared to Q4 2009. Foreign exchange had a negative impact on quarterly revenues of approximately $67 million, as the Canadian dollar was 4% stronger relative to the U.S. dollar and 7% stronger relative to the U.K. pound sterling for Q4 2010 compared to Q4 2009.
Gross profit increased by 34% from Q4 2009, and gross profit margin improved to 29.1% from 27.5% due to higher margins realized in equipment sales and rental. New equipment sales contributed 46% to the total revenue in Q4 2010 compared to 43% in Q4 2009, with product support contribution of 43%, similar to Q4 2009.
Selling, general and administrative (SG&A) expenses as a percentage of revenue decreased to 22.3% from 23.0% in Q4 2009, reflecting the lower cost structure and continued focus on cost containment and productivity initiatives. In absolute dollars, SG&A expenses were 23% higher than in Q4 2009, supporting higher volumes and the growing product support business. For the full year, the Company achieved the targeted permanent cost reductions and continued to implement productivity and efficiency initiatives. The Company‘s goal on an annual basis is to drive SG&A expenses as a percentage of revenue to approximately 20% in the medium term.
EBIT increased by 99% to $79 million, and consolidated EBIT margin of 5.8% improved significantly from 3.7% in Q4 2009 due to EBIT recovery in Canada. Improving EBIT margin performance remains at the top of the Company‘s priorities. For the full year, 2010 EBIT margin increased to 5.9% from 5.5% in 2009.
Net income increased by 131% to $50 million. Basic EPS of $0.29 was up 123% compared to $0.13 in Q4 2009 and included an impairment charge on investments of $0.04 per share and IT system implementation costs of $0.03 per share. Foreign exchange had a negative impact of $0.03 per share compared to Q4 2009.
EBITDA, which is an indicator of a company‘s cash operating performance and generation of operating cash
flow, was $128 million, up 52% from Q4 2009.
Q4 2010 HIGHLIGHTS BY OPERATIONS
Canada
Fourth quarter revenues rose by 12% from Q4 2009. Strong growth in product support revenues, which were up by 30%, was partly offset by lower new and used equipment sales, which were down by 2% and 20% respectively from Q4 2009. Rental revenues increased by 28% in the quarter. Growth in product support was driven by mining and substantial improvement in non-mining sectors.
SG&A costs were higher than in the prior year, both in absolute dollars and as a percentage of revenue, reflecting increased costs in line with higher product support revenues.
EBIT was $45 million in the quarter compared to a break even in Q4 2009. EBIT margin of 6.7% was slightly lower than in Q3 2010 but improved from the first two quarters of 2010. Finning Canada continues to drive higher EBIT margin by maximizing gross profit margin and focusing on cost containment, productivity improvements and supply chain efficiencies.

Finning International Inc. Annual 2010 Results
3
Order activity remained very solid in Q4 2010 and is expected to continue to increase in 2011 as market conditions are expected to remain favorable in all sectors.
South America
Fourth quarter revenues reached a new record. They increased by 50% from Q4 2009 and were driven by strong new equipment sales and continued growth in product support revenues. In functional currency (USD), quarterly revenues were up 57% from Q4 2009. In functional currency, new equipment sales almost doubled in the quarter due to mining deliveries and increased demand from the construction sector in Chile and Argentina. Product support revenues continued to grow at a solid rate, and increased by 27% in functional currency.
SG&A costs declined as a percentage of revenue compared to Q4 2009 but increased in absolute dollars in line with higher volumes. The Company is incurring higher people costs as many technicians are being recruited and trained to meet current and anticipated customer demand driven by large investments in mining projects in Chile.
EBIT of $40 million increased by 22% from Q4 2009 and was 28% higher in functional currency. New equipment sales accounted for 51% of the total revenue compared to 40% in Q4 2009, reflecting a higher volume of large mining equipment sales. The shift in revenue mix and people costs to meet future growth resulted in an EBIT margin of 7.8%, down from 9.6% in Q4 2009. This decline is expected to be temporary with EBIT margin returning to more normal levels in 2011.
Order intake from mining and construction customers continued to be strong in Q4 2010. Large investments in mining projects and in infrastructure and energy continue to support a strong outlook for South American operations.
United Kingdom and Ireland (continuing operations)
Quarterly revenues were up 33% from Q4 2009. In functional currency (GBP), quarterly revenues increased by 44%, driven by an 83% increase in new equipment sales and 15% higher product support revenues compared to Q4 2009. Stronger quarterly revenues reflected improved demand from coal mining, quarrying and heavy construction customers, as well as additional revenues from the Irish operations.
EBIT was $5 million compared to $6 million in Q4 2009. EBIT margin was 2.4% in the quarter, compared to 4.2% in Q4 2009. Gross profit margin was lower in Q4 2010 due to the shift in revenue mix to more new equipment sales, which contributed 61% to total revenue compared to 48% in Q4 2009. SG&A expenses as a percentage of revenue declined from Q4 2009. EBIT margin is expected to improve in 2011 with higher revenues and a lower SG&A percentage.
Order intake increased in the quarter compared to Q3 2010. The outlook for the coal mining, quarrying, waste management and plant hire sectors remains positive, while the impact of the Government proposed spending cuts on other sectors is uncertain.
CORPORATE AND BUSINESS DEVELOPMENTS
Executive Appointment On December 16, 2010, Finning announced the appointment of Rebecca Schalm to the position of Senior Vice President, Human Resources, effective January 17, 2011. Ms. Schalm will be responsible for providing leadership and oversight to Finning‘s global efforts to build on the talents of its employees to achieve the Company‘s strategic objectives. Ms. Schalm‘s extensive experience includes providing consulting services in the areas of executive selection, integration and leadership development, succession and talent management, and senior team development. Ms. Schalm earned a Ph.D. in Industrial/Organizational Psychology from the University of Guelph.
Dividend The Board of Directors approved a quarterly dividend at $0.12 per common share, payable on March 18, 2011, to shareholders of record on March 4, 2011. This dividend will be considered an eligible dividend for Canadian income tax purposes.

Finning International Inc. Annual 2010 Results
4
SELECTED CONSOLIDATED FINANCIAL INFORMATION: Q4 AND ANNUAL 2010 (from continuing operations unless otherwise stated, C$ millions, except per share amounts)
Three months ended Dec 31 Twelve months ended Dec 31
Revenue 2010 2009 % change 2010 2009 % change
New equipment 633.9 469.9 35 1,940.6 1,983.8 (2)
Used equipment 61.1 66.2 (8) 272.4 290.2 (6)
Equipment rental 84.6 72.2 17 299.9 310.2 (3)
Product support 583.1 469.0 24 2,117.7 1,883.7 12
Other 3.6 3.5 3 10.7 12.0 (11)
Total revenue 1,366.3 1,080.8 26 4,641.3 4,479.9 4
Gross profit 397.9 297.2 34 1,385.2 1,288.2 8
Gross profit margin(3)
29.1% 27.5% 29.8% 28.8%
SG&A (304.4) (248.2) (23) (1,069.6) (1,007.6) (6)
SG&A as a percentage of revenue (22.3)% (23.0)% (23.0)% (22.5)%
Other expenses (14.4) (9.3) (55) (40.6) (33.7) (20)
EBIT(1)
79.1 39.7 99 275.0 246.9 11
EBIT margin(4)
5.8% 3.7% 5.9% 5.5%
Income from continuing operations 50.1 21.7 131 170.7 156.7 9
Loss from discontinued operations, net of tax - (5.4) (249.1) (25.9)
Net income (loss) 50.1 16.3 (78.4) 130.8
Basic earnings (loss) per share (EPS)
from continuing operations 0.29 0.13 123 1.00 0.92 9
from discontinued operations - (0.03) (1.46) (0.15)
Total basic earnings (loss) per share 0.29 0.10 (0.46) 0.77
EBITDA(1)
128.0 84.2 52 450.7 442.4 2
Free Cash Flow*(1) (2)
129.0 130.4 (1) 264.9 493.9 (46)
Dec 31, 10 Dec 31, 09
Total assets* 3,613.6 3,671.4
Total shareholders‘ equity* 1,386.6 1,515.7
Net debt to total capital(5)
* 33.0% 39.3%
* Free cash flow and assets from Hewden have been included in the figures for periods prior to the sale.

Finning International Inc. Annual 2010 Results
5
Q4 2010 RESULTS INVESTOR CALL Management will hold an investor conference call on Thursday, February 17 at 11:00 am Eastern Time. Dial-in numbers: 1-866-223-7781 (anywhere within Canada and the U.S.) or (416) 340-8018 (for participants dialing from Toronto and overseas). The call will be webcast live and subsequently archived at www.finning.com. Playback recording will be available at 1-800-408-3053 from 1:00 pm Eastern Time on February 17 until February 24. The pass code to access the playback recording is 4463383 followed by the number sign. ANNUAL GENERAL MEETING – MAY 11, 2011 Finning International‘s Annual General Meeting will be held at the Terminal City Club, 837 West Hastings Street, Vancouver, British Columbia on May 11, 2011 at 2 pm Pacific Time.
ABOUT FINNING Finning International Inc. (TSX: FTT) is the world‘s largest Caterpillar equipment dealer delivering unrivalled service to customers since 1933. Finning sells, rents and services equipment and engines to help customers maximize productivity. Headquartered in Vancouver, B.C., the Company operates in western Canada, Chile, Argentina, Bolivia, Uruguay, as well as in the United Kingdom and Ireland.
CONTACT INFORMATION
Mauk Breukels Director, Investor Relations and Corporate Affairs Phone: (604) 331-4934 Email: [email protected] www.finning.com
Footnotes
(1) These amounts do not have a standardized meaning under generally accepted accounting principles. For a reconciliation of these amounts to net income and cash flow from operating activities, see the heading ―Description of Non-GAAP Measures‖ in the Company‘s management discussion and analysis that accompanies the fourth quarter and annual consolidated financial statements.
(2) Free cash flow is defined as cash flow provided by (used in) operating activities less net capital expenditures.
(3) Gross profit margin is defined as gross profit as a percentage of total revenue.
(4) EBIT margin is defined as earnings before interest and income taxes as a percentage of total revenue.
(5) Net debt to total capital ratio is calculated as short-term debt and long-term debt, net of cash and cash equivalents (net debt) divided by total capitalization. Total capitalization is defined as the sum of net debt and all components of equity (share capital, contributed surplus, accumulated other comprehensive loss, and retained earnings).

Finning International Inc. Annual 2010 Results
6
Forward-Looking Disclaimer
This report contains statements about the Company‘s business outlook, objectives, plans, strategic priorities and other statements that are not historical facts. A statement we make is forward-looking when it uses what we know and expect today to make a statement about the future. Forward-looking statements may include words such as aim, anticipate, assumption, believe, could, expect, goal, guidance, intend, may, objective, outlook, plan, project, seek, should, strategy, strive, target, and will. Forward-looking statements in this report include, but are not limited to, statements with respect to: expectations with respect to the economy and associated impact on the Company‘s financial results; the estimated annualized cost savings and anticipated restructuring charges related to actions taken by the Company in response to the economic downturn; expected revenue levels and EBIT growth; anticipated generation of free cash flow (including projected net capital and rental expenditures), and its expected use; anticipated defined benefit plan contributions; and expected target range of Debt Ratio; and the expected quantitative impact on the consolidated statement of financial position of the Company‘s transition to IFRS at January 1, 2010. All such forward-looking statements are made pursuant to the ‗safe harbour‘ provisions of applicable Canadian securities laws.
Unless otherwise indicated by us, forward-looking statements in this report describe our expectations at February 16, 2011. Except as may be required by Canadian securities laws, we do not undertake any obligation to update or revise any forward-looking statement, whether as a result of new information, future events, or otherwise.
Forward-looking statements, by their very nature, are subject to numerous risks and uncertainties and are based on several assumptions which give rise to the possibility that actual results could differ materially from our expectations expressed in or implied by such forward-looking statements and that our business outlook, objectives, plans, strategic priorities and other statements that are not historical facts may not be achieved. As a result, we cannot guarantee that any forward-looking statement will materialize. Factors that could cause actual results or events to differ materially from those expressed in or implied by our forward-looking statements include: general economic and credit market conditions; foreign exchange rates; commodity prices; the level of customer confidence and spending, and the demand for, and prices of, our products and services; our dependence on the continued market acceptance of Caterpillar‘s products and Caterpillar‘s timely supply of parts and equipment; our ability to continue to implement our cost reduction initiatives while continuing to maintain customer service; our ability to control cost pressures as growth in revenues occur; our ability to attract sufficient skilled labour resources to meet growing product support demand; the intensity of competitive activity; our ability to raise the capital we need to implement our business plan; regulatory initiatives or proceedings, litigation and changes in laws or regulations; stock market volatility; changes in political and economic environments for operations; new or amended IFRS or interpretations that become effective prior to the inclusion of the Company‘s financial statement of position in its first annual audited IFRS financial statements. Forward-looking statements are provided in this report for the purpose of giving information about management‘s current expectations and plans and allowing investors and others to get a better understanding of our operating environment. However, readers are cautioned that it may not be appropriate to use such forward-looking statements for any other purpose.
Forward-looking statements made in this report are based on a number of assumptions that we believed were reasonable on the day we made the forward-looking statements. Refer in particular to the Market Outlook section of the MD&A. Some of the assumptions, risks, and other factors which could cause results to differ materially from those expressed in the forward-looking statements contained in this report are discussed in the Company‘s current Annual Information Form (AIF) in Section 4.
We caution readers that the risks described in the AIF are not the only ones that could impact us. Additional risks and uncertainties not currently known to us or that we currently deem to be immaterial may also have a material adverse effect on our business, financial condition, or results of operations.
Except as otherwise indicated by us, forward-looking statements do not reflect the potential impact of any non-recurring or other unusual items or of any dispositions, mergers, acquisitions, other business combinations or other transactions that may be announced or that may occur after the date hereof. The financial impact of these transactions and non-recurring and other unusual items can be complex and depends on the facts particular to each of them. We therefore cannot describe the expected impact in a meaningful way or in the same way we present known risks affecting our business.
- end -

Finning International Inc. Annual 2010 Results
7
MANAGEMENT‘S DISCUSSION AND ANALYSIS
This discussion and analysis of the financial results of Finning International Inc. (Finning or the Company) should be read in conjunction with the consolidated financial statements and accompanying notes. The results reported herein have been prepared in accordance with Canadian generally accepted accounting principles (GAAP) and are presented in Canadian dollars unless otherwise stated. Additional information relating to the Company, including its current Annual Information Form (AIF), can be found on the SEDAR (System for Electronic Document Analysis and Retrieval) website at www.sedar.com.
Results of Operations
The results from continuing operations described in this Management‘s Discussion and Analysis (MD&A) include those of acquired businesses from the date of their purchase and exclude results from operations that have been disposed or are classified as discontinued. Results of operations from businesses that qualified as discontinued operations have been reclassified to that category for all periods presented unless otherwise noted.
In August 2010, Finning was appointed the Caterpillar Inc. (Caterpillar) dealer for Northern Ireland and the Republic of Ireland. The Company acquired the business by purchasing certain assets, comprising inventory, a building, and other fixed assets in Northern Ireland and the Republic of Ireland.
Following an extensive strategic review, on May 5, 2010 the Company sold Hewden Stuart plc (Hewden), its UK equipment rental business, for an after-tax loss of $244.1 million or $1.43 per share. The results of operations of Hewden for the periods up to May 5, 2010 have been reclassified as discontinued operations in the consolidated statements of income and cash flow. The assets and liabilities of Hewden in the balance sheet for periods prior to the date of disposition have been presented separately.
Please see the section entitled ―Discontinued Operations – Hewden‖ for a discussion of these operations.
Fourth Quarter Overview
Q4 2010 Q4 2009 Q4 2010 Q4 2009
($ millions) (% of revenue)
Revenue $ 1,366.3 $ 1,080.8
Gross profit 397.9 297.2 29.1% 27.5%
Selling, general & administrative expenses (304.4) (248.2) (22.3)% (23.0)%
Other expenses (14.4) (9.3) (1.0)% (0.8)%
Earnings from continuing operations before interest and income taxes (EBIT)
(1) 79.1 39.7 5.8% 3.7%
Finance costs (12.8) (16.9) (0.9)% (1.6)%
Provision for income taxes (16.2) (1.1) (1.2)% (0.1)%
Income from continuing operations $ 50.1 $ 21.7 3.7% 2.0%
Loss from discontinued operations, net of tax (3)
— (5.4) — (0.5)%
Net income $ 50.1 $ 16.3 3.7% 1.5%
Basic earnings (loss) per share (EPS)
from continuing operations $ 0.29 $ 0.13
from discontinued operations (3)
$ — $ (0.03)
Total basic earnings per share $ 0.29 $ 0.10
Earnings from continuing operations before interest, taxes, depreciation, and amortization (EBITDA)
(1) $ 128.0 $ 84.2 9.4% 7.8%
Free Cash Flow (1) (2)
$ 129.0 $ 130.4
(1) These amounts do not have a standardized meaning under generally accepted accounting principles. For a reconciliation of these amounts to
net income and cash flow from operating activities, see the heading ―Description of Non-GAAP Measures‖ below.
(2) Free Cash Flow is defined as cash provided by (used in) operating activities less net capital expenditures.
(3) On May 5, 2010, the Company sold Hewden, its UK equipment rental business. As a consequence, the results of operations of Hewden have
been reclassified as discontinued operations for all periods presented.

Finning International Inc. Annual 2010 Results
8
Revenue from Continuing Operations ($ millions) Three months ended December 31
Fourth quarter consolidated revenues of $1.4 billion were up 26.4% from the comparable quarter in 2009, with higher revenues contributed by all operations, but most significantly from the Company‘s South American and Canadian operations.
Foreign exchange had a negative impact on revenues of approximately $67 million (or 5%) due to the 4.1% stronger Canadian dollar relative to the U.S. dollar and the 7.2% stronger Canadian dollar relative to the U.K. pound sterling for the three months ended December 31, 2010 compared to the same period last year.
601.8
337.0
142.0
189.0
505.7
671.6
0
400
800
Canada South
America
UK &
Ireland
2009 2010
Revenues from the Company‘s Canadian operations increased 11.6% in the fourth quarter of 2010 compared with the same period last year, largely due to significant growth in product support (30.3% higher than the comparative period in 2009). Growth in product support revenues was primarily driven by the mining sector but there was substantial improvement in non-mining sectors as well. The Canadian operations‘ new equipment sales were slightly lower than the fourth quarter of 2009, but were slightly higher when adjusting for the negative impact of foreign exchange, and reflected higher deliveries due to increased demand in the mining and non-mining sectors.
Revenues from the Company‘s operations in South America increased 50.1% compared to the fourth quarter of 2009. Excluding the negative impact of translating the results of the South American operations with a stronger Canadian dollar, revenues for the fourth quarter of 2010 in functional currency (the U.S. dollar) were at record levels and increased by 56.5% over the fourth quarter of 2009. This was driven mainly by strong new equipment sales (almost double the sales recorded in the fourth quarter of 2009) with higher mining deliveries and increased demand from the construction sector in Chile and Argentina. Product support revenues continued to show solid growth, and were 26.6% higher than the fourth quarter of 2009, up in all sectors but most significantly in mining.
Revenues from the UK and Ireland operations were up 33.1% over the fourth quarter of 2009, and were up 43.6% in local currency. This increase was largely due to considerably higher new equipment sales (up 83.0% in local currency), up in all sectors but most significantly in construction and mining. Product support revenues were 15.4% higher (in local currency) than the same quarter last year, most notably in the coal and quarrying sectors.
Revenue by Line of Business from Continuing Operations ($ millions) Three months ended December 31
Overall, new equipment sales were up 34.9% compared with the fourth quarter of 2009, up significantly in the Company‘s South American and UK and Ireland operations.
Product support revenues in the fourth quarter of 2010 were up 24.3% overall compared with the same quarter last year, with increases reported in all regions. Growth in product support revenues was driven primarily by the mining sectors in Canada and South America.
Rental revenues increased by 17.3% (up in the Canadian and South American operations) and used equipment sales declined by 7.8%, compared to the fourth quarter of 2009.
3.5
46
9.0
72
.2
66
.2
46
9.9
84
.6
58
3.1
61
.1
3.6
63
3.9
0
400
800
New
Equip
Used
Equip
Equip
Rental
Prod
Support
Other
2009 2010
Finning‘s global order book or backlog (the retail value of new equipment units ordered by customers for future deliveries) was $1.3 billion at the end of the fourth quarter of 2010 and was at the highest level since December 2008. The consolidated backlog increased in each consecutive quarter in 2010, and more than doubled from the end of 2009, driven primarily by mining and continued increase in new orders from the construction sector. The Company‘s new order intake in the fourth quarter of 2010 was the highest since the third quarter of 2008, and was up 2% from the third quarter of 2010.

Finning International Inc. Annual 2010 Results
9
The Company is dependent on Caterpillar for the timely supply of equipment to fulfill its deliveries. With global demand increasing, Caterpillar is challenged to meet demand for certain equipment in 2011 and has been taking steps to increase production capacity to meet this demand. Finning continues to work closely with Caterpillar and customers to ensure that equipment demands from the Company‘s customers can be met.
Earnings from Continuing Operations Before Interest and Taxes (EBIT)
On a consolidated basis, EBIT was $79.1 million in the fourth quarter of 2010, almost double the EBIT of $39.7 million in the fourth quarter of 2009, primarily driven by robust revenue growth and a strongly improved EBIT margin (EBIT divided by revenues) from the Company‘s Canadian operations.
Gross profit of $397.9 million in the fourth quarter of 2010 was up 33.9% compared to the fourth quarter of 2009. Quarterly gross profit margin (gross profit as a percentage of revenue) of 29.1% was also higher than the prior year‘s fourth quarter margin of 27.5%. This was primarily due to an improvement in margins in most lines of business. New equipment sales made up 46.4% of total revenues in the fourth quarter of 2010, compared with 43.5% of total revenues in the same period last year. Comparatively, product support revenues were approximately the same at 42.7%.
Selling, general, and administrative (SG&A) expenses were $304.4 million or 22.6% higher than the fourth quarter of 2009, partly reflecting increased volume-related costs to support higher revenues and the growing higher margin product support business. The Company continued to realize cost savings from productivity initiatives announced last year. Primarily as a result of these cost reductions and efficiency improvements, SG&A costs in the fourth quarter of 2010 decreased as a percentage of revenue to 22.3% from 23.0% in the fourth quarter of 2009.
EBIT in the fourth quarter of 2010 included $7.1 million of costs (Q4 2009: $6.2 million) related to the implementation of a new information technology (IT) system for the Company‘s global operations, and restructuring and severance costs of $0.5 million (Q4 2009: $12.1 million). In addition, in the fourth quarter of 2010 as part of its review of the valuation of investments and long-lived assets, the Company recorded an impairment charge totalling $6.8 million, primarily related to its equity investment in Energyst B.V. Included in the results for the fourth quarter of 2009 was a $9.0 million pre-tax gain on the sale of certain properties, primarily in South America.
The Company‘s EBIT margin of 5.8% in the fourth quarter of 2010 improved significantly from 3.7% in the fourth quarter of 2009. The improvement in the EBIT margin was primarily driven by the Company‘s Canadian operations.
EBIT from Continuing Operations
($ millions)
Three months ended December 31
Major components of the EBIT variance were: ($ millions)
2009 Q4 EBIT 39.7
Net change in operations 54.3
Foreign exchange impact (9.8)
Lower restructuring costs in 2010 11.6
Impairment of investment and long-lived asset in 2010 (6.8)
Higher IT system implementation costs in 2010 (0.9)
Higher gains on sale of certain properties in 2009 (9.0)
2010 Q4 EBIT 79.1
32
.4
6.0
45
.3
39
.6
4.6
0
30
60
Canada South America UK & Ireland
2009 2010
Excluding other operations – corporate head office
The Company‘s Canadian operations contributed $45.3 million of EBIT in the fourth quarter of 2010, compared with an EBIT loss of $0.2 million in the comparable period last year. The fourth quarter results of last year included significantly higher restructuring and severance costs and lower revenues. EBIT margin of 6.7% for the three months ended December 31, 2010 improved significantly from the break-even contribution in the fourth quarter of 2009, as the Canadian operations continued to drive higher EBIT margin by focusing on cost containment, productivity improvements, and supply chain efficiencies.
EBIT from the Company‘s South American operations of $39.6 million was 22.2% higher than the fourth quarter of 2009 (27.7% higher in functional currency). EBIT margin of 7.8% was below the 9.6% experienced in the fourth quarter of 2009 largely due to the shift in revenue mix to relatively lower margin new equipment sales and higher volume-related costs. The Company‘s South American operations are incurring higher employee costs as many technicians are being recruited and trained to meet current and anticipated customer demand.
(0.2
)

Finning International Inc. Annual 2010 Results
10
The UK and Ireland operations contributed EBIT of $4.6 million in the fourth quarter of 2010, down from EBIT of $6.0 million in the comparable period of 2009. EBIT margin was 2.4%, down from the EBIT margin of 4.2% in the fourth quarter of 2009. The decline in EBIT margin compared to the prior year‘s quarter largely reflected lower gross profit margin resulting from the shift in revenue mix to a higher proportion of new equipment sales, and lower new equipment and product support margins.
Earnings from Continuing Operations Before Interest, Taxes, Depreciation, and Amortization (EBITDA) and Free Cash Flow
EBITDA, which management views as an indicator of the Company‘s cash operating performance, was $128.0 million in the fourth quarter of 2010 compared to $84.2 million in the fourth quarter of 2009.
The Company‘s Free Cash Flow generated in the fourth quarter of 2010 of $129.0 million was comparable to the $130.4 million generated in the comparative period of the prior year. Free Cash Flow from Hewden has been included in the reported amounts for periods prior to the sale – see ―Description of Non-GAAP Measures‖.
Finance Costs
Finance costs for the three months ended December 31, 2010 were $12.8 million compared with $16.9 million in the fourth quarter of 2009. The lower finance costs in the fourth quarter of 2010 was primarily due to lower debt outstanding and the favourable foreign exchange impact of translating foreign currency denominated finance costs in the fourth quarter of 2010 with a stronger Canadian dollar relative to the U.S. dollar and the U.K. pound sterling.
Provision for Income Taxes
The effective income tax rate for the fourth quarter of 2010 was 24.4% compared to 4.8% in the comparable period of the prior year. The effective tax rate was higher in the fourth quarter of 2010 due to an increased proportion of earnings from higher tax jurisdictions, partly offset by the positive impact of tax rate changes in Chile. The low effective tax rate in the fourth quarter of 2009 reflected lower capital gains tax rates applied to the sale of properties in South America, as well as higher income earned in lower tax jurisdictions.
Income from Continuing Operations
Finning‘s income from continuing operations was $50.1 million in the fourth quarter of 2010, up 130.9% compared with $21.7 million in the comparative period in 2009.
Basic EPS from continuing operations was $0.29 in the fourth quarter of 2010 compared with $0.13 in the same period last year. The fourth quarter 2010 results reflected higher revenues in all operations, improved margins, and the benefits of cost control and process efficiencies. Fourth quarter 2010 results included $0.03 per share of costs related to the global IT system implementation and a $0.04 per share impairment charge related to an investment and a long-lived asset. Comparatively, the fourth quarter of 2009 included $0.05 per share of restructuring and severance costs and $0.02 per share of costs related to the global IT system implementation, partly offset by $0.05 per share gain on sale of certain property, primarily in South America.

Finning International Inc. Annual 2010 Results
11
Annual Overview
YTD 2010 YTD 2009 YTD 2010 YTD 2009
($ millions) (% of revenue)
Revenue $ 4,641.3 $ 4,479.9
Gross profit 1,385.2 1,288.2 29.8% 28.8%
Selling, general & administrative expenses (1,069.6) (1,007.6) (23.0)% (22.5)%
Other expenses (40.6) (33.7) (0.9)% (0.8)%
Earnings from continuing operations before interest and income taxes (EBIT)
(1) 275.0 246.9 5.9% 5.5%
Finance costs (58.7) (61.8) (1.2)% (1.4)%
Provision for income taxes (45.6) (28.4) (1.0)% (0.6)%
Income from continuing operations $ 170.7 $ 156.7 3.7% 3.5%
Loss from discontinued operations, net of tax (3)
(249.1) (25.9) (5.4)% (0.6)%
Net income (loss) $ (78.4) $ 130.8 (1.7)% 2.9%
Basic earnings (loss) per share (EPS)
from continuing operations $ 1.00 $ 0.92
from discontinued operations (3)
$ (1.46) $ (0.15)
Total basic earnings (loss) per share $ (0.46) $ 0.77
Earnings from continuing operations before interest, taxes, depreciation, and amortization (EBITDA)
(1) $ 450.7 $ 442.4 9.7% 9.9%
Free Cash Flow (1) (2)
$ 264.9 $ 493.9
(1) These amounts do not have a standardized meaning under generally accepted accounting principles. For a reconciliation of these amounts to
net income and cash flow from operating activities, see the heading ―Description of Non-GAAP Measures‖ below.
(2) Free Cash Flow is defined as cash provided by (used in) operating activities less net capital expenditures.
(3) On May 5, 2010, the Company sold Hewden, its UK equipment rental business. As a consequence, the results of operations of Hewden have
been reclassified as discontinued operations for all periods presented.
Revenue from Continuing Operations ($ millions) For years ended December 31
For the year ended December 31, 2010, revenues of $4.6 billion increased 3.6% over the same period last year, reflecting higher revenues from the Company‘s South American and UK and Ireland operations.
Foreign exchange had a negative impact on revenues of approximately $397 million (or 9%) due to the 9.8% stronger Canadian dollar relative to the U.S. dollar and the 10.6% stronger Canadian dollar relative to the U.K. pound sterling for the year ended December 31, 2010 compared to last year.
60
3.7
2,3
86
.6
1,4
89
.6
2,3
23
.6
1,6
68
.4
64
9.3
0
1,500
3,000
Canada South America UK & Ireland
2009 2010
Annual 2010 revenues from the Company‘s Canadian operations were slightly down from 2009. However, adjusting for the impact of foreign exchange, revenues in 2010 were 3.7% higher. Product support revenues contributed by the Canadian operations reached a record for Finning (Canada), surpassing $1 billion for the first time. New equipment sales in 2010 were lower than 2009, largely due to the negative impact from foreign exchange as well as lower deliveries in the first half of 2010. The previous year benefited from a significantly higher opening backlog level which supported equipment deliveries in the first half of 2009.
Revenues from the Company‘s South American operations were at record levels, reaching $1.7 billion for the year ended December 31, 2010, up 12.0% over the prior year. In functional currency (the U.S. dollar), annual revenues increased 24.3% over 2009, reflecting strong new equipment sales, particularly in construction and mining, and continued solid growth in product support revenues, up in all sectors.
Finning International Inc. Annual 2010 Results
12
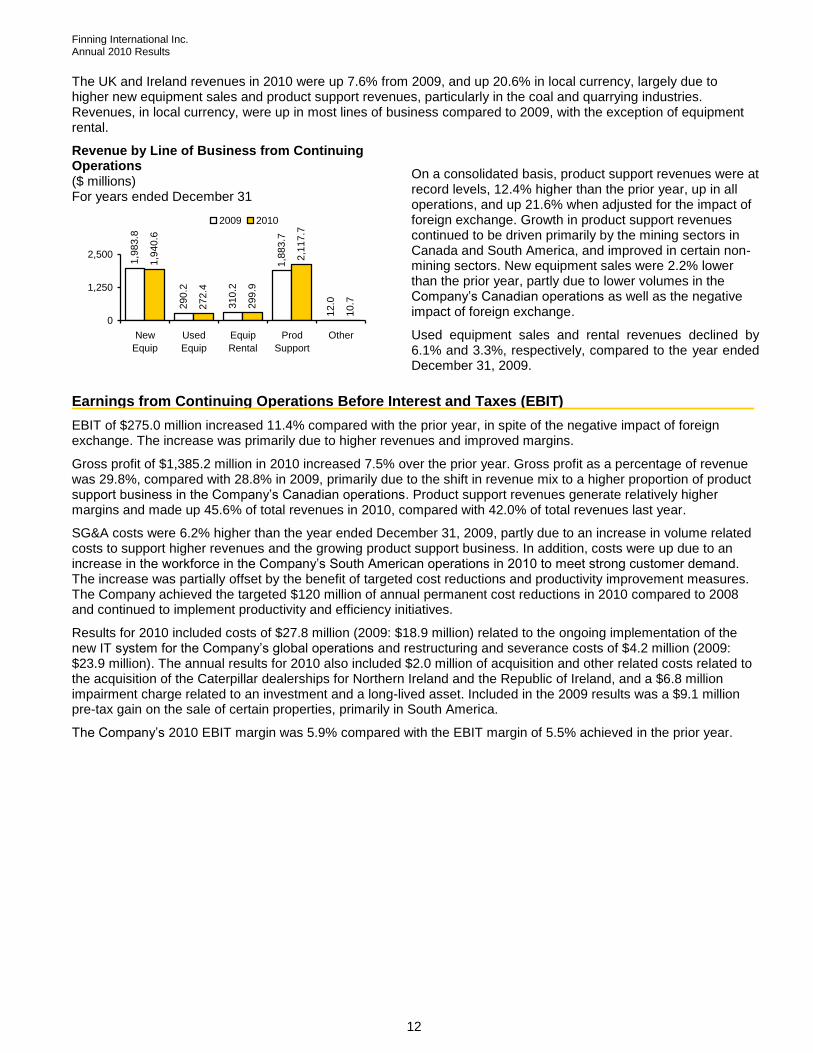
The UK and Ireland revenues in 2010 were up 7.6% from 2009, and up 20.6% in local currency, largely due to higher new equipment sales and product support revenues, particularly in the coal and quarrying industries. Revenues, in local currency, were up in most lines of business compared to 2009, with the exception of equipment rental.
Revenue by Line of Business from Continuing Operations ($ millions) For years ended December 31
1,9
83.8
290.2
310.2
1,8
83.7
12.0
1,9
40.6
10.7272.4
2,1
17.7
299.9
0
1,250
2,500
New
Equip
Used
Equip
Equip
Rental
Prod
Support
Other
2009 2010
On a consolidated basis, product support revenues were at record levels, 12.4% higher than the prior year, up in all operations, and up 21.6% when adjusted for the impact of foreign exchange. Growth in product support revenues continued to be driven primarily by the mining sectors in Canada and South America, and improved in certain non-mining sectors. New equipment sales were 2.2% lower than the prior year, partly due to lower volumes in the Company‘s Canadian operations as well as the negative impact of foreign exchange.
Used equipment sales and rental revenues declined by 6.1% and 3.3%, respectively, compared to the year ended December 31, 2009.
Earnings from Continuing Operations Before Interest and Taxes (EBIT)
EBIT of $275.0 million increased 11.4% compared with the prior year, in spite of the negative impact of foreign exchange. The increase was primarily due to higher revenues and improved margins.
Gross profit of $1,385.2 million in 2010 increased 7.5% over the prior year. Gross profit as a percentage of revenue was 29.8%, compared with 28.8% in 2009, primarily due to the shift in revenue mix to a higher proportion of product support business in the Company‘s Canadian operations. Product support revenues generate relatively higher margins and made up 45.6% of total revenues in 2010, compared with 42.0% of total revenues last year.
SG&A costs were 6.2% higher than the year ended December 31, 2009, partly due to an increase in volume related costs to support higher revenues and the growing product support business. In addition, costs were up due to an increase in the workforce in the Company‘s South American operations in 2010 to meet strong customer demand. The increase was partially offset by the benefit of targeted cost reductions and productivity improvement measures. The Company achieved the targeted $120 million of annual permanent cost reductions in 2010 compared to 2008 and continued to implement productivity and efficiency initiatives.
Results for 2010 included costs of $27.8 million (2009: $18.9 million) related to the ongoing implementation of the new IT system for the Company‘s global operations and restructuring and severance costs of $4.2 million (2009: $23.9 million). The annual results for 2010 also included $2.0 million of acquisition and other related costs related to the acquisition of the Caterpillar dealerships for Northern Ireland and the Republic of Ireland, and a $6.8 million impairment charge related to an investment and a long-lived asset. Included in the 2009 results was a $9.1 million pre-tax gain on the sale of certain properties, primarily in South America.
The Company‘s 2010 EBIT margin was 5.9% compared with the EBIT margin of 5.5% achieved in the prior year.

Finning International Inc. Annual 2010 Results
13
EBIT from Continuing Operations ($ millions) For years ended December 31
Major components of the EBIT variance were: ($ millions)
2009 EBIT 246.9
Net change in operations 99.4
Foreign exchange impact (64.2)
Lower restructuring costs in 2010 19.7
Impairment of investment and long-lived asset in 2010 (6.8)
Higher IT system implementation costs in 2010 (8.9)
Acquisition and other related costs in 2010 (2.0)
Higher gains on sale of certain properties in 2009 (9.1)
2010 EBIT 275.0
153.7
98.3
19.6
16.0
147.5
131.5
0
100
200
Canada South America UK & Ireland
2009 2010
Excluding other operations – corporate head office
Earnings from Continuing Operations Before Interest, Taxes, Depreciation, and Amortization (EBITDA) and Free Cash Flow
EBITDA, which management views as an indicator of the Company‘s cash operating performance, was $450.7 million in 2010 compared to $442.4 million in 2009.
The Company‘s Free Cash Flow generated in 2010 was $264.9 million compared to $493.9 million in 2009. The 2010 annual Free Cash Flow exceeded management‘s target of approximately $200 million due to a higher than expected sales and collections from customers late in the year. Finning has experienced significant improvement in the generation of Free Cash Flow from the fourth quarter of 2008 through to the end of 2010 as management focus has increased in this area. Free Cash Flow from Hewden has been included in the reported amounts for periods prior to the sale – see ―Description of Non-GAAP Measures‖.
Finance Costs
Finance costs for the year ended December 31, 2010 were $58.7 million compared with $61.8 million in the prior year. The lower finance costs in 2010 were primarily due to lower debt outstanding and the favourable foreign exchange impact of translating foreign currency denominated finance costs in 2010 with a stronger Canadian dollar relative to the U.S. dollar and the U.K. pound sterling, The decrease was partly offset by a charge related to purchasing a portion of the Company‘s Eurobond Notes as described below.
The Company‘s U.K. pound sterling denominated assets reduced after the sale of Hewden. The Company took advantage of favourable market conditions and exchange rates at that time and used a portion of the sale proceeds to purchase £45 million of its £115 million outstanding Eurobond Notes in June 2010. As a result, the Company recorded charges of approximately $6.4 million in finance costs, reflecting the premium paid to purchase the Notes, costs associated with the recognition of deferred original financing costs, and related purchase costs. Following the purchase, £70 million of the 5.625% Notes due 2013 remain outstanding.
Provision for Income Taxes
The annual effective income tax rate for 2010 was 21.1% compared to 15.3% last year. The income tax expense in 2009 was lower by $8.5 million due to a change in the estimated tax rate related to items that had been recorded directly to other comprehensive income in prior periods. This tax adjustment reduced the Company‘s tax rate by 4.6% for 2009.
Income from Continuing Operations
Finning‘s income from continuing operations of $170.7 million was up 8.9% in 2010 compared with the prior year.
Basic EPS from continuing operations for the twelve months ended December 31, 2010 was $1.00 per share compared with $0.92 per share last year. Results for 2010 included $0.12 per share of costs related to the Company‘s global IT system implementation, $0.04 per share related to impairment of an investment and a long-lived asset, $0.02 per share of costs related to the acquisition of the Ireland dealerships and restructuring and severance, as well as $0.03 per share of incremental finance costs incurred on the repurchase of a portion of the Company‘s Eurobond Notes. Comparatively, 2009 results included $0.08 per share related to the global IT system implementation and $0.10 per share of restructuring and severance costs, partially offset by an income tax recovery

Finning International Inc. Annual 2010 Results
14
of approximately $0.05 per share related to the change in the estimated tax rate noted above, and $0.05 per share of gains on sale of certain properties, primarily in South America. Foreign exchange had a negative impact of approximately $0.27 per share in 2010 compared to the prior year due to the stronger Canadian dollar relative to the U.S. dollar and the U.K. pound sterling.
Discontinued Operations — Hewden
On May 5, 2010, the Company sold Hewden, its UK equipment rental business as the Company determined that a large, short-term rental business operating separately from its UK dealership was not aligned with the Company‘s strategic objectives. Gross proceeds on the sale of Hewden of $171.1 million (£110.2 million) comprised cash of £90.2 million and a £20.0 million interest bearing 5-year note receivable with a fair value of £16.9 million.
The after-tax loss on sale was $244.1 million or $1.43 per share, which included the realization of $100.8 million of foreign exchange losses related to the Company‘s investment in Hewden previously recorded in accumulated other comprehensive loss, and $68.0 million related to Hewden‘s unfunded pension liability, which the buyer assumed. After taking this into account, the balance of $75.3 million can be attributed to the loss on the Company‘s net carrying value of Hewden operations, net of tax.
The results of operations of Hewden for the periods up to May 5, 2010 have been reclassified as discontinued operations in the consolidated statements of income and cash flow. The assets and liabilities of Hewden in the balance sheet for periods prior to the date of disposition have been presented separately.
The Company expects to maintain an ongoing commercial relationship with Hewden. A further discussion regarding the divestiture of Hewden can be found in Note 20 to the Annual Financial Statements.
Foreign Exchange
Translation
The Company‘s reporting currency is the Canadian dollar. However, due to the geographical diversity of the Company‘s operations, a significant portion of revenue and operating expenses are in different currencies. The most significant currencies in which the Company transacts business are the U.S. dollar, the Canadian dollar, the U.K. pound sterling and the Chilean peso (CLP). Changes in the Canadian dollar / U.S. dollar and Canadian dollar / U.K. pound sterling relationship affects reported results on the translation of the financial statements of the Company‘s South American and UK operations as well as U.S. dollar based earnings of the Company‘s Canadian operations.
Foreign exchange had a negative impact on consolidated revenues in the fourth quarter of 2010 of $66.5 million due to a 4.1% stronger Canadian dollar relative to the U.S. dollar, and a 7.2% stronger Canadian dollar relative to the U.K. pound sterling, all compared to the fourth quarter of 2009. As a result, EBIT was negatively impacted by $9.8 million and net income was negatively impacted by $0.03 per share in the fourth quarter of 2010 compared to the prior year‘s fourth quarter.
For the year ended December 31, 2010, foreign exchange had a negative impact on consolidated revenues of $397.0 million due to a 9.8% stronger Canadian dollar relative to the U.S. dollar, and a 10.6% stronger Canadian dollar relative to the U.K. pound sterling. As a result, EBIT was negatively impacted by $64.2 million and net income was negatively impacted by $0.27 per share in 2010 compared to the year ended December 31, 2009.
The Canadian dollar has historically correlated to commodity prices. If commodity prices strengthen, the Canadian dollar is likely to strengthen. In this scenario, the Company‘s resource industry customers may be able to increase production which can result in increased demand for equipment and services. However, the Company is negatively impacted when U.S. dollar based revenues and earnings are translated into lower Canadian dollar reported revenues and earnings due to the stronger Canadian dollar, although lags may occur.
The impact of foreign exchange due to the value of the Canadian dollar relative to the U.S. dollar and U.K. pound sterling is expected to continue to affect Finning‘s results. The sensitivity of the Company‘s net earnings to fluctuations in the average annual foreign exchange rates is summarized in the Risk Management section of this MD&A.

Finning International Inc. Annual 2010 Results
15
The following tables provide details of revenue and EBIT from continuing operations and the foreign exchange impact for the three and twelve months ended December 31, 2010.
Three months ended December 31 ($ millions) Canada
South America
UK &
Ireland Consolidated
Revenues – Q4 2009 $ 601.8 $ 337.0 $ 142.0 $ 1,080.8
Foreign exchange impact (20.0) (30.4) (16.1) (66.5)
Operating revenue increase 89.8 199.1 63.1 352.0
Revenues – Q4 2010 $ 671.6 $ 505.7 $ 189.0 $ 1,366.3
Total revenue increase $ 69.8 $ 168.7 $ 47.0 $ 285.5
- percentage increase 11.6% 50.1% 33.1% 26.4%
- percentage increase, excluding foreign exchange 14.9% 59.1% 44.4% 32.6%
For year ended December 31 ($ millions) Canada
South America
UK & Ireland Consolidated
Revenues – 2009 $ 2,386.6 $ 1,489.6 $ 603.7 $ 4,479.9
Foreign exchange impact (150.4) (168.1) (78.5) (397.0)
Operating revenue increase 87.4 346.9 124.1 558.4
Revenues – 2010 $ 2,323.6 $ 1,668.4 $ 649.3 $ 4,641.3
Total revenue increase (decrease) $ (63.0) $ 178.8 $ 45.6 $ 161.4
- percentage increase (decrease) (2.6)% 12.0% 7.6% 3.6%
- percentage increase , excluding foreign exchange 3.7% 23.3% 20.6% 12.5%
Three months ended December 31 ($ millions) Canada
South America
UK &
Ireland Other Consolidated
EBIT – Q4 2009 $ (0.2) $ 32.4 $ 6.0 $ 1.5 $ 39.7
Foreign exchange impact (5.9) (3.7) (0.2) — (9.8)
Operating EBIT increase (decrease) 51.4 10.9 (1.2) (11.9) 49.2
EBIT – Q4 2010 $ 45.3 $ 39.6 $ 4.6 $ (10.4) $ 79.1
Total EBIT increase (decrease) $ 45.5 $ 7.2 $ (1.4) $ (11.9) $ 39.4
- percentage increase (decrease) n/m 22.2% (23.3)% n/m 99.2%
- percentage increase (decrease), excluding foreign exchange n/m 33.6% (20.0)% n/m 123.9%
For year ended December 31 ($ millions) Canada
South America
UK &
Ireland Other Consolidated
EBIT – 2009 $ 98.3 $ 153.7 $ 19.6 $ (24.7) $ 246.9
Foreign exchange impact (40.7) (21.4) (2.1) — (64.2)
Operating EBIT increase (decrease) 73.9 15.2 (1.5) 4.7 92.3
EBIT – 2010 $ 131.5 $ 147.5 $ 16.0 $ (20.0) $ 275.0
Total EBIT increase (decrease) $ 33.2 $ (6.2) $ (3.6) $ 4.7 $ 28.1
- percentage increase (decrease) 33.8% (4.0)% (18.4)% n/m 11.4%
- percentage increase (decrease), excluding foreign exchange 75.2% 9.9% (7.7)% n/m 37.4%
n/m = not meaningful

Finning International Inc. Annual 2010 Results
16
Investment in Foreign Operations
Assets and liabilities of the Company‘s self-sustaining foreign operations are translated into Canadian dollars using the exchange rates in effect at the balance sheet dates. Any unrealized translation gains and losses are recorded as an item of other comprehensive income and accumulated other comprehensive income.
Currency translation adjustments arise as a result of fluctuations in foreign currency exchange rates at the period reporting date compared to the previous period reporting date. The unrealized currency translation loss of $98.8 million recorded in 2010 resulted from the stronger spot Canadian dollar against the U.S. dollar and the U.K. pound sterling of 5.0% and 8.3%, respectively, at December 31, 2010 compared to December 31, 2009. This was partially offset by $13.7 million (after tax) of unrealized foreign exchange gains on net investment hedges. In addition, the Company realized an after-tax loss of $100.8 million on foreign currency translation, net of realized gain on net investment hedges, reclassified to earnings on disposal of discontinued operations. For more details, refer to the Annual Consolidated Statements of Comprehensive Income (Loss).
Results by Business Segment
The Company and its subsidiaries operate primarily in one principal business, that being the selling, servicing, and renting of heavy equipment, engines, and related products in various markets worldwide as noted below. Finning‘s operating units are as follows:
Canadian operations: British Columbia, Alberta, the Yukon Territory, the Northwest Territories, and a portion of Nunavut.
South American operations: Chile, Argentina, Uruguay, and Bolivia.
UK and Ireland operations: England, Scotland, Wales, Northern Ireland, the Falkland Islands, the Channel Islands, and the Republic of Ireland.
Other: corporate head office.

Finning International Inc. Annual 2010 Results
17
The table below provides details of revenue by operations and lines of business for continuing operations. Comparative periods have been reclassified to conform to the 2010 presentation.
For year ended December 31, 2010 ($ millions) Canada South America
UK & Ireland Consolidated
Revenue percentage
New equipment $ 829.0 $ 763.3 $ 348.3 $ 1,940.6 41.8%
Used equipment 175.2 41.6 55.6 272.4 5.9%
Equipment rental 214.7 56.3 28.9 299.9 6.5%
Product support 1,095.9 805.3 216.5 2,117.7 45.6%
Other 8.8 1.9 — 10.7 0.2%
Total $ 2,323.6 $ 1,668.4 $ 649.3 $ 4,641.3 100.0%
Revenue percentage by operations 50.1% 35.9% 14.0% 100.0%
For year ended December 31, 2009 ($ millions) Canada South America UK Consolidated
Revenue percentage
New equipment $ 1,015.8 $ 656.0 $ 312.0 $ 1,983.8 44.3%
Used equipment 202.2 41.9 46.1 290.2 6.5%
Equipment rental 224.4 47.9 37.9 310.2 6.9%
Product support 935.2 740.8 207.7 1,883.7 42.0%
Other 9.0 3.0 — 12.0 0.3%
Total $ 2,386.6 $ 1,489.6 $ 603.7 $ 4,479.9 100.0%
Revenue percentage by operations 53.3% 33.2% 13.5% 100.0%
The table below provides selected income statement information from continuing operations by business segment:
For year ended December 31, 2010 ($ millions) Canada South America UK & Ireland Other Consolidated
Revenue from external sources $ 2,323.6 $ 1,668.4 $ 649.3 $ — $ 4,641.3
Operating costs (2,053.2) (1,475.1) (608.0) (13.7) (4,150.0)
Depreciation and amortization (119.0) (36.5) (20.1) (0.1) (175.7)
151.4 156.8 21.2 (13.8) 315.6
Other income (expenses)
IT system implementation costs (14.7) (9.3) (2.6) (1.2) (27.8)
Other (5.2) — (2.6) (5.0) (12.8)
Earnings from continuing operations before interest and income taxes $ 131.5 $ 147.5 $ 16.0 $ (20.0) $ 275.0
- percentage of revenue 5.7% 8.8% 2.5% — 5.9%
- percentage by operations 47.8% 53.7% 5.8% (7.3)% 100.0%
For year ended December 31, 2009 ($ millions) Canada South America UK Other Consolidated
Revenue from external sources $ 2,386.6 $ 1,489.6 $ 603.7 $ — $ 4,479.9
Operating costs (2,125.7) (1,299.4) (553.4) (25.3) (4,003.8)
Depreciation and amortization (132.6) (37.4) (25.3) (0.2) (195.5)
128.3 152.8 25.0 (25.5) 280.6
Other income (expenses)
IT system implementation costs (10.6) (5.6) (2.4) (0.3) (18.9)
Other (19.4) 6.5 (3.0) 1.1 (14.8)
Earnings from continuing operations before interest and income taxes $ 98.3 $ 153.7 $ 19.6 $ (24.7) $ 246.9
- percentage of revenue 4.1% 10.3% 3.2% — 5.5%
- percentage by operations 39.8% 62.3% 7.9% (10.0)% 100.0%

Finning International Inc. Annual 2010 Results
18
Canadian Operations
The Canadian operating segment includes Finning (Canada), the Company‘s interest in OEM Remanufacturing Company Inc. (OEM), and a 25% interest in PipeLine Machinery International (PLM). Finning (Canada) sells, services, and rents mainly Caterpillar mobile equipment and engines in British Columbia, Alberta, the Yukon Territory, the Northwest Territories, and a portion of Nunavut. The Company‘s end markets comprise principally mining (including oil sands), construction, conventional oil and gas, forestry, and power systems.
The table below provides details of the results from the Canadian operating segment:
For years ended December 31 ($ millions)
2010 2009
Revenue from external sources $ 2,323.6 $ 2,386.6
Operating costs (2,053.2) (2,125.7)
Depreciation and amortization (119.0) (132.6)
151.4 128.3
Other expenses
Information technology system implementation costs (14.7) (10.6)
Restructuring and other costs (5.2) (19.4)
Earnings before interest and taxes (EBIT) $ 131.5 $ 98.3
EBIT
- as a percentage of revenue 5.7% 4.1%
- as a percentage of consolidated EBIT 47.8% 39.8%
Earnings before interest, taxes, depreciation, and amortization (EBITDA) $ 250.5 $ 230.9
Canada – Revenue by Line of Business For years ended December 31 ($ millions)
2010 revenues decreased 2.6% over 2009 to $2.3 billion. Foreign exchange had a negative impact on revenues of approximately $150 million in 2010 due to a 9.8% stronger Canadian dollar relative to the U.S. dollar compared to last year. Adjusting for the impact of foreign exchange, revenues were 3.7% higher than last year.
Product support revenues for the year grew to record levels, in excess of $1 billion for the first time. Product support revenues were 17.2% higher than 2009 (up 24.0% when adjusted for the impact of foreign exchange) and benefited from increased customer activity as well as the growing population of Caterpillar equipment in Finning‘s Canadian territories. Product support revenues from the mining sector were strong and also increased in non-mining sectors.
1,0
15.8
202.2
224.4
935.2
9.0
829.0
8.81
75.2
1,0
95.9
214.7
0
750
1,500
New
Equip
Used
Equip
Equip
Rental
Prod
Support
Other
2009 2010
New equipment sales in 2010 were 18.4% lower than in 2009, reflecting the negative impact from foreign exchange as well as lower deliveries in 2010. The previous year benefited from a significantly higher opening backlog level which supported equipment deliveries in the first half of 2009. However, order activity in 2010 has increased from the prior year and Finning (Canada)‘s current backlog is at its highest level since December 2008, which reflects improving market conditions. The existing backlog reflects future deliveries largely to mining customers scheduled to be made in 2011. Demand for construction and conventional oil & gas sectors is showing signs of increased activity, but remains soft relative to historical levels.
In Canada, despite overall lower revenues, gross profit in absolute dollars and as a percentage of revenue was higher than in 2009. This was primarily due to the shift in revenue mix to a higher proportion of product support revenues which typically return higher margins than new equipment sales. Product support revenues made up 47.2% of total revenues in 2010, compared with 39.2% in 2009. In addition, gross profit margins were higher in most lines of business compared with 2009, reflecting the economic recovery seen throughout 2010.
SG&A costs in 2010 were higher in absolute dollars and as a percentage of revenue compared to last year, partly reflecting increased costs in line with higher product support revenues as well as costs incurred in 2010 to generate

Finning International Inc. Annual 2010 Results
19
future process efficiencies and higher bad debt expense. Partially offsetting the increase in SG&A were savings resulting from targeted workforce reductions and other actions taken to reduce expenses and improve efficiencies.
Finning (Canada) incurred $14.7 million of costs in 2010 (2009: $10.6 million) representing its share of the costs related to the implementation of a new information technology (IT) system for the Company‘s global dealership operations. System development is now complete and full-scale testing of the system is underway. Depending on the results of this testing and any remediation, if required, the new system is expected to go live in 2011 shortly after this stage of the project is completed.
Also included in other expenses in 2010 were restructuring and other costs of $5.2 million. Included in this balance were restructuring costs of $3.4 million (2009: $19.4 million) which were incurred primarily as a result of reducing Finning (Canada)‘s workforce in targeted areas in response to the downturn in the economy in 2009 in order to align costs with revenue levels.
EBIT totalled $131.5 million in 2010 compared with $98.3 million in 2009. EBIT margin was 5.7%, up from the EBIT margin of 4.1% achieved in 2009. EBIT margin improved significantly in the last half of 2010 and reflected the strong growth in product support sales, improved margins in most lines of business, and the impact of cost saving initiatives.
Other Developments
In the third quarter of 2010, Finning (Canada) and the International Association of Machinists and Aerospace Workers (IAM) – Local Lodge 99 (Alberta Union) successfully reached a new two-year collective agreement which will expire in 2012.
In the fourth quarter of 2010, the Company announced that Finning (Canada) will proceed with the construction of a new oil sands service facility in Fort McKay, Alberta. The new 16-bay facility, an investment of approximately $110 million, will further expand the Company‘s strong product support capabilities. Construction of the new building is expected to commence in the second quarter of 2011, with completion by the end of 2012.
In early January 2011, the Company received a decision from the Alberta Labour Relations Board relating to the ongoing proceedings with the IAM – Local Lodge 99 relating to Finning (Canada)‘s outsourcing of component repair and rebuilding services to OEM in 2005. The decision recognized the existing collective agreement with the Christian Labour Association of Canada (CLAC) and found that it should continue to apply to the OEM bargaining unit to the end of the current contract (December 31, 2011). A vote has been ordered to be held by the OEM employees (some former Finning (Canada) Component Rebuild Centre employees will also be eligible to vote) within 90 days to determine whether CLAC or IAM – Local Lodge 99 will represent them. Finning and OEM are considering the findings and orders of the Board and assessing next steps. Regardless of the outcome of the vote, OEM is committed to the collective bargaining process and to concluding a fair contract for its employees and for OEM.
Finning (Canada)‘s collective bargaining agreement with the British Columbia division of the IAM – Local Lodge 692 will expire in April 2011. Negotiations with the BC union are underway The Company is committed to the collective bargaining process and to concluding a fair contract for its employees and for Finning.

Finning International Inc. Annual 2010 Results
20
South American Operations
Finning‘s South American operations sell, service, and rent mainly Caterpillar mobile equipment and engines in Chile, Argentina, Uruguay, and Bolivia. The Company‘s end markets comprise principally mining, construction, and power systems.
The table below provides details of the results from the South American operations:
For years ended December 31 ($ millions)
2010
2009
Revenue from external sources $ 1,668.4 $ 1,489.6
Operating costs (1,475.1) (1,299.4)
Depreciation and amortization (36.5) (37.4)
156.8 152.8
Other expenses
Information technology system implementation costs (9.3) (5.6)
Restructuring costs — (0.7)
Gain on sale of property — 7.2
Earnings before interest and taxes (EBIT) $ 147.5 $ 153.7
EBIT
- as a percentage of revenue 8.8% 10.3%
- as a percentage of consolidated EBIT 53.7% 62.3%
Earnings before interest, taxes, depreciation, and amortization (EBITDA) $ 184.0 $ 191.1
In functional currency, gross profit increased in 2010 in absolute terms and was up slightly as a percentage of revenue. This occurred despite a shift in revenue mix to a higher proportion of new equipment sales, which typically return lower margins than product support revenues. Product support revenues made up 48.2% of total revenues in 2010, compared with 49.9% of total revenues in the same period last year. Gross profit margins were higher in most lines of business.
SG&A costs, in functional currency, have increased both in absolute dollars and as a percentage of revenue, partly due to an increase in the workforce and other volume related costs to support higher revenues and the growing product support business. From December 31, 2009 to December 31, 2010, the number of employees in the Company‘s South American operations increased by 19% to 5,900 to meet current and anticipated customer demand for product support. There is significant demand and competition for highly skilled workers which the Company is actively managing. SG&A costs were also higher in 2010 compared to 2009 primarily due to costs incurred as a result of the earthquake that struck Chile in February 2010. The earthquake had minimal impact on the Company‘s South American operations.
Included in other expenses was $9.3 million (2009: $5.6 million) of costs representing the South American operations‘ share of costs related to the implementation of a new IT system for the Company‘s global dealership
South America – Revenue by Line of Business
For years ended December 31 ($ millions)
Finning South America‘s 2010 revenues were at record levels, reaching $1.7 billion, up 12.0% over 2009, and increased 24.3% in functional currency (the U.S. dollar). Compared to 2009, foreign exchange had an approximately $168 million negative impact on the translation of revenues, due to the 9.8% strengthening of the Canadian dollar relative to the U.S. dollar.
2010 revenues, in functional currency, reflected strong new equipment sales, up 29.7% compared to 2009, with increased demand in construction and mining sectors. New equipment backlog, in functional currency, was slightly below the level at September 2010, but continues to be near its highest level since September 2008. The existing backlog reflects future deliveries largely to mining customers scheduled to be made in 2011. Product support revenues continued to show solid growth, and were 20.1% higher in functional currency than in 2009, up in all sectors.
656.0
41.9
47.9
740.8
3.0
763.3
1.941.6
805.3
56.3
0
500
1,000
New
Equip
Used
Equip
Equip
Rental
Prod
Support
Other
2009 2010

Finning International Inc. Annual 2010 Results
21
operations. Other income in 2009 included a $7.2 million pre-tax gain on the sale of a Finning Chile property in exchange for a new head office property.
EBIT from the Company‘s South American operations of $147.5 million in 2010 was 4.0% lower than in 2009. In functional currency, EBIT increased 6.7% over the prior year largely due to strong growth in new equipment and product support revenues, partly offset by higher SG&A (growth related) and higher IT implementation costs. EBIT as a percentage of revenue for Finning South America was 8.8%, compared with the EBIT margin of 10.3% achieved in 2009. The Company‘s South American operations are incurring higher employee costs as many technicians are being recruited and trained to meet current and anticipated customer demand.
United Kingdom (UK) and Ireland Operations
The Company‘s UK and Ireland operations sell, service, and rent mainly Caterpillar mobile equipment and engines in England, Scotland, Wales, Northern Ireland, the Falkland Islands, the Channel Islands, and the Republic of Ireland. The Company‘s markets comprise principally mining, quarrying, construction, power systems, and rental services. In August 2010, Finning was appointed the Caterpillar dealer for Northern Ireland and the Republic of Ireland. The results of these operations have been included in the consolidated financial statements since the acquisition date.
The table below provides details of the results of the continuing operations from the UK and Ireland:
For years ended December 31 ($ millions) 2010 2009
Revenue from external sources $ 649.3 $ 603.7
Operating costs (608.0) (553.4)
Depreciation and amortization (20.1) (25.3)
21.2 25.0
Other expenses
Information technology system implementation costs (2.6) (2.4)
Acquisition and other related costs (2.0) —
Restructuring costs (0.6) (3.0)
Earnings before interest and taxes (EBIT) $ 16.0 $ 19.6
EBIT
- as a percentage of revenue 2.5% 3.2%
- as a percentage of consolidated EBIT 5.8% 7.9%
Earnings before interest, taxes, depreciation, and amortization (EBITDA) $ 36.1 $ 44.9
UK and Ireland – Revenue by Line of Business from Continuing Operations
For years ended December 31 ($ millions)
The UK and Ireland revenues in 2010 of $649.3 million were up 7.6% from the same period last year, and were up 20.6% in local currency, largely due to higher new equipment sales and product support revenues, particularly in the coal and quarrying industries.
Revenues, in local currency, from most lines of business were higher compared to 2009, with the exception of equipment rental. In local currency, new equipment sales were up 25.3%, and revenues from product support and used equipment were 16.5% and 35.8% higher, respectively, in 2010 compared to 2009.
31
2.0
46
.1
37
.9
20
7.73
48
.3
55
.6
21
6.5
28
.9
0
250
500
New Equip Used Equip Equip
Rental
Prod
Support
2009 2010
Compared to 2009, foreign exchange had an approximately $79 million negative impact on the translation of revenues, due to the 10.6% strengthening of the Canadian dollar relative to the U.K. pound sterling.
Gross profit, in local currency, in 2010 was higher compared with the same period last year in absolute terms. However, gross profit as a percentage of revenue was lower in 2009, reflecting a shift in revenue mix to a higher
Finning International Inc. Annual 2010 Results
22
proportion of new equipment sales, which typically return lower margins than product support revenues. In addition, there were lower gross margins in new equipment and product support compared with the prior year, resulting from a very competitive market environment, particularly in power systems.
SG&A costs, in local currency, were higher in 2010 compared to 2009, partly due to increased volume-related costs to support higher revenues, higher pension expense, and higher long-term incentive plan (LTIP) costs allocated to the UK operations due to the appreciation of the Company‘s share price in 2010. However, SG&A as a percentage of revenue was lower than in 2009, reflecting the benefit of management‘s initiatives to reduce operating cost levels and improve operating efficiencies.
Other expenses in 2010 included costs of $2.6 million representing the UK dealership‘s share of the costs related to the implementation of a new IT system for the Company‘s global dealership operations (2009: $2.4 million).
In August 2010, Finning was appointed the Caterpillar dealer for Northern Ireland and the Republic of Ireland and acquired certain assets, comprising inventory, a building, and other fixed assets. The acquisition was recorded as a purchase of a business and the total purchase price was approximately $6 million (£3.7 million). Acquisition and other related costs of $2.0 million were incurred on the transaction, and were included in other expenses.
In 2010, the UK and Ireland operations generated EBIT of $16.0 million, compared with EBIT of $19.6 million in 2009. The lower EBIT in 2010 was primarily the result of higher SG&A, and the negative impact of foreign exchange. The UK‘s EBIT margin (EBIT as a percentage of revenue) in 2010 was 2.5% compared with 3.2% in 2009, primarily the result of lower gross margins due to the shift in revenue mix to new equipment sales.
Other Developments
Finning UK‘s contract with the Unite trade union expired January 1, 2011. Negotiations with the Unite trade union are underway. The Company is committed to the collective bargaining process and to concluding a fair contract for its employees and for Finning.
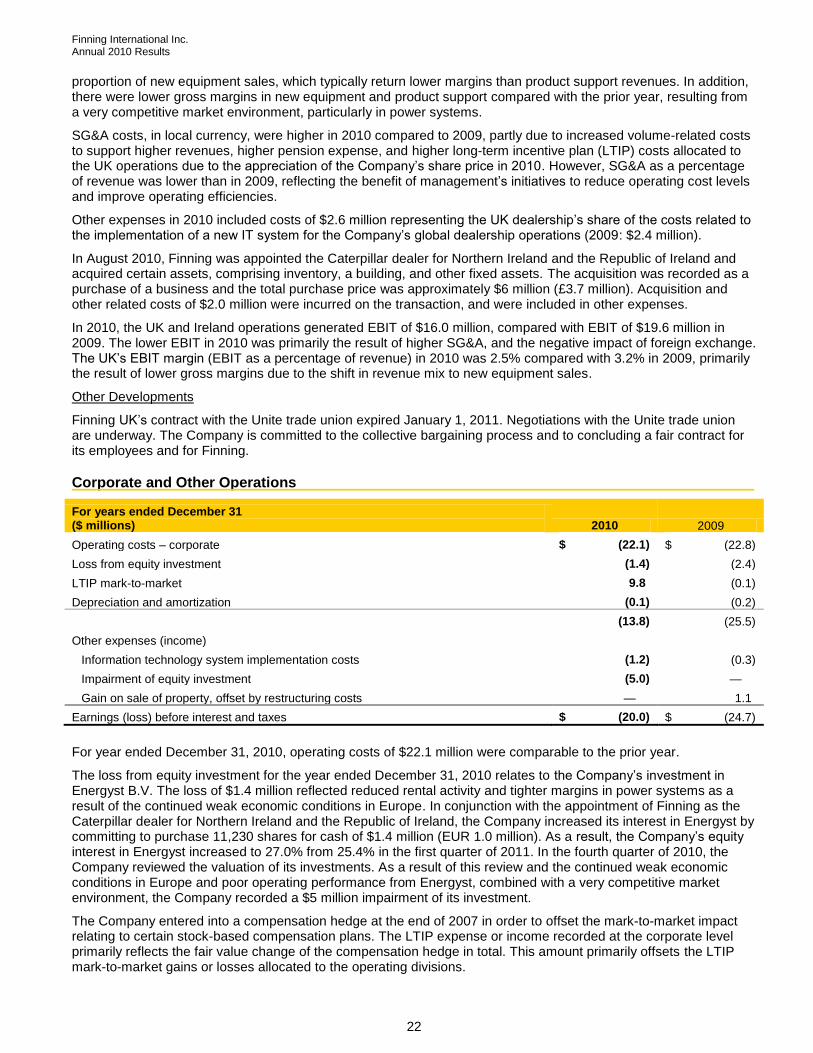
Corporate and Other Operations
For years ended December 31 ($ millions) 2010 2009
Operating costs – corporate $ (22.1) $ (22.8)
Loss from equity investment (1.4) (2.4)
LTIP mark-to-market 9.8 (0.1)
Depreciation and amortization (0.1) (0.2)
(13.8) (25.5)
Other expenses (income)
Information technology system implementation costs (1.2) (0.3)
Impairment of equity investment (5.0) —
Gain on sale of property, offset by restructuring costs — 1.1
Earnings (loss) before interest and taxes $ (20.0) $ (24.7)
For year ended December 31, 2010, operating costs of $22.1 million were comparable to the prior year.
The loss from equity investment for the year ended December 31, 2010 relates to the Company‘s investment in Energyst B.V. The loss of $1.4 million reflected reduced rental activity and tighter margins in power systems as a result of the continued weak economic conditions in Europe. In conjunction with the appointment of Finning as the Caterpillar dealer for Northern Ireland and the Republic of Ireland, the Company increased its interest in Energyst by committing to purchase 11,230 shares for cash of $1.4 million (EUR 1.0 million). As a result, the Company‘s equity interest in Energyst increased to 27.0% from 25.4% in the first quarter of 2011. In the fourth quarter of 2010, the Company reviewed the valuation of its investments. As a result of this review and the continued weak economic conditions in Europe and poor operating performance from Energyst, combined with a very competitive market environment, the Company recorded a $5 million impairment of its investment.
The Company entered into a compensation hedge at the end of 2007 in order to offset the mark-to-market impact relating to certain stock-based compensation plans. The LTIP expense or income recorded at the corporate level primarily reflects the fair value change of the compensation hedge in total. This amount primarily offsets the LTIP mark-to-market gains or losses allocated to the operating divisions.

Finning International Inc. Annual 2010 Results
23
Also included in other expenses in 2010 was Corporate‘s share of costs related to the ongoing implementation of a new information technology system for the Company‘s global operations.
Discontinued Operations — Hewden
Following an extensive strategic review, in May 2010, the Company sold Hewden, its UK equipment rental business.
The results of operations of Hewden for the periods up to May 5, 2010 have been reclassified as discontinued operations in the consolidated statements of income and cash flow. The assets and liabilities of Hewden in the balance sheet for periods prior to the date of disposition have been presented separately. Approximately 1,300 employees were transferred to the buyer with the sale of Hewden.
The table below provides details of the discontinued operations of Hewden:
($ millions)
January 1 – May 5, 2010
For year ended December 31,
2009
Revenue from external sources $ 65.3 $ 257.6
Operating costs (52.4) (221.4)
Depreciation and amortization (18.9) (72.2)
(6.0) (36.0)
Other income (expenses)
Loss on sale of Hewden (238.0) —
Gain on sale of properties 2.4 9.3
Restructuring costs (2.0) (13.0)
Earnings (loss) before interest and taxes (EBIT) $ (243.6) $ (39.7)
Goodwill Impairment
Goodwill is assessed for impairment at the reporting unit level at least annually or as warranted by events or circumstances. Any potential goodwill impairment is identified by comparing the fair value of a reporting unit to its carrying value. If the fair value of the reporting unit exceeds its carrying value, goodwill is considered not to be impaired. If the carrying value of the reporting unit exceeds its fair value, a more detailed assessment must be undertaken to determine the fair value of goodwill. A goodwill impairment charge is recognized to the extent that, at the reporting unit level, the carrying value of goodwill exceeds its fair value.
The Company determines the fair value of its reporting units using a discounted cash flow model corroborated by other valuation techniques such as market multiples. The process of determining these fair values requires management to make estimates and assumptions including, but not limited to, projected future sales, earnings and capital investment, discount rates, and terminal growth rates. Projected future sales, earnings, and capital investment are consistent with strategic plans presented to the Company‘s Board of Directors. Discount rates are based on an industry weighted average cost of capital. These estimates are subject to change due to uncertain competitive and economic market conditions or changes in business strategies.
Liquidity and Capital Resources
Management of the Company assesses liquidity in terms of Finning‘s ability to generate sufficient cash flow, along with other sources of liquidity including cash and borrowings, to fund its operations and growth in operations. Cash provided by continuing operations is affected by the following items:
operating activities, including the level of accounts receivable, inventories, accounts payable, rental equipment, and financing provided to customers;
investing activities, including capital expenditures, acquisitions of complementary businesses, and divestitures of non-core businesses; and
financing activities, including bank credit facilities, commercial paper, long-term debt, and other capital market activities, providing both short and long-term financing.
Cash Flow from Operating Activities
For the year ended December 31, 2010, cash provided by continuing operations after working capital changes was $451.6 million, compared with $511.2 million provided in 2009. Throughout all operations, management has been

Finning International Inc. Annual 2010 Results
24
focusing on improving cash cycle times and operating efficiencies while ensuring appropriate levels of working capital to support activity levels.
In 2010, the Company invested $122.9 million in rental assets, net of disposals (2009: generated proceeds on the disposal of rental assets in excess of additions in the amount of $14.4 million) in continuing operations. As a result of lower demand and a focus on a more selective rental strategy, rental investment moderated in 2009, and underutilized rental assets were sold. Net rental spend in 2010 was within management‘s target range of $100 million to $150 million.
As a result of these items, cash provided by operating activities was $322.5 million in 2010, compared to $562.4 million in 2009.
EBITDA was $450.7 million in 2010 compared to $442.4 million in 2009.
Cash Used For Investing Activities
Net cash provided by investing activities for continuing operations in 2010 totalled $75.6 million compared with net cash used by investing activities of $65.3 million in 2009. The primary source of cash in 2010 related to the sale of Hewden for net proceeds of $117.8 million, net of transaction costs and cash sold. The primary use of cash in 2010 related to capital asset additions as well as the purchase price for certain assets and acquisition and other related costs of $6.7 million paid on the acquisition of the Ireland dealerships.
Gross capital additions from continuing operations for the ended December 31, 2010 were $66.5 million which is lower compared with the $104.9 million invested in 2009. Capital additions in 2010 and 2009 generally reflected capital spending related to growing product support demand. In addition, capital additions in 2010 included capitalized costs of $17.5 million (2009: $11.8 million) related to the Company‘s new global IT system.
In 2010, the Company received proceeds of $26.0 million on the settlement of a cross currency interest rate swap that was part of a hedge against foreign subsidiary investments. In 2009, the Company paid approximately $12.3 million on the settlement of foreign currency swaps, and received proceeds of $32.3 million on the settlement of a cross currency interest rate swap, that partially hedged the Company‘s investment in a foreign subsidiary.
The Company‘s planned net capital expenditures for 2011 are projected to be in the range of $75 million to $100 million, excluding the investment in Fort McKay, Alberta. Net rental additions for 2011 are projected to be at the higher end of management‘s target range of $100 million to $150 million.
The Company believes that internally generated cash flow, supplemented by net borrowing from existing financing sources, if necessary, will be sufficient to meet anticipated capital expenditures and other cash requirements in 2011. Management believes that the 2011 results will continue to generate strong cash flows as working capital requirements, capital expenditures, and investment in rental fleets continue to be actively managed. At this time, the Company does not expect any presently known trend or uncertainty to affect its ability to access its historical sources of cash.
Financing Activities
As at December 31, 2010 the Company‘s short and long-term borrowings totalled $1.0 billion, a decrease of 12.4% from December 31, 2009. The decrease reflected the early purchase of £45 million in June 2010 of the then outstanding £115 million Eurobond Notes using a portion of the proceeds received from the sale of Hewden.
To complement the internally generated funds from operating and investing activities, the Company has approximately $1.2 billion in unsecured credit facilities. Included in this amount, Finning has committed bank facilities totalling approximately $1.0 billion with various Canadian, U.S., and South American financial institutions. The largest of these facilities, an $800 million global credit facility, matures in December 2011. As at December 31, 2010 over $800 million was available under these committed facilities and no long-term debt matures until December 2011. The Company expects to negotiate a revised global credit facility prior to December 2011. Based upon the availability of these facilities, the Company‘s business operating plans, and the discretionary nature of some of the outflows such as rental and capital expenditures, the Company believes it has sufficient liquidity to meet operational needs.
Longer-term capital resources are provided by direct access to capital markets. The Company is rated by both Standard and Poor‘s (S&P) and Dominion Bond Rating Service (DBRS). In 2010, the Company‘s long-term debt ratings were reconfirmed at A (low) by DBRS and BBB+ by S&P. The Company‘s short-term debt rating was reconfirmed by DBRS at R-1 (low). The Company continues to utilize the Canadian commercial paper market as well as borrowings under its credit facilities as its principal sources of short-term funding. The Company‘s commercial paper program is backstopped by the global credit facility. The maximum authorized limit of the Company‘s commercial paper program is $600 million.
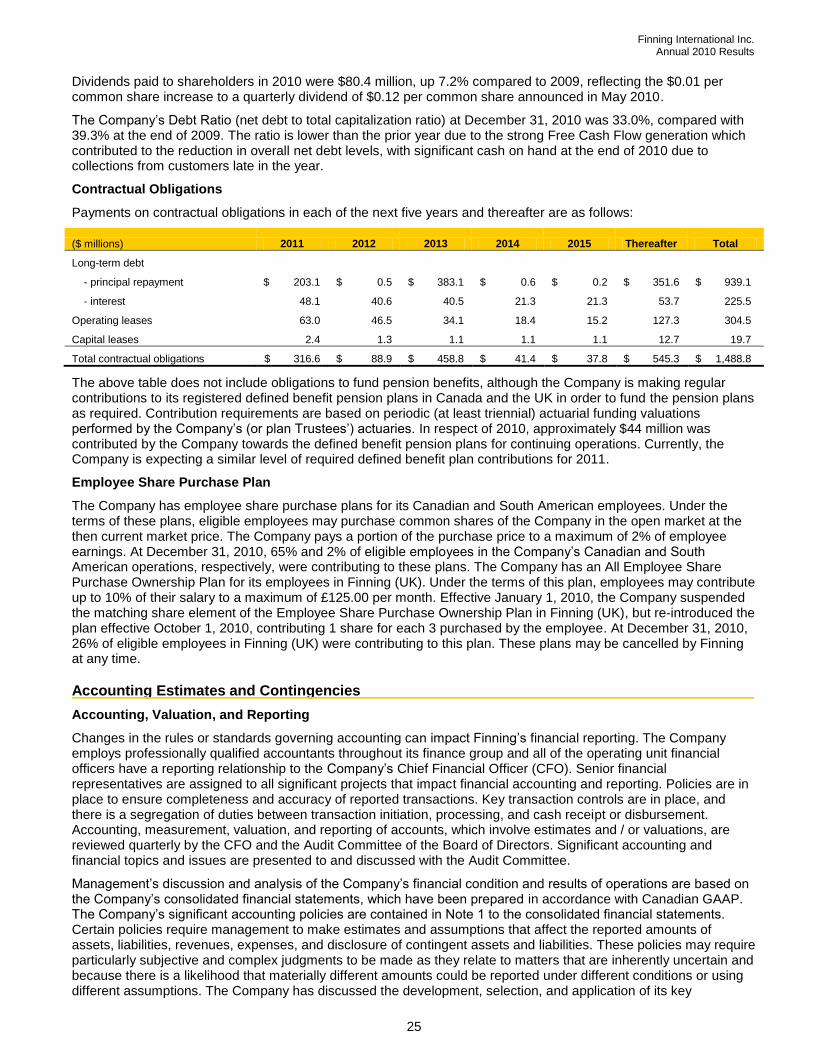
Finning International Inc. Annual 2010 Results
25
Dividends paid to shareholders in 2010 were $80.4 million, up 7.2% compared to 2009, reflecting the $0.01 per common share increase to a quarterly dividend of $0.12 per common share announced in May 2010.
The Company‘s Debt Ratio (net debt to total capitalization ratio) at December 31, 2010 was 33.0%, compared with 39.3% at the end of 2009. The ratio is lower than the prior year due to the strong Free Cash Flow generation which contributed to the reduction in overall net debt levels, with significant cash on hand at the end of 2010 due to collections from customers late in the year.
Contractual Obligations
Payments on contractual obligations in each of the next five years and thereafter are as follows:
($ millions) 2011 2012 2013 2014 2015 Thereafter Total
Long-term debt
- principal repayment $ 203.1 $ 0.5 $ 383.1 $ 0.6 $ 0.2 $ 351.6 $ 939.1
- interest 48.1 40.6 40.5 21.3 21.3 53.7 225.5
Operating leases 63.0 46.5 34.1 18.4 15.2 127.3 304.5
Capital leases 2.4 1.3 1.1 1.1 1.1 12.7 19.7
Total contractual obligations $ 316.6 $ 88.9 $ 458.8 $ 41.4 $ 37.8 $ 545.3 $ 1,488.8
The above table does not include obligations to fund pension benefits, although the Company is making regular contributions to its registered defined benefit pension plans in Canada and the UK in order to fund the pension plans as required. Contribution requirements are based on periodic (at least triennial) actuarial funding valuations performed by the Company‘s (or plan Trustees‘) actuaries. In respect of 2010, approximately $44 million was contributed by the Company towards the defined benefit pension plans for continuing operations. Currently, the Company is expecting a similar level of required defined benefit plan contributions for 2011.
Employee Share Purchase Plan
The Company has employee share purchase plans for its Canadian and South American employees. Under the terms of these plans, eligible employees may purchase common shares of the Company in the open market at the then current market price. The Company pays a portion of the purchase price to a maximum of 2% of employee earnings. At December 31, 2010, 65% and 2% of eligible employees in the Company‘s Canadian and South American operations, respectively, were contributing to these plans. The Company has an All Employee Share Purchase Ownership Plan for its employees in Finning (UK). Under the terms of this plan, employees may contribute up to 10% of their salary to a maximum of £125.00 per month. Effective January 1, 2010, the Company suspended the matching share element of the Employee Share Purchase Ownership Plan in Finning (UK), but re-introduced the plan effective October 1, 2010, contributing 1 share for each 3 purchased by the employee. At December 31, 2010, 26% of eligible employees in Finning (UK) were contributing to this plan. These plans may be cancelled by Finning at any time.
Accounting Estimates and Contingencies
Accounting, Valuation, and Reporting
Changes in the rules or standards governing accounting can impact Finning‘s financial reporting. The Company employs professionally qualified accountants throughout its finance group and all of the operating unit financial officers have a reporting relationship to the Company‘s Chief Financial Officer (CFO). Senior financial representatives are assigned to all significant projects that impact financial accounting and reporting. Policies are in place to ensure completeness and accuracy of reported transactions. Key transaction controls are in place, and there is a segregation of duties between transaction initiation, processing, and cash receipt or disbursement. Accounting, measurement, valuation, and reporting of accounts, which involve estimates and / or valuations, are reviewed quarterly by the CFO and the Audit Committee of the Board of Directors. Significant accounting and financial topics and issues are presented to and discussed with the Audit Committee.
Management‘s discussion and analysis of the Company‘s financial condition and results of operations are based on the Company‘s consolidated financial statements, which have been prepared in accordance with Canadian GAAP. The Company‘s significant accounting policies are contained in Note 1 to the consolidated financial statements. Certain policies require management to make estimates and assumptions that affect the reported amounts of assets, liabilities, revenues, expenses, and disclosure of contingent assets and liabilities. These policies may require particularly subjective and complex judgments to be made as they relate to matters that are inherently uncertain and because there is a likelihood that materially different amounts could be reported under different conditions or using different assumptions. The Company has discussed the development, selection, and application of its key

Finning International Inc. Annual 2010 Results
26
accounting policies, and the critical accounting estimates and assumptions they involve, with the Audit Committee. The more significant estimates include: fair values for goodwill and other asset impairment tests, allowance for doubtful accounts, provisions for inventory obsolescence, reserves for warranty, provisions for income tax, the determination of employee future benefits, the useful lives of the rental fleet and capital assets and related residual values, revenues and costs associated with maintenance and repair contracts, asset retirement obligations, reserves for legal claims, and provisions for restructuring costs.
The Company performs impairment tests on its goodwill balances on at least an annual basis or as warranted by events or circumstances. During the year, the Company performed its assessment of goodwill by estimating the fair value of operations to which the goodwill relates using the present value of expected discounted future cash flows. The Company determined that goodwill was not impaired at December 31, 2010 or 2009.
Due to the size, complexity, and nature of the Company‘s operations, various legal and tax matters are pending. In the opinion of management, none of these matters are expected to have a material effect on the Company‘s consolidated financial position or results of operations.
Income Taxes
The Company exercises judgment in estimating the provision for income taxes. Provisions for federal, provincial, and foreign taxes are based on the respective laws and regulations in each jurisdiction within which the Company operates. Income tax laws and regulations can be complex and are potentially subject to different interpretation between the Company and the respective tax authority. Due to the number of variables associated with the differing tax laws and regulations across the multiple jurisdictions, the precision and reliability of the resulting estimates are subject to uncertainties and may change as additional information becomes known.
Future income tax assets and liabilities comprise the tax effect of temporary differences between the carrying amount and tax basis of assets and liabilities as well as the tax effect of undeducted tax losses, and are measured according to the income tax law that is expected to apply when the asset is realized or liability settled. Assumptions underlying the composition of future income tax assets and liabilities include estimates of future results of operations and the timing of reversal of temporary differences as well as the tax rates and laws in each respective jurisdiction at the time of the expected reversal. The composition of future income tax assets and liabilities is reasonably likely to change from period to period due to the uncertainties surrounding these assumptions.
Description of Non-GAAP Measures
EBIT is defined herein as earnings from continuing operations before interest expense, interest income, and income taxes. EBITDA is defined as earnings from continuing operations before interest, taxes, depreciation, and amortization. Free Cash Flow is defined as cash flow provided by (used in) operating activities less net capital expenditures. EBIT, EBITDA, and Free Cash Flow are measures of performance utilized by management to measure and evaluate the financial performance of its operating segments. EBITDA and Free Cash Flow are measures commonly reported and widely used by investors as an indicator of a company‘s cash operating performance and ability to raise and service debt. EBITDA is also commonly regarded as an indirect measure of operating cash flow, a significant indicator of success for many businesses and is a common valuation metric.
Management believes that these measures provide important information regarding the operational performance of the Company's business. By considering these measures in combination with the comparable GAAP measures set out below, management believes that shareholders are provided a better overall understanding of the Company's business and its financial performance during the relevant period than if they simply considered the GAAP measures alone. EBIT, EBITDA, and Free Cash Flow do not have any standardized meaning prescribed by GAAP and are therefore unlikely to be comparable to similar measures presented by other issuers. Accordingly, these measures should not be considered as a substitute or alternative for net income or cash flow, in each case as determined in accordance with GAAP.

Finning International Inc. Annual 2010 Results
27
A reconciliation between EBITDA, EBIT, and net income from continuing operations is as follows:
Three months ended
December 31 Twelve months ended
December 31
($ millions) 2010 2009 2010 2009
Earnings from continuing operations before interest, taxes, depreciation, and amortization (EBITDA) $ 128.0 $ 84.2 $ 450.7 $ 442.4
Depreciation and amortization (48.9) (44.5) (175.7) (195.5)
Earnings from continuing operations before interest and income taxes (EBIT) 79.1 39.7 275.0 246.9
Finance costs (12.8) (16.9) (58.7) (61.8)
Provision for income taxes (16.2) (1.1) (45.6) (28.4)
Net income from continuing operations $ 50.1 $ 21.7 $ 170.7 $ 156.7
A reconciliation of Free Cash Flow is as follows:
Three months ended
December 31 Twelve months ended
December 31
($ millions) 2010 2009 2010 2009
Cash flow provided by operating activities $ 148.0 $ 128.4 $ 322.5 $ 562.4
Additions to capital assets (19.3) (18.6) (66.5) (104.9)
Proceeds on disposal of capital assets 0.3 14.9 5.0 19.5
Net capital expenditures of discontinued operations — 5.7 3.9 16.9
Free Cash Flow $ 129.0 $ 130.4 $ 264.9 $ 493.9
Free Cash Flow from Hewden has been included in the figures for periods prior to the sale – see Note 20 to the Annual Consolidated Financial Statements.
Risk Management
Finning and its subsidiaries are exposed to market, financial, and other risks in the normal course of their business activities. The Company has adopted an Enterprise Risk Management (ERM) approach in identifying, prioritizing, and evaluating risks. This ERM framework assists the Company in managing business activities and risks across the organization in order to achieve the Company‘s strategic objectives.
The Company is dedicated to a strong risk management culture to protect and enhance shareholder value. The processes within Finning‘s risk management function are designed to ensure that risks are properly identified, managed, and reported. The Company discloses all of its key risks in its most recent Annual Information Form (AIF) with key financial risks also included herein. On a quarterly basis, the Company assesses all of its key risks and any changes to key financial or business risks are disclosed in the Company‘s quarterly MD&A. Also on a quarterly basis, the Audit Committee reviews the Company‘s process with respect to risk assessment and management of key risks, including the Company‘s major financial risks and exposures and the steps taken to monitor and control such exposures. Changes to the key risks are also reviewed by the Audit Committee.
Financial Derivatives
The Company uses, or may use, various financial instruments such as forward and swap foreign exchange contracts, interest rate swaps, and equity hedges, as well as non-derivative foreign currency debt to manage its foreign exchange exposures, interest rate exposures, and stock-based compensation expense exposures (see Note 4 of the Notes to the Consolidated Financial Statements). The Company uses derivative financial instruments only in connection with managing related risk positions and does not use them for trading or speculative purposes.
The Company continually evaluates and manages risks associated with financial derivatives, which includes counterparty credit exposure.

Finning International Inc. Annual 2010 Results
28
Financial Risks and Uncertainties
LIQUIDITY RISK
Liquidity risk is the risk that the Company will not be able to meet its financial obligations as they fall due. The Company‘s approach to managing liquidity is to ensure, as far as possible, that it will have sufficient liquid financial resources to fund its operations and meet its commitments and obligations. The Company maintains bilateral and syndicated bank credit facilities, a commercial paper program, continuously monitors actual and forecast cash flows, and manages maturity profiles of financial liabilities. Undrawn credit facilities for continuing operations at December 31, 2010 were $1,039 million (2009: $987 million), of which approximately $815 million (2009: $725 million) is committed credit facility capacity. The Company believes that it has reasonable access to capital markets which is supported by its investment grade credit ratings.
Financing Arrangements
The Company will require capital to finance its future growth and to refinance its outstanding debt obligations as they come due for repayment. If the cash generated from the Company‘s operations is not sufficient to fund future capital and debt repayment requirements, the Company will require additional debt or equity financing in the capital markets. The Company‘s ability to access capital markets on terms that are acceptable will be dependent upon prevailing market conditions, as well as the Company‘s future financial condition. Further, the Company‘s ability to increase the level of debt financing may be limited by its financial covenants or its credit rating objectives. Although the Company does not anticipate any difficulties in raising necessary funds in the future, there can be no assurance that capital will be available on suitable terms and conditions, or that borrowing costs and credit ratings will not be adversely affected. In addition, the Company‘s current financing arrangements contain certain restrictive covenants that may impact the Company‘s future operating and financial flexibility.
MARKET RISK
Market risk is the risk that changes in the market, such as foreign exchange rates and interest rates, will affect the Company‘s income or the fair value of its financial instruments. The objective of market risk management is to manage and control market risk exposures within acceptable parameters.
The Company buys and sells derivatives in the ordinary course of business, and also incurs financial liabilities, in order to manage market risks. All such transactions are carried out within the guidelines set by the Company‘s Global Foreign Exchange Risk Management Policy approved by the Audit Committee.
Foreign Exchange Risk
The Company is geographically diversified, with significant investments in several different countries. The Company transacts business in multiple currencies, the most significant of which are the U.S. dollar (USD), the Canadian dollar (CAD), the U.K. pound sterling (GBP), and the Chilean peso (CLP). As a result, the Company has foreign currency exposure with respect to items denominated in foreign currencies. The main types of foreign exchange risk of the Company can be categorized as follows:
Translation exposure
The most significant foreign exchange impact on the Company‘s net income is the translation of foreign currency based earnings into Canadian dollars, which is the Company‘s reporting currency. All of the Company‘s foreign subsidiaries are considered self-sustaining and report their operating results in currencies other than the Canadian dollar. Therefore, exchange rate movements in the U.S. dollar and U.K. pound sterling relative to the Canadian dollar will impact the consolidated results of the South American and U.K. operations in Canadian dollar terms. In addition, the results of the Company‘s Canadian operations are impacted by the translation of its U.S. dollar based earnings. The Company does not hedge its exposure to foreign currency risk with regard to foreign currency earnings.
The Company‘s UK and South American operations have functional currencies other than the Canadian dollar, and as a result foreign currency gains and losses arise in the cumulative translation adjustment account from the translation of the Company‘s net investment in these operations. To the extent practical, it is the Company‘s objective to manage this exposure. The Company has hedged a portion of its foreign investments through foreign currency denominated loans and, periodically, through other derivative contracts. For those derivatives and loans where hedge accounting has been elected, any exchange gains or losses arising from the translation of the hedging instruments are recorded, net of tax, as an item of other comprehensive income and accumulated other comprehensive income. Cumulative currency translation adjustments, net of gains or losses of the associated hedging instruments, are recognized in net income when there is a reduction in the Company‘s net investment in the self-sustaining foreign operation.

Finning International Inc. Annual 2010 Results
29
Transaction exposure
Many of the Company‘s operations purchase, sell, rent, and lease products as well as incur costs in currencies other than their functional currency. This mismatch of currencies creates transactional exposure at the operational level, which may affect the Company‘s profitability as exchange rates fluctuate. The Company‘s competitive position may also be impacted as relative currency movements affect the business practices and/or pricing strategies of the Company‘s competitors.
The Company is also exposed to currency risks related to the future cash flows on its non-Canadian denominated short and long term debt.
To the extent practical, it is the Company‘s objective to manage the impact of exchange rate movements and volatility on its financial results. Each operation manages the majority of its transactional exposure through sales pricing policies and practices. The Company also enters into forward exchange contracts to manage residual mismatches in foreign currency cash flows.
Sensitivity to variances in foreign exchange rates
The sensitivity of the Company‘s net earnings to fluctuations in average annual foreign exchange rates is summarized in the table below. A 5% strengthening of the Canadian dollar against the following currencies for a full year relative to the December 31, 2010 month end rates would increase / (decrease) net income by the amounts shown below. A 5% strengthening of the Canadian dollar against the following currencies from the December 31, 2010 month end rates would increase / (decrease) other comprehensive income by the amounts shown below. This analysis assumes that all other variables, in particular volumes, relative pricing, interest rates, and hedging activities are unchanged.
($ thousands)
December 31, 2010
month end rates Net Income
Other Comprehensive
Income
CAD/USD 0.9946 $ (23,700) $ (40,400)
CAD/GBP 1.5513 (600) (11,100)
CAD/CLP 0.0021 $ 2,200 $ —
The sensitivities noted above ignore the impact of exchange rate movements on other macroeconomic variables, including overall levels of demand and relative competitive advantages. If it were possible to quantify these impacts, the results would likely be different from the sensitivities shown above.
Interest Rate Risk
Changes in market interest rates will cause fluctuations in the fair value or future cash flows of financial instruments.
The Company is exposed to changes in interest rates on its interest bearing financial assets including cash and cash equivalents and instalment and other notes receivable. The short term nature of investments included in cash and cash equivalents limits the impact to fluctuations in fair value, but interest income earned will be impacted. Instalment and other notes receivable bear interest at a fixed rate thus their fair value will fluctuate prior to maturity but, absent monetization, future cash flows do not change.
The Company is exposed to changes in interest rates on its interest bearing financial liabilities including short and long term debt and variable rate share forward (VRSF). The Company‘s debt portfolio comprises both fixed and floating rate debt instruments, with terms to maturity ranging up to fifteen years. Floating rate debt, due to its short term nature, exposes the Company to limited fluctuations in changes to fair value, but finance expense and cash flows will increase or decrease as interest rates change.
The fair value of the Company‘s fixed rate debt obligations fluctuate with changes in interest rates, but absent early settlement, related cash flows do not change. The Company does not measure any fixed rate long-term debt at fair value. The Company is exposed to future interest rates upon refinancing of any debt prior to or at maturity.
The Company pays floating interest rates on its VRSF. Both fair value and future cash flows are impacted by changes in interest rates.
The Company manages its interest rate risk by balancing its portfolio of fixed and floating rate debt, as well as managing the term to maturity of its debt portfolio. At certain times the Company may utilize derivative instruments such as interest rate swaps to adjust the balance of fixed and floating rate debt.
Finning International Inc. Annual 2010 Results
30
Commodity Prices
The Company‘s revenues can be indirectly affected by fluctuations in commodity prices; in particular, changes in expectations of longer-term prices. In Canada, commodity price movements in the metals, coal, petroleum, and forestry sectors can have an impact on customers‘ demands for equipment and product support. In Chile and Argentina, fluctuations in the price of copper and gold can have similar effects, as customers base their capital expenditure decisions on the long-term price outlook for these commodities. In the U.K., changes to prices for thermal coal may impact equipment demand in that sector. Significant fluctuations in commodity prices could result in a material impact on the Company‘s financial results. With significantly lower commodity prices, demand is reduced as development of new projects is slowed or stopped and production from existing projects can be curtailed, both leading to less demand for equipment. In addition, product support growth has been, and is expected to continue to be, important in mitigating the effects of downturns in the business cycle. Alternatively, if commodity prices rapidly increase, customer demand for Finning‘s products and services could increase and apply pressure on the Company‘s ability to supply the products or skilled technicians on a timely and cost efficient basis. To assist in mitigating the impacts of fluctuations in demand for its products, Finning management works closely with Caterpillar to ensure an adequate and timely supply of product or offers customers alternative solutions and has implemented human resources recruiting strategies to ensure adequate staffing levels are achieved.
CREDIT RISK
Credit risk is the risk of financial loss to the Company if a customer or counterparty to a financial instrument fails to meet its contractual obligations, and arises principally in respect of the Company‘s cash and cash equivalents, receivables from customers, instalment notes receivable, and derivative assets. Credit risk associated with cash and cash equivalents is managed by ensuring that these financial assets are held with major financial institutions with strong investment grade ratings and by maintaining limits on exposures with any single institution. An ongoing review is performed to evaluate the changes in the credit rating of counterparties. The Company has a large diversified customer base, and is not dependent on any single customer or group of customers. Credit risk is minimized because of the diversification of the Company‘s operations as well as its large customer base and its geographical dispersion. Although there is usually no significant concentration of credit risk related to the Company‘s position in trade accounts or notes receivable, the Company does have a certain degree of credit exposure arising from its derivative instruments relating to counterparties defaulting on their obligations. However, the Company minimizes this risk by ensuring there is no excessive concentration of credit risk with any single counterparty, by active credit monitoring, and by dealing only with major financial institutions that have a credit rating of at least A from S&P.
STOCK-BASED COMPENSATION RISK
Stock-based compensation is an integral part of the Company‘s compensation program, and can be in the form of the Company‘s common shares or cash payments that reflect the value of the shares. Since Canadian GAAP require certain stock-based compensation plans accounted for as liability-based awards to be recorded at intrinsic value, compensation expense can vary as the price of the Company‘s common shares changes. The Company has entered into a derivative contract to partly offset this exposure, called a VRSF.
A 5% strengthening in the Company‘s share price as at December 31, 2010, all other variables remaining constant, would have increased net income by approximately $1.4 million as a result of revaluing the Company‘s VRSF, with a 5% weakening having the opposite effect. This impact partially mitigates changes in the stock based compensation expense; as the Company‘s share price changes, the intrinsic value impact related to the stock-based compensation liability is partially offset by the fair value impact related to the VRSF.
Contingencies and Guarantees
Due to the size, complexity, and nature of the Company‘s operations, various legal and tax matters are pending. In the opinion of management, these matters will not have a material effect on the Company‘s consolidated financial position or results of operations.
The Company enters into contracts with rights of return, in certain circumstances, for the repurchase of equipment sold to customers for an amount which is generally based on a discount from the estimated future fair value of that equipment. As at December 31, 2010, the total estimated value of these contracts outstanding is $146.0 million coming due at periods ranging from 2011 to 2016. The Company‘s experience to date has been that the equipment at the exercise date of the contract is generally worth more than the repurchase amount. The total amount recognized as a provision against these contracts is $0.6 million.
For further information on the Company‘s contingencies, commitments, guarantees, and indemnifications, refer to Notes 25 and 26 of the Notes to the Consolidated Financial Statements.

Finning International Inc. Annual 2010 Results
31
Controls and Procedures Certification
Disclosure Controls and Procedures
Management is responsible for establishing and maintaining a system of controls and procedures over the public disclosure of financial and non-financial information regarding the Company. Such controls and procedures are designed to provide reasonable assurance that all relevant information is gathered and reported to senior management, including the Chief Executive Officer (CEO) and Chief Financial Officer (CFO), on a timely basis so that appropriate decisions can be made regarding public disclosure.
The CEO and the CFO, together with other members of management, have designed the Company‘s disclosure controls and procedures in order to provide reasonable assurance that material information relating to the Company and its consolidated subsidiaries would have been known to them, and by others, within those entities.
The Company has a Disclosure Policy and a Disclosure Committee in place to mitigate risks associated with the disclosure of inaccurate or incomplete information, or failure to disclose required information.
The Disclosure Policy sets out accountabilities, authorized spokespersons, and Finning‘s approach to the determination, preparation, and dissemination of material information. The policy also defines restrictions on insider trading and the handling of confidential information.
A Disclosure Committee, consisting of senior management and external legal counsel, review all financial information prepared for communication to the public to ensure it meets all regulatory requirements and is responsible for raising all outstanding issues it believes require the attention of the Audit Committee prior to recommending disclosure for that Committee‘s approval.
Internal Control over Financial Reporting
Management is responsible for establishing and maintaining adequate internal control over financial reporting. Management has designed internal control over financial reporting to provide reasonable assurance regarding the reliability of financial reporting and the preparation of financial statements in accordance with Canadian GAAP. There has been no change in the design of the Company‘s internal control over financial reporting during the quarter ended December 31, 2010, that would materially affect, or is reasonably likely to materially affect, the Company‘s internal control over financial reporting.
Regular involvement of the Company‘s internal audit function and quarterly reporting to the Audit Committee and the Company‘s external auditors assist in providing reasonable assurance that the objectives of the control system are met. While the officers of the Company have designed the Company‘s disclosure controls and procedures and internal control over financial reporting, they expect that these controls and procedures may not prevent all errors and fraud. A control system, no matter how well conceived or operated, can only provide reasonable, not absolute, assurance that the objectives of the control system are met.
Evaluation of Effectiveness
As required by National Instrument 52-109, Certification of Disclosure in Issuers’ Annual and Interim Filings (NI 52-109) issued by the Canadian Securities regulatory authorities, an evaluation of the design and testing of the effectiveness of the operation of the Company‘s disclosure controls and procedures and internal control over financial reporting were conducted as of December 31, 2010, by and under the supervision of management, including the CEO and CFO. In making the assessment of the effectiveness of the Company‘s disclosure controls and procedures and internal control over financial reporting, management used the criteria set forth by the Committee of Sponsoring Organizations of the Treadway Commission (COSO) in Internal Control – Integrated Framework. The evaluation included documentation review, enquiries, testing, and other procedures considered by management to be appropriate in the circumstances.
Based on that evaluation, the CEO and CFO have concluded that the Company‘s disclosure controls and procedures and internal control over financial reporting were effective as of December 31, 2010.

Finning International Inc. Annual 2010 Results
32
Selected Quarterly Information
2010 2009
Q4 Q3 Q2 Q1 Q4 Q3 Q2 Q1
Revenue from continuing operations (1) (2)
Canada $ 671.6 $ 600.2 $ 561.9 $ 489.9 $ 601.8 $ 489.9 $ 582.0 $ 712.9
South America 505.7 462.2 352.7 347.8 337.0 376.9 363.0 412.7
UK & Ireland 189.0 157.7 160.6 142.0 142.0 145.5 152.4 163.8
Total revenue $1,366.3 $1,220.1 $1,075.2 $ 979.7 $1,080.8 $1,012.3 $1,097.4 $1,289.4
Net income (loss) (1)
(2)
from continuing operations $ 50.1 $ 61.5 $ 36.0 $ 23.1 $ 21.7 $ 25.6 $ 56.5 $ 52.9
from discontinued operations — — (246.1) (3.0) (5.4) (3.9) (8.7) (7.9)
Total net income $ 50.1 $ 61.5 $ (210.1) $ 20.1 $ 16.3 $ 21.7 $ 47.8 $ 45.0
Basic Earnings (Loss) Per Share (1)
(2)
from continuing operations $ 0.29 $ 0.36 $ 0.21 $ 0.14 $ 0.13 $ 0.15 $ 0.33 $ 0.31
from discontinued operations — — (1.44) (0.02) (0.03) (0.02) (0.05) (0.05)
Total basic EPS $ 0.29 $ 0.36 $ (1.23) $ 0.12 $ 0.10 $ 0.13 $ 0.28 $ 0.26
Diluted Earnings (Loss) Per Share (1) (2)
from continuing operations $ 0.29 $ 0.36 $ 0.21 $ 0.14 $ 0.13 $ 0.15 $ 0.33 $ 0.31
from discontinued operations — — (1.44) (0.02) (0.03) (0.02) (0.05) (0.05)
Total diluted EPS $ 0.29 $ 0.36 $ (1.23) $ 0.12 $ 0.10 $ 0.13 $ 0.28 $ 0.26
Total assets (1) (2)
$3,613.6 $3,533.5 $3,401.5 $3,492.2 $3,671.4 $3,892.4 $4,357.3 $4,639.6
Long-term debt
Current $ 203.1 $ 37.9 $ 32.4 $ 23.7 $ 24.2 $ 23.9 $ 2.6 $ 2.6
Non-current 736.0 891.1 899.9 973.7 991.7 1,013.8 1,206.4 1,437.3
Total long-term debt (3)
$ 939.1 $ 929.0 $ 932.3 $ 997.4 $1,015.9 $1,037.7 $1,209.0 $1,439.9
Cash dividends paid per common share $ 0.12 $ 0.12 $ 0.12 $ 0.11 $ 0.11 $ 0.11 $ 0.11 $ 0.11
Common shares outstanding (000‘s) 171,431 171,177 171,009 170,907 170,747 170,661 170,631 170,545
Options outstanding (000‘s)
5,603 6,095 6,455 6,058 6,299 6,537 6,606 5,807
1) In August 2010, the Company was appointed the Caterpillar dealer for Northern Ireland and the Republic of Ireland. The results of operations and financial position of these dealers have been included in the figures above since the date of acquisition.
2) On May 5, 2010, the Company sold Hewden, its UK equipment rental business. Results from Hewden are presented as discontinued operations and have been reclassified to that category for all periods presented. Included in the loss from discontinued operations in the second quarter of 2010 is the after-tax loss on the disposition of Hewden of $244.1 million or $1.43 per share. Revenues from Hewden have been excluded from the revenue figures above. Assets from Hewden have been included in the total assets figures for periods prior to the sale.
3) In the second quarter of 2010, the Company utilized funds from the sale of Hewden to redeem £45 million of its £115 million Eurobond Notes.
The Company‘s $800 million global credit facility matures in December 2011; therefore drawings on the credit facility at December 31, 2010 were classified as current. The Company expects to negotiate a revised global credit facility prior to December 2011.

Finning International Inc. Annual 2010 Results
33
New Accounting Pronouncements
Changes in Accounting Policy in 2010
Business Combinations
In January 2009, the Canadian Institute of Chartered Accountants (CICA) issued Section 1582, Business Combinations, Section 1601, Consolidations, and Section 1602, Non-controlling Interests. These new standards are harmonized with International Financial Reporting Standards (IFRS). Section 1582 specifies a number of changes, including: an expanded definition of a business, a requirement to measure all business acquisitions at fair value, a change in the basis of measurement of non-controlling interests, and a requirement to recognize acquisition-related costs as expenses. Section 1601 establishes the standards for preparing consolidated financial statements. Section 1602 specifies that non-controlling interests be treated as a separate component of equity, not as a liability or other item outside of equity. The new standards will become effective in 2011, although early adoption was permitted as long as all three sections were adopted at once.
Effective January 1, 2010, the Company early adopted Sections 1582, 1601, and 1602 in accordance with the transitional provisions. The adoption of Sections 1601 and 1602 did not have a material impact on the Company‘s consolidated financial statements. In August 2010, the Company was appointed the Caterpillar dealer for Northern Ireland and the Republic of Ireland. These acquisitions have been accounted for in accordance with the new standard on business combinations; however, the Company was not materially affected as a result of adopting the new recommendations of Section 1582 for these transactions.
Future Accounting Pronouncements
Convergence with International Financial Reporting Standards
In February 2008, Canada‘s Accounting Standards Board confirmed that Canadian GAAP, as used by public companies, will be converged with International Financial Reporting Standards (IFRS) effective January 1, 2011. The transition from Canadian GAAP to IFRS will be applicable for the Company for the first quarter of 2011 when the Company will prepare both the current and comparative financial information using IFRS. Finning must also present an opening IFRS statement of financial position as at January 1, 2010, its date of transition to IFRS (Transition Date) which will form part of its interim financial report for the quarter ending March 31, 2011.
The Company‘s consolidated financial statements for the year ending December 31, 2011 will be its first annual financial statements that comply with IFRS. As this will be Finning‘s first year of reporting under IFRS, IFRS 1 First-time Adoption of IFRS will be applicable.
In accordance with IFRS 1, Finning will apply IFRS retrospectively as of January 1, 2010, for comparative purposes as if IFRS had always been in effect, subject to certain mandatory exceptions and optional exemptions applicable to us, discussed below.
Senior management and the Audit Committee have approved the Company‘s IFRS accounting policies, but IFRS standards are evolving and may be different at the time of transition. The International Accounting Standards Board (IASB) has several projects underway that could affect the differences currently identified between Canadian GAAP and IFRS.
Project management
While IFRS uses a conceptual framework similar to Canadian GAAP, there are significant differences on recognition, measurement, and disclosures. The Company commenced its IFRS conversion project in late 2007. The project consists of four phases: raise awareness; assessment; design; and implementation. The Company is currently in the implementation phase. While a number of differences were identified, the areas of highest potential impact to the Company are employee benefits, income taxes, share-based payment, presentation, and disclosure, as well as the initial selection of applicable transitional exemptions under the provisions of IFRS 1 First Time Adoption of IFRS. The Company has not identified any further areas subject to significant change during subsequent phases of the transition project.

Finning International Inc. Annual 2010 Results
34
The Company‘s IFRS transition project is on schedule. The following table indicates key milestones in the project. It is based on management‘s current expectations and is hence subject to change as a result of new IASB IFRS projects and standards, and management‘s experiences as its project progresses:
Activity Milestone Status
Technical analysis Initial scoping and risk assessment
High level review, using external expert advisor, to determine most significant GAAP differences applicable to the Company.
Completed 2008.
Technical review of each standard
Analysis of IFRS standards, identifying specific changes to the Company‘s accounting processes and policies.
Completed 2009.
Transitional election choice and approval
Identification, analysis, and selection of appropriate IFRS 1 transitional provisions to be used by the Company. Presentation of transitional choices to Audit Committee.
Transitional choices presented to Audit Committee in December 2009 and approved February 2010.
Go-forward accounting policy choices
Identification, analysis, and selection of accounting policy choices available under IFRS.
Accounting policy selections approved by Audit Committee in February, May, and August 2010.
Financial statement preparation Preparation of Opening Statement of Financial Position
Preparation of opening statement of financial position and associated reconciliation from Canadian GAAP to IFRS.
A condensed statement of financial position is provided on the following page with a description of key impacts.
Quarterly comparatives preparation
Preparation of quarterly comparative financials, including reconciliation from Canadian GAAP to IFRS balances.
The comparatives preparation process for Q1-Q3 is largely complete. The preparation of Q4 comparatives is expected to be completed in March 2011.
Financial statement template
Completion of IFRS-compliant financial statement template and associated note disclosures.
Completed in Q1 2010. Template will be refreshed as additional disclosure requirements are released.
Training Design and implementation of IFRS training plan
Design training plan. Provide overview training.
IFRS ‗overview‘ training provided to finance personnel in all geographic regions in 2009. Comprehensive training session provided to Board of Directors in December 2009. Additional training on the impact of transition to IFRS was provided to senior management in all regions in November 2010. Detailed topic-specific training sessions have been provided to all finance personnel.
Communication Design and implementation of communication plan
Design communication plan for internal and external stakeholders. Implement awareness-building and communication activities.
Communication provided through internal newsletters, forums, and intranet-based media. Investor relations team have been involved in development of the external communication plan. An investor call was held December 8, 2010 to discuss the Company‘s transition to IFRS and the key adjustments to Finning‘s financial statements arising from conversion to IFRS.
Systems Dual reporting and additional data gathering
Ensure successful systems transition from dual reporting to pure IFRS reporting.
Rollover of core reporting systems into 2011 IFRS environment is underway.
Controls Internal control over financial reporting and disclosure controls and procedures
Perform review of controls to ensure adequacy of existing controls, or implementation of new controls where required.
Relevant controls are being assessed as each work stream progresses. Regional compliance managers have been briefed on IFRS impacts to enable timely assessment of controls.

Finning International Inc. Annual 2010 Results
35
Transitional elections (under IFRS 1)
The following summary provides details of the opening statement of financial position transitional provisions to be adopted effective January 1, 2010.
Employee benefits: Any unamortized defined benefit pension plan actuarial gains and losses accumulated at January 1, 2010 will be recognized in retained earnings in accordance with the IFRS 1 transitional exemption. Not taking this exemption would require retrospective application of IAS 19 Employee Benefits from the inception of all defined benefit plans. This is anticipated to be the Company‘s most significant adjustment to our opening statement of financial position.
Share-based payment: IFRS 2, Share-based Payment, encourages application of its provisions to equity instruments granted on or before November 7, 2002, if fair value information about these instruments had previously been publicly disclosed. As the fair value of the Company‘s instruments had not been historically disclosed, the Company will not restate share-based payment balances in relation to fully vested awards of share-based payments prior to January 1, 2010.
Property, plant, and equipment (PP&E): No transitional elections will be taken. The Company will retain assets at historical cost upon transition rather than taking the allowed election to recognize assets at fair value.
In addition to the key areas outlined above, the use of the following additional transitional exemptions, available under IFRS 1, has also been agreed by management and the Audit Committee:
Borrowing costs: Borrowing costs will not be capitalized retrospectively and the Company will only capitalize borrowing costs incurred after the date of transition (January 1, 2010).
Business combinations: The Company will not retrospectively restate any business combinations; IFRS 3 will be applied prospectively to acquisitions after January 1, 2010. This date is consistent with the Company‘s adoption of the CICA‘s revised sections for business combinations, consolidations, and non controlling interests.
Cumulative translation adjustments: All cumulative translation adjustments and associated cumulative hedging gains and losses will be transferred to retained earnings from accumulated other comprehensive income upon transition. Not taking this election would require retrospective application of IAS 21 The Effect of Changes in Foreign Exchange Rates from the date the foreign operations were formed or acquired.
IFRS opening statement of financial position
The following table summarizes the expected quantitative impact on the consolidated statement of financial position of the Company‘s transition to IFRS at January 1, 2010. These differences have been identified with reference to IFRS effective at the time of publishing this MD&A. In the event that new or amended accounting standards or interpretations become effective prior to the inclusion of the Company‘s financial statement of position in its first annual audited IFRS financial statements (December 2011 year end), or if other changes are determined to be appropriate, the differences currently identified between Canadian GAAP and IFRS may change.
January 1, 2010 Canadian
GAAP Employee benefits(1)
Share-based
payment(2) Leases(3) Income taxes(4) Other(5)
IFRS reclassifications(6) IFRS ($ millions)
Current assets $ 2,083.6 $ — $ — $ — $ — $ — $ (80.1) $ 2,003.5
Non-current assets 1,587.8 (152.7) (0.4) 4.2 (0.8) (1.8) (12.9) 1,423.4
Total assets 3,671.4 (152.7) (0.4) 4.2 (0.8) (1.8) (93.0) 3,426.9
Current liabilities 945.0 — — 0.6 — — (24.3) 921.3
Non-current liabilities 1,210.7 73.0 0.6 (1.7) 4.5 (0.7) (68.7) 1,217.7
Total liabilities 2,155.7 73.0 0.6 (1.1) 4.5 (0.7) (93.0) 2,139.0
Shareholders‘ equity 1,515.7 (225.7) (1.0) 5.3 (5.3) (1.1) — 1,287.9
Total liabilities and shareholders‘ equity $ 3,671.4 $ (152.7) $ (0.4) $ 4.2 $ (0.8) $ (1.8) $ (93.0) $ 3,426.9
Under IFRS, the Company anticipates that its net debt to total capitalization ratio will continue to be within the Company‘s target range of 35-45%. The transition to IFRS is not expected to significantly impact the Company‘s current bank covenants.

Finning International Inc. Annual 2010 Results
36
The following notes explain the significant adjustments to the Company‘s Canadian GAAP statement of financial position at January 1, 2010, as a result of the Company‘s transition to IFRS:
1. Employee benefits
Under Canadian GAAP, actuarial gains and losses were deferred and amortized in accordance with the ―corridor‖ method. The excess of the net accumulated actuarial gains or losses over 10% of the greater of the accrued benefit obligation and the fair value of the plan assets was amortized on a straight-line basis over the expected average remaining service life of the active employees covered by the plans.
As described above in the IFRS transitional elections section, the Company elected to recognize its unamortized cumulative actuarial loss of $225.7 million (after-tax) that existed at the transition date in opening retained earnings for all employee benefit plans.
In addition, IFRS requires that the Company measures the assets and liabilities of the defined benefit plan at the end of the reporting period, whereas Canadian GAAP allows the valuation to occur up to 3 months prior to the reporting date. The Company‘s measurement date prior to adopting IFRS was November 30. Plans that were previously measured on November 30, 2009 will be re-valued as at December 31, 2009 under IFRS.
There is ongoing debate as to the applicability of International Financial Reporting Interpretations Committee (IFRIC) 14 in the Canadian regulatory environment. The quantifications provided above assume that no IFRIC 14 liability for minimum defined benefit pension plan funding requirements is required to be recognized in the Company‘s opening statement of financial position. Developments in the interpretation of IFRIC 14 in a Canadian context could result in an adjustment to the opening statement of financial position defined benefit pension liability.
2. Share-based Payment
Cash settled plans
Under Canadian GAAP, cash settled share-based payments are measured at intrinsic value, with changes in intrinsic value taken to the income statement immediately. IFRS requires such cash settled plans to be valued at fair value and valuation movements will continue to be taken to the income statement. The additional liability of $0.6 million arising from the fair valuation under IFRS of the Company‘s cash settled deferred share units and share appreciation rights plans at December 31, 2009 will be recognized in the opening statement of financial position.
Equity settled plans
Under Canadian GAAP, the Company values share options that vest in tranches as a single grant. IFRS requires that each share option tranche be valued as a separate grant with a separate vesting date. In addition, under IFRS, the initial valuation is based upon the amount of awards estimated to vest, whereas under Canadian GAAP the Company only recognizes forfeitures of awards as and when they arise. The Company will record a charge to contributed surplus of $1.4 million for unvested share options in its IFRS opening statement of financial position to reflect these changes in the valuation process.
The method of computation of deferred tax on share-based payments also differs under IFRS, as compared to Canadian GAAP. The Canadian GAAP deferred tax balances will therefore be recalculated in the statement of financial position to reflect these differences in deferred tax methodology.
3. Leases
a. Accelerated recognition of sale and leaseback gains
Under Canadian GAAP, sale and leaseback gains relating to operating leases are deferred and amortized over the term of the operating lease. Under IFRS, such gains may be recognized upfront if the sale and leaseback results in an operating lease, and is undertaken at fair value. As certain sale and leaseback transactions of the Company meet these criteria, the unamortized portion of the gains of $5.4 million (after-tax) will be recognized in retained earnings and the deferred gain derecognized in the opening IFRS statement of financial position.
b. Reclassification of certain leases from operating to finance lease
While the concepts of operating and finance leases are very similar between Canadian GAAP and IFRS, IFRS provides more qualitative indicators to apply in the classification of the lease, and does not specify quantitative thresholds to be applied in the lease classification test. Certain leases which were classified as operating under Canadian GAAP are now classified as financing under IFRS. Leased assets of $4.9 million will be

Finning International Inc. Annual 2010 Results
37
capitalized on the opening statement of financial position, with the corresponding payable recognized as a liability.
4. Income taxes
IAS 12 requires that deferred tax be recognized on foreign exchange differences where the currency of the tax basis of non monetary assets is different to the functional currency for accounting purposes, whereas no such deferred taxation was recognized under Canadian GAAP. This difference gives rise to an additional deferred tax asset of $1.5 million under IFRS. In addition, under IFRS deferred taxes are recognized on temporary differences arising from intra-company transfers, which will result in an additional $2.1 million deferred tax asset, whereas this is not required under Canadian GAAP.
There are also differences between IFRS and Canadian GAAP with respect to the calculation of the tax basis of certain assets in the UK and Chile. In Chile, inflation adjustments on assets that are subject to income tax will be included in the tax basis of the asset for deferred tax computation purposes under IFRS. In the UK, the determination of the tax basis for certain buildings is impacted by the different approaches of Canadian GAAP and IFRS with regard to circumstances where the tax deductible amount of a building differs dependent on whether it is used or sold. The differences in the computation of the UK buildings tax basis will result in the recognition of an additional $8.9 million deferred tax liability under IFRS.
5. Other miscellaneous adjustments
These are immaterial adjustments in relation to the componentization of rental assets and differences in the accounting treatment of asset retirement obligations.
6. Opening statement of financial position presentation reclassifications
The following notes explain each statement of financial position reclassification arising from the Company‘s transition to IFRS:
Joint Venture Accounting
Canadian GAAP prescribes the use of the proportionate consolidation method for joint ventures. Under IFRS, the Company may use either proportionate consolidation or equity method accounting. In anticipation of proposed amendments to IAS 31, Joint Ventures, which would mandate the use of the equity method accounting for Joint Ventures, the Company has elected to adopt the IFRS option to use equity accounting for its existing joint ventures. This has no overall impact on net assets, but alters the presentation of the joint venture; the joint venture will be presented as a separate line item on the statement of financial position under IFRS, ‗Investment in joint ventures and associate‘. The Company‘s investment in an associate, which was always accounted for using the equity method under Canadian GAAP, will be re-classified under IFRS from ‗other assets‘ into ‗Investment in joint ventures and associate‘ on the statement of financial position.
Income taxes
Canadian GAAP requires deferred taxation balances to be split between current and non-current assets and liabilities. In contrast, IAS 12 requires that all deferred tax be presented as non-current. Current deferred tax balances will be re-classified to non-current assets and liabilities under IFRS.
Accounting policy changes
In addition to the transitional impacts described above, there are several accounting policy differences which will impact the company on a go-forward basis. Except for changes to the employee benefits and income taxes accounting policies, the changes to the accounting policies described below are not anticipated to have a significant impact on the Company‘s income statement. This is not an exhaustive list, but it provides an indication of the main accounting policy changes which will apply to the Company under IFRS effective January 1, 2011 with comparatives presented for 2010:
Employee benefits: Under Canadian GAAP, the Company applies the ‗corridor‘ method of accounting, whereby actuarial gains and losses are deferred and amortized over time. Under IFRS, the Company has elected to record actuarial gains and losses arising from its defined benefit pension plans in other comprehensive income. As the Company will no longer defer and amortize actuarial gains and losses occurring after January 1, 2011, IFRS will likely increase variability in other comprehensive income and accumulated other comprehensive income.
The Company‘s pension expense under IFRS will be lower than that recorded under Canadian GAAP as actuarial losses will no longer be amortized. The amortization of actuarial losses in 2010 under Canadian GAAP was approximately $14 million, pre tax.
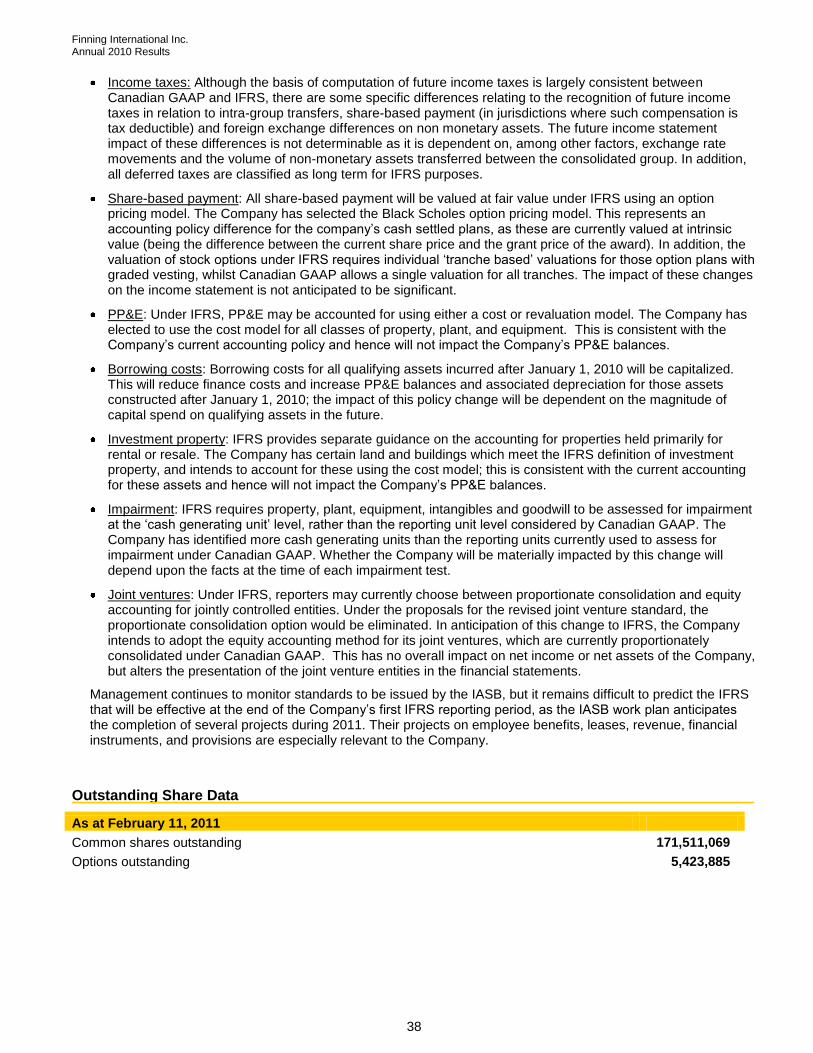
Finning International Inc. Annual 2010 Results
38
Income taxes: Although the basis of computation of future income taxes is largely consistent between Canadian GAAP and IFRS, there are some specific differences relating to the recognition of future income taxes in relation to intra-group transfers, share-based payment (in jurisdictions where such compensation is tax deductible) and foreign exchange differences on non monetary assets. The future income statement impact of these differences is not determinable as it is dependent on, among other factors, exchange rate movements and the volume of non-monetary assets transferred between the consolidated group. In addition, all deferred taxes are classified as long term for IFRS purposes.
Share-based payment: All share-based payment will be valued at fair value under IFRS using an option pricing model. The Company has selected the Black Scholes option pricing model. This represents an accounting policy difference for the company‘s cash settled plans, as these are currently valued at intrinsic value (being the difference between the current share price and the grant price of the award). In addition, the valuation of stock options under IFRS requires individual ‗tranche based‘ valuations for those option plans with graded vesting, whilst Canadian GAAP allows a single valuation for all tranches. The impact of these changes on the income statement is not anticipated to be significant.
PP&E: Under IFRS, PP&E may be accounted for using either a cost or revaluation model. The Company has elected to use the cost model for all classes of property, plant, and equipment. This is consistent with the Company‘s current accounting policy and hence will not impact the Company‘s PP&E balances.
Borrowing costs: Borrowing costs for all qualifying assets incurred after January 1, 2010 will be capitalized. This will reduce finance costs and increase PP&E balances and associated depreciation for those assets constructed after January 1, 2010; the impact of this policy change will be dependent on the magnitude of capital spend on qualifying assets in the future.
Investment property: IFRS provides separate guidance on the accounting for properties held primarily for rental or resale. The Company has certain land and buildings which meet the IFRS definition of investment property, and intends to account for these using the cost model; this is consistent with the current accounting for these assets and hence will not impact the Company‘s PP&E balances.
Impairment: IFRS requires property, plant, equipment, intangibles and goodwill to be assessed for impairment at the ‗cash generating unit‘ level, rather than the reporting unit level considered by Canadian GAAP. The Company has identified more cash generating units than the reporting units currently used to assess for impairment under Canadian GAAP. Whether the Company will be materially impacted by this change will depend upon the facts at the time of each impairment test.
Joint ventures: Under IFRS, reporters may currently choose between proportionate consolidation and equity accounting for jointly controlled entities. Under the proposals for the revised joint venture standard, the proportionate consolidation option would be eliminated. In anticipation of this change to IFRS, the Company intends to adopt the equity accounting method for its joint ventures, which are currently proportionately consolidated under Canadian GAAP. This has no overall impact on net income or net assets of the Company, but alters the presentation of the joint venture entities in the financial statements.
Management continues to monitor standards to be issued by the IASB, but it remains difficult to predict the IFRS that will be effective at the end of the Company‘s first IFRS reporting period, as the IASB work plan anticipates the completion of several projects during 2011. Their projects on employee benefits, leases, revenue, financial instruments, and provisions are especially relevant to the Company.
Outstanding Share Data
As at February 11, 2011
Common shares outstanding 171,511,069
Options outstanding 5,423,885

Finning International Inc. Annual 2010 Results
39
Outlook
Finning‘s consolidated order backlog continued to increase and is at its highest level since the fourth quarter of 2008. This reflects increased demand for new equipment and strong quotation activity in all sectors, particularly in mining. In all markets, low hour, used equipment is in short supply and customer demand for rental equipment is robust. In all regions, mining product support remains strong and there is an increase in equipment rebuild work for large mining producers and contractors. Product support continues to improve in non-mining sectors as well.
As market conditions have strengthened, all regions are experiencing increased lead times from Caterpillar for new equipment. The Company is working closely with its customers and Caterpillar to plan for future equipment needs and is leveraging the entire dealer network to source equipment.
In Canada, the Company is experiencing increased demand for equipment and product support in all sectors. In mining, including the oil sands, quoting and new machine sales activity is very strong. In non-mining sectors, particularly heavy construction, forestry, and oil and gas, demand for equipment continues to improve. Product support revenues are growing in all sectors and large equipment overhaul and component remanufacturing activity is solid.
In South America, the Company is actively quoting to mining customers and receiving new orders for large equipment. At current copper and gold prices, investments in mining projects are at record levels and expected to remain very strong. Mining contracts are expected to continue to drive product support growth. In Chile, construction and power systems sales activity is projected to remain strong, as a result of significant investment in infrastructure and energy. The growing installed base of equipment will continue to contribute to ongoing product support growth in South America.
In the UK, the Company sees opportunities with coal mining, quarrying, waste, and plant hire customers for new equipment sales and product support. In power systems, order intake is improving as marine, oil and gas, and power and energy sectors are strengthening. The implications of recent announcements by the government to cut public spending while committing to significant investments in infrastructure are still being assessed.
Consolidated revenues are projected to grow, on average, at 10 percent per annum over the next three years. In 2011, mining deliveries are scheduled more towards the latter part of the year, which will drive stronger results in the second half. The revenue mix is expected to remain similar to 2010.
In addition to an ongoing focus on cost containment, the Company will continue to implement efficiency and productivity improvements to achieve operating leverage and drive higher profitability. SG&A as a percentage of revenue is projected to decline in the medium term towards the SG&A target of approximately 20%. The Company expects to make ongoing progress towards achieving a 10 percent consolidated EBIT margin in the medium term.
The Company anticipates higher net investments in capital expenditures and rental over the next three years to support its growth strategies, while continuing to generate solid free cash flow and maintain a strong balance sheet.
February 16, 2011
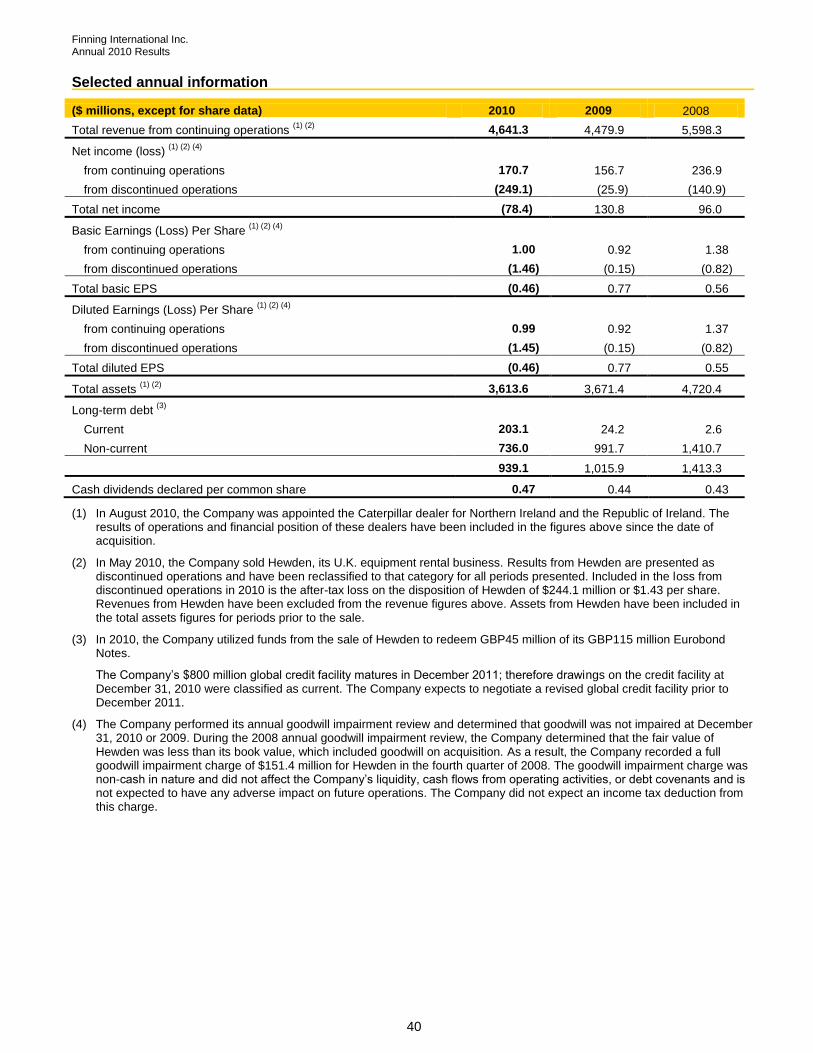
Finning International Inc. Annual 2010 Results
40
Selected annual information
($ millions, except for share data) 2010 2009 2008
Total revenue from continuing operations (1) (2)
4,641.3 4,479.9 5,598.3
Net income (loss) (1) (2) (4)
from continuing operations 170.7 156.7 236.9
from discontinued operations (249.1) (25.9) (140.9)
Total net income (78.4) 130.8 96.0
Basic Earnings (Loss) Per Share (1) (2) (4)
from continuing operations 1.00 0.92 1.38
from discontinued operations (1.46) (0.15) (0.82)
Total basic EPS (0.46) 0.77 0.56
Diluted Earnings (Loss) Per Share (1) (2) (4)
from continuing operations 0.99 0.92 1.37
from discontinued operations (1.45) (0.15) (0.82)
Total diluted EPS (0.46) 0.77 0.55
Total assets (1) (2)
3,613.6 3,671.4 4,720.4
Long-term debt (3)
Current 203.1 24.2 2.6
Non-current 736.0 991.7 1,410.7
939.1 1,015.9 1,413.3
Cash dividends declared per common share 0.47 0.44 0.43
(1) In August 2010, the Company was appointed the Caterpillar dealer for Northern Ireland and the Republic of Ireland. The results of operations and financial position of these dealers have been included in the figures above since the date of acquisition.
(2) In May 2010, the Company sold Hewden, its U.K. equipment rental business. Results from Hewden are presented as discontinued operations and have been reclassified to that category for all periods presented. Included in the loss from discontinued operations in 2010 is the after-tax loss on the disposition of Hewden of $244.1 million or $1.43 per share. Revenues from Hewden have been excluded from the revenue figures above. Assets from Hewden have been included in the total assets figures for periods prior to the sale.
(3) In 2010, the Company utilized funds from the sale of Hewden to redeem GBP45 million of its GBP115 million Eurobond Notes.
The Company‘s $800 million global credit facility matures in December 2011; therefore drawings on the credit facility at December 31, 2010 were classified as current. The Company expects to negotiate a revised global credit facility prior to December 2011.
(4) The Company performed its annual goodwill impairment review and determined that goodwill was not impaired at December 31, 2010 or 2009. During the 2008 annual goodwill impairment review, the Company determined that the fair value of Hewden was less than its book value, which included goodwill on acquisition. As a result, the Company recorded a full goodwill impairment charge of $151.4 million for Hewden in the fourth quarter of 2008. The goodwill impairment charge was non-cash in nature and did not affect the Company‘s liquidity, cash flows from operating activities, or debt covenants and is not expected to have any adverse impact on future operations. The Company did not expect an income tax deduction from this charge.
Finning International Inc. Annual 2010 Results
41
Forward-Looking Disclaimer
This report contains statements about the Company‘s business outlook, objectives, plans, strategic priorities and other statements that are not historical facts. A statement we make is forward-looking when it uses what we know and expect today to make a statement about the future. Forward-looking statements may include words such as aim, anticipate, assumption, believe, could, expect, goal, guidance, intend, may, objective, outlook, plan, project, seek, should, strategy, strive, target, and will. Forward-looking statements in this report include, but are not limited to, statements with respect to: expectations with respect to the economy and associated impact on the Company‘s financial results; the estimated annualized cost savings and anticipated restructuring charges related to actions taken by the Company in response to the economic downturn; expected revenue and EBIT growth; anticipated generation of free cash flow (including projected net capital and rental expenditures), and its expected use; anticipated defined benefit plan contributions; expected target range of Debt Ratio; and the expected quantitative impact on the consolidated statement of financial position of the Company‘s transition to IFRS at January 1, 2010. All such forward-looking statements are made pursuant to the ‗safe harbour‘ provisions of applicable Canadian securities laws.
Unless otherwise indicated by us, forward-looking statements in this report describe our expectations at February 16, 2011. Except as may be required by Canadian securities laws, we do not undertake any obligation to update or revise any forward-looking statement, whether as a result of new information, future events, or otherwise.
Forward-looking statements, by their very nature, are subject to numerous risks and uncertainties and are based on several assumptions which give rise to the possibility that actual results could differ materially from our expectations expressed in or implied by such forward-looking statements and that our business outlook, objectives, plans, strategic priorities and other statements that are not historical facts may not be achieved. As a result, we cannot guarantee that any forward-looking statement will materialize. Factors that could cause actual results or events to differ materially from those expressed in or implied by our forward-looking statements include: general economic and credit market conditions; foreign exchange rates; commodity prices; the level of customer confidence and spending, and the demand for, and prices of, our products and services; our dependence on the continued market acceptance of Caterpillar‘s products and Caterpillar‘s timely supply of parts and equipment; our ability to continue to implement our cost reduction initiatives while continuing to maintain customer service; our ability to control cost pressures as growth in revenues occur; our ability to attract sufficient skilled labour resources to meet growing product support demand; the intensity of competitive activity; our ability to raise the capital we need to implement our business plan; regulatory initiatives or proceedings, litigation and changes in laws or regulations; stock market volatility; changes in political and economic environments for operations; new or amended IFRS or interpretations that become effective prior to the inclusion of the Company‘s financial statement of position in its first annual audited IFRS financial statements. Forward-looking statements are provided in this report for the purpose of giving information about management‘s current expectations and plans and allowing investors and others to get a better understanding of our operating environment. However, readers are cautioned that it may not be appropriate to use such forward-looking statements for any other purpose.
Forward-looking statements made in this report are based on a number of assumptions that we believed were reasonable on the day we made the forward-looking statements. Refer in particular to the Market Outlook section of the MD&A. Some of the assumptions, risks, and other factors which could cause results to differ materially from those expressed in the forward-looking statements contained in this report are discussed in the Company‘s current Annual Information Form (AIF) in Section 4.
We caution readers that the risks described in the AIF are not the only ones that could impact us. Additional risks and uncertainties not currently known to us or that we currently deem to be immaterial may also have a material adverse effect on our business, financial condition, or results of operations.
Except as otherwise indicated by us, forward-looking statements do not reflect the potential impact of any non-recurring or other unusual items or of any dispositions, mergers, acquisitions, other business combinations or other transactions that may be announced or that may occur after the date hereof. The financial impact of these transactions and non-recurring and other unusual items can be complex and depends on the facts particular to each of them. We therefore cannot describe the expected impact in a meaningful way or in the same way we present known risks affecting our business.

Finning International Inc. Annual 2010 Results
42
Attachment 1: Supplementary Information
Quarterly Segmented Revenue Information
Three months ended December 31, 2010 ($ millions) Canada South America UK & Ireland Consolidated
Revenue percentage
New equipment $ 261.4 $ 257.1 $ 115.4 $ 633.9 46.4%
Used equipment 38.8 10.1 12.2 61.1 4.5%
Equipment rental 61.6 16.0 7.0 84.6 6.2%
Product support 306.6 222.1 54.4 583.1 42.7%
Other 3.2 0.4 — 3.6 0.2%
Total $ 671.6 $ 505.7 $ 189.0 $ 1,366.3 100.0%
Revenue percentage by operations 49.2% 37.0% 13.8% 100.0%
Three months ended December 31, 2009 ($ millions) Canada South America UK Consolidated
Revenue percentage
New equipment $ 266.7 $ 135.1 $ 68.1 $ 469.9 43.5%
Used equipment 48.6 7.2 10.4 66.2 6.1%
Equipment rental 48.2 11.2 12.8 72.2 6.7%
Product support 235.3 183.0 50.7 469.0 43.4%
Other 3.0 0.5 — 3.5 0.3%
Total $ 601.8 $ 337.0 $ 142.0 $ 1,080.8 100.0%
Revenue percentage by operations 55.7% 31.2% 13.1% 100.0%
Quarterly Segmented EBIT Information
Three months ended December 31, 2010 ($ millions) Canada South America UK & Ireland Other Consolidated
Revenue from external sources $ 671.6 $ 505.7 $ 189.0 $ — $ 1,366.3
Operating costs (586.6) (453.9) (178.6) (4.8) (1,223.9)
Depreciation and amortization (34.2) (9.4) (5.3) — (48.9)
50.8 42.4 5.1 (4.8) 93.5
Other income (expenses)
IT system implementation costs (3.5) (2.8) (0.2) (0.6) (7.1)
Other (2.0) — (0.3) (5.0) (7.3)
Earnings from continuing operations before interest and taxes (EBIT) $ 45.3 $ 39.6 $ 4.6 $ (10.4) $ 79.1
EBIT
- percentage of revenue 6.7% 7.8% 2.4% — 5.8%
- percentage by operations 57.3% 50.1% 5.8% (13.2)% 100.0%
Three months ended December 31, 2009 ($ millions) Canada South America UK Other Consolidated
Revenue from external sources $ 601.8 $ 337.0 $ 142.0 $ — $ 1,080.8
Operating costs (555.0) (297.9) (127.7) (6.7) (987.3)
Depreciation and amortization (29.6) (8.9) (5.9) (0.1) (44.5)
17.2 30.2 8.4 (6.8) 49.0
Other income (expenses)
IT system implementation costs (6.1) (4.8) (2.2) 6.9 (6.2)
Other (11.3) 7.0 (0.2) 1.4 (3.1)
Earnings from continuing operations before interest and taxes (EBIT) $ (0.2) $ 32.4 $ 6.0 $ 1.5 $ 39.7
EBIT
- percentage of revenue — 9.6% 4.2% — 3.7%
- percentage by operations (0.5)% 81.6% 15.1% 3.8% 100%

Finning International Inc. Annual 2010 Results
43
Attachment 1: Supplementary Information [continued]
Quarterly Consolidated Statements of Income
Three months ended December 31 (Canadian $ thousands, except share and per share amounts)
2010 unaudited
2009 unaudited
Revenue
New equipment $ 633,933 $ 469,873
Used equipment 61,069 66,225
Equipment rental 84,661 72,173
Product support 583,100 469,047
Other 3,535 3,503
Total revenue 1,366,298 1,080,821
Cost of sales 968,362 783,589
Gross profit 397,936 297,232
Selling, general, and administrative expenses 304,390 248,143
Other expenses (income) 14,497 9,371
Earnings from continuing operations before interest and income taxes 79,049 39,718
Finance costs 12,806 16,918
Income from continuing operations before provision for income taxes 66,243 22,800
Provision for income taxes 16,137 1,085
Income from continuing operations 50,106 21,715
Loss from discontinued operations, net of tax — (5,401)
Net income $ 50,106 $ 16,314
Earnings (loss) per share – basic
From continuing operations $ 0.29 $ 0.13
From discontinued operations — (0.03)
$ 0.29 $ 0.10
Earnings (loss) per share – diluted From continuing operations
From continuing operations $ 0.29 $ 0.13
From discontinued operations — (0.03)
$ 0.29 $ 0.10
Weighted average number of shares outstanding
Basic 171,247,563 170,687,152
Diluted 172,224,467 171,114,239
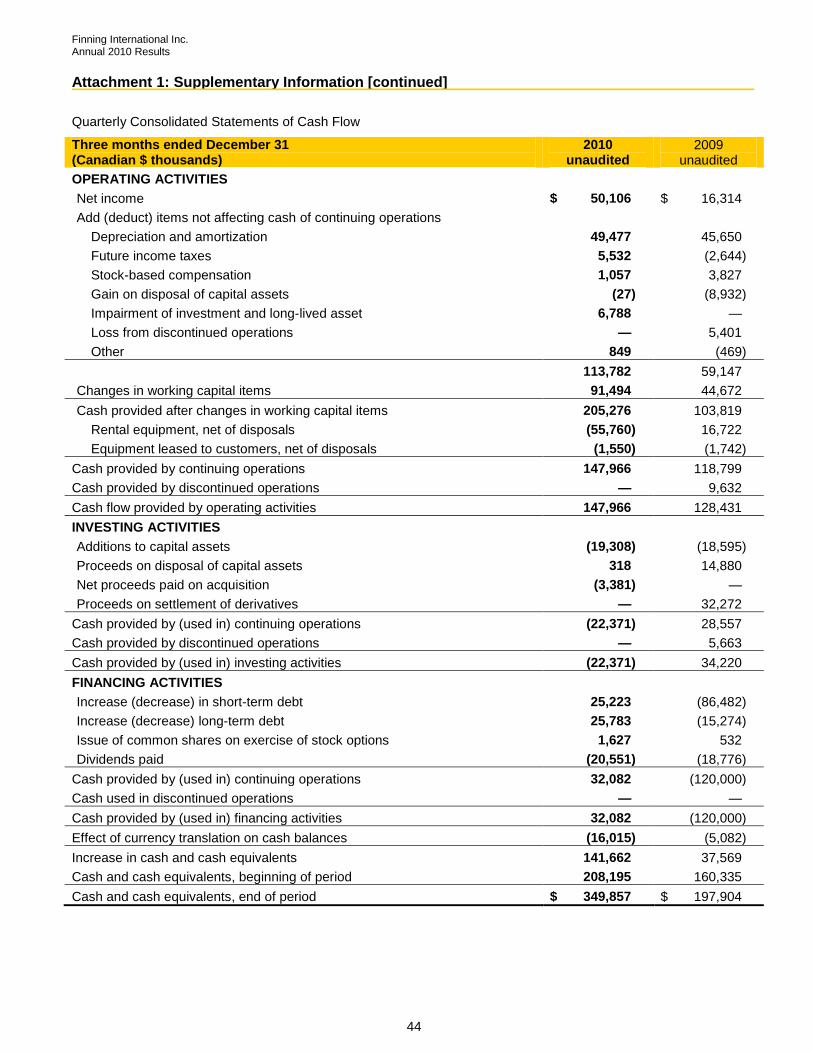
Finning International Inc. Annual 2010 Results
44
Attachment 1: Supplementary Information [continued]
Quarterly Consolidated Statements of Cash Flow
Three months ended December 31 (Canadian $ thousands)
2010 unaudited
2009 unaudited
OPERATING ACTIVITIES
Net income $ 50,106 $ 16,314
Add (deduct) items not affecting cash of continuing operations
Depreciation and amortization 49,477 45,650
Future income taxes 5,532 (2,644)
Stock-based compensation 1,057 3,827
Gain on disposal of capital assets (27) (8,932)
Impairment of investment and long-lived asset 6,788 —
Loss from discontinued operations — 5,401
Other 849 (469)
113,782 59,147
Changes in working capital items 91,494 44,672
Cash provided after changes in working capital items 205,276 103,819
Rental equipment, net of disposals (55,760) 16,722
Equipment leased to customers, net of disposals (1,550) (1,742)
Cash provided by continuing operations 147,966 118,799
Cash provided by discontinued operations — 9,632
Cash flow provided by operating activities 147,966 128,431
INVESTING ACTIVITIES
Additions to capital assets (19,308) (18,595)
Proceeds on disposal of capital assets 318 14,880
Net proceeds paid on acquisition (3,381) —
Proceeds on settlement of derivatives — 32,272
Cash provided by (used in) continuing operations (22,371) 28,557
Cash provided by discontinued operations — 5,663
Cash provided by (used in) investing activities (22,371) 34,220
FINANCING ACTIVITIES
Increase (decrease) in short-term debt 25,223 (86,482)
Increase (decrease) long-term debt 25,783 (15,274)
Issue of common shares on exercise of stock options 1,627 532
Dividends paid (20,551) (18,776)
Cash provided by (used in) continuing operations 32,082 (120,000)
Cash used in discontinued operations — —
Cash provided by (used in) financing activities 32,082 (120,000)
Effect of currency translation on cash balances (16,015) (5,082)
Increase in cash and cash equivalents 141,662 37,569
Cash and cash equivalents, beginning of period 208,195 160,335
Cash and cash equivalents, end of period $ 349,857 $ 197,904

Finning International Inc. Annual 2010 Results
45
MANAGEMENT'S REPORT TO THE SHAREHOLDERS
The accompanying Consolidated Financial Statements and Management‘s Discussion and Analysis (MD&A) are the responsibility of Finning International Inc.‘s management. The Consolidated Financial Statements have been prepared in accordance with accounting principles generally accepted in Canada which recognize the necessity of relying on some of management's best estimates and informed judgements.
The Company maintains an accounting system and related controls to provide management with reasonable assurance that transactions are executed and recorded in accordance with its authorizations, that assets are properly safeguarded and accounted for, and that financial records are reliable for preparation of financial statements.
The Company's independent auditors, Deloitte & Touche LLP, have audited the Consolidated Financial Statements, as reflected in their report for 2010.
The Board of Directors oversees management‘s responsibilities for the Consolidated Financial Statements primarily through the activities of its Audit Committee. The Audit Committee of the Board of Directors is composed solely of directors who are neither officers nor employees of the Company. The Committee meets regularly during the year with management of the Company and the Company‘s independent auditors to review the Company‘s interim and annual financial statements and MD&A. The Audit Committee also reviews internal accounting controls, risk management, internal and external audit results and accounting principles and practices. The Audit Committee is responsible for approving the remuneration and terms of engagement of the Company‘s independent auditors. The Audit Committee also meets with the independent auditors, without management present, to discuss the results of their audit and the quality of financial reporting. On a quarterly basis, the Audit Committee reports its findings to the Board of Directors, and recommends approval of the interim and annual Consolidated Financial Statements.
The Consolidated Financial Statements and MD&A have, in management's opinion, been properly prepared within reasonable limits of materiality and within the framework of the accounting policies summarized in Note 1 of the Notes to the Consolidated Financial Statements.
M.T. Waites D.S. Smith President and Chief Executive Officer Executive Vice President and Chief Financial Officer
February 16, 2011 Vancouver, BC, Canada
Finning International Inc. Annual 2010 Results
46
AUDITORS’ REPORT
We have audited the accompanying consolidated financial statements of Finning International Inc., which comprise the consolidated balance sheets as at December 31, 2010 and 2009 and the consolidated statements of income (loss), changes in shareholders' equity, comprehensive income (loss) and cash flows for the years then ended, and a summary of significant accounting policies and other explanatory information.
Management's responsibility for the consolidated financial statements
Management is responsible for the preparation and fair presentation of these consolidated financial statements in accordance with Canadian generally accepted accounting principles, and for such internal control as management determines is necessary to enable the preparation of consolidated financial statements that are free from material misstatement, whether due to fraud or error.
Auditor's responsibility
Our responsibility is to express an opinion on these consolidated financial statements based on our audits. We conducted our audits in accordance with Canadian generally accepted auditing standards. Those standards require that we comply with ethical requirements and plan and perform the audit to obtain reasonable assurance about whether the consolidated financial statements are free from material misstatement.
An audit involves performing procedures to obtain audit evidence about the amounts and disclosures in the consolidated financial statements. The procedures selected depend on the auditor's judgment, including the assessment of the risks of material misstatement of the consolidated financial statements, whether due to fraud or error. In making those risk assessments, the auditor considers internal control relevant to the entity's preparation and fair presentation of the consolidated financial statements in order to design audit procedures that are appropriate in the circumstances, but not for the purpose of expressing an opinion on the effectiveness of the entity's internal control. An audit also includes evaluating the appropriateness of accounting policies used and the reasonableness of accounting estimates made by management, as well as evaluating the overall presentation of the consolidated financial statements.
We believe that the audit evidence we have obtained in our audits is sufficient and appropriate to provide a basis for our audit opinion.
Opinion
In our opinion, the consolidated financial statements present fairly, in all material respects, the financial position of Finning International Inc. as at December 31, 2010 and 2009 and the results of its operations and its cash flows for the years then ended in accordance with Canadian generally accepted accounting principles.
Chartered Accountants February 16, 2011 Vancouver, B.C., Canada

Finning International Inc. Annual 2010 Results Consolidated Financial Statements
47
CONSOLIDATED STATEMENTS OF INCOME (LOSS)
For years ended December 31 (Canadian $ thousands, except share and per share amounts) 2010 2009
Revenue
New equipment $ 1,940,648 $ 1,983,827
Used equipment 272,388 290,227
Equipment rental 299,911 310,187
Product support 2,117,663 1,883,681
Other 10,692 11,998
Total revenue 4,641,302 4,479,920
Cost of sales 3,256,098 3,191,719
Gross profit 1,385,204 1,288,201
Selling, general, and administrative expenses 1,069,593 1,007,566
Other expenses (Note 2) 40,648 33,739
Earnings from continuing operations before interest and income taxes 274,963 246,896
Finance costs (Notes 3 and 4) 58,701 61,793
Income from continuing operations before provision for income taxes 216,262 185,103
Provision for income taxes (Note 6) 45,546 28,396
Income from continuing operations 170,716 156,707
Loss from discontinued operations, net of tax (Note 20) (249,089) (25,884)
Net income (loss) $ (78,373) $ 130,823
Earnings (loss) per share - basic
From continuing operations (Note 9) $ 1.00 $ 0.92
From discontinued operations (1.46) (0.15)
$ (0.46) $ 0.77
Earnings (loss) per share - diluted
From continuing operations (Note 9) $ 0.99 $ 0.92
From discontinued operations (1.45) (0.15)
$ (0.46) $ 0.77
Weighted average number of shares outstanding
Basic 171,029,585 170,607,892
Diluted 171,718,261 170,993,485 The accompanying Notes to the Consolidated Financial Statements are an integral part of these statements.

Finning International Inc. Annual 2010 Results Consolidated Financial Statements
48
CONSOLIDATED BALANCE SHEETS
December 31 (Canadian $ thousands)
2010 2009
ASSETS
Current assets
Cash and cash equivalents (Note 18) $ 349,857 $ 146,055
Accounts receivable 669,192 584,203
Service work in progress 73,602 62,563
Inventories (Note 10) 1,086,924 992,075
Other assets (Note 11) 198,941 197,275
Assets of discontinued operations (Note 20) — 101,490
Total current assets 2,378,516 2,083,661
Finance assets (Note 12) 30,158 32,604
Rental equipment (Note 13) 417,140 440,809
Land, buildings, and equipment (Note 14) 440,864 439,712
Intangible assets (Note 14) 45,752 32,450
Goodwill (Note 15) 91,114 94,254
Other assets (Note 11) 210,097 212,905
Assets of discontinued operations (Note 20) — 335,040
$ 3,613,641 $ 3,671,435
LIABILITIES
Current liabilities
Short-term debt (Note 3) $ 92,739 $ 162,238
Accounts payable and accruals 1,004,148 697,260
Income tax payable 8,127 8,429
Current portion of long-term debt (Note 3) 203,087 24,179
Liabilities of discontinued operations (Note 20) — 52,876
Total current liabilities 1,308,101 944,982
Long-term debt (Note 3) 736,056 991,732
Long-term obligations (Note 16) 106,477 105,878
Future income taxes (Note 6) 76,420 80,388
Liabilities of discontinued operations (Note 20) — 32,769
Total liabilities 2,227,054 2,155,749
Commitments and contingencies (Notes 24 and 25)
SHAREHOLDERS’ EQUITY
Share capital (Note 7) 564,973 557,052
Contributed surplus 35,735 33,509
Accumulated other comprehensive loss (274,346) (293,869)
Retained earnings 1,060,225 1,218,994
Total shareholders‘ equity 1,386,587 1,515,686
$ 3,613,641 $ 3,671,435
APPROVED BY THE DIRECTORS:
K.M. O‘Neill, Director D.W.G. Whitehead, Director The accompanying Notes to the Consolidated Financial Statements are an integral part of these statements.

Finning International Inc. Annual 2010 Results Consolidated Financial Statements
49
CONSOLIDATED STATEMENTS OF COMPREHENSIVE INCOME (LOSS)
For years ended December 31 (Canadian $ thousands) 2010 2009
Net income (loss) $ (78,373) $ 130,823
Other comprehensive income (loss), net of income tax
Currency translation adjustments (98,793) (165,606)
Unrealized gain on net investment hedges 16,768 55,594
Realized loss on foreign currency translation, net of realized gain on net investment hedges, reclassified to earnings on disposal of discontinued operations 82,833 —
Tax recovery (expense) on net investment hedges 14,938 (18,040)
Foreign currency translation and gain (loss) on net investment hedges 15,746 (128,052)
Unrealized gain (loss) on cash flow hedges 3,817 10,318
Realized loss (gain) on cash flow hedges, reclassified to earnings 1,127 2,657
Tax recovery (expense) on cash flow hedges (1,167) (2,348)
Gains (loss) on cash flow hedges 3,777 10,627
Comprehensive income (loss) $ (58,850) $ 13,398
CONSOLIDATED STATEMENTS OF SHAREHOLDERS’ EQUITY
Share Capital
Accumulated Other Comprehensive Income
(Loss)
($ Canadian thousands, except share amounts) Shares Amount
Contributed Surplus
Foreign Currency
Translation and Gain / (Loss) on
Net Investment
Hedges
Gain / (Loss) on Cash Flow
Hedges Retained Earnings Total
Balance, January 1, 2009 170,445,067 $ 554,966 $ 25,441 $ (160,971) $ (15,473) $ 1,163,141 $ 1,567,104
Comprehensive income (loss) — — — (128,052) 10,627 130,823 13,398
Issued on exercise of stock options 301,733 2,086 (121) — — — 1,965
Stock option expense — — 8,189 — — — 8,189
Dividends on common shares — — — — — (74,970) (74,970)
Balance, December 31, 2009 170,746,800 $ 557,052 $ 33,509 $ (289,023) $ (4,846) $ 1,218,994 $ 1,515,686
Comprehensive income (loss) — — — 15,746 3,777 (78,373) (58,850)
Issued on exercise of stock options 684,549 7,921 (3,084) — — — 4,837
Stock option expense — — 5,310 — — — 5,310
Dividends on common shares — — — — — (80,396) (80,396)
Balance, December 31, 2010 171,431,349 $ 564,973 $ 35,735 $ (273,277) $ (1,069) $ 1,060,225 $ 1,386,587
The accompanying Notes to the Consolidated Financial Statements are an integral part of these statements

Finning International Inc. Annual 2010 Results Consolidated Financial Statements
50
CONSOLIDATED STATEMENTS OF CASH FLOW
For years ended December 31 (Canadian $ thousands) 2010 2009
OPERATING ACTIVITIES
Net income $ (78,373) $ 130,823
Add (deduct) items not affecting cash of continuing operations
Depreciation and amortization 179,754 198,946
Future income taxes (4,104) 6,551
Stock-based compensation 5,974 11,142
Gain on disposal of capital assets (Note 2) (106) (9,061)
Impairment of investment and long-lived asset (Note 2) 6,788 —
Loss from discontinued operations (Note 20) 249,089 25,884
Other 6,784 1,632
365,806 365,917
Changes in working capital items (Note 18) 85,814 145,282
Cash provided after changes in working capital items 451,620 511,199
Rental equipment, net of disposals (122,944) 14,377
Equipment leased to customers, net of disposals (3,469) (27,203)
Cash provided by continuing operations 325,207 498,373
Cash provided by discontinued operations (2,664) 63,984
Cash flow provided by operating activities 322,543 562,357
INVESTING ACTIVITIES
Additions to capital assets (66,475) (104,914)
Proceeds on disposal of capital assets 5,003 19,546
Net proceeds paid on acquisition (Note 19) (6,725) —
Net proceeds from sale of discontinued operations (Note 20) 117,829 —
Proceeds on settlement of derivatives 25,983 20,020
Cash provided by (used in) continuing operations 75,615 (65,348)
Cash provided by (used in) discontinued operations (27,206) 16,902
Cash provided by (used in) investing activities 48,409 (48,446)
FINANCING ACTIVITIES
Increase (decrease) in short-term debt (67,139) 28,040
Increase (decrease) in long-term debt 17,034 (344,477)
Purchase of Eurobond Notes and premium paid (Note 3) (73,156) —
Issue of common shares on exercise of stock options 4,837 1,965
Dividends paid (80,396) (74,970)
Cash used in continuing operations (198,820) (389,442)
Cash used in discontinued operations — (20,377)
Cash used in financing activities (198,820) (409,819)
Effect of currency translation on cash balances (20,179) (15,960)
Increase in cash and cash equivalents 151,953 88,132
Cash and cash equivalents, beginning of year 197,904 109,772
Cash and cash equivalents, end of year $ 349,857 $ 197,904
See supplemental cash flow information, Note 18 The accompanying Notes to the Consolidated Financial Statements are an integral part of these statements.
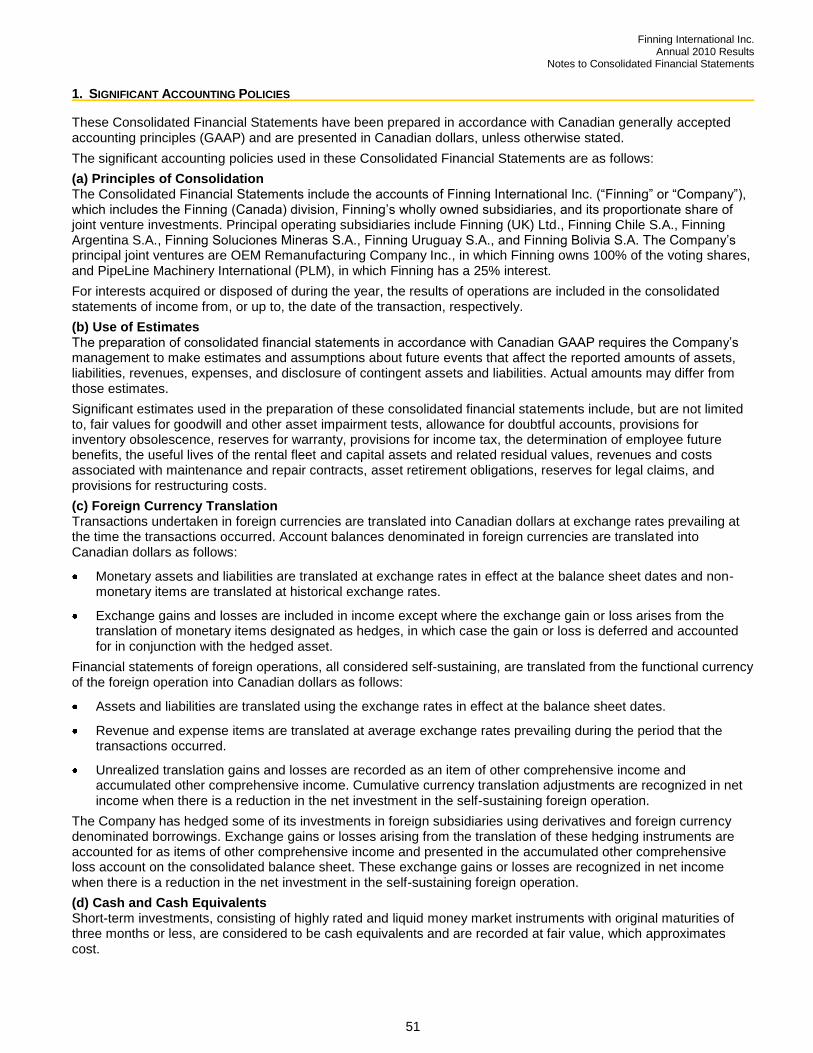
Finning International Inc. Annual 2010 Results Notes to Consolidated Financial Statements
51
1. SIGNIFICANT ACCOUNTING POLICIES
These Consolidated Financial Statements have been prepared in accordance with Canadian generally accepted accounting principles (GAAP) and are presented in Canadian dollars, unless otherwise stated.
The significant accounting policies used in these Consolidated Financial Statements are as follows:
(a) Principles of Consolidation The Consolidated Financial Statements include the accounts of Finning International Inc. (―Finning‖ or ―Company‖), which includes the Finning (Canada) division, Finning‘s wholly owned subsidiaries, and its proportionate share of joint venture investments. Principal operating subsidiaries include Finning (UK) Ltd., Finning Chile S.A., Finning Argentina S.A., Finning Soluciones Mineras S.A., Finning Uruguay S.A., and Finning Bolivia S.A. The Company‘s principal joint ventures are OEM Remanufacturing Company Inc., in which Finning owns 100% of the voting shares, and PipeLine Machinery International (PLM), in which Finning has a 25% interest.
For interests acquired or disposed of during the year, the results of operations are included in the consolidated statements of income from, or up to, the date of the transaction, respectively.
(b) Use of Estimates The preparation of consolidated financial statements in accordance with Canadian GAAP requires the Company‘s management to make estimates and assumptions about future events that affect the reported amounts of assets, liabilities, revenues, expenses, and disclosure of contingent assets and liabilities. Actual amounts may differ from those estimates.
Significant estimates used in the preparation of these consolidated financial statements include, but are not limited to, fair values for goodwill and other asset impairment tests, allowance for doubtful accounts, provisions for inventory obsolescence, reserves for warranty, provisions for income tax, the determination of employee future benefits, the useful lives of the rental fleet and capital assets and related residual values, revenues and costs associated with maintenance and repair contracts, asset retirement obligations, reserves for legal claims, and provisions for restructuring costs.
(c) Foreign Currency Translation Transactions undertaken in foreign currencies are translated into Canadian dollars at exchange rates prevailing at the time the transactions occurred. Account balances denominated in foreign currencies are translated into Canadian dollars as follows:
Monetary assets and liabilities are translated at exchange rates in effect at the balance sheet dates and non-monetary items are translated at historical exchange rates.
Exchange gains and losses are included in income except where the exchange gain or loss arises from the translation of monetary items designated as hedges, in which case the gain or loss is deferred and accounted for in conjunction with the hedged asset.
Financial statements of foreign operations, all considered self-sustaining, are translated from the functional currency of the foreign operation into Canadian dollars as follows:
Assets and liabilities are translated using the exchange rates in effect at the balance sheet dates.
Revenue and expense items are translated at average exchange rates prevailing during the period that the transactions occurred.
Unrealized translation gains and losses are recorded as an item of other comprehensive income and accumulated other comprehensive income. Cumulative currency translation adjustments are recognized in net income when there is a reduction in the net investment in the self-sustaining foreign operation.
The Company has hedged some of its investments in foreign subsidiaries using derivatives and foreign currency denominated borrowings. Exchange gains or losses arising from the translation of these hedging instruments are accounted for as items of other comprehensive income and presented in the accumulated other comprehensive loss account on the consolidated balance sheet. These exchange gains or losses are recognized in net income when there is a reduction in the net investment in the self-sustaining foreign operation.
(d) Cash and Cash Equivalents Short-term investments, consisting of highly rated and liquid money market instruments with original maturities of three months or less, are considered to be cash equivalents and are recorded at fair value, which approximates cost.

Finning International Inc. Annual 2010 Results Notes to Consolidated Financial Statements
52
(e) Inventories Inventories are assets held for sale in the ordinary course of business, in the process of production for sale, or in the form of materials or supplies to be consumed in the production process or in the rendering of services. Inventories are stated at the lower of cost and net realizable value. Cost is determined on a specific item basis for on-hand equipment, and on a weighted average cost basis for parts and supplies. The cost of inventories includes all costs of purchase, conversion costs, and other costs incurred in bringing inventories to their existing location and condition. In the case of internal service work in progress on equipment, cost includes an appropriate share of overhead costs based on normal operating capacity.
(f) Other Assets Investments in which the Company exercises significant influence, but not control, are accounted for using the equity method. A long-term investment is considered impaired if its fair value falls below its cost, and the decline is considered other than temporary.
(g) Income Taxes The asset and liability method of tax allocation is used in accounting for income taxes. Under this method, temporary differences arising from the difference between the tax basis of an asset and a liability and its carrying amount on the balance sheet are used to calculate future income tax assets or liabilities. Future income tax assets or liabilities are calculated using tax rates anticipated to be in effect in the periods that the temporary differences are expected to reverse. The effect of a change in income tax rates on future income tax assets and liabilities is recognized in income in the period that the change becomes substantively enacted.
(h) Finance Assets Finance assets comprise instalment notes receivable and equipment leased to customers on long-term financing leases.
Instalment notes receivable represents amounts due from customers relating to financing of equipment sold and parts and service sales. These receivables are recorded net of unearned finance charges.
Depreciation of equipment leased to customers is provided in equal monthly amounts over the terms of the individual leases after recognizing the estimated residual value of each unit at the end of each lease. Depreciation is recorded in cost of sales in the consolidated statement of income.
(i) Rental Equipment Rental equipment is available for short and medium term rentals and is recorded at cost, net of accumulated depreciation. Cost is determined on a specific item basis. Rental equipment is depreciated to its estimated residual value over its estimated useful life on a straight-line or on an actual usage basis. Depreciation is recorded in cost of sales in the consolidated statement of income.
(j) Capital Assets Land, buildings, and equipment are recorded at cost, net of accumulated depreciation. Depreciation of capital assets is recorded in selling, general, and administrative expenses in the consolidated statement of income.
Buildings and equipment are depreciated over their estimated useful lives on either a declining balance or straight-line basis using the following annual rates:
Buildings 2% - 5% General equipment 10% - 33% Automotive equipment 20% - 33%
Intangible assets with indefinite lives are not amortized. Intangible assets with finite lives are amortized on a straight-line basis over their estimated useful lives, which range to a maximum period of ten years. Amortization is recorded in selling, general, and administrative expenses in the consolidated statement of income.
(k) Goodwill Goodwill represents the excess cost of an investment over the fair value of the net assets acquired and is not amortized.

Finning International Inc. Annual 2010 Results Notes to Consolidated Financial Statements
53
(l) Asset Impairment The Company reviews both long-lived assets to be held and used and identifiable intangible assets with finite lives for impairment whenever events or changes in circumstances indicate that the carrying amount of such assets may not be fully recoverable. Determination of recoverability is based on an estimate of undiscounted future cash flows resulting from the use of the asset and its eventual disposition. Measurement of an impairment loss for long-lived assets and certain identifiable intangible assets that management expects to hold and use is based on the fair value of the assets, whereas assets to be disposed of are reported at the lower of carrying amount or fair value less estimated selling costs. In 2010, continued weak economic conditions in Europe and poor operating performance from the Company‘s equity investment in Energyst B.V., combined with a very competitive market environment, triggered the requirement for an impairment analysis on the Company‘s investment – see Note 2. As at December 31, 2009, the Company determined that there were no triggering events requiring an impairment analysis.
Goodwill and intangible assets with indefinite lives are subject to an annual assessment for impairment unless events or changes in circumstances indicate that the value may not be fully recoverable, in which case the assessment is done at that time. Goodwill and intangible assets with indefinite lives are assessed primarily by applying a fair value-based test at the reporting unit level. The fair value is estimated using the present value of expected future cash flows. The Company also considers projected future operating results, trends, and other circumstances in making such evaluations. An impairment loss would be recognized to the extent the carrying amount of goodwill or intangible assets exceeds their fair value. There was no goodwill impairment identified in 2010 and 2009 following the Company‘s annual impairment review.
(m) Leases Leases entered into by the Company as lessee are classified as either capital or operating leases. Leases where substantially all of the benefits and risks of ownership of property rest with the Company are accounted for as capital leases. Equipment under capital lease is depreciated on the same basis as capital assets. Gains or losses resulting from sale/leaseback transactions are deferred and amortized in proportion to the amortization of the leased asset. Rental payments under operating leases are expensed as incurred.
(n) Asset Retirement Obligations The Company recognizes its legal obligations for the retirement of certain tangible long-lived assets. The fair value of a liability for an asset retirement obligation is recognized in the period in which it is incurred if a reasonable estimate of fair value can be made. The associated asset retirement costs are capitalized as part of the carrying amount of the long-lived asset and then amortized over the estimated useful life. In subsequent periods, the asset retirement obligation is adjusted for the passage of time and any changes in the amount or timing of the underlying future cash flows through charges to earnings. A gain or loss may be incurred upon settlement of the liability.
(o) Revenue Recognition Revenue recognition, with the exception of cash sales, occurs when there is a written arrangement in the form of a contract or purchase order with the customer, a fixed or determinable sales price is established with the customer, performance requirements are achieved, and ultimate collection of the revenue is reasonably assured. Revenue is recognized as performance requirements are achieved in accordance with the following:
Revenue from sales of equipment is recognized at the time title to the equipment and significant risks and rewards of ownership passes to the customer, which is generally at the time of shipment of the product to the customer;
Revenue from sales of equipment includes construction contracts with customers that involve the design, installation, and assembly of power and energy equipment systems. Revenue is recognized on a percentage of completion basis proportionate to the work that has been completed which is based on associated costs incurred;
Revenue from equipment rentals and operating leases is recognized in accordance with the terms of the relevant agreement with the customer, either evenly over the term of that agreement or on a usage basis such as the number of hours that the equipment is used; and
Revenue from product support includes sales of parts and servicing of equipment. For sales of parts, revenue is recognized when the part is shipped to the customer or when the part is installed in the customer‘s equipment. For servicing of equipment, revenue is recognized as the service work is performed. Product support is also offered to customers in the form of long-term maintenance and repair contracts. For these contracts, revenue is recognized on a basis proportionate to the service work that has been performed based on the parts and labour service provided. Parts revenue is recognized based on parts list price and service revenue is recognized based on standard billing labour rates. Any losses estimated during the term of the contract are recognized when identified.

Finning International Inc. Annual 2010 Results Notes to Consolidated Financial Statements
54
(p) Stock-Based Compensation The Company has stock option plans and other stock-based compensation plans for directors and certain eligible employees which are described in Note 8. Stock-based awards are measured and recognized using a fair value-based method of accounting.
The Company determines the cost of all stock options granted since January 1, 2003 using the fair value-based method of accounting for stock options. This method of accounting uses an option-pricing model to determine the fair value of stock options granted. Fair value is determined on the grant date of the stock option and recorded as compensation expense over the vesting period, with a corresponding increase to contributed surplus. For stock options granted prior to January 1, 2003, the Company recorded no compensation expense and will continue to use the intrinsic value-based method of accounting for those stock options. When stock options are exercised, the proceeds received by the Company, together with any related amount recorded in contributed surplus, are credited to share capital.
Compensation expense which arises from fluctuations in the market price of the Company‘s common shares underlying other stock-based compensation plans (net of hedging instruments) is recognized in selling, general, and administrative expense in the consolidated income statement with the corresponding liability recorded on the consolidated balance sheet in long-term obligations.
(q) Employee Future Benefits The Company and its subsidiaries offer a number of benefit plans that provide pension and other benefits to many of its employees in Canada and the U.K. These plans include defined benefit and defined contribution plans.
The Company‘s South American employees do not participate in employer pension plans but are covered by country specific legislation with respect to post employment benefit plans. The Company accrues its obligations to employees under these arrangements based on the actuarial valuation of anticipated payments to employees.
Defined benefit plans: The cost of pensions and other retirement benefits is determined by independent actuaries using the projected benefit method prorated on service and management‘s best estimates of assumptions including the expected return on plan assets and salary escalation rate, along with the use of a discount rate as prescribed under Canadian Institute of Chartered Accountants (CICA) Section 3461, Employee Future Benefits.
For the purpose of calculating the expected return on plan assets, those assets are valued at fair value.
Past service costs from plan amendments are amortized on a straight-line basis over the expected average remaining service life of employees active at the date of amendment.
Actuarial gains and losses arise from differences between actual experience and that expected as a result of economic, demographic, and other assumptions made. These include the difference between the actual and expected rate of return on plan assets for a period, and differences from changes in actuarial assumptions used to determine the accrued benefit obligation. The excess of the net accumulated actuarial gains or losses over 10% of the greater of the accrued benefit obligation and the fair value of the plan assets is amortized on a straight-line basis over the expected average remaining service life of the active employees covered by the plans.
Upon adoption of CICA 3461 on January 1, 2000, a transitional asset or obligation was determined for each plan as a result of the new standard. The Company is amortizing these transitional amounts on a straight-line basis over 13 years for the Finning (Canada) plans and over 14 years for the Finning (UK) plan, representing the average remaining service period of employees expected to receive benefits under the benefit plans as of January 1, 2000, the transition date.
Defined contribution plans: The cost of pension benefits includes the current service cost, which comprise the actual contributions made by the Company during the year. These contributions are based on a fixed percentage of member earnings for the year.
(r) Comprehensive Income, Financial Instruments, and Hedges Comprehensive Income Comprehensive income comprises the Company‘s net income and other comprehensive income and represents changes in shareholders‘ equity during a period arising from non-owner sources. Other comprehensive income includes currency translation adjustments on the Company‘s net investment in self-sustaining foreign operations and related hedging gains and losses, unrealized gains and losses on available-for-sale securities, and hedging gains and losses on cash flow hedges. The Company‘s comprehensive income, components of other comprehensive income, and accumulated other comprehensive income are presented in the Statements of Comprehensive Income and the Statements of Shareholders‘ Equity.

Finning International Inc. Annual 2010 Results Notes to Consolidated Financial Statements
55
Financial Assets and Financial Liabilities Classification
The Company has made the following classification of its financial assets and financial liabilities:
Cash equivalents are classified as Held for Trading. They are measured at fair value with realized and unrealized gains and losses reported in net income.
Accounts receivable, instalment notes receivable, and supplier claims receivable are classified as Loans and Receivables. They are measured at amortized cost using the effective interest rate method. At December 31, 2010 and 2009, the recorded amount approximates fair value.
Short-term and long-term debt and accounts payable and accruals are classified as ―Other Financial Liabilities‖. They are measured at amortized cost using the effective interest rate method. At December 31, 2010 and 2009, the measured amount approximates fair value, with the exception of long-term debt. The estimated fair value of the Company‘s long-term debt as at December 31, 2010 and 2009 is disclosed in Note 4.
Transaction costs directly attributable to the acquisition or issue of a financial asset or financial liability (except those held for trading) are included in the carrying amount of the financial asset or financial liability, and are amortized to income using the effective interest method.
Derivatives All derivative instruments are recorded on the balance sheet at fair value.
Embedded Derivatives Derivatives may be embedded in other financial instruments (host instruments). Embedded derivatives are treated as separate derivatives when their economic characteristics and risks are not closely related to those of the host instrument, the terms of the embedded derivative are the same as those of a stand-alone derivative, and the combined contract is not classified as Held for Trading. These embedded derivatives are measured at fair value on the balance sheet with subsequent changes in fair value recognized in income. The Company has not identified any embedded derivatives that are required to be accounted for separately from the host contract.
Hedges The Company utilizes derivative financial instruments and foreign currency debt in order to manage its foreign currency and interest rate exposures, and stock-based compensation expenses which fluctuate with share price movements. The Company uses derivative financial instruments only in connection with managing related risk positions and does not use them for trading or speculative purposes.
The Company determines whether or not to formally designate, for accounting purposes, eligible hedging relationships between hedging instruments and hedged items. This process includes linking derivatives to specific risks from assets or liabilities on the balance sheet or specific firm commitments or forecasted transactions. For hedges designated as such for accounting purposes, the Company formally assesses, both at inception and on an ongoing basis, whether the hedging instrument is highly effective in offsetting changes in fair value or cash flows associated with the identified hedged items. When derivative instruments have been designated as a hedge and are highly effective in offsetting the identified hedged risk, hedge accounting is applied to the derivative instruments. The ineffective portion of hedging gains and losses of highly effective hedges is reported in income. The accounting treatment for the types of hedges used by the Company is described below.
Cash Flow Hedges The Company uses foreign exchange forward contracts and, at times, options to hedge the currency risk associated with certain foreign currency purchase commitments, payroll, and associated accounts payable and accounts receivable for periods up to two years in advance. The effective portion of hedging gains and losses associated with these cash flow hedges is recorded, net of tax, in other comprehensive income and is released from accumulated other comprehensive income and recorded in the same income statement caption as the underlying item when the hedged item affects income.
When a hedging instrument expires or is sold, or when a hedge is discontinued or no longer meets the criteria for hedge accounting, any accumulated gain or loss recorded in other comprehensive income at that time remains in other comprehensive income until the originally hedged transaction affects income. When a forecasted transaction is no longer expected to occur, the accumulated gain or loss that was reported in other comprehensive income is immediately recorded in the income statement.
Gains and losses relating to forward foreign exchange contracts that are not designated as hedges for accounting purposes are recorded in selling, general, and administrative expenses.
From time to time, the Company uses derivative financial instruments to hedge interest rate risk associated with future proceeds of debt.

Finning International Inc. Annual 2010 Results Notes to Consolidated Financial Statements
56
As at December 31, 2010, approximately $2.1 million of net gains (net of tax) included in accumulated other comprehensive income are expected to be reclassified to current earnings over the next twelve months when earnings are affected by the hedged transactions.
Fair Value Hedges Changes in the fair value of derivatives designated and qualifying as fair value hedging instruments are recorded in income along with changes in the fair value of the hedged item attributable to the hedged risk.
Generally, if a hedging relationship no longer meets the criteria for hedge accounting, the cumulative adjustment to the carrying amount of the hedged item is amortized to income based on a recalculated effective interest rate over the remaining expected life of the hedged item, unless the hedged item has been derecognized in which case the cumulative adjustment is recorded immediately in the income statement.
Net Investment Hedges The Company typically uses foreign currency debt and, at times, foreign exchange forward contracts to hedge foreign currency gains and losses on its long-term net investments in self-sustaining foreign operations. The effective portion of the gain or loss of such instruments associated with the hedged risk is recorded in other comprehensive income each period. These gains or losses will be recorded in income when there is a reduction in the Company‘s net investment in the self-sustaining foreign operation.
(s) Change in Accounting Policies
Business Combinations In January 2009, the CICA issued Section 1582, Business Combinations, Section 1601, Consolidations, and Section 1602, Non-controlling Interests. These new standards are harmonized with International Financial Reporting Standards (IFRS). Section 1582 specifies a number of changes, including: an expanded definition of a business, a requirement to measure all business acquisitions at fair value, a change in the basis of measurement of non-controlling interests, and a requirement to recognize acquisition-related costs as expenses. Section 1601 establishes the standards for preparing consolidated financial statements. Section 1602 specifies that non-controlling interests be treated as a separate component of equity, not as a liability or other item outside of equity. The new standards will become effective in 2011, although early adoption was permitted as long as all three sections were adopted at once.
Effective January 1, 2010, the Company early adopted Sections 1582, 1601, and 1602 in accordance with the transitional provisions. The adoption of Sections 1601 and 1602 did not have a material impact on the Company‘s consolidated financial statements. In August 2010, the Company was appointed the Caterpillar dealer for Northern Ireland and the Republic of Ireland (see Note 19). These acquisitions have been accounted for in accordance with the new standard on business combinations; however, the Company was not materially affected as a result of adopting the new recommendations of Section 1582 for these transactions.
(t) Comparative Figures Certain comparative figures have been reclassified to conform to the 2010 presentation.
(u) Future Accounting Pronouncements
Convergence with International Financial Reporting Standards In February 2008, Canada‘s Accounting Standards Board confirmed that Canadian GAAP, as used by public companies, will be converged with IFRS effective January 1, 2011. The transition from Canadian GAAP to IFRS will be applicable for the Company for the first quarter of 2011 when the Company will prepare both the current and comparative financial information using IFRS.
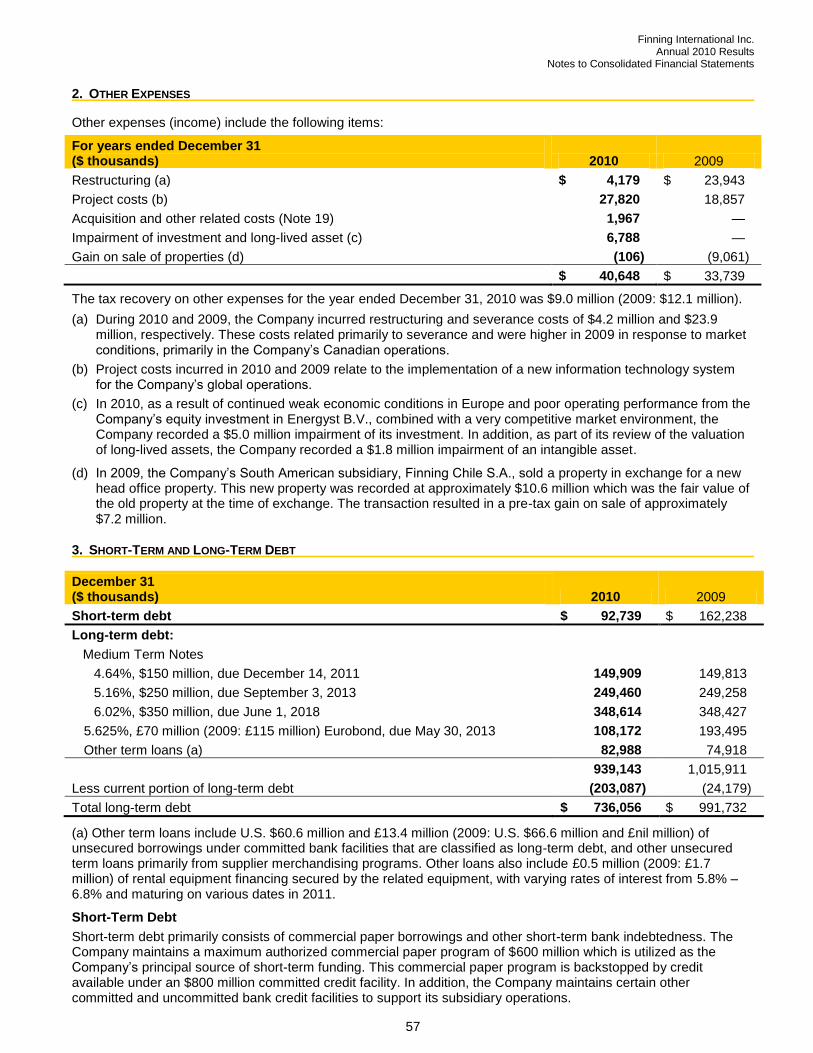
Finning International Inc. Annual 2010 Results Notes to Consolidated Financial Statements
57
2. OTHER EXPENSES
Other expenses (income) include the following items:
For years ended December 31 ($ thousands) 2010 2009
Restructuring (a) $ 4,179 $ 23,943
Project costs (b) 27,820 18,857
Acquisition and other related costs (Note 19) 1,967 —
Impairment of investment and long-lived asset (c) 6,788 —
Gain on sale of properties (d) (106) (9,061)
$ 40,648 $ 33,739
The tax recovery on other expenses for the year ended December 31, 2010 was $9.0 million (2009: $12.1 million).
(a) During 2010 and 2009, the Company incurred restructuring and severance costs of $4.2 million and $23.9 million, respectively. These costs related primarily to severance and were higher in 2009 in response to market conditions, primarily in the Company‘s Canadian operations.
(b) Project costs incurred in 2010 and 2009 relate to the implementation of a new information technology system for the Company‘s global operations.
(c) In 2010, as a result of continued weak economic conditions in Europe and poor operating performance from the Company‘s equity investment in Energyst B.V., combined with a very competitive market environment, the Company recorded a $5.0 million impairment of its investment. In addition, as part of its review of the valuation of long-lived assets, the Company recorded a $1.8 million impairment of an intangible asset.
(d) In 2009, the Company‘s South American subsidiary, Finning Chile S.A., sold a property in exchange for a new head office property. This new property was recorded at approximately $10.6 million which was the fair value of the old property at the time of exchange. The transaction resulted in a pre-tax gain on sale of approximately $7.2 million.
3. SHORT-TERM AND LONG-TERM DEBT
December 31 ($ thousands) 2010 2009
Short-term debt $ 92,739 $ 162,238
Long-term debt:
Medium Term Notes
4.64%, $150 million, due December 14, 2011 149,909 149,813
5.16%, $250 million, due September 3, 2013 249,460 249,258
6.02%, $350 million, due June 1, 2018 348,614 348,427
5.625%, £70 million (2009: £115 million) Eurobond, due May 30, 2013 108,172 193,495
Other term loans (a) 82,988 74,918
939,143 1,015,911
Less current portion of long-term debt (203,087) (24,179)
Total long-term debt $ 736,056 $ 991,732
(a) Other term loans include U.S. $60.6 million and £13.4 million (2009: U.S. $66.6 million and £nil million) of unsecured borrowings under committed bank facilities that are classified as long-term debt, and other unsecured term loans primarily from supplier merchandising programs. Other loans also include £0.5 million (2009: £1.7 million) of rental equipment financing secured by the related equipment, with varying rates of interest from 5.8% – 6.8% and maturing on various dates in 2011.
Short-Term Debt
Short-term debt primarily consists of commercial paper borrowings and other short-term bank indebtedness. The Company maintains a maximum authorized commercial paper program of $600 million which is utilized as the Company‘s principal source of short-term funding. This commercial paper program is backstopped by credit available under an $800 million committed credit facility. In addition, the Company maintains certain other committed and uncommitted bank credit facilities to support its subsidiary operations.

Finning International Inc. Annual 2010 Results Notes to Consolidated Financial Statements
58
3. SHORT-TERM AND LONG-TERM DEBT (CONTINUED)
As at December 31, 2010, the Company had approximately $1,232 million (2009: $1,215 million) of unsecured credit facilities, and including all bank and commercial paper borrowings drawn against these facilities, approximately $1,039 million (2009: $987 million) of capacity remained available, of which approximately $815 million (2009: $725 million) is committed credit facility capacity.
Included in short-term debt is foreign currency denominated debt of U.S. $59.1 million (2009: U.S. $150.7 million).
The average interest rate applicable to the consolidated short-term debt for 2010 was 3.9% (2009: 1.5%).
Long-Term Debt
The Company's Canadian dollar denominated Medium Term Notes (MTNs) are unsecured, and interest is payable semi-annually with principal due on maturity. The Company‘s £70 million (2009: £115.0 million) 5.625% Eurobond is unsecured, and interest is payable annually with principal due on maturity.
Following the sale of Hewden, the Company‘s UK equipment rental business in May 2010 (see Note 20), the Company used a portion of the proceeds to purchase £45 million of the 5.625% Eurobond at a price of £107.055. The Company recorded charges of approximately $6.4 million, reflecting the premium paid to purchase the Eurobond, the early recognition of deferred financing costs, and other costs associated with this purchase.
The Company has an $800 million unsecured syndicated revolving credit facility, maturing in December 2011. Drawings on the credit facility at December 31, 2010 were classified as current. The facility is available in multiple borrowing jurisdictions and may be drawn by a number of the Company‘s principal operating subsidiaries. Borrowings under this facility are available in multiple currencies and at various floating rates of interest. At December 31, 2010, $62.8 million (2009: $142.5 million) was drawn on this facility, including commercial paper issuances.
Long-Term Debt Repayments
Principal repayments of long-term debt (book value) in each of the next five years and thereafter are as follows:
($ thousands)
2011 $ 203,087
2012 498
2013 383,153
2014 566
2015 231
Thereafter 351,608
$ 939,143
Finance Costs
Finance costs as shown on the consolidated statement of income comprise the following elements:
For years ended December 31 ($ thousands) 2010 2009
Interest on debt securities:
Short-term debt $ 1,548 $ 4,347
Long-term debt 50,364 55,499
51,912 59,846
Loss on interest rate derivatives 1,663 2,232
Costs associated with Eurobond debt purchase 6,441 —
Interest income on tax reassessment (2,941) (3,529)
Other finance related expenses, net of sundry interest earned 3,678 9,059
60,753 67,608
Less: interest expense related to discontinued operations (2,052) (5,815)
Finance costs of continuing operations $ 58,701 $ 61,793
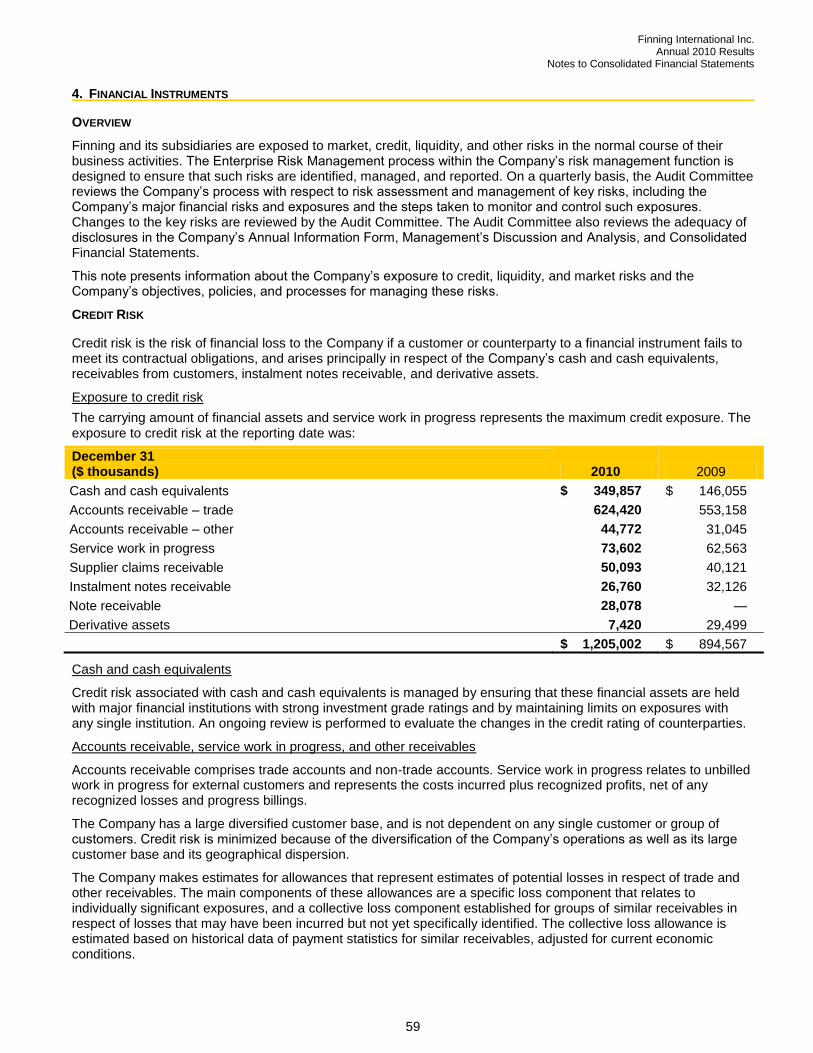
Finning International Inc. Annual 2010 Results Notes to Consolidated Financial Statements
59
4. FINANCIAL INSTRUMENTS
OVERVIEW
Finning and its subsidiaries are exposed to market, credit, liquidity, and other risks in the normal course of their business activities. The Enterprise Risk Management process within the Company‘s risk management function is designed to ensure that such risks are identified, managed, and reported. On a quarterly basis, the Audit Committee reviews the Company‘s process with respect to risk assessment and management of key risks, including the Company‘s major financial risks and exposures and the steps taken to monitor and control such exposures. Changes to the key risks are reviewed by the Audit Committee. The Audit Committee also reviews the adequacy of disclosures in the Company‘s Annual Information Form, Management‘s Discussion and Analysis, and Consolidated Financial Statements.
This note presents information about the Company‘s exposure to credit, liquidity, and market risks and the Company‘s objectives, policies, and processes for managing these risks.
CREDIT RISK
Credit risk is the risk of financial loss to the Company if a customer or counterparty to a financial instrument fails to meet its contractual obligations, and arises principally in respect of the Company‘s cash and cash equivalents, receivables from customers, instalment notes receivable, and derivative assets.
Exposure to credit risk
The carrying amount of financial assets and service work in progress represents the maximum credit exposure. The exposure to credit risk at the reporting date was:
December 31 ($ thousands) 2010 2009
Cash and cash equivalents $ 349,857 $ 146,055
Accounts receivable – trade 624,420 553,158
Accounts receivable – other 44,772 31,045
Service work in progress 73,602 62,563
Supplier claims receivable 50,093 40,121
Instalment notes receivable 26,760 32,126
Note receivable 28,078 —
Derivative assets 7,420 29,499
$ 1,205,002 $ 894,567
Cash and cash equivalents
Credit risk associated with cash and cash equivalents is managed by ensuring that these financial assets are held with major financial institutions with strong investment grade ratings and by maintaining limits on exposures with any single institution. An ongoing review is performed to evaluate the changes in the credit rating of counterparties.
Accounts receivable, service work in progress, and other receivables
Accounts receivable comprises trade accounts and non-trade accounts. Service work in progress relates to unbilled work in progress for external customers and represents the costs incurred plus recognized profits, net of any recognized losses and progress billings.
The Company has a large diversified customer base, and is not dependent on any single customer or group of customers. Credit risk is minimized because of the diversification of the Company‘s operations as well as its large customer base and its geographical dispersion.
The Company makes estimates for allowances that represent estimates of potential losses in respect of trade and other receivables. The main components of these allowances are a specific loss component that relates to individually significant exposures, and a collective loss component established for groups of similar receivables in respect of losses that may have been incurred but not yet specifically identified. The collective loss allowance is estimated based on historical data of payment statistics for similar receivables, adjusted for current economic conditions.

Finning International Inc. Annual 2010 Results Notes to Consolidated Financial Statements
60
4. FINANCIAL INSTRUMENTS (CONTINUED)
The maximum exposure to credit risk for trade receivables at the reporting date by geographic location of customer was:
December 31 ($ thousands) 2010 2009
Canada $ 331,339 $ 310,172
Chile 147,746 109,193
U.K. 71,504 84,713
Argentina 49,885 37,125
Bolivia 4,911 4,782
Uruguay 2,992 1,484
Europe 6,821 2,832
U.S. 6,473 2,332
Other 2,749 525
$ 624,420 $ 553,158
Impairment losses
The aging of trade receivables at the reporting date was:
December 31 2010 2009
($ thousands) Gross Allowance Gross Allowance
Not past due $ 456,557 $ — $ 390,162 $ —
Past due 1 – 30 days 112,343 — 109,112 —
Past due 31 – 90 days 29,126 586 30,855 210
Past due 91 – 120 days 8,092 355 5,564 252
Past due greater than 120 days 32,111 12,868 36,891 18,964
Total $ 638,229 $ 13,809 $ 572,584 $ 19,426
The movement in the allowance for doubtful accounts in respect of trade receivables during the period was as follows:
For years ended December 31 ($ thousands) 2010 2009
Balance, beginning of year $ 19,426 $ 17,053
Additional allowance 9,114 12,584
Receivables written off (14,503) (8,223)
Foreign exchange translation adjustment (228) (1,988)
Balance, end of year $ 13,809 $ 19,426
The allowance amounts in respect of trade receivables are used to record possible impairment losses unless the Company is satisfied that no recovery of the amount owing is possible; at that point the amount is considered not recoverable and the financial asset is written off.
Derivative assets
The Company does have a certain degree of credit exposure arising from its derivative instruments relating to counterparties defaulting on their obligations. However, the Company minimizes this risk by ensuring there is no excessive concentration of credit risk with any single counterparty, by active credit monitoring, and by dealing only with major financial institutions that have a credit rating of at least A from Standard & Poor‘s.
LIQUIDITY RISK
Liquidity risk is the risk that the Company will not be able to meet its financial obligations as they fall due. The Company‘s approach to managing liquidity is to ensure, as far as possible, that it will have sufficient liquid financial resources to fund its operations and meet its commitments and obligations. The Company maintains bilateral and

Finning International Inc. Annual 2010 Results Notes to Consolidated Financial Statements
61
syndicated bank credit facilities, a commercial paper program, continuously monitors actual and forecast cash flows, and manages maturity profiles of financial liabilities. Undrawn credit facilities for continuing operations at December 31, 2010 were $1,039 million (2009: $987 million). The Company believes that it has reasonable access to capital markets which is supported by its investment grade credit ratings.
The following are the contractual maturities of non-derivative financial liabilities and derivative financial assets and liabilities. The amounts presented represent the future undiscounted principal and interest cash flows and therefore do not equate to the carrying amount on the consolidated balance sheet.
Carrying amount Contractual cash flows
($ thousands) Dec 31, 2010 2011 2012-2013 2014-2015 Thereafter
Non-derivative financial liabilities
Short-term debt $ (92,739) $ (92,957) $ — $ — $ —
Unsecured MTNs (747,983) (190,930) (317,940) (42,140) (402,646)
Eurobond (108,172) (6,108) (120,807) — —
Unsecured bank facilities (75,810) (51,453) (25,392) — —
Other term loans (7,178) (2,752) (1,610) (1,248) (4,023)
Capital lease obligations (12,495) (2,422) (2,426) (2,161) (12,667)
Accounts payable and accruals (excluding derivative liabilities and current portion of capital lease obligations) (997,730) (997,730) — — —
Total non-derivative financial liabilities (2,042,107) (1,344,352) (468,175) (45,549) (419,336)
Derivatives
Interest rate swaps
Pay USD (fixed) (395) (231) (252) — —
Receive USD (floating) — 23 75 — —
Forward foreign currency contracts and swaps
Sell CAD (3,937) (127,574) (8,282) — —
Buy USD — 123,478 7,952 — —
Sell USD — (99,460)
Buy CAD 2,843 102,438
Sell CLP (484) (45,238) — — —
Buy USD — 44,757 — — —
Sell USD — (38,789) — — —
Buy CLP 4,577 43,929 — — —
Share forward
Sell (8,672) (720) (9,892) — —
Buy — — — — —
Total derivatives $ (6,068) $ 2,613 $ (10,399) $ — $ —
Canadian dollar (CAD) United States dollar (USD) Chilean peso (CLP)

Finning International Inc. Annual 2010 Results Notes to Consolidated Financial Statements
62
4. FINANCIAL INSTRUMENTS (CONTINUED)
MARKET RISK
Market risk is the risk that changes in the market, such as foreign exchange rates and interest rates, will affect the Company‘s income or the fair value of its financial instruments. The objective of market risk management is to manage and control market risk exposures within acceptable parameters.
The Company buys and sells derivatives in the ordinary course of business, and also incurs financial liabilities, in order to manage market risks. All such transactions are carried out within the guidelines set by the Company‘s Global Foreign Exchange Risk Management Policy approved by the Audit Committee.
Foreign exchange risk
The Company is geographically diversified, with significant investments in several different countries. The Company transacts business in multiple currencies, the most significant of which are the U.S. dollar, the Canadian dollar, the U.K. pound sterling, and the Chilean peso.
As a result, the Company has foreign currency exposure with respect to items denominated in foreign currencies. The main types of foreign exchange risk of the Company can be categorized as follows:
Translation Exposure
The most significant foreign exchange impact on the Company‘s net income is the translation of foreign currency based earnings into Canadian dollars, which is the Company‘s reporting currency. All of the Company‘s foreign subsidiaries are considered self-sustaining and report their operating results in currencies other than the Canadian dollar. Therefore, exchange rate movements in the U.S. dollar and U.K. pound sterling relative to the Canadian dollar will impact the consolidated results of the South American and U.K. operations in Canadian dollar terms. In addition, the results of the Company‘s Canadian operations are impacted by the translation of its U.S. dollar based earnings. The Company does not hedge its exposure to foreign exchange risk with regard to foreign currency earnings.
The Company‘s UK and South American operations have functional currencies other than the Canadian dollar, and as a result foreign currency gains and losses arise in the cumulative translation adjustment account from the translation of the Company‘s net investment in these operations. To the extent practical, it is the Company‘s objective to manage this exposure. The Company has hedged a portion of its foreign investments through foreign currency denominated loans and, periodically, through other derivative contracts. For those derivatives and loans where hedge accounting has been elected, any exchange gains or losses arising from the translation of the hedging instruments are recorded, net of tax, as an item of other comprehensive income and accumulated other comprehensive income. Cumulative currency translation adjustments, net of gains or losses of the associated hedging instruments, are recognized in net income when there is a reduction in the Company‘s net investment in the self-sustaining foreign operation.
Transaction Exposure
Many of the Company‘s operations purchase, sell, rent, and lease products as well as incur costs in currencies other than their functional currency. This mismatch of currencies creates transactional exposure at the operational level, which may affect the Company‘s profitability as exchange rates fluctuate. The Company‘s competitive position may also be impacted as relative currency movements affect the business practices and/or pricing strategies of the Company‘s competitors.
The Company is also exposed to currency risks related to the future cash flows on its non-Canadian denominated short and long term debt.
To the extent practical, it is the Company‘s objective to manage the impact of exchange rate movements and volatility on its financial results. Each operation manages the majority of its transactional exposure through sales pricing policies and practices. The Company also enters into forward exchange contracts to manage residual mismatches in foreign currency cash flows.
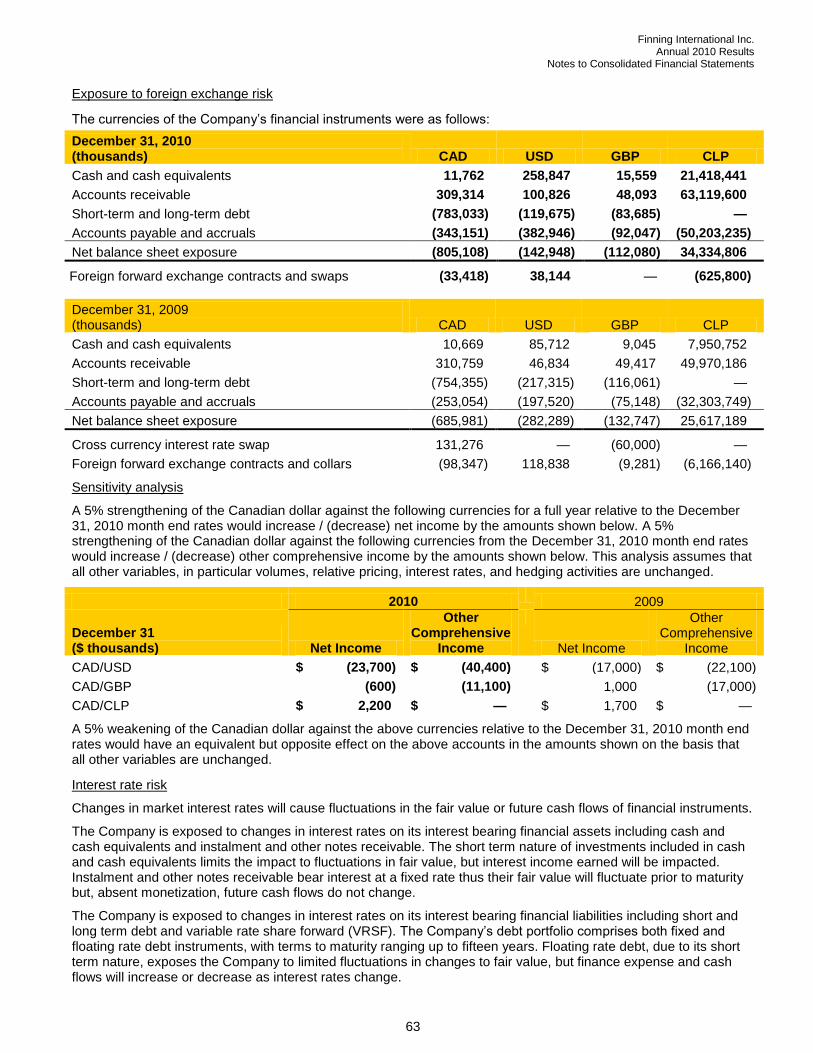
Finning International Inc. Annual 2010 Results Notes to Consolidated Financial Statements
63
Exposure to foreign exchange risk
The currencies of the Company‘s financial instruments were as follows:
December 31, 2010 (thousands) CAD USD GBP CLP
Cash and cash equivalents 11,762 258,847 15,559 21,418,441
Accounts receivable 309,314 100,826 48,093 63,119,600
Short-term and long-term debt (783,033) (119,675) (83,685) —
Accounts payable and accruals (343,151) (382,946) (92,047) (50,203,235)
Net balance sheet exposure (805,108) (142,948) (112,080) 34,334,806
Foreign forward exchange contracts and swaps (33,418) 38,144 — (625,800)
December 31, 2009 (thousands) CAD USD GBP CLP
Cash and cash equivalents 10,669 85,712 9,045 7,950,752
Accounts receivable 310,759 46,834 49,417 49,970,186
Short-term and long-term debt (754,355) (217,315) (116,061) —
Accounts payable and accruals (253,054) (197,520) (75,148) (32,303,749)
Net balance sheet exposure (685,981) (282,289) (132,747) 25,617,189
Cross currency interest rate swap 131,276 — (60,000) —
Foreign forward exchange contracts and collars (98,347) 118,838 (9,281) (6,166,140)
Sensitivity analysis
A 5% strengthening of the Canadian dollar against the following currencies for a full year relative to the December 31, 2010 month end rates would increase / (decrease) net income by the amounts shown below. A 5% strengthening of the Canadian dollar against the following currencies from the December 31, 2010 month end rates would increase / (decrease) other comprehensive income by the amounts shown below. This analysis assumes that all other variables, in particular volumes, relative pricing, interest rates, and hedging activities are unchanged.
2010
2009
December 31 ($ thousands) Net Income
Other Comprehensive
Income
Net Income
Other Comprehensive
Income
CAD/USD $ (23,700) $ (40,400) $ (17,000) $ (22,100)
CAD/GBP (600) (11,100) 1,000 (17,000)
CAD/CLP $ 2,200 $ — $ 1,700 $ —
A 5% weakening of the Canadian dollar against the above currencies relative to the December 31, 2010 month end rates would have an equivalent but opposite effect on the above accounts in the amounts shown on the basis that all other variables are unchanged.
Interest rate risk
Changes in market interest rates will cause fluctuations in the fair value or future cash flows of financial instruments.
The Company is exposed to changes in interest rates on its interest bearing financial assets including cash and cash equivalents and instalment and other notes receivable. The short term nature of investments included in cash and cash equivalents limits the impact to fluctuations in fair value, but interest income earned will be impacted. Instalment and other notes receivable bear interest at a fixed rate thus their fair value will fluctuate prior to maturity but, absent monetization, future cash flows do not change.
The Company is exposed to changes in interest rates on its interest bearing financial liabilities including short and long term debt and variable rate share forward (VRSF). The Company‘s debt portfolio comprises both fixed and floating rate debt instruments, with terms to maturity ranging up to fifteen years. Floating rate debt, due to its short term nature, exposes the Company to limited fluctuations in changes to fair value, but finance expense and cash flows will increase or decrease as interest rates change.
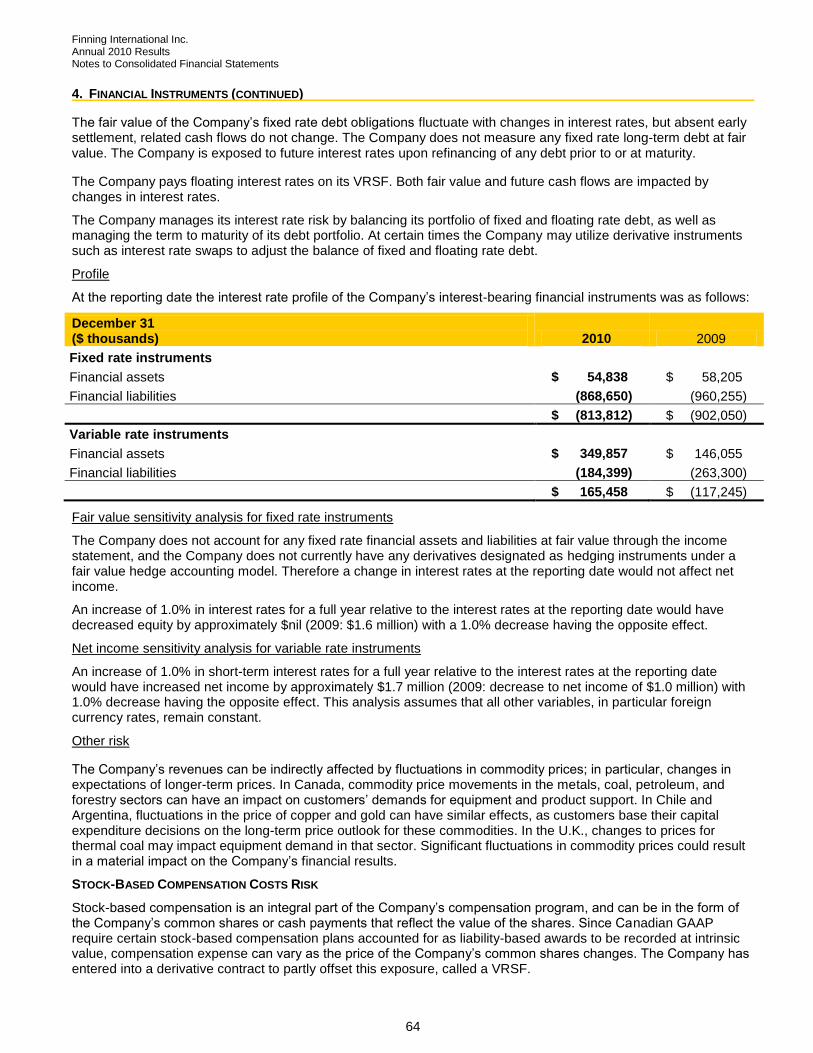
Finning International Inc. Annual 2010 Results Notes to Consolidated Financial Statements
64
4. FINANCIAL INSTRUMENTS (CONTINUED)
The fair value of the Company‘s fixed rate debt obligations fluctuate with changes in interest rates, but absent early settlement, related cash flows do not change. The Company does not measure any fixed rate long-term debt at fair value. The Company is exposed to future interest rates upon refinancing of any debt prior to or at maturity.
The Company pays floating interest rates on its VRSF. Both fair value and future cash flows are impacted by changes in interest rates.
The Company manages its interest rate risk by balancing its portfolio of fixed and floating rate debt, as well as managing the term to maturity of its debt portfolio. At certain times the Company may utilize derivative instruments such as interest rate swaps to adjust the balance of fixed and floating rate debt.
Profile
At the reporting date the interest rate profile of the Company‘s interest-bearing financial instruments was as follows:
December 31 ($ thousands) 2010 2009
Fixed rate instruments
Financial assets $ 54,838 $ 58,205
Financial liabilities (868,650) (960,255)
$ (813,812) $ (902,050)
Variable rate instruments
Financial assets $ 349,857 $ 146,055
Financial liabilities (184,399) (263,300)
$ 165,458 $ (117,245)
Fair value sensitivity analysis for fixed rate instruments
The Company does not account for any fixed rate financial assets and liabilities at fair value through the income statement, and the Company does not currently have any derivatives designated as hedging instruments under a fair value hedge accounting model. Therefore a change in interest rates at the reporting date would not affect net income.
An increase of 1.0% in interest rates for a full year relative to the interest rates at the reporting date would have decreased equity by approximately $nil (2009: $1.6 million) with a 1.0% decrease having the opposite effect.
Net income sensitivity analysis for variable rate instruments
An increase of 1.0% in short-term interest rates for a full year relative to the interest rates at the reporting date would have increased net income by approximately $1.7 million (2009: decrease to net income of $1.0 million) with 1.0% decrease having the opposite effect. This analysis assumes that all other variables, in particular foreign currency rates, remain constant.
Other risk
The Company‘s revenues can be indirectly affected by fluctuations in commodity prices; in particular, changes in expectations of longer-term prices. In Canada, commodity price movements in the metals, coal, petroleum, and forestry sectors can have an impact on customers‘ demands for equipment and product support. In Chile and Argentina, fluctuations in the price of copper and gold can have similar effects, as customers base their capital expenditure decisions on the long-term price outlook for these commodities. In the U.K., changes to prices for thermal coal may impact equipment demand in that sector. Significant fluctuations in commodity prices could result in a material impact on the Company‘s financial results.
STOCK-BASED COMPENSATION COSTS RISK
Stock-based compensation is an integral part of the Company‘s compensation program, and can be in the form of the Company‘s common shares or cash payments that reflect the value of the shares. Since Canadian GAAP require certain stock-based compensation plans accounted for as liability-based awards to be recorded at intrinsic value, compensation expense can vary as the price of the Company‘s common shares changes. The Company has entered into a derivative contract to partly offset this exposure, called a VRSF.
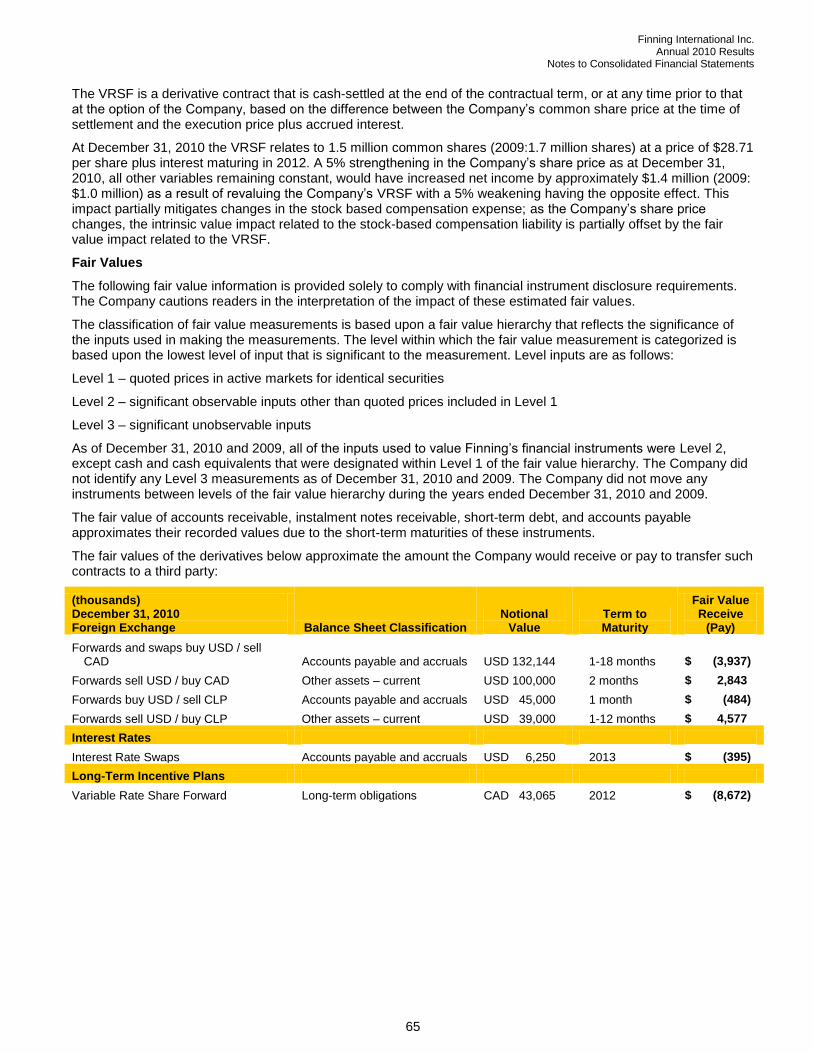
Finning International Inc. Annual 2010 Results Notes to Consolidated Financial Statements
65
The VRSF is a derivative contract that is cash-settled at the end of the contractual term, or at any time prior to that at the option of the Company, based on the difference between the Company‘s common share price at the time of settlement and the execution price plus accrued interest.
At December 31, 2010 the VRSF relates to 1.5 million common shares (2009:1.7 million shares) at a price of $28.71 per share plus interest maturing in 2012. A 5% strengthening in the Company‘s share price as at December 31, 2010, all other variables remaining constant, would have increased net income by approximately $1.4 million (2009: $1.0 million) as a result of revaluing the Company‘s VRSF with a 5% weakening having the opposite effect. This impact partially mitigates changes in the stock based compensation expense; as the Company‘s share price changes, the intrinsic value impact related to the stock-based compensation liability is partially offset by the fair value impact related to the VRSF.
Fair Values
The following fair value information is provided solely to comply with financial instrument disclosure requirements. The Company cautions readers in the interpretation of the impact of these estimated fair values.
The classification of fair value measurements is based upon a fair value hierarchy that reflects the significance of the inputs used in making the measurements. The level within which the fair value measurement is categorized is based upon the lowest level of input that is significant to the measurement. Level inputs are as follows:
Level 1 – quoted prices in active markets for identical securities
Level 2 – significant observable inputs other than quoted prices included in Level 1
Level 3 – significant unobservable inputs
As of December 31, 2010 and 2009, all of the inputs used to value Finning‘s financial instruments were Level 2, except cash and cash equivalents that were designated within Level 1 of the fair value hierarchy. The Company did not identify any Level 3 measurements as of December 31, 2010 and 2009. The Company did not move any instruments between levels of the fair value hierarchy during the years ended December 31, 2010 and 2009.
The fair value of accounts receivable, instalment notes receivable, short-term debt, and accounts payable approximates their recorded values due to the short-term maturities of these instruments.
The fair values of the derivatives below approximate the amount the Company would receive or pay to transfer such contracts to a third party:
(thousands) December 31, 2010 Foreign Exchange Balance Sheet Classification
Notional Value
Term to Maturity
Fair Value Receive
(Pay)
Forwards and swaps buy USD / sell CAD Accounts payable and accruals USD 132,144 1-18 months $ (3,937)
Forwards sell USD / buy CAD Other assets – current USD 100,000 2 months $ 2,843
Forwards buy USD / sell CLP Accounts payable and accruals USD 45,000 1 month $ (484)
Forwards sell USD / buy CLP Other assets – current USD 39,000 1-12 months $ 4,577
Interest Rates
Interest Rate Swaps Accounts payable and accruals USD 6,250 2013 $ (395)
Long-Term Incentive Plans
Variable Rate Share Forward Long-term obligations CAD 43,065 2012 $ (8,672)
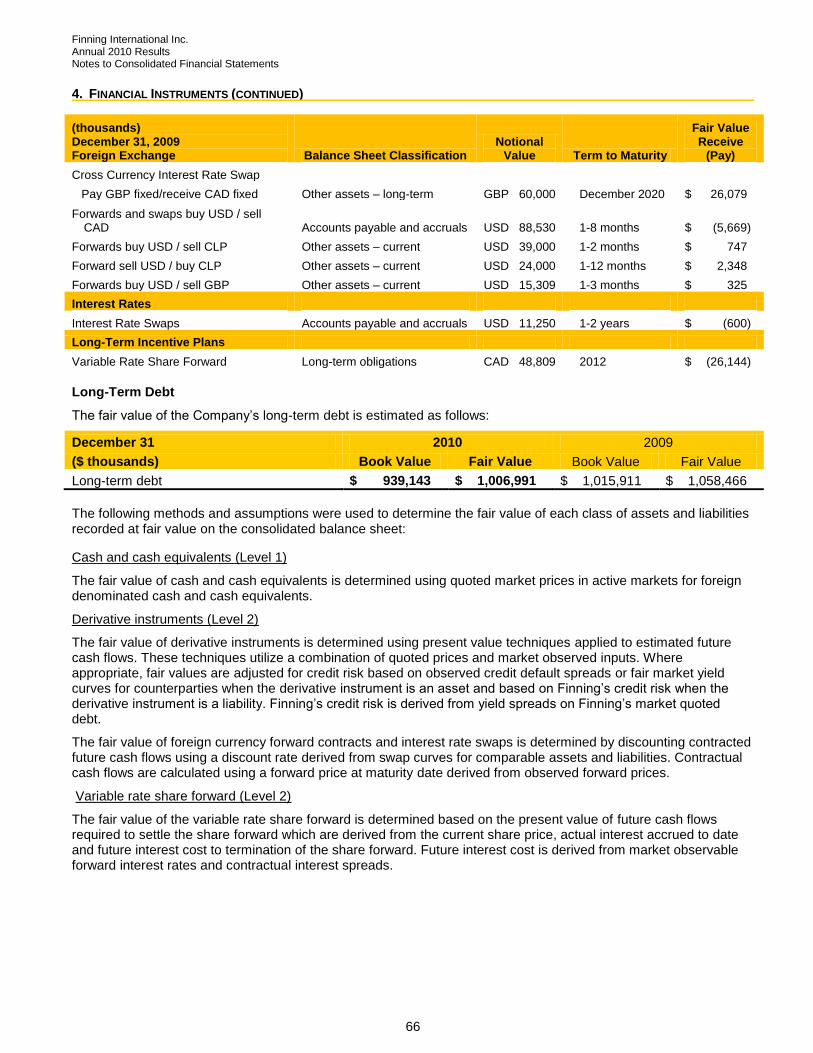
Finning International Inc. Annual 2010 Results Notes to Consolidated Financial Statements
66
4. FINANCIAL INSTRUMENTS (CONTINUED)
(thousands) December 31, 2009 Foreign Exchange Balance Sheet Classification
Notional Value Term to Maturity
Fair Value Receive
(Pay)
Cross Currency Interest Rate Swap
Pay GBP fixed/receive CAD fixed Other assets – long-term GBP 60,000 December 2020 $ 26,079
Forwards and swaps buy USD / sell CAD Accounts payable and accruals USD 88,530 1-8 months $ (5,669)
Forwards buy USD / sell CLP Other assets – current USD 39,000 1-2 months $ 747
Forward sell USD / buy CLP Other assets – current USD 24,000 1-12 months $ 2,348
Forwards buy USD / sell GBP Other assets – current USD 15,309 1-3 months $ 325
Interest Rates
Interest Rate Swaps Accounts payable and accruals USD 11,250 1-2 years $ (600)
Long-Term Incentive Plans
Variable Rate Share Forward Long-term obligations CAD 48,809 2012 $ (26,144)
Long-Term Debt
The fair value of the Company‘s long-term debt is estimated as follows:
December 31 2010 2009
($ thousands) Book Value Fair Value Book Value Fair Value
Long-term debt $ 939,143 $ 1,006,991 $ 1,015,911 $ 1,058,466
The following methods and assumptions were used to determine the fair value of each class of assets and liabilities recorded at fair value on the consolidated balance sheet:
Cash and cash equivalents (Level 1)
The fair value of cash and cash equivalents is determined using quoted market prices in active markets for foreign denominated cash and cash equivalents.
Derivative instruments (Level 2)
The fair value of derivative instruments is determined using present value techniques applied to estimated future cash flows. These techniques utilize a combination of quoted prices and market observed inputs. Where appropriate, fair values are adjusted for credit risk based on observed credit default spreads or fair market yield curves for counterparties when the derivative instrument is an asset and based on Finning‘s credit risk when the derivative instrument is a liability. Finning‘s credit risk is derived from yield spreads on Finning‘s market quoted debt.
The fair value of foreign currency forward contracts and interest rate swaps is determined by discounting contracted future cash flows using a discount rate derived from swap curves for comparable assets and liabilities. Contractual cash flows are calculated using a forward price at maturity date derived from observed forward prices.
Variable rate share forward (Level 2)
The fair value of the variable rate share forward is determined based on the present value of future cash flows required to settle the share forward which are derived from the current share price, actual interest accrued to date and future interest cost to termination of the share forward. Future interest cost is derived from market observable forward interest rates and contractual interest spreads.

Finning International Inc. Annual 2010 Results Notes to Consolidated Financial Statements
67
5. MANAGEMENT OF CAPITAL
The Company‘s objective when managing capital is to maintain a flexible capital structure which optimizes the cost of capital at an acceptable risk. The Company includes shareholders‘ equity, cash and cash equivalents, short-term and long-term debt in the definition of capital.
The Company manages its capital structure and makes adjustments to it in light of changes in economic conditions and the risk characteristics of its underlying assets. In order to maintain or adjust the capital structure, the Company may purchase shares for cancellation pursuant to normal course issuer bids, issue new shares, issue new debt, repay debt, issue new debt to replace existing debt with different characteristics, or adjust the amount of dividends paid to shareholders.
The Company monitors the following ratios: net debt to total capitalization and dividend payout ratio. Net debt to total capitalization and dividend payout ratio are non-GAAP measures which do not have a standardized meaning prescribed by GAAP and therefore may not be comparable to similar measures presented by other issuers.
Net debt to total capitalization is calculated as short-term and long-term debt, net of cash and cash equivalents (net debt) divided by total capitalization. Total capitalization is defined as the sum of net debt and all components of shareholders‘ equity (share capital, contributed surplus, accumulated other comprehensive loss, and retained earnings).
Dividend payout ratio is calculated as the indicated annual dividend declared per share divided by basic earnings per share from continuing operations for the preceding twelve month period.
The Company‘s strategy is to manage, over a longer-term average basis, to the target ranges set out below. The Company believes that these target ratios are appropriate and provide access to capital at a reasonable cost.
As at and for years ended December 31 ($ thousands, except as noted) 2010 2009
Components of Debt Ratio
Cash and cash equivalents $ (349,857) $ (146,055)
Short-term debt 92,739 162,238
Current portion of long-term debt 203,087 24,179
Long-term debt 736,056 991,732
Cash and cash equivalents from discontinued operations — (51,849)
Net debt 682,025 980,245
Shareholders‘ equity $ 1,386,587 $ 1,515,686
Company Targets 2010 2009
Net debt to total capitalization 35 – 45% 33.0% 39.3%
Dividend payout ratio 25 – 30% 48.0% 47.8%
The net debt to total capitalization ratio is below the Company‘s target due to significant cash at the end of 2010, the result of collections from customers late in the year. This ratio is lower than the prior year due to cash flow generated by operations in 2010 which was utilized to reduce overall debt levels, in addition to the early purchase of £45 million of the outstanding £115 million Eurobond Notes with a portion of the proceeds received from the sale of Hewden.
The dividend payout ratio in 2010 and 2009 exceeded the Company‘s target levels; however, management believes that with the overall economic and business conditions improving the payout ratio will be back on target within the next two years. The Company believes the higher payout was acceptable given the strong cash flow generated in the year, among other considerations.
Covenant
The Company is subject to a maximum net debt to total capitalization level pursuant to a covenant within its syndicated bank credit facility. As at December 31, 2010 and 2009, the Company is in compliance with this covenant.

Finning International Inc. Annual 2010 Results Notes to Consolidated Financial Statements
68
6. INCOME TAXES
Provision for Income Taxes
As the Company operates in several tax jurisdictions, its income is subject to various rates of taxation. The components of the Company‘s income tax provision from continuing operations are as follows:
For years ended December 31 ($ thousands) 2010 2009
Provision for income taxes
Current
Canada $ 15,921 $ (9,627)
International 33,729 31,320
49,650 21,693
Future
Canada 6,409 5,279
International (10,513) 1,424
(4,104) 6,703
$ 45,546 $ 28,396
The provision for income taxes differs from the amount that would have resulted from applying the Canadian statutory income tax rates to income from continuing operations before income taxes as follows:
For years ended December 31 ($ thousands) 2010 2009
Combined Canadian federal and provincial income taxes at the statutory tax rate $ 60,986 28.20% $ 54,327 29.35%
Increase / (decrease) resulting from:
Lower statutory rates on the earnings of foreign subsidiaries (11,667) (5.39)% (13,884) (7.50)%
Income not subject to tax (6,687) (3.09)% (4,084) (2.21)%
Non-taxable capital gain (613) (0.28)% (1,758) (0.95)%
Non-deductible stock-based compensation 880 0.41% 1,461 0.79%
Recovery related to items previously charged to other comprehensive income — — (8,534) (4.61)%
Other 2,647 1.21% 868 0.47%
Provision for income taxes $ 45,546 21.06% $ 28,396 15.34%
Future Income Tax Asset and Liability
Included in other assets on the consolidated balance sheets are a current future income tax asset and long-term future income tax asset of $52.7 million (2009: $48.2 million) and $1.6 million (2009: $0.8 million), respectively.

Finning International Inc. Annual 2010 Results Notes to Consolidated Financial Statements
69
Temporary differences and tax loss carry-forwards that give rise to future income tax assets and liabilities are as follows:
December 31 ($ thousands) 2010 2009
Future income tax assets:
Accounting provisions not currently deductible for tax purposes $ 60,722 $ 52,862
Loss carry-forwards 3,443 3,563
Other stock-based compensation 2,306 7,373
Derivative financial instruments 1,898 —
Goodwill of foreign subsidiaries — 1,004
68,369 64,802
Future income tax liabilities:
Derivative financial instruments — (6,272)
Capital, rental, and leased assets (46,388) (47,281)
Employee benefits (41,220) (38,901)
Other (2,889) (3,812)
(90,497) (96,266)
Net future income tax liability $ (22,128) $ (31,464)
The Company has recognized the benefit of the following tax loss carry-forwards available to reduce future taxable income and capital gains expiring through 2015 for Canada and available indefinitely for International, with the exception of Argentina, which expire through 2015 ($3.6 million):
December 31 ($ thousands) 2010 2009
Canada $ — $ 1,700
International 10,551 10,638
$ 10,551 $ 12,338
As at December 31, 2010, the Company has unrecognized net operating losses and capital loss carry-forwards of $1.3 million and $257.3 million, respectively, to reduce future taxable income. These amounts do not expire.

Finning International Inc. Annual 2010 Results Notes to Consolidated Financial Statements
70
7. SHARE CAPITAL
The Company is authorized to issue an unlimited number of preferred shares without par value, of which 4.4 million are designated as cumulative redeemable preferred shares. The Company had no preferred shares outstanding for the years ended December 31, 2010 and 2009.
The Company is authorized to issue an unlimited number of common shares.
The Company had a share repurchase program in place until July 8, 2009. The Company did not repurchase any common shares during 2010 and 2009.
A shareholders' rights plan is in place which is intended to provide all holders of common shares with the opportunity to receive full and fair value for all of their shares in the event a third party attempts to acquire a significant interest in the Company. The Company's dealership agreements with subsidiaries of Caterpillar Inc. are fundamental to its business and any change in control must be approved by Caterpillar Inc.
The plan provides that one share purchase right has been issued for each common share and will trade with the common shares until such time as any person or group, other than a ―permitted bidder‖, bids to acquire or acquires 20% or more of the Company's common shares, at which time the plan rights become exercisable. The rights may also be triggered by a third party proposal for a merger, amalgamation or a similar transaction. In May 2008, the rights plan was extended for three years such that it will automatically terminate at the end of the Company‘s Annual Meeting of shareholders in 2011 unless further extended by the shareholders prior to that time. The Company will be seeking shareholder approval at its 2011 Annual Meeting to extend the rights plan for three years such that it will automatically terminate at the end of the Company‘s Annual Meeting in 2014.
The plan will not be triggered if a bid meets certain criteria (a permitted bidder). These criteria include that:
the offer is made for all outstanding voting shares of the Company;
more than 50% of the voting shares have been tendered by independent shareholders pursuant to the Takeover Bid (voting shares tendered may be withdrawn until taken up and paid for); and
the Takeover Bid expires not less than 60 days after the date of the bid circular.
8. STOCK-BASED COMPENSATION PLANS
The Company has a number of stock-based compensation plans in the form of stock options and other stock-based compensations plans noted below.
Stock Options
The Company has several stock option plans for certain employees and directors with vesting occurring over a three-year period. The exercise price of each option is based on the closing price of the common shares of the Company on the date of the grant. Options granted after January 1, 2004 are exercisable over a seven-year period. Options granted prior to January 1, 2004 are exercisable over a ten-year period. Under the 2005 Stock Option Plan, the Company may issue up to 7.5 million common shares pursuant to the exercise of stock options. At December 31, 2010, 1.6 million common shares remain eligible to be issued in connection with future grants under this Stock Option Plan.

Finning International Inc. Annual 2010 Results Notes to Consolidated Financial Statements
71
Details of the stock option plans are as follows:
2010 2009
For years ended December 31 Options Weighted Average
Exercise Price Options Weighted Average
Exercise Price
Options outstanding, beginning of year 6,299,454 $ 22.94 6,037,270 $ 23.72
Granted 548,990 $ 17.43 978,703 $ 14.64
Exercised (1)
(1,086,873) $ 13.42 (301,733) $ 6.51
Cancelled (158,959) $ 26.06 (414,786) $ 26.63
Options outstanding, end of year 5,602,612 $ 24.16 6,299,454 $ 22.94
Exercisable at year end 3,934,913 $ 25.85 3,827,509 $ 22.01
(1) Stock options exercised in 2010 comprised both cash and cashless exercises, based on the terms of the particular stock option plan. There were 520,201 options exercised under the pre-2005 Stock Option Plan and utilized a cash method of exercise resulting in the same number (520,201) of common shares issued. Under the 2005 Stock Option Plan, exercises generally utilize the cashless method, whereby the actual number of shares issued is represented by the premium between the fair market value at exercise time and the grant value, and the equivalent value of the number of options up to the grant value is withheld. An additional 566,672 options were exercised in 2010 under the 2005 Stock Option Plan resulting in 164,348 common shares issued and 402,324 options were withheld and returned to the option pool for future issues/grants.
In 2010 and 2009, long term incentives for executives and senior management were a combination of both stock options and performance share units. In the second quarter of 2010, the Company granted 548,990 common share options to senior executives and management of the Company (2009: 978,703 common share options). The Company‘s practice is to grant and price stock options only when it is felt that all material information has been disclosed to the market.
The fair value of the options granted has been estimated on the date of grant using the Black-Scholes option-pricing model with the following weighted-average assumptions:
2010 Grant 2009 Grant
Dividend yield 1.75% 1.78%
Expected volatility 33.41% 38.45%
Risk-free interest rate 2.66% 3.66%
Expected life 5.8 years 5.5 years
The weighted average grant date fair value of options granted during the year was $5.20 (2009: $5.07). Total stock option expense recognized in 2010 was $5.3 million (2009: $8.0 million).
The following table summarizes information about stock options outstanding at December 31, 2010:
Options Outstanding Options Exercisable
Range of exercise prices
Number outstanding
Weighted Average
Remaining Life
Weighted Average
Exercise Price
Number Outstanding
Weighted Average
Exercise Price
$6.23- $8.50 56,700 0.1 years $ 6.69 56,700 $ 6.69
$14.64- $17.43 1,624,146 5.2 years $ 15.77 465,746 $ 15.30
$19.75- $19.82 1,006,466 2.4 years $ 19.75 1,006,466 $ 19.75
$25.85- $31.67 2,915,300 3.9 years $ 30.70 2,406,001 $ 30.89
5,602,612 4.0 years $ 24.16 3,934,913 $ 25.85
Other Stock-Based Compensation Plans
The Company has other stock-based compensation plans in the form of deferred share units, performance share units, and stock appreciation rights that use notional common share units. These notional units are valued based on the Company‘s common share price on the Toronto Stock Exchange and are marked to market at the end of each fiscal quarter.
In December 2007, the Company entered into a Variable Rate Share Forward (VRSF) with a financial institution to hedge a portion of its outstanding deferred share units and vested share appreciation units, reducing the volatility caused by movements in the Company‘s share price on the value of these stock-based compensation plans – see Note 4.

Finning International Inc. Annual 2010 Results Notes to Consolidated Financial Statements
72
8. STOCK-BASED COMPENSATION PLANS (CONTINUED)
Details of the plans are as follows:
Directors
Directors‘ Deferred Share Unit Plan A (DDSU)
The Company offers a Deferred Share Unit Plan (DDSU) for members of the Board of Directors. Under the DDSU Plan, non-employee Directors of the Company may elect to allocate all or a portion of their annual compensation as deferred share units. These units are fully vested upon issuance. These units accumulate dividend equivalents in the form of additional units based on the dividends paid on the Company‘s common shares.
Units are redeemable for cash or shares only following cessation of service on the Board of Directors and must be redeemed by December 31
st of the year following the year in which the cessation occurred. The value of the
deferred share units when converted to cash will be equivalent to the market value of the Company‘s common shares at the time the conversion takes place.
Non-employee Directors of the Company were allocated a total of 34,430 deferred share units in 2010 (2009: 21,690 share units), which were granted to the Directors and expensed over the calendar year as the units are issued. An additional 11,464 DSUs were issued in lieu of cash compensation payable for service as a director. A further 7,770 DSUs were granted to present directors during 2010 as payment for notional dividends.
Executive
Deferred Share Unit Plan A (DSU-A)
Under the DSU-A Plan, senior executives of the Company may be awarded deferred share units as approved by the Board of Directors. This plan utilizes notional units that are fully vested upon issuance to the executives. These units accumulate dividend equivalents in the form of additional units based on the dividends paid on the Company‘s common shares. Units are redeemable only following cessation of employment and must be redeemed by December 31
st of the year following the year in which the cessation occurred. No units have been awarded under
the DSU-A Plan since 2001.
Deferred Share Unit Plan B (DSU-B)
Under the DSU-B Plan, executives of the Company may be awarded performance based deferred share units as approved by the Board of Directors. This plan utilizes notional units that become vested at specified percentages or become vested partially on December 30
th of the year following the year of retirement, death, or disability. These
specified levels and vesting percentages are based on the Company‘s common share price at those spec ified levels exceeding, for ten consecutive days, the common share price at the date of grant. Vested deferred share units are redeemable for a period of 30 days after cessation of employment, or by December 31
st of the year following the
year of retirement, death, or disability. The notional deferred share units that have not vested within five years from the date that they were granted expire. Only vested units accumulate dividend equivalents in the form of additional units based on the dividends paid on the Company‘s common shares. No units have been awarded under the DSU-B Plan since 2005.
Performance Share Unit Plan (PSU)
Under the PSU Plan, executives of the Company may be awarded performance share units as approved by the Board of Directors. This plan utilizes notional units that become vested dependent on achieving future specified performance levels. Vesting of the awards is based on the extent to which the Company‘s average return on equity achieves or exceeds the specified performance levels over a three-year period. Vested performance share units are redeemable in cash based on the common share price at the end of the performance period.
Only vested units accumulate dividend equivalents in the form of additional units based on the dividends paid on the Company‘s common shares. Compensation expense for the PSU Plan is recorded over the three-year performance period. The amount of compensation expense is adjusted over the three-year performance period to reflect the current market value of common shares and the number of shares anticipated to vest based upon the Company‘s forecast three-year average return on equity.
Executives of the Company were allocated a total of 236,390 performance share units in 2010, based on 100% vesting (2009: 341,253).
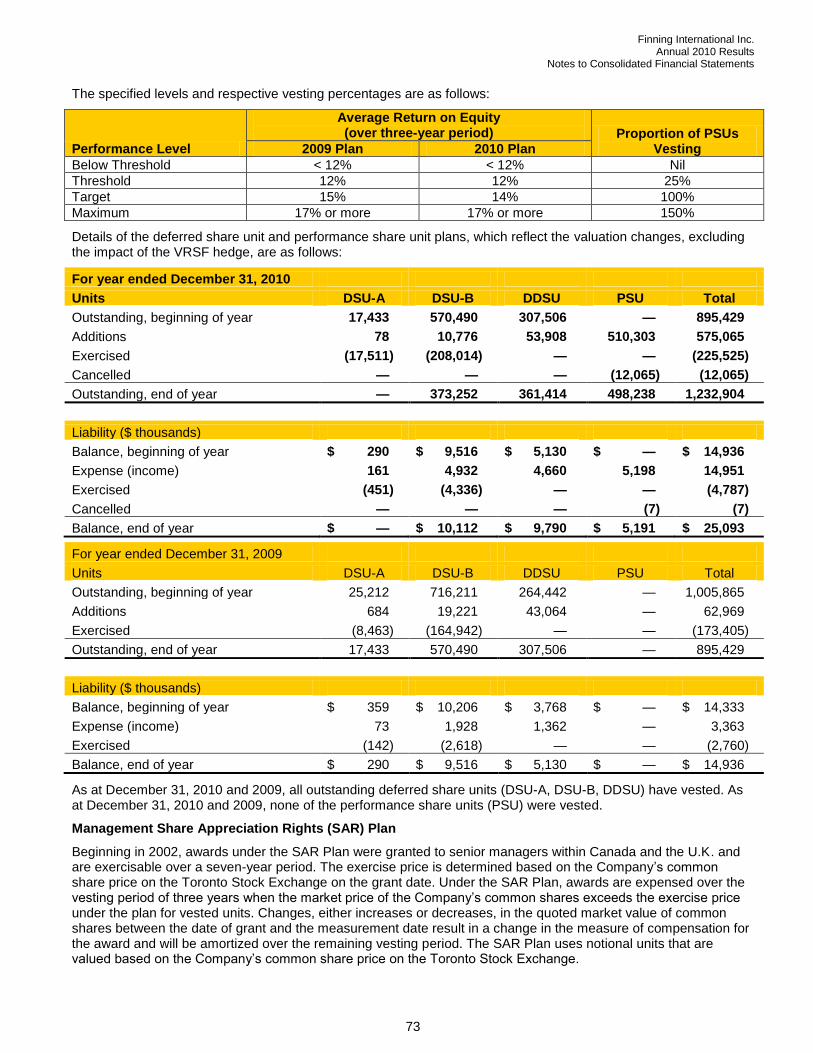
Finning International Inc. Annual 2010 Results Notes to Consolidated Financial Statements
73
The specified levels and respective vesting percentages are as follows:
Performance Level
Average Return on Equity (over three-year period) Proportion of PSUs
Vesting 2009 Plan 2010 Plan
Below Threshold < 12% < 12% Nil
Threshold 12% 12% 25%
Target 15% 14% 100%
Maximum 17% or more 17% or more 150%
Details of the deferred share unit and performance share unit plans, which reflect the valuation changes, excluding the impact of the VRSF hedge, are as follows:
For year ended December 31, 2010
Units DSU-A DSU-B DDSU PSU Total
Outstanding, beginning of year 17,433 570,490 307,506 — 895,429
Additions 78 10,776 53,908 510,303 575,065
Exercised (17,511) (208,014) — — (225,525)
Cancelled — — — (12,065) (12,065)
Outstanding, end of year — 373,252 361,414 498,238 1,232,904
Liability ($ thousands)
Balance, beginning of year $ 290 $ 9,516 $ 5,130 $ — $ 14,936
Expense (income) 161 4,932 4,660 5,198 14,951
Exercised (451) (4,336) — — (4,787)
Cancelled — — — (7) (7)
Balance, end of year $ — $ 10,112 $ 9,790 $ 5,191 $ 25,093
For year ended December 31, 2009
Units DSU-A DSU-B DDSU PSU Total
Outstanding, beginning of year 25,212 716,211 264,442 — 1,005,865
Additions 684 19,221 43,064 — 62,969
Exercised (8,463) (164,942) — — (173,405)
Outstanding, end of year 17,433 570,490 307,506 — 895,429
Liability ($ thousands)
Balance, beginning of year $ 359 $ 10,206 $ 3,768 $ — $ 14,333
Expense (income) 73 1,928 1,362 — 3,363
Exercised (142) (2,618) — — (2,760)
Balance, end of year $ 290 $ 9,516 $ 5,130 $ — $ 14,936
As at December 31, 2010 and 2009, all outstanding deferred share units (DSU-A, DSU-B, DDSU) have vested. As at December 31, 2010 and 2009, none of the performance share units (PSU) were vested.
Management Share Appreciation Rights (SAR) Plan
Beginning in 2002, awards under the SAR Plan were granted to senior managers within Canada and the U.K. and are exercisable over a seven-year period. The exercise price is determined based on the Company‘s common share price on the Toronto Stock Exchange on the grant date. Under the SAR Plan, awards are expensed over the vesting period of three years when the market price of the Company‘s common shares exceeds the exercise price under the plan for vested units. Changes, either increases or decreases, in the quoted market value of common shares between the date of grant and the measurement date result in a change in the measure of compensation for the award and will be amortized over the remaining vesting period. The SAR Plan uses notional units that are valued based on the Company‘s common share price on the Toronto Stock Exchange.

Finning International Inc. Annual 2010 Results Notes to Consolidated Financial Statements
74
8. STOCK-BASED COMPENSATION PLANS (CONTINUED)
No SAR units have been issued to management since 2005. Details of the SAR plans, excluding the impact of the VRSF hedge, are as follows:
For years ended December 31
Units 2010 2009
Outstanding and vested, beginning of year 474,664 645,604
Exercised (225,224) (81,754)
Cancelled (7,000) (89,186)
Outstanding and vested, end of year 242,440 474,664
Liability ($ thousands)
Balance, beginning of year $ 717 $ 216
Expense 3,232 699
Exercised (1,344) (198)
Balance, end of year $ 2,605 $ 717
Strike price ranges: $13.03- $16.22
Summary – Impact of Stock-Based Compensation Plans
Changes in the value of all deferred share units, performance share units, and share appreciation rights is a result of fluctuations in the Company‘s common share price, management‘s estimate of achieving performance targets, and the impact of new issues, including stock options, partially offset by the impact of the VRSF hedge. The net impact was an expense of $7.0 million in 2010 (2009: $11.1 million).
9. EARNINGS PER SHARE
Basic earnings per share (EPS) is calculated by dividing net income available to common shareholders by the weighted average number of common shares outstanding during the period. Diluted earnings per share is calculated to reflect the dilutive effect of exercising outstanding stock options by applying the treasury stock method.
Earnings used in determining earnings per share from continuing operations are presented below. Earnings used in determining earnings per share from discontinued operations are the earnings from discontinued operations as reported within the consolidated statements of income.
For years ended December 31
($ thousands, except share and per share amounts)
2010 Income Shares Per Share
Basic EPS from continuing operations:
Net income from continuing operations $ 170,716 171,029,585 $ 1.00
Effect of dilutive securities: stock options — 688,676 —
Diluted EPS from continuing operations:
Net income from continuing operations and assumed conversions $ 170,716 171,718,261 $ 0.99
2009
Basic EPS from continuing operations:
Net income from continuing operations $ 156,707 170,607,892 $ 0.92
Effect of dilutive securities: stock options — 385,593 —
Diluted EPS from continuing operations
Net income from continuing operations and assumed conversions $ 156,707 170,993,485 $ 0.92
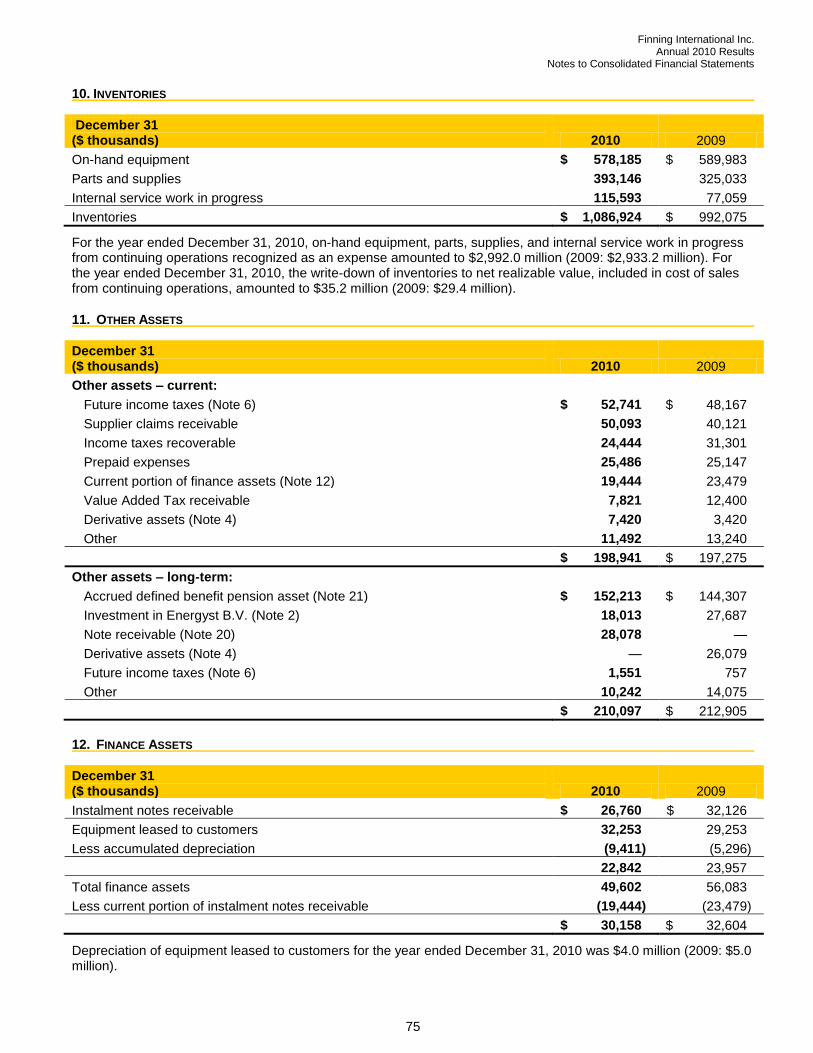
Finning International Inc. Annual 2010 Results Notes to Consolidated Financial Statements
75
10. INVENTORIES
December 31 ($ thousands) 2010 2009
On-hand equipment $ 578,185 $ 589,983
Parts and supplies 393,146 325,033
Internal service work in progress 115,593 77,059
Inventories $ 1,086,924 $ 992,075
For the year ended December 31, 2010, on-hand equipment, parts, supplies, and internal service work in progress from continuing operations recognized as an expense amounted to $2,992.0 million (2009: $2,933.2 million). For the year ended December 31, 2010, the write-down of inventories to net realizable value, included in cost of sales from continuing operations, amounted to $35.2 million (2009: $29.4 million).
11. OTHER ASSETS
December 31 ($ thousands) 2010 2009
Other assets – current:
Future income taxes (Note 6) $ 52,741 $ 48,167
Supplier claims receivable 50,093 40,121
Income taxes recoverable 24,444 31,301
Prepaid expenses 25,486 25,147
Current portion of finance assets (Note 12) 19,444 23,479
Value Added Tax receivable 7,821 12,400
Derivative assets (Note 4) 7,420 3,420
Other 11,492 13,240
$ 198,941 $ 197,275
Other assets – long-term:
Accrued defined benefit pension asset (Note 21) $ 152,213 $ 144,307
Investment in Energyst B.V. (Note 2) 18,013 27,687
Note receivable (Note 20) 28,078 —
Derivative assets (Note 4) — 26,079
Future income taxes (Note 6) 1,551 757
Other 10,242 14,075
$ 210,097 $ 212,905
12. FINANCE ASSETS
December 31 ($ thousands) 2010 2009
Instalment notes receivable $ 26,760 $ 32,126
Equipment leased to customers 32,253 29,253
Less accumulated depreciation (9,411) (5,296)
22,842 23,957
Total finance assets 49,602 56,083
Less current portion of instalment notes receivable (19,444) (23,479)
$ 30,158 $ 32,604
Depreciation of equipment leased to customers for the year ended December 31, 2010 was $4.0 million (2009: $5.0 million).

Finning International Inc. Annual 2010 Results Notes to Consolidated Financial Statements
76
13. RENTAL EQUIPMENT
December 31 ($ thousands) 2010 2009
Cost $ 735,070 $ 735,231
Less accumulated depreciation (317,930) (294,422)
$ 417,140 $ 440,809
Rental equipment under capital leases of $5.3 million (2009: $19.6 million), which is net of accumulated depreciation of $8.6 million (2009: $10.2 million), are included above, of which $nil (2009: $6.8 million) was acquired during the year. Depreciation of rental equipment for the year ended December 31, 2010 was $132.4 million (2009: $151.0 million).
14. CAPITAL ASSETS
Land, Buildings, and Equipment
2010 2009
December 31 ($ thousands) Cost
Accumulated depreciation
Net book value Cost
Accumulated depreciation
Net book value
Land $ 51,788 $ — $ 51,788 $ 51,226 $ — $ 51,226
Buildings and equipment 584,358 (195,282) 389,076 564,896 (176,410) 388,486
$ 636,146 $ (195,282) $ 440,864 $ 616,122 $ (176,410) $ 439,712
Land, buildings, and equipment under capital leases of $10.7 million (2009: $11.8 million), which is net of accumulated depreciation of $3.4 million (2009: $3.0 million), are included above, of which $0.5 million (2009: $1.2 million) was acquired during the year. Depreciation of buildings and equipment for the year ended December 31, 2010 was $35.6 million (2009: $34.9 million).
Intangible Assets
2010 2009
December 31 ($ thousands) Cost
Accumulated amortization
Net book value Cost
Accumulated amortization
Net book value
Subject to amortization
Customer contracts and related customer relationships $ 10,599 $ (8,402) $ 2,197 $ 13,349 $ (6,766) $ 6,583
Software 54,169 (11,260) 42,909 35,683 (10,462) 25,221
64,768 (19,662) 45,106 49,032 (17,228) 31,804
Indefinite lives
Distribution rights 646 — 646 646 — 646
$ 65,414 $ (19,662) $ 45,752 $ 49,678 $ (17,228) $ 32,450
The Company acquired intangible assets subject to amortization of $19.6 million in 2010 (2009: $14.4 million). The additions in 2010 primarily related to costs incurred in connection with the development of software to be used internally. Amortization of intangible assets subject to amortization for the year ended December 31, 2010 was $3.7 million (2009: $4.6 million).
Certain intangible assets are considered to have indefinite lives because they are expected to generate cash flows indefinitely.

Finning International Inc. Annual 2010 Results Notes to Consolidated Financial Statements
77
15. GOODWILL
The change in the carrying amount of goodwill is as follows:
December 31, 2010 ($ thousands) Canada
South America
UK & Ireland Consolidated
Goodwill, beginning of year $ 43,811 $ 31,451 $ 18,992 $ 94,254
Foreign exchange translation adjustment — (1,562) (1,578) (3,140)
Goodwill, end of year $ 43,811 $ 29,889 $ 17,414 $ 91,114
December 31, 2009 ($ thousands) Canada
South America UK Consolidated
Goodwill, beginning of year $ 43,811 $ 35,377 $ 20,090 $ 99,278
Acquired (a) — 1,276 — 1,276
Foreign exchange translation adjustment — (5,202) (1,098) (6,300)
Goodwill, end of year $ 43,811 $ 31,451 $ 18,992 $ 94,254
(a) In 2009, the Company acquired the remaining issued and outstanding common shares of Finning Servicio Especializado S.A., a machine repair, recovery, and reconditioning company based in Chile for cash of approximately $3 million. As a result, the Company now holds 100% of the issued and outstanding common shares.
16. LONG-TERM OBLIGATIONS
December 31 ($ thousands) 2010 2009
Stock-based compensation (Notes 4 and 8) $ 36,370 $ 41,797
Leasing obligations (a) (Note 24) 10,893 12,086
Employee future benefit obligations (Note 21) 31,714 23,974
Sale leaseback deferred gain 6,381 6,990
Asset retirement obligations (b) 1,264 1,201
Other 19,855 19,830
$ 106,477 $ 105,878
(a) Capital leases issued at varying rates of interest from 0.7% - 6.8% and maturing on various dates up to 2026.
(b) Asset retirement obligations relate to estimated future remediation and decommissioning costs on certain operating leases in the U.K. and are based on the Company‘s prior experience, including estimates for labour, materials, equipment, and overheads such as surveyor and legal costs. To determine the recorded liability, the future estimated cash flows have been discounted using the Company‘s credit-adjusted risk-free rate of 4.13%. Should changes occur in estimated future dilapidation costs, revisions to the liability could be made. The total undiscounted amount of estimated cash flows is $4.0 million, and the expected timing of payment of the cash flows is estimated to be over the next 70 years.
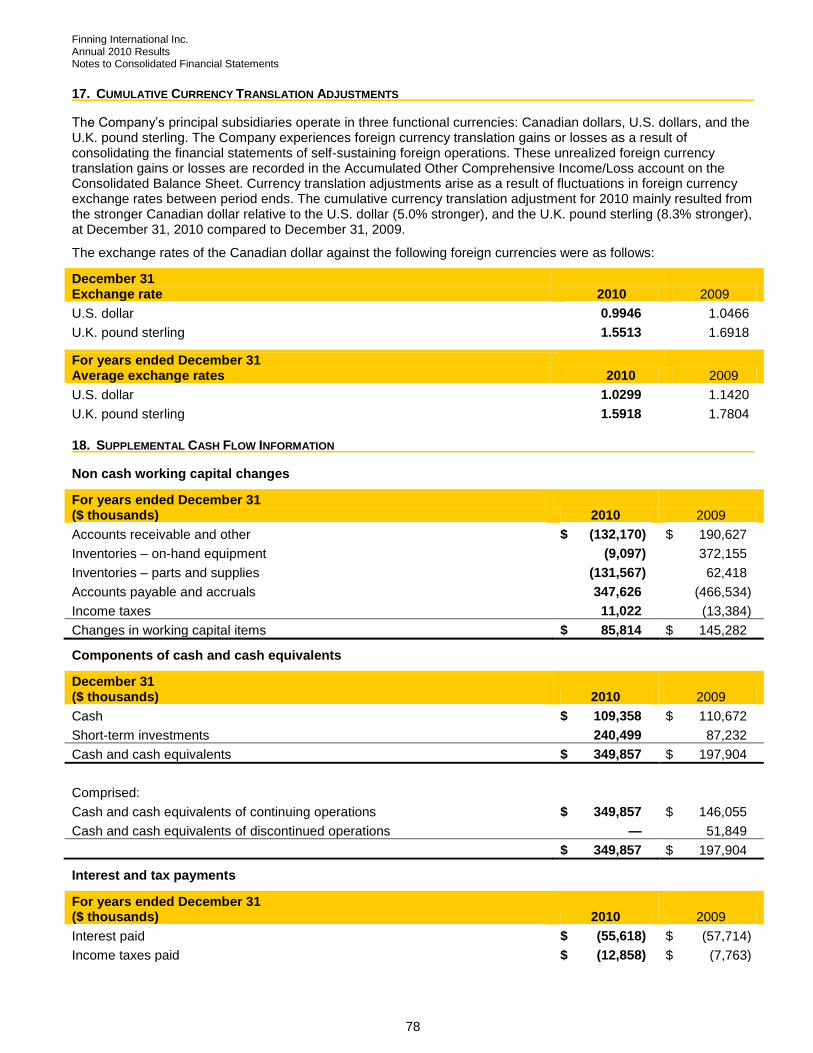
Finning International Inc. Annual 2010 Results Notes to Consolidated Financial Statements
78
17. CUMULATIVE CURRENCY TRANSLATION ADJUSTMENTS
The Company‘s principal subsidiaries operate in three functional currencies: Canadian dollars, U.S. dollars, and the U.K. pound sterling. The Company experiences foreign currency translation gains or losses as a result of consolidating the financial statements of self-sustaining foreign operations. These unrealized foreign currency translation gains or losses are recorded in the Accumulated Other Comprehensive Income/Loss account on the Consolidated Balance Sheet. Currency translation adjustments arise as a result of fluctuations in foreign currency exchange rates between period ends. The cumulative currency translation adjustment for 2010 mainly resulted from the stronger Canadian dollar relative to the U.S. dollar (5.0% stronger), and the U.K. pound sterling (8.3% stronger), at December 31, 2010 compared to December 31, 2009.
The exchange rates of the Canadian dollar against the following foreign currencies were as follows:
December 31 Exchange rate 2010 2009
U.S. dollar 0.9946 1.0466
U.K. pound sterling 1.5513 1.6918 For years ended December 31 Average exchange rates 2010 2009
U.S. dollar 1.0299 1.1420
U.K. pound sterling 1.5918 1.7804
18. SUPPLEMENTAL CASH FLOW INFORMATION
Non cash working capital changes
For years ended December 31 ($ thousands) 2010 2009
Accounts receivable and other $ (132,170) $ 190,627
Inventories – on-hand equipment (9,097) 372,155
Inventories – parts and supplies (131,567) 62,418
Accounts payable and accruals 347,626 (466,534)
Income taxes 11,022 (13,384)
Changes in working capital items $ 85,814 $ 145,282
Components of cash and cash equivalents
December 31 ($ thousands) 2010 2009
Cash $ 109,358 $ 110,672
Short-term investments 240,499 87,232
Cash and cash equivalents $ 349,857 $ 197,904
Comprised:
Cash and cash equivalents of continuing operations $ 349,857 $ 146,055
Cash and cash equivalents of discontinued operations — 51,849
$ 349,857 $ 197,904
Interest and tax payments
For years ended December 31 ($ thousands) 2010 2009
Interest paid $ (55,618) $ (57,714)
Income taxes paid $ (12,858) $ (7,763)

Finning International Inc. Annual 2010 Results Notes to Consolidated Financial Statements
79
19. ACQUISITION
In August 2010, Finning was appointed the Caterpillar dealer for Northern Ireland and the Republic of Ireland. The purchase is accounted for under the purchase method of accounting. The results of these operations have been included in the consolidated financial statements since that date.
The Company acquired certain assets, comprising inventory, a building, and other fixed assets, from the Administrator or Receiver of the previous Caterpillar dealers in Northern Ireland and the Republic of Ireland. The total purchase price for the assets is approximately $6 million (GBP 3.7 million), representing the fair value of the assets acquired. Acquisition and other related costs of $2.0 million were incurred on the transaction, and are recorded in other expenses on the consolidated statement of income. The total purchase price will be paid in cash; in 2010, $6.7 million was paid with the remaining $1.3 million to be paid in 2011.
In conjunction with these acquisitions, the Company increased its interest in Energyst B.V. by committing to purchase, at fair value, 11,230 shares for cash of $1.4 million (EUR 1.0 million). As a result, the Company‘s equity interest in Energyst increased to 27.0% from 25.4% in the first quarter of 2011.
20. DISPOSITION OF DISCONTINUED OPERATION
Following an extensive strategic review, on May 5, 2010, the Company sold its U.K. equipment rental subsidiary, Hewden Stuart Limited (Hewden). The Company determined that a large, short-term rental business operating separately from its UK dealership was not aligned with the Company‘s strategic objectives. Gross proceeds on the sale of Hewden of $171.1 million (£110.2 million) comprised cash of £90.2 million and a £20.0 million interest bearing 5-year note receivable with a fair value of £16.9 million. Transaction costs of $7.2 million were incurred and paid on the transaction.
The loss on sale was $244.1 million or $1.43 per share, which included the realization of $100.8 million of foreign exchange losses related to the Company‘s investment in Hewden which was previously recorded in accumulated other comprehensive loss, and $68.0 million related to Hewden‘s unfunded pension liability, which the buyer assumed.
The results of operations of Hewden for the periods up to May 5, 2010 have been reclassified as discontinued operations in the consolidated statements of income and cash flow. The assets and liabilities in the balance sheet for periods prior to the date of disposition have been presented separately. The results of Hewden had previously been reported in the Finning UK Group segment.
Loss from discontinued operations to the date of disposition is summarized as follows:
($ thousands)
January 1 – May 5 2010
Year ended December 31, 2009
Revenue $ 65,259 $ 257,621
Loss before provision for income taxes (7,596) (45,691)
Loss on sale of discontinued operation, pre tax (238,013) —
Provision for income taxes – recovery (expense) (3,480) 19,807
Loss from discontinued operations $ (249,089) $ (25,884)

Finning International Inc. Annual 2010 Results Notes to Consolidated Financial Statements
80
20. DISPOSITION OF DISCONTINUED OPERATION (CONTINUED)
The carrying amounts of assets and liabilities related to discontinued operations as at the date of disposition, and for the comparative period presented, are as follows:
($ thousands)
May 5 2010 (date of disposition) December 31 2009
ASSETS
Current assets
Cash $ 15,403 $ 51,849
Accounts receivable 41,584 38,438
Inventories 1,385 1,448
Other assets 12,985 9,755
Total current assets 71,357 101,490
Rental equipment 214,645 250,311
Land, building and equipment 36,246 43,065
Intangible assets 7,174 9,019
Other assets 62,159 32,645
Total assets $ 391,581 $ 436,530
LIABILITIES
Current liabilities
Accounts payable and accruals $ 47,342 $ 52,681
Income tax payable 160 195
Total current liabilities 47,502 52,876
Long-term obligations 3,638 4,269
Future income taxes 24,112 28,500
Total liabilities $ 75,252 $ 85,645
21. EMPLOYEE FUTURE BENEFITS
The Company and its subsidiaries in Canada and the U.K. have defined benefit pension plans and defined contribution pension plans providing retirement benefits for most of their permanent employees. The Company‘s Irish subsidiary has a defined contribution plan.
The defined benefit pension plans include both registered and non-registered pension plans that provide a pension based on the members‘ final average earnings and years of service while participating in the pension plan.
In Canada, defined benefit plans exist for eligible employees. Final average earnings are based on the highest 3-5 year average salary and there is no standard indexation feature. Effective July 1, 2004, non-executive members of the defined benefit plan were offered a voluntary opportunity to convert their benefits to a defined contribution pension plan. The registered defined benefit plan was subsequently closed to all new non-executive employees, who are eligible to enter one of the Company‘s defined contribution plans. Effective January 1, 2010, the defined benefit plan was closed to new executive employees, who are eligible to join a defined contribution plan. Pension benefits under the registered defined benefit plans‘ formula that exceed the maximum taxation limits are provided from a non-registered supplemental pension plan. Benefits under this plan are partially funded by a Retirement Compensation Arrangement.
Finning (UK) provides a defined benefit plan for all employees hired prior to January 2003. Final average earnings are based on the highest 3-year period and benefits are indexed annually with inflation subject to limits. Effective January 2003, this plan was essentially closed to new employees and replaced with a defined contribution pension plan.
The defined contribution pension plans in Canada are registered pension plans that offer a base Company contribution rate for all members. The Company will also partially match non-executive employee contributions to a maximum additional Company contribution of 1% of employee earnings. The defined contribution pension plan in
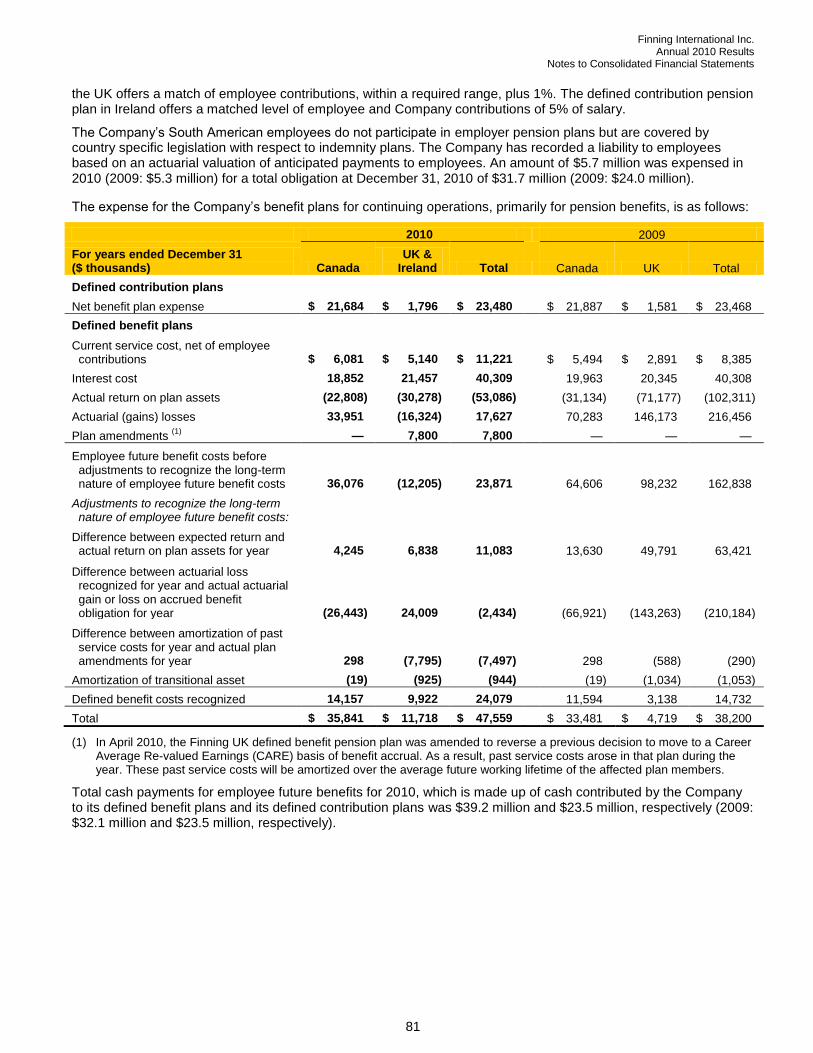
Finning International Inc. Annual 2010 Results Notes to Consolidated Financial Statements
81
the UK offers a match of employee contributions, within a required range, plus 1%. The defined contribution pension plan in Ireland offers a matched level of employee and Company contributions of 5% of salary.
The Company‘s South American employees do not participate in employer pension plans but are covered by country specific legislation with respect to indemnity plans. The Company has recorded a liability to employees based on an actuarial valuation of anticipated payments to employees. An amount of $5.7 million was expensed in 2010 (2009: $5.3 million) for a total obligation at December 31, 2010 of $31.7 million (2009: $24.0 million).
The expense for the Company‘s benefit plans for continuing operations, primarily for pension benefits, is as follows:
2010 2009
For years ended December 31 ($ thousands) Canada
UK & Ireland Total Canada UK Total
Defined contribution plans
Net benefit plan expense $ 21,684 $ 1,796 $ 23,480 $ 21,887 $ 1,581 $ 23,468
Defined benefit plans
Current service cost, net of employee contributions $ 6,081 $ 5,140 $ 11,221 $ 5,494 $ 2,891 $ 8,385
Interest cost 18,852 21,457 40,309 19,963 20,345 40,308
Actual return on plan assets (22,808) (30,278) (53,086) (31,134) (71,177) (102,311)
Actuarial (gains) losses 33,951 (16,324) 17,627 70,283 146,173 216,456
Plan amendments (1)
— 7,800 7,800 — — —
Employee future benefit costs before adjustments to recognize the long-term nature of employee future benefit costs 36,076 (12,205) 23,871 64,606 98,232 162,838
Adjustments to recognize the long-term nature of employee future benefit costs:
Difference between expected return and actual return on plan assets for year 4,245 6,838 11,083 13,630 49,791 63,421
Difference between actuarial loss recognized for year and actual actuarial gain or loss on accrued benefit obligation for year (26,443) 24,009 (2,434) (66,921) (143,263) (210,184)
Difference between amortization of past service costs for year and actual plan amendments for year 298 (7,795) (7,497) 298 (588) (290)
Amortization of transitional asset (19) (925) (944) (19) (1,034) (1,053)
Defined benefit costs recognized 14,157 9,922 24,079 11,594 3,138 14,732
Total $ 35,841 $ 11,718 $ 47,559 $ 33,481 $ 4,719 $ 38,200
(1) In April 2010, the Finning UK defined benefit pension plan was amended to reverse a previous decision to move to a Career Average Re-valued Earnings (CARE) basis of benefit accrual. As a result, past service costs arose in that plan during the year. These past service costs will be amortized over the average future working lifetime of the affected plan members.
Total cash payments for employee future benefits for 2010, which is made up of cash contributed by the Company to its defined benefit plans and its defined contribution plans was $39.2 million and $23.5 million, respectively (2009: $32.1 million and $23.5 million, respectively).

Finning International Inc. Annual 2010 Results Notes to Consolidated Financial Statements
82
21. EMPLOYEE FUTURE BENEFITS (CONTINUED)
Information about the Company‘s defined benefit plans for continuing operations is as follows:
2010 2009
For years ended December 31 ($ thousands) Canada UK Total
Canada UK Total
Accrued benefit obligation
Balance at beginning of year $ 344,398 $ 417,706 $ 762,104 $ 267,253 $ 290,273 $ 557,526
Current service cost 7,253 5,372 12,625 7,237 4,107 11,344
Interest cost 18,852 21,457 40,309 19,963 20,345 40,308
Benefits paid (20,941) (15,759) (36,700) (20,338) (19,825) (40,163)
Actuarial (gains) losses 33,951 (16,324) 17,627 70,283 146,173 216,456
Past service cost — 7,800 7,800 — — —
Foreign exchange rate changes — (34,754) (34,754) — (23,367) (23,367)
Balance at end of year $ 383,513 $ 385,498 $ 769,011 $ 344,398 $ 417,706 $ 762,104
Plan assets
Fair value at beginning of year $ 282,623 $ 355,447 $ 638,070 $ 257,629 $ 302,621 $ 560,250
Actual return on plan assets 22,808 30,278 53,086 31,134 71,177 102,311
Employer contributions 17,815 18,358 36,173 12,454 20,428 32,882
Employees‘ contributions 1,211 232 1,443 1,744 1,216 2,960
Benefits paid (20,941) (15,759) (36,700) (20,338) (19,825) (40,163)
Foreign exchange rate changes — (30,361) (30,361) — (20,170) (20,170)
Fair value at end of year $ 303,516 $ 358,195 $ 661,711 $ 282,623 $ 355,447 $ 638,070
Funded status – deficit $ (79,997) $ (27,303) $ (107,300) $ (61,775) $ (62,259) $ (124,034)
Unamortized net actuarial loss 138,562 113,098 251,660 116,404 156,126 272,530
Unamortized past service costs 1,175 2,477 3,652 1,472 (5,583) (4,111)
Contributions remitted after valuation date 5,419 1,469 6,888 2,188 1,663 3,851
Unamortized transitional asset (44) (2,643) (2,687) (63) (3,866) (3,929)
Accrued benefit asset (a) $ 65,115 $ 87,098 $ 152,213 $ 58,226 $ 86,081 $ 144,307
a) The accrued benefit asset is classified in long term other assets on the consolidated balance sheets.
Included in the above accrued benefit obligation and fair value of plan assets at the year-end are the following amounts in respect of plans that are not fully funded:
2010 2009
For years ended December 31 ($ thousands) Canada UK Total
Canada UK Total
Accrued benefit obligation $ 381,180 $ 385,498 $ 766,678 $ 342,433 $ 417,706 $ 760,139
Fair value of plan assets 298,323 358,195 656,518 277,522 355,447 632,969
Funded status – plan deficit $ 82,857 $ 27,303 $ 110,160 $ 64,911 $ 62,259 $ 127,170
For measurement purposes, assets and liabilities of the plans are valued as at November 30. Plan assets do not include a direct investment in common shares of the Company at December 31, 2010 and 2009.

Finning International Inc. Annual 2010 Results Notes to Consolidated Financial Statements
83
Plan assets are principally invested in the following securities at November 30, 2010:
Canada UK
Equity 59.1% 50.4%
Fixed-income 34.3% 40.5%
Real estate 6.6% 9.1%
The significant actuarial assumptions are as follows:
2010 2009
Canada UK Canada UK
Discount rate – obligation 5.1% 5.5% 5.5% 5.5%
Discount rate – expense 5.5% 5.5% 7.5% 7.2%
Expected long-term rate of return on plan assets 7.0% 7.0% 7.0% 7.0%
Rate of compensation increase 3.5% 3.9% 3.5% 4.0%
Estimated remaining service life (years) 9-11 14 9-11 14
Discount rates are determined based on high quality corporate bonds at the measurement date, November 30. The accrued defined benefit pension obligations and expense are sensitive to changes in the discount rate, among other assumptions. For example, if yields were lower, the accrued defined benefit pension obligations as presented in this note would be higher. As an indication of the sensitivity of Finning‘s defined benefit pension obligation, if the discount rates were 0.25% lower at November 30, 2010, the accrued defined benefit pension obligation presented would have increased by approximately $11 million for Finning (Canada)‘s plans and £12 million for the Finning UK plan.
Defined benefit pension plans are country and entity specific. The major defined benefit plans and their respective valuation dates are:
Defined Benefit Plan Last Actuarial Valuation Date
Next Actuarial Valuation Date
Canada – BC Regular & Executive Plan December 31, 2009 December 31, 2012
Canada – Executive Supplemental Income Plan December 31, 2009 December 31, 2012
Canada – General Supplemental Income Plan December 31, 2009 December 31, 2012
Canada – Alberta Defined Benefit Plan December 31, 2009 December 31, 2010
Finning UK Defined Benefit Scheme December 31, 2008 December 31, 2011
22. ECONOMIC RELATIONSHIPS
The Company distributes and services heavy equipment, engines, and related products. The Company has dealership agreements with numerous equipment manufacturers, of which the most significant are with subsidiaries of Caterpillar Inc. Distribution and servicing of Caterpillar products account for the major portion of the Company's operations. Finning has a strong relationship with Caterpillar Inc. that has been ongoing since 1933.
23. SEGMENTED INFORMATION
The Company and its subsidiaries have operated primarily in one industry during the year, that being the selling, servicing, and renting of heavy equipment, engines, and related products.
The reportable operating segments are as follows:
Canadian operations: British Columbia, Alberta, the Yukon Territory, the Northwest Territories, and a portion of Nunavut.
South American operations: Chile, Argentina, Uruguay, and Bolivia.
UK and Ireland operations: England, Scotland, Wales, Northern Ireland, the Republic of Ireland, Falkland Islands, and the Channel Islands.
Other: corporate head office.

Finning International Inc. Annual 2010 Results Notes to Consolidated Financial Statements
84
23. SEGMENTED INFORMATION (CONTINUED)
For year ended December 31, 2010 ($ thousands) Canada
South America
UK & Ireland Other Consolidated
Revenue from external sources $ 2,323,567 $ 1,668,438 $ 649,297 $ — $ 4,641,302
Operating costs (2,053,156) (1,475,108) (608,004) (13,674) (4,149,942)
Depreciation and amortization (119,027) (36,503) (20,051) (168) (175,749)
151,384 156,827 21,242 (13,842) 315,611
Other income (expenses)
IT system implementation costs (14,663) (9,311) (2,637) (1,209) (27,820)
Other (5,201) — (2,627) (5,000) (12,828)
Earnings from continuing operations before interest and taxes $ 131,520 $ 147,516 $ 15,978 $ (20,051) $ 274,963
Finance costs (58,701)
Provision for income taxes (45,546)
Net income from continuing operations 170,716
Loss from discontinued operations, net of tax (249,089)
Net income $ (78,373)
Identifiable assets $ 1,587,769 $ 1,435,025 $ 518,190 $ 72,657 $ 3,613,641
Capital assets $ 313,118 $ 131,248 $ 41,631 $ 619 $ 486,616
Gross capital expenditures (1)
$ 33,180 $ 27,852 $ 9,576 $ — $ 70,608
Gross rental asset expenditures $ 154,079 $ 47,292 $ 21,205 $ — $ 222,576
For year ended December 31, 2009 ($ thousands) Canada
South America UK Other Consolidated
Revenue from external sources $ 2,386,642 $ 1,489,600 $ 603,678 $ — $ 4,479,920
Operating costs (2,125,706) (1,299,386) (553,350) (25,323) (4,003,765)
Depreciation and amortization (132,614) (37,405) (25,319) (182) (195,520)
128,322 152,809 25,009 (25,505) 280,635
Other income (expenses)
IT system implementation costs (10,574) (5,616) (2,388) (279) (18,857)
Other (19,421) 6,532 (3,005) 1,012 (14,882)
Earnings from continuing operations before interest and taxes $ 98,327 $ 153,725 $ 19,616 $ (24,772) $ 246,896
Finance costs (61,793)
Provision for income taxes (28,396)
Net income from continuing operations 156,707
Loss from discontinued operations, net of tax (25,884)
Net income $ 130,823
Identifiable assets from continuing operations $ 1,651,206 $ 1,034,074 $ 489,111 $ 60,514 $ 3,234,905
Capital assets $ 307,627 $ 123,791 $ 39,425 $ 1,319 $ 472,162
Gross capital expenditures (1)
$ 55,129 $ 45,265 $ 5,639 $ — $ 106,033
Gross rental asset expenditures $ 118,071 $ 20,549 $ 25,316 $ — $ 163,936
(1) includes capital leases

Finning International Inc. Annual 2010 Results Notes to Consolidated Financial Statements
85
24. CONTRACTUAL OBLIGATIONS
Future minimum lease payments due under capital lease contracts and payments due under various operating lease contracts are as follows:
For years ended December 31 ($ thousands)
Capital Leases
Operating Leases
2011 $ 2,422 $ 63,039
2012 1,279 46,523
2013 1,147 34,121
2014 1,096 18,349
2015 1,065 15,235
Thereafter 12,667 127,289
$ 19,676 $ 304,556
Less imputed interest 7,181
12,495
Less current portion of capital lease obligation 1,602
Total long-term capital lease obligation $ 10,893
25. COMMITMENTS AND CONTINGENCIES
(a) Due to the size, complexity, and nature of the Company‘s operations, various legal and tax matters are pending. In the opinion of management, these matters will not have a material effect on the Company‘s consolidated financial position or results of operations.
(b) The Company is proceeding with the construction of a new oil sands service facility in Fort McKay, Alberta. Construction of the new building is anticipated to cost approximately $110 million, with completion by the end of 2012.
26. GUARANTEES AND INDEMNIFICATIONS
The Company enters into contracts with rights of return, in certain circumstances, for the repurchase of equipment sold to customers for an amount which is generally based on a discount from the estimated future fair value of that equipment. As at December 31, 2010, the total estimated value of these contracts outstanding is $146.0 million coming due at periods ranging from 2011 to 2016. The Company‘s experience to date has been that the equipment at the exercise date of the contract is generally worth more than the repurchase amount. The total amount recognized as a provision against these contracts is $0.6 million.
The Company has issued certain guarantees to Caterpillar Finance to guarantee, on a pro-rata basis, certain borrowers‘ obligations. The guarantees would be enforceable in the event that the borrowers defaulted on their obligations to Caterpillar Finance, to the extent that any net proceeds from the recovery and sale of collateral securing repayment of the borrowers‘ obligations is insufficient to meet those obligations. As at December 31, 2010, the maximum potential amount of future payments that the Company could be required to make under the guarantees, before any amounts that may possibly be recovered under recourse or collateralization provisions in the guarantees, is $10.3 million, covering various periods up to 2016. As at December 31, 2010, the Company had no liability recorded for these guarantees.
As part of the Hewden Purchase and Sale Agreement in 2010, Finning provided indemnifications to the third party purchaser, covering breaches of representation and warranties as well as litigation and other matters set forth in the agreement. Claims may be made by the third party purchaser under the agreement for various periods of time depending on the nature of the claim, up to six years. The maximum potential exposure of Finning under these indemnifications is 100% of the purchase price. As at December 31, 2010, Finning had no material liabilities recorded for these indemnifications.

Finning International Inc. Annual 2010 Results Notes to Consolidated Financial Statements
86
26. GUARANTEES AND INDEMNIFICATIONS (CONTINUED)
In connection with the sale of the Materials Handling Division in 2006, the Company provided a guarantee to a third party with respect to a property lease. If the lessee were to default, the Company would be required to make the annual lease payments of approximately $1.0 million to the end of the lease term in 2020. As at December 31, 2010, the Company had no liability recorded for this guarantee.
In the normal course of operations, the Company has several long-term maintenance and repair contracts with various customers which contain cost per hour guarantees.
During the year, the Company entered into various other commercial letters of credit in the normal course of operations. The total issued and outstanding letters of credit at December 31, 2010 was $86.5 million, of which $84.7 million relates to letters of credit issued in Chile, principally related to performance guarantees on delivery for prepaid equipment and other operational commitments.