Embed Size (px)
Citation preview
Please click on the appropriate sectorto view
EconomyOfficesRetailIndustrial
About & Contacts
FINLANDCountry SnapshotsSecond quarter I 2016

This report has been produced by Cushman & Wakefield LLP for use by those with an interest in commercial property solely for information purposes. It is not intended to be a complete description of the markets or developments to which it refers. The report uses information obtained from public sources which Cushman & Wakefield LLP believe to be reliable, but we have not verified such information and cannot guarantee that it is accurate and complete. No warranty or representation, express or implied, is made as to the accuracy or completeness of any of the information contained herein and Cushman & Wakefield LLP shall not be liable to any reader of this report or any third party in any way whatsoever. All expressions of opinion are subject to change. Our prior written consent is required before this report can be reproduced in whole or in part. ©2016 Cushman & Wakefield LLP. All rights reserved.
Ville Suominen Analyst, Valuation & Research Itämerenkatu 1, Helsinki, 00180, Finland Tel: +358 10 836 8455 [email protected] cushmanwakefield.com / dtz.fi
FINLAND
Economic Snapshot
Second Quarter | 2016
Overview The Finnish economy maintained a steady momentum in the first half of 2016, with private consumption the main driver of growth, although gains are being offset by continued weakness in exports and public spending. GDP growth rose 0.6% quarter-on-quarter in Q1, marginally better than the 0.5% growth recorded in the final quarter of 2015.
Private consumption ahead of expectations Consumer spending continues to surprise to the upside, despite muted wage growth and still high unemployment. Recent high-frequency economic indicators, such as retail sales and consumer confidence, have been showing steady signs of improvement, while low inflation is helping support real disposable incomes. The unemployment rate has started to gradually decline from the peak level of 9.4% in 2015 to 9.1% in May. Private consumption is now forecast to increase by 1.5% before slowing to 0.9% in 2017.
Slow recovery in investment to continue After five consecutive years of contraction, fixed investment activity is forecast to finally start increasing in 2016, led primarily by the construction sector. For the majority of companies, however, large scale capital spending plans are expected to remain on hold, with the domestic and external environment still not strong enough to warrant significant investment. There is little support from the public sector, with investment being hampered by the government’s ongoing fiscal adjustment programme. Fixed investment growth is forecast to be 1.2% in 2016, before averaging 2.0% per year between 2017-19.
Reforms remain key to achieving stronger growth The economy is expected to grow by 1.3% in 2016, by 0.9% in 2017 and then average around 1.6% a year in 2018-19. While the economic outlook may have improved, Finland lost the last of its triple-A ratings in June, after Moody’s downgraded it. This was due to concerns that stronger growth over the medium term will remain elusive until Finland addresses several structural issues, including weak cost competitiveness, poor labour productivity and declining corporate profitability. The government, unions and businesses have recently signed a competitiveness pact, which is an important step in the right direction to address these issues.
MARKET INDICATORS Market Outlook GDP: Steady improvement in 2016, but several domestic
and external challenges remain.
Inflation: Price pressures are gradually building and inflation is expected to turn positive this year.
Interest rate: The ECB continues to pursue ultra-loose monetary policy and may cut interest rates further.
Employment: Weak but stabilising. Job creation is still very subdued in many industries amid limited investment.
Economic Summary ECONOMIC INDICATORS 2013 2014 2015E 2016F 2017F GDP Growth -0.8 -0.7 0.7 1.3 0.9
Consumer Spending -0.5 0.6 1.4 1.5 0.9
Industrial Production -3.2 -1.9 -1.1 -0.3 2.3
Investment -4.9 -2.6 -1.1 1.2 1.8
Unemployment rate (ILO%) 8.1 8.7 9.3 9.1 9.1
Inflation 1.5 1.0 -0.2 0.4 1.8
USD/EUR (average) 1.33 1.33 1.11 1.10 1.06
USD/EUR (end-period) 1.32 1.38 1.21 1.09 1.05
Interest Rates: 3-month (%) 0.3 0.1 -0.1 -0.3 -0.2
Interest Rates: 10-year (%) 2.1 0.8 0.9 0.9 1.4
NOTE: *annual % growth rate unless otherwise indicated. E estimate F forecast
Source: Oxford Economics Ltd. and Consensus Economics Inc
Economic & Political Breakdown Population 5.5 million (2015)
GDP US$ 230.3 billion (2015)
Public Sector Balance -2.8% of GDP (2015)
Public Sector Debt 63.2% of GDP (2015)
Current Account Balance 0.1% of GDP (2015)
Parliament A coalition of the Centre Party, The Finns and the National Coalition Party.
President Sauli Niinistö
Prime Minister Juha Sipilä
Election Dates April 2019 (Legislative) February 2018 (Presidential)
Economic Activity
-5.0
-2.5
0.0
2.5
5.0
-10.0-7.5-5.0-2.50.02.55.07.5
10.0
2006 2008 2010 2012 2014 2016 F
GDP GROWTH (annual %) - leftINFLATION (annual %) - right

This report has been produced by Cushman & Wakefield LLP for use by those with an interest in commercial property solely for information purposes. It is not intended to be a complete description of the markets or developments to which it refers. The report uses information obtained from public sources which Cushman & Wakefield LLP believe to be reliable, but we have not verified such information and cannot guarantee that it is accurate and complete. No warranty or representation, express or implied, is made as to the accuracy or completeness of any of the information contained herein and Cushman & Wakefield LLP shall not be liable to any reader of this report or any third party in any way whatsoever. All expressions of opinion are subject to change. Our prior written consent is required before this report can be reproduced in whole or in part. ©2016 Cushman & Wakefield LLP. All rights reserved.
Ville Suominen Analyst, Valuation & Research Itämerenkatu 1, Helsinki, 00180, Finland Tel: +358 10 836 8455 [email protected] cushmanwakefield.com / dtz.fi
FINLAND
Office Market Snapshot Second Quarter | 2016
Overview GDP growth forecasts for Finland have recently been revised upwards to 1.3%, however conditions remain challenging with unemployment relatively high, albeit declining slowly and this has dented business confidence.
Occupier focus Occupier demand is showing signs of strengthening as 2016 progresses but the overall vacancy remains high and is currently between 13%-14%. Active requirements for modern buildings in good locations is strong but supply at this end of the market is declining and there are now clear signs that the demand for good quality secondary office properties has increased. In Q2 only 25,000 sq.m of new office space completed in the Helsinki Metropolitan Area and there is an estimated 54,000 sq.m due to complete in 2017. These current market conditions will support positive rental growth at the quality end of the market.
The ongoing investments in transport infrastructure will go someway in reshaping the office market landscape in Helsinki, although this will take time as some have been delayed. For example, the new metro line towards the west from the Helsinki city centre was supposed to start to operate in August 2016 but is now delayed until January 2017 at the earliest, but this could provide opportunity to companies looking to relocate now on a cheaper rent before the area opens up further with the completion of the infrastructure projects.
Investment focus Q2 investment in the Finnish office sector totaled €144 million with private property companies the most active, accounting for approximately 45% and international investors taking a market share of around 25%. Demand for office assets is still clearly targeting prime product - this is not expected to change going forward. However, secondary properties have traded and there are clear signs that investor appetite for secondary office properties have increased during 2016 as the lack of quality product forces them to look here for opportunities.
Outlook Prime, well-let assets will remain key for investors although some demand for non-core assets is becoming apparent. The occupational market will continue to suffer from the slow economic momentum but demand should improve slowly.
MARKET INDICATORS Market Outlook Prime Rents: With vacancy still high rents are generally stable,
although with some potential uplift for quality stock.
Prime Yields: Prime yields are expected to stabilise following a sustained period of hardening.
Supply: Supply is expected to decrease as speculative space falls and demand improves, eroding excess space.
Demand: A strengthening of demand is apparent but this is from a low base.
Prime Office rents – June 2016 LOCATION € € US$ GROWTH %
SQ.M MTH
SQ.M YR
SQ.FT YR
1YR 5YR CAGR
Helsinki (City Centre) 34.00 408 42.1 1.5 3.6
Helsinki (Out of Town) 21.50 258 26.6 0.0 3.1
Turku 16.50 198 20.4 0.0 1.9
Tampere 21.00 252 26.0 0.0 3.1
Oulu 15.00 180 18.6 0.0 n/a
Prime Office yields – June 2016 LOCATION (FIGURES ARE NET, %)
CURRENT LAST LAST 10 YEAR Q Q Y HIGH LOW
Helsinki (City Centre) 4.40 4.40 4.50 6.00 4.40
Helsinki (Out of Town) 5.75 5.75 5.90 6.95 5.40
Turku 7.25 7.25 7.25 8.00 5.80
Tampere 6.75 6.75 6.75 7.90 5.80
Oulu 6.75 6.75 6.75 7.90 5.80 With respect to the yield data provided, in light of the changing nature of the market and the costs implicit in any transaction, such as financing, these are very much a guide only to indicate the approximate trend and direction of prime initial yield levels and should not be used as a comparable for any particular property or transaction without regard to the specifics of the property.
Recent performance
-10.0%
-5.0%
0.0%
5.0%
10.0%
15.0%
3.00%
4.00%
5.00%
6.00%
7.00%
8.00%
Jun-06 Jun-08 Jun-10 Jun-12 Jun-14 Jun-16
Rental grow
th (y/y)
Yiel
ds
Yield - Country Average Yield - PrimeRental Growth - Prime Rental Growth - Country Average

This report has been produced by Cushman & Wakefield LLP for use by those with an interest in commercial property solely for information purposes. It is not intended to be a complete description of the markets or developments to which it refers. The report uses information obtained from public sources which Cushman & Wakefield LLP believe to be reliable, but we have not verified such information and cannot guarantee that it is accurate and complete. No warranty or representation, express or implied, is made as to the accuracy or completeness of any of the information contained herein and Cushman & Wakefield LLP shall not be liable to any reader of this report or any third party in any way whatsoever. All expressions of opinion are subject to change. Our prior written consent is required before this report can be reproduced in whole or in part. ©2016 Cushman & Wakefield LLP. All rights reserved.
Ville Suominen Analyst, Valuation & Research Itämerenkatu 1, Helsinki, 00180, Finland Tel: +358 10 836 8455 [email protected] cushmanwakefield.com / dtz.fi
FINLAND
Retail Market Snapshot Second Quarter | 2016
Overview With robust economic performance reported in the early part of 2016 growth forecasts for the year have been revised upwards from 0.7% to 1.3%, although this is likely to follow a slower period in 2017 with GDP estimates at 0.9%. According to Statistics Finland, consumer confidence increased from 9.8 in April to 14.9 in June, which is the highest value since May 2015 as consumers’ expectations concerning the performance of the economy are improving.
Occupier focus Prime retail high street and shopping centre locations saw steady occupier demand in Q2 2016 with a continued clear focus on units along the key high streets in Helsinki. Prime rents remain unchanged across all retail segments both in prime and secondary retail locations but there may be some uplift as the year progresses, demand strengthens further for key thoroughfares and the option to take suitable available units declines further.
On the supply side there were no new shopping centre openings in Q1 and Q2 2016. However, development activity is expected to improve in H2 2016 and 2017 with more than 170,000 sq.m of new shopping centre space currently under construction. More than 70% of new shopping centre space will be opened in Helsinki, with the 60,000 sq.m Redi shopping centre representing one of the most anticipated openings in 2017.
Investment focus Activity in the Finnish retail market was robust yet again in Q2, continuing the trend of rising investor sentiment. Trading volumes reached €253 million in Q2 with activity dominated entirely by Nordic investors. Indeed 55% of the capital invested in the Finnish retail sector originated from Sweden. The most active investor type was private property companies accounting for approximately 60% of the Q2 transaction volume. The most notable deal was AB Sagax’s purchase of a retail portfolio for €90 million.
Outlook The retail property market is expected to remain relatively stable but with an increasingly positive outlook. Occupational and investors demand will begin to improve but no significant changes in rent and yields are expected before 2017.
MARKET INDICATORS Market Outlook Prime Rents: Stable rents, although some marginal growth
potential in the best prime high streets in Helsinki.
Prime Yields: Yields anticipated to remain at current level across all retail segments in 2016.
Supply: Limited, with some improvement expected in H2 2016 and 2017.
Demand: Steady demand for prime assets in Helsinki and best retail location in dominant regional cities.
Prime Retail Rents - June 2016 HIGH STREET SHOPS € € US$ GROWTH %
SQ.M MTH
SQ.M YR
SQ.FT YR
1YR 5YR CAGR
Helsinki 130 1,560 161 0.0 0.4
Turku 65 780 81 0.0 -0.8
Tampere 70 840 87 0.0 -2.6
Oulu 70 840 87 0.0 n/a
Prime Retail Yields - June 2016 HIGH STREET SHOPS (FIGURES ARE NET, %)
CURRENT LAST LAST 10 YEAR Q Q Y HIGH LOW
Helsinki 4.50 4.50 4.60 5.80 4.50
Turku 6.00 6.00 6.15 7.20 5.65
Tampere 5.75 5.75 5.90 6.95 5.40
Oulu* 6.50 6.50 6.65 7.00 6.50 SHOPPING CENTRES (FIGURES ARE NET, %)
CURRENT LAST LAST 10 YEAR Q Q Y HIGH LOW
Country prime 4.80 4.80 4.80 5.80 4.50 Note: *3yr record. With respect to the yield data provided, in light of the changing nature of the market and the costs implicit in any transaction, such as financing, these are very much a guide only to indicate the approximate trend and direction of prime initial yield levels and should not be used as a comparable for any particular property or transaction without regard to the specifics of the property.
Recent performance
-10.0%-5.0%0.0%5.0%10.0%15.0%20.0%
3.00%
4.00%
5.00%
6.00%
7.00%
Jun-06 Jun-08 Jun-10 Jun-12 Jun-14 Jun-16
Rental grow
th (y/y)
Yiel
ds
Yield - Country Average Yield - PrimeRental Growth - Prime Rental Growth - Country Average
This report has been produced by Cushman & Wakefield LLP for use by those with an interest in commercial property solely for information purposes. It is not intended to be a complete description of the markets or developments to which it refers. The report uses information obtained from public sources which Cushman & Wakefield LLP believe to be reliable, but we have not verified such information and cannot guarantee that it is accurate and complete. No warranty or representation, express or implied, is made as to the accuracy or completeness of any of the information contained herein and Cushman & Wakefield LLP shall not be liable to any reader of this report or any third party in any way whatsoever. All expressions of opinion are subject to change. Our prior written consent is required before this report can be reproduced in whole or in part. ©2016 Cushman & Wakefield LLP. All rights reserved.
Ville Suominen Analyst, Valuation & Research Itämerenkatu 1, Helsinki, 00180, Finland Tel: +358 10 836 8455 [email protected] cushmanwakefield.com / dtz.fi
FINLAND
Industrial Market Snapshot Second Quarter | 2016
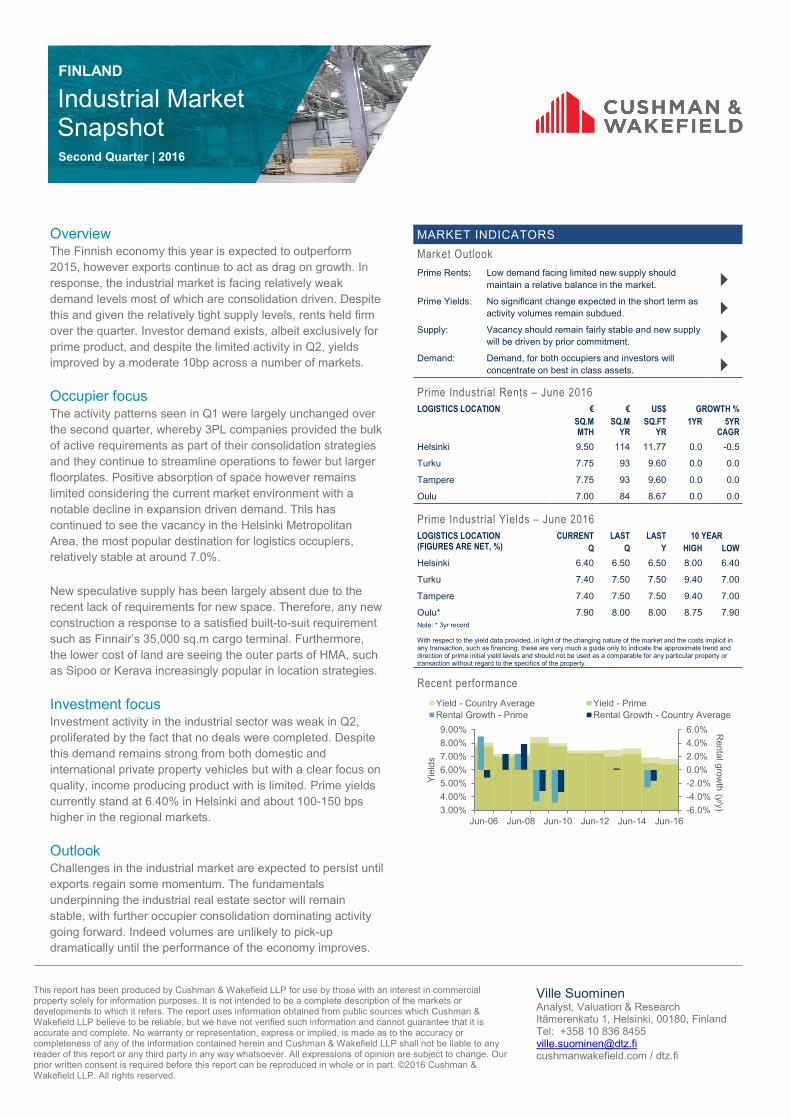
Overview The Finnish economy this year is expected to outperform 2015, however exports continue to act as drag on growth. In response, the industrial market is facing relatively weak demand levels most of which are consolidation driven. Despite this and given the relatively tight supply levels, rents held firm over the quarter. Investor demand exists, albeit exclusively for prime product, and despite the limited activity in Q2, yields improved by a moderate 10bp across a number of markets.
Occupier focus The activity patterns seen in Q1 were largely unchanged over the second quarter, whereby 3PL companies provided the bulk of active requirements as part of their consolidation strategies and they continue to streamline operations to fewer but larger floorplates. Positive absorption of space however remains limited considering the current market environment with a notable decline in expansion driven demand. This has continued to see the vacancy in the Helsinki Metropolitan Area, the most popular destination for logistics occupiers, relatively stable at around 7.0%.
New speculative supply has been largely absent due to the recent lack of requirements for new space. Therefore, any new construction a response to a satisfied built-to-suit requirement such as Finnair’s 35,000 sq.m cargo terminal. Furthermore, the lower cost of land are seeing the outer parts of HMA, such as Sipoo or Kerava increasingly popular in location strategies.
Investment focus Investment activity in the industrial sector was weak in Q2, proliferated by the fact that no deals were completed. Despite this demand remains strong from both domestic and international private property vehicles but with a clear focus on quality, income producing product with is limited. Prime yields currently stand at 6.40% in Helsinki and about 100-150 bps higher in the regional markets.
Outlook Challenges in the industrial market are expected to persist until exports regain some momentum. The fundamentals underpinning the industrial real estate sector will remain stable, with further occupier consolidation dominating activity going forward. Indeed volumes are unlikely to pick-up dramatically until the performance of the economy improves.
MARKET INDICATORS Market Outlook Prime Rents: Low demand facing limited new supply should
maintain a relative balance in the market.
Prime Yields: No significant change expected in the short term as activity volumes remain subdued.
Supply: Vacancy should remain fairly stable and new supply will be driven by prior commitment.
Demand: Demand, for both occupiers and investors will concentrate on best in class assets.
Prime Industrial Rents – June 2016 LOGISTICS LOCATION € € US$ GROWTH %
SQ.M MTH
SQ.M YR
SQ.FT YR
1YR 5YR CAGR
Helsinki 9.50 114 11.77 0.0 -0.5
Turku 7.75 93 9.60 0.0 0.0
Tampere 7.75 93 9.60 0.0 0.0
Oulu 7.00 84 8.67 0.0 0.0
Prime Industrial Yields – June 2016 LOGISTICS LOCATION (FIGURES ARE NET, %)
CURRENT LAST LAST 10 YEAR Q Q Y HIGH LOW
Helsinki 6.40 6.50 6.50 8.00 6.40
Turku 7.40 7.50 7.50 9.40 7.00
Tampere 7.40 7.50 7.50 9.40 7.00
Oulu* 7.90 8.00 8.00 8.75 7.90 Note: * 3yr record With respect to the yield data provided, in light of the changing nature of the market and the costs implicit in any transaction, such as financing, these are very much a guide only to indicate the approximate trend and direction of prime initial yield levels and should not be used as a comparable for any particular property or transaction without regard to the specifics of the property.
Recent performance
-6.0%-4.0%-2.0%0.0%2.0%4.0%6.0%
3.00%4.00%5.00%6.00%7.00%8.00%9.00%
Jun-06 Jun-08 Jun-10 Jun-12 Jun-14 Jun-16
Rental grow
th (y/y)
Yiel
ds
Yield - Country Average Yield - PrimeRental Growth - Prime Rental Growth - Country Average

Our Research Services
Cushman & Wakefield is known the world over as an industry knowledge leader. Through the delivery of timely, accurate, high-quality research reports on the leading trends, markets around the world and business issues of the day, we aim to assist our clients in making property decisions that meet their objectives and enhance their competitive position. In addition to producing regular reports such as global rankings and local quarterly updates available on a regular basis, Cushman & Wakefield also provides customised studies to meet specific information needs of owners, occupiers and investors.
Accessing Cushman & Wakefield Research To access our industry-recognized research, please visit:
cushmanwakefield.com
Visit our website to access...
...Global Research Reports To learn more about the global trends in the commercial real estate sectors that are shaping economic development, business practices and real estate strategies.
...Local Market Reports To find out about local real estate trends in the office, industrial and retail sectors in markets around the world
...White Papers and Strategic Insights For authoritative and insightful commentary and analysis on the business landscape for commercial property markets
...Economic Reports To keep you updated on global economic events and emerging trends that will influence finance, investment, business and real estate markets
...Cushman & Wakefield global real estate blogs To hear our point of view on global market trends and how they are impacting on real estate decision making
Ville Suominen Analyst, Valuation & Research Finland +358 10 836 8455 [email protected]
István Tóth Senior Research Analyst EMEA Research +36 (06) 1 484 1302 [email protected]
Disclaimer
This report has been produced by Cushman & Wakefield LLP, with data and market intelligence contributed by DTZ Finland, the Alliance Partner of legacy Cushman & Wakefield in Finland, for use by those with an interest in commercial property solely for information purposes and should not be relied upon as a basis for entering into transactions without seeking specific, qualified professional advice. It is not intended to be a complete description of the markets or developments to which it refers. This report uses information obtained from public sources that Cushman & Wakefield has rigorously checked and believes to be reliable, but Cushman & Wakefield has not verified such information and cannot guarantee that it is accurate or complete. No warranty or representation, express or implied, is made as to the accuracy or completeness of any of the information contained in this report and Cushman & Wakefield shall not be liable to any reader of this report or any third party in any way whatsoever. All expressions of opinion are subject to change. The prior written consent of Cushman & Wakefield is required before this report or any information contained in it can be reproduced in whole or in part, and any such reproduction should be credited to Cushman & Wakefield. ©2016 Cushman & Wakefield LLP. All rights reserved.
To see a full list of all our publications, please go to cushmanwakefield.com or download the My C&W Research App
For more information, please contact our Research Department: Cushman & Wakefield LLP 125 Old Broad Street, London, EC2N 1AR, UK
www.cushmanwakefield.com