Embed Size (px)
Citation preview

JOURNAL OF GEOPHYSICAL RESEARCH, VOL. 91, NO. B3, PAGES 3664-3676, MARCH 10, 1986
Finite Strain Calculations of Continental Deformation
2. Comparison With the India-Asia Collision Zone
PHILIP ENGLAND
Department of Geological Sciences, Harvard University, Cambridge, Massachusetts
GREGORY HOUSEMAN
Research School of Earth Sciences, Australian National University, Canberra
Numerical experiments on a thin viscous sheet model for deformation of continental lithosphere subjected to an indenting boundary condition yield distributions of crustal thickness, of stress and strain rate, and of latitudinal displacements that may be compared with observations in the India-Asia collision zone. A simple indenting boundary condition applied to initially laterally homogeneous sheets obeying a power law rheology produces results that are in broad agreement with the observations, provided that the power law exponent is three or greater and the sheet can support vertically integrated stress differ- ences of 2 x 10¹³ (-t-5 X 10¹²) N m -• in regions in front of the indenter. Under these conditions, the calculated deformation shows accommodation of convergence primarily by crustal thickening, to pro- duce a plateau in front of the indenter. Palaeomagnetic data from India and Tibet, and the observed distribution of topography, suggest that much of the post-Eocene convergence of India with Asia has been taken up by deformation within Asia that involved crustal thickening. The principal difference between calculation and observation is the absence from the calculated strain rate fields of east-west
extension of the plateau in front of the indenting boundary. The calculations show that once such a plateau is formed, the buoyancy force associated with the crustal thickness contrast inhibits further thickening and the plateau strains at less than half the rate of its immediate surroundings. Seismically determined regional strain rates exhibit a similar distribution, with the Tibetan plateau straining at about one quarter the rate of the Tien Shan and Ningxia-Gansu regions. Calculated principal compressive stress orientations and regional strain rates agree with the seismically determined quantities in the Mongolia-Baikal, Tien Shan, Tibet, and Ningxia-Gansu regions of Asia, to within the uncertainty of the latter. The vertically integrated stresses that are calculated for the viscous sheet are comparable with those that can be supported by a rheologically stratified continental lithosphere obeying laboratory- determined flow laws. We suggest that the thin viscous sheet model, described in this paper and its companion, gives a simple and physically plausible description of the observed deformation in central Asia; in this description the predominant mechanism of accommodation of continental convergence is diffuse crustal thickening, with shear on vertical planes playing a subsidiary role once large crustal thickness contrasts have been established.
1. INTRODUCTION
The collision of India with Asia probably occurred during the major decrease in India's northward velocity in the Eocene, and since then, India has moved approximately northward by between 1800 and 2500 km [McKenzie and Sclater, 1971; Molnar and Tapponnier, 1975]. Although some of this convergence has undoubtedly been taken up by defor- mation of the northern margin of the Indian plate (see, for example, Gansser [1966] and summary by Lyon-Caen and Molnar [1983]), most estimates of this deformation leave over 1500 km of convergence to be accounted for; the difference has usually been explained in one of two ways: thrusting of the Indian continental lithosphere beneath Asia or defor- mation within Asia.
Underthrusting of India was suggested by Argand [1924] and has been advocated more recently by Powell and Cona- ghan [1973] and Barazangi and Ni [1982]. In contrast, several authors have proposed that diffuse deformation within Asia has been the primary means of accommodating India's north- ward motion [e.g., Dewey and Burke, 1973; Molnar and Tap- ponnier, 1975; England and McKenzie, 1982; Vilotte et al., 1982]. As there is at present no general agreement on the relative importance of the two mechanisms, it is worth sum- marizing the arguments here.
Copyright 1986 by the American Geophysical Union.
Paper number 5B5548. 0148-0227/86/005 B- 5548505.00
3664
Much of the seismic evidence that bears on this question has been discussed by Molnar [1984]. There is clear evidence for underthrusting of India beneath the Himalaya at present [e.g., Ni and Barazangi, 1984; Baranowski et al., 1984], but this seismicity extends less than 150 km north from the Hima- layan front. To the north of the High Himalaya the seismicity is diffuse, and in the Tibetan plateau, fault plane solutions of most earthquakes show large components of normal and strike-slip faulting, indicating a combination of east-west ex- tension and north-south shortening of the region [Molnar and Tapponnier, 1975, 1978; Ni and Yorke, 1978; Molnar and Chen, 1983; Molnar and Deng, 1984]. We shall discuss the diffuse seismicity further in section 3, but note here that if a major underthrust does exist beneath the Tibetan plateau, it has no seismic expression.
Barazangi and Ni [1982] argue on the basis of efficient propagation and high velocity of P, and S, across Tibet that the plateau must be underlain by a shieldlike structure, which they infer to be the Indian continental lithosphere, and con- clude that their observations are inconsistent with the forma-
tion of the Tibetan plateau by the diffuse deformation of Asia. This conclusion may be disputed on two grounds. First, re- gardless of how the Tibetan crust has doubled, it seems to have done so in a time that is short compared with the ther- mal time constant of the lithosphere, and we should expect, therefore, that temperatures at the Moho have not been great- ly perturbed from their precollision values; it is not legitimate, then, to argue against diffuse deformation within the Tibetan plateau from the absence of low P, or S, velocities there.
ENGLAND AND HOUSEMAN: FINITE STRAIN CALCULATIONS OF CONTINENTAL DEFORMATION, 2 3665
Second, as Molnar and Chen [1984] argue, even if S n velocities are "shieldlike" beneath much of Tibet, the thickness of the layer in which these velocities occur is unconstrained. Molnar and Chen [1984] interpret $-P residuals obtained from earth- quakes in Tibet as indicating that the mean crust and upper mantle S wave velocity beneath central Tibet is 4-8% lower than beneath the Himalaya.
Palaeomagnetic data strongly support the idea that most of the convergence of India with Asia was accommodated by shortening within Asia. The measured inclinations on the Cre- taceous Takena formation and the Eocene Lingzizong vol- canics of southern Tibet show that the southern margin of Tibet has moved north by around 2000 km since the collision of India with Asia [Zhu et al., 1977; Molnar and Chen, 1978; Achache et al., 1984].
For these reasons, it seems likely that much of the conver- gence between India and Asia is taken up by deformation within Asia rather than at the suture zone [-Molnar and Tap- ponnier, 1975]. The purpose of this paper is to compare the results of numerical experiments on a continuum model (pre- sented by Houseman and England [this issue], hereafter re- ferred to as paper 1) for continental deformation with observa- tions made in the India-Asia collision zone. In this model the
continental lithosphere is treated as a homogeneous viscous layer whose deformation can be calculated by considering the vertical integrals of the stresses acting on it and of its rheology (which is taken to be that of a power law fluid). For a given choice of boundary conditions, the calculated deformation de- pends on two parameters: the dimensionless Argand number Ar, which is a measure of the lithospheric strength, and the power law exponent n of the rheology (see paper 1, section 2). We shall compare the results of calculations using this model with observations in the India-Asia collision zone of topogra- phy, present stress, and strain rate fields and with measures of Tertiary deformation provided by palaeomagnetic data. The comparison provides constraints on the effective values of n and Ar in a collision zone and elucidates the physical mecha- nisms that control the distribution of deformation within Asia.
2. TERTIARY VERTICAL STRAIN OF ASIA
The first quantitative approach to the deformation of Asia in continuum mechanics terms was made by Molnar and Tap- ponnier [1975] and Tapponnier and Molnar [1976-1, who ap- plied the results of slip line theory to the indenting of Asia by India. They were careful to point out the instantaneous and infinitesimal nature of slip line field theory and that their as- sumed plane strain deformation could only be justified in the presence of a vertical load on the lithosphere, which could be provided by variations in crustal thickness, such as the present plateau. Clearly, finite amplitude continental deformation cannot be treated using a plane strain model unless the strike- slip motion is much greater than the vertical strain involved in forming topographic and crustal thickness contrasts. Several interpretations of the integrated history of continental defor- mation have been in terms of purely plane strain finite dis- placements, and Tapponnier et al. [1982] have suggested that convergence of India with Asia has been taken up almost entirely by the lateral motion of portions of Asia on strike-slip faults.
It is our contention, based on the results of calculations using the thin sheet model (England and McKenzie [1983], En•tland et al. [1985], paper 1, section 3, and below) that the large crustal thickness and topographic contrasts in Asia were produced by the collision of India with Asia and that they represent a large fraction of the total strain. The distinction
between predominantly plane strain and three-dimensional deformation is an important one, which determines not only the configuration of deformation but also its dynamics [En- gland and McKenzie, 1982; paper 1].
In order to assess the importance of crustal thickening in the Cenozoic convergence of India with Asia, we make a simple mass balance calculation. Following Cochran [1982], we require any column of continental lithosphere to be in isostatic balance with a reference mid-ocean ridge column, consisting of a thickness hw of seawater, density Pw, and a thickness of ht, of crust, density pt,, which are underlain by asthenosphere of density Pa' A column of continental litho- sphere of thickness L, crustal thickness S, average crustal den- sity Pc, and average mantle density p,, has an elevation e, given by
e = 1/Pa[S(p c -- Pro)- L(Pm -- Pa)- hw(Pa -- Pw)- ht,(Pa -- Pt,)]
(1)
We assume that before the collision of India with Asia, the
presently elevated region of Asia was at an average elevation eo, whose value we allow to vary between 0 and 500 m above sea level, and that changes in elevation have been generated by isostatically compensated crustal thickness changes within a constant thickness lithosphere.
Consider a region originally of area Ao, but now of area A, as a result of deformation during the India-Asia collision. If volume is conserved,
(e - eo) dA - So •a 1- (Ao - (2)
where So is the crustal thickness corresponding to elevation eo. If the area of Asia has been reduced by an amount of con-
vergence C between India and Asia along a front of width W,
cw = (A - Ao)
A
- - (3)
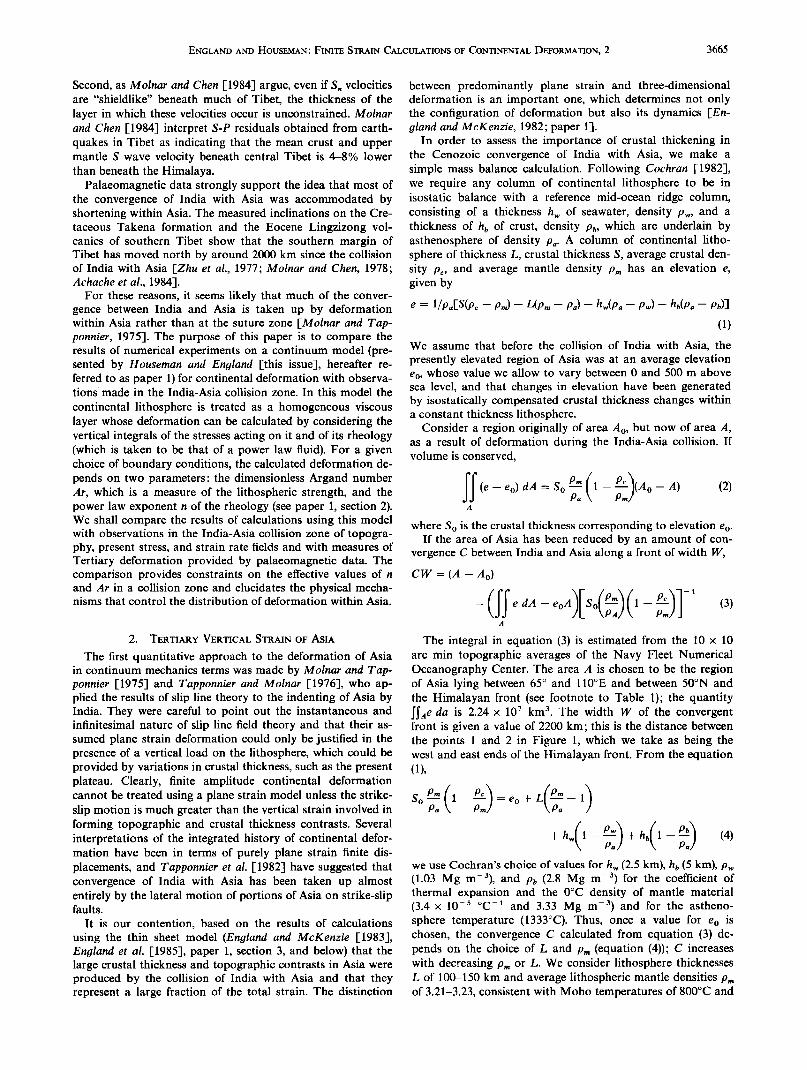
The integral in equation (3) is estimated from the 10 x 10 arc min topographic averages of the Navy Fleet Numerical Oceanography Center. The area A is chosen to be the region of Asia lying between 65 ø and 110øE and between 50øN and the Himalayan front (see footnote to Table 1); the quantity •Ae da is 2.24 x 10⁷ km 3. The width W of the convergent front is given a value of 2200 km; this is the distance between the points 1 and 2 in Figure 1, which we take as being the west and east ends of the Himalayan front. From the equation (1),
eo + L( pro-- 1) + hw(1- •-•a•)+ ht,(1--•aa)
So •aa 1-- =
(4)
we use Cochran's choice of values for hw (2.5 km), ht, (5 km), Pw (1.03 Mg m-3), and pt, (2.8 Mg m -3) for the coefficient of thermal expansion and the 0øC density of mantle material (3.4 x 10 -5 øC-• and 3.33 Mg m -3) and for the astheno- sphere temperature (1333øC). Thus, once a value for e0 is chosen, the convergence C calculated from equation (3) de- pends on the choice of L and Pm (equation (4)); C increases with decreasing Pm or L. We consider lithosphere thicknesses L of 100-150 km and average lithospheric mantle densities of 3.21-3.23, consistent with Moho temperatures of 800øC and

3666 ENGLAND AND HOUSEMAN: FINITE STRAIN CALCULATIONS OF CONTINENTAL DEFORMATION, 2
TABLE 1. Convergence Calculated From Area Integral of Elevation in Asia
; e dA -- eoA , eo, C, C + C1, m A km 3 km km
0 2.24 x 10 ? 3100-2100 3300-2300 100 2.14 x 10⁷ 2900-2000 3100-2200 300 1.95 x 10 ? 2500-1700 2700-1900 500 1.78 x 10⁷ 2200-1500 2400-1700
See text for symbols. The integral IIA e dA is evaluated for the region, A, bounded by the lines 65øE, 50øN, 110øE, and (30øN from 65 ø to 85øE, 28øN from 80øE to 95øE, and 25øN from 95 ø to 110øE). The higher and lower values of calculated convergence correspond to the combinations (L- 100 km; Pm= 3.21 Mg m -3) and (L- 150 km; pm- 3.23 Mg m-3), respectively.
400øC, respectively. Table 1 shows the range of calculated convergence for different values of e0. These calculations give an estimate of 3100-2100 km for the amount of convergence between India and Asia along the Himalayan front if the orig- inal elevation were zero. This figure reduces to 2200-1500 km for an original elevation of 500 m.
The above estimates ignore material that has been eroded from Asia since the collision; a conservative estimate of the volume of this material may be obtained by taking double the volume of about 107 km 3 of Neogene sediment in the Bengal fan [Curray and Moore, 1971]. The additional convergence implied is
2 x 10⁷ P.•s km (5) C1 -- W'So Pm where Ps is the sediment density. For Pc = 2.8 Mg m-3 [Coch- ran, 1982] (see above) and Ps = 2.2 Mg m -3 [Curray and
Moore, 1971] the estimates of convergence in Table 1 are increased by approximately 200 km, to 3300-2300 km for e0 = 0 and to 2400-1700 km for e0 = 500 m.
The estimate of 1700-3300 km for the convergence that is accommodated by crustal thickening in Asia should be com- pared with the estimate of about 1800-2500 km of conver- gence since the major decrease in India's northward velocity [McKenzie and Sclater, 1971; Molnar and Tapponnier, 1975; Molnar et al., 1981] and with the estimates based on palaeo- magnetic data [Zhu et al., 1977; Molnar and Chen, 1978; Achache et al., 1984] that there has been around 2000 km of shortening north of the Tsangpo suture zone since the early Tertiary. Note that the latter figure does not include 300-500 km of underthrusting at the Tsangpo suture zone and south of it [Gansser, 1966; Lyon-Caen and Molnar, 1983].
The greatest source of uncertainty in this calculation lies in estimating the lithospheric thickness in Asia; interpretations of surface wave dispersion across Tibet [Romanowicz, 1982; Jobert et al., 1985] suggest that the top of the low-velocity zone is at a depth of around 100 km, but the relation of this observation to the isostatic calculation is uncertain. Note that we have assumed that the lithosphere has the same thickness before and after crustal thickening. If we had assumed that the lithosphere thickened along with the crust, we should have estimated greater convergence from the same elevation distri- bution; equally, if the lithosphere thinned during crustal thick- ening, less convergence would be calculated.
The calculation above suggests that most of the conver- gence has been absorbed by crustal thickening and that there is little convergence that still needs to be accounted for by the plain strain mechanisms advocated, for example, by Tappon- nier et al. [1982]; the results of this calculation are certainly inconsistent with the hypothesis that horizontal plane strain
TARIM
UASIN
A
D 40 ø N
/V FRON
80 • E I00 ø E
Fig. 1. Sketch of regions referred to in the text. The 2000- and 4000-m contours are marked, and the areas above 4000 m are stippled. Points marked "1" and "2" are referred to in section 2, and the six areas whose seismically determined strain rates [-Molnar and Deng, 1984] are discussed in section 3.3 are shown by thick lines and the letters A-F: A, Mongolia-Baikal; B, Tien Shan; C, Tibetan Plateau; D, Ningxia-Gansu; E, Xianshuihe and western Sichuan; F, Yunnan.
ENGLAND AND HOUSEMAN: FINITE STRAIN CALCULATIONS OF CONTINENTAL DEFORMATION, 2 3667
has been the dominant means of accommodating convergence between India and Asia in the last 40-50 m.y.
3. COMPARISONS OF RESULTS OF THIN SHEET CALCULATIONS
WITH OBSERVATIONS IN ASIA
Below we compare the results of calculations using the model discussed in paper 1 with the principal observables that relate to the strain history of the India-Asia collision zone. These are the crustal thickness distribution, the seismically estimated stress and strain rate fields, and the latitudinal dis- placements inferred from palaeomagnetic data. The original shape of and the boundary conditions on the thin sheet that we have used are shown in Figure lb of paper 1. The calcula- tions discussed in this paper do not address the rheology of the indenter, and in comparing the calculations with the ob- servations in Asia, no distinction has been made between the mechanical properties of material of the Indian plate that has deformed since the collision and material north of the Indus-
Tsangpo suture zone. Except where indicated, we use the di- mensional constants given in Table 1 of paper 1 and choose the axis of symmetry in our calculations to be coincident with a line running N20øE through the middle of the Himalaya, at about 85øE.
3.1. Crustal Thickness and Surface Elevation
The calculated crustal thickness distribution after a given amount of convergence is governed by the stress-strain rate exponent n and by the Argand number of the sheet (see paper 1, Figure 4)-
Estimates of crustal thickness in Tibet have been made by Chen and Molnar [1981] using surface wave dispersion and the travel times of Pn and Sn phases, by Romanowicz [1982] and Joberr et al. [1985] using surface waves and by Hirn et al. [1984a, b] using wide-angle reflection profiling in the Lhasa block. The estimates of average crustal thickness of the pla- teau lie in the range 65-75 km, and Chen and Molnar [1981] consider that 80 km is an upper limit.
Several of the calculations yield plateau crustal thicknesses that are within the range of 60-80 km (Table 2), the maximum plateau crustal thickness being 74 km for n--10, Ar--1. Note, however, that greater plateau thicknesses are calculated for more convergence than the 2000 km (40 Ma) used in Table
TABLE 2. Calculated Plateau Crustal Thickness and Driving Forces
Plateau Crustal f Thickness, km (al -- {73) dz, Argand
n Number Axis Average Pc/Pm 10 •2 N m -•
3 0 64 64 0.81 ... 3 1 59 59 0.78 24.8 5 1 66 67 0.83 33.2 5 2 62 62 0.80 17.8
5 3 59 60 0.78 12.6 10 1 74 74 0.86 38.8 10 2 67 67 0.83 22.4 10 3 63 64 0.81 16.4
Plateau crustal thickness: "Axis" gives maximum crustal thickness on the y axes after 40 m.y. "Average" is average crustal thickness within region C (see section 3.3). Vertical integral of (a• -- a3) is evalu- ated at the center of the indenter boundary. Dimensional stresses are calculated from the model parameters of paper 1, Table 1, except that Pc/Pm is chosen so that the average plateau crustal thickness corre- sponds to a surface elevation of 5.4 km. Dimensional stresses are undefined for zero Argand number (see paper 1, section 2) (also see England and McKenzie [1982, p. 301]).
2 or for a greater initial crustal thickness than the 35 km used in the calculations.
Crustal thickness is related to surface elevation by equation (1), so the above seismic observations can be used to estimate the average crustal density of the plateau. The average eleva- tion of land within the 5-km contour in Asia is 5.4 km (Navy Fleet Numerical Oceanography Center)' if we assume that crustal thicknesses in this area fall within the range quoted above (65-80 km) and assume also that crust whose elevation is zero is between 30 and 35 km thick, then the range of crustal density for Pm= 3.27 Mg m-3 is 2.70-2.93 Mg m-3 (the lower limit being for S - So = 30 km, and the upper limit for S- So = 50 km).
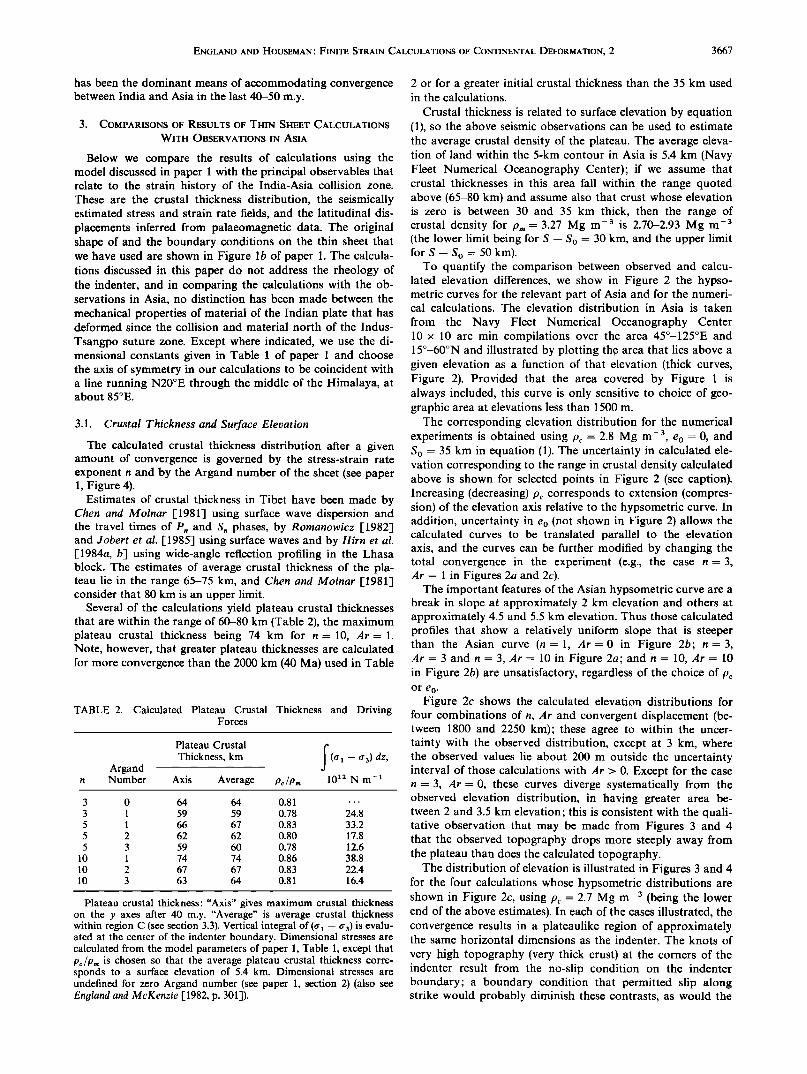
To quantify the comparison between observed and calcu- lated elevation differences, we show in Figure 2 the hypso- metric curves for the relevant part of Asia and for the numeri- cal calculations. The elevation distribution in Asia is taken
from the Navy Fleet Numerical Oceanography Center 10 x 10 arc min compilations over the area 45ø-125øE and 15ø-60øN and illustrated by plotting the area that lies above a given elevation as a function of that elevation (thick curves, Figure 2). Provided that the area covered by Figure 1 is always included, this curve is only sensitive to choice of geo- graphic area at elevations less than 1500 m.
The corresponding elevation distribution for the numerical experiments is obtained using Pc = 2.8 Mg m-3, eo = 0, and So = 35 km in equation (1). The uncertainty in calculated ele- vation corresponding to the range in crustal density calculated above is shown for selected points in Figure 2 (see caption). Increasing (decreasing) Pc corresponds to extension (compres- sion) of the elevation axis relative to the hypsometric curve. In addition, uncertainty in eo (not shown in Figure 2) allows the calculated curves to be translated parallel to the elevation axis, and the curves can be further modified by changing the total convergence in the experiment (e.g., the case n = 3, Ar = 1 in Figures 2a and 2c).
The important features of the Asian hypsometric curve are a break in slope at approximately 2 km elevation and others at approximately 4.5 and 5.5 km elevation. Thus those calculated profiles that show a relatively uniform slope that is steeper than the Asian curve (n= 1, Ar=O in Figure 2b' n=3, Ar = 3 and n = 3, Ar = 10 in Figure 2a; and n = 10, Ar = 10 in Figure 2b) are unsatisfactory, regardless of the choice of Pc or eo.
Figure 2c shows the calculated elevation distributions for four combinations of n, Ar and convergent displacement (be- tween 1800 and 2250 km)' these agree to within the uncer- tainty with the observed distribution, except at 3 km, where the observed values lie about 200 m outside the uncertainty interval of those calculations with Ar > 0. Except for the case n = 3, Ar- 0, these curves diverge systematically from the observed elevation distribution, in having greater area be- tween 2 and 3.5 km elevation-this is consistent with the quali- tative observation that may be made from Figures 3 and 4 that the observed topography drops more steeply away from the plateau than does the calculated topography.
The distribution of elevation is illustrated in Figures 3 and 4 for the four calculations whose hypsometric distributions are shown in Figure 2c, using Pc - 2.7 Mg m -3 (being the lower end of the above estimates). In each of the cases illustrated, the convergence results in a plateaulike region of approximately the same horizontal dimensions as the indenter. The knots of
very high topography (very thick crust) at the corners of the indenter result from the no-slip condition on the indenter boundary' a boundary condition that permitted slip along strike would probably diminish these contrasts, as would the
3668 ENGLAND AND HOUSEMAN' FINITE STRAIN CALCULATIONS OF CONTINENTAL DEFORMATION, 2
action of erosion in nature. The calculated plateau elevation outside these knots is above 5 km for the cases (n = 3, Ar = 0; n= 10, Ar=2) and above 4 km in the other two cases; choosing a value of 2.9 Mg m -3 for pc would reduce these elevations to 4 and 3 km, respectively. Table 2 indicates the values of Pc/Pro that would be required to yield average pla- teau elevations of 5.4 km for different combinations of n and Ar discussed in this paper.
England and Houseman •1985] show that lateral heteroge- neities in the lithosphere can influence the length scale of the deformation as profoundly as do differences in the value of n; the Tarim Basin may reflect an anomalously strong region in the India-Asia collision zone •e.g., Molnar and Tapponnier, 1981], and thin sheet calculations that contain such a hetero- geneity show much steeper slopes where the plateau abuts the strong region than do the calculations reported here •see Vil- otte et al., 1984; England and Houseman, 1985]. In view of these considerations, we regard any effective power law ex- ponent n between 3 and 10 (and possibly greater than 10) as consistent with the observations.
Although the comparison of Figure 2 seems to rule out values of Ar greater than about 1 for n = 3, or 3 for n = 10, numerical experiments that include a strength heterogeneity representing the Tarim Basin [Vilotte et al., 1984; England and Houseman, 1985] may allow these limits on Ar to be increased by a factor of approximately 3. In the next section we use the four calculations of Figure 2c to investigate the influence of varying n in comparisons between calculated and observed stress and strain rate fields.
3.2. Stress Orientation and Fault Plane Solutions
Molnar et al. [1973], in a study of the focal mechanisms of large earthquakes in Asia, noted that the P axes of these events were aligned between N-S and NE-SW. Although the viscous sheet model does not contain discontinuities, it is pos- sible to compare the stress fields calculated from it with the seismic observations, if it is assumed that the brittle layer of the lithosphere accommodates the same strain rate field as its viscous substrate (paper 1, section 3.3 and Appendix A).
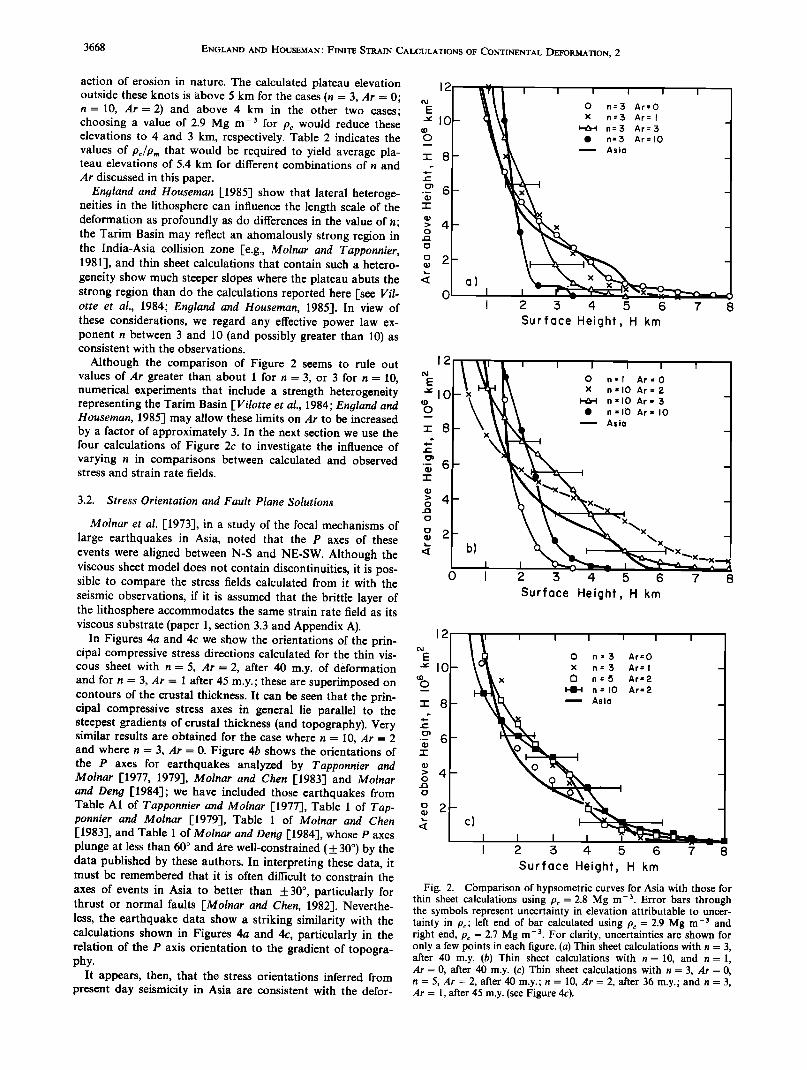
In Figures 4a and 4c we show the orientations of the prin- cipal compressive stress directions calculated for the thin vis- cous sheet with n = 5, Ar = 2, after 40 m.y. of deformation and for n -- 3, Ar = 1 after 45 m.y.' these are superimposed on contours of the crustal thickness. It can be seen that the prin- cipal compressive stress axes in general lie parallel to the steepest gradients of crustal thickness (and topography). Very similar results are obtained for the case where n = 10, Ar = 2 and where n - 3, Ar = 0. Figure 4b shows the orientations of the P axes for earthquakes analyzed by Tapponnier and Molnar [1977, 1979], Molnar and Chen [1983] and Molnar and Deng [1984]' we have included those earthquakes from Table A1 of Tapponnier and Molnar [1977], Table 1 of Tap- ponnier and Molnar [1979], Table 1 of Molnar and Chen [1983], and Table 1 of Molnar and Deng [1984], whose P axes plunge at less than 60 ø and are well-constrained (_+ 30 ø) by the data published by these authors. In interpreting these data, it must be remembered that it is often difficult to constrain the axes of events in Asia to better than _+ 30 ø, particularly for thrust or normal faults [Molnar and Chen, 1982]. Neverthe- less, the earthquake data show a striking similarity with the calculations shown in Figures 4a and 4c, particularly in the relation of the P axis orientation to the gradient of topogra- phy.
It appears, then, that the stress orientations inferred from present day seismicity in Asia are consistent with the defor-
12
o
(D
0 I
I I I
O n:3 Ar=O x n=3 Ar= I
• n=3 Ar=3
ß n=3 Ar=10
• Asio
x xj I .
2 3 4 5 6 7 8 Surfoce Height, H km
k ' ' ' ' ' ' I I • .•. • o n:l Ar=O I
"IOI- h. " •x x n=10 Ar= 2 q [ • •• • n=10 At= 3 I k • •' ' n=10 Ar=10 /
• b) X•x x 0 I 2 3 4 5 6 7 8
Surfcce Height, H km
(D
o
12 i i i • i i
I0
c)
O n = 3 Ar=O
x n = 3 Ar= I
F1 n = 5 Ar= 2
• n = I0 Ar=2
• Asio
I I I
I 2 3 4 5 6 7 8
Surfoce Height, H km
Fig. 2. Comparison of hypsometric curves for Asia with those for thin sheet calculations using Pc = 2.8 Mg m -3. Error bars through the symbols represent uncertainty in elevation attributable to uncer- tainty in Pc; left end of bar calculated using Pc- 2.9 Mg m -s and right end, Pc = 2.7 Mg m -s. For clarity, uncertainties are shown for only a few points in each figure. (a) Thin sheet calculations with n - 3, after 40 m.y. (b) Thin sheet calculations with n- 10, and n- 1, Ar = 0, after 40 m.y. (c) Thin sheet calculations with n = 3, Ar = O, n = 5, Ar - 2, after 40 m.y.; n - 10, Ar = 2, after 36 m.y.; and n = 3, Ar = 1, after 45 m.y. (see Figure 4c).

ENGLAND AND HOUSEMAN: FINITE STRAIN CALCULATIONS OF CONTINENTAL DEFORMATION, 2 3669
b
Fig. 3. Distributions of elevation calculated from the thin sheet model and observed in Asia. Contours of elevation are at 1 km. Observations in Asia are from Navy Fleet Numerical Oceanography Center, smoothed with a Gaussian filter of width 1 ø. Calculated crustal thicknesses are converted to elevation using equation (1) with e0 = 0, So = 35 km, and Pc = 2.7 Mg m -3, Pm= 3.27 Mg m -3. (a) Elevations calculated for thin sheet with n = 10, Ar = 2 after 36 m.y. of convergence. (b) Elevations in Asia. (c) Elevations calculated for thin sheet with n = 3, Ar = 0 after 40 m.y. of convergence.
mation of a continuous sheet whose tectonics are governed by an indenting boundary condition similar to that assumed here.
3.3. Present-Day Rates
We can continue the line of argument of the previous sec- tion to compare the calculated strain rate fields with the ob- served distribution of strain rate in Asia. Molnar and Deng
[1984] summed the moment tensors for this century's large earthquakes in nine regions of Asia and calculated the strain rate tensor for each region. We consider six of their regions, which are outlined in Figure 1. The only region of major activity (strain rates greater than 0.5% m.y.-x) not considered is their region H (Himalaya); this region has no counterpart in
the calculations discussed in this paper. Areas in the calcula- tions that correspond to the areas in Asia considered by Molnar and Deng were determined by overlaying the finite element grid for each calculation on an appropriately scaled map (see geographical and model coordinates in Figures 3 and 4).
For comparison with the finite element calculations the strain rate tensors given by Molnar and Deng [1984] are re- solved into symmetric and antisymmetric components. Table 3 lists the azimuths of the horizontal projection of the prin- cipal compressive strain rate axis, the values of the second invariant of the symmetrical component of the strain rate tensor for each region and the equivalent quantities from the
3670 ENGLAND AND HOUSEMAN: FINITE STRAIN CALCULATIONS OF CONTINENTAL DEFORMATION, 2
Fig. 4. Comparison of the trends of P axes determined for earthquakes in Asia (see text) with the orientations of the principal stress directions in thin sheet calculations. (a) Contours of elevation at 1-km intervals (thin lines) and orientations of horizontal principal stresses (crosses) for a thin sheet calculation with n = 5, Ar = 2 after 40 m.y. of convergence. Thick arms to crosses indicate compressional deviatoric stress; thinner arms indicate extensional deviatoric stress. (b) Horizontal projections of P axes of large earthquakes in Asia (thick lines, see text) and contours of elevation at 1-km intervals (thin lines) (see Figure 3b). (c) Same as Figure 4a except for calculation with n = 3, Ar = 1 after 45 m.y. (2250 km) of convergence.
four finite element calculations of Figure 2c (n = 3, Ar = 0, 1; n= 5, Ar= 2; n= 10, Ar=2).
The orientations of the calculated and observed principal compressive strain rate axes agree to within 22 ø for regions A, B, and C and to within 35 ø for regions D and E, while the observed variations from region B to region E is nearly 100 ø. The exception is region F (Yunnan): here calculated principal compressive and extensional stress directions are approxi- mately at right angles to those inferred by Molnar and Deng, who express strong reservations about the extent to which the historical seismic data reflect the long-term strain in this region. In view of this uncertainty and of the fact that calcu-
lated deformation in regions E and F is very sensitive to the boundary conditions that we use at the corners and along the sides of the indenter, which may not be appropriate for re- gions E and F, we consider only areas A-D for the rest of this dicussion.
The magnitudes of the observed strain rates (expressed in Table 3 by the second invariant of the symmetrical strain rate tensor; see paper 1, equation (5)) vary by a factor of 4.5, with a pattern of low strain rates within the plateau (region C), strain rates about 4 times higher in regions bordering the plateau (B, Tien Shan; D, Ningxia-Gansu), and lower strain rates to the north and east in the Mongolia-Baikal region (A).
ENGLAND AND HOUSEMAN: FINITE STRAIN CALCULATIONS OF CONTINENTAL DEFORMATION, 2 3671
TABLE 3. Comparison Between Seismically Determined Strain Rates in Asia and Strain Rates From Thin Sheet Calculations
Region A Region B Region C Region D Region E Region F
P Axis /• P Axis /• P Axis /• P Axis /• P Axis /• T Axis
Molnar and 40 ø 1.25 349 ø 3.0 359 ø 0.7 66 ø 3.2 86 ø 1.2 84 ø 0.5 Den•] [ 1984]
Thin sheet, 23 ø 1.0 356 ø 3.4 21 ø 1.3 35 ø 2.9 55 ø 3.2 155 ø 1.6 n-- 10, Ar=2
Thin sheet, 24 ø 1.6 6 ø 2.6 20 ø 1.4 34 ø 2.3 58 ø 2.6 159 ø 1.2 n=5, Ar=2
Thin sheet, 26 ø 1.6 3 ø 2.6 20 ø 1.6 31 ø 2.5 58 ø 2.1 157 ø 1.1 n=3, Ar=l
Thin sheet, 25 ø 1.0 0 ø 1.7 21 ø 2.4 32 ø 2.2 53 ø 2.3 155 ø 1.2 n=3, Ar--O
Trends of P axes (plunges are less than 5 ø) calculated from symmetrical portions of observed regional moment tensors [Molnar and Deng, 1984] and from the average strain rate tensor of comparable regions in the calculations (plunges are zero); in the latter case the y axis is assumed to point N20øE. For reg!on F the T axes are compared, as observed P axis is near vertical. Second invariant of strain rate E is calculated from strain rate tensors given by Molnar and Deng [1984] or from regionally averaged ones in thin sheet calculations; units are percent per million years or 3.17 x 10- • 6 s- •
It is notoriously difficult to relate short-term seismic defor- mation to deformation over geological timespans, and Molnar and Deng caution that there is an uncertainty of a factor of 2 in their estimates based on 80 years of data; thus given the uncertainties, the long-term strain rates in regions A-D might all be the same. Nevertheless the present distribution of seis- mic deformation in Central Asia is consistent with that of the calculations. In the calculations, the build up of the crustal thickness in front of the indenting boundary causes the region of most intense deformation to migrate away from this bound- ary (see paper 1). After 40 m.y. of convergence, the most in- tense deformation in all the cases described here, except for n - 3, Ar = 0, is in an arcuate region that encircles the plateau and corresponds to regions B and D in Figure 1.
The calculated strain rates in regions A, B, and D agree with the observed ones to within 25% for n = 10, Ar - 2 and n -- 5, Ar = 1; to within 30% for n = 3, Ar - 1; and to within 40% for n - 3, Ar- 0. The calculated strain rates in region C (the plateau) are all higher than those observed; for the cases n = 10 and n = 5 the difference is within the uncertainty of a factor of 2 that Molnar and Den•l [1984] attach to their obser- vations, and it is just outside (a factor of 2.5) for the case n- 3, Ar-- 1; however, in each case, the difference between calculation and observation in region C is many times greater than that in the other three regions (A, B, D). For the case n = 3, Ar = 0 the calculated strain rate in region C is 3.4 times that observed and, furthermore, is greater than the strain rate in regions B and C; thus we do not regard the case n--3, Ar = 0 as adequately fitting the observations.
A consistent difference between calculation and observation,
with the exception of region B (Tien Shan), is that the seismic data show a greater contribution to the strain rate tensors from strike-slip motion than do the numerical experiments. This difference is most pronounced in Tibet (region C), where the calculations show predominantly crustal thickening in contrast to the predominantly strike-slip motion with crustal extension shown by the seismic data [Molnar and Den•l, 1984]. We attribute this difference to the no-slip condition that we have applied on the boundary of the indenter. Allowing flow tangential to the boundary may permit east-west extension to occur in the calculations.
As in the case of the crustal thickness distribution (section 3.1), lateral heterogeneities can appreciably affect the strain rate field; in particular, they can lead to stress concentrations
around their edges and to an enhancement of strike-slip over compressional deformation in their vicinities [e.g., Vilotte et al., 1984; England and Houseman, 1985]. It is possible that the inclusion of such features in a model would provide closer agreement between calculation and observation, but we do not feel that proliferation of parameters will, at present, lead to greater understanding.
The slightly closer agreement between the calculated and observed strain rates for the sheet with n = 10, compared with those for n = 3 or 5, appears to favor the higher power law exponent. However, the most rapidly straining regions (Tien Shan and Ningxia-Gansu) each appear to border on tec- tonically stable blocks (the Tarim Basin and the Ordos massif, respectively). Thus n = 3 or 5 may in fact give equally accept- able results in the presence of lateral heterogeneities. However, the comparisons of this section suggest that a sheet with arbi- trarily high strength (Ar -- 0), for which gravity has no influ- ence on the deformation, does not yield present-day strain rate fields that are consistent with observation, even though the distribution of topography may be acceptable (section 3.1). For a sheet in which Ar > 0, gravity acts to inhibit further crustal thickening, once a critical crustal thickness is reached, and to transfer the deformation to the outer edges of the plateau (see Figure 5 of paper 1); this does not occur for Ar = 0 with any value of n used in our calculations (paper 1, Figure 3).
3.4. Palaeoma•lnetic Data
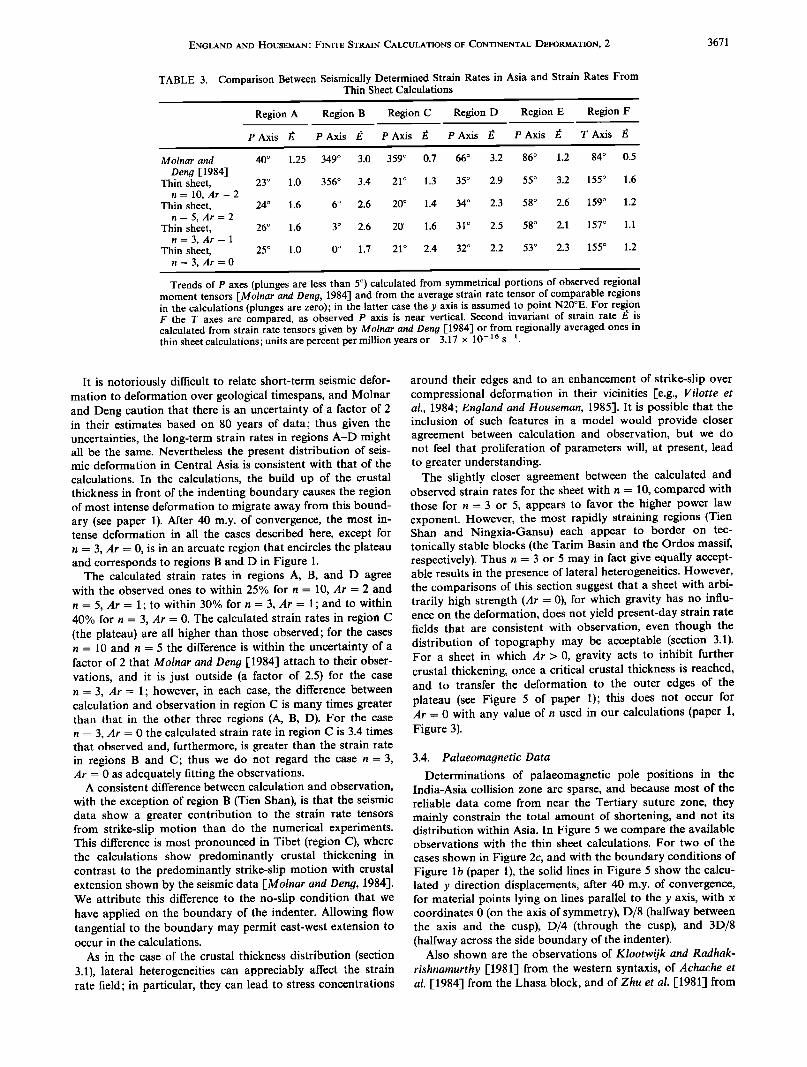
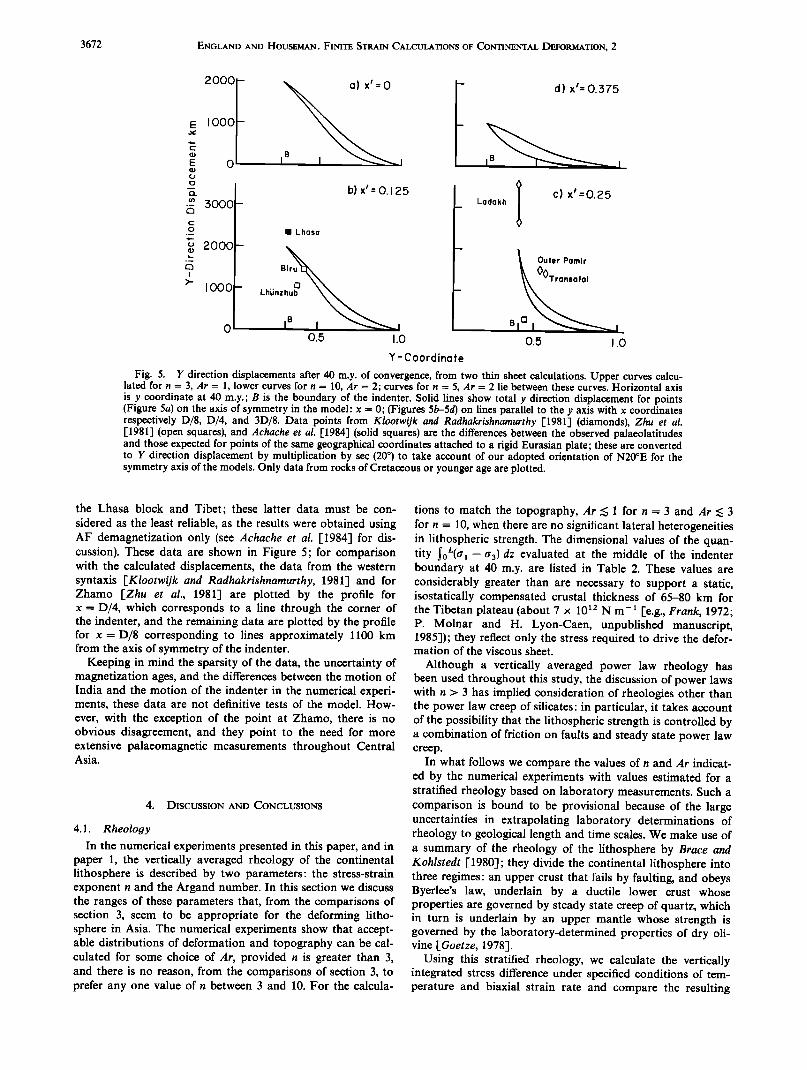
Determinations of palaeomagnetic pole positions in the India-Asia collision zone are sparse, and because most of the reliable data come from near the Tertiary suture zone, they mainly constrain the total amount of shortening, and not its distribution within Asia. In Figure 5 we compare the available observations with the thin sheet calculations. For two of the cases shown in Figure 2c, and with the boundary conditions of Figure lb (paper 1), the solid lines in Figure 5 show the calcu- lated y direction displacements, after 40 m.y. of convergence, for material points lying on lines parallel to the y axis, with x coordinates 0 (on the axis of symmetry), D/8 (halfway between the axis and the cusp), D/4 (through the cusp), and 3D/8 (halfway across the side boundary of the indenter).
Also shown are the observations of Klootwijk and Radhak- rishnamurthy [1981] from the western syntaxis, of Achache et al. [1984] from the Lhasa block, and of Zhu et al. [1981] from
3672 ENGLAND AND HOUSEMAN' FINITE STRAIN CALCULATIONS OF CONTINENTAL DEFORMATION, 2
2000 I • Iøøø I E 0 •
-"'" 3000-
.o_
o 2000-
I000 -
o
a) x t = 0 -
I •
b) xt:O. 125
ß Lhasa
0.,5 1.0
Y-Coordinate
d) x ½-- 0.375
Ladakh I C) X •:0.25 k
•[ Outer Pamlr
BIOI "•----"•--- L 0.5 1.0
Fig. 5. Y direction displacements after 40 m.y. of convergence, from two thin sheet calculations. Upper curves calcu- lated for n -- 3, Ar -- 1, lower curves for n = 10, Ar = 2; curves for n - 5, Ar- 2 lie between these curves. Horizontal axis is y coordinate at 40 m.y.; B is the boundary of the indenter. Solid lines show total y direction displacement for points (Figure 5a) on the axis of symmetry in the model: x - 0; (Figures 5b-5d) on lines parallel to the y axis with x coordinates respectively D/8, D/4, and 3D/8. Data points from Klootwijk and Radhakrishnarnurthy [1981] (diamonds), Zhu et al. [1981] (open squares), and Achache et al. [1984] (solid squares) are the differences between the observed palaeolatitudes and those expected for points of the same geographical coordinates attached to a rigid Eurasian plate; these are converted to Y direction displacement by multiplication by sec (20 ø) to take account of our adopted orientation of N20øE for the symmetry axis of the models. Only data from rocks of Cretaceous or younger age are plotted.
the Lhasa block and Tibet; these latter data must be con- sidered as the least reliable, as the results were obtained using AF demagnetization only (see Achache et al. [1984] for dis- cussion). These data are shown in Figure 5; for comparison with the calculated displacements, the data from the western syntaxis [Klootwijk and Radhakrishnarnurthy, 1981] and for Zhamo [Zhu et al., 1981] are plotted by the profile for x - D/4, which corresponds to a line through the corner of the indenter, and the remaining data are plotted by the profile for x--D/8 corresponding to lines approximately 1100 km from the axis of symmetry of the indenter.
Keeping in mind the sparsity of the data, the uncertainty of magnetization ages, and the differences between the motion of India and the motion of the indenter in the numerical experi- ments, these data are not definitive tests of the model. How-
ever, with the exception of the point at Zhamo, there is no obvious disagreement, and they point to the need for more extensive palaeomagnetic measurements throughout Central Asia.
4. DISCUSSION AND CONCLUSIONS
4.1. Rheology
In the numerical experiments presented in this paper, and in paper 1, the vertically averaged rheology of the continental lithosphere is described by two parameters: the stress-strain exponent n and the Argand number. In this section we discuss the ranges of these parameters that, from the comparisons of section 3, seem to be appropriate for the deforming litho- sphere in Asia. The numerical experiments show that accept- able distributions of deformation and topography can be cal- culated for some choice of At, provided n is greater than 3, and there is no reason, from the comparisons of section 3, to prefer any one value of n between 3 and 10. For the calcula-
tions to match the topography, Ar •< 1 for n = 3 and Ar •< 3 for n = 10, when there are no significant lateral heterogeneities in lithospheric strength. The dimensional values of the quan- tity I0t'(a•- (r3)dz evaluated at the middle of the indenter boundary at 40 m.y. are listed in Table 2. These values are considerably greater than are necessary to support a static, isostatically compensated crustal thickness of 65-80 km for the Tibetan plateau (about 7 x 10 •2 N m-• [e.g., Frank, 1972; P. Molnar and H. Lyon-Caen, unpublished manuscript, 1985]); they reflect only the stress required to drive the defor- mation of the viscous sheet.
Although a vertically averaged power law rheology has been used throughout this study, the discussion of power laws with n > 3 has implied consideration of rheologies other than the power law creep of silicates: in particular, it takes account of the possibility that the lithospheric strength is controlled by a combination of friction on faults and steady state power law creep.
In what follows we compare the values of n and Ar indicat- ed by the numerical experiments with values estimated for a stratified rheology based on laboratory measurements. Such a comparison is bound to be provisional because of the large uncertainties in extrapolating laboratory determinations of rheology to geological length and time scales. We make use of a summary of the rheology of the lithosphere by Brace and Kohlstedt [1980]; they divide the continental lithosphere into three regimes: an upper crust that fails by faulting, and obeys Byerlee's law, underlain by a ductile lower crust whose properties are governed by steady state creep of quartz, which in turn is underlain by an upper mantle whose strength is governed by the laboratory-determined properties of dry oli- vine [Goetze, 1978].
Using this stratified rheology, we calculate the vertically integrated stress difference under specified conditions of tem- perature and biaxial strain rate and compare the resulting

ENGLAND AND HOUSEMAN' FINITE STRAIN CALCULATIONS OF CONTINENTAL DEFORMATION, 2 3673
stress-strain rate relations with the model parameters, Ar and n (paper 1, equations (3) and (6)). For details of this procedure, see Sonder and England [1986].
The calculated strain rate in the region corresponding to the Tibetan plateau is about 3 x 10 -16 s -1 (Table 3), and the deformation is approximately plane strain with y axis com- pression balanced by vertical thickening. The vertically inte- grated stress difference calculated for the three cases that give acceptable fits to the hypsometry and strain rate observations (n=3, Ar= 1;n=5, Ar=2;andn= 10, Ar=2) isbetween 1.5 and 2.5 x 10¹³ N m- 1 (Table 2). We calculate the quantity
F L = (01 -- 15'3) dz (6)
at a strain rate of 3 x 10-•6 s-• for a rheologically stratified lithosphere obeying the deformation laws summarized by Brace and Kohlstedt [1980]. The al and cr 3 are the greatest and least principal stresses; the governing parameters are the Moho temperature T2u, the thermal gradient in the mantle 7, the depth to the brittle-ductile transition ZBD, and the ratio of pore fluid to lithostatic pressure in the crust 2; 2 is assumed to be zero in the mantle.
Molnar and Chen [1983] determined the focal depths of 16 crustal earthquakes in Tibet to be less than 15 km, and we choose a value of 15 km for ZBD and let pore fluid pressure vary from zero (2- 0) to lithostatic pressure (2 = 1); in the latter case there is no contribution to the strength of the litho-
7 E
A
400 500'B • 600 700 a) Moho Temperature oc
13
14
15
16
A
n=17 B
17 12.8 13.2 1:5.6
b) Iog•o (F L N m -• ) 14.0
Fig. 6. (a) Conditions of Moho temperature and sub-Moho ther- mal gradient 7, for which the quantity F L (equation (6)) lies between 25 and 15 x 1012 N m -• at a strain rate of 3 x 10 -•6 s -•. Using Brace and Kohlstedt's [1980] choices of deformation law. Hatched region shows intervals of 3' and T•t that satisfy these requirements; values of 2 given by each line are for the crust only: 2 = 0 in the mantle. A, B, and C refer to conditions illustrated in Figure 6b. (b) Plots of log•o (F0 against log•o (•) for the three sets of conditions (A, B, C) picked out in Figure 6a. Solid symbols indicate Ft• evaluated at strain rates between 10 -13 and 10 -•7 s -• and the straight lines are picked by eye. For each line, n = d(log•o g)/d[log•o (F0].
sphere from the crust. We let 7 vary between 5 and 15 K km-1, corresponding to a heat flow at the Moho of between 15 and 45 mW m -2 for a conductivity of 3 W m -1 K -1 Figure 6a illustrates the range of Moho temperature for which FL lies between 1.5 and 2.5 x 10¹³ N m -1 for the rheologi- cally stratified continental lithosphere thickening at a strain rate of 3 x 10-16 s-1. It can be seen that these conditions are reached for Moho temperatures between 360 ø and 650øC. These temperatures are uncertain by at least _+ 100øC, owing to the uncertainty in the laboratory values of the material constants summarized by Brace and Kohlstedt (see, for exam- ple, discussion by Sonder and England [1986]).
With Moho temperatures in the lower end of this range, the upper mantle can support an integrated stress difference be- tween 1.5 and 2.5 x 10 •3 N m -1, without contribution from the crust, but at the higher temperatures, the stress is support- ed by a combination of ductile deformation of olivine and friction in the upper crust; when 2- 0, the crustal contri- bution to the strength in Figure 6a is between 35% (curve for S• = 0, F• = 2.5 x 10¹³ N m-1) and 60% (for ,• = 0, F• = 1.5 X 10¹³ N m-1).
Sonder and England [1986] show that over a strain rate range of • 10-13 to 10-•7 s-• the vertically integrated rheol- ogy of such a combined brittle and ductile lithosphere may, to a close approximation, be described by a power law, such as has been used in this paper and in paper 1. This is illustrated in Figure 6b, where curve A approximates the relation be- tween F• and strain rate for the conditions of Figure 6a under which friction on faults contributes most to the vertically- integrated rheology (point A' 7--15 K km -1, F• = 1.5 X 10¹³ N m-1, S• = 0) and curves B and C show this relation
for cases when friction on faults contributes nothing to the integral (•, = 1). In each case, over the range of strain rates illustrated (10-13 to 10-17 s- 1), the vertically averaged rheol- ogy is closely approximated by a power law, with n about 17 for curve A, about 8 for curve B, and about 7 for curve C; the different values of n in the latter two cases indicate varying contributions to the vertically averaged rheology from Dorn law plasticity [Brace and Kohlstedt, 1980]. The Argand number is calculated from the value of F L at the reference strain rate of 1.4 x 10⁻¹,• s-1 (paper 1, Table 1, equations (3) and (6) and Sonder and England [1986])' it lies between 1 and 2 for rheologies that give a value of 1.5 to 2.5 x 10¹³ N m-1 for the driving force Ft, in Figure 6a.
The range of effective power law exponent n that is calcu- lated from vertically integrated laboratory rheology should be compared with the range of n for which the thin sheet calcula- tions yield results consistent with observations in Asia (section 3). The comparison of stratified rheology under compression with the thin viscous sheet rheology is presented as a possible explanation for n values larger than 3. However, there are perhaps other stratified rheologies that would give similar values of n and support driving forces of the order of 1013 N m -1. It should also be noted that within the brittle layer, Byerlee's law predicts that thrust, normal, and strike-slip faults have different stresses on them at failure. Thus the depth- averaged rheology of the thin viscous sheet should not simply depend on the second invariant of the strain rate tensor as assumed in the thin viscous sheet calculations but should be a
more complicated function of the tensor, depending on the relative magnitude of the different components and their signs.
4.2. Tectonic History
Previous interpretations of the India-Asia collision have tended to emphasize the role of strike-slip faulting in the tec-
3674 ENGLAND AND HOUSEMAN' FINITE STRAIN CALCULATIONS OF CONTINENTAL DEFORMATION, 2
tonic evolution of the region (e.g., Molnar and Tapponnier [1975], Tapponnier and Molnar [1976], and Tapponnier et al. [1982], but see Dewey and Burke [1973] and England and McKenzie [1983]). In contrast, we have presented a model that is in quantitative agreement with the major features of the present-day deformation field and requires crustal thickening as the major means of accommodating the convergence be- tween India and Asia. We feel obliged to attempt some expla- nation for the discrepancy between these two viewpoints.
The thin sheet calculations with n between 3 and 10 and Ar
between 1 and 3 can reconcile these differing views to some extent because the sheet deforms first by thickening and then, as the resulting buoyancy forces increase, a plateau is formed in front of the indenter and strike-slip deformation becomes more important (paper 1, Figures 6 and 8). However, the cal- culations do not show the degree of strike-slip motion that is seen in the focal mechanisms [Molnar and Deng, 1984] and certainly not the apparent predominance of such motion that is inferred from satellite photographs [e.g., Tapponnier and Molnar, 1976].
The earlier emphasis on strike-slip deformation may result partly from the fact that strike-slip faults are, by their very nature, easier to detect from satellite photographs than are thrust faults; quantitative studies of the seismic deformation in Asia have concluded that at least half of the present-day northward convergence is accommodated by crustal thicken- ing [Chen and Molnar, 1977; Molnar and Deng, 1984].
The results of our calculations are dependent on our as- sumptions of homogeneity of strength and initial crustal thick- ness distribution. As has been remarked by Vilotte et al. [1984] and England and Houseman [1985], the presence of lateral heterogeneities can lead to enhancement of strike-slip deformation around their edges when compared with the lat- erally homogeneous models discussed here. Alternatively, horizontal motions not accounted for in our calculations
could have occurred if, for example, the Tibetan plateau (or a large fraction of it) existed before the collision; the related buoyancy forces would then presumably inhibit further thick- ening and result in an enhanced contribution of strike-slip deformation to the Tertiary deformation. England and Searle [1986] consider the influence on the deformation of such an elevation contrast along the southern boundary of the Lhasa block in the late Cretaceous and early Tertiary, but the impli- cation of their study, and of the present one, would be that if such an elevation contrast existed over the whole area of the
present plateau, there should be evidence of widespread late Cretaceous/early Tertiary compressive deformation around the edge of the plateau. The hypothesis of a precollision pla- teau of comparable extent to the present one is hard to recon- cile with reports of Cretaceous marine sediments on the west- ern Qiang Tang block [Norin, 1946].
A prominent feature of the deformation in Tibet is the crustal thinning expressed in the north-south grabens [Tappon- nier and Molnar, 1976; Molnar and Tapponnier, 1978; Tappon- nier et al., 1981] and in fault plane solutions [Molnar and Chen, 1983; Molnar and Deng, 1984]. This is a relatively recent phenomenon and accounts for only a small fraction of the accumulated strain in Asia [Armijo et al., 1982]. It seems likely that, as Molnar and Tapponnier [1978] suggest, the ex- tension is driven by the extensional deviatoric stresses associ- ated with the elevated plateau. However, although there is some east-west extension in the north of the plateau in some of our calculations, it is less than the north-south shortening, and net extension of the plateau is not present in our results nor, so far as we are aware, in the published results of other laboratory or numerical experiments with comparable bound-
ary conditions. This discrepancy does not invalidate the thin sheet model, which can produce net extensional strain with purely compressive boundary conditions [England and Mc- Kenzie, 1983]. We do not regard England and McKenzie's boundary conditions as appropriate for the deformation in Asia (see paper 1, section 3.2), but it seems possible that ap- propriate boundary conditions may exist that could result in extensional strains on the plateau once a sufficient elevation contrast had been built up.
4.3. Conclusions
This paper compares the results of numerical experiments on a thin viscous sheet model for continental deformation
with observations of topography, stress and strain rate fields and palaeomagnetic latitudinal displacements in Asia. It is not in the nature of the simple model discussed here that it could reproduce in great detail the features of the India-Asia col- lision zone nor was it our desire to do so. For instance, we have ignored lateral heterogeneities in the lithosphere [-see Vilotte et al., 1984;England and Houseman, 1985-], erosion and faulting. We carry out our calculations in terms of the vertical integrals of stresses acting on the thin sheet, and the observa- tions with which we compare the results are of features on the scale of hundreds to thousands of kilometers.
On this scale the results of the thin sheet calculations are
consistent with the observations in Asia, to within the uncer- tainties discussed in section 3. Where discrepancies exist, we believe they could generally be removed by adding complexity to the model (see, for instance, the influence of lateral hetero- geneities on the topography and strain rate distribution I-Vil- otte et al., 1984' England and Houseman, 1985]).
The thin sheet calculations yield results that are consistent with the observations, provided that the sheets are capable of supporting vertically-integrated stress differences of 1.5 to 2.5 x 10¹³ N m -1 at a strain rate of 3 x 10 -•6 s -• and have
power law exponent n greater than 3. The vertical integrals of stress difference at this strain rate calculated for the conti-
nental lithosphere from laboratory deformation laws [Brace and Kohlstedt, 1980] fall within the range 1.5 to 2.5 x 10 •3 N m- • for Moho temperatures between 360 ø and 650 ø (_+ 100øC) and, under these conditions, the vertically integrated defor- mation laws exhibit a power-law-like dependence of strain rate on driving force with effective power law exponents be- tween 6 and 17 (section 4.1; Figure 6b; see also Sonder and England [1986]). Thus the parameter range for the thin sheet that provides an acceptable fit to the observations in Asia is also consistent with laboratory-determined rheologies for the continental lithosphere.
The orientation of the principal stresses in Asia at the pres- ent day appears to be determined primarily by the configura- tion of the continental collision, but the magnitude and distri- bution of present-day strain rates is determined not only by this configuration, as would be the case for plane-strain defor- mation [e.g., Tapponnier et al., 1982] but depends also on the past history of crustal thickening and the consequent influence of gravitational forces (section 3). Those thin sheet calcula- tions that yield elevated plateaux comparable to the Tibetan plateau show that the major accommodation of convergence is by thickening of the sheet. The distribution of topography in the India-Asia collision zone (sections 2 and 3.1) indicates that most of the convergence between India and Asia is ex- pressed in crustal thickening, and we regard the present-day prominence of strike slip deformation as a relatively recent result of this thickening and not as a dominant mode of ac- commodation of convergence throughout the Tertiary I-En- •Iland and McKenzie, 1982, 1983' England, 1982' paper 1].
ENGLAND AND HOUSEMAN: FINITE STRAIN CALCULATIONS OF CONTINENTAL DEFORMATION, 2 3675
Acknowledgments. The development of this paper has benefited from discussions with Dan McKenzie; we are grateful for reviews from Peter Bird and from Peter Molnar, who provided a review that went beyond the call of duty. This work was supported by National Science Foundation grants EAR81-07659 and EAR84-08352 and by NASA grant NAS5-27229.
REFERENCES
Achache, J., V. Courtillot, and Zhou Y. X., Paleogeographic and tec- tonic evolution of southern Tibet since middle Cretaceous time:
New paleomagnetic data and synthesis, d. Geophys. Res., 89, 10311- 10339, 1984.
Armijo, R., P. Tapponnier, J. L. Mercier, and Han T., A field study of Pleistocene rifts in Tibet, Eos Trans. AGU, 63, 1093, 1982.
Argand, E., La tectonique de L'Asie, Proc. Int. Geol. Congr. 13th, 7, 171-372, 1924.
Baranowski, J., J. Armbruster, L. Seeber, and P. Molnar, Focal depths and fault plane solutions of earthquakes and active tectonics of the Himalaya, d. Geophys. Res., 89, 6918-6928, 1984.
Barazangi, M., and J. Ni, Velocities and propagation characteristics of Pn and Sn beneath the Himalayan arc and Tibetan plateau: Possi- ble evidence for underthrusting of the Indian continental litho- sphere beneath Tibet, Geology, 10, 179-185, 1982.
Brace, W. F., and D. L. Kohlstedt, Limits on lithospheric stress im- posed by laboratory experiments, d. Geophys. Res., 85, 6248-6253, 1980.
Chen, W.-P., and P. Molnar, Seismic moments of major earthquakes and the average rate of slip in Asia, d. Geophys. Res., 82, 2945-2969, 1977.
Chen, W.-P., and P. Molnar, Constraints on the seismic wave velocity structure beneath the Tibetan Plateau and their tectonic impli- cations, d. Geophys. Res., 86, 5937-5962, 1981.
Cochran, J. R., The magnetic quiet zone in the eastern Gulf of Aden: Implications for the early development of the continental margin, Geophys. d. R. Astron. Soc., 68, 171-202, 1982.
Curray, J. R., and D. G. Moore, Growth of the Bengal deep sea fan and denudation in the Himalayas, Geol. Soc. Am. Bull., 82, 563-572, 1971.
Dewey, J. F., and K. C. A. Burke, Tibetan, Variscan and Precambrian basement reactivation: Products of continental collision, d. Geol., 81, 683-692, 1973.
England, P. C., Some numerical investigations of large scale conti- nental deformation, in Mountain Building Processes, edited by K. Hsu, Academic, Orlando, Fla., 1982.
England, P. C., and G. A. Houseman, The influence of lithospheric strength heterogeneities on the tectonics of Tibet and surrounding regions, Nature, 315, 297-301, 1985.
England, P. C., and D. P. McKenzie, A thin viscous sheet model for continental deformation, Geophys. J. R. Astron. Soc., 70, 295-321, 1982. (Correction to: A thin viscous sheet model for continental deformation, Geophys. d. R. Astron. Soc., 73, 523-532, 1983.)
England, P. C., and M.P. Searle, Cretaceous Tertiary deformation of the Lhasa block and its implications for crustal thickening in Tibet, Tectonics, in press, 1986.
England, P. C., G. A. Houseman, and L. Sonder, Length scales for continental deformation in convergent, divergent and strike-slip en- vironments: Analytical and approximate solutions for a thin vis- cous sheet model, d. Geophys. Res., 90, 3551-3557, 1985.
Frank, F. C., Plate tectonics, the analogy with glacier flow and isos- tasy, in Flow and Fracture of Rocks, Geophys. Monogr. Ser., vol. 16, edited by H. C. Heard, I. Y. Borg, N. I. Carter, and C. B. Raleigh, pp. 285-292, AGU, Washington, D.C., 1972.
Gansser, A., The Indian Ocean and the Himalayas: A geologic inter- pretation, Eclogae Geol. Helv., 59, 832-848, 1966.
Goetze, C., The mechanisms of creep in olivine, Philos. Trans. R. Soc. London, Ser. A, 288, 99-119, 1978.
Hirn, A., J.-C. Lepine, G. Jobert, M. Sapin, G. Wittlinger, Z. X. Xu, E. Y. Gao, X. J. Wang, J. W. Teng, S. B. Xiong, M. R. Pandey, and J. M. Tater, Crustal structure and variability of the Himalayan border of Tibet, Nature, 370, 23-25, 1984a.
Hirn, A., A. Nercessian, M. Sapin, G. Jobert, Z. X. Xu, E. Y. Gao, D. Y. Lu, and J. W. Teng, Lhasa block and bordering sutures--A continuation of a 500 km Moho traverse through Tibet, Nature, 307, 25-27, 1984b.
Houseman, G. A., and P. C. England, Finite strain calculations of continental deformation, I, Method and general results for conver- gent zones, d. Geophys. Res., this issue.
Jobert, N., B. Journet, G. Jobert, A. Hirn, and Sun K., Deep structure of southern Tibet inferred from dispersion of Rayleigh waves through a long period seismic network, Nature, 313, 386-388, 1985.
Klootwijk, C. T., and C. Radhakrishnamurthy, Phanerozoic palaeo- magnetism of the Indian plate and the India Asia collision, in Pa- laeoreconstruction of the Continents, Geodyn. Ser., vol. 2, edited by M. W. McElhinny and D. A. Valencio, pp. 93-105, AGU, Wash- ington, D.C., 1981.
Lyon-Caen, H., and P. Molnar, Constraints on the structure of the Himalaya from an analysis of gravity anomalies and a flexural model of the lithosphere, d. Geophys. Res., 88, 8171-8191, 1983.
McKenzie, D. P., and J. G. Sclater, The evolution of the Indian Ocean since the late Cretaceous, Geophys. J. R. Astron. Soc., 24, 437-528, 1971.
Molnar, P., Structure and tectonics of the Himalaya: Constraints and implications of geophysical data, Annu. Rev. Earth Planet. Sci., 12, 489-518, 1984.
Molnar, P., and W.-P. Chen, Evidence for large Cainozoic crustal shortening of Asia, Nature, 273, 218-220, 1978.
Molnar, P., and W.-P. Chen, Seismicity and mountain building, in Mountain Building Processes, edited by K. J. Hsti, pp. 41-56,; Aca- demic, Orlando, Fla., 1982.
Molnar, P., and W.-P. Chen, Focal depths and fault plane solutions of earthquakes under the Tibetan plateau, d. Geophys. Res., 88, 1180-1196, 1983.
Molnar, P., and W.-P. Chen, S-P wave travel time residuals and lateral inhomogeneity in the mantle beneath Tibet and the Hima- laya, d. Geophys. Res., 89, 6911-6917, 1984.
Molnar, P., and Deng Q., Faulting associated with large earthquakes and the average rate of deformation in central and eastern Asia, d. Geophys. Res., 89, 6203-6228, 1984.
Molnar, P., and P. Tapponnier, Cenozoic tectonics of Asia: Effects of a continental collision, Science, 189, 419-426, 1975.
Molnar, P., and P. Tapponnier, Active tectonics of Tibet, d. Geophys. Res., 83, 5361-5375, 1978.
Molnar, P., and P. Tapponnier, A possible dependence of the tectonic strength on the age of the crust in Asia, Earth Planet. Sci. Lett., 52, 107-114, 1981.
Molnar, P., T. J. Fitch, and F. T. Wu, Fault plane solutions of shal- low earthquakes and contemporary tectonics in Asia, Earth Planet. Sci. Lett., 19, 101-112, 1973.
Molnar, P., W.-P. Chen, and P. Tapponnier, Constraints of the amount of north-south shortening in Tibet during the Cenozoic, in Geological and Ecological Studies of Qinghai-Xizang Plateau, vol. 1, pp. 757-762, Science Press, Beijing, 1981.
Ni, J., and M. Barazangi, Seismotectonics of the Himalayan collision zone: Geometry of underthrusting Indian plate beneath the Hima- laya, J. Geophys. Res., 89, 1147-1164, 1984.
Ni, J., and J. York, Late Cenozoic tectonics of Tibetan plateau, d. Geophys. Res., 83, 5375-5384, 1978.
Norin, E., Geological explorations in western Tibet, Reports from the Scientific Expedition to the Northwestern Provinces under the Leadership of Dr. Sven Hedin, Publ. 29, part III, Geology 7, Stock- holm, 1946.
Powell, C. M., and P. Conaghan, Plate tectonics and the Himalayas, Earth Planet. Sci. Lett., 20, 1-12, 1973.
Romanowicz, B., Constraints on the structure of the Tibet plateau from pure path phase velocities of Love and Rayleigh waves, d. Geophys. Res., 87, 6865-6883, 1982.
Sonder, L. J., and P. C. England, Vertical averages of rheology of continental lithosphere: Relation to thin sheet parameters, Earth Planet. Sci. Lett., in press, 1986.
Tapponnier, P., and P. Molnar, Slip-line field theory and large scale continental tectonics, Nature, 264, 319-324, 1976.
Tapponnier, P., and P. Molnar, Active faulting and tectonics in China, J. Geophys. Res., 82, 2905-2928, 1977.
Tapponnier, P., and P. Molnar, Active faulting and Cenozoic tec- tonics of the Tien Shan, Mongolia, and Baykal regions, J. Geophys. Res., 84, 3425-3459, 1979.
Tapponnier, P., et al., The Tibetan side of the India-Eurasian col- lision, Nature, 294, 405-410, 1981.
Tapponnier, P., G. Pelzer, A. Y. Le Dain, R. Armijo, and P. Cobbold, Propagating extrusion tectonics in Asia: New insights from simple plasticine experiments, Geology, 10, 611-616, 1982.
Vilotte, J.P., M. Daigni•res, and R. Madariaga, Numerical modeling of intraplate deformation: Simple mechanical models of continental collision, d. Geophys. Res., 87, 10709-10728, 1982.
Vilotte, J.P., M. Daigni•res, R. Madariaga, and O. C. Zienkiewicz,

3676 ENGLAND AND HOUSEMAN.' FINITE STRAIN CALCULATIONS OF CONTINENTAL DEFORMATION, 2
The role of a heterogeneous inclusion during continental collision, Phys. Earth Planet. Inter., 36, 236-259, 1984.
Zhu X., Liu C., Ye S., and Liu J., Remanence of red beds from Linzhou, Xizang and the northward movement of the Indian plate, Sci. Geol. Sin., 1• 44-51, 1977.
Zhu Z., Zhu X., and Zhang Y., Palaeomagnetic observation in Xizang and continental drift, in Geolo•7ical and Ecolo•7ical Studies of Zinflhai-Xizan•t Plateau, vol. 1, pp. 931-939, Science Press, Beijing, 1981.
P. England, Department of Geological Sciences, Harvard Univer- sity, Hoffman Laboratory, 20 Oxford Street, Cambridge, MA 02138.
G. Houseman, Research School of Earth Sciences, Australian Na- tional University, Canberra, ACT 2601, Australia.
(Received March 25, 1985; revised November 5, 1985;
accepted November 7, 1985.)