Embed Size (px)
Citation preview
Journal of Engineering Science and Technology Vol. 11, No. 12 (2016) 1758 - 1770 © School of Engineering, Taylor’s University
1758
FINITE ELEMENT MODELLING OF A TURBINE BLADE TO STUDY THE EFFECT OF MULTIPLE CRACKS
USING MODAL PARAMETERS
RAVI PRAKASH BABU KOCHARLA1,3,
*, RAGHU KUMAR BANDLAM2,
MALLIKARJUNA RAO KUCHIBOTLA3
1Department of Mechanical Engineering, KLEF University, Guntur, Andhra Pradesh, India 2Department of Mechanical Engineering, PVP Siddhartha Institute of Technology,
Vijayawada, Andhra Pradesh, India 3Department of Mechanical Engineering, JNTUK, Kakinada, Andhra Pradesh, India
*Corresponding Author: [email protected]
Abstract
The presence of crack in a structure tends to modify its modal parameters (natural
frequencies and mode shapes). The fact can be used inversely to predict the crack
parameters (crack depth and its location) from measurement of the changes in the
modal parameters, once a functional relationship between them has been
established. The machine components like turbine blade can be treated as a
cantilever beam. Vibration analysis of cantilever beam can be extended
successfully to develop online crack detection methodology in turbine blade. In
the present work, finite element model of a cantilever beam for flexural vibrations
has been considered by including two transverse open U-notches. The modal
analysis has been carried out on cantilever beam with two U-notches and observed
the influence of one U-notch on the other for natural frequencies and mode
shapes. It is found that a certain frequency may correspond to different crack
depths and locations. Later, by using a central difference approximation, curvature
mode shapes were then calculated from the displacement mode shapes. The
location and depth corresponding to any peak on this curve becomes a possible
notch location and depth. The identification procedure presented in this study is a
useful tool for detection of multiple cracks in a turbine blade.
Keywords: Finite element, Natural frequency, Mode shapes, Cantilever,
Multiple cracks
1. Introduction
Any localized crack in a structure reduces the stiffness in the cracked area. These
features are related to variation in the dynamic properties, such as, decreases in
Finite Element Modelling of a Turbine Blade to Study the Effect of Multiple . . . . 1759
Journal of Engineering Science and Technology December 2016, Vol. 11(12)
Nomenclatures
a Depth of the crack, mm
a//h Crack depth ratio
b Thickness of the crack, mm
c Location of the first crack from the fixed end, mm
c/l First crack location ratio from fixed end
d Location of the second crack from the fixed end, mm
d/l Second crack location ratio from fixed end
e Element edge length, mm
h Height of the cantilever beam, mm
i Node number
k Curvature of bending
l Length of the cantilever beam, mm
l/h Length to height ratio of the beam
w Width of the beam, mm
ω1 Natural frequency of the first mode of vibration, Hertz
ω2 Natural frequency of the second mode of vibration, Hertz
ω3 Natural frequency of the third mode of vibration, Hertz
natural frequencies and variation of the modes of vibration of the structure. One
or more of above characteristics can be used to detect and locate cracks. This
property may be used to detect existence of crack or faults together with location
and its severity in a structural member. Rizos et al. [1] measured the amplitude at
two points and proposed an algorithm to identify the location of crack. Pandey et
al. [2] suggested a parameter, namely curvature of the deflected shape of beam
instead of change in frequencies to identify the location of crack. Ostachowicz
and Krewczuk [3] proposed a procedure for identification of a crack based on the
measurement of the deflection shape of the beam.
Ratcliffe [4] also developed a technique for identifying the location of
structural damage in a beam using a 1D FEA. A finite difference approximation
called Laplace’s differential operator was applied to the mode shapes to identify
the location of the damage. Wahab and Roeck [5] investigated the application of
the change in modal curvatures to detect damage in a prestressed concrete bridge.
Lakshminarayana and Jebaraj [6] carried out analytical work to study the effect of
crack at different location and depth on mode shape behaviour.
Kishen and Sain [7] developed a technique for damage detection using static
test data. Nahvi and Jabbari [8] established analytical as well as experimental
approach to the crack detection in cantilever beams. Babu and Prasad [9] used
differences in curvature mode shapes to detect a crack in beams. Wang et. al. [10]
incorporated finite element method for dynamic analysis and the mode shape
difference curvature information for damage detection/diagnosis.
This paper deals with the technique and its application of natural frequencies
and mode shapes to a cantilever beam. The paper of Pandey et al. [2] showed a
quite interesting phenomenon: that is, the modal curvatures are highly sensitive to
damage and can be used to localize it. They used simulated data for a cantilever
and a simply supported beam model to demonstrate the applicability of the
1760 K. Ravi Prakash Babu at el.
Journal of Engineering Science and Technology December 2016, Vol. 11(12)
method. The damaged beam was modelled by reducing the E-modules of a certain
element. By plotting the difference in modal curvature between the intact and the
damaged case, a peak appears at the damaged element indicating the presence of a
fault. They used a central difference approximation to derive the curvature mode
shapes from the displacement mode shapes.
So, this paper is done in two parts. First part of this paper studies about the
changes in natural frequencies because of the presence of multiple cracks in the
cantilever beam. The second part of this paper is concerned with investigation of
the accuracy when using the central difference approximation to compute the
modal curvature and determine the location of the cracks. The application of this
technique to turbine blades in which more than one fault positions exist is
investigated using a continuous beam with simulated data. The results of this
scenario will be analyzed in this paper and multiple cracks will be detected and
localized by using the measured change in modal curvatures.
The objective of this paper to find a methodology for predicting crack
parameters (crack depth and its location) in a cantilever beam from changes in
natural frequencies and curvature mode shapes has been developed. Parametric
studies have been carried out using ANSYS Software to evaluate modal
parameters (natural frequencies and mode shapes) for different crack parameters.
Curvature mode shapes were then calculated from the displacement mode shapes
to identify crack location and its severity in the cantilever beam.
2. Theory
Steam turbines have number of stages and employs number of blades ranging from
few centimeters in length in high pressure turbine to almost one meter long blades
in the low pressure turbine. And the natural frequencies of high pressure turbine
blades are high compared to low pressure turbine blades, so even small decrease of
natural frequency of low pressure turbine blade makes frequency of the blade closer
to operating frequency. Also, for the same crack parameters the eigen value
changes are more appreciable for high pressure turbine blade when compared to low
pressure turbine blade. It means that the crack in a high pressure turbine blade
changes the dynamic behavior more compared to that of low pressure turbine blade.
So, the condition of high pressure turbine blade is predicted more perfectly than that
of low pressure turbine blade using vibration response.
So, modal analysis of low pressure steam turbine blade was carried out which
has been modelled with airfoil cross section and tapered length. The first three
natural frequencies are of the turbine blade of low pressure steam turbine last
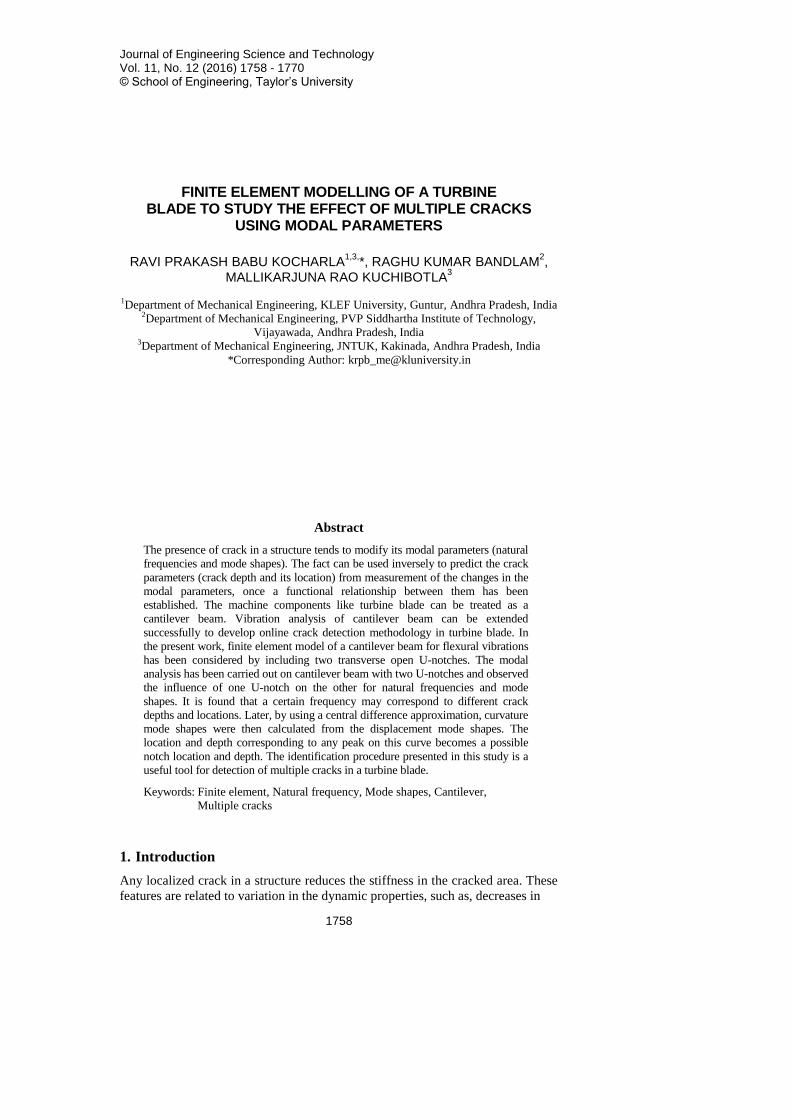
stage blade is given in Table 1 for different angle of twists. Figure 1 confirms the
results of turbine blade.
From the Table 1 it was found that first mode frequency for turbine blade is
almost same with increased angle of twist. Second mode frequency is increasing
with increased angle of twist and Third mode frequency is decreasing with
increased angle of twist.
Later same analysis was carried out for cantilever beam with different angle of
twists. The low pressure steam turbine is modelled as cantilever beam with
l/h=60. The material properties are assigned to the blade and boundary conditions
Finite Element Modelling of a Turbine Blade to Study the Effect of Multiple . . . . 1761
Journal of Engineering Science and Technology December 2016, Vol. 11(12)
are defined same as that of turbine blade. Natural Frequency values for cantilever
beam of rectangular cross section are analyzed and the first, second and third
modes are given in Table 2.
Table 1. Natural frequencies of turbine blade
with different angles of twist (for uncracked blade).
Angle of Twist ω1 ω2 ω3
0o 74.093 268.71 690.59
15o 72.775 229.47 685.18
30o 72.395 236.55 719.23
45o 72.281 269.16 690.62
60o 71.596 301.53 677.20
Fig. 1. First mode shape of turbine blade with 0
o angle of twist.
Table 2. Natural frequencies of twisted cantilever beam
with different angles of twist (for uncracked beam).
Angle of Twist ω1 ω2 ω3
0o 171.89 1075.8 3006.0
15o 170.65 918.72 2994.6
30o 170.52 945.18 3142.6
45o 170.78 1083.5 3008.7
60o 169.28 1208.2 2947.7
The same results of turbine blade can be observed for cantilever beam as
frequency values given in Table 2. First mode frequency is almost same with
increased angle of twist. Second mode frequency is increasing with increased
angle of twist and Third mode frequency is decreasing with increased angle of
twist. Hence one can conclude that vibration response of a component will purely
depend upon mass and stiffness of the component. It is merely affected by size
and shape of the component. So, from this analysis one can conclude that modal
analysis of cantilever beam can be validated for turbine blades.
The low pressure steam turbine blades on turbine-generator units at an
electricity generating station have had a history of failures. Early experience was
with failures at the root attachment of the blade, but subsequently failures also
1762 K. Ravi Prakash Babu at el.
Journal of Engineering Science and Technology December 2016, Vol. 11(12)
occurred at the outer of two lacing wire holes. So, it is required to know the
behavior of turbine blades with multiple cracks.
Stress corroded blades will have loss of material. After material removal the
damage location can be mapped into U-notch. For this type of damages regular
elements with finer mesh can be opted for modelling. For shape edge cracks one
had to select crack tip elements to model the cracked geometry. In the present
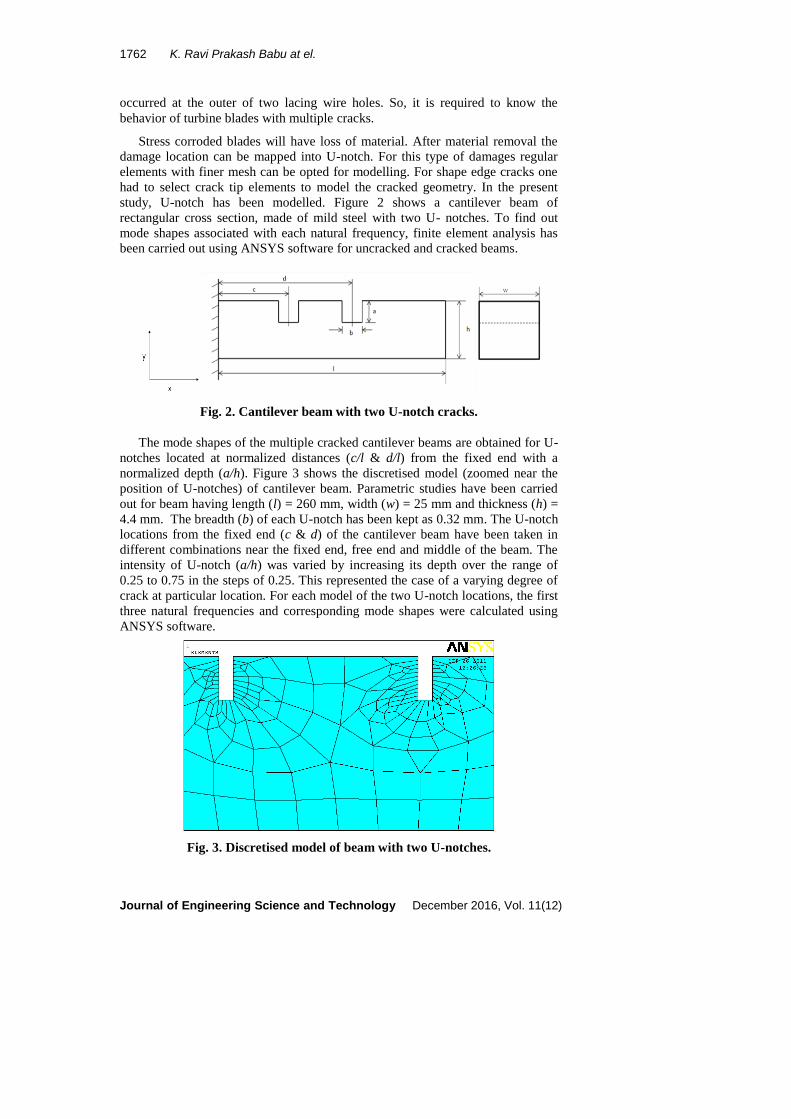
study, U-notch has been modelled. Figure 2 shows a cantilever beam of
rectangular cross section, made of mild steel with two U- notches. To find out
mode shapes associated with each natural frequency, finite element analysis has
been carried out using ANSYS software for uncracked and cracked beams.
Fig. 2. Cantilever beam with two U-notch cracks.
The mode shapes of the multiple cracked cantilever beams are obtained for U-
notches located at normalized distances (c/l & d/l) from the fixed end with a
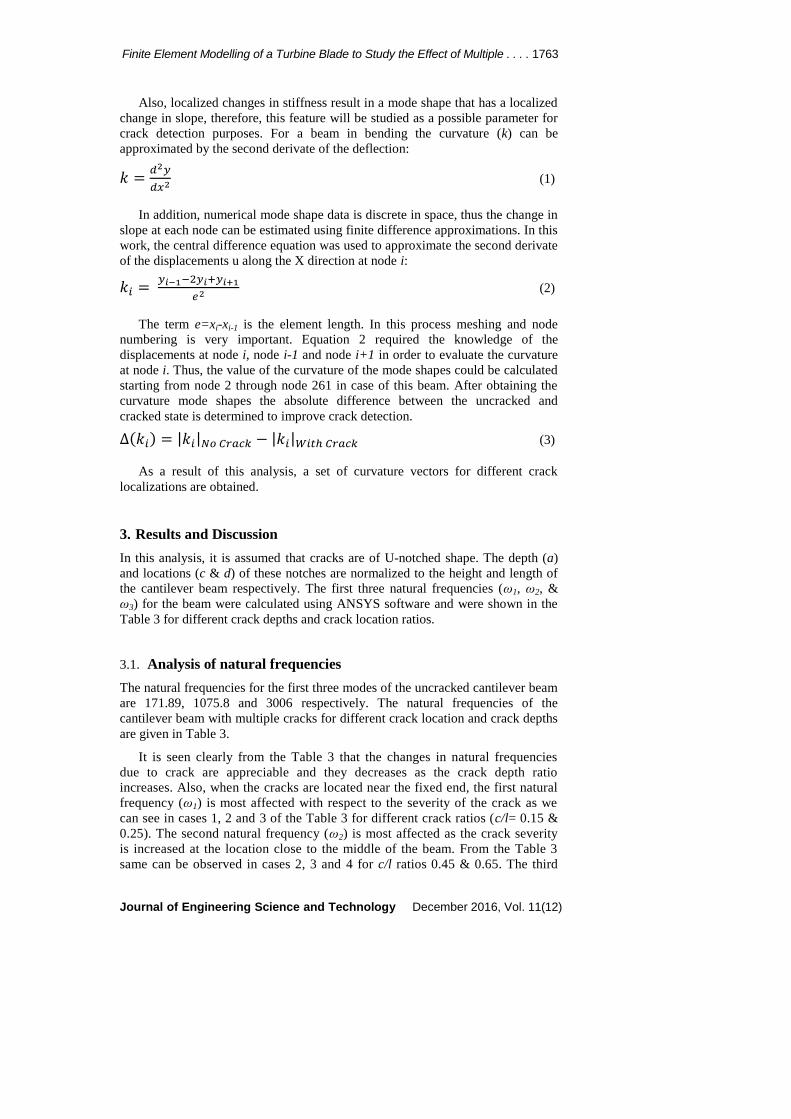
normalized depth (a/h). Figure 3 shows the discretised model (zoomed near the
position of U-notches) of cantilever beam. Parametric studies have been carried
out for beam having length (l) = 260 mm, width (w) = 25 mm and thickness (h) =
4.4 mm. The breadth (b) of each U-notch has been kept as 0.32 mm. The U-notch
locations from the fixed end (c & d) of the cantilever beam have been taken in
different combinations near the fixed end, free end and middle of the beam. The
intensity of U-notch (a/h) was varied by increasing its depth over the range of
0.25 to 0.75 in the steps of 0.25. This represented the case of a varying degree of
crack at particular location. For each model of the two U-notch locations, the first
three natural frequencies and corresponding mode shapes were calculated using
ANSYS software.
Fig. 3. Discretised model of beam with two U-notches.
Finite Element Modelling of a Turbine Blade to Study the Effect of Multiple . . . . 1763
Journal of Engineering Science and Technology December 2016, Vol. 11(12)
Also, localized changes in stiffness result in a mode shape that has a localized
change in slope, therefore, this feature will be studied as a possible parameter for
crack detection purposes. For a beam in bending the curvature (k) can be
approximated by the second derivate of the deflection:
𝑘 =𝑑2𝑦
𝑑𝑥2 (1)
In addition, numerical mode shape data is discrete in space, thus the change in
slope at each node can be estimated using finite difference approximations. In this
work, the central difference equation was used to approximate the second derivate
of the displacements u along the X direction at node i:
𝑘𝑖 = 𝑦𝑖−1−2𝑦𝑖+𝑦𝑖+1
𝑒2 (2)
The term e=xi-xi-1 is the element length. In this process meshing and node
numbering is very important. Equation 2 required the knowledge of the
displacements at node i, node i-1 and node i+1 in order to evaluate the curvature
at node i. Thus, the value of the curvature of the mode shapes could be calculated
starting from node 2 through node 261 in case of this beam. After obtaining the
curvature mode shapes the absolute difference between the uncracked and
cracked state is determined to improve crack detection.
∆(𝑘𝑖) = |𝑘𝑖|𝑁𝑜 𝐶𝑟𝑎𝑐𝑘 − |𝑘𝑖|𝑊𝑖𝑡ℎ 𝐶𝑟𝑎𝑐𝑘 (3)
As a result of this analysis, a set of curvature vectors for different crack
localizations are obtained.
3. Results and Discussion
In this analysis, it is assumed that cracks are of U-notched shape. The depth (a)
and locations (c & d) of these notches are normalized to the height and length of
the cantilever beam respectively. The first three natural frequencies (ω1, ω2, &
ω3) for the beam were calculated using ANSYS software and were shown in the
Table 3 for different crack depths and crack location ratios.
3.1. Analysis of natural frequencies
The natural frequencies for the first three modes of the uncracked cantilever beam
are 171.89, 1075.8 and 3006 respectively. The natural frequencies of the
cantilever beam with multiple cracks for different crack location and crack depths
are given in Table 3.
It is seen clearly from the Table 3 that the changes in natural frequencies
due to crack are appreciable and they decreases as the crack depth ratio
increases. Also, when the cracks are located near the fixed end, the first natural
frequency (ω1) is most affected with respect to the severity of the crack as we
can see in cases 1, 2 and 3 of the Table 3 for different crack ratios (c/l= 0.15 &
0.25). The second natural frequency (ω2) is most affected as the crack severity
is increased at the location close to the middle of the beam. From the Table 3
same can be observed in cases 2, 3 and 4 for c/l ratios 0.45 & 0.65. The third
1764 K. Ravi Prakash Babu at el.
Journal of Engineering Science and Technology December 2016, Vol. 11(12)
natural frequency (ω3) is more sensitive throughout the beam except when the
crack is near the middle portion of the beam which can be seen in all the cases
of the Table 3.
Table 3. Natural frequencies for multiple cracks.
Case
No.
Crack Location
ratio (c/l & d/l)
Cracks Depth
ratio (a/h)
Natural Frequencies
ω1 ω2 ω3
1 0.15 & 0.8
1.1 & 1.1
1.1 & 2.2
1.1 & 3.3
2.2 & 2.2
3.3 & 2.2
165.7
165.6
165.3
156.8
123.2
1046.1
1037.1
983.5
1030.5
1007.8
2914.0
2814.4
2877.5
2818.1
2809.0
2 0.25 & 0.45
1.1 & 1.1
2.2 & 1.1
2.2 & 2.2
2.2 & 3.3
3.3 & 1.1
165.7
159.5
157.5
146.2
132.9
1040.1
1038.9
1002.7
856.0
1033.6
2911.7
2832.5
2825.7
2797.3
2560.2
3 0.25 & 0.65
1.1 & 1.1
1.1 & 2.2
1.1 & 3.3
2.2 & 2.2
3.3 & 2.2
166.2
165.7
162.8
159.5
132.9
1041.4
1006.2
849.9
1009.3
1002.3
2887.4
2780.8
2466.7
2710.5
2447.1
4 0.65 & 0.85
1.1 & 1.1
1.1 & 2.2
1.1 & 3.3
2.2 & 2.2
3.3 & 2.2
167.7
167.8
167.7
167.3
164.3
1041.2
1037.6
1016.0
1002.9
847.5
2896.3
2847.9
2563.0
2745.3
2461.8
3.2. Analysis of mode shapes
The first three natural frequencies and mode shapes of the uncracked cantilever
beam and of the cracked cantilever beam at two different element combinations
is evaluated in ANSYS. It was found that there is a percentage change in the
frequency from the uncracked to the cracked case, but no indication of the exact
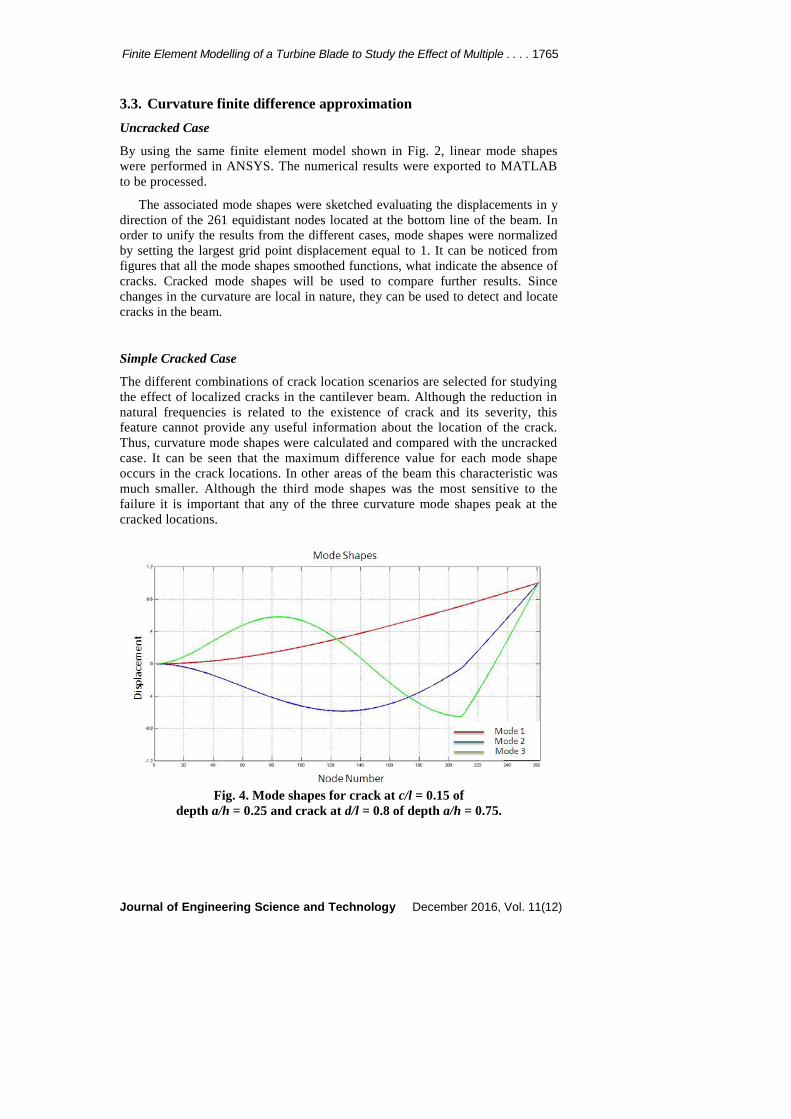
location of crack is obtained from this without further analysis. Figures 4, 6, 8
and 10 indicate the mode shapes which are almost identical. Hence it is difficult
to detect the location of crack. The difference curvature mode shapes are shown
in Figs. 5, 7, 9 and 11 which are plotted from the absolute differences between
the curvature mode shapes of the uncracked and the cracked cantilever. The
maximum difference for each curvature mode shape occurs in the cracked
region, which are at point’s c/l and d/l. This characteristic of curvature mode
shapes can be very useful in locating the cracked area. So, it can be concluded
that by using finite difference approximation crack parameters (depth and
location) may be identified for medium size cracks (a/h=0.25) in cantilever
beam like structures.
Finite Element Modelling of a Turbine Blade to Study the Effect of Multiple . . . . 1765
Journal of Engineering Science and Technology December 2016, Vol. 11(12)
3.3. Curvature finite difference approximation
Uncracked Case
By using the same finite element model shown in Fig. 2, linear mode shapes
were performed in ANSYS. The numerical results were exported to MATLAB
to be processed.
The associated mode shapes were sketched evaluating the displacements in y
direction of the 261 equidistant nodes located at the bottom line of the beam. In
order to unify the results from the different cases, mode shapes were normalized
by setting the largest grid point displacement equal to 1. It can be noticed from
figures that all the mode shapes smoothed functions, what indicate the absence of
cracks. Cracked mode shapes will be used to compare further results. Since
changes in the curvature are local in nature, they can be used to detect and locate
cracks in the beam.
Simple Cracked Case
The different combinations of crack location scenarios are selected for studying
the effect of localized cracks in the cantilever beam. Although the reduction in
natural frequencies is related to the existence of crack and its severity, this
feature cannot provide any useful information about the location of the crack.
Thus, curvature mode shapes were calculated and compared with the uncracked
case. It can be seen that the maximum difference value for each mode shape
occurs in the crack locations. In other areas of the beam this characteristic was
much smaller. Although the third mode shapes was the most sensitive to the
failure it is important that any of the three curvature mode shapes peak at the
cracked locations.
Fig. 4. Mode shapes for crack at c/l = 0.15 of
depth a/h = 0.25 and crack at d/l = 0.8 of depth a/h = 0.75.
1766 K. Ravi Prakash Babu at el.
Journal of Engineering Science and Technology December 2016, Vol. 11(12)
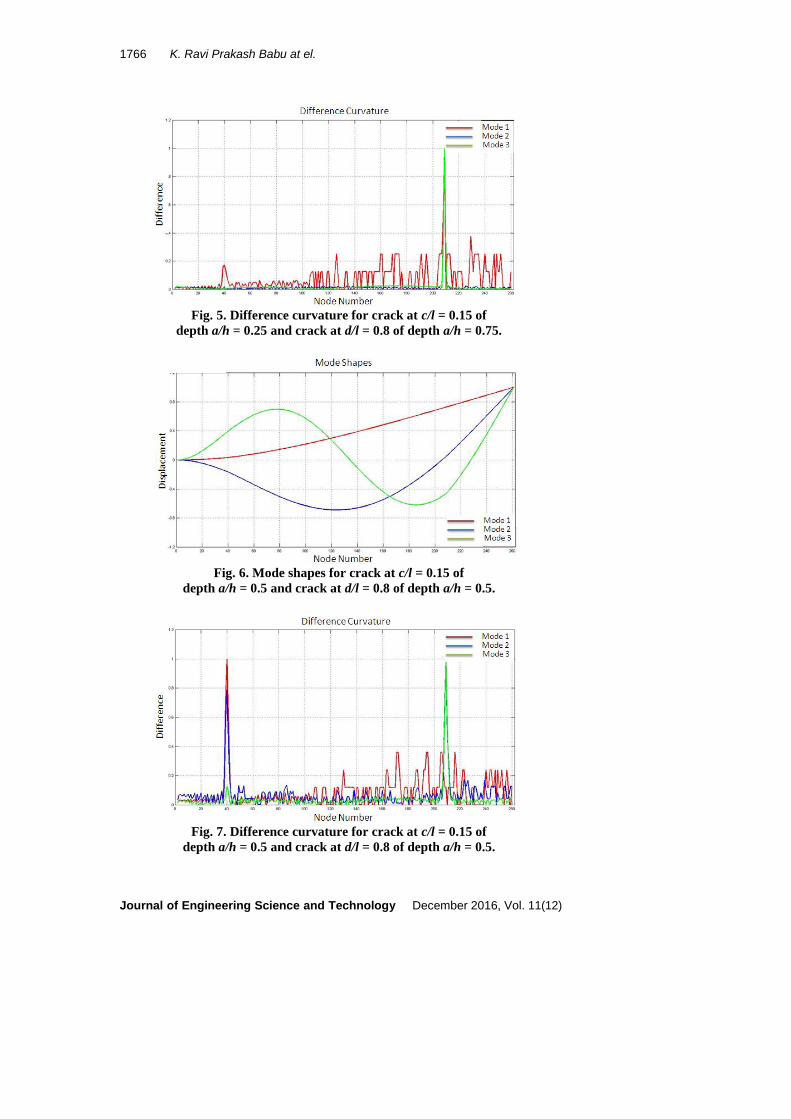
Fig. 5. Difference curvature for crack at c/l = 0.15 of
depth a/h = 0.25 and crack at d/l = 0.8 of depth a/h = 0.75.
Fig. 6. Mode shapes for crack at c/l = 0.15 of
depth a/h = 0.5 and crack at d/l = 0.8 of depth a/h = 0.5.
Fig. 7. Difference curvature for crack at c/l = 0.15 of
depth a/h = 0.5 and crack at d/l = 0.8 of depth a/h = 0.5.
Finite Element Modelling of a Turbine Blade to Study the Effect of Multiple . . . . 1767
Journal of Engineering Science and Technology December 2016, Vol. 11(12)
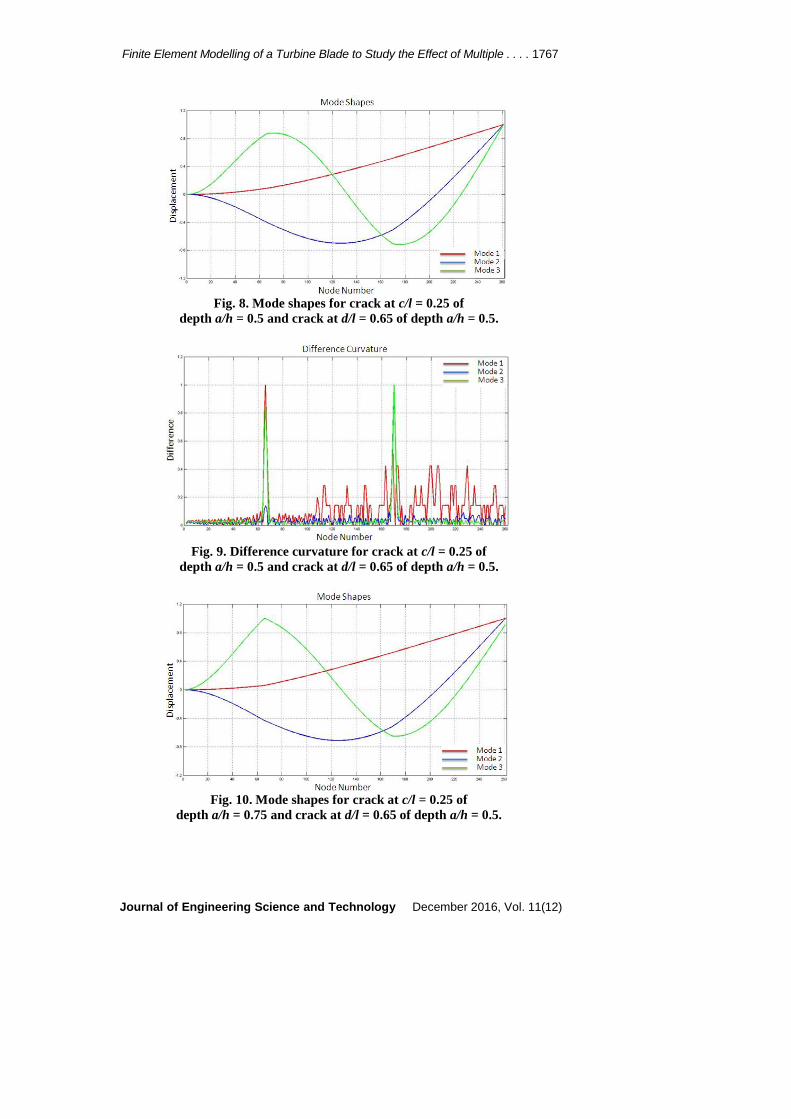
Fig. 8. Mode shapes for crack at c/l = 0.25 of
depth a/h = 0.5 and crack at d/l = 0.65 of depth a/h = 0.5.
Fig. 9. Difference curvature for crack at c/l = 0.25 of
depth a/h = 0.5 and crack at d/l = 0.65 of depth a/h = 0.5.
Fig. 10. Mode shapes for crack at c/l = 0.25 of
depth a/h = 0.75 and crack at d/l = 0.65 of depth a/h = 0.5.
1768 K. Ravi Prakash Babu at el.
Journal of Engineering Science and Technology December 2016, Vol. 11(12)
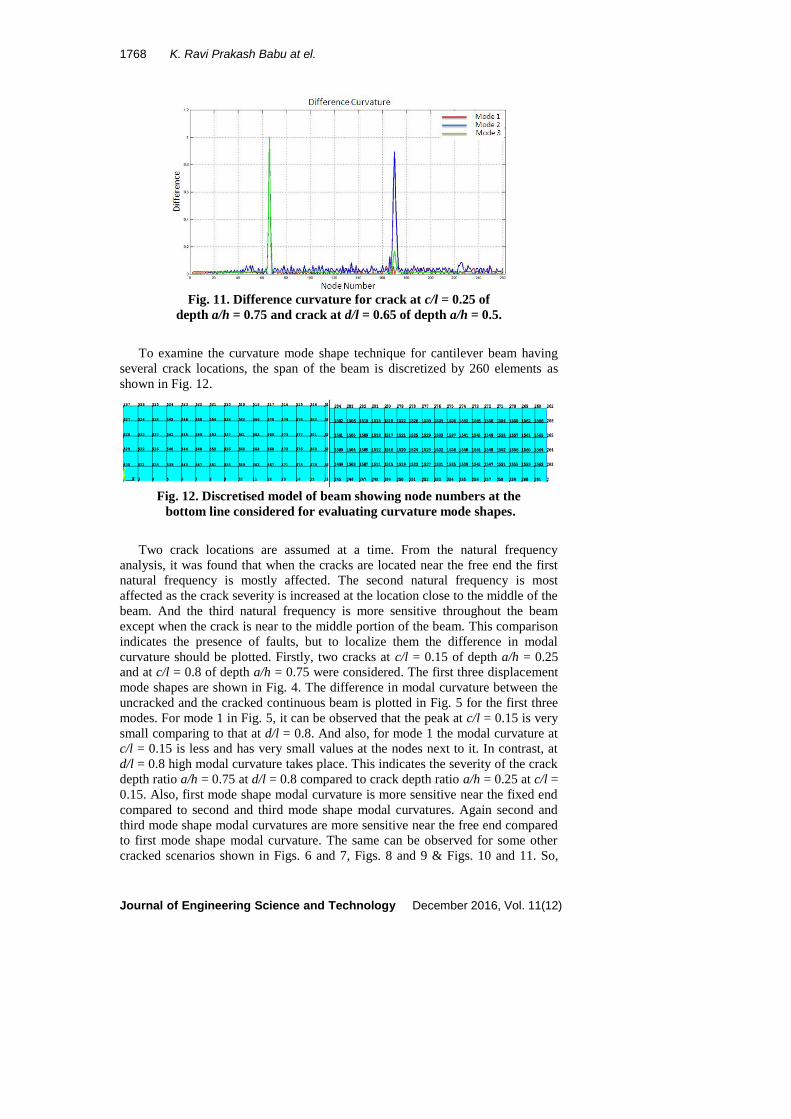
Fig. 11. Difference curvature for crack at c/l = 0.25 of
depth a/h = 0.75 and crack at d/l = 0.65 of depth a/h = 0.5.
To examine the curvature mode shape technique for cantilever beam having
several crack locations, the span of the beam is discretized by 260 elements as
shown in Fig. 12.
Fig. 12. Discretised model of beam showing node numbers at the
bottom line considered for evaluating curvature mode shapes.
Two crack locations are assumed at a time. From the natural frequency
analysis, it was found that when the cracks are located near the free end the first
natural frequency is mostly affected. The second natural frequency is most
affected as the crack severity is increased at the location close to the middle of the
beam. And the third natural frequency is more sensitive throughout the beam
except when the crack is near to the middle portion of the beam. This comparison
indicates the presence of faults, but to localize them the difference in modal
curvature should be plotted. Firstly, two cracks at c/l = 0.15 of depth a/h = 0.25
and at c/l = 0.8 of depth a/h = 0.75 were considered. The first three displacement
mode shapes are shown in Fig. 4. The difference in modal curvature between the
uncracked and the cracked continuous beam is plotted in Fig. 5 for the first three
modes. For mode 1 in Fig. 5, it can be observed that the peak at c/l = 0.15 is very
small comparing to that at d/l = 0.8. And also, for mode 1 the modal curvature at
c/l = 0.15 is less and has very small values at the nodes next to it. In contrast, at
d/l = 0.8 high modal curvature takes place. This indicates the severity of the crack
depth ratio a/h = 0.75 at d/l = 0.8 compared to crack depth ratio a/h = 0.25 at c/l =
0.15. Also, first mode shape modal curvature is more sensitive near the fixed end
compared to second and third mode shape modal curvatures. Again second and
third mode shape modal curvatures are more sensitive near the free end compared
to first mode shape modal curvature. The same can be observed for some other
cracked scenarios shown in Figs. 6 and 7, Figs. 8 and 9 & Figs. 10 and 11. So,
Finite Element Modelling of a Turbine Blade to Study the Effect of Multiple . . . . 1769
Journal of Engineering Science and Technology December 2016, Vol. 11(12)
depending on the absolute ratio between the modal curvature values for a
particular mode at two different locations, one peak can dominate the other.
Therefore, one can conclude that in case of several crack locations in a structure,
all modes should be carefully examined.
The crack is assumed to affect stiffness of the cantilever beam. The stiffness
matrix of the cracked element in the Finite element model of the beam will
replace the stiffness matrix of the same element prior to damaging to result in the
global stiffness matrix. Thus frequencies and mode shapes are obtained by
solving the Eigen Value Problem (EVP) [K] – ω2 [M] = 0. So it can be seen in
Figs. 4 and 10 very clearly the changes in slopes and deviations in mode shape at
crack location for crack depth ratio 0.75.
4. Conclusions
A method for identifying multiple crack parameters (crack depth and its location) in
a cantilever beam using modal parameters has been attempted in the present paper.
Parametric studies have been carried out using ANSYS Software to evaluate modal
parameters (natural frequencies and mode shapes) for different multiple crack
parameters.
A change in certain mode frequency may correspond to different crack depth
and location. But for multiple crack effects, mode shape analysis needs to be
carried out.
Due to the irregularities in the measured mode shapes, a curve fitting can be
applied by calculating the curvature mode shapes using the central difference
approximation. The curvature mode shapes technique for crack localization in
turbine blades can be investigated.
The results confirm that the application of the curvature mode shape method to
detect cracks in turbine blades seems to be promising. The identification
procedure presented in this paper is believed to provide a useful tool for
detection of multiple cracks in turbine blades.
References
1. Rizos, P.F.; Aspragathos, N.; and Dimarogonas, A.D. (1990). Identification
of crack location and magnitude in a cantilever beam from the vibration
modes. Journal of Sound and Vibration, 138(3), 381-388.
2. Pandey, A.K.; Biswas, M.; and Samman, M.M. (1991). Damage detection
from change in curvature mode shapes. Journal of Sound and Vibration,
145(2), 321-332.
3. Ostachowicz, W.M.; and Krawczuk, M. (1991). Analysis of the effect of
cracks on the natural frequencies of a cantilever beam. Journal of Sound and
Vibration, 150(2), 191-201.
4. Ratcliffe, C.P. (1997). Damage detection using a modified Laplacian operator
on mode shape data. Journal of Sound and Vibration, 204(3), 505-517.
1770 K. Ravi Prakash Babu at el.
Journal of Engineering Science and Technology December 2016, Vol. 11(12)
5. Wahab, M.; and Roeck, G. (1999). Damage detection in bridges using modal
curvatures: application to a real damage scenario. Journal of Sound and
Vibration, 226(2), 217-235.
6. Lakshminarayana, K.; and Jebaraj, C. (1999). Sensitivity analysis of
local/global modal parameters for identification of a crack in a beam. Journal
of Sound and Vibration, 228(5), 977-994.
7. Kishen, J.M.C.; and Sain, T. (2004). Damage Detection Using Static Test
Data. Journal of Structural Engineering, India, 31(1), 15-21.
8. Nahvi, H.; and Jabbari, M. (2005). Crack detection in beams using
experimental modal data and finite element model. International Journal of
Mechanical Sciences, 47(10), 1477-1497.
9. Babu, K.R.P.; and Prasad, G.D. (2012). Crack detection in beams from the
differences in curvature mode shapes. Journal of Structural Engineering
India, 39(2), 237-242.
10. Wang, Y.; Liang, M.; and Xiang, J. (2014). Damage detection method for wind
turbine blades based on dynamic analysis and mode shape difference curvature
information. Mechanical Systems and Signal Processing, 48, 351-367.