Embed Size (px)
Citation preview
Jurnal Mekanikal June 2007, No. 23, 15 - 30
15
FINITE ELEMENT MODELING OF ARC WELDED JOINTS
Niw Chang Chee*, Abd Rahim Abu Bakar
Department of Aeronautics & Automotive,
Faculty of Mechanical Engineering, Universiti Teknologi Malaysia,
81310 UTM Skudai, Johor Bahru.
ABSTRACT
In the past, researchers did not consider welded joints in their finite element models. This could give large discrepancies to the dynamic characteristics of the structure and consequently would lead to inaccuracies in their predicted results. This paper attempts to present an appropriate way to model welded joints in a structure using the finite element method. First, two single-plate were developed in 3-dimensional finite element model and then were validated using modal analysis. The two plates were joined together to form a single T-joint simple structure that considered arc-welded joints. Dynamic characteristics of the T-joint structure were determined by finite element analysis and experimental modal analysis and the predicted results were then compared with the measured data. Model updating was performed in order to increase accuracy of the predicted results. Finally, comparison of dynamic characteristics of the T-joint were made between rigid joints and arc-welded joints. Keywords: Modal analysis, finite element, correlation, welded joint, model
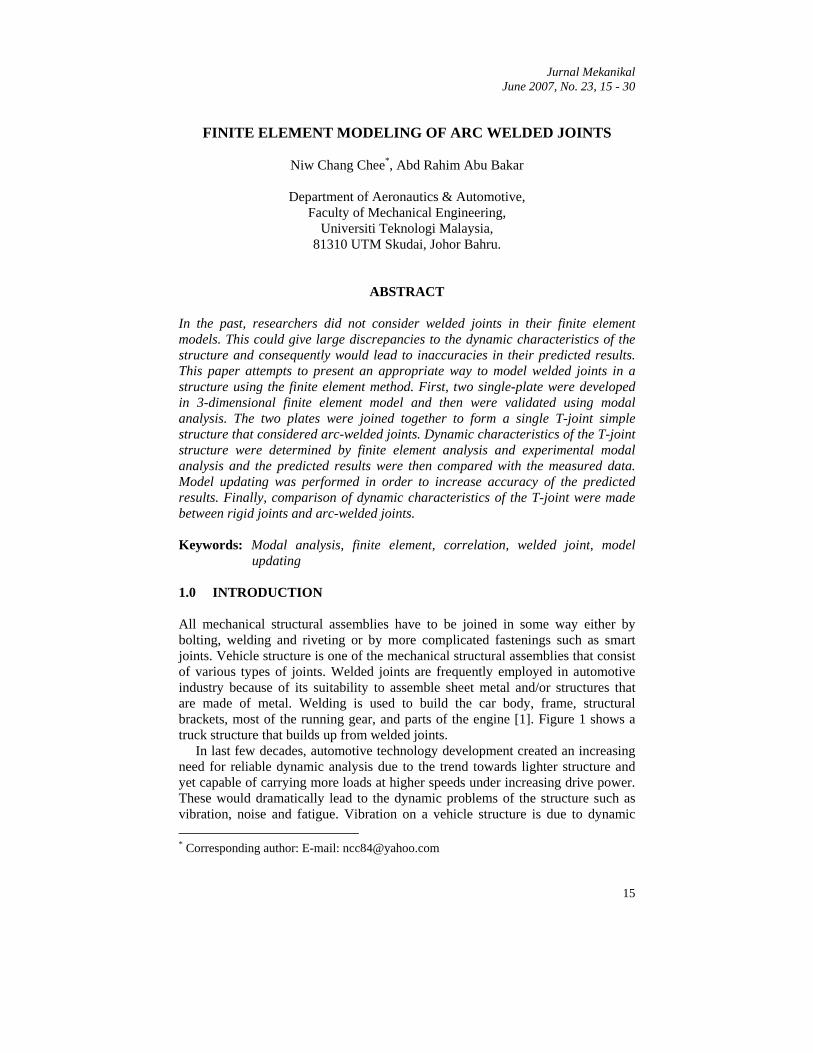
updating 1.0 INTRODUCTION All mechanical structural assemblies have to be joined in some way either by bolting, welding and riveting or by more complicated fastenings such as smart joints. Vehicle structure is one of the mechanical structural assemblies that consist of various types of joints. Welded joints are frequently employed in automotive industry because of its suitability to assemble sheet metal and/or structures that are made of metal. Welding is used to build the car body, frame, structural brackets, most of the running gear, and parts of the engine [1]. Figure 1 shows a truck structure that builds up from welded joints.
In last few decades, automotive technology development created an increasing need for reliable dynamic analysis due to the trend towards lighter structure and yet capable of carrying more loads at higher speeds under increasing drive power. These would dramatically lead to the dynamic problems of the structure such as vibration, noise and fatigue. Vibration on a vehicle structure is due to dynamic * Corresponding author: E-mail: [email protected]
Jurnal Mekanikal, June 2007
16
forces induced by road irregularities, engine, transmission and many more. Under these various dynamic excitation, chassis tends to vibrate and lead to ride discomfort, ride safety problems and the welded joints on structure would be damaged [2]. In addition, flexibility of the joint in the structure could heavily affect structure behavior and due to dynamic loading most of the energy in the structure are lost in the joints [3]. Accurate and reliable vibration analysis tools are required to extract all dynamic properties of the structure. Modal analysis is one of those tools, providing an understanding of structural characteristic, enables designing for optimal dynamic behavior or solving structural dynamics problems in existing designs. Finite element (FE) analysis could be used to simulate noise, vibration and harshness (NVH) issues. The FE model was often compared to the experimental modal analysis (EMA) results in order to achieve high degree of correlation [4].
In the past, a number of researchers did not take into account the effect of welded joints in their model. For instance, Zaman and Rahman [2] investigated dynamic characteristics of a truck structure using the finite element method. A rigid connection was assumed between the cross beam and the main structure. This paper attempts to present an appropriate way to model welded joints in a structure using the finite element method. First, two single-plate were developed using 3-dimensional finite element model and then were validated using modal analysis. The two plates were joined together to form single T-joint simple structure that considered arc-welded joints. Dynamic characteristics of the T-joint structure were determined by finite element analysis and experimental modal analysis and the predicted results were then compared with the measured data. Model updating was performed in order to increase accuracy of the predicted results. Finally, comparison of dynamic characteristics of the T-joint were made between rigid joints and arc-welded joints.
Figure 1: Arc welded joints on a truck chassis 2.0 EXPERIMENTAL MODAL ANALYSIS (EMA) EMA was carried out to obtain the natural frequency and its associated mode shape for plates A and B that will be used to form a T-shape welded joint model.
Jurnal Mekanikal, June 2007
17
After these two plates were joined together using shield metal arc welding, EMA was conducted again on the welded joint model. The results from EMA were used as a comparison for FE results.
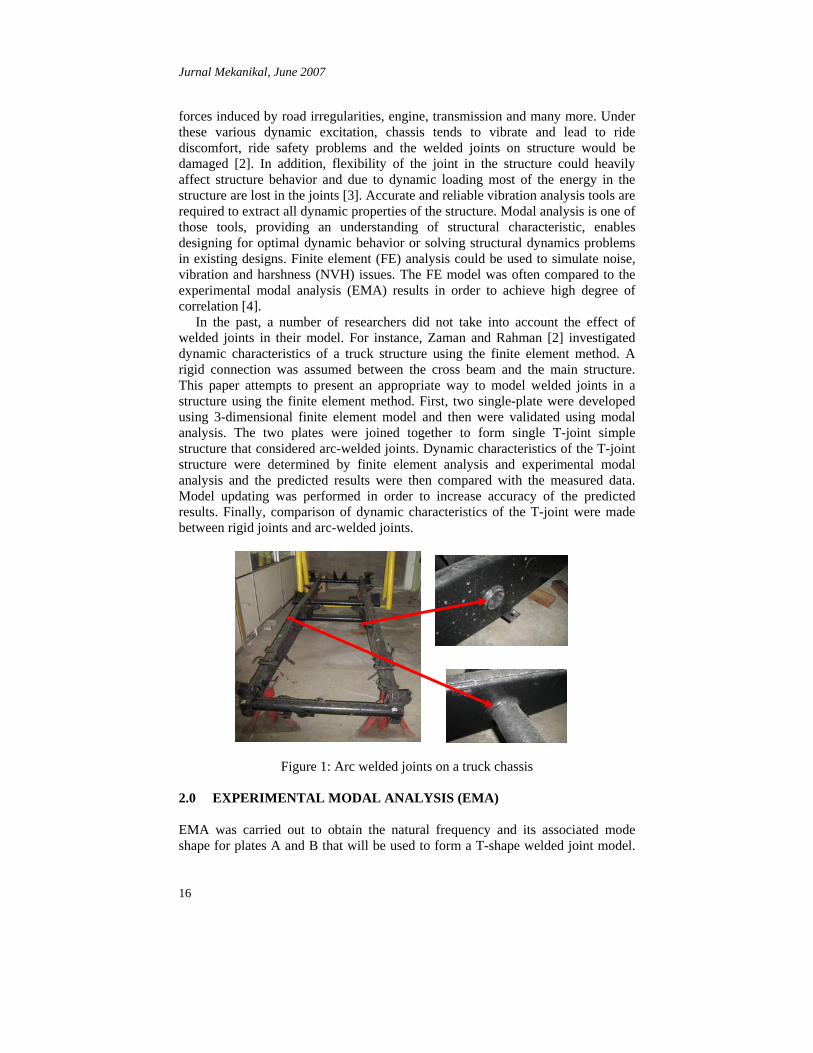
2.1 EMA Test on Single Plate Before the analysis can be carried out, plates A and B were divided into small grid points where at these points Frequency Response Function (FRF) was measured [4]. 25 grid points were used to represent the plate shape since its geometry was simple. The plates A and B have weight of 452 gram and 637 gram, respectively. A Kistler Type 9722A500 impact hammer was used to produce the excitation force on the plate while a Kistler Type 8636C50 uni-axial accelerometer was fix-mounted onto the plate at the area near to point 12 in plates A and B by using beeswax as shown in Figure 2. The uni-axial accelerometer has sensitivity and mass of 100 mV/g and 5.5 gram, respectively. It is also important that the accelerometer should be placed away from the nodes of mode shapes. This is to ensure that the output signal from the accelerometer can be captured.
Figure 2: Element grid of plate A and B
PAK MK II Muller BBM Analyzer was used to measure the signal from impact
hammer and accelerometer and converts it into FRF. The frequency response functions were measured in the range of 0-6000 Hz. The plate was supported by a soft platform (sponge) in order to achieve free-free boundary conditions. The overall experimental setup is illustrated in Figure 3.
Having measured all of the FRFs for 25 points curve fitting was produced using PAK MK II Analyzer in the Universal File Format (UFF). This file was then exported to ME Scope software to extract the modal parameter of a measured plate [5]. In ME Scope, the plate structure was constructed based on the nodal sequence in Figure 2. Accelerometer reference degree of freedom (DOF) point was set to point 12 since the accelerometer was fix-mounted at the area near to point 12. The Roving DOF was referred to the excitation direction. In this test, the hammer hit the plate vertically therefore the Roving DOF is +Z. Complex Exponential Modal Identification method was used to extract the natural frequency and mode shape of the plate.
Accelerometer

Jurnal Mekanikal, June 2007
18
Figure 3: Experimental modal analysis setup
2.2 EMA Test on a T-Shape Welded Joint Model The procedures to carry out the EMA test for this T-shape welded joint are similar to single plate procedures. The T-shape welded joint is shown in Figure 4. This model was divided into 50 small grid points and accelerometer was fix-mounted on the plate as shown in Figure 5. Again, the impact hammer method was applied to produce the excitation force on the model. PAK MK II analyzer converted the signal from impact hammer and accelerometer and transferred it to ME scope software to generate natural frequency and its associated mode shape.
Figure 4: T-shape welded joint Figure 5: Location of accelerometer
Channel 1 (Hammer)
Channel 2 (Accelerometer)
Impact
Accelerometer
PAK MK II Analyzer Laptop
Plate A
Welded joint Plate B
Point 7
Jurnal Mekanikal, June 2007
19
3.0 FINITE ELEMENT ANALYSIS A commercial finite element software package namely, ABAQUS was utilized to generate natural frequency and its corresponding mode shape on plates A and B and the welded joint model. 3.1 Finite Element Analysis on Single Plate A 3-dimensional FE model of the plate was developed using this ABAQUS/CAE (Computer Aided Engineering). Material properties from Table 1 were assigned to the plates A and B respectively. Linear perturbation frequency was used as analysis step to modal analysis on the plate. In this analysis, LANCZOS algorithm was used to analyze the plate because the element size on plate is fine and consists of many DOF. The minimum frequency was set at 1 Hz to avoid the solver from calculating the six rigid body motions which have the frequency of 0 Hz [4]. No constraints and loads were assigned in an attempt to simulate the free-free boundary condition.
In ABAQUS, there are two modeling elements used to represent the 3-dimensional model, which are solid element and shell element. A solid element consists of hexahedral (Hex), tetrahedral (Tet) and wedge elements while a shell element consists of quadrilateral (Quad) and triangular (Tri) elements. All of the 3D element type above were used to model Plate A and B to define the most suitable modeling method on single plate. Global element size that assigned on each type of element is 4 mm which enough to represent the actual model.
Table 1: Material properties for plates A and B
Plate
Length (mm)
Width (mm)
Thickness
(mm)
Density (kg/m3)
Young’s Modulus
(GPa)
Poisson’s
Ratio
A
B
100
140
100
100
6 6
7548.33
7591.67
207
207
0.292
0.292
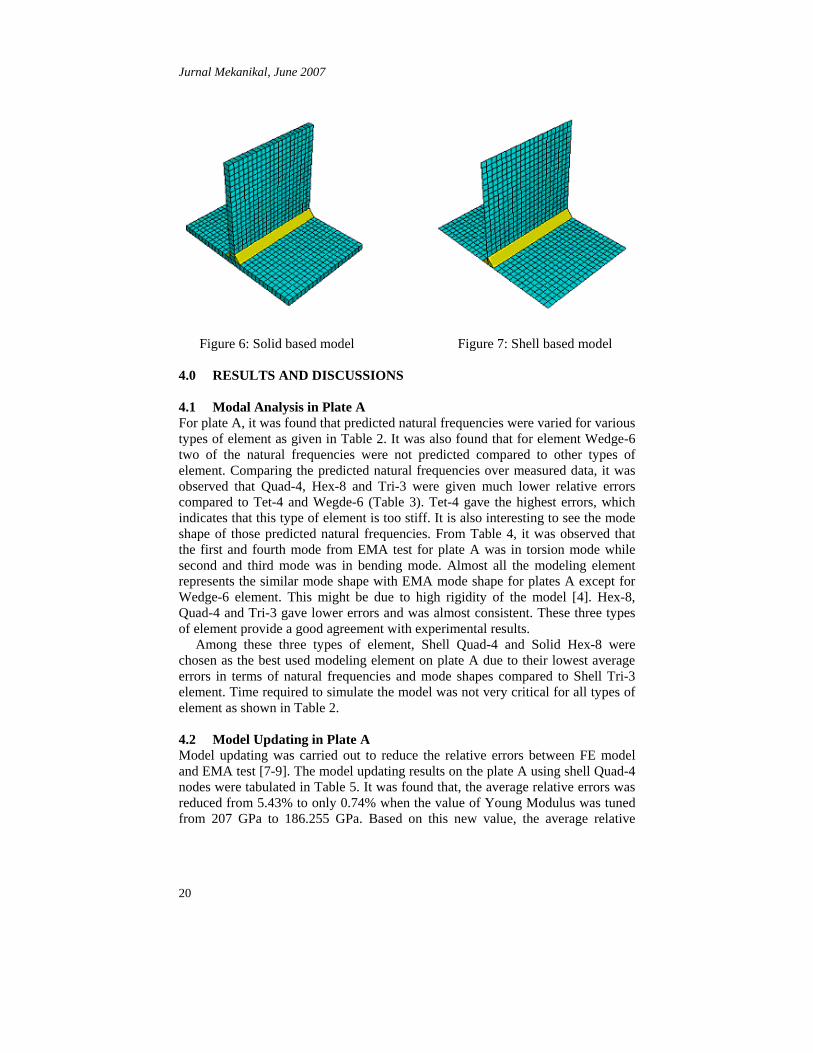
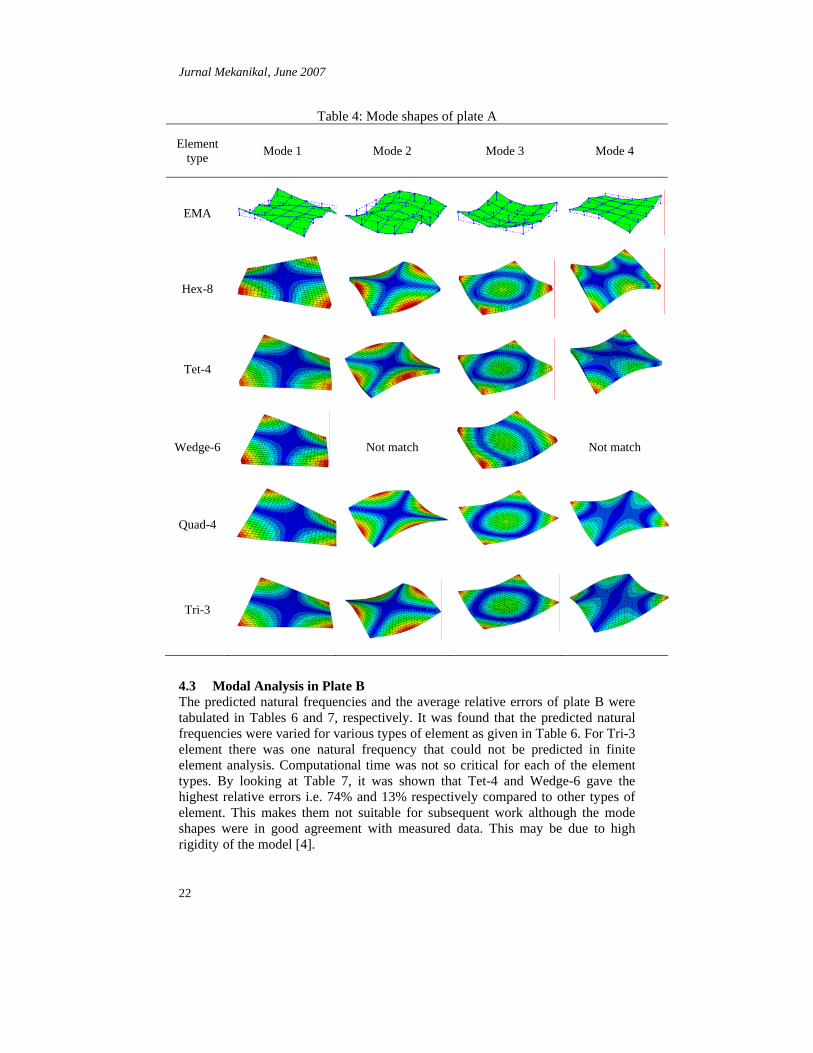
3.2 Finite Element Analysis on a T-Shape Welded Joint Model A 3-dimensional FE model of the T-shaped welded joint was generated using ABAQUS/CAE. Material properties of single plate model given in Table 1 were used in this analysis. The model which used solid element to model plates A and B was called Solid Based Model (Figure 6) while the model using shell element to model plates A and B was called Shell Based Model (Figure 7). Global element size that was assigned on each type of element is 5 mm which enough to represent the actual model.
Jurnal Mekanikal, June 2007
20
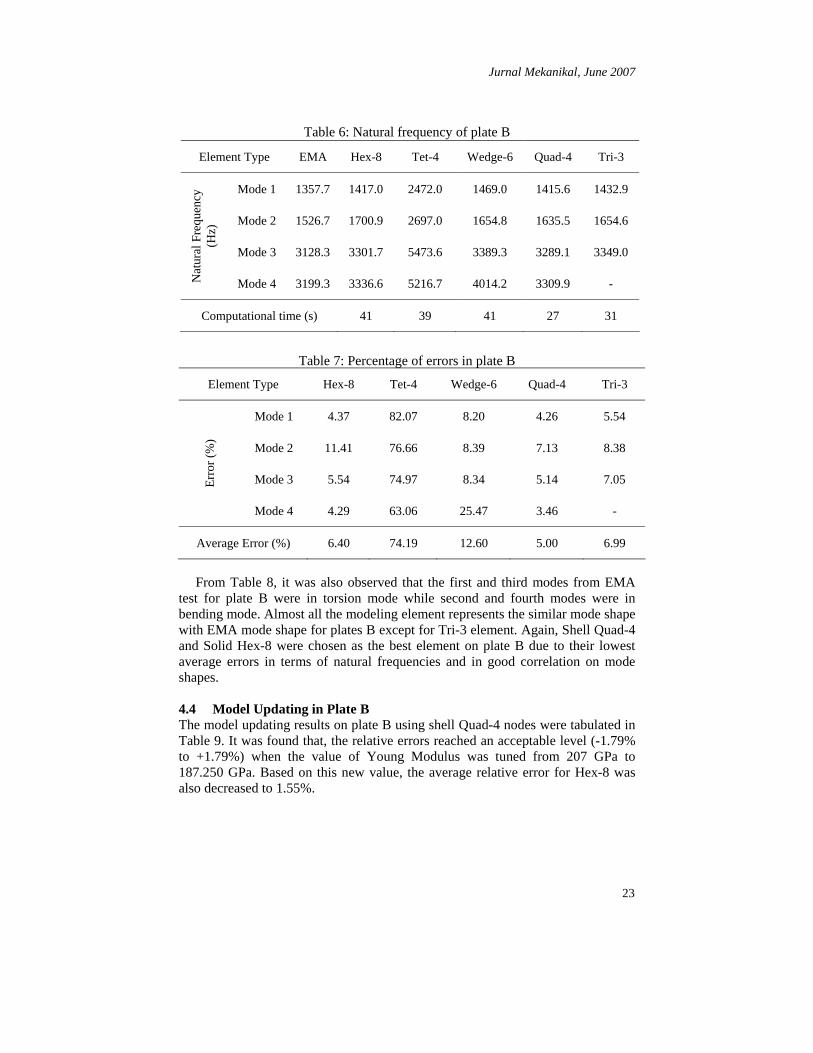
Figure 6: Solid based model Figure 7: Shell based model 4.0 RESULTS AND DISCUSSIONS 4.1 Modal Analysis in Plate A For plate A, it was found that predicted natural frequencies were varied for various types of element as given in Table 2. It was also found that for element Wedge-6 two of the natural frequencies were not predicted compared to other types of element. Comparing the predicted natural frequencies over measured data, it was observed that Quad-4, Hex-8 and Tri-3 were given much lower relative errors compared to Tet-4 and Wegde-6 (Table 3). Tet-4 gave the highest errors, which indicates that this type of element is too stiff. It is also interesting to see the mode shape of those predicted natural frequencies. From Table 4, it was observed that the first and fourth mode from EMA test for plate A was in torsion mode while second and third mode was in bending mode. Almost all the modeling element represents the similar mode shape with EMA mode shape for plates A except for Wedge-6 element. This might be due to high rigidity of the model [4]. Hex-8, Quad-4 and Tri-3 gave lower errors and was almost consistent. These three types of element provide a good agreement with experimental results.
Among these three types of element, Shell Quad-4 and Solid Hex-8 were chosen as the best used modeling element on plate A due to their lowest average errors in terms of natural frequencies and mode shapes compared to Shell Tri-3 element. Time required to simulate the model was not very critical for all types of element as shown in Table 2. 4.2 Model Updating in Plate A Model updating was carried out to reduce the relative errors between FE model and EMA test [7-9]. The model updating results on the plate A using shell Quad-4 nodes were tabulated in Table 5. It was found that, the average relative errors was reduced from 5.43% to only 0.74% when the value of Young Modulus was tuned from 207 GPa to 186.255 GPa. Based on this new value, the average relative

Jurnal Mekanikal, June 2007
21
errors for Hex-8 also decreased from 6.79% to 0.95%. This indicated that after model updating was carried a much better predicted results were achieved.
Table 2: Natural frequency of plate A
Table 3: Percentage of errors in plate A
Table 5: Predicted natural frequencies for plate A after model updating
Quad-4 Hex-8
Mode Frequency (Hz) Error (%) Frequency
(Hz) Error (%)
1 1881.6 -1.11 1881.7 -1.11
2 2784.1 -0.49 2829.1 1.12
3 3420.1 1.11 3341.0 -1.22
4 4804.8 -0.23 4798.2 -0.37
Average error (%) 0.74 0.95
Solid Element Shell Element Element Type
EMA
Hex-8 Tet-4 Wedge-6 Quad-4 Tri-3
Mode 1 1902.8 1987.4 3346.4 2067.7 1986.3 2013.5
Mode 2 2797.9 3153.1 4625.7 - 2939.4 3007.3
Mode 3 3382.4 3514.5 5381.0 4104.4 3613.7 3619.9
Nat
ural
Fre
quen
cy
(Hz)
Mode 4 4816.1 5111.3 7926.8 - 5077.6 5189.9
*Computational time (s) 30 32 30 26 27
* This computational time is based on Pentium III 866 MHz 512 SDRAM
Element Type Hex-8 Tet-4 Wedge-6 Quad-4 Tri-3
Mode 1 4.45 75.87 8.67 4.39 5.82
Mode 2 12.70 65.33 - 5.06 7.48
Mode 3 3.91 59.09 21.35 6.84 7.02 Erro
r (%
)
Mode 4 6.13 64.59 - 5.43 7.76
Average Error (%) 6.79 66.22 15.01 5.43 7.02
Jurnal Mekanikal, June 2007
22
Table 4: Mode shapes of plate A
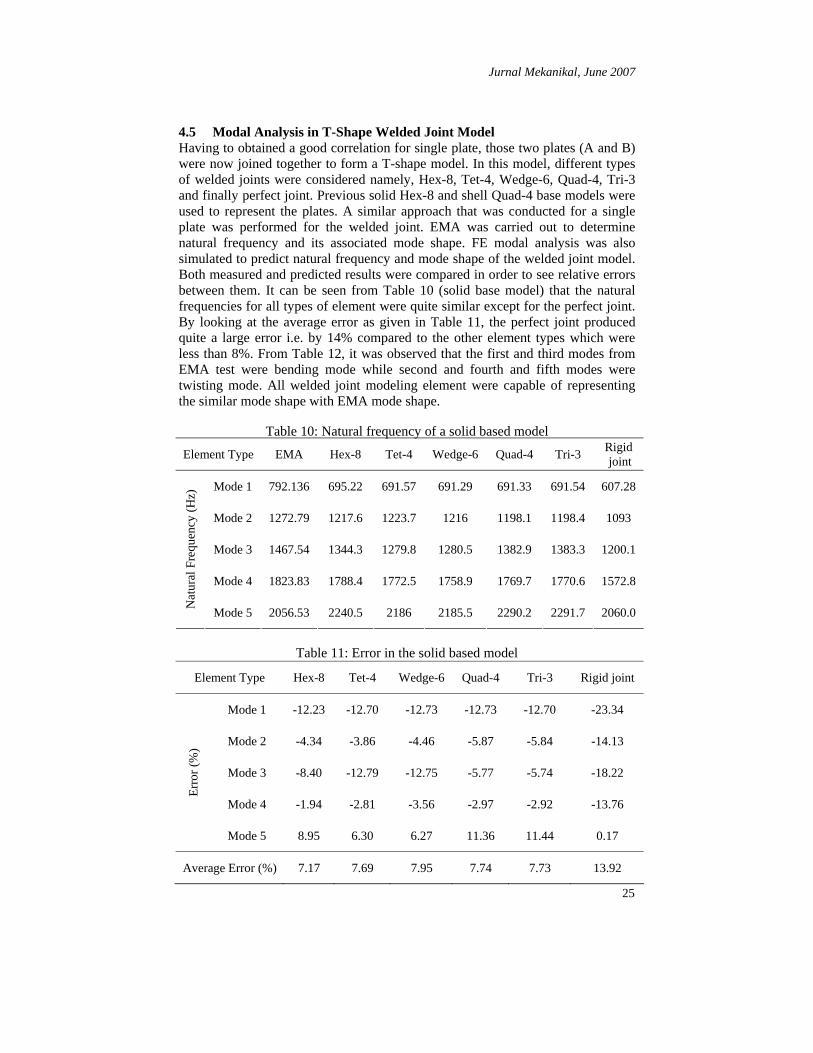
4.3 Modal Analysis in Plate B The predicted natural frequencies and the average relative errors of plate B were tabulated in Tables 6 and 7, respectively. It was found that the predicted natural frequencies were varied for various types of element as given in Table 6. For Tri-3 element there was one natural frequency that could not be predicted in finite element analysis. Computational time was not so critical for each of the element types. By looking at Table 7, it was shown that Tet-4 and Wedge-6 gave the highest relative errors i.e. 74% and 13% respectively compared to other types of element. This makes them not suitable for subsequent work although the mode shapes were in good agreement with measured data. This may be due to high rigidity of the model [4].
Element type Mode 1 Mode 2 Mode 3 Mode 4
EMA
Hex-8
Tet-4
Wedge-6
Not match
Not match
Quad-4
Tri-3
Jurnal Mekanikal, June 2007
23
Table 6: Natural frequency of plate B
Table 7: Percentage of errors in plate B
From Table 8, it was also observed that the first and third modes from EMA test for plate B were in torsion mode while second and fourth modes were in bending mode. Almost all the modeling element represents the similar mode shape with EMA mode shape for plates B except for Tri-3 element. Again, Shell Quad-4 and Solid Hex-8 were chosen as the best element on plate B due to their lowest average errors in terms of natural frequencies and in good correlation on mode shapes. 4.4 Model Updating in Plate B The model updating results on plate B using shell Quad-4 nodes were tabulated in Table 9. It was found that, the relative errors reached an acceptable level (-1.79% to +1.79%) when the value of Young Modulus was tuned from 207 GPa to 187.250 GPa. Based on this new value, the average relative error for Hex-8 was also decreased to 1.55%.
Element Type EMA Hex-8 Tet-4 Wedge-6 Quad-4 Tri-3
Mode 1 1357.7 1417.0 2472.0 1469.0 1415.6 1432.9
Mode 2 1526.7 1700.9 2697.0 1654.8 1635.5 1654.6
Mode 3 3128.3 3301.7 5473.6 3389.3 3289.1 3349.0
Nat
ural
Fre
quen
cy
(Hz)
Mode 4 3199.3 3336.6 5216.7 4014.2 3309.9 -
Computational time (s) 41 39 41 27 31
Element Type Hex-8 Tet-4 Wedge-6 Quad-4 Tri-3
Mode 1 4.37 82.07 8.20 4.26 5.54
Mode 2 11.41 76.66 8.39 7.13 8.38
Mode 3 5.54 74.97 8.34 5.14 7.05 Erro
r (%
)
Mode 4 4.29 63.06 25.47 3.46 -
Average Error (%) 6.40 74.19 12.60 5.00 6.99

Jurnal Mekanikal, June 2007
24
Table 8: Mode shape of plate B
Table 9: Predicted natural frequencies for plate B after model updating
Element type Mode 1 Mode 2 Mode 3 Mode 4
EMA
Hex-8
Tet-4
Wedge-6
Quad-4
Tri-3
Not match
Quad-4 Hex-8
Mode Frequency
(Hz) Error (%)
Frequency
(Hz) Error (%)
1 1345.0 -0.94 1345.1 -0.93
2 1554.1 1.79 1560.3 2.20
3 3122.8 -0.18 3111.1 -0.55
4 3142.1 -1.79 3118.4 -2.53
Average error (%) 1.17 1.55
Jurnal Mekanikal, June 2007
25
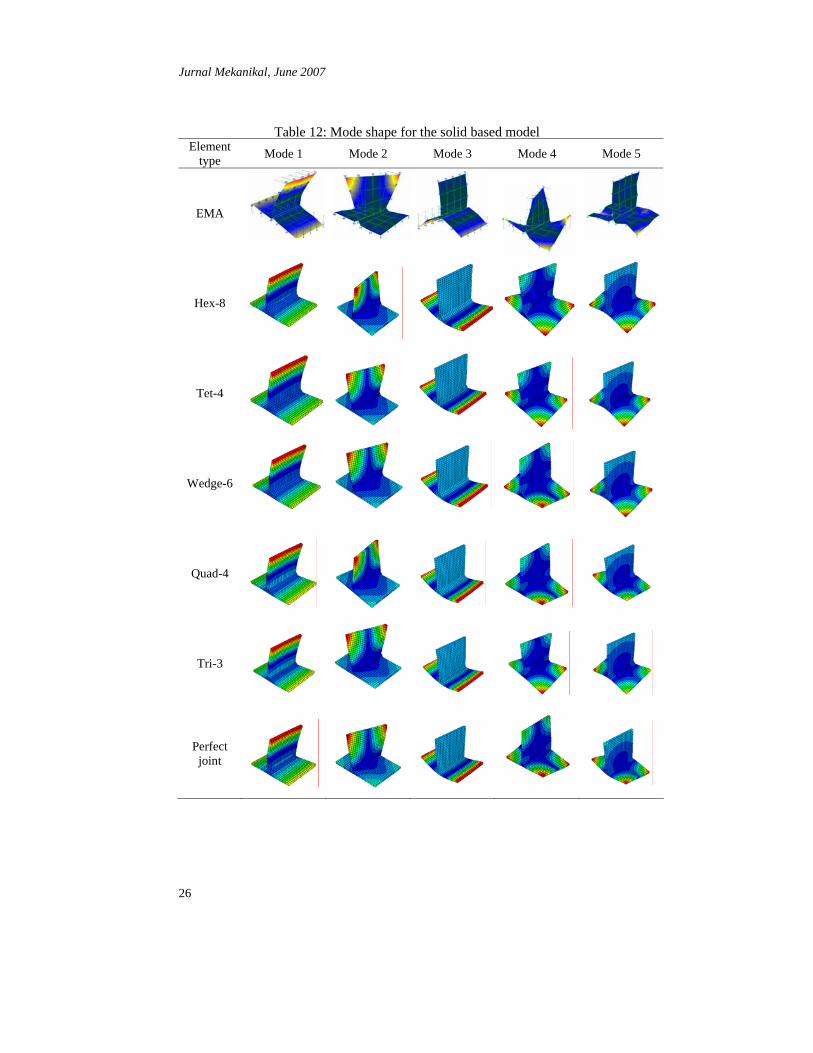
4.5 Modal Analysis in T-Shape Welded Joint Model Having to obtained a good correlation for single plate, those two plates (A and B) were now joined together to form a T-shape model. In this model, different types of welded joints were considered namely, Hex-8, Tet-4, Wedge-6, Quad-4, Tri-3 and finally perfect joint. Previous solid Hex-8 and shell Quad-4 base models were used to represent the plates. A similar approach that was conducted for a single plate was performed for the welded joint. EMA was carried out to determine natural frequency and its associated mode shape. FE modal analysis was also simulated to predict natural frequency and mode shape of the welded joint model. Both measured and predicted results were compared in order to see relative errors between them. It can be seen from Table 10 (solid base model) that the natural frequencies for all types of element were quite similar except for the perfect joint. By looking at the average error as given in Table 11, the perfect joint produced quite a large error i.e. by 14% compared to the other element types which were less than 8%. From Table 12, it was observed that the first and third modes from EMA test were bending mode while second and fourth and fifth modes were twisting mode. All welded joint modeling element were capable of representing the similar mode shape with EMA mode shape.
Table 10: Natural frequency of a solid based model
Table 11: Error in the solid based model
Element Type EMA Hex-8 Tet-4 Wedge-6 Quad-4 Tri-3 Rigid joint
Mode 1 792.136 695.22 691.57 691.29 691.33 691.54 607.28
Mode 2 1272.79 1217.6 1223.7 1216 1198.1 1198.4 1093
Mode 3 1467.54 1344.3 1279.8 1280.5 1382.9 1383.3 1200.1
Mode 4 1823.83 1788.4 1772.5 1758.9 1769.7 1770.6 1572.8
Nat
ural
Fre
quen
cy (H
z)
Mode 5 2056.53 2240.5 2186 2185.5 2290.2 2291.7 2060.0
Element Type Hex-8 Tet-4 Wedge-6 Quad-4 Tri-3 Rigid joint
Mode 1 -12.23 -12.70 -12.73 -12.73 -12.70 -23.34
Mode 2 -4.34 -3.86 -4.46 -5.87 -5.84 -14.13
Mode 3 -8.40 -12.79 -12.75 -5.77 -5.74 -18.22
Mode 4 -1.94 -2.81 -3.56 -2.97 -2.92 -13.76
Erro
r (%
)
Mode 5 8.95 6.30 6.27 11.36 11.44 0.17
Average Error (%) 7.17 7.69 7.95 7.74 7.73 13.92
Jurnal Mekanikal, June 2007
26
Table 12: Mode shape for the solid based model
Element type Mode 1 Mode 2 Mode 3 Mode 4 Mode 5
EMA
Hex-8
Tet-4
Wedge-6
Quad-4
Tri-3
Perfect joint
Jurnal Mekanikal, June 2007
27
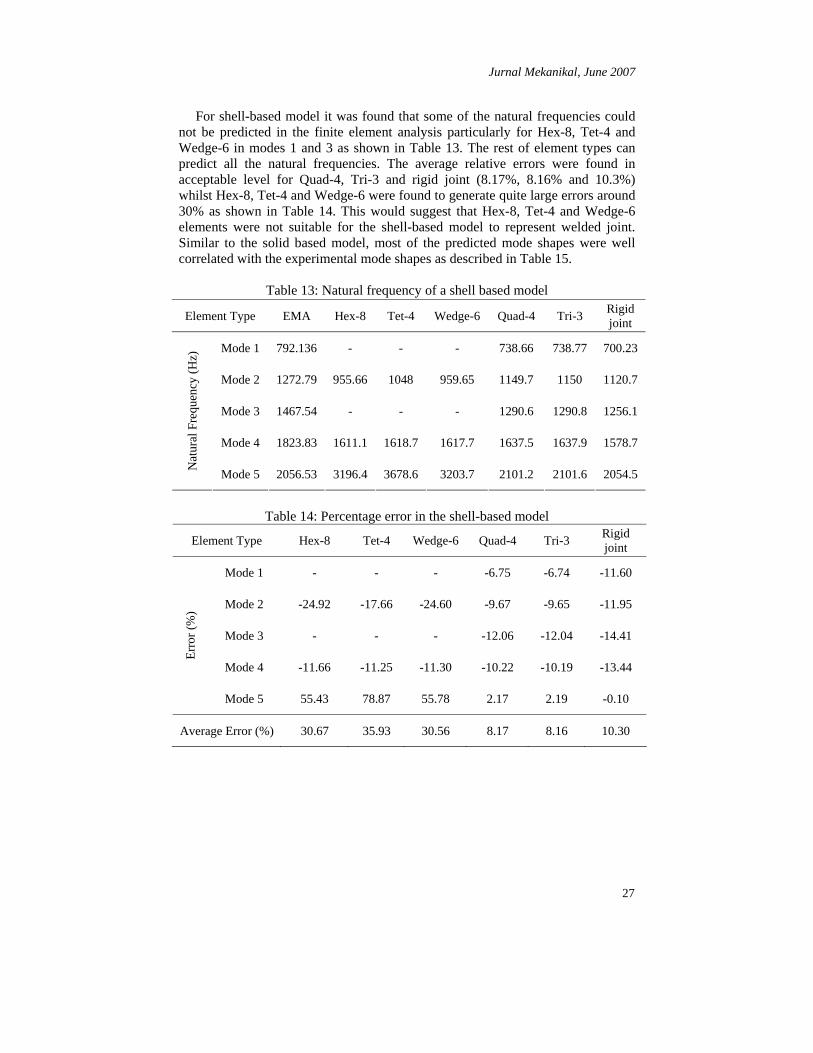
For shell-based model it was found that some of the natural frequencies could not be predicted in the finite element analysis particularly for Hex-8, Tet-4 and Wedge-6 in modes 1 and 3 as shown in Table 13. The rest of element types can predict all the natural frequencies. The average relative errors were found in acceptable level for Quad-4, Tri-3 and rigid joint (8.17%, 8.16% and 10.3%) whilst Hex-8, Tet-4 and Wedge-6 were found to generate quite large errors around 30% as shown in Table 14. This would suggest that Hex-8, Tet-4 and Wedge-6 elements were not suitable for the shell-based model to represent welded joint. Similar to the solid based model, most of the predicted mode shapes were well correlated with the experimental mode shapes as described in Table 15.
Table 13: Natural frequency of a shell based model
Table 14: Percentage error in the shell-based model
Element Type EMA Hex-8 Tet-4 Wedge-6 Quad-4 Tri-3 Rigid joint
Mode 1 792.136 - - - 738.66 738.77 700.23
Mode 2 1272.79 955.66 1048 959.65 1149.7 1150 1120.7
Mode 3 1467.54 - - - 1290.6 1290.8 1256.1
Mode 4 1823.83 1611.1 1618.7 1617.7 1637.5 1637.9 1578.7
Nat
ural
Fre
quen
cy (H
z)
Mode 5 2056.53 3196.4 3678.6 3203.7 2101.2 2101.6 2054.5
Element Type Hex-8 Tet-4 Wedge-6 Quad-4 Tri-3 Rigid joint
Mode 1 - - - -6.75 -6.74 -11.60
Mode 2 -24.92 -17.66 -24.60 -9.67 -9.65 -11.95
Mode 3 - - - -12.06 -12.04 -14.41
Mode 4 -11.66 -11.25 -11.30 -10.22 -10.19 -13.44
Erro
r (%
)
Mode 5 55.43 78.87 55.78 2.17 2.19 -0.10
Average Error (%) 30.67 35.93 30.56 8.17 8.16 10.30

Jurnal Mekanikal, June 2007
28
Table 15: Mode shape for a shell based model
Element type Mode 1 Mode 2 Mode 3 Mode 4 Mode 5
EMA
Hex-8 Not match
Not match
Tet-4 Not match
Not match
Wedge-6 Not match
Not match
Quad-4
Tri-3
Perfect Joint

Jurnal Mekanikal, June 2007
29
4.6 Model Updating in T-Shape Welded Joint Model updating was conducted based on the previous solid based model as it gave much better correlation against experimental results compared to the shell based model. The Young’s Modulus value from this model updating was used to update the relative error for Hex-8, Tri-3, Tet-4 and Quad-4 element model. Results of model updating for T-shape welded joint model was tabulated in Table 16.
It was indicated that the relative errors for Hex-8 is in an acceptable level (-10.94% to +10.94%) when the value of Young Modulus for welded joint was tuned from 207 GPa to 530.35 GPa. The Young Modulus value for welded joint was higher than Plates A and B. This is because normally weld metal is stronger than the based metal [6]. Based on this new value, the average relative errors for those all types of welded model decreased after model updating. The computational time for each type of element was found not very critical. The procedures to analyze the T-shape welded joint model using solid type elements at welded joint were easier than using shell element at welded joint especially during assembly and meshing process. It can be concluded that these four element types were suitable to represent welded joint in the finite element model.
Table 16: Model updating of T-shape model
5.0 CONCLUSIONS This paper attempts to provide an appropriate way to model welded joints in the finite element model. Firstly, single two-plate structure was developed and validated in terms of natural frequency and its corresponding mode shape. Various types of element that available in ABAQUS software were explored. It was found that Quad-4 and Hex-8 gave better correlation compared to other types of element. Then these two plates were joined together to form a T-shape FE model. Again, various types of element were employed to represent welded joint in two different based model namely, solid and shell. Having simulated the dynamic characteristics of the T-shape model it was found that about four element types were considered suitable for representing welded joint in the solid based model i.e.
Hex-8 Tri-3 Tet-4 Quad-4 Mode Initial
(%) Updated
(%) Initial (%)
Updated (%)
Initial (%)
Updated (%)
Initial (%)
Updated (%)
1 -12.23 -10.94 -12.70
-11.65 -12.70
-11.41 -12.73 -11.43
2 -4.34 -1.89 -5.84 -1.17 -3.86 -3.06 -5.87 -3.07
3 -8.40 -5.99 -5.74 -11.12 -12.79
-3.33 -5.77 -3.35
4 -1.94 1.65 -2.92 0.92 -2.81 1.16 -2.97 1.13
5 8.95 10.94 11.44 7.77 6.30 14.11 11.36 14.06
Average error (%) 7.17 6.28 7.73 6.53 7.69 6.61 7.74 6.61
Computational time (s)
28 29 32 32
Jurnal Mekanikal, June 2007
30
Hex-8, Tri-3, Quad-4 and Tet-4. Perfect joint seemed to generate quite large errors in the predicted natural frequencies.
ACKNOWLEDGEMENT The author would like to thank Mr. Elfandy Jamaluddin and Mr. Jaafar for their assistance in the experimental work.
REFERENCES 1. Sacks, R.J. and Bohnart, E.R., 2005. Welding: principles and practice, 3rd Ed.,
McGraw-Hill, Boston, USA. 2. Zaman, I. and Rahman, R.A., 2006. Application of dynamic correlation
technique and model updating on truck chassis, Proceeding of 1st Regional Conference on Vehicle Engineering and Technology, Putra World Trade Centre (PWTC).
3. Segalman, D.J., Paez, T., Smallwood, D., Sumali, A. and Arbina, A., 2003. Status and integrated road-map for joints modeling research, Technical Report AND2003-0897, Sandia National Laboratories, New Mexico,USA.
4. Rahman, A.R., Zubair, M. and Amin, N., 2003. Finite element modeling, correlation and model updating of stiffened plate, Jurnal Mekanikal, 16, 91-106.
5. ME Scope Ves Version 3, 2001. Vibrant Technology, Inc. 6. Kiang, T.J., 2005. Experimental and finite element investigation of the tensile
characteristic of a single v-groove arc welded joint of metal plate structure, Thesis Sarjana Muda, Skudai, Universiti Teknologi Malaysia.
7. Motthershead, J.E. and Friswell, M.I., 1993. Model updating in structural dynamics, Journal of Sound and Vibration, 167(2), 347-375.
8. Chen, G. and Edwin, D.J., 2001. Verification of FE models for model updating, Proceedings of SPIE, the International Society for Optical Engineering, 4359 (1), 385-391.
9. Donley, M. and Stokes, W., 1997. The use of pre-test analysis procedures for FE model/test correlation of a transmission side cover, SAE Technical Paper 972023.