Embed Size (px)
Citation preview

Journal of Mechanical Engineering and Sciences (JMES)
ISSN (Print): 2289-4659; e-ISSN: 2231-8380; Volume 8, pp. 1414-1425, June 2015
© Universiti Malaysia Pahang, Malaysia
DOI: http://dx.doi.org/10.15282/jmes.8.2015.16.0138
1414
FINITE ELEMENT-BASED FATIGUE LIFE PREDICTION OF A LOAD-
CARRYING CRUCIFORM JOINT
M.A. Mohamed1,2*
, Y.H.P. Manurung2, F.A. Ghazali
2 and A.A. Karim
2
1University Kuala Lumpur Malaysia France Institute (UNIKL MFI),
Bandar Baru Bangi, Selangor, Malaysia Email: *
Phone: +603 8926 2022; Fax: +603 8925 8845 2Faculty of Mechanical Engineering, Universiti Teknologi MARA (UiTM),
40450, Shah Alam, Selangor, Malaysia
ABSTRACT
The aim of this study is to determine the stress intensity factor (SIF) and fatigue
lifecycle of load-carrying 6 mm-thick fillet-welded cruciform joints subjected to fatigue
loading conditions by means of finite element analysis (FEA). These joints are typical
of automotive structures such as the mid-series rear axle of motor trucks which are
sensitive to fatigue loading because of their construction and loading conditions. Finite
element software was used to develop various cruciform joint models with varying
geometrical dimensions, namely the depth of penetration and weld throat length, and
simulation and analysis of the crack propagation were performed with 2D and 3D crack
simulation software. The effect of the variations in the weld geometry with an induced
crack at the weld root and weld toe on fatigue life was determined from the simulation
results. The stress intensity factor values and lifecycles determined by the fracture
mechanics approach were compared with the simulation results. It was shown that an
increase in the depth of weld penetration and the weld size in isosceles triangles fillet
weld shape for crack initiated in the weld root can decrease the stress intensity factor
(SIF) and intensify the fatigue lifecycle. It was also found that linear misalignment had
no significant effect on the SIF and fatigue life of cracks originating from the weld toe.
Keywords: Cruciform welded joint; lack of penetration; SIF; fatigue; FRANC 2D/3D.
INTRODUCTION
The governing parameter for fatigue life estimation by fracture mechanics is the stress
intensity factor (SIF), which indicates the stress intensity at the tip of the propagating
crack assuming that cracks already exist in welded joints [1]. When the Paris equation is
used for calculating the fatigue life of welded joints, precise determination of the SIF is
a necessity [1-3]. High stress concentrations normally occur at the vicinity of the weld
toe and weld root in typical welded joints, enabling fatigue cracks to originate in these
regions. Toe cracks and lack of penetration (LOP) are a common defect in parallel
joints. Toe cracks occur because of the stress concentration in the weld toe region, and
LOP defects result from the inaccessibility of the root region during welding [2]. For
load-carrying cruciform welded joints, LOP is considered the initial crack and plays an
important role in the fatigue life of these joints [2, 4].

Mohamed et al. / Journal of Mechanical Engineering and Sciences 8(2015) 1414-1425
1415
Fatigue resistance prediction is a major concern in the welded design of
mechanical components and engineering structures subjected to cyclic loading.
Numerous works have used several approaches to estimate fatigue crack propagation
and fatigue life by means of experimentation and FEA [3, 5-7]. Branco et al. [8] applied
the adaptive remeshing technique based on the finite element method to evaluate crack
shape evolution and fatigue life. The fatigue life of cruciform joints with lack of
penetration with different welding process was investigated by Balasubramanian and
Guha [9]. A finite element modeling procedure for predicting fatigue crack growth rate
in butt welds subjected to mode I loading condition was studied by Lee and Chang [10].
The weld-induced residual stress effect on the fatigue crack growth rate was then
modeled by calculating the SIF owed to the residual stress field based on the
superposition rule of linear elastic fracture mechanics (LEFM). Investigations on the
fatigue fracture behavior of a 30 mm-thick cruciform welded joint with groove indicated
a fatigue strength of 80 MPa and the fatigue crack source of the failed specimen
originating from the weld toe [11].
Investigations of the effects of varying the geometry of weldment on SIF are
scarce. Moreover, certain geometrical parameters such as the leg length ratio and the
throat size have not yet been sufficiently investigated. Several researches on the effect
of weld geometry have mainly concentrated on the weld flank angle, weld toe radius
and weld throat thickness with equal leg length on both sides of plates (cross-plate and
main plate) of non-load-carrying cruciform joints [12, 13]. The importance of SIF as a
governing factor in fatigue life computation has been further established by numerous
investigations focusing on fatigue life prediction and SIF calculations of fillet-welded
joints and considering failures in the weld toe and root region [1, 2, 4, 14]. Hence this
study focuses on the determination of SIF and fatigue lifecycles for 6 mm-thick load-
carrying fillet-welded cruciform joints subjected to fatigue loading conditions by means
of FEA using 2D and 3D crack simulation software through variations in the weld
geometry with an induced crack at the weld root and weld toe.
METHODS AND MATERIALS
Stress Intensity Factor of Load-Carrying Cruciform Joint
The determination of the fatigue lifecycle of a welded structure is based on SIF
computation in accordance with the initial crack caused by cyclic slips or welding flaws.
The unpenetrated zone in partially penetrated T-butt welds is regarded as an initial
crack. Therefore, the SIF ensuing from this zone is very much influenced by the
geometry details and has a substantial effect on fatigue lifecycle behavior [1, 2, 4]. An
empirical formula based on the results of finite element analysis (FEA) was introduced
by Frank and Fisher [15] to calculate the SIF of fatigue cracks that originate from weld
roots. A stress range computation formula was proposed for fatigue crack propagation
analysis enabling the determination of the fatigue strength [2].
A polynomial expression for the SIF range (dK) for a crack at the weld root in
the case of an isosceles weld shape of a load carrying a cruciform joint developed by
Frank and Fisher [15] and is given as:

Finite element-based fatigue life prediction of a load-carrying cruciform joint
1416
p
R
t
H
wa
a
w
aAAS
K
21
)2/cos()( 22
1
(1)
The International Institute of Welding (IIW) [16] adopted Frank and Fisher's
formula for the SIF which is valid for H/tp from 0.2 to 1.2 and for w
a from 0.0 to 0.7,
where H is the leg length, pt is plate thickness,
1A and 2A are function of x and
RS =
nominal stress range in the main plate
2
ptHw (2)
pt
Hx (3)
5432
1 415.0875.1696.3361.4287.3528.0 xxxxxA (4)
5432
1 783.1755.7122.1317.10717.2218.0 xxxxxA (5)
Subsequently the Paris equation was applied to calculate fatigue life. However
since the mathematical integration is difficult to solve, fatigue life was determined by
the numerical integration method where the stress intensity factor value was calculated
from Eq. (1). In sheets with thicknesses less than 20 mm, the influence of residual
stresses on SIF and fatigue life has been assumed as negligible although some research
supposed that residual stresses are relieved [17]. In addition, the crack was assumed to
remain open as in Mode-1 during cyclic loading because of the amount of tensile
residual stress caused by welding in as-welded conditions. Therefore, the SIF's range
corresponding to the nominal stress range is effective and independent of the R-ratio of
nominal stresses.
Finite Element Modeling
In this study, fracture analysis codes (FRANC 2D and FRANC 3D) have been
employed to compute the SIFs for load-carrying cruciform welded joints. A further
comparison is made between the fracture analysis code computation and analytical
calculations. The fracture analysis two-dimensional code (FRANC 2D) is a finite
element-based simulator for curvilinear crack propagation in planar structures (plane
stress, plane strain, and axisymmetric). The mesh creation was generated by a CASCA
preprocessor which is able to analyze a cracked body by defining the singularity ahead
of the crack tip and employing distinctive isoperimetric crack tip elements. The base
and weld metal used for this study was assumed to be isotropic and linear elastic and the
mechanical properties are shown in Table 1. Appropriate benchmarking for the possible
influence of crack growth increments, symmetry and mesh density was conducted. All
the sub-divided regions in the 2D model were built with rectangular bilinear four-sided
meshing and the 3D model was meshed using sweep hexagon meshing and ANSYS
APDL FEA software. The developed model was inserted into FRANC 2D and FRANC
3D for preprocessing and the material properties, constraints and loading conditions
were defined as depicted in Table 1.
Mohamed et al. / Journal of Mechanical Engineering and Sciences 8(2015) 1414-1425
1417
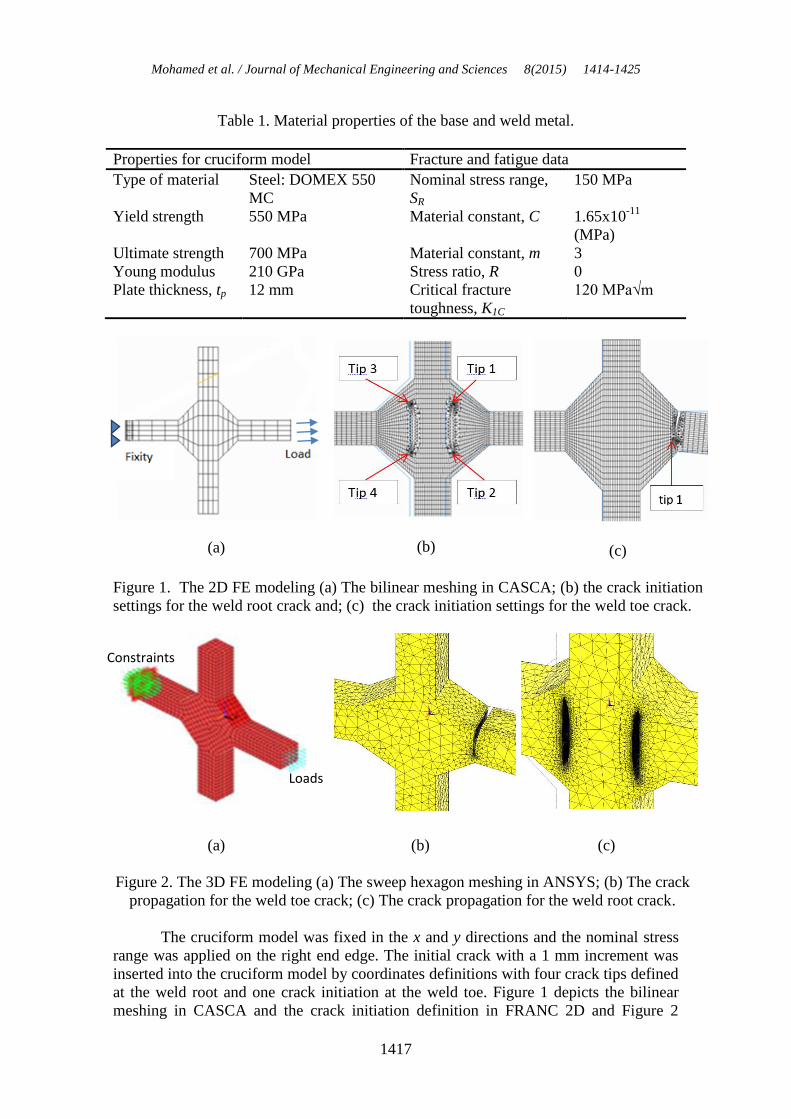
Table 1. Material properties of the base and weld metal.
Properties for cruciform model Fracture and fatigue data
Type of material Steel: DOMEX 550
MC
Nominal stress range,
SR
150 MPa
Yield strength 550 MPa Material constant, C 1.65x10⁻¹¹
(MPa)
Ultimate strength 700 MPa Material constant, m 3
Young modulus 210 GPa Stress ratio, R 0
Plate thickness, tp 12 mm Critical fracture
toughness, K1C
120 MPa√m
(a)
(b)
(c)
Figure 1. The 2D FE modeling (a) The bilinear meshing in CASCA; (b) the crack initiation
settings for the weld root crack and; (c) the crack initiation settings for the weld toe crack.
(a) (b) (c)
Figure 2. The 3D FE modeling (a) The sweep hexagon meshing in ANSYS; (b) The crack
propagation for the weld toe crack; (c) The crack propagation for the weld root crack.
The cruciform model was fixed in the x and y directions and the nominal stress
range was applied on the right end edge. The initial crack with a 1 mm increment was
inserted into the cruciform model by coordinates definitions with four crack tips defined
at the weld root and one crack initiation at the weld toe. Figure 1 depicts the bilinear
meshing in CASCA and the crack initiation definition in FRANC 2D and Figure 2
Constraints
Loads

Finite element-based fatigue life prediction of a load-carrying cruciform joint
1418
shows the sweep hexagon meshing with stress distribution used in ANSYS APDL with
the initiated weld root cracks designed for preprocessing in FRANC 3D . The
geometrical dimensions of the cruciform joint are depicted in Figure 3. The main
purpose of this work is to show the validity of the 2D and 3D programs for calculating
accurately the SIF in welded joints which is used to calculate fatigue life. Hence, with
knowledge of the SIF at different crack depths (a), it is possible to make curve fits for
KI (a) for different loadings because of the linear relation between the SIF and load.
Table 2 lists different geometrical parameters that were used, including linear
misalignment, crack length, weld size, toe-leg length, leg length ratio and assessment
methods. Moreover, the unpenetrated line, LOP, was treated as an initial crack (2a) for
the crack initiation from the weld root and a 1 mm-deep crack was initiated for all
geometrical variations in the weld toe crack. A total of nine geometrical variations were
analyzed for the cracks initiating from the weld root and a total of 14 geometrical
variations were used to investigate the crack propagation from the weld toe.
Figure 3. Boundary conditions and cruciform joint dimensions
Table 2. Weld geometry dimensional variations for weld root and weld toe crack
initiation.
Total
geometries
Crack
length
(mm)
Leg
length, Ha
(mm)
Leg length
ratio
Misalignment
(%)
Assessment
methods
9 (root
crack)
6, 8, 10 6, 9, 12 1 - FRANC 2D,
FRANC 3D and
Analytical
14 (toe
crack)
1 7, 9, 10.5,
12
0.58, 0.75,
0.875, 1.0,
1.14, 1.33, 1.7
0, 15 FRANC 2D and
FRANC 3D
RESULTS AND DISCUSSION
Cracks initiating in a cruciform joint with fillet welds largely exist in the main plate
surface in the vicinity of the weld transition toe and at the weld root. The first crack
propagates through the main plate, whereas the second one propagates through the weld
throat [18]. The maximum hoop stress theory was employed in the 2D and 3D
computation during the initial stage of investigating the SIFs versus crack length for

Mohamed et al. / Journal of Mechanical Engineering and Sciences 8(2015) 1414-1425
1419
crack propagation perpendicular to the nominal load applied. The fatigue life of
cruciform joints is influenced by the size of the LOP, which acts as an initial crack with
any increase in the LOP causing a decrease in the fatigue life and vice versa, as a bigger
LOP needs a shorter route before the final fracture. The FEA was employed to
determine the influence of the weld geometry as past research has mostly utilized the 2-
D plane strain models containing edge cracks to derive SIF solutions. These models
depict a maximum stress intensity development when the direction of the primary
tensile stress is normal to the plane of the crack path [17]. The SIFs for cruciform joints
were calculated with 2D as well as 3D computation and were compared with solutions
from Frank and Fisher. The SIF solutions for cracks initiating from the weld root and
weld toe were reached separately under varying geometrical conditions.
Crack Initiation at Weld Root
The SIF solutions were determined at each crack tip from the assumed LOP crack
initiation to the final crack length with an increment of 1 mm for crack initiation values
of 6 mm, 8 mm and 10 mm as well as varied leg lengths of 6 mm, 9 mm and 12 mm.
The comparisons for cracks initiating from the weld root are shown in Figure 4.
Different SIF solutions from 2D and 3D along with LEFM approach were computed for
comparison. The results obtained show that weld geometries with an increased initial
crack size but similar leg length contribute to a higher SIF value at the beginning of the
propagation. However, equivalent SIF values are depicted as the crack propagates and
very similar SIF values are obtained towards the end of the crack for all geometrical
variations because of the similarities of the crack propagation path in the simulation [2].
Increments to the leg length size with constant initial crack sizes showed a decrease in
the SIF values obtained and good agreement with the findings of [2, 10]. The highest
SIF value of 18 MPa√m was obtained with the geometrical variation of 6 mm leg length
and 10 mm crack initiation size.
The SIF results obtained from 2D, 3D and LEFM assessment methods are
shown in Figure 5. The 2D and 3D computations generate identical SIF solutions along
the crack length for all models with similar leg length and initial crack size and SIF
values determined by FRANC 3D are seemingly slightly higher than FRANC 2D with a
percentage difference of 4.3%, as depicted in Figure 5. The SIF values determined by
the LEFM approach minor variations compared with 2D and 3D simulations in the
vicinity of the crack initiation, but become more distinct when the crack length
increases to the final length. The differences are obvious in geometries with 6 mm and 9
mm leg length. Overall, the SIF value determined with 3D modeling are slightly higher
than 2D and LEFM provides the lowest SIF values. The comparable SIF values are
owed to the SIF solution techniques employed in each simulation. Three techniques are
used in the 2D solution to calculate the stress intensity factor at crack tip, namely the
displacement correlation technique, J-integral technique and modified crack closure
integral technique; all give similar SIF values. In the 3D modeling, the SIF is calculated
with the interaction integral (M-integral) or displacement correlation method; both
techniques give similar SIF values as well.
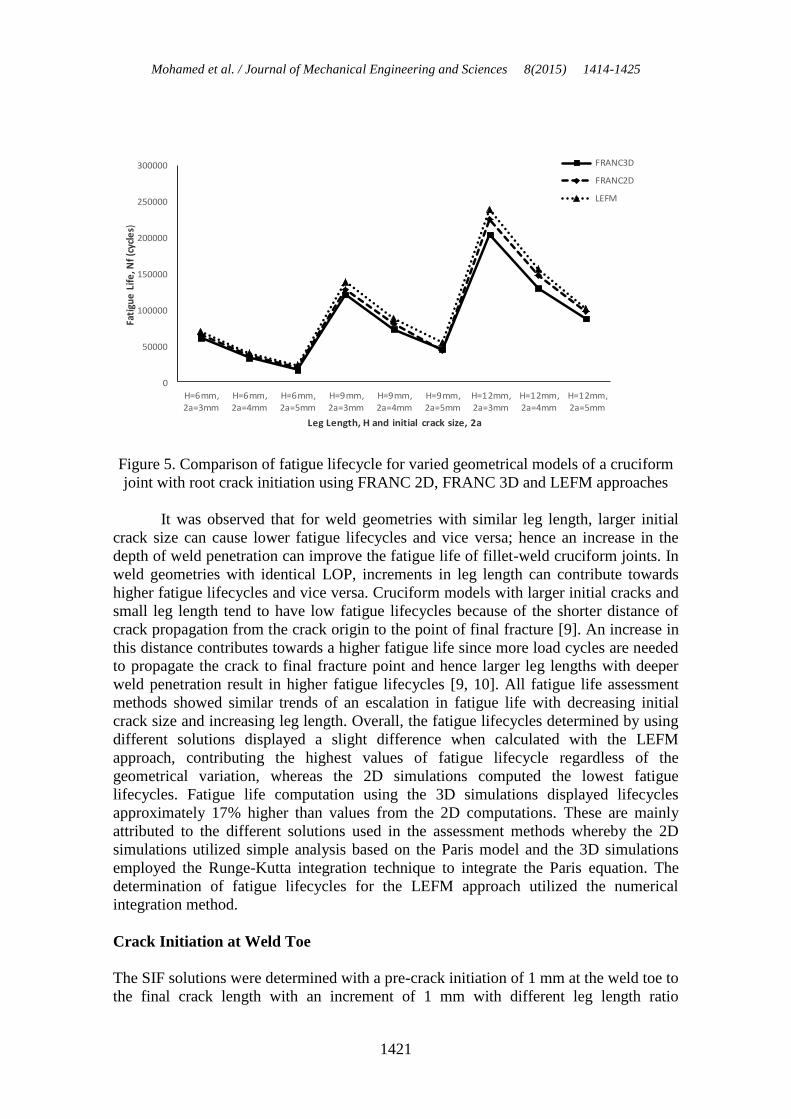
The fatigue life estimation at the final crack length of 9 mm for varied
geometrical models of a cruciform joint with root crack initiation using 2D and 3D
modeling as well as the LEFM approach is depicted in Figure 5. The geometrical model
with leg size of 6 mm and a crack initiation of 10 mm has the lowest fatigue lifecycle
with all assessment methods and that with leg size of 12 mm and a crack initiation of 6

Finite element-based fatigue life prediction of a load-carrying cruciform joint
1420
mm gave the highest fatigue life estimation in all three assessment methods, with
corresponding lifecycle values of 205000, 226000 and 239592 cycles. It is notable that
the geometry contributing to the highest fatigue lifecycle has the smallest value of SIF
at crack initiation and the geometry with the highest SIF value at the crack initiation
resulted in the lowest fatigue lifecycle. Higher SIF contributes to a lower fatigue life
[19].
(a)
(b)
Figure 4. Comparison between different SIF solution with varied leg lengths (a) Crack
initiation, 2a=6 mm (b) Crack initiation, 2a=10 mm
Mohamed et al. / Journal of Mechanical Engineering and Sciences 8(2015) 1414-1425
1421
0
50000
100000
150000
200000
250000
300000
H=6mm,2a=3mm
H=6mm,2a=4mm
H=6mm,2a=5mm
H=9mm,2a=3mm
H=9mm,2a=4mm
H=9mm,2a=5mm
H=12mm,2a=3mm
H=12mm,2a=4mm
H=12mm,2a=5mm
Fati
gue
Lif
e, N
f (c
ycle
s)
Leg Length, H and initial crack size, 2a
FRANC3D
FRANC2D
LEFM
Figure 5. Comparison of fatigue lifecycle for varied geometrical models of a cruciform
joint with root crack initiation using FRANC 2D, FRANC 3D and LEFM approaches
It was observed that for weld geometries with similar leg length, larger initial
crack size can cause lower fatigue lifecycles and vice versa; hence an increase in the
depth of weld penetration can improve the fatigue life of fillet-weld cruciform joints. In
weld geometries with identical LOP, increments in leg length can contribute towards
higher fatigue lifecycles and vice versa. Cruciform models with larger initial cracks and
small leg length tend to have low fatigue lifecycles because of the shorter distance of
crack propagation from the crack origin to the point of final fracture [9]. An increase in
this distance contributes towards a higher fatigue life since more load cycles are needed
to propagate the crack to final fracture point and hence larger leg lengths with deeper
weld penetration result in higher fatigue lifecycles [9, 10]. All fatigue life assessment
methods showed similar trends of an escalation in fatigue life with decreasing initial
crack size and increasing leg length. Overall, the fatigue lifecycles determined by using
different solutions displayed a slight difference when calculated with the LEFM
approach, contributing the highest values of fatigue lifecycle regardless of the
geometrical variation, whereas the 2D simulations computed the lowest fatigue
lifecycles. Fatigue life computation using the 3D simulations displayed lifecycles
approximately 17% higher than values from the 2D computations. These are mainly
attributed to the different solutions used in the assessment methods whereby the 2D
simulations utilized simple analysis based on the Paris model and the 3D simulations
employed the Runge-Kutta integration technique to integrate the Paris equation. The
determination of fatigue lifecycles for the LEFM approach utilized the numerical
integration method.
Crack Initiation at Weld Toe
The SIF solutions were determined with a pre-crack initiation of 1 mm at the weld toe to
the final crack length with an increment of 1 mm with different leg length ratio
Finite element-based fatigue life prediction of a load-carrying cruciform joint
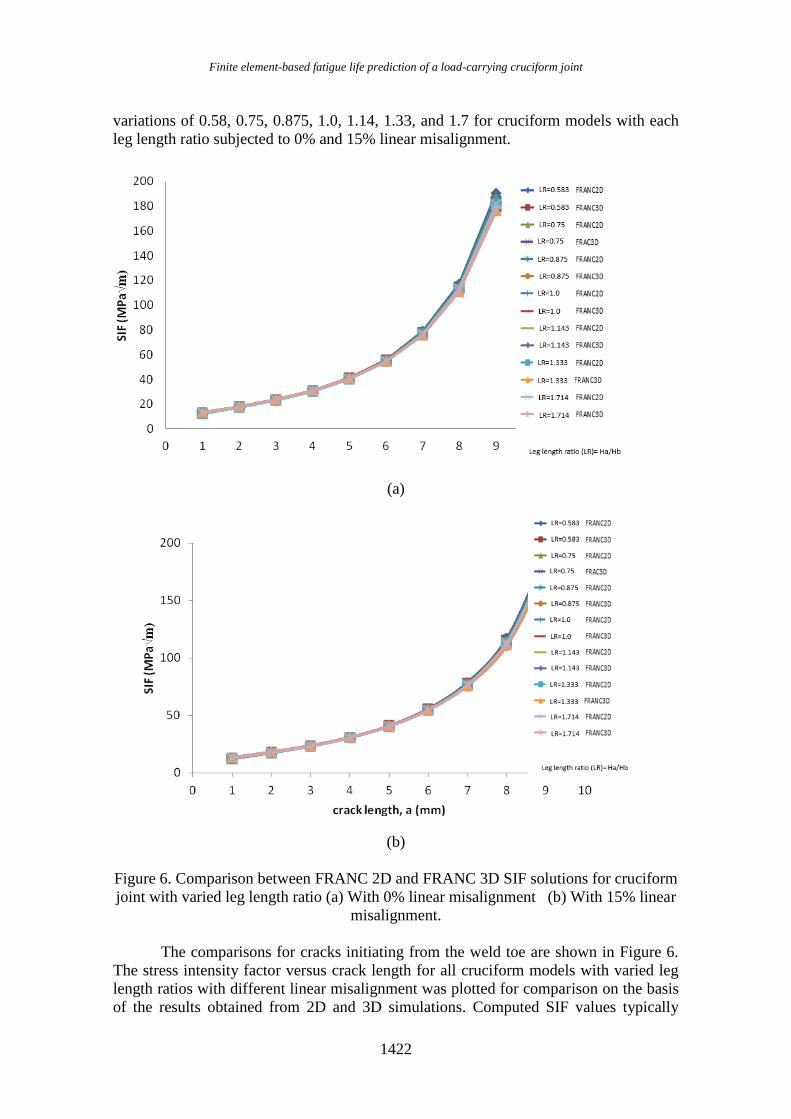
1422
variations of 0.58, 0.75, 0.875, 1.0, 1.14, 1.33, and 1.7 for cruciform models with each
leg length ratio subjected to 0% and 15% linear misalignment.
(a)
(b)
Figure 6. Comparison between FRANC 2D and FRANC 3D SIF solutions for cruciform
joint with varied leg length ratio (a) With 0% linear misalignment (b) With 15% linear
misalignment.
The comparisons for cracks initiating from the weld toe are shown in Figure 6.
The stress intensity factor versus crack length for all cruciform models with varied leg
length ratios with different linear misalignment was plotted for comparison on the basis
of the results obtained from 2D and 3D simulations. Computed SIF values typically

Mohamed et al. / Journal of Mechanical Engineering and Sciences 8(2015) 1414-1425
1423
grow proportionally to the crack propagation as the crack tip propagates from initial to
final crack length. For leg length ratios from 0.583 to 1.0, the leg length at the cross-
plate (Ha) increased from 7 mm to 12 mm and the leg length at the main plate (Hb) was
fixed at 12 mm. The crack position on the main plate was not varied. For leg length
ratios from 1.0 to 1.714, the leg length at the cross-plate (Ha) remained constant at 12
mm and the leg length at main plate (Hb) decreased from 12 mm to 7 mm. The length
changes on the main plate (Hb) caused the crack initiated at the weld toe to propagate
towards the cross-plate. The 2D and 3D analysis shows that the stress intensity values
from initial to final crack propagation for all the cruciform joint models with weld toe
crack initiation have identical values. The SIF values at initial crack length of 1 mm
determined using 2D and 3D solutions are approximately between 12.2MPa√m and
12.9MPa√m and 12.6 MPa√m and 13.4 MPa√m respectively.
The SIF values at final crack length of 9 mm determined using 2D and 3D
computations are in the range of 181.3MPa√m to 190.5MPa√m and 175.611MPa√m to
184.788MPa√m respectively. Comparison of the 2D and 3D SIF solutions for
cruciform joints with both 0% and 15% misalignment shows a slight difference; the SIF
values determined with 2D are constantly less than those of the 3D computations for
every crack propagation. From the computed SIF values, fatigue lifecycles for varied
leg length ratio models of the cruciform joint with weld toe crack initiation using 2D
and 3D simulations for 0% and 15% misalignment were determined and are depicted in
Figure 7. The variation of the leg length ratio tends to decrease the fatigue lifecycles as
the leg length ratio is increased and upon reaching the value of one onwards, the fatigue
lifecycle seemingly increases. However, changes in the fatigue lifecycle are not
significant as they are minimal and can be considered approximately identical.
Figure 7. Comparison of fatigue lifecycle for varied leg length ratio models of the
cruciform joint with weld toe crack initiation using FRANC 2D and FRANC 3D for 0%
and 15% misalignment.

Finite element-based fatigue life prediction of a load-carrying cruciform joint
1424
At minimum leg length ratio of 0.583, fatigue life for cruciform models with 0%
axial misalignment determined by 2D and 3D simulations is 31300 cycles and 31304
cycles respectively; for the maximum leg length ratio of 1.714, fatigue life for cruciform
models with 0% axial misalignment determined by 2D and 3D is 29900 cycles and
29711 cycles respectively. Such identical fatigue lifecycle values are also observed for
cruciform models with 15% axial misalignment. With this number of cycles, fatigue life
assessment by 2D and 3D simulation yields approximately similar results for the same
cruciform model. The overall percentage of difference between the FRANC 2D and
FRANC 3D results is less than 3%. Further investigation reveals that a linear
misalignment of 15% in the main plate had no significant effect on the fatigue lifecycle
for cruciform joint models with varied leg length ratios. According to the simulation
analysis, although leg length ratio and linear misalignment varied in the cruciform
geometrical model, the identical fatigue lifecycles resulted from the cracks initiated
from the weld toe having similar crack paths. The crack was observed to propagate
from the weld toe on the upper side to the weld toe on the bottom side of the main plate,
a similar propagation distance because there were no changes in the thickness of the
plate. The calculation of the fatigue lifecycle was not influenced by leg length changes
or linear misalignment as it is primarily governed by the plate thickness.
CONCLUSIONS
The main findings regarding the weld geometry effect are as follows:
i) The increase in the depth of weld penetration and the weld size in isosceles
triangles fillet-weld shape for crack initiated in the weld root decrease the SIF
and increase the fatigue lifecycle.
ii) The weld leg lengths, Ha and Hb, have a major effect on the SIF. The study
showed that the value of the SIF is strongly affected by the leg length on the
main plate side. The decreasing H significantly increases the SIF.
iii) The effects of leg length ratio and linear misalignment were studied for cracks
initiating from the weld toe, and none were found on SIF solutions and fatigue
lifecycles for load-carrying cruciform joints.
iv) FRANC 2D and FRANC 3D compute identical SIF and fatigue lifecycle
solutions regardless of the different assessment methods used yet the results are
comparable to those obtained by employing the LEFM approach.
ACKNOWLEDGEMENTS
This work is a part of the research project - Capability analysis on LEFM approach for
fatigue life assessment of partially penetrated welded structure using 2D/3D FEA and
experiment. The authors would also like to acknowledge the grant given by the
Universiti Teknologi Mara (UiTM) by the project code 600-RMI/DANA 5/3/RIF
(750/2012) for the successful implementation of this project.
REFERENCES
[1] Motarjemi AK, Kokabi AH, Ziaie AA, Manteghi S, Burdekin FM. Comparison
of the stress intensity factor of T and cruciform welded joints with different

Mohamed et al. / Journal of Mechanical Engineering and Sciences 8(2015) 1414-1425
1425
main and attachment plate thickness. Engineering Fracture Mechanics.
2000;65:55-66.
[2] Al-Mukhtar A, Biermann H, Henkel S, Hübner P. Comparison of the Stress
Intensity Factor of Load-Carrying Cruciform Welded Joints with Different
Geometries. J of Materi Eng and Perform. 2010;19:802-9.
[3] Barsoum Z, Barsoum I. Residual stress effects on fatigue life of welded
structures using LEFM. Engineering Failure Analysis. 2009;16:449-67.
[4] Wei Z, Dong P. Multiaxial fatigue life assessment of welded structures.
Engineering Fracture Mechanics. 2010;77:3011-21.
[5] Kamal M, Rahman M, Rahman A. Fatigue life evaluation of suspension knuckle
using multi body simulation technique. Journal of Mechanical Engineering and
Sciences. 2012;3:291-300.
[6] Kamal M, Rahman MM. Fatigue life estimation models: A state of the art.
International Journal of Automotive and Mechanical Engineering. 2014;9:1599-
608.
[7] Kamal M, Rahman MM, Sani M. Application of multibody simulation for
fatigue life estimation. International Journal of Automotive and Mechanical
Engineering. 2013;7:912-23.
[8] Branco R, Antunes FV, Costa JD. A review on 3D-FE adaptive remeshing
techniques for crack growth modelling. Engineering Fracture Mechanics.
2015;141:170-95.
[9] Balasubramanian V, Guha B. Influences of welding processes on fatigue life of
cruciform joints of pressure vessel grade steels containing LOP defects.
Mechanics of Materials. 2000;32:265-76.
[10] Lee CH, Chang KH. Finite element computation of fatigue growth rates for
mode I cracks subjected to welding residual stresses. Engineering Fracture
Mechanics. 2011;78:2505-20.
[11] Zhao X, Liu Y, Liu Y, Gao Y. Research on fatigue behavior and residual stress
of large-scale cruciform welding joint with groove. Materials & Design.
2014;63:593-9.
[12] Balasubramanian V, Guha B. Fatigue life prediction of welded cruciform joints
using strain energy density factor approach. Theoretical and Applied Fracture
Mechanics. 2000;34:85-92.
[13] Lee CH, Chang KH, Jang GC, Lee CY. Effect of weld geometry on the fatigue
life of non-load-carrying fillet welded cruciform joints. Engineering Failure
Analysis. 2009;16:849-55.
[14] Smith IFC, Smith RA. Fatigue crack growth in a fillet welded joint. Engineering
Fracture Mechanics. 1983;18:861-9.
[15] Frank KH, Fisher JW. Fatigue strength of fillet welded cruciform joints. Journal
of the Structural Division. 1979;105:1727-40.
[16] Hobbacher A. Recommendations for fatigue design of welded joints and
components. International Institute of Welding; 2007.
[17] Knight J. Some basic fatigue data for various types of fillet welded joints in
structural steel: Welding Institute; 1976.
[18] Maddox S. Assessing the significance of flaws in welds subject to fatigue.
Welding lournal. 1974;53.
[19] Nykänen T, Li X, Björk T, Marquis G. A parametric fracture mechanics study of
welded joints with toe cracks and lack of penetration. Engineering Fracture
Mechanics. 2005;72:1580-609.


![Active vibration control of composite shallow shells: An ...jmes.ump.edu.my/images/Volume 12 Issue 1 2018/06_rahman et al.pdf · Sun et al. [34] designed a multimodal fuzzy sliding](https://img.pdfslide.us/doc/110x75/5e0c16f63107b8074e304fce/active-vibration-control-of-composite-shallow-shells-an-jmesumpedumyimagesvolume.jpg)