Embed Size (px)
Citation preview
FINITE ELEMENT ANALYSIS OF 3D STEEL JACKET FRAME (OFFSHORE
STRUCTURE) USING ANSYS
TENGKU MUHAMMAD HASIF BIN TENGKU MOHAMED SALIM
Report submitted in partial fulfillment of the requirements
For the award of degree of
B.Eng. (Hons.) Civil Engineering
Faculty of Civil Engineering & Earth Resources
UNIVERSITI MALAYSIA PAHANG
JUNE 2015
vi
ABSTRACT
Jackets were among the very first structures that used in the offshore industry, as stable
platforms mainly for oil and gas production facilities. Frame is one of the important
elements of this structure. Unfit or improper design can lead to the failure of a structure.
The steel jacket frame was analyzed by manual calculation and also design in ANSYS
software. There are several methods can be used to analyses the behaviour of steel jacket
frame. However, among all these methods, finite element method and probabilistic
method will be a very effective method to obtain the strength and behaviour of steel
structure. This analysis is to determine the behaviour of frame design for the jacket
structure. This research will mainly focus on the steel frame of jacket platform. The yield
strength of steel jacket that used is 500 N/𝑚𝑚2 which is the strongest steel. The value for
the input variables are generated randomly by using Monte Carlo Simulation or as
prescribed samples using Response Surface Methods. 1000 simulations had been made
to make sure the analysis is more precise and accurate. Here, the study was conducted to
prove that a steel jacket under the existence of randomness and uncertainty can be
analyzed by apply probabilistic finite element analysis using ANSYS.

vii
ABSTRAK
Jaket adalah antara struktur yang pertama yang digunakan dalam industri luar pesisir,
sebagai platform stabil terutamanya untuk kemudahan pengeluaran minyak dan gas.
Frame adalah salah satu elemen penting dalam struktur ini. Reka bentuk tidak layak atau
tidak betul boleh menyebabkan kegagalan struktur. Rangka jaket keluli dianalisis dengan
pengiraan manual dan juga mereka bentuk dalam perisian ANSYS. Terdapat beberapa
kaedah yang boleh digunakan untuk menganalisis kelakuan kerangka jaket keluli. Walau
bagaimanapun, di kalangan semua kaedah ini, kaedah unsur terhingga dan kaedah
kebarangkalian akan menjadi kaedah yang sangat berkesan untuk mendapatkan kekuatan
dan kelakuan struktur keluli. Analisis ini adalah untuk menentukan kelakuan reka bentuk
bingkai untuk struktur jaket. Kajian ini akan memberi tumpuan pada rangka keluli
platform jaket. Kekuatan alah jaket keluli yang digunakan ialah 500 N/𝑚𝑚2 yang keluli
yang paling kuat. Nilai untuk pemboleh ubah input yang dijana secara rawak dengan
menggunakan Monte Carlo Simulasi atau sebagai sampel ditetapkan menggunakan
Kaedah Respon Permukaan. 1000 simulasi telah dibuat untuk memastikan analisis yang
lebih tepat dan tepat. Di sini, kajian ini dijalankan bagi membuktikan bahawa keluli jacket
yang mengalami masalah kerawakan dan ketidakpastian boleh dianalisis dengan
menggunakan cara analisis terhingga dan analisis kebarangkalian di bawah penolongan
perisian komputer ANSYS.
viii
TABLE OF CONTENTS
DECLARATION OF THESIS AND COPYRIGHT i
SUPERVISOR’S DECLARATION ii
STUDENT’S DECLARATION iii
DECICATION v
ACKNOWLEDGEMENTS iv
ABSTRACT vi
ABSTRAK vii
TABLE OF CONTENTS viii
LIST OF TABLES xii
LIST OF FIGURES xiii
LIST OF SYMBOLS xvii
LIST OF ABBREVIATIONS xviii
CHAPTER 1 INTRODUCTION
1.1 Introduction 1
1.2 Problem Statement 2
1.3 Objective 2
1.4 Scope of Study 3
1.5 Expected Outcome 3
1.6 Significance of Study 3
ix
CHAPTER 2 LITERATURE REVIEW
2.1 Introduction of Frame Jacket Platform 4
2.2 Model of Jacket Offshore Platform 5
2.3 Probabilistic Analysis in Finite Element Modelling 6
2.4 Finite Element Analysis 7
2.5 Probabilistic Design 7
2.5.1 General 8
2.5.2 Probabilistic Design System 8
2.5.3 Distribution of Probability Design Variables 9
2.5.4 Monte Carlo Simulation 10
2.5.5 Monte Carlo Simulation and Latin Hypercube Simulation 11
CHAPTER 3 METHODOLOGY
3.1 Introduction 12
3.2 Preprocessing: Defining the Problem 13
3.2.1 Modelling 3D Jacket platform structure 13
3.2.2 Entering Title 14
3.2.3 Defining CivilFEM 14
3.2.4 Defining Beam Element Types for Code Checking 15
3.2.5 Defining Material Properties 16
3.2.6 Defining Cross sections and Member Properties 16
3.2.7 Entering Key Points 18
3.2.8 Setup All Force, Wind Load and Support 20
3.2.9 Result by Load Step Number 21
3.2.10 Reaction Forces 22
3.2.11 Deflection 23
3.2.12 Read Result 25
x
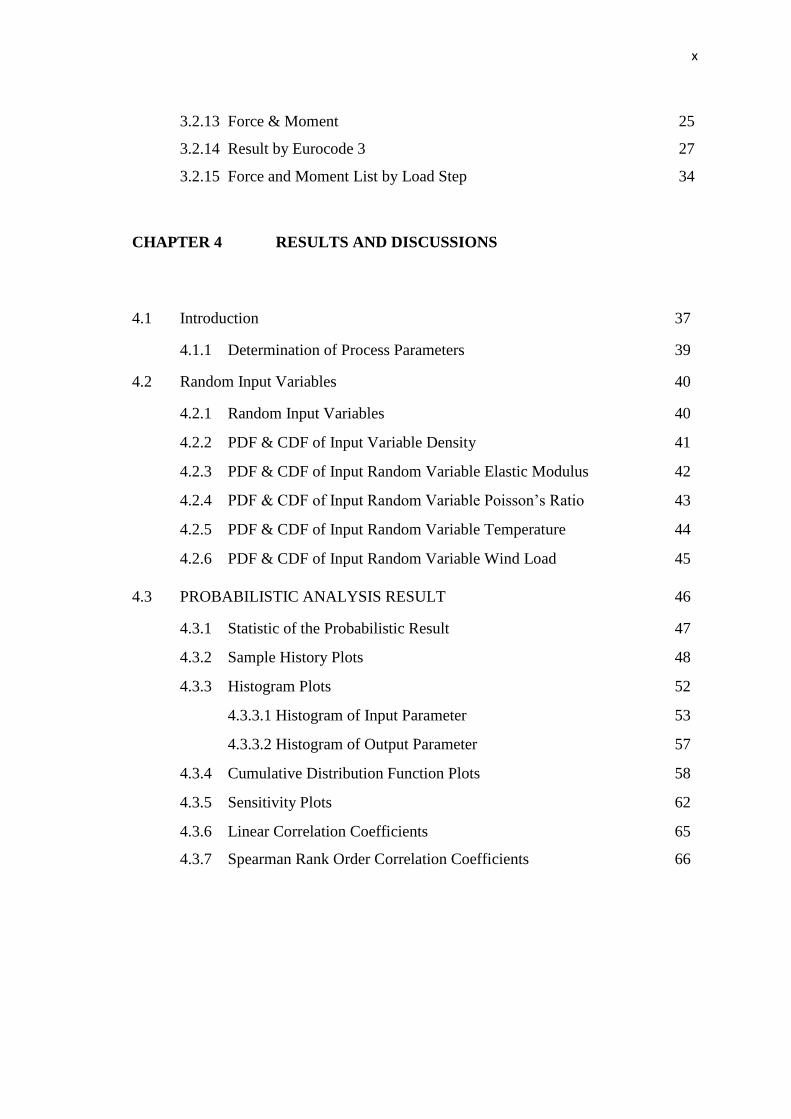
3.2.13 Force & Moment 25
3.2.14 Result by Eurocode 3 27
3.2.15 Force and Moment List by Load Step 34
CHAPTER 4 RESULTS AND DISCUSSIONS
4.1 Introduction 37
4.1.1 Determination of Process Parameters 39
4.2 Random Input Variables 40
4.2.1 Random Input Variables 40
4.2.2 PDF & CDF of Input Variable Density 41
4.2.3 PDF & CDF of Input Random Variable Elastic Modulus 42
4.2.4 PDF & CDF of Input Random Variable Poisson’s Ratio 43
4.2.5 PDF & CDF of Input Random Variable Temperature 44
4.2.6 PDF & CDF of Input Random Variable Wind Load 45
4.3 PROBABILISTIC ANALYSIS RESULT 46
4.3.1 Statistic of the Probabilistic Result 47
4.3.2 Sample History Plots 48
4.3.3 Histogram Plots 52
4.3.3.1 Histogram of Input Parameter 53
4.3.3.2 Histogram of Output Parameter 57
4.3.4 Cumulative Distribution Function Plots 58
4.3.5 Sensitivity Plots 62
4.3.6 Linear Correlation Coefficients 65
4.3.7 Spearman Rank Order Correlation Coefficients 66
xi
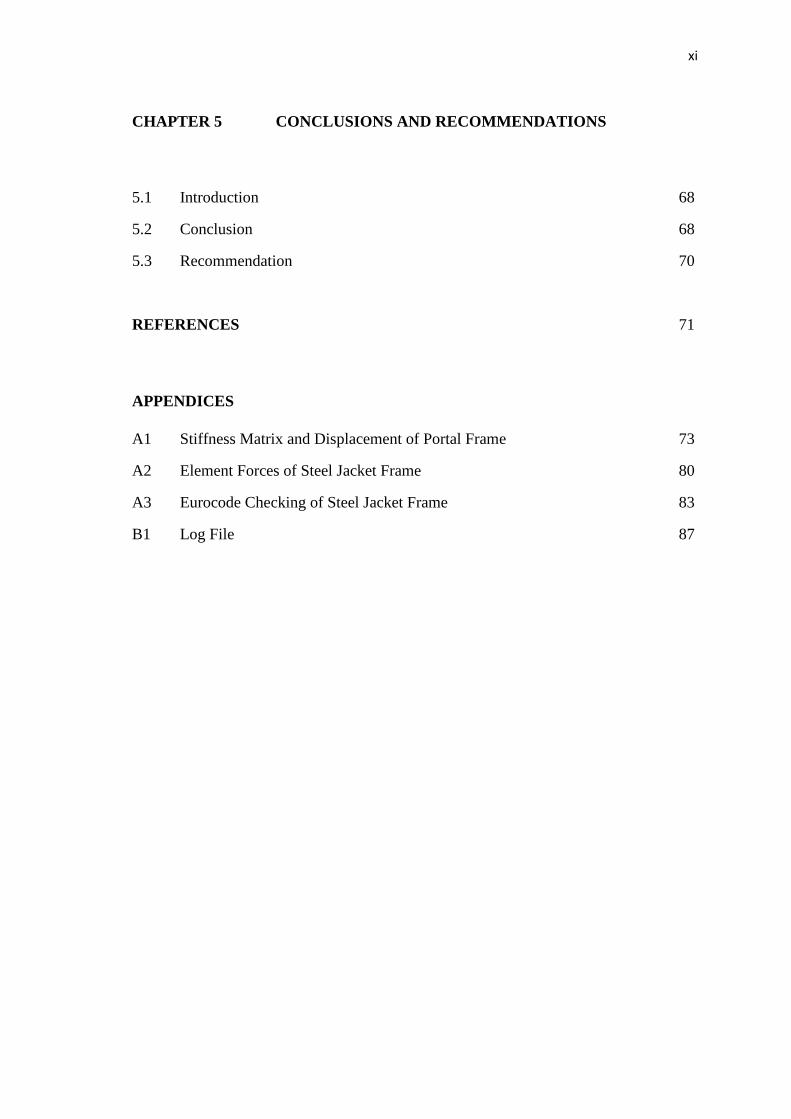
CHAPTER 5 CONCLUSIONS AND RECOMMENDATIONS
5.1 Introduction 68
5.2 Conclusion 68
5.3 Recommendation 70
REFERENCES 71
APPENDICES
A1 Stiffness Matrix and Displacement of Portal Frame 73
A2 Element Forces of Steel Jacket Frame 80
A3 Eurocode Checking of Steel Jacket Frame 83
B1 Log File 87
xii
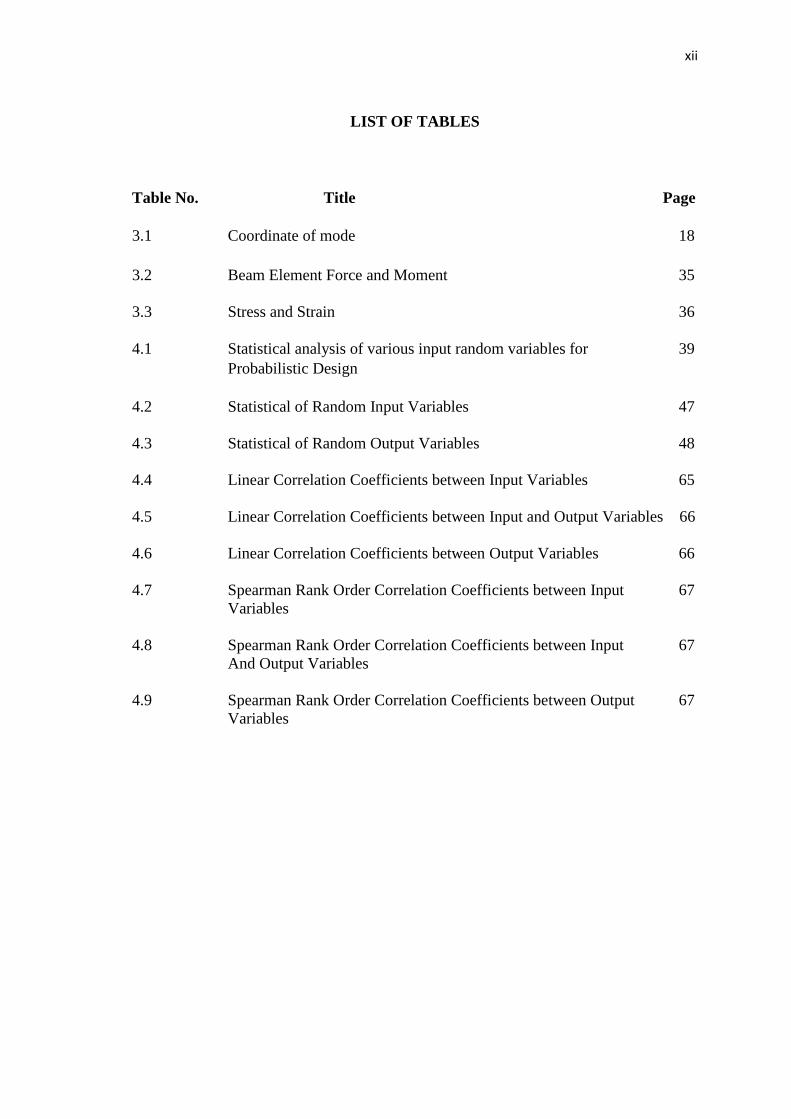
LIST OF TABLES
Table No. Title Page
3.1 Coordinate of mode 18
3.2 Beam Element Force and Moment 35
3.3 Stress and Strain 36
4.1 Statistical analysis of various input random variables for 39
Probabilistic Design
4.2 Statistical of Random Input Variables 47
4.3 Statistical of Random Output Variables 48
4.4 Linear Correlation Coefficients between Input Variables 65
4.5 Linear Correlation Coefficients between Input and Output Variables 66
4.6 Linear Correlation Coefficients between Output Variables 66
4.7 Spearman Rank Order Correlation Coefficients between Input 67
Variables
4.8 Spearman Rank Order Correlation Coefficients between Input 67
And Output Variables
4.9 Spearman Rank Order Correlation Coefficients between Output 67
Variables
xiii
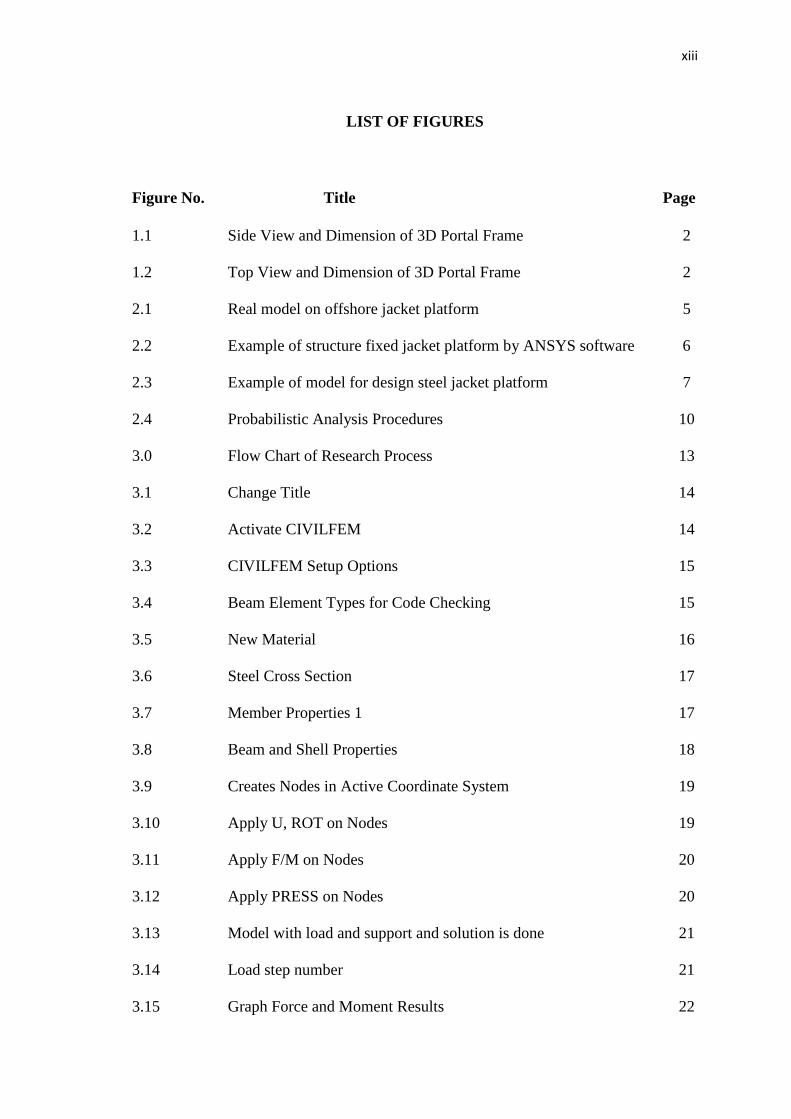
LIST OF FIGURES
Figure No. Title Page
1.1 Side View and Dimension of 3D Portal Frame 2
1.2 Top View and Dimension of 3D Portal Frame 2
2.1 Real model on offshore jacket platform 5
2.2 Example of structure fixed jacket platform by ANSYS software 6
2.3 Example of model for design steel jacket platform 7
2.4 Probabilistic Analysis Procedures 10
3.0 Flow Chart of Research Process 13
3.1 Change Title 14
3.2 Activate CIVILFEM 14
3.3 CIVILFEM Setup Options 15
3.4 Beam Element Types for Code Checking 15
3.5 New Material 16
3.6 Steel Cross Section 17
3.7 Member Properties 1 17
3.8 Beam and Shell Properties 18
3.9 Creates Nodes in Active Coordinate System 19
3.10 Apply U, ROT on Nodes 19
3.11 Apply F/M on Nodes 20
3.12 Apply PRESS on Nodes 20
3.13 Model with load and support and solution is done 21
3.14 Load step number 21
3.15 Graph Force and Moment Results 22
xiv
3.16 Plot Deformed Shape 22
3.17 Deformed Shape 23
3.18 Contour Nodal Solution Data 24
3.19 Contour Plot of Deflection 24
3.20 Read Results by Load Step Number 25
3.21 Graph Force and Moment Results 25
3.22 Axial Force Diagram 26
3.23 Shear Force Diagram 26
3.24 Bending Moment Diagram 27
3.25 Check Model Results by Eurocode 3 28
3.26 Graph Steel Results 28
3.27 Tension Checking Results 29
3.28 Compression Checking Results 30
3.29 Bending Moment Checking Results 30
3.30 Shear Checking Results 31
3.31 Bending Shear Checking Results 31
3.32 Bending and Axial Checking Results 32
3.33 Bending Axial and Shear Checking Results 32
3.34 Bending Buckling Checking Results 33
3.35 Compression Buckling Checking Results 33
3.36 Bending & Compression Buckling Checking Results 34
3.37 List Force and Moment 34
3.38 List Stress & Strain Result 36
4.1 Model Geometry and Finite Element Mesh 38
xv
4.2 PDF & CDF of Input Random Variable APPLIED LOAD 41
4.3 PDF & CDF of Input Random Variable DENSITY 42
4.4 PDF & CDF of Input Random Variable ELASTIC MODULUS 43
4.5 PDF & CDF of Input Random Variable POISSON’S RATIO 44
4.6 PDF & CDF of Input Random Variable TEMPERATURE 45
4.7 PDF & CDF of Input Random Variable WIND LOAD 46
4.8 Mean Value History for Output Parameter 49
MAXIMUMDEFLECTION
4.9 Standard Deviation History for Output Parameter 49
MAXIMUMDEFLECTION
4.10 Mean Value History for Output Parameter 50
MAX_DEFLECTION
4.11 Standard Deviation History for Output Parameter 51
MAX_DEFLECTION
4.12 Sampled Values for Output Parameter MAXIMUMDEFLECTION 51
4.13 Sample Values for Output Parameter MAX_DEFLECTION 52
4.14 Histogram of Input Variable APPLIEDLOAD 53
4.15 Histogram of Input Variable DENSITY 54
4.16 Histogram of Input Variable ELASTIC 54
4.17 Histogram of Input Variable POISSON 55
4.18 Histogram of Input Variable TEMP 56
4.19 Histogram of Input Variable WINDLOAD 56
4.20 Histogram for Output Parameter MAXIMUMDEFLECTION 57
4.21 Histogram for Output Parameter MAX_DEFLECTION 58
4.22 CDF of Input Variable APPLIEDLOAD 59
4.23 CDF of Input Variable DENSITY 60
4.24 CDF of Input Variable POISON 60
xvi
4.25 CDF of Input Variable TEMPERATURE 61
4.26 CDF of Input Variable WINDLOAD 61
4.27 Linear Correlation Sensitivity Plot for 62
MAXIMUMDEFLECTION
4.28 Rank- Order Correlation Sensitivity Plot for 63
MAX_DEFLECTION
4.29 Sensitivity Plot for MAX_DEFLECTION 64
xvii
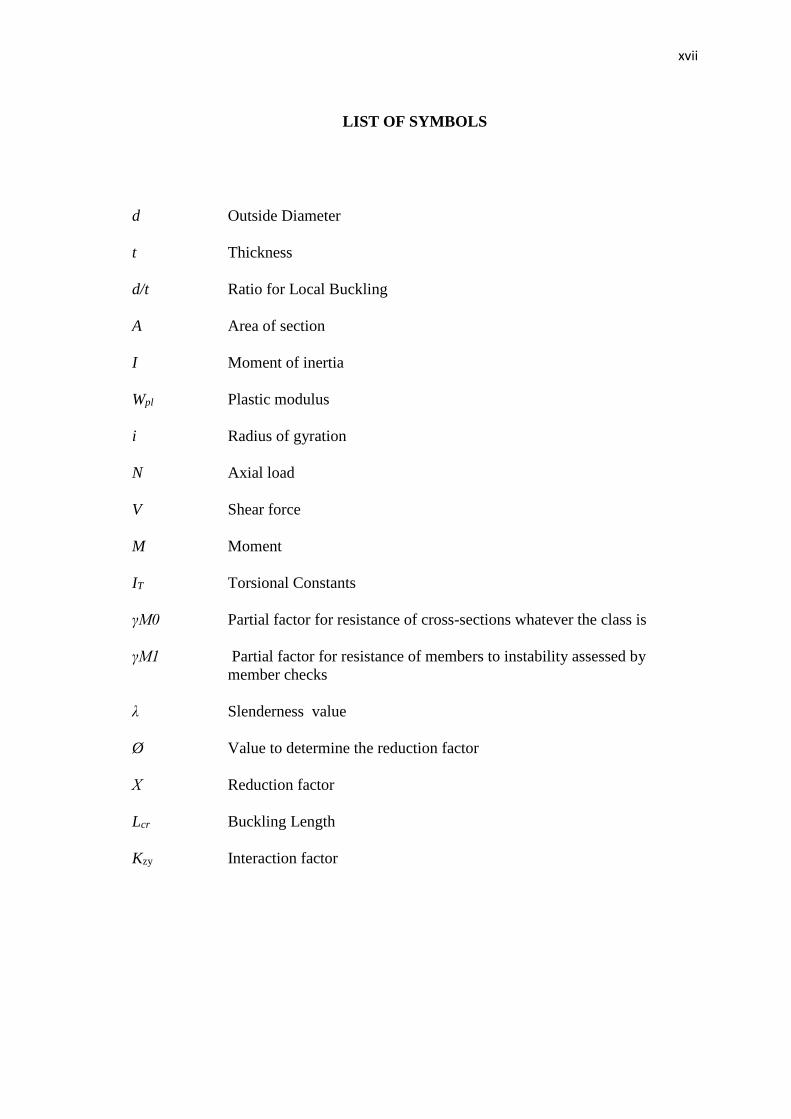
LIST OF SYMBOLS
d Outside Diameter
t Thickness
d/t Ratio for Local Buckling
A Area of section
I Moment of inertia
Wpl Plastic modulus
i Radius of gyration
N Axial load
V Shear force
M Moment
IT Torsional Constants
γM0 Partial factor for resistance of cross-sections whatever the class is
γM1 Partial factor for resistance of members to instability assessed by
member checks
λ Slenderness value
Ø Value to determine the reduction factor
Χ Reduction factor
Lcr Buckling Length
Kzy Interaction factor
xviii
LIST OF ABBREVIATIONS
2D Two Dimensional
3D Three Dimensional
CIVIFEM Civil Finite Element Method
LatBuck Lateral Buckling
ChckAxis Check Axis
BMSHPRO Beam and Shell Properties
CS Coordinate System
LS Load Step
DOF Degree of Freedom
PRES Pressure
GAUS Gaussian
DENS Density
ELASTIC Elastic modulus
POISON Poison ratio
LOAD Point load
WINDLOAD Wind load
TEMP Temperature
PDF Probabilistic density function
CDF Cumulative distribution function
MAXIMUMDEFLECTION Maximum Deflection
/MAX_DEFLECTION
1
CHAPTER 1
INTRODUCTION
1.1 GENERAL
The finite element analysis is a numerical technique. It was an extension of matrix
method of structural analysis. In finite element method, actual component is replaced by
a simplified model, identified by a finite number of element connected at common point
called nodes, with an assumed behavior of each element to the set of applied load, and
evaluating the unknown variable such as displacement.
Since sixty years ago, the offshore structure is the bigger structure in oil and gas
industry and it growing quickly over time (M.H. Patel 1989). Fix steel structure (D.J.
Wisch 1998) was studied that the design of structure will be considered by load and the
increasing of water depth. A simple model whole shape frame jacket will be proposed
and modelled by the software ANSYS in three directions, then finite element calculation
were carried out through the software to obtain the deflection, stress and strain and
buckling of steel structure jacket. All these analysis were based on finite element method.
Probabilistic analysis will be carried out by changing the input parameters and properties
of steel to find out which affect the frame effectively.
The analysis of steel frame jackets can be done by hand calculation easily if the
structure of frame is simple. However, if the structure of steel frame is complicated, the
2
analysis will involve many long and mathematical calculation may take long time to
complete all the calculation. Nevertheless, with the increasing of computer technology all
around the word, people nowadays are able to solve the analysis of a structure by using
software in computer such as STAAD Pro, SACS, SAP 2000, and etc.
1.2 PROBLEM STATEMENT
Jackets were among the very first structures to be used in the offshore industry, as
stable platforms mainly for oil and gas production facilities. Frame is one of the important
elements of this frame structure. Unfit or improper design can lead to the failure of a
structure. There are several methods can be used to analyzes the behavior of steel jacket
frame. However, among all these methods, finite element method will be a very effective
method to obtain the strength and behavior of steel structure.
Most of the times, engineers need to find out an accurate data of deflection and
stress for the structure before he start design. A lot of time had been wasted for that works.
By applying the probabilistic analysis, a range of result can be obtained by input the
loading and the wind load. So, engineers works can be reduced and save more time for
others.
1.3 OBJECTIVE
This thesis have a few objectives that related to the design of steel structure. There
are many thing that should be considered to make this project more reasonable with the
objective. The objective that use for this project must be achieve. The ultimate purpose
of this study is to study the strength and behavior of steel jacket frame by using a finite
element analysis software ANSYS.
i. To determine the force and moment, stress & strain and deflection on steel
jacket structure using ANSYS software.
ii. To verify the steel jacket frame is stable against the variable load
iii. To determine probabilistic analysis of steel jacket frame
3
1.4 SCOPE OF STUDY
This research will mainly focus on the steel frame of jacket platform. In order to
achieve the objective of this research, there are a few scope of work that important to be
revised and followed, such as:
i. Result of analysis on steel structure (stress, strain, deflection)
ii. Develop a model on ANSYS software for analyzing steel jacket structure
iii. Conduct probabilistic response analysis on steel jacket structure
First step is install the ANSYS software to the computer and do all the tutorials
that given on this software. The basic tutorial will increase the skills on modelling and
analyzing all structure in ANSYS. Then, the properties of structure steel must be define
which include their dimensions and the section on jacket structure. The type of structure
can be determine by referring plans or assumptions. Preprocessing is the step to define
lines and key points. It will be continue to next step. All environmental load and supports
will assign to the modelling structure. After that, determine the solution of the structure
which is deflection and stress. Finally, carry out probabilistic analysis and observe the
result of that occur on structure.
1.5 EXPECTED OUTCOME
This research claims to find out the behaviors and passing code checking of 3D
portal frame. The behaviors are deformation, deflection, tension checking, compression
checking and lateral torsional buckling checking according to Eurocode 3.
1.6 SIGNIFICANCE OF STUDY
This research will be a significance endeavor in providing the information about
the steps and results of analyzing steel jacket frame by using ANSYS. Maximum
deformation, deflection axial stress and strain are able to be determined. It is really good
to practice to analyze and make sure it is safe before constructing it. This definitely will
enhance the reputation of Malaysia with advance engineering skills.
4
CHAPTER 2
LITERATURE REVIEW
2.1 INTRODUCTION OF FRAME JACKET PLATFORM
Nowadays, steel is most one material that used in construction industrial. It’s
because, steel have more advantage than timber and other material. (K.Sadeghi 2001)
provide a review of the literature on design and structure of offshore jacket platform. The
jacket platform have difference type depends on their design such as towed to drilling site,
three or four ‘legs’ are piled on the sea bottom. Jacket rig also suitable for shallower water
and their legs were extend down to deeply in the water. The jacket is design for fix
structure and the advantage of this structure is their stability because they are attached to
the sea floor. So that, all the variable load applied on the structure can be covered by the
structure. Besides that, jacket structure also will be stable. However, this jacket cannot
used in very deep water and it’s also not economical to build legs that long.
(Sadeghi 2001) stated that fix Jacket platform is made of steel and template
platform mostly consist of jacket, deck and piles. Jacket offshore structure are exposed to
many of external load such as wave load, wind load, earthquakes, ship-berthing impact,
and operation load. (M.J. Terro, M.S. Mahmoud, M. Abdel-Rohman 2004) researched
that the large deformation and fatigue damage will come when the structure properties
are liable to induce self-excited force. (Adrezin 1996) studied the offshore structure was
focusing in particular on the various model. Some of researchers investigated that only
5
the loads acting on the structure. (Kim at al. 2011) studied the steel buildings was sensitive
because of the design parameters subjected to progressive collapse.
Frame steel jacket is the most structure that use in offshore platform. Among the
various types of offshore structure, the steel structure of jacket platform is the most
common used in oil and gas industry because it is multi-functions for oil exploration,
drilling, as well as for production. Usually, this structure operate up to depth of about
100-150 meters. Besides that, the maintenance and repair of the structure is more difficult
than large infrastructure on land.
2.2 MODEL OF JACKET OFFSHORE PLATFORM
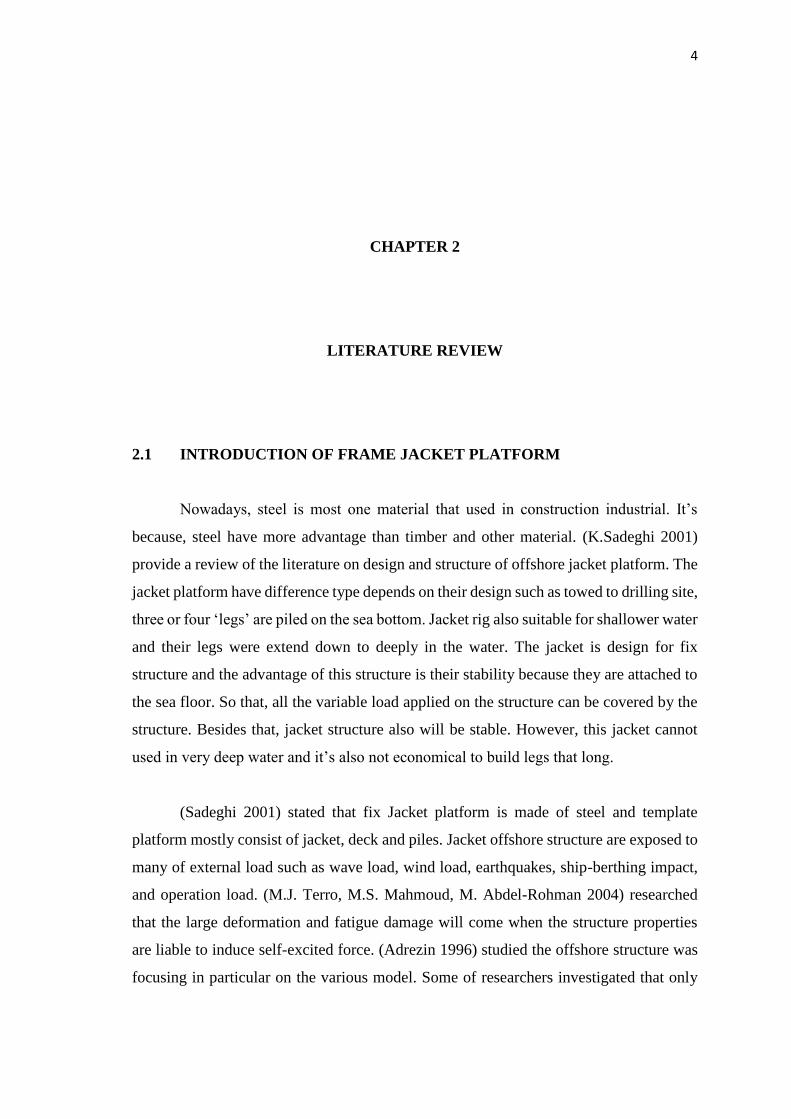
According to (Poona Mohan, 2013), software is the easier for offshore engineers
to do simplified and realistic evaluation of the static operation and ultimate limit
characteristic of jacket platform that subjected to various environmental condition. The
jacket is modeled as a frame in three dimensional spaces. Figure below shows the real
model that used for modelling the jacket structure. Figure 2.1 show the real model on
offshore jacket platform
Figure 2.1: Real model on offshore jacket platform
Topside Modules
Steel Jacket
6
2.3 PROBABILISTIC ANALYSIS IN FINITE ELEMENT MODELLING
(Tie Ming 2011) stated that the probabilistic analysis method was applied to
account for the variability in fiction. In this study, Monte Carlo simulation was used to
analyze the effect of parameter uncertainty for the structural analysis. From the analysis
result, it was observed that the changes in pre-stressing force, elastic modulus of pre-
stressing steel, which need to be tightly controlled. As a result, from deterministic analysis
and probabilistic analysis, it was found that probabilistic analysis tends to be closer to
reality and gives a way of designing for quality.
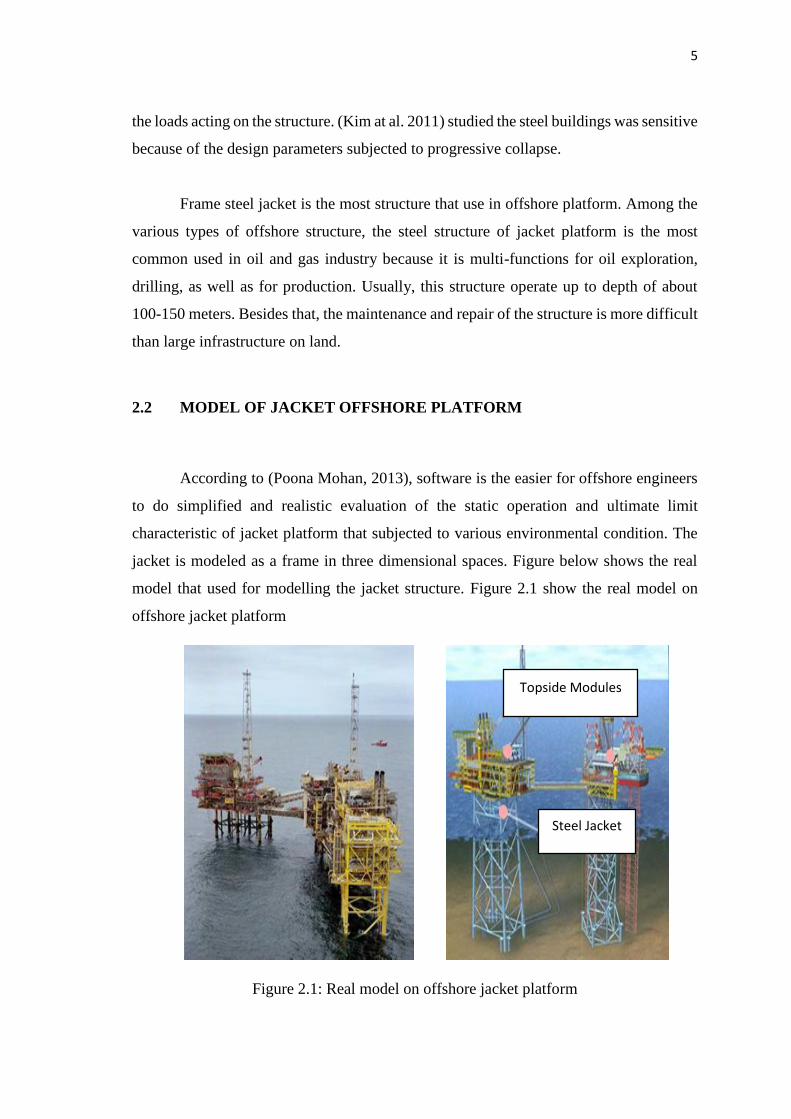
Recent trends of structural mechanics applications in finite element analysis
demonstrate an increasing demand for efficient analysis tools. Using ANSYS, finite
element models were developed to simulate deflection behavior. Probabilistic analysis
methodology could predict the response on stress, strain, and deflection due to various
combination of input variables. Figure 2.2 show the example of structure fixed jacket
platform by ANSYS software
Figure 2.2: Example of structure fixed jacket platform by ANSYS software
7
2.4 FINITE ELEMENT ANALYSIS
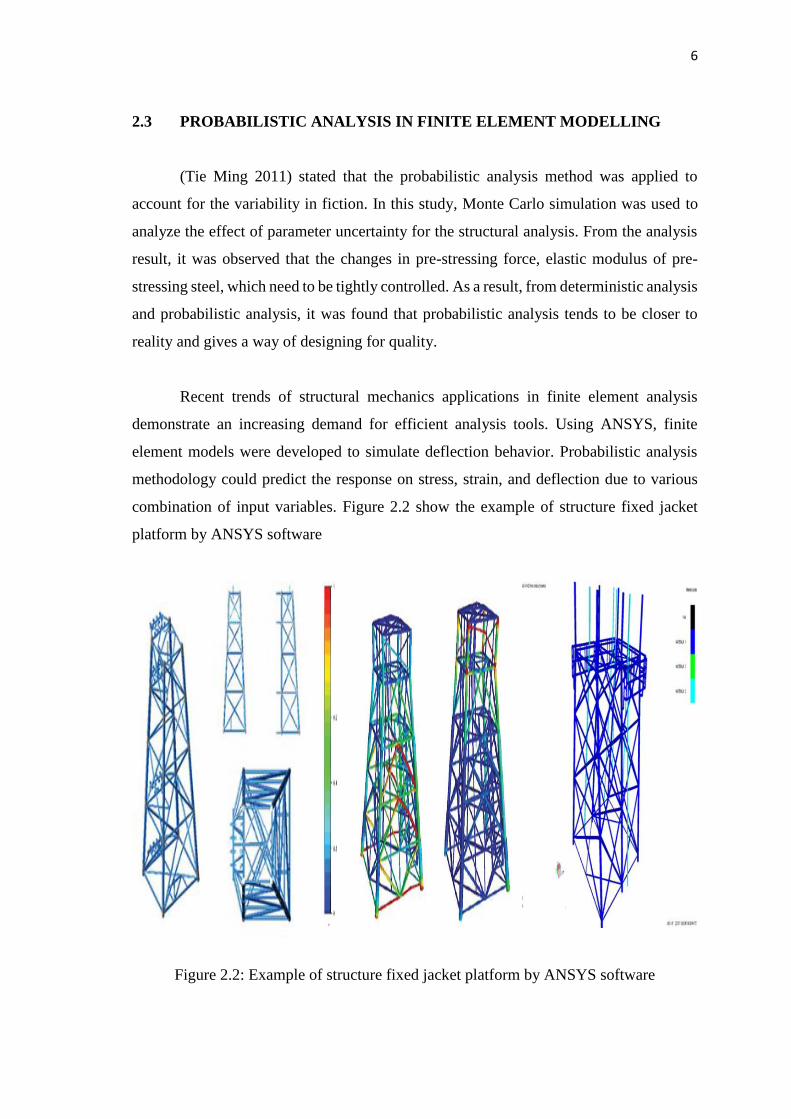
In research of (K.S Sivakumaran, 2001) a finite element analysis model for the
post-local buckling behavior of steel members exposed to axial compression has been
develop. The finite element model consists of a shell finite element and experimental-
based material properties model to represent the body of steel section. A special loading
or environmental various were employed to obtain uniform displacement condition at the
loading edges. The compression between the test result, and the finite element result was
performed for axial and lateral displacement behavior, buckling load, ultimate loads, and
axial stress distribution.
Figure 2.3: Example of model for design steel jacket platform
2.5 PROBABILISTIC DESIGN
Computer models are expressed and described with specific numerical and
deterministic value; material properties are entered using certain values, the geometry of
the component is assigned a certain length or width, etc. An analysis based on a given set
of specific numbers and values is called a deterministic analysis. Naturally, the results of
a deterministic analysis are only as good as the assumptions and input values used for the
analysis. The validity of those results depends on how correct the values were for
computer under real life conditions.
8
2.5.1 General
In reality, every aspect of an analysis model is subjected to uncertain in some way.
Material property values are different if one specimen is compared to the next. This kind
of uncertain is inherent for materials and varies among different material types and
material properties. For example, the uncertain of the elastic modulus for many materials
can often be described as a Gaussian distribution with standard deviation of ±3-5%.
Likewise, the geometric properties of components can only be reproduced within certain
manufacturing tolerances. The same variation holds true for the loads that are applied to
finite element model. This means that almost all input parameters used in a finite element
analysis are inexact, each associated with some degree of uncertainty.
It is neither physically possible nor financially feasible to eliminate the uncertain
of input parameters completely. The reduction of uncertain is typically associated with
higher costs either through better and more precise manufacturing methods and processes
or increased efforts in quality control; hence, accepting the existence of uncertain and
dealing with it rather than trying to eliminate it makes products more affordable and
production of those products more cost-effective.
Probabilistic design can be used to determine the effect of one or more variables
on the outcome of the analysis. In addition to the probabilistic design techniques available,
the ANSYS program offers a set of strategic tools that can be used to enhance the
efficiency of the probabilistic design process.
2.5.2 Probabilistic Design System
ANSYS Probabilistic Design System (PDS) is a very powerful tool to solve
probabilistic problems. As such, it can be used for an uncertainty analysis or a reliability
analysis. It is tightly integrated into ANSYS, using the same graphical user interface,
hence having the same look and feel as ANSYS itself. The PDS is based on the ANSYS
Parametric Design Language (APDL), which allows users to parametrically build a finite
element model, solve it, obtain results and extract characteristic results parameters such
as the maximum deflection or stress etc. The PDS tools typically offer several
9
probabilistic methods (i.e. Monte Carlo simulation method and response surface method).
The Monte Carlo simulation (MCS) method does not make any simplification or
assumptions in the deterministic or probabilistic model. The key functionality of MCS
techniques is the generation of random numbers with a uniform distribution from 0 to 1.
The only assumption it does in fact make is that the limited number of samples is
representative to quantify the randomness of the results parameters. With increasing
number of samples the MCS method converges to the true and correct probabilistic result.
The MCS is therefore widely used a benchmark to verify the accuracy of other
probabilistic methods.
2.5.3 Distribution of Probability Design Variables
In a mass production filed, usually have a lot of data, in which case we could use
commercial statistical tools that will allow us to actually fit a statistical distribution
function that best describes the uncertain or scatter of the data.
The mean value and standard deviation are most commonly used to describe the
scatter of data. The mean and the standard deviation of a set of data are use together.
Frequently, information about a physical quantity is given in the form that its value is, for
example, “100±5”. Generally, this form means that the value 100 is the mean value and
5 is the standard deviation. By definition, the standard deviation is the square root of the
variance. It has the same units as the random variable and the mean; therefore, it is a better
descriptor of dispersion or spread of either a sample of data or a distribution function than
the variance.
In this study, Gaussian and lognormal distribution has considered as function for
probabilistic designs input random variables. The Gaussian or normal distribution is a
very fundamental and commonly used distribution for statistical matters. It is typically
used to describe the uncertainty of the measurement data of many physical phenomena.
Strictly speaking, every random variable follows a normal distribution if it is generated
by a linear combination of a very large number of other random effects, regardless which
distribution these random effects originally follow. The Gaussian distribution these
random effects originally follow. The Gaussian distribution is also valid if the random
10
variable is a linear combination of two or more other effects if those effects also follow a
Gaussian distribution.
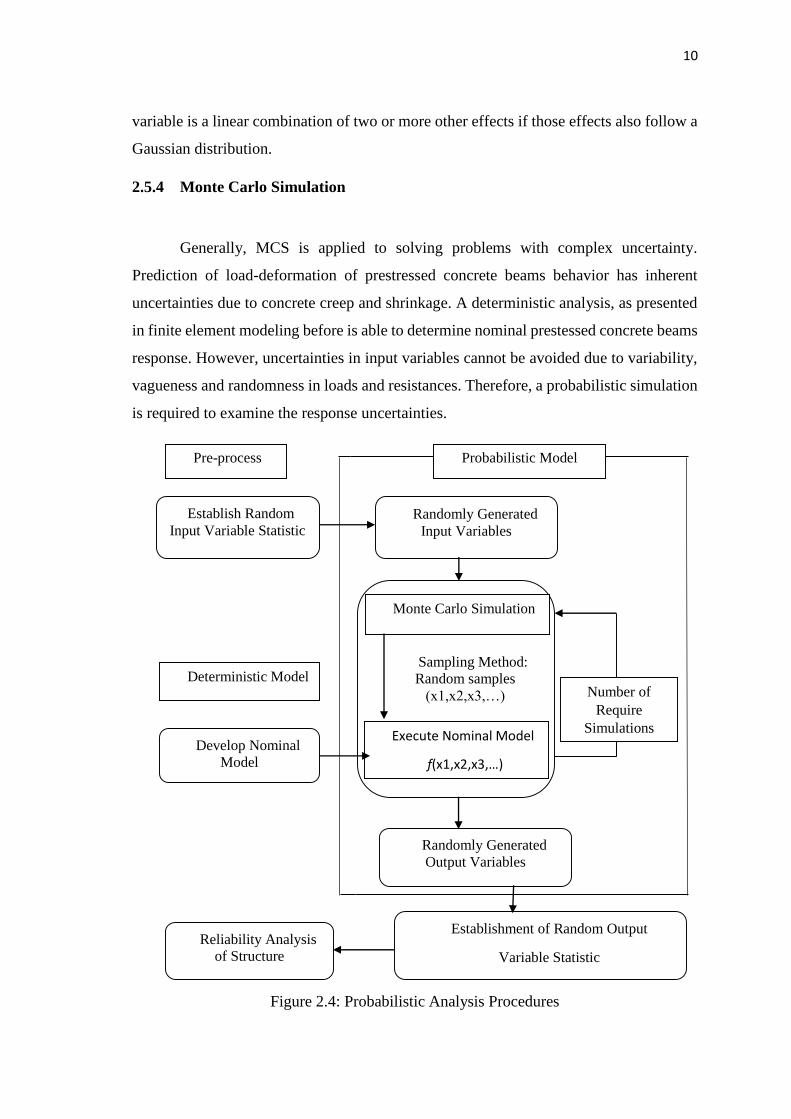
2.5.4 Monte Carlo Simulation
Generally, MCS is applied to solving problems with complex uncertainty.
Prediction of load-deformation of prestressed concrete beams behavior has inherent
uncertainties due to concrete creep and shrinkage. A deterministic analysis, as presented
in finite element modeling before is able to determine nominal prestessed concrete beams
response. However, uncertainties in input variables cannot be avoided due to variability,
vagueness and randomness in loads and resistances. Therefore, a probabilistic simulation
is required to examine the response uncertainties.
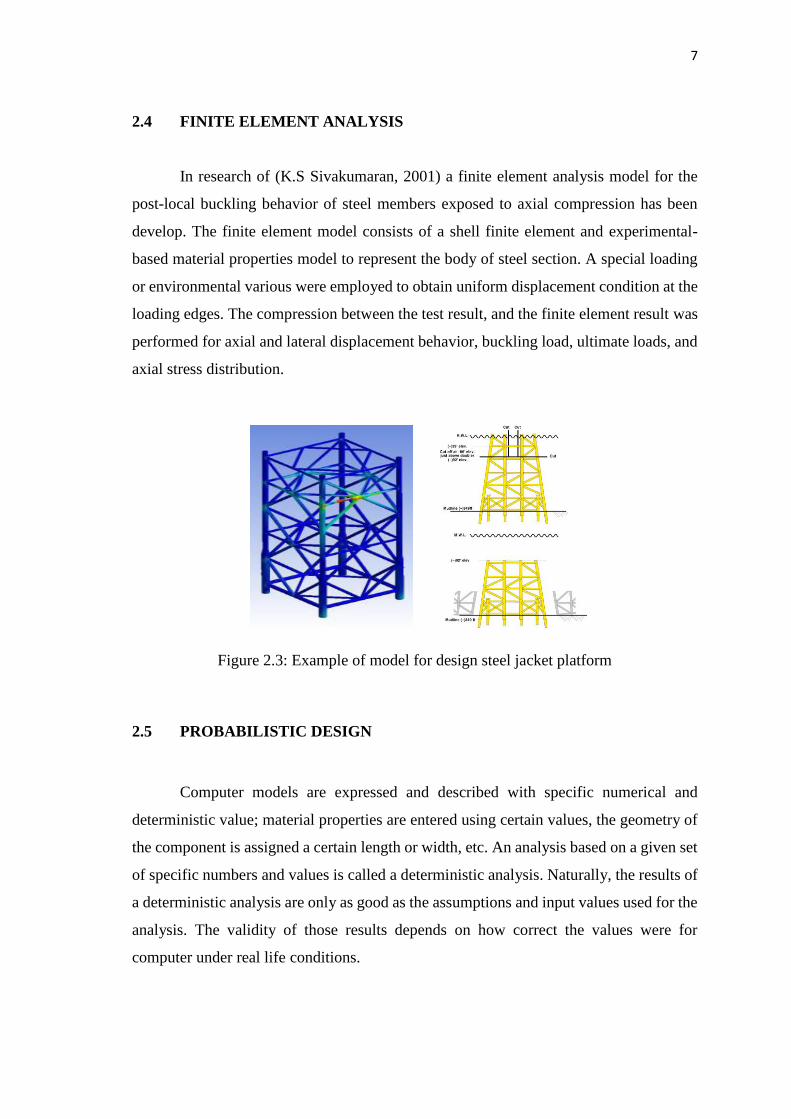
Figure 2.4: Probabilistic Analysis Procedures
Pre-process
Deterministic Model
Probabilistic Model
Establish Random
Input Variable Statistic
Develop Nominal
Model
Randomly Generated
Input Variables
Sampling Method:
Random samples
(x1,x2,x3,…)
Monte Carlo Simulation
Execute Nominal Model
f(x1,x2,x3,…)
Reliability Analysis
of Structure
Establishment of Random Output
Variable Statistic
Randomly Generated
Output Variables
Number of
Require
Simulations