Embed Size (px)
Citation preview
Finite Element Analysis and Design
Optimization of Platen for Injection Molding
Machine
By
Rahul M. Thaker
(Enrolment No. 130321708509)
Guided By
Ms. Neha B Joshi
Assistant professor, Mech. Engg. Dept.,
L. J. Institute of Engineering and Technology,
Ahmedabad, Gujarat
A Thesis submitted to
Gujarat Technological University
In partial fulfilment of the requirements for
The Degree of Master of Engineering in [CAD/CAM]
May-2015
L. J. Institute of Engineering and Technology,
LJ campus, S.G. Highway, Sarkhej,
Ahmedabad - 382210.
ii
CERTIFICATE
This is to certify that research work embodied in this project report entitled “Finite
Element Analysis and Design Optimization of Platen for Injection Molding
Machine” was carried out by Mr. Rahul M. Thaker (Enrollment No. 130320708509)
at L. J. Institute of Engineering and Technology, Ahmedabad for partial fulfillment of
M.E. degree to be awarded by Gujarat Technological University. This research work has
been carried out under my supervision and is to the satisfaction of department.
Date:
Place: Ahmedabad
Ms. Neha B. Joshi
Asst. Prof., PG. Dept.
LJIET, Ahmedabad
Ms Gayatri S. Pandi (Jain)
HOD, PG Dept.
LJIET, Ahmedabad
Dr. A. C. Suthar
Director
LJIET, Ahmedabad

iii
INDUSTRY CERTIFICATE

iv
COMPLIANCE CERTIFICATE This is to certify that research work embodied in this thesis entitled “Finite Element
Analysis and Design Optimization of Platen for Injection Molding Machine” was
carried out by Mr. Rahul M. Thaker (Enrollment No. 130320708509) at L. J. Institute
of Engineering and Technology, (032) for partial fulfilment of M.E. Mechanical
(CAD/CAM) degree to be awarded by Gujarat Technological University. He has
complied to the comments given by the Mid Semester Thesis Reviewer to my
satisfaction.
Date:-
Place:-Ahmedabad
Rahul M. Thaker
(Enrolment No.130320708509)
Ms. Neha B. Joshi
Asst. Prof., PG. Dept.
LJIET, Ahmedabad
v
PAPER PUBLICATION CERTIFICATE
This is to certify that research work embodied in this thesis entitled “Finite Element
Analysis and Design Optimization of Platen for Injection Molding Machine” was
carried out by Mr. Rahul M. Thaker (Enrollment No. 130320708509) at L. J. Institute
of Engineering and Technology, (032) for partial fulfilment of M.E. Mechanical
(CAD/CAM) degree to be awarded by Gujarat Technological University, has been
published in International Journal of Innovative Research in science & Technology,
during May, 2015.
Date: Place:-Ahmedabad
Rahul M. Thaker
(Enrolment No.130320708509)
Ms. Neha B. Joshi
Asst. Prof., PG. Dept.
LJIET, Ahmedabad
Dr. A. C. Suthar
Director
LJIET, Ahmedabad

vi
THESIS APPROVAL CERTIFICATE
This is to certify that research work embodied in this entitled “Finite Element Analysis
and Design Optimization of Platen for Injection Molding Machine” was carried out
by Rahul M. Thaker (130320708509) at L. J. Institute of Engineering and Technology
is approved for award of the degree of Master of Engineering in Mechanical
(CAD/CAM) by Gujarat Technological University.
Date:
Place:
Examiner Sign and Name:
............................. .............................
( ) ( )

vii
DECLARATION OF ORGINALITY
I hereby certify that I am the sole author of this project report and that neither any
part of this nor the whole of the project report has been submitted for a degree to any
other University or Institution.
I certify that, to the best of my knowledge, my project report does not infringe
upon anyone’s copyright nor violate any proprietary rights and that any ideas,
techniques, quotations, or any other material from the work of other people included in
my project report, published or otherwise, are fully acknowledged in accordance with
the standard referencing practices. Furthermore, to the extent that I have included
copyrighted material that surpasses the bounds of fair dealing within the meaning of
the Indian Copyright Act, I certify that I have obtained a written permission from the
copyright owner(s) to include such material(s) in my project report and have included
copies of such copyright clearances to my appendix.
I declare that this is a true copy of my project report, including any final
revisions, as approved by my project report review committee.
Date:
Place: Ahmedabad
Rahul M. Thaker
(Enrolment No.130320708509)
Ms. Neha B. Joshi
Asst. Prof., PG. Dept.
LJIET, Ahmedabad (032)

viii
AKNOWLEDGEMENT
I express my deep gratitude and respect to my guide Ms. Neha B Joshi, Assistant
Professor in Mechanical Department, L.J.I.E.T., Ahmedabad for her valuable guidance,
motivation, cooperation, constant support with encouraging attitude at all stages of my
work. I am highly obliged to her for her constructive criticism and valuable suggestions,
which helped me to present the scientific suggestion in an efficient and effective manner
in this thesis. I thank her from bottom of my heart.
I am highly thankful to Mr. Nikunj Desai, Industrial Guide in Design
Department, Windsor India Pvt. Ltd. for his valuable guidance and proper suggestions
for solving difficulties during my work.
I would also like to thank Ms. Gayatri Pandi (Jain), Head of PG Department,
L.J.I.E.T., Ahmedabad for her constant guidance, encouragement and academic support.
I owe my most sincere gratitude to my parents whose blessing and honest support
has given me energy to start my work successfully. I admire my parents determination
and sacrifice helped me during the difficult moments of my life. Thank is a very small
words for this. Last but not the least thanks to almighty for giving me such a platform.
Rahul M. Thaker
M.E. (CAD/CAM)
(Enrolment No.130320708509)

ix
TABLE OF CONTENTS
Title page i
Certificate ii
Industry certificate iii
Compliance certificate iv
Paper publication certificate v
Thesis approval certificate vi
Declaration of Originality vii
Acknowledgement viii
Table of contents ix
List of figures xii
List of Table xiv
Abstract xv
Chapter 1. Introduction 1
1.1 Overview 1
1.2 Components of Plastic Injection Molding Machine 2
1.3 Injection system 4
1.4 Application of Plastic Injection Molding Machine 9
Chapter 2. Literature review 10
2.1 Review of research papers 10
2.2 Abstract of entire review 18
Chapter 3. Project work out 19
3.1 Objective of Thesis 19
3.2 Project road map 20
3.3 Various Forces act on Plastic Injection Molding Machine 21
3.4 Machine Parameters 23
3.5 Force Analysis 25
3.5.1 Calculation of Applied Pressure 25

x
3.5.2 Types of Molds mounted on Platen 27
Chapter 4. Modeling 28
4.1 Introduction 28
4.1.1 Introduction About Solid Works 28
4.1.2 Difference between solidworks and other CAD systems 28
4.1.3 Machining Drawing 29
Chapter 5. FE Analysis 30
5.1 Introduction 30
5.2 ANSYS Package 30
5.3 Analysis Results of Platen 30
5.3.1 FE Analysis of End Platen 31
5.3.2 Thermal analysis on stationary platen 36
Chapter 6. Experimental Setup and Methodology 38
6.1 Taguchi’s Philosophy 38
6.2 Taguchi Method’s Categories 39
6.2.1 Static Problems 39
6.3 Parameters Consideration For Experiment 40
6.4 Selection of Orthogonal Array (OA) 41
6.5 Variation in Parameter for Taguchi’s Design 43
6.6 Data Analysis 52
Chapter 7. Analysis and Discussion of Results 53
7.1 Testing Results 53
7.2 Analysis Software Minitab16 53
7.3 S/N Ratio Calculation for Stress And Deformation 54
7.3.1 Main Effects Plot of Stress 55
7.3.2 Main Effects Plot of Deformation 56
7.4 Analysis of Variance 57
7.4.1 Analysis of Variance for stre 58

xi
7.4.1 Analysis of Variance for deformation 59
Chapter 8. Result And Discussion 63
Chapter 9. Conclusion 64
References 65
Appendix-A:Review comment card 68
Appendix-B:Plagiarism report 73
Appendix-C:Review paper 75
Appendix-D:Published paper 80
xii
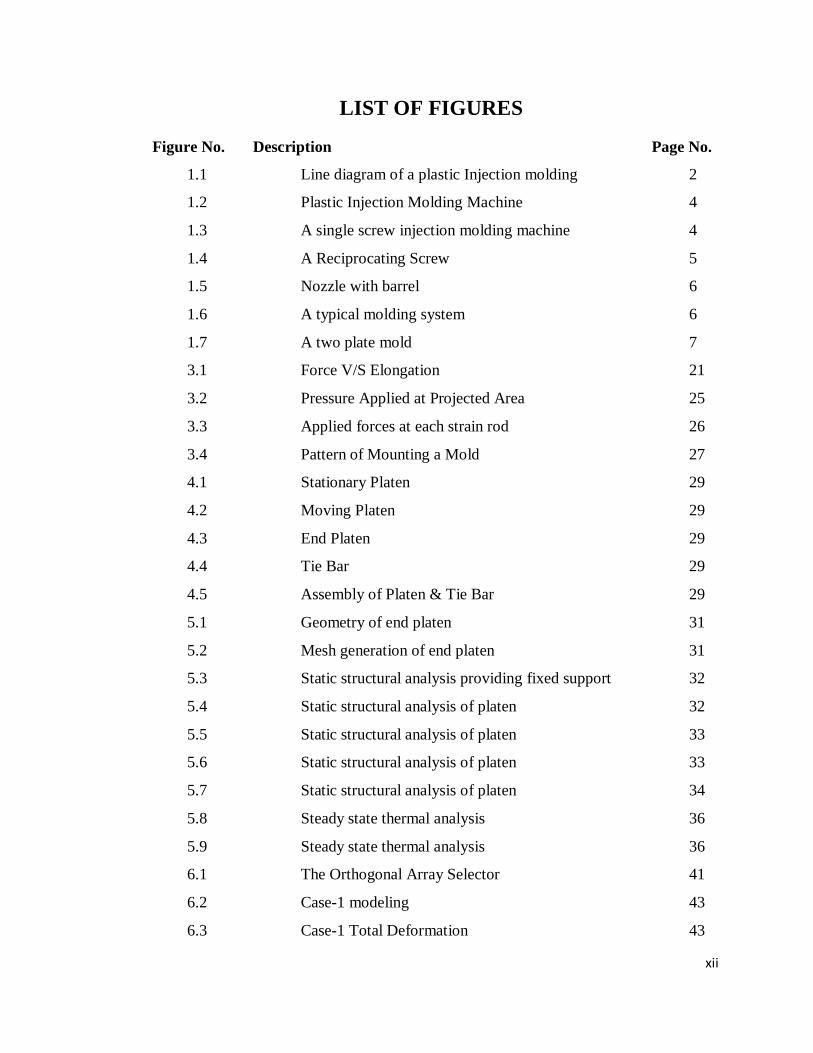
LIST OF FIGURES
Figure No. Description Page No.
1.1 Line diagram of a plastic Injection molding
machine
2
1.2 Plastic Injection Molding Machine 4
1.3 A single screw injection molding machine 4
1.4 A Reciprocating Screw 5
1.5 Nozzle with barrel 6
1.6 A typical molding system 6
1.7 A two plate mold 7
3.1 Force V/S Elongation 21
3.2 Pressure Applied at Projected Area 25
3.3 Applied forces at each strain rod 26
3.4 Pattern of Mounting a Mold 27
4.1 Stationary Platen 29
4.2 Moving Platen 29
4.3 End Platen 29
4.4 Tie Bar 29
4.5 Assembly of Platen & Tie Bar 29
5.1 Geometry of end platen 31
5.2 Mesh generation of end platen 31
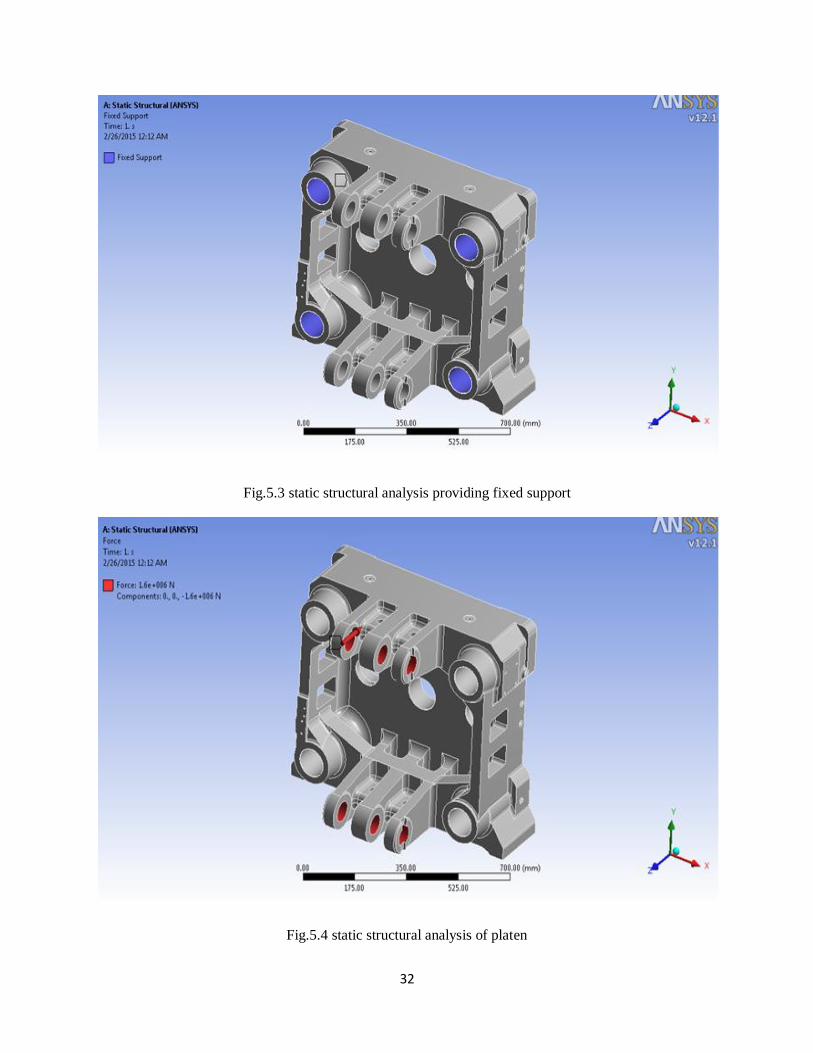
5.3 Static structural analysis providing fixed support 32
5.4 Static structural analysis of platen 32
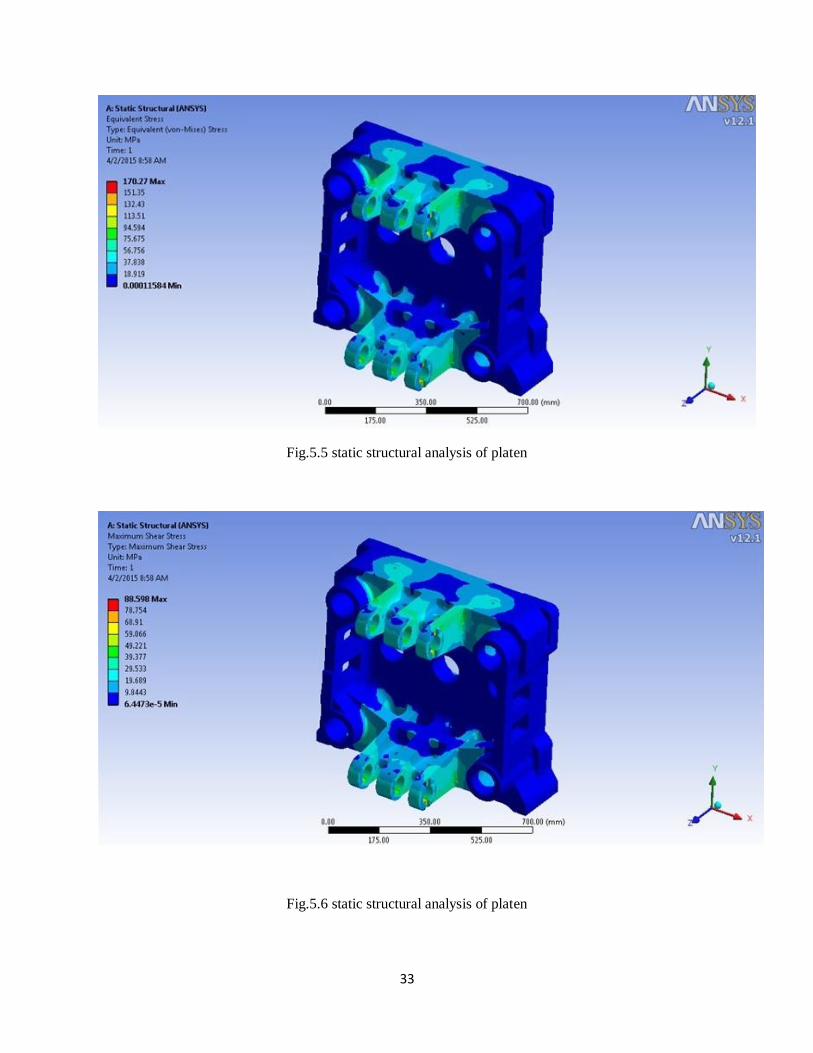
5.5 Static structural analysis of platen 33
5.6 Static structural analysis of platen 33
5.7 Static structural analysis of platen 34
5.8 Steady state thermal analysis 36
5.9 Steady state thermal analysis 36
6.1 The Orthogonal Array Selector 41
6.2 Case-1 modeling 43
6.3 Case-1 Total Deformation 43
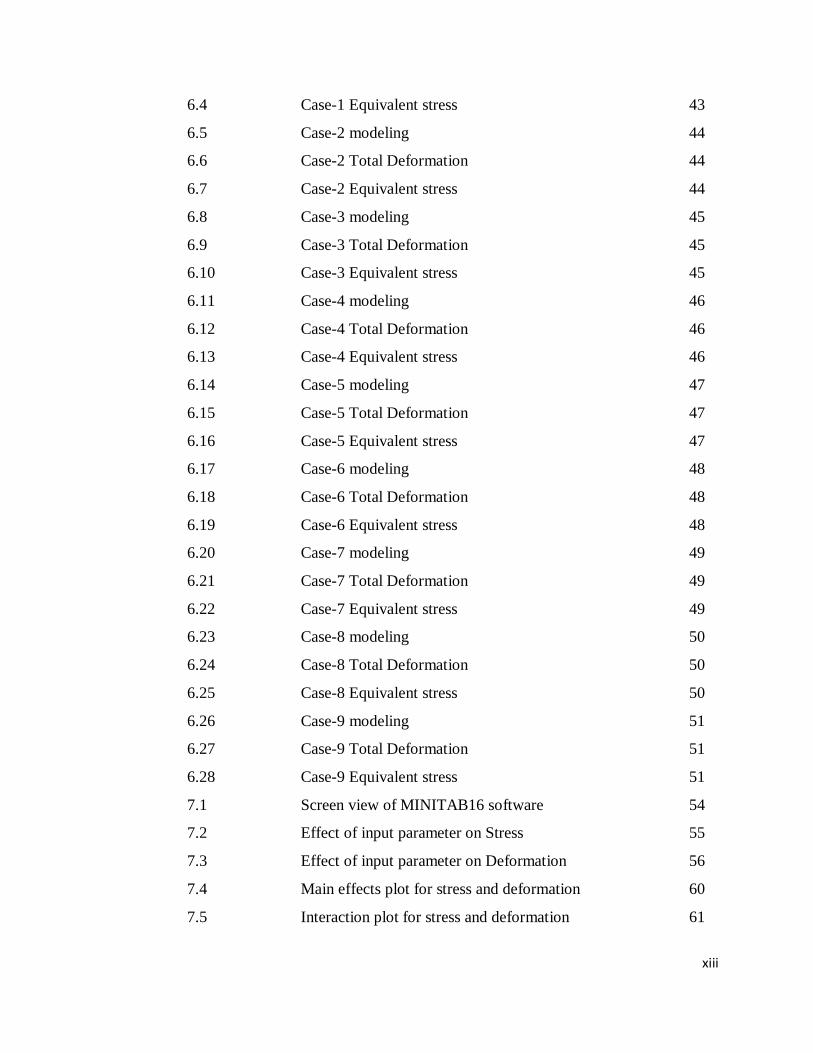
xiii
6.4 Case-1 Equivalent stress 43
6.5 Case-2 modeling 44
6.6 Case-2 Total Deformation 44
6.7 Case-2 Equivalent stress 44
6.8 Case-3 modeling 45
6.9 Case-3 Total Deformation 45
6.10 Case-3 Equivalent stress 45
6.11 Case-4 modeling 46
6.12 Case-4 Total Deformation 46
6.13 Case-4 Equivalent stress 46
6.14 Case-5 modeling 47
6.15 Case-5 Total Deformation 47
6.16 Case-5 Equivalent stress 47
6.17 Case-6 modeling 48
6.18 Case-6 Total Deformation 48
6.19 Case-6 Equivalent stress 48
6.20 Case-7 modeling 49
6.21 Case-7 Total Deformation 49
6.22 Case-7 Equivalent stress 49
6.23 Case-8 modeling 50
6.24 Case-8 Total Deformation 50
6.25 Case-8 Equivalent stress 50
6.26 Case-9 modeling 51
6.27 Case-9 Total Deformation 51
6.28 Case-9 Equivalent stress 51
7.1 Screen view of MINITAB16 software 54
7.2 Effect of input parameter on Stress 55
7.3 Effect of input parameter on Deformation 56
7.4 Main effects plot for stress and deformation 60
7.5 Interaction plot for stress and deformation 61
xiv
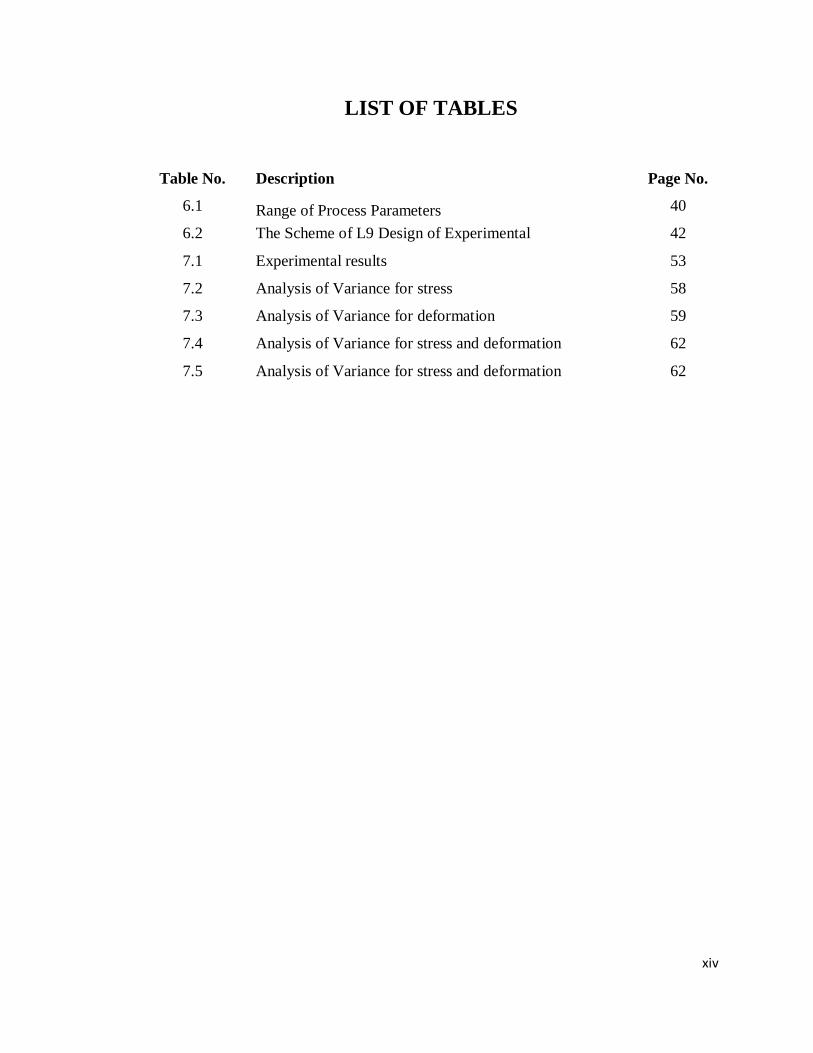
LIST OF TABLES
Table No. Description Page No.
6.1 Range of Process Parameters 40
6.2 The Scheme of L9 Design of Experimental 42
7.1 Experimental results 53
7.2 Analysis of Variance for stress 58
7.3 Analysis of Variance for deformation 59
7.4 Analysis of Variance for stress and deformation 62
7.5 Analysis of Variance for stress and deformation 62
xv
Finite Element Analysis and Design Optimization of Platen for
Injection Molding Machine
By
Rahul M. Thaker
(Enrolment No. 130320708509)
Gudied By
Ms. Neha B. Joshi
Assistant professor, Mech. Engg.
Dept. LJIET, Ahmedabad
ABSTRACT
Plastics are certainly most versatile of all known materials today and have
therefore, established themselves in enviable position from where are not even possible to
replaced. Injection molding machine is one of the most widely used method of
conversion of plastic into various end products application to wide range of plastic
materials from plastic commodity to specialty engineering plastic. In injection molding
machine platen play a very important role. During the process generally compressive
stress generates at particular regions. As load varies with fast rate there is chance to
failure of tie bar rod. Due to heavy mould shape, size of platen also change, that’s
increase its weight as well as stress level at certain region and this is not good in practice.
This leads to failure of platen or failure of tie rod due to stretching by nut and platen. The
aim of this research is study about those areas where stress can affect the failure of tie bar
due to heavy weight of platen the deflection or misalignment with movable platen.
Finally redistribution of stress so that uniform stress achieve (optimization of platen).
This project is including Finite Element Analysis and Optimization of a Typical
Structural Component of a Plastic Injection Molding Machine. The aim of project is to
optimize a typical structural component (platen) by using finite element analysis after
checking induced stresses with allowable design stress. Optimize design of platen with
the use of removing material from them. Hence design modification of platen is carried
out to achieve good strength and cost effectiveness.
1
CHAPTER-1
INTRODUCTION
1.1 Plastic Injection Molding Machine Overview
Plastics are certainly the most versatile of all known material today and have, therefore,
established themselves in an enviable position from where they are not even possible to
be displaced.
The most common method of conversion of plastics are: -
Compression Molding
Injection Molding
Blow Molding
Extrusion And Thermoforming
Injection molding is one of the principle methods of conversions of plastics into various
end-products using a very wide range of plastics materials from commodity plastics to
specialty engineering plastics.
A large variety of molding machines are manufacture in the country with the
indigenously developed technology as well as in collaboration with the world leaders to
indigenously manufacture machines of world standards. Clamping force, low pressure
molding machines, gas injection molding machines, multi component molding
machines‟s co-injection molding machines or some very special tailor-made machines
dedicated to specific end-uses and polymers.
The facilities for mold making have also developed over the years and even the most
difficult and sophisticated molds are now being designed and fabricated in India. The
potential for the injection molded products is tremendous in our country.
2
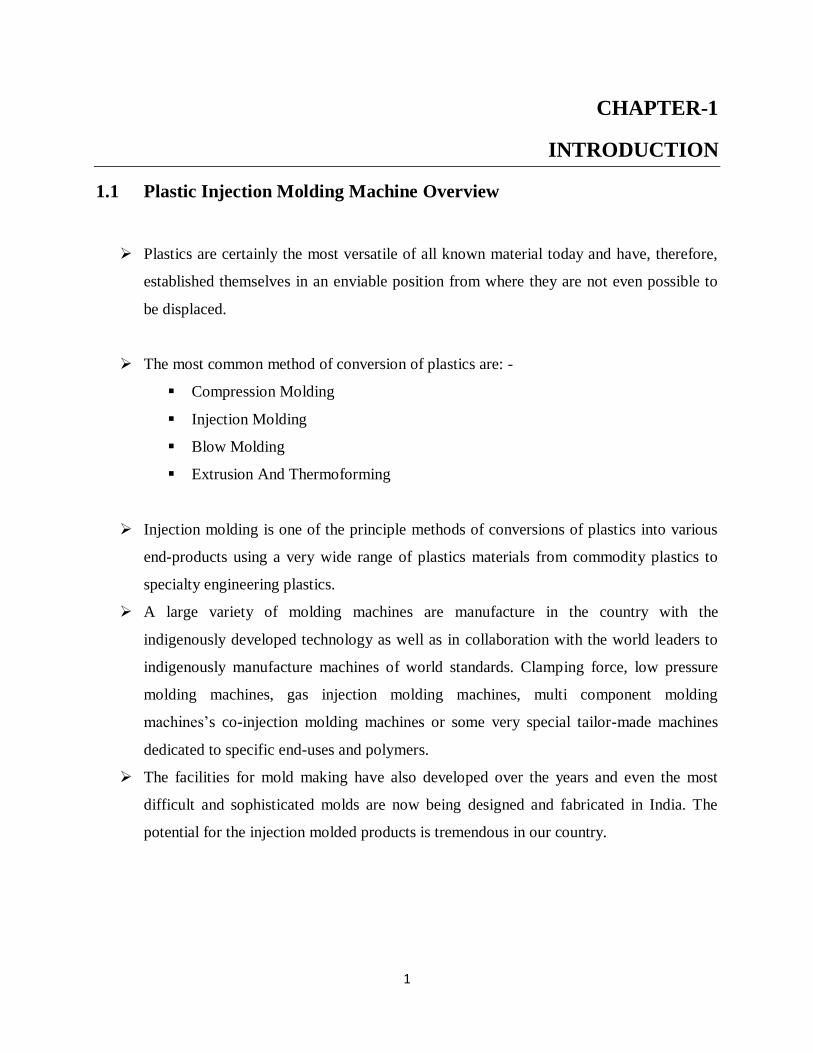
Courtesy: www.plasticsdome.com
Fig 1.1 Line diagram of a Injection molding machine[21]
1.2 Components of Plastic Injection Molding Machine:
1.2.1 Types of Machine
These are broadly classified as plunger and screw types.
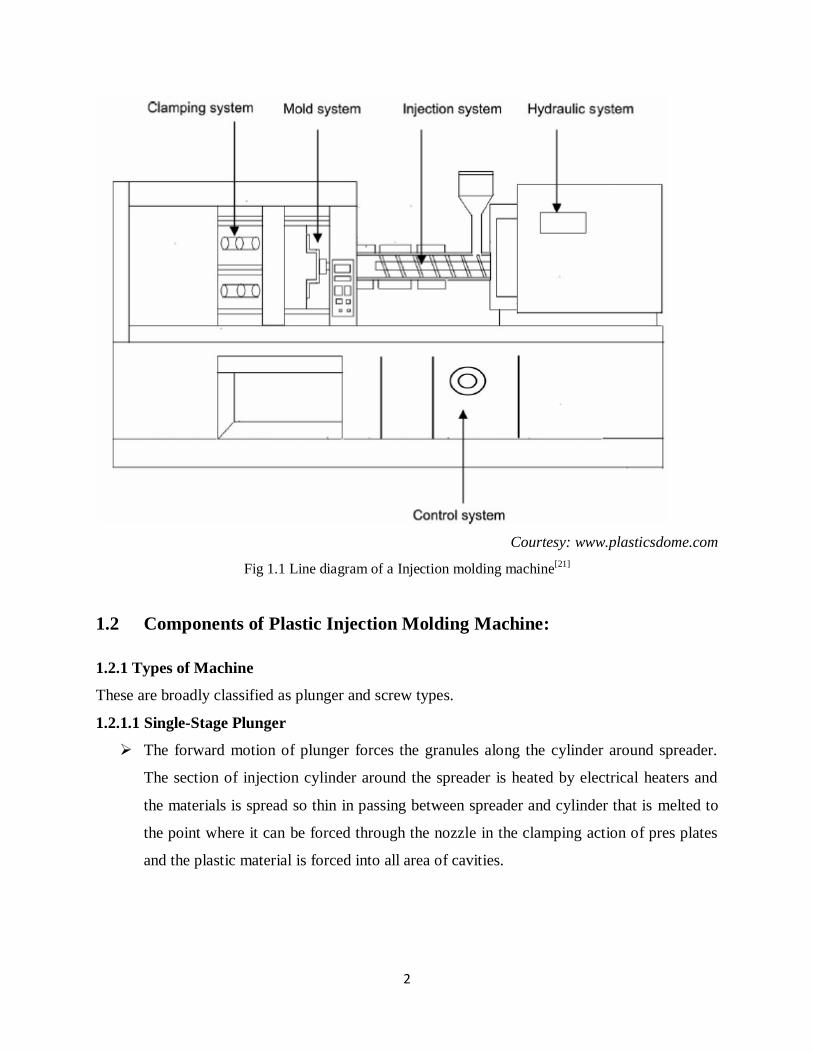
1.2.1.1 Single-Stage Plunger
The forward motion of plunger forces the granules along the cylinder around spreader.
The section of injection cylinder around the spreader is heated by electrical heaters and
the materials is spread so thin in passing between spreader and cylinder that is melted to
the point where it can be forced through the nozzle in the clamping action of pres plates
and the plastic material is forced into all area of cavities.
3
1.2.1.2 Two-Stage Plunger Machine
This equipment involves two plungers, one on top of the other. One plasticizes the
material and feeds it to the other cylinder where the second one, which is stronger,
operates as shooting plunger and pushes plasticized materials into the mould.
1.2.1.3 Two-Stage Screw Plunger Machine
Here the action of screw serves to work and melt the resin and feed it to the second
plunger unit, where the injection ram forces it forward into the mould.
1.2.1.4 Reciprocating Screw Type Machine
In this machine the plunger/spreader has is a key to the plunger type machine, is replaced
by a reciprocating screw, which moves back and forth within the heating cylinder. As the
screw rotates, the flights pick up the feed of granular material from the hopper and force
it along the hot cylinder barrel.
The complete cycle can be depicted as under: -
1. Oil is set behind the clamp ram closing the mould. Pressure builds up to develop enough
force to keep mould closed while the injection process occurs.
2. Previously plasticized material, in front of reciprocating screw, is forced into the mould
by the hydraulic injection cylinders.
3. Pressure is maintained on the material to mould a part free from sink marks, flow marks,
welds and other defects.
4. At the end of this period, the screw starts to turn plasticizing material for next shot.
5. While this is occurring, the plastic is cooling in the mould and solidifying to a point
whereby it can be ejected successfully. This cooling is accomplished by circulating a
cooling media, usually water, through drilled holes or channels in mould base, cavities
and cores.
6. Oil is sent to return port of clamping ram, separating the mould halves.
7. As moving platen returns, the knock-out or ejection mechanism is activated removing
pieces from the mould.

4
Fig 1.2 Plastic Injection Molding Machine [21]
1.3 Injection system
The injection system consists of a hopper, a reciprocating screw and barrel assembly, and
an injection nozzle, as shown in Fig 1.4. This system confinesand transports the plastic as
it progresses through the feeding, compressing, degassing, melting, injection, and
packing stages.
Fig. 1.3 single screw injection molding machine[22]
Hopper
Thermoplastic material is supplied to molders in the form of small pellets. The hopper on
the injection molding machine holds these pellets. The pellets are gravity-fed from the
hopper through the hopper throat into the barrel and screw assembly.
5
Barrel
As shown in Fig 1.4, the barrel of the injection molding machine supportsthe
reciprocating plasticizing screw. It is heated by the electric heater bands.
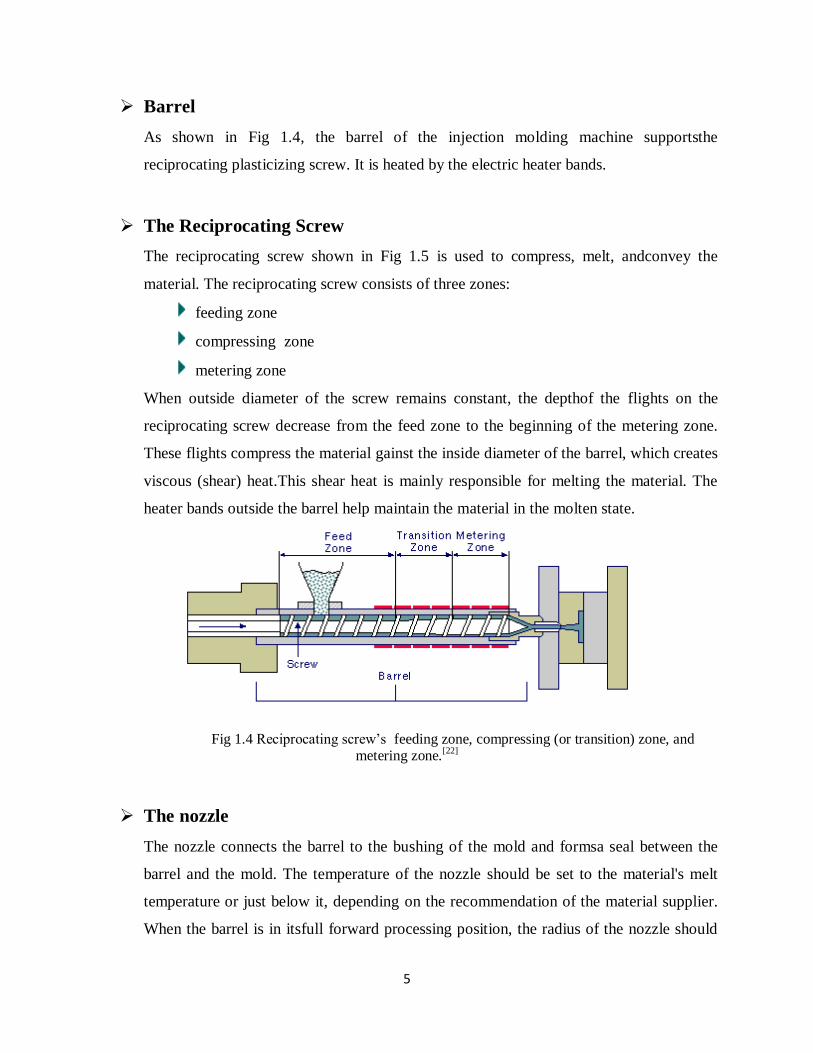
The Reciprocating Screw
The reciprocating screw shown in Fig 1.5 is used to compress, melt, andconvey the
material. The reciprocating screw consists of three zones:
feeding zone
compressing zone
metering zone
When outside diameter of the screw remains constant, the depthof the flights on the
reciprocating screw decrease from the feed zone to the beginning of the metering zone.
These flights compress the material gainst the inside diameter of the barrel, which creates
viscous (shear) heat.This shear heat is mainly responsible for melting the material. The
heater bands outside the barrel help maintain the material in the molten state.
Fig 1.4 Reciprocating screw‟s feeding zone, compressing (or transition) zone, and metering zone.
[22]
The nozzle
The nozzle connects the barrel to the bushing of the mold and formsa seal between the
barrel and the mold. The temperature of the nozzle should be set to the material's melt
temperature or just below it, depending on the recommendation of the material supplier.
When the barrel is in itsfull forward processing position, the radius of the nozzle should
6
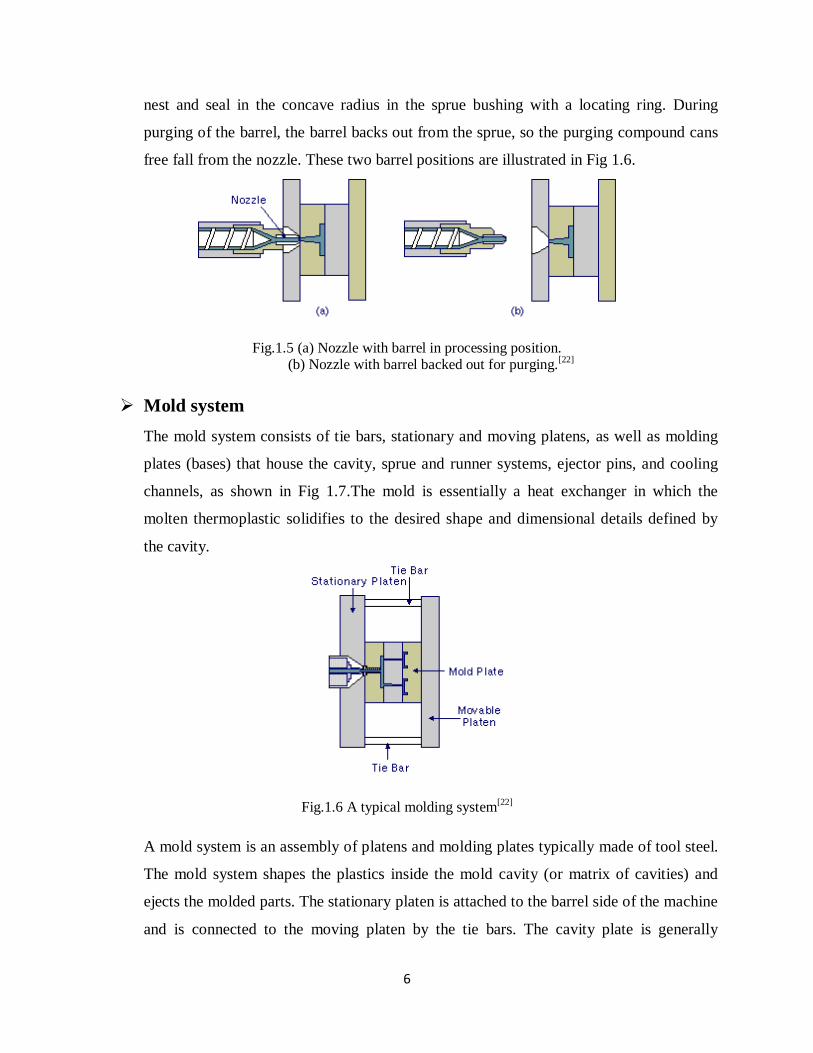
nest and seal in the concave radius in the sprue bushing with a locating ring. During
purging of the barrel, the barrel backs out from the sprue, so the purging compound cans
free fall from the nozzle. These two barrel positions are illustrated in Fig 1.6.
Fig.1.5 (a) Nozzle with barrel in processing position. (b) Nozzle with barrel backed out for purging.
[22]
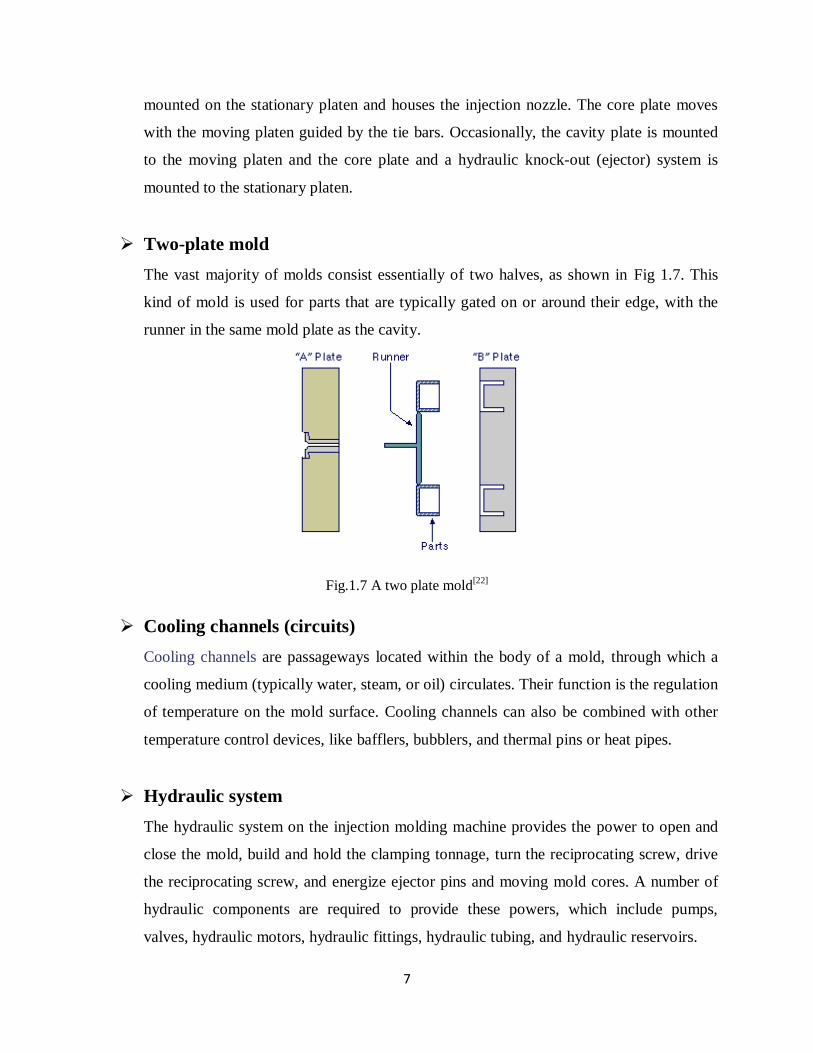
Mold system
The mold system consists of tie bars, stationary and moving platens, as well as molding
plates (bases) that house the cavity, sprue and runner systems, ejector pins, and cooling
channels, as shown in Fig 1.7.The mold is essentially a heat exchanger in which the
molten thermoplastic solidifies to the desired shape and dimensional details defined by
the cavity.
Fig.1.6 A typical molding system[22]
A mold system is an assembly of platens and molding plates typically made of tool steel.
The mold system shapes the plastics inside the mold cavity (or matrix of cavities) and
ejects the molded parts. The stationary platen is attached to the barrel side of the machine
and is connected to the moving platen by the tie bars. The cavity plate is generally
7
mounted on the stationary platen and houses the injection nozzle. The core plate moves
with the moving platen guided by the tie bars. Occasionally, the cavity plate is mounted
to the moving platen and the core plate and a hydraulic knock-out (ejector) system is
mounted to the stationary platen.
Two-plate mold
The vast majority of molds consist essentially of two halves, as shown in Fig 1.7. This
kind of mold is used for parts that are typically gated on or around their edge, with the
runner in the same mold plate as the cavity.
Fig.1.7 A two plate mold[22]
Cooling channels (circuits)
Cooling channels are passageways located within the body of a mold, through which a
cooling medium (typically water, steam, or oil) circulates. Their function is the regulation
of temperature on the mold surface. Cooling channels can also be combined with other
temperature control devices, like bafflers, bubblers, and thermal pins or heat pipes.
Hydraulic system
The hydraulic system on the injection molding machine provides the power to open and
close the mold, build and hold the clamping tonnage, turn the reciprocating screw, drive
the reciprocating screw, and energize ejector pins and moving mold cores. A number of
hydraulic components are required to provide these powers, which include pumps,
valves, hydraulic motors, hydraulic fittings, hydraulic tubing, and hydraulic reservoirs.

8
Control system
The control system provides consistency and repeatability in machine operation. It
monitors and controls the processing parameters, including the temperature, pressure,
injection speed, screw speed and position, and hydraulic position. The process control has
a direct impact on the final part quality and the economics of the process. Process control
systems can range from a simple relay on/off control to an extremely sophisticated
microprocessor-based, closed-loop control.
Clamping system
The clamping system opens and closes the mold, supports and carries the constituent
parts of the mold, and generates sufficient force to prevent the mold from opening.
Clamping force can be generated by a mechanical (toggle) lock, hydraulic lock, or a
combination of the two basic types.
Cold runners
After molding, the cold-runner delivery system is trimmed off and recycled. Therefore,
the delivery system is normally designed to consume minimum material, while
maintaining the function of delivering molten plastic to the cavity in a desirable pattern.
Hot runners
The hot-runner (or runner less) molding process keeps the runners hot in order to
maintain the plastic in a molten state at all times. Since the hot runner system is not
removed from the mold with the molded part, it saves material and eliminates the
secondary trimming process.
9
1.4 Application of Plastic Injection Molding Machine:
In Automobile application like Radiator Fan, Air Separator.
In engineering application like Pipe End Cap, Pipe Coupler, Textile Bobbin.
Computers & Accessories: Mouse, Key Board Parts.
Electrical & Electronics: 2 point socket, Miracle Base.
Furniture: Back chair with arm.
Food / Non Food Containers: Plastic Container, Round Container.
Medical / Lab: Measuring Cup, Lab Tray.
Writing Instruments / Stationeries: Pen Barrel, Scale.
Automotive Structural Parts.
TV Cabinets.
Computer Monitor-housing.
Rigid Packaging Containers.

10
CHAPTER-2
LITRETURE REVIEW
2.1 REVIEW OF RESEARCH PAPERS
C.Sasikumar, S.Srikanth, S.K.Das (January-2006)[1]
“Analysis of premature failure of a tie bar in an injection molding machine”
In this paper researcher, the tie bars are subjected to a pulsating cyclic loading during the plastic
molding process. The failure was occur at the root of the first thread of transverse fatigue
fracture induced by a pulsating tensile stress with multiple points of high stress concentration.
The high stress concentrations appear to have introduced with a combination of improper
molding parameters resulting in uneven tensions in the four tie bars and aggravated by the
presence of some material defects. The material defects observed are inclusions, presence of
some retained austenite and fine cracks. The tie bar of the injection-molding machine has failed
at the root of the thread by fatigue fracture induced in a combination of pulsating cyclic tensile
stress and a component of torsional stress with multiple points of high stress concentration. High
stress concentrations have introduced with a combination of improper molding parameters
resulting in uneven tensions in the four tie bars and significant amount of material defects.The
fatigue crack has initiated at the root of the final thread at an inclusion and propagated through
the inclusions and fine cracks inherently present in the material. Once the diameter of the tie bar
is reduced due to the propagation of fatigue fracture and reaches the critical diameter, the final
failure has occurred by ductile fracture due to overload.
Z.W.jiao,P.C.Xie, Y.An,X.T.Wang, W.M.Yang ( June-2011)[2]
“Development of internal circulation two-platen IMM for Thermoplastic Polymer”
In this research proposed and designed an internal circulation two-platen IMM, which can
produce plastic parts while maintaining excellent quality. Experimental tests performed on the
IMM prototype CHH200 (results of which were compared with a toggle IMM of the same

11
specification) show that the clamping force partial load rate and clamping force repeatability of
CHH200 are higher than those of the toggle IMM. Items produced by IMM CHH200 are shown
to be more precise, with weight repeatability reaching 0.867%. and a low energy consumption of
0.395 kWh/kg. Utilizing the IMM, ultra-precise plastics parts used in automobiles, IT,
medicines, and many other products can be molded with lower equipment cost and power cost.
Energy consumption for the internal circulation two-platen IMM is below 0.4 kWh/kg. The
structure of the internal circulation two-platen IMM‟s simple, with the CHH200‟s number of
parts being 46 less than that of a toggle machine‟s of the same specification. The internal
circulation two-platen clamping unit can achieve strong mold adaptability. Weight repeatability
for the CHH200 can reach as low as 0.867%.
George Z. Voyiadjis, PawelWoelke (august-2005)[3]
“General non-linear finite element analysis of thick plates and shells”
In this paper researcher presented a non-linear FE analysis, for the elasto-plastic behavior of
thick shells and plates including the effect of large rotations. In the treatment of material non-
linearities the authors adopt:
I. A non-layered approach and a plastic node method.
II. A yield function expressed in terms of stress resultants and stress couples modified to
investigate the development of plastic deformations across the thickness, as well as the
influence of the transverse shear forces on plastic behavior of plates and shells.
III. Isotropic and kinematic hardening rules.
Hence, Non-linear finite element analysis had used for assembly analysis to analyze the exact
values of stress and deflection at the moving platen because there is a bonded contact between
the mating components of assembly, therefore there will be a non-linear behavior of the analysis.
Patel Niral ,MihirChauhan ( March-2013)[4]
“FEA and Topology Optimization of 1000T Clamp Cylinder for Injection Molding
Machine”
12
The paper consist the detail design of clamp cylinder for 1000 ton injection machine with
topology optimization. The design is carried out based on calculated diameter and thickness.
Modeling and FEA is doing for newly designed 1000T clamp cylinder and to be verified with
theoretical calculation and acceptance criteria. The topology optimization of clamp cylinder is
also carried out using CAE tools to reduce weight with the constraints of standard operating
condition. Topology optimization is a mathematical approach which optimizes the material
layout within a given design space, under given set of loading and boundary condition. Fourteen
iterations were required to solve this the optimization problem. The optimized model is equally
strong and light in weight compared to existing model. After modify the topology of the clamp
cylinder the maximum principle stresses and the total deformation within the permissible limits,
but substantial reduction of the material hence weight have been obtained. Hence the purpose of
the topology optimization serves. The topology optimization of the component is carried out and
substantial reduction in weight about 70 kg is obtained.
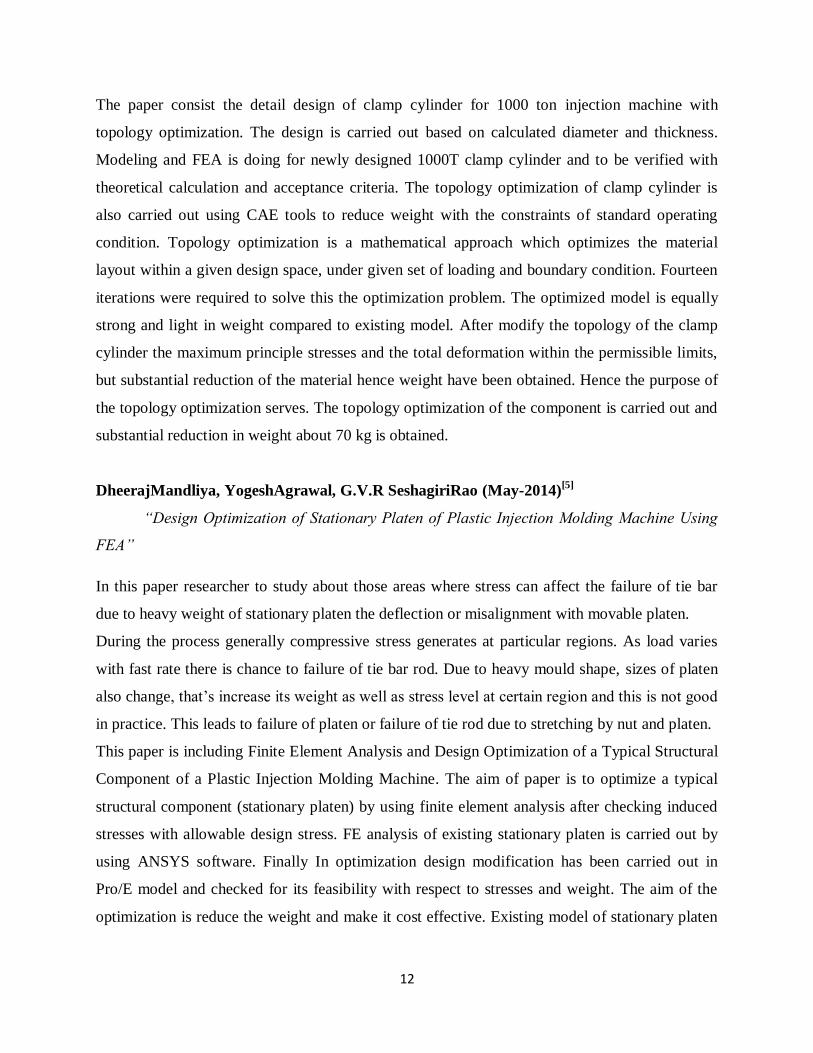
DheerajMandliya, YogeshAgrawal, G.V.R SeshagiriRao (May-2014)[5]
“Design Optimization of Stationary Platen of Plastic Injection Molding Machine Using
FEA”
In this paper researcher to study about those areas where stress can affect the failure of tie bar
due to heavy weight of stationary platen the deflection or misalignment with movable platen.
During the process generally compressive stress generates at particular regions. As load varies
with fast rate there is chance to failure of tie bar rod. Due to heavy mould shape, sizes of platen
also change, that‟s increase its weight as well as stress level at certain region and this is not good
in practice. This leads to failure of platen or failure of tie rod due to stretching by nut and platen.
This paper is including Finite Element Analysis and Design Optimization of a Typical Structural
Component of a Plastic Injection Molding Machine. The aim of paper is to optimize a typical
structural component (stationary platen) by using finite element analysis after checking induced
stresses with allowable design stress. FE analysis of existing stationary platen is carried out by
using ANSYS software. Finally In optimization design modification has been carried out in
Pro/E model and checked for its feasibility with respect to stresses and weight. The aim of the
optimization is reduce the weight and make it cost effective. Existing model of stationary platen

13
has dome type shape. Dome type shape is converted in to box type which resulted in reduction of
overall thickness of platen to the tune of 5 %.
Shu Huang Sun (Septmber-2004)[6]
“Optimum topology design for the stationary platen of a plastic injection machine”
In this paper researcher main objective is to design the structure of the stationary platen with
optimized stiffness at minimal raw material cost. Tie bars are key components of a plastic
injection machine. They very easily fatigue in periodically long term operations due to the
bending moment transferred to them by the bending of the stationary platen. This problem can be
easily overcome by reducing the deflection of the stationary platen through topology
optimization of the platen structure by applying a cost or weight constraint. In this paper, the
self-organization method was introduced to optimize the topology of the stationary platen. This
method is to modify the Young‟s modulus of each element according to the ratio of its stress and
the average stress of the entire model after each FEM analysis. By applying this method to the
stationary platen design, the deflection of the platen could be reduced, which correspondingly
reduces the bending load of the tie bars and thus extending their operating life. The proposed
stationary platen design was almost identical to that used in a commercial machine Also, the
proposed method herein, proved the effectiveness of the existing platen design through a simple
and systematic scientific way.
Mold Flow Corporation, USA (s2005)[7]
“Simulation of core shift and Injection Molding Machine clamp over-tonnage using
Mold-flow plastics”
In this paper researcher said, when the clamp force of the machine is exceeded to the limit, the
tie bars stretch. The mold will open the amount of the stretch, increasing the wall thickness of the
part. As the part shrinks, the clamp force is reduced and the mold will shut. In most molds, the
pressure distribution is not even, so the stretching of the tie-bars is not uniform. The ends of the
tie-bars that are not attached to the platen have a displacement load applied to them which

14
represent the stretch applied to the tie-bars based on the clamp force applied to the mold.This is
calculated based on the following relationship: -
Clamp force ∗ (length of the tie bars )
(Modulus E of the tie bars) ∗ (total transverse area of the tie bars)
The total amount of the bending of the moving platen and elongation of the Tie-bars depend
upon the maximum camping force applied by the machine.
D. Papageorgiou, C. Medrea , N. Kyriakou( march 2013)[8]
“Failure analysis of H13 working die used in plastic injection moulding”
This paper is focused on the failure of a die used in plastic injection molding. The die was made
from AISI H13 steel and was intended for the production of plastic cups used for the outer
closure of cylindrical aluminum cans in coffee packaging. Extended corrosion damage on
various areas of the metallic part and a wide crack can be observed by the naked eye. The design
deficiency and improper cooling conditions generated a complex fatigue-corrosion cracking
mechanism that lead to the damage of the die after half of its predicted service life. Poor design
and improper cooling agent are responsible for the die failure. The water corroded the cooling
surface leading to increased surface roughness. The surface irregularities converted the laminar
liquid flow into turbulence. Corroded crack tip worsens the stress contribution around it and
accelerates crack propagation. The crack propagated towards the mould-surface and ended at the
injection hole. The most effective method to prevent similar failures is the reduction of the stress
contribution. Furthermore, the intensive corrosion could have been avoided by using salt-free
cooling water. In addition, selection of corrosion fatigue resistant steels is desirable.
Ph.D. Eng. VolodymyrKrasinskiy(2012)[9]
“Optimization of Injection Molding Manufacturing For Automotive Industry”
This paper deals with optimization of injection molding process. Optimization of process with
configuration of main parameters influences on velocity of injection cycle, quality of moulds and

15
energy consumption. The aim is to reduce the time of the injection process and reduce the
number of defective parts during mass production. Examination analyzing injection molding
production process and optimize the manufacturing process using software. The task of the
optimization was to create moldings with required quality in the shorter injection cycle, without
compromising their quality. The simulation included a test of process parameters obtained during
the optimization of injection molding process. Fill analysis of the cavity and injection pressure
analysis revealed the cause of burns in two places between inlet moldings. Analysis of quality
prediction revealed the possible problems during production and confirms problems from praxis.
Optimization of the injection cycle and error analysis yielded shortens production cycle and
reduced the proportion of waste during production because of visual defects. Thus optimization
of this part and process saves the energy and material costs.
Li-ping Ding, Jian-rong Tan, ZheWei(January-2010)[10]
“Multi-Objective Performance Design Of Injection Molding Machine Via A New Multi-
Objective Optimization Algorithm”
To solve the multi-objective optimization problem of injection molding machine product's
overall performance, the optimal design of injection molding machine is studied and the design
problem is formulated as a constrained multi-objective problem involving continuous and
discrete design variables. Furthermore, with the K means of joint support vector clustering
method to reduce the number of external stocks, a new multi-objective optimization algorithm
KSVC-SPEA is proposed. Then, taking the multi-objective optimization of the overall
performance of the HT160X1N high-speed injection molding machine as an example, the
traditional linear weighting methods, Strength Pareto Evolutionary Algorithm (SPEA) and the
KSCV-SPEA are applied. The traditional linear weighting method and the KSCV-SPEA are
applied to the optimization design problem of the HT160X1N injection molding machine's
overall performance respectively. The optimization results show that the Pareto frontier achieved
by the KSCV-SPEA has better border and distribution. In addition, through the computations of
the cases with external population at different scales, it can be noticed that the KSVC clustering
method can effectively improve the performance of clustering operations of the large scale
population, meaning the computing efficiency are improved signicantly.

16
Xiaowei Li, Zhiming Jin, Yajun Zhang[11]
“Kinematic calculation analysis of micro injection molding machine with double-toggle
clamping mechanism based on MATLAB”
The geometric model of micro injection molding machine with double-toggle clamping
mechanism is established to analyses the kinematic and mechanical performance of double
toggle clamping mechanism. The kinematic analysis of the double-toggle clamping mechanism
is used to study the effects of the double-toggle parameters for the microstructure injection
molding machine. The parameters discussed in this paper include the amplification ratio, velocity
ratio and the amplified force ratio for the double-toggle clamping mechanism. The optimized
parameters of clamping mechanism are obtained according the calculation results of stroke ratio,
velocity ratio and the amplified force ratio. This paper is based on the geometric model of
double-toggle clamping mechanism. After analyzing the mechanical and kinematic performance
of the mechanism specially, the mathematic expression of geometry and position dimensions,
stroke, velocity and force amplified ratio, which settles theoretic foundation for the calculation
analysis of MATLAB.
Amol J. Asalekar(sept-2014)[12]
“Design & Analysis in Injection Moulding Machine System to Reduce the Torsional
Failure of Screw”
The plastic being melted in injection molding machine and then injected into the mould. The
barrel contains reciprocating screw for injecting the material into the mould and the material is
also melted into the barrel. This project deals with, the solution of problem occurred for
reciprocating screw of Injection molding machine. It identifies and solves the problem by using
the modeling and analysis techniques. The problem occurred in the reciprocating screw of
machine which is wearing of threads due to effect of temperature of mold materials. The main
work was to model the components of machine with dimensions, and perform static and thermal
analysis with parts of injection molding machine parts like reciprocating screw. In analysis of
coupling we can observe that, coupling shows maximum possibility of failure than reciprocating
screw. And maximum value of equivalent stress is obtained is also to much higher than
17
reciprocating screw . We can say from analysis of coupling and reciprocating screw, coupling is
weaker one than reciprocating screw and it will really fail before. The coupling is the better
solution for reducing at least torsion failure of the reciprocating screw by making coupling
element than reciprocating screw in injection molding process
Mr.G.V.Pujari (January-2015)[13]
Defect by Applying Taguchi & Moldflow Method For Injection Molding Component
This paper describes about the parameter optimization using the combination of design of
experiment (DOE) Taguchi method and Moldflow simulation tests by this method, it can gain
the experiment data which can reflect the overall situation using fewer number of simulation test.
Furthermore, the effects degree of different molding process parameters for surface sink marks
are investigated, optimized parameter combination is obtained. It can solve the unreasonable
appearance of process parameter settings. The mold design above mentioned can fasten the mold
developing schedule, thus shorten the cycle of product development, and improve the quality of
products and the competitive ability of enterprise. The simulation considering the sequence of
effects degree of different molding process parameters for surface sink marks ranked in the
holding pressure; melt temperature, cooling time and injection pressure. The holding pressure is
the most important effect. The optimized parameter combinations of different factors are
considered as melt temp 235°c; injection pressure 80 bar; holding pressure 55 bar & cooling time
50 sec, and its sink marks index is 2.674, which is the best data compared with other parameter
combinations.

18
2.2 ABSTRACT OF ENTIRE REVIEW:
In general, the researchers give different method of topology optimization and FE
analysis of injection molding machine by changing its geometry. One of the researchers Shu
Huang Sun From Kun Shan University Of Technology, Taiwan has research on topology design
for the stationary platen of a plastic injection machine. He had carried out on ANSYS 5.5 to
FEM analysis for stationary platen.
Following are the some points which shows the entire review of the above research‟s papers:
Researchers outlined modification of platen is carried out to achieve good strength and
cost effectiveness.
Some researchers focus on failure analysis in tie bar & reduce the bending load of tie
bars. So its increase operating life of platen.
Some researchers focus on failure of Screw, Multi-Objective Optimization Algorithm is
for optimization.
As per review of research papers, we can see that during the process compressive stress
generates at particular regions of platen. As load varies with fast rate there is chance to failure of
tie bar rod. Due to heavy mould shape, sizes of platen also change, that‟s increase its weight as
well as stress level at certain region. This leads to failure of platen or failure of tie rod due to
stretching by nut and platen. Main objective of these literature study are, optimize design of
platen with the use of removing material from them.
19
CHAPTER-3
PROJECT WORK OUT
3.1 OBJECTIVE OF PROJECT WORK:
The aim of this project is study about those areas where stress can affect the failure of tie bar
due to heavy weight of stationary platen the deflection or misalignment with movable platen.
Finally redistribution of stress so that uniform stress can achieve (optimization of platen) and
optimize design of platen with the use of removing material from them.
The objectives of the study are as follows:-To reduce weight of clamping assembly. To
reduce weight of moving platen. To reduce running cost of machine.
In injection molding machine platen play a very important role. During the process generally
compressive stress generates at particular regions. When load varies with fast rate there is
chance to failure of tie bar rod. Due to heavy mould shape, size of platen also change, that‟s
increase its weight as well as stress level at certain region.
20
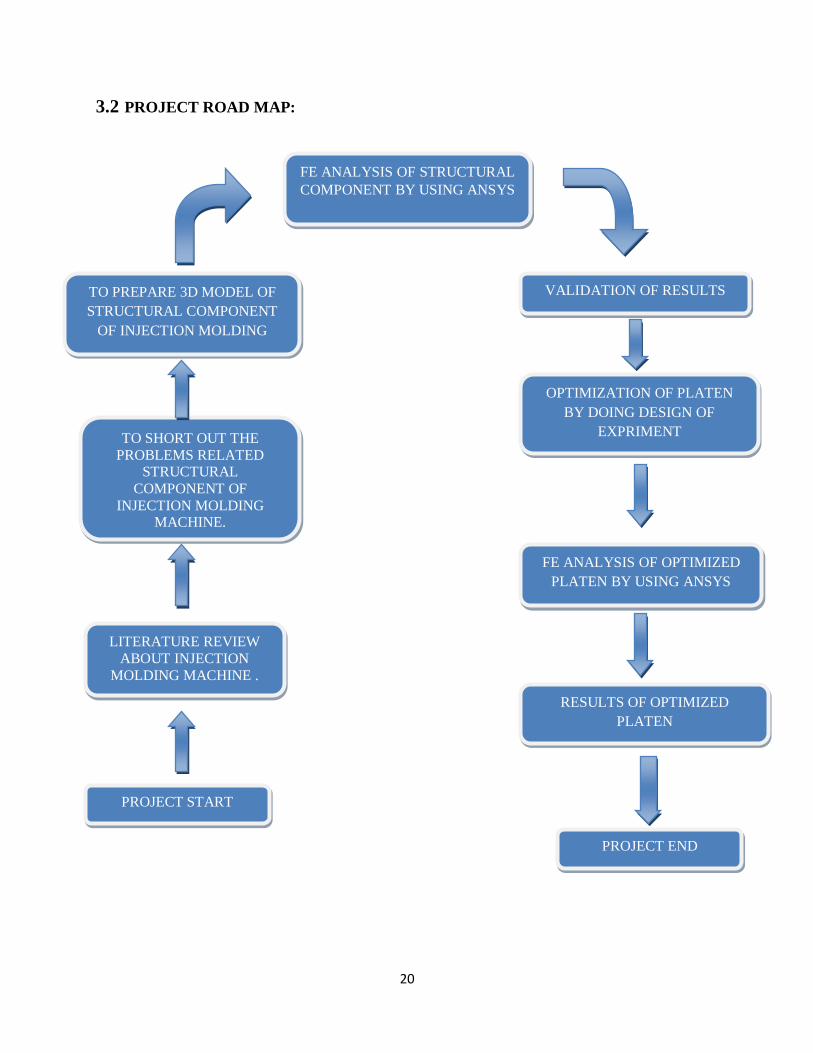
3.2 PROJECT ROAD MAP:
FE ANALYSIS OF STRUCTURAL
COMPONENT BY USING ANSYS
TO SHORT OUT THE
PROBLEMS RELATED STRUCTURAL
COMPONENT OF
INJECTION MOLDING MACHINE.
VALIDATION OF RESULTS
LITERATURE REVIEW
ABOUT INJECTION
MOLDING MACHINE .
OPTIMIZATION OF PLATEN
BY DOING DESIGN OF
EXPRIMENT
PROJECT START
PROJECT END
TO PREPARE 3D MODEL OF
STRUCTURAL COMPONENT
OF INJECTION MOLDING
MACHINE.
FE ANALYSIS OF OPTIMIZED
PLATEN BY USING ANSYS
RESULTS OF OPTIMIZED
PLATEN
21
3.3 VARIOUS FORCES THAT ACT ON PLASTIC INJECTION MOLDING
MACHINE:
The Various Forces Which Act On The Machine Are Following: -
Clamping force
Reactive force (due to cavity pressure)
Total force (clamping + reactive)
Breaking force
Ejection force
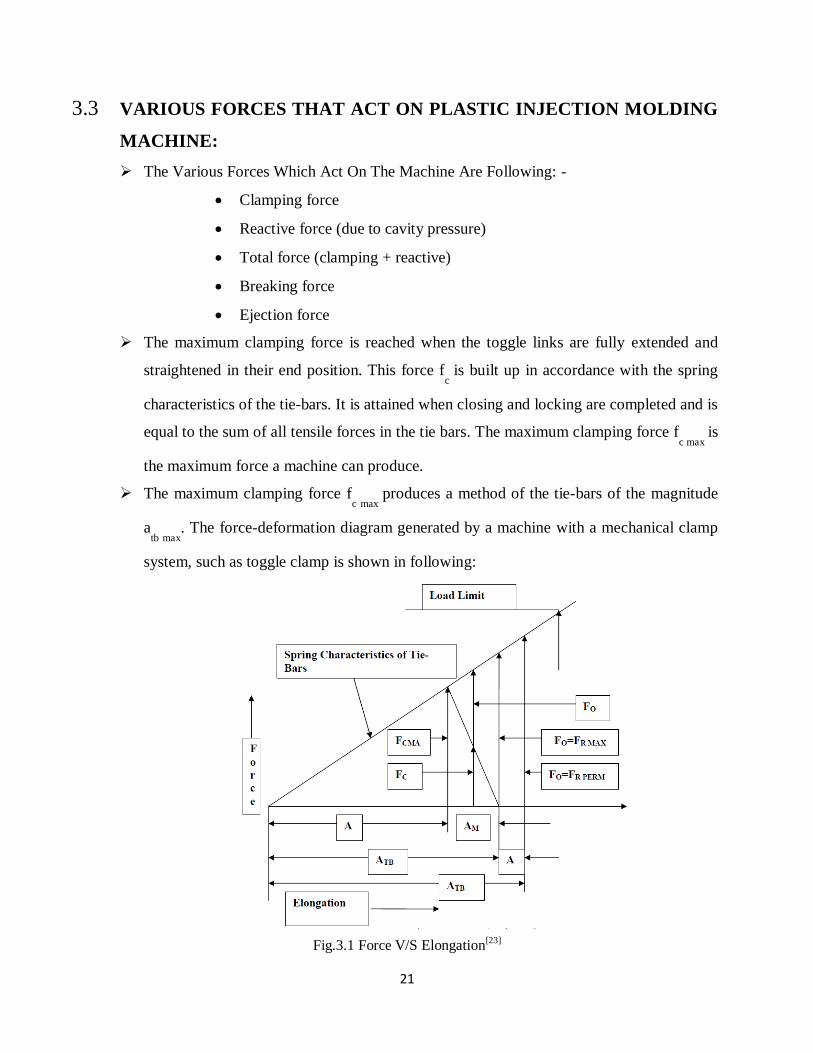
The maximum clamping force is reached when the toggle links are fully extended and
straightened in their end position. This force fc
is built up in accordance with the spring
characteristics of the tie-bars. It is attained when closing and locking are completed and is
equal to the sum of all tensile forces in the tie bars. The maximum clamping force fc max
is
the maximum force a machine can produce.
The maximum clamping force fc max
produces a method of the tie-bars of the magnitude
atb max
. The force-deformation diagram generated by a machine with a mechanical clamp
system, such as toggle clamp is shown in following:
Fig.3.1 Force V/S Elongation[23]
22
Fc max – Maximum clamping Force
Atb max - Magnitude of Tie bar
FR – Relative force
Ax – Distance
The clamping force Fc Max
affects the mold and compresses it by the distance AmoMax
.
During injection into the mold cavity, a reactive force FR
is produced, which is the
product of the average cavity pressure multiplied by the cavity area projected on a plane
through the parting line. This force decreases the compression of the mold AMO
and
increases the elongation of tie-bars ATB
. As soon as flashing occurs, this action has
reached its practical limit somewhere between FO
= FR MAX
& FO
= FR PERM
. During this
action, the elongation of the tie-bars increases first to ATB MAX
. This cause the mating
mold surfaces to separate by a distance AX. The permissible value of a
x depends on the
plastic material and on the melt and mold temperatures. It is of order of 0.05-0.1mm. The
usable force reserve of a toggle clamp system is if the magnitude of 10% of the clamping
force.
The rigid unit permits a higher Total Clamping Force (Reactive Force) before the mold
halves begin to separate. At this moment, the stresses in the tie bars are higher than in the
less rigid unit. Thus, one can conclude that rigid bars call for a greater safety factor than
yielding (thin) ones, if they are frequently over-loaded by incorrect operation (equal flash
in both cases). Reproducibility and precise adjustment of the clamp force certainly not
improved with an extremely rigid design, because the force is produced within a
relatively small distance and subject to great variations.
To set the desired Clamping Force, a suitable distance between mold platen and tail
stock platen is selected and adjusted with mostly a central mechanical adjusting device.
Another critical point is the deflection of the machine platens, primarily the stationary
platen. For reasons of strength, little thickness is sufficient most of the time. An
acceptable value would be a deflection of <0.2 mm related to 1 m distance between tie
23
bars. The problem of deflecting machine platens, of course, also exists in machines with
hydraulic clamping units.
The Opening Force is the force produced by the clamping unit during the opening stage.
The forces available over the full stroke are smaller during opening than during closing.
The nominal opening force is that force which remains attainable for opening the mold
after clamping and subsequent unlocking.
The Toggle Forces are fully sufficient to break open the mold. Ejection is often produced
during mold opening by an ejector bar, against which the movable platen moves and
which activates the ejection system of the mold. The magnitude of the ejection force
which is exerted upon the ejection system in the mold is important. This operation uses
the opening force of the toggle which is available after part of the opening stroke has
been completed. It cannot be more than the minimum opening force which is only 1 to
2% of the maximum clamping force in the most adverse case.
3.4 Machine Parameters:
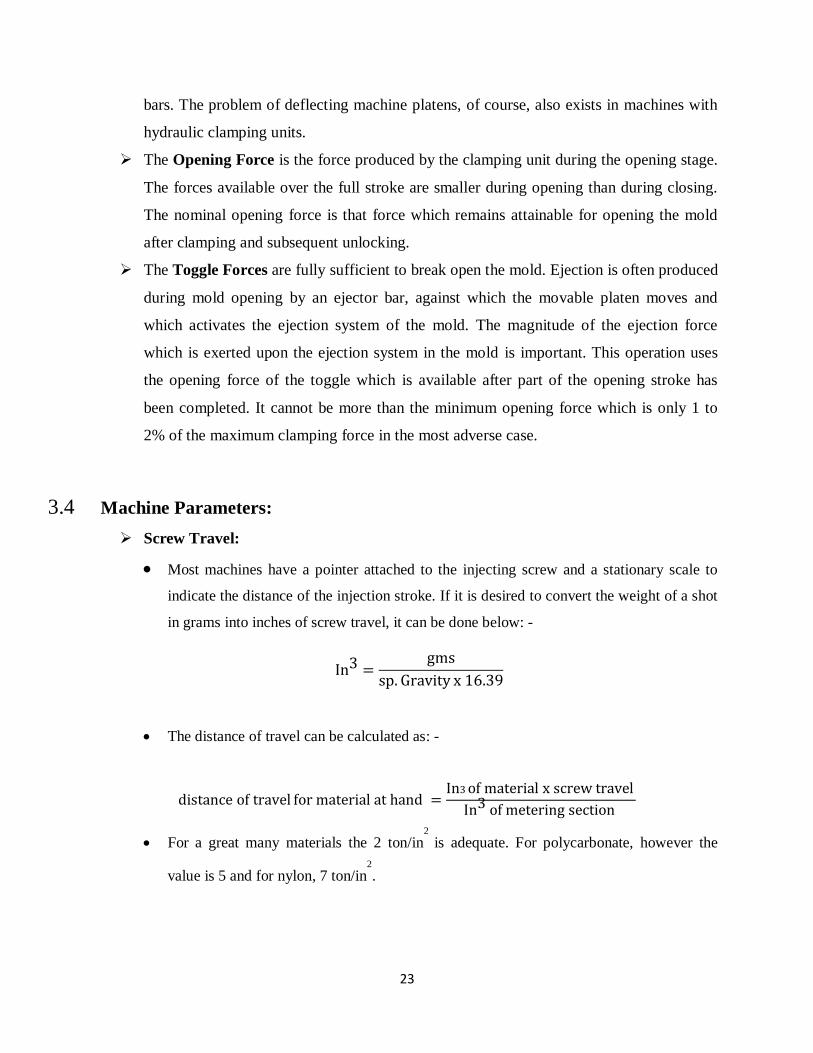
Screw Travel:
Most machines have a pointer attached to the injecting screw and a stationary scale to
indicate the distance of the injection stroke. If it is desired to convert the weight of a shot
in grams into inches of screw travel, it can be done below: -
In3 =gms
sp. Gravity x 16.39
The distance of travel can be calculated as: -
distance of travel for material at hand =In3 of material x screw travel
In3 of metering section
For a great many materials the 2 ton/in2
is adequate. For polycarbonate, however the
value is 5 and for nylon, 7 ton/in2
.
24
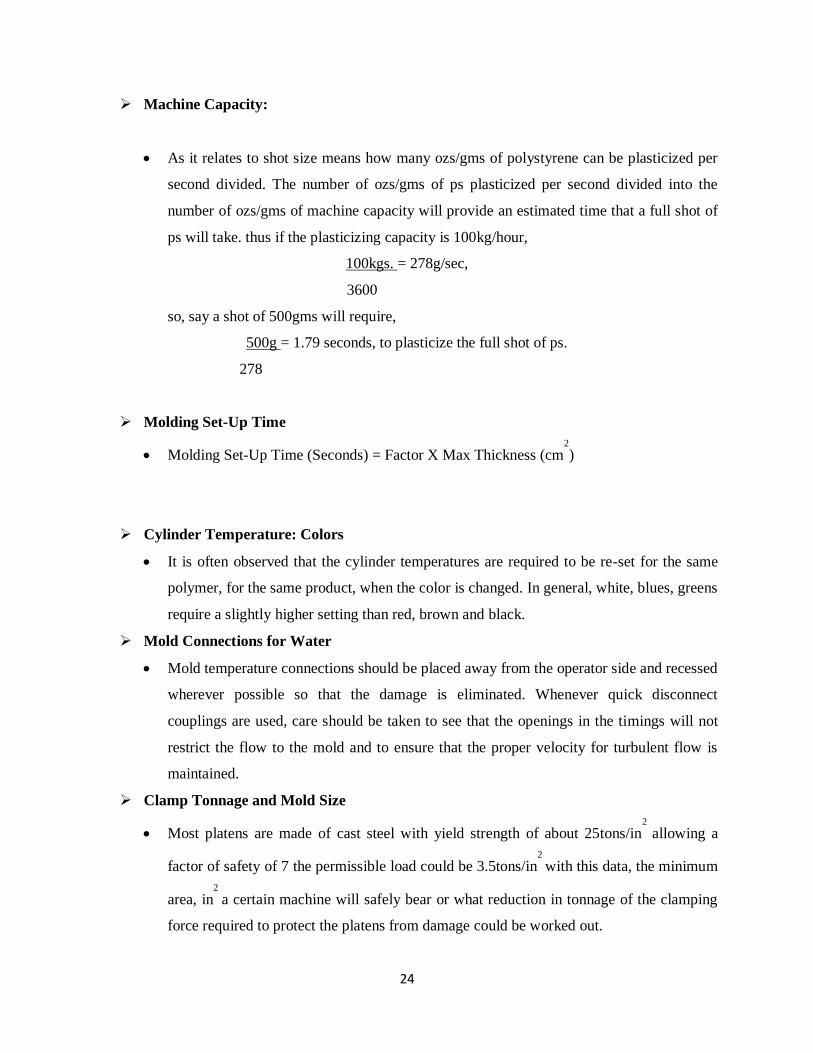
Machine Capacity:
As it relates to shot size means how many ozs/gms of polystyrene can be plasticized per
second divided. The number of ozs/gms of ps plasticized per second divided into the
number of ozs/gms of machine capacity will provide an estimated time that a full shot of
ps will take. thus if the plasticizing capacity is 100kg/hour,
100kgs. = 278g/sec,
3600
so, say a shot of 500gms will require,
500g = 1.79 seconds, to plasticize the full shot of ps.
278
Molding Set-Up Time
Molding Set-Up Time (Seconds) = Factor X Max Thickness (cm2
)
Cylinder Temperature: Colors
It is often observed that the cylinder temperatures are required to be re-set for the same
polymer, for the same product, when the color is changed. In general, white, blues, greens
require a slightly higher setting than red, brown and black.
Mold Connections for Water
Mold temperature connections should be placed away from the operator side and recessed
wherever possible so that the damage is eliminated. Whenever quick disconnect
couplings are used, care should be taken to see that the openings in the timings will not
restrict the flow to the mold and to ensure that the proper velocity for turbulent flow is
maintained.
Clamp Tonnage and Mold Size
Most platens are made of cast steel with yield strength of about 25tons/in2
allowing a
factor of safety of 7 the permissible load could be 3.5tons/in2
with this data, the minimum
area, in2
a certain machine will safely bear or what reduction in tonnage of the clamping
force required to protect the platens from damage could be worked out.
25
Clamping Force
This is usually expressed in ton and if this is not adequate, the two halves of the mold
will open because of force exerted by the melt injected into the mold.
The relationship is 𝑓 =p x a
2000
Where,
F = force (tons),
P = pressure (psi, average 10,000)
A = projected area, in2
.
3.5 Force Analysis:
Forces Applied on Stationary Plate
All pressure from the mold side transferring to the stationary platen.
Then these forces transferring to strain rod through stationary platen.
And the forces from the strain rod transfers to the NUT.
Nut is fixed so it produced the reaction forces.
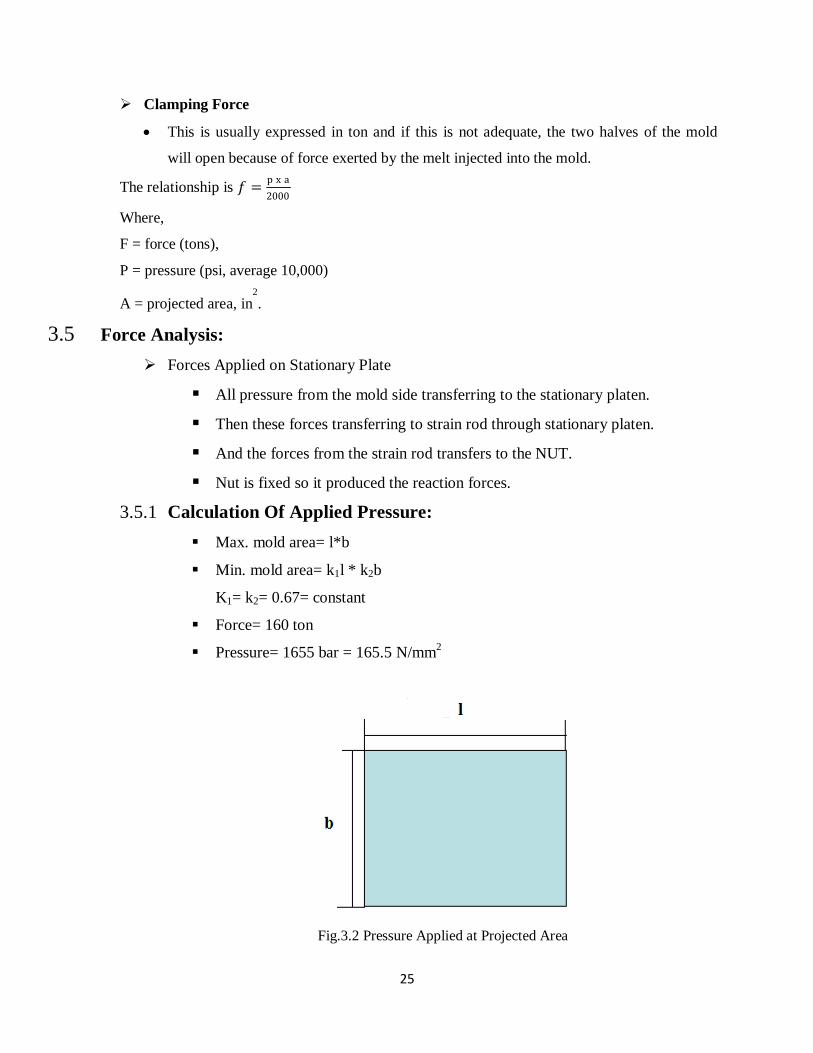
3.5.1 Calculation Of Applied Pressure:
Max. mold area= l*b
Min. mold area= k1l * k2b
K1= k2= 0.67= constant
Force= 160 ton
Pressure= 1655 bar = 165.5 N/mm2
Fig.3.2 Pressure Applied at Projected Area
26
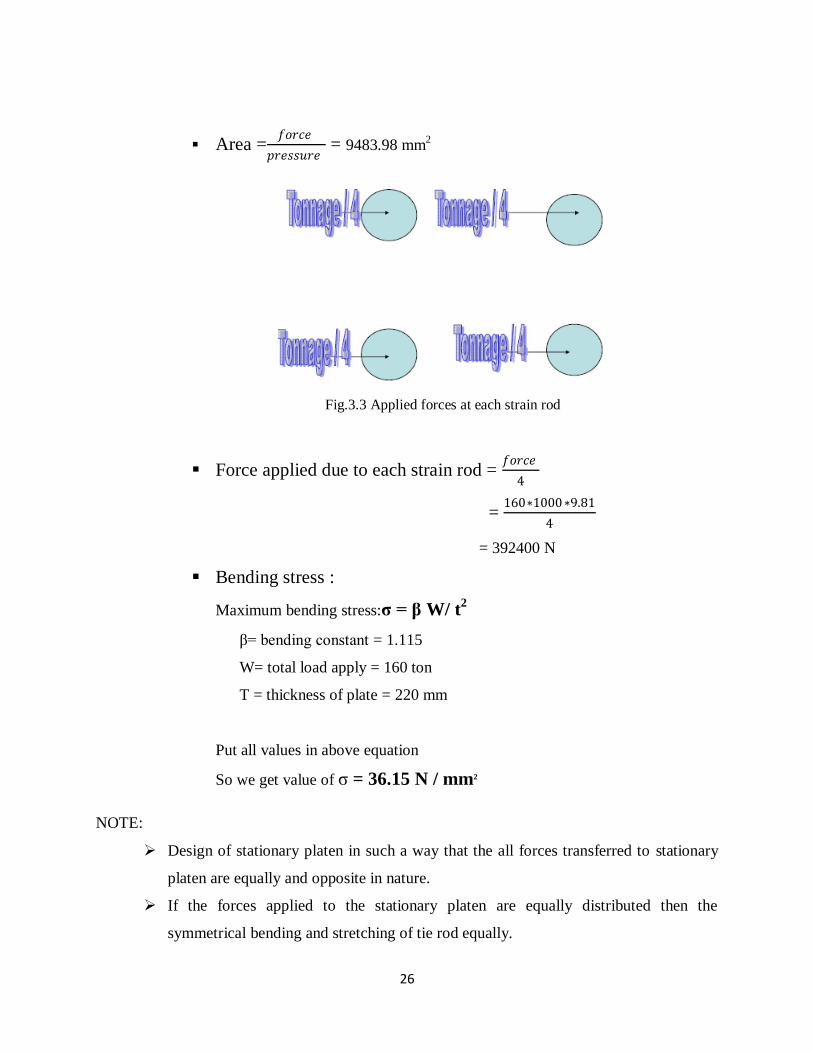
Area =𝑓𝑜𝑟𝑐𝑒
𝑝𝑟𝑒𝑠𝑠𝑢𝑟𝑒 = 9483.98 mm
2
Fig.3.3 Applied forces at each strain rod
Force applied due to each strain rod = 𝑓𝑜𝑟𝑐𝑒
4
= 160∗1000∗9.81
4
= 392400 N
Bending stress :
Maximum bending stress:σ = β W/ t2
β= bending constant = 1.115
W= total load apply = 160 ton
T = thickness of plate = 220 mm
Put all values in above equation
So we get value of σ = 36.15 N / mm2
NOTE:
Design of stationary platen in such a way that the all forces transferred to stationary
platen are equally and opposite in nature.
If the forces applied to the stationary platen are equally distributed then the
symmetrical bending and stretching of tie rod equally.
27
So we can maintain relative deflection within some criteria otherwise there are
following problem arise.
1. Mold Flash
2. Distortion of Mold
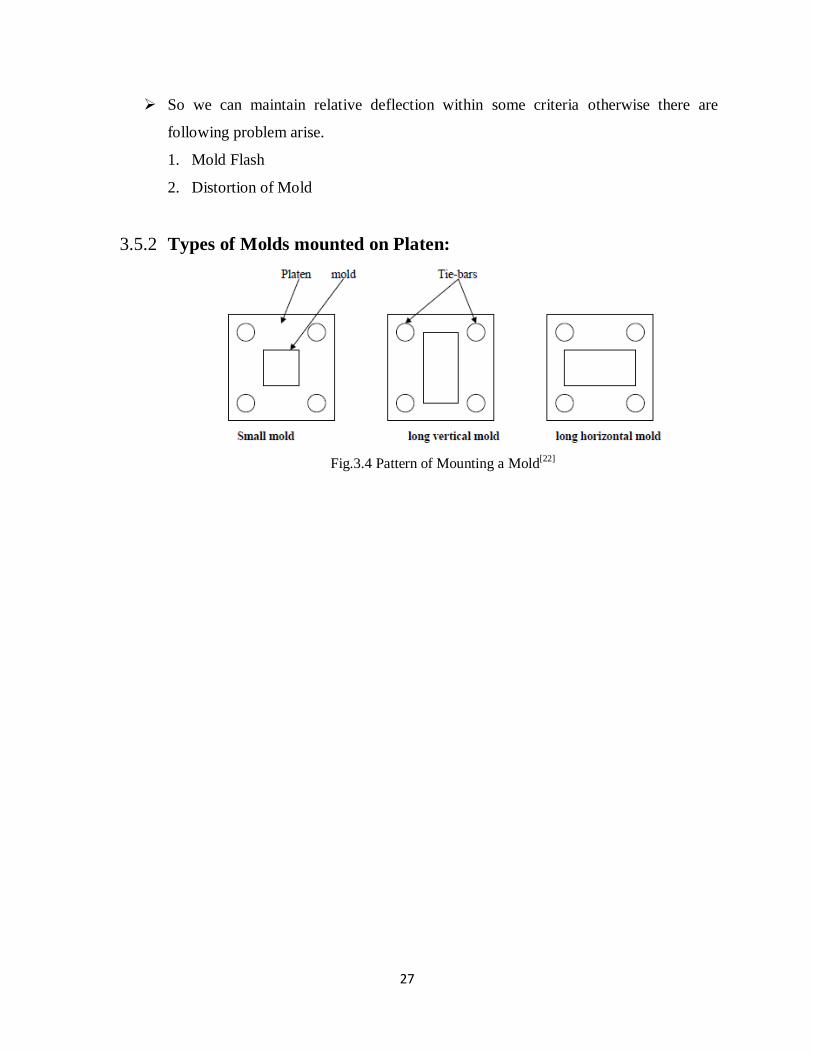
3.5.2 Types of Molds mounted on Platen:
Fig.3.4 Pattern of Mounting a Mold[22]
28
CHAPTER - 4
MODELLING
4.1 INTRODUCTION
The modeling has been performed on the Solid works 2013 version and then after the
analysis work has been performed on the ANSYS 12.1 version.
4.1.1 About Solid works
Solid works is a computer graphics system for modeling various mechanical designs
for performing related design and manufacturing operations. The system uses a 3D
solid modeling system as the core, and applies the feature base parametric modeling
method. In short solidworks is a feature based parametric solid modeling system with
many extended design and manufacturing applications.
4.1.2 Difference between Solidworks and other CAD systems:
Solidworks is the first commercial CAD system entirely based upon the feature based
design and parametric modeling philosophy. Today many software producers have
recognized the advantage of this approach and started to shift their product on to this
platform. Nevertheless, the differences between a feature based, parametric solid
modeling.
Solidworks Conventional CAD systems
Solid model Wire frame and solid model
Parametric model Fixed-dimension model
Feature based modeling Primitive-based modeling
Subject oriented sub-modeling systems A single geometry based system

29
4.1.3 MACHINING DRAWING FOR PLATEN:
Fig. 4.1 Stationary Platen
Fig. 4.3 Moving Platen
Fig. 4.2 End Platen
Fig. 4.4 Tie Bar
Fig. 4.5Assembly of Platen & Tie Bar

30
CHAPTER - 5
FE ANALYSIS
5.1 Introduction
The ANSYS-12.1 software is used to obtain the results by FEM. The modeling, meshing
and post-processing are done by the ANSYS the results obtained will be compared with
the results of analytical solutions.
5.2 ANSYS Package
The ANSYS is a comprehensive general-purpose finite element computer program. The
ANSYS program has many capabilities ranging from a simple, linear, static analysis to a
complex, nonlinear, transient dynamic analysis. A typical analysis in ANSYS involves
three distinct steps.
1. Pre-processing: Using PREP7 processor, providing data such as the geometry,
materials, and element type to the program.
2. Solution: Using Solution processor, defining the type of analysis, set boundary
conditions, applies loads, and initiate finite element solutions.
3. Post processing: Using POST1 (for static or steady state problems) or POST26 (for
transient problems), reviewing the results of analysis through graphical displays and
tabular listings.
5.3 Analysis Results of Platen:
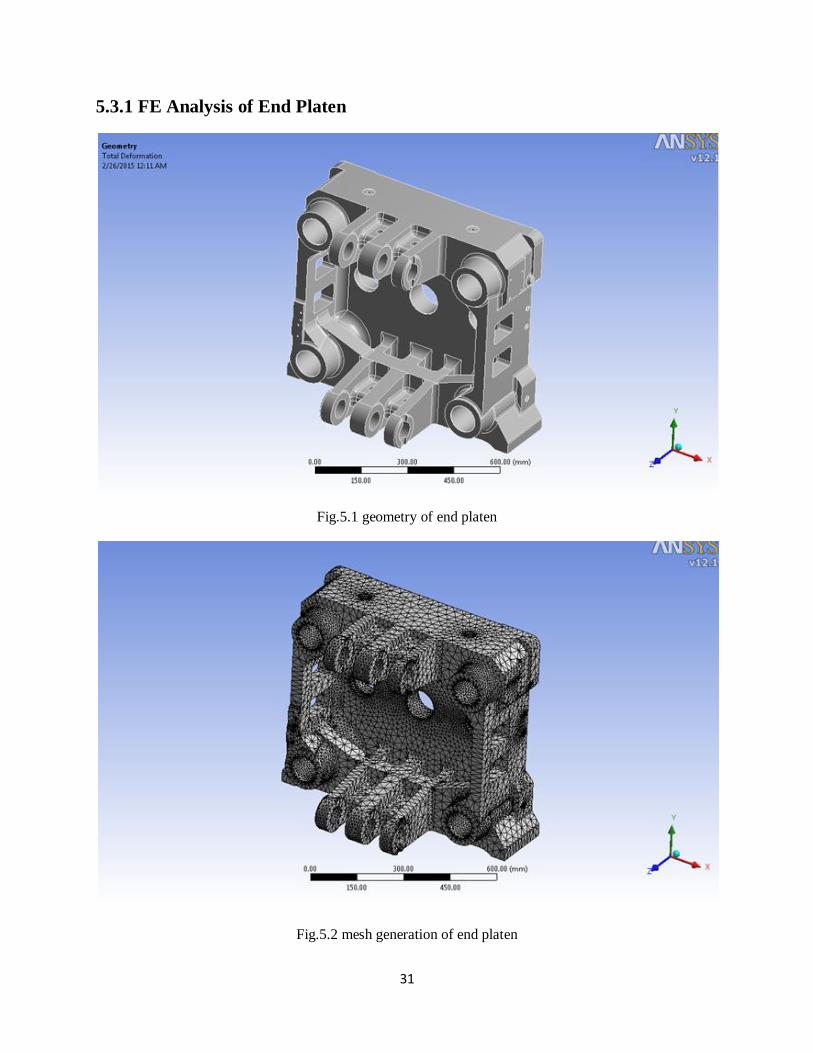
Static FE analysis has been carried out on Platen for checking stress and weight. Here
shown in figure four faces of hole are fixed and force 160 ton applied on toggle part.
Then automatic tetrahedral mesh generation generate nodes-42252, element-160862.
The below fig show geometry of end platen and then generate mesh on it.
31
5.3.1 FE Analysis of End Platen
Fig.5.1 geometry of end platen
Fig.5.2 mesh generation of end platen
32
Fig.5.3 static structural analysis providing fixed support
Fig.5.4 static structural analysis of platen
33
Fig.5.5 static structural analysis of platen
Fig.5.6 static structural analysis of platen

34
Fig.5.7 static structural analysis of platen
The above fig. Show that static structural analysis of end platen.
First take fixed support and then apply force 160 ton on that platen. Then analysis carried
out on equivalent (von-mises) stress.
Here shows that toggle link get maximum shear stress. And total deformation has been
carried out it like 0.1834 mm.
Material properties: Materials in the Workbench are imported from material library
available in ANSYS database.
35
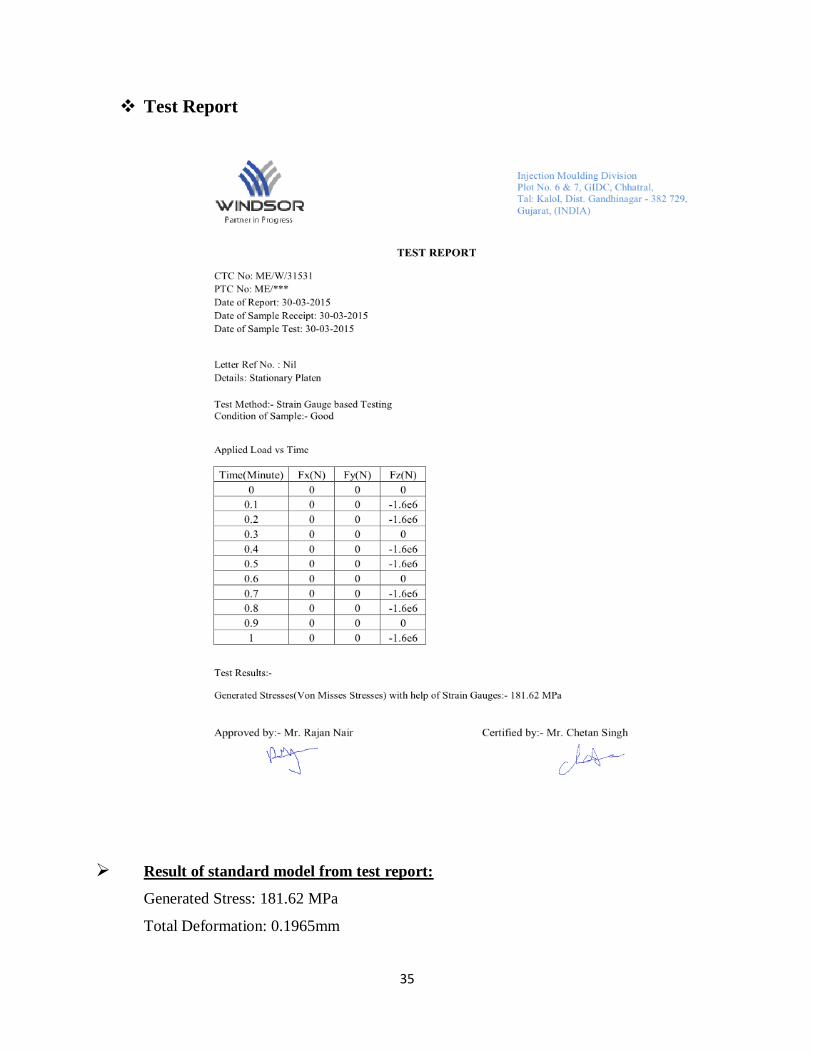
Test Report
Result of standard model from test report:
Generated Stress: 181.62 MPa
Total Deformation: 0.1965mm
36
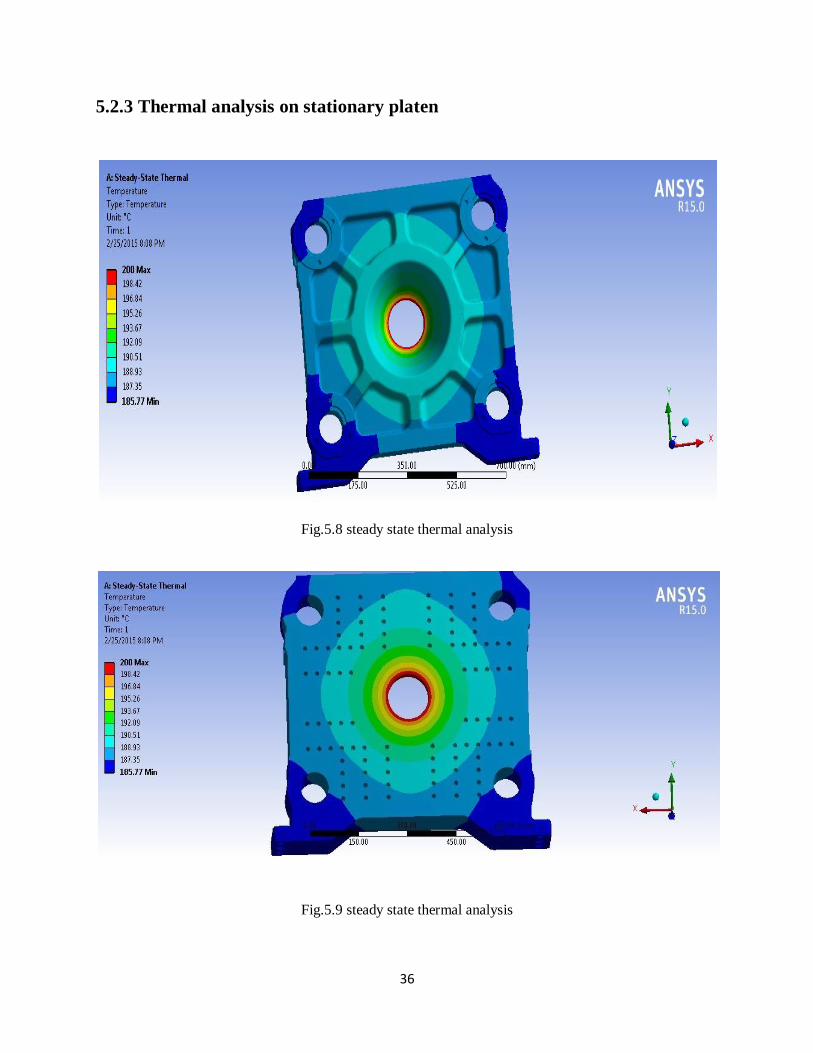
5.2.3 Thermal analysis on stationary platen
Fig.5.8 steady state thermal analysis
Fig.5.9 steady state thermal analysis
37
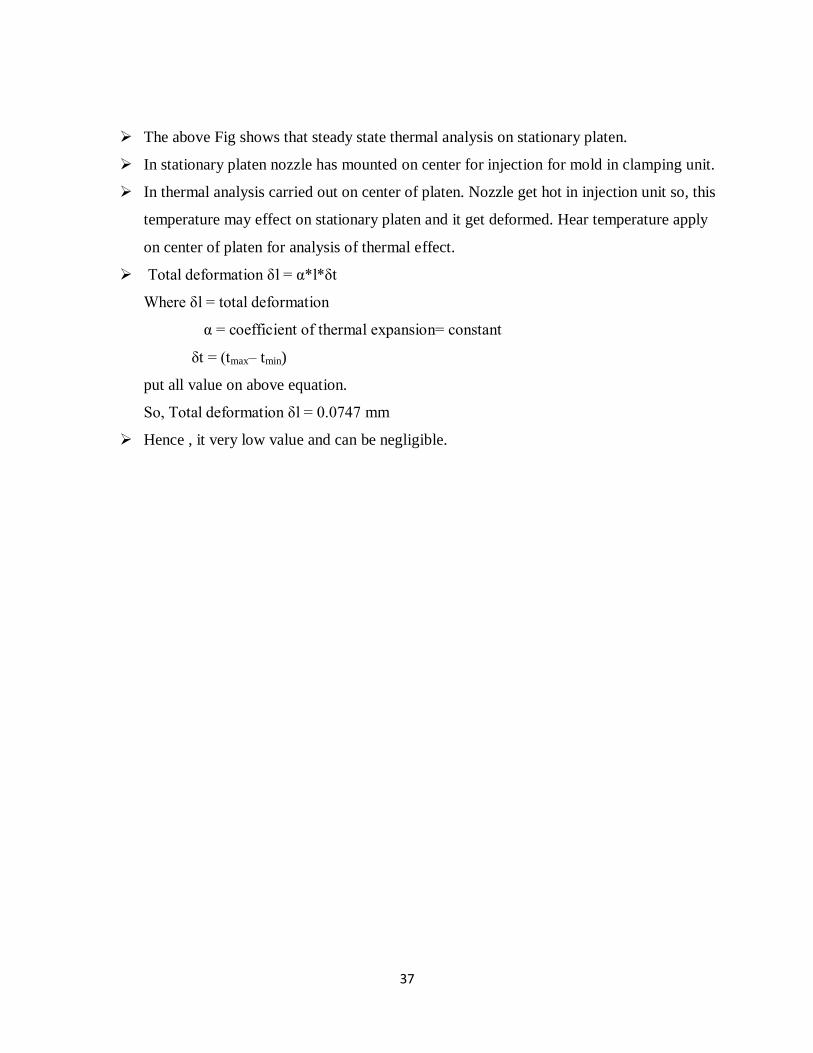
The above Fig shows that steady state thermal analysis on stationary platen.
In stationary platen nozzle has mounted on center for injection for mold in clamping unit.
In thermal analysis carried out on center of platen. Nozzle get hot in injection unit so, this
temperature may effect on stationary platen and it get deformed. Hear temperature apply
on center of platen for analysis of thermal effect.
Total deformation δl = α*l*δt
Where δl = total deformation
α = coefficient of thermal expansion= constant
δt = (tmax– tmin)
put all value on above equation.
So, Total deformation δl = 0.0747 mm
Hence , it very low value and can be negligible.
38
CHAPTER -6
EXPERIMENTAL SETUP AND METHODOLOGY
DESIGN OF EXPERIMENT
In this study, three machining parameters were selected as control factors, and each
parameter was designed to have three levels, denoted 1, 2, 3 and 4 (Table). The experimental
design was according to an L‟9 array based on TAGUCHI Method, while using the Orthogonal
array would markedly reduce the number of experiments. A set of experiments designed using
the TAGUCHI method was conducted to investigate the relation between the process parameters
and response factor. Minitab 16 software is used to optimization and graphical analysis of
obtained data.
Topology optimization is a powerful structural optimization method that combines a
numerical solution method, usually the finite element method, with an optimization algorithm to
find the optimal material distribution inside a given domain. In designing the topology of a
structure we determine which points in the domain should be material and which points should
be void.
6.1 TAGUCHI’S PHILOSOPHY
Design of experiment (doe) is a powerful statistical technique for improving
product/process designs and solving production problems. A standardized version of the doe, as
forwarded by Dr. Genichi Taguchi, allows one to easily learn and apply the technique product
design optimization and production problem investigation. There are a number of statistical
techniques available for engineering and scientific studies. Taguchi has prescribed a standardized
way to utilize the Design of Experiments (DOE) technique to enhance the quality of products
and processes.
Upstream methods efficiently use small-scale experiments to reduce variability and
remain cost-effective, and robust designs for large-scale production and market place. Shop-floor
techniques provide cost-based, real time methods for monitoring and maintaining quality in
production. The farther upstream a quality method is applied, the greater leverages it produces on
39
the improvement, and the more it reduces the cost and time. Taguchi„s philosophy is founded on
the following three very simple and fundamental concepts:
Quality is best achieved by minimizing the deviations from the target. The product or
process should be so designed that it is immune to uncontrollable environmental
variables.
The cost of quality should be measured as a function of deviation from the standard and
the losses should be measured system-wide.
Taguchi proposes “off-line” strategy for quality improvement as an alternative to an
attempt to inspect quality into a product on the production line. He observes that poor
quality cannot be improved by the process of inspection, screening and salvaging. No
amount of inspection can put quality back into the product.
6.2 TAGUCHI METHOD’S CATEGORIES
6.2.1 Static Problems
Generally, a process to be optimized has several control factors which directly decide the
target or desired value of the output. The optimization then involves determining the best control
factor levels so that the output is at the target value. Such a problem is called as a "STATIC
PROBLEM". Noise is shown to be present in the process but should have no effect on the
output! This is the primary aim of the Taguchi experiments - to minimize variations in output
even though noise is present in the process. The process is then said to have become ROBUST.
6.2.1.1 Signal to Noise Ratio
Once the experimental design has been determined and the trials have been carried out,
the measured performance characteristic from each trial can be used to analyse the relative effect
of the different parameters. The product/process/system design phase involves deciding the best
values/levels for the control factors. The signal to noise (S/N) ratio is an ideal metric for that
purpose.
The S/N ratio, as stated earlier, is a concurrent statistic. A concurrent statistic is able to
look at two characteristics of a distribution and roll these characteristics into a single number or

40
figure of merit. The S/N ratio combines both the parameters (the mean level of the quality
characteristic and variance around this mean) into a single metric. A high value of S/N implies
that signal is much higher than the random effects of noise factors. Process operation consistent
with highest S/N always yields optimum quality with minimum variation.
The S/N ratio consolidates several repetitions into one value. The equation for calculating
S/N ratios for “smaller is better” (LB), “larger is better” (HB) and “nominal is best” (NB) types
of characteristics.
6.3 PARAMETERS CONSIDERATION FOR EXPERIMENT:
Input parameters
Hole Size
Lateral Distance
Linear Distance
Output parameters
Stress
Deformation
Table 6.1: Range of Process Parameters
Input parameters Level
1 2 3
Hole Size 40 42 44
Lateral Distance 250 270 290
Linear Distance 250 270 290
In the present study hole size, lateral & linear distance selected as input parameter. The
range of selected process parameters are shown in Table no. 4.1.
While we take other data for this parameter stress can increase on platen. We also
perform on hole size 38, 45, both distance 249, 291 but stress can increased. So, we
cannot take consideration this level of parameter.[13]
41
6.4 SELECTION OF ORTHOGONAL ARRAY (OA)
In selecting an appropriate OA, the pre-requisites are:
Selection of process parameters and/or interactions to be evaluated.
Selection of number of levels for the selected parameters
The determination of which parameters to investigate hinges upon the product or process
performance characteristics or responses of interest. Several methods are suggested by Taguchi
for determining which parameters to include in an experiment. These are:
Brainstorming
Flow charting
Cause-Effect diagrams
The total Degrees of Freedom (DOF) of an experiment is a direct function of total
number of trials. If the number of levels of a parameter increases, the DOF of the parameter also
increases because the DOF of a parameter is the number of levels minus one. Thus, increasing
the number of levels for a parameter increases the total degrees of freedom in the experiment
which in turn increases the total number of trials. Knowing the number of parameters and the
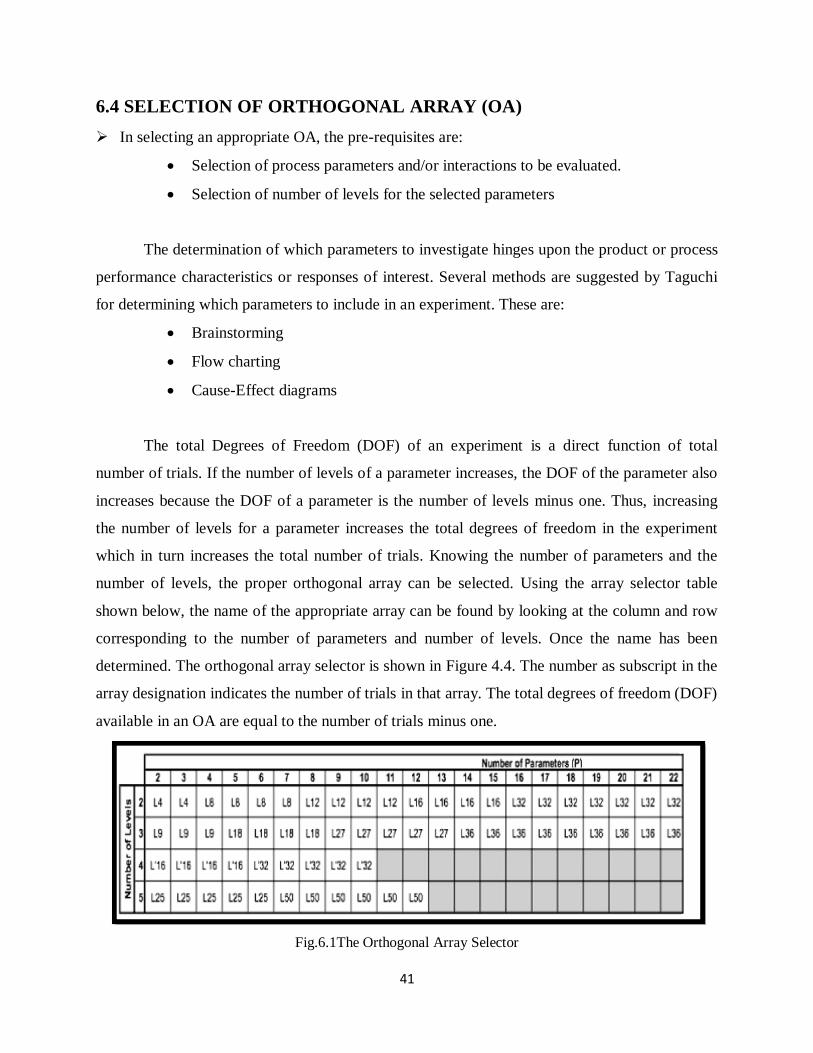
number of levels, the proper orthogonal array can be selected. Using the array selector table
shown below, the name of the appropriate array can be found by looking at the column and row
corresponding to the number of parameters and number of levels. Once the name has been
determined. The orthogonal array selector is shown in Figure 4.4. The number as subscript in the
array designation indicates the number of trials in that array. The total degrees of freedom (DOF)
available in an OA are equal to the number of trials minus one.
Fig.6.1The Orthogonal Array Selector
42
fLn=N-1
Where,
fLn= Total degrees of freedom of an Orthogonal Array
LN = OA designation
N = Number of trials
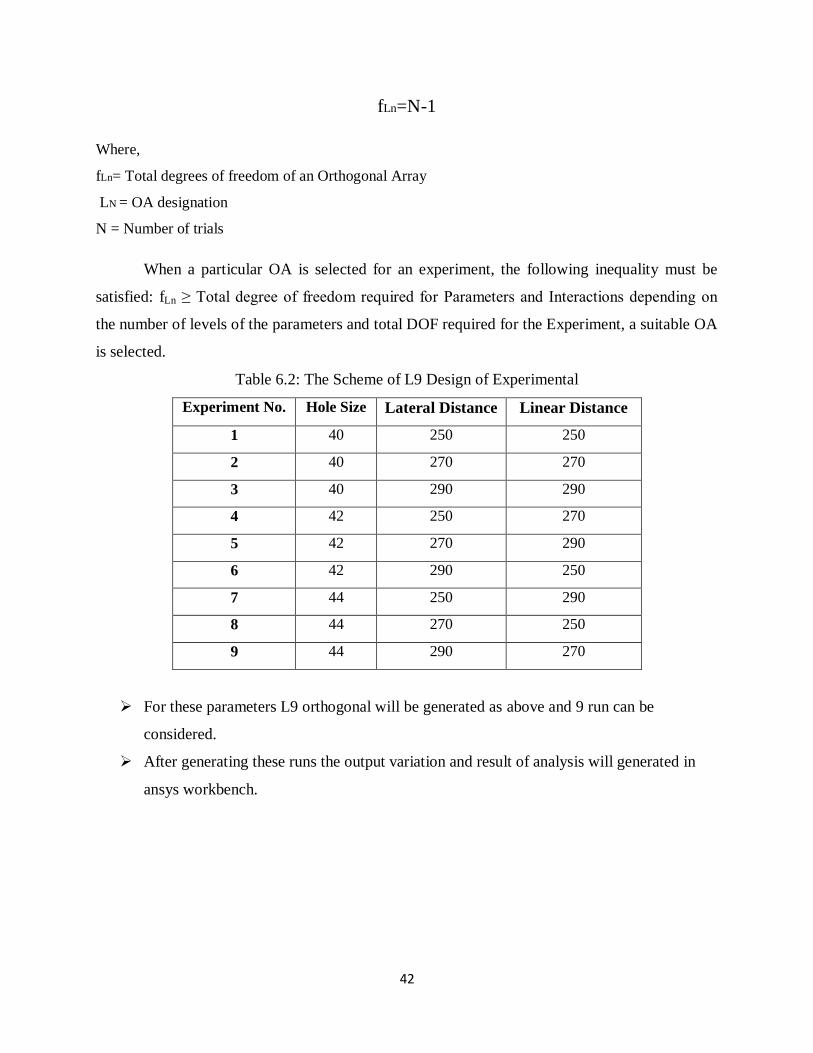
When a particular OA is selected for an experiment, the following inequality must be
satisfied: fLn ≥ Total degree of freedom required for Parameters and Interactions depending on
the number of levels of the parameters and total DOF required for the Experiment, a suitable OA
is selected.
Table 6.2: The Scheme of L9 Design of Experimental
Experiment No. Hole Size Lateral Distance Linear Distance
1 40 250 250
2 40 270 270
3 40 290 290
4 42 250 270
5 42 270 290
6 42 290 250
7 44 250 290
8 44 270 250
9 44 290 270
For these parameters L9 orthogonal will be generated as above and 9 run can be
considered.
After generating these runs the output variation and result of analysis will generated in
ansys workbench.
43
6.5 VARIATION IN PARAMETER FOR TAGUCHI’S DESIGN
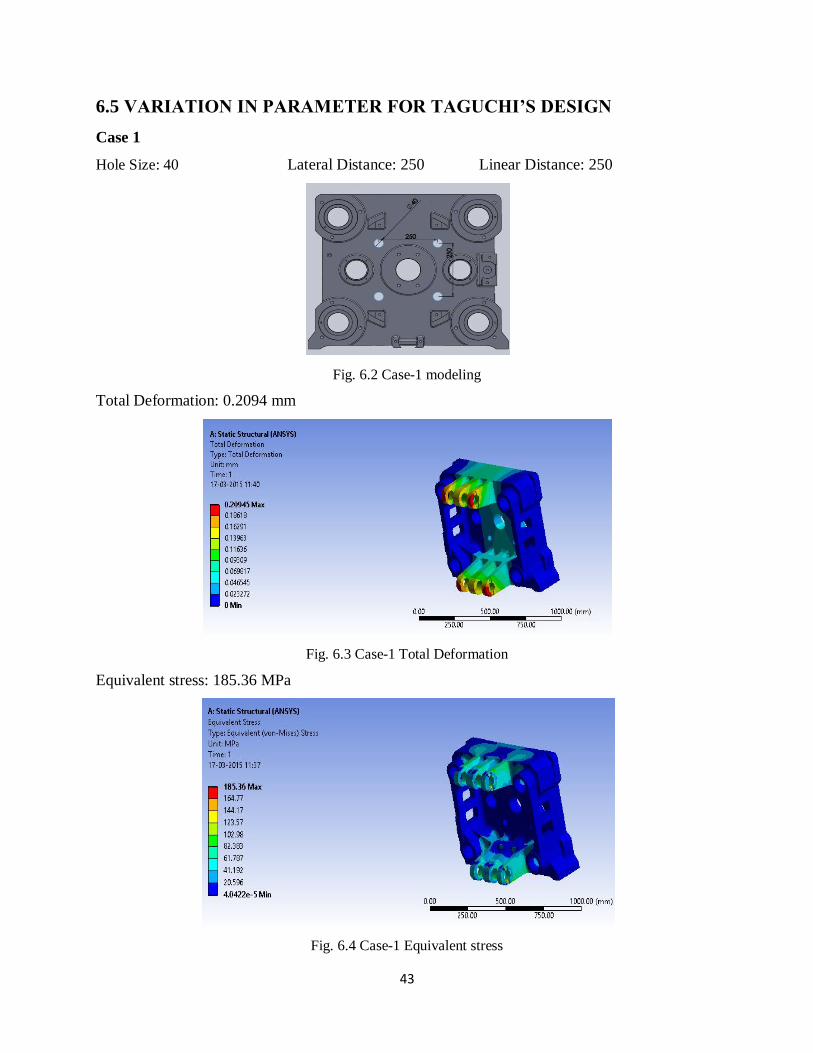
Case 1
Hole Size: 40 Lateral Distance: 250 Linear Distance: 250
Fig. 6.2 Case-1 modeling
Total Deformation: 0.2094 mm
Fig. 6.3 Case-1 Total Deformation
Equivalent stress: 185.36 MPa
Fig. 6.4 Case-1 Equivalent stress
44
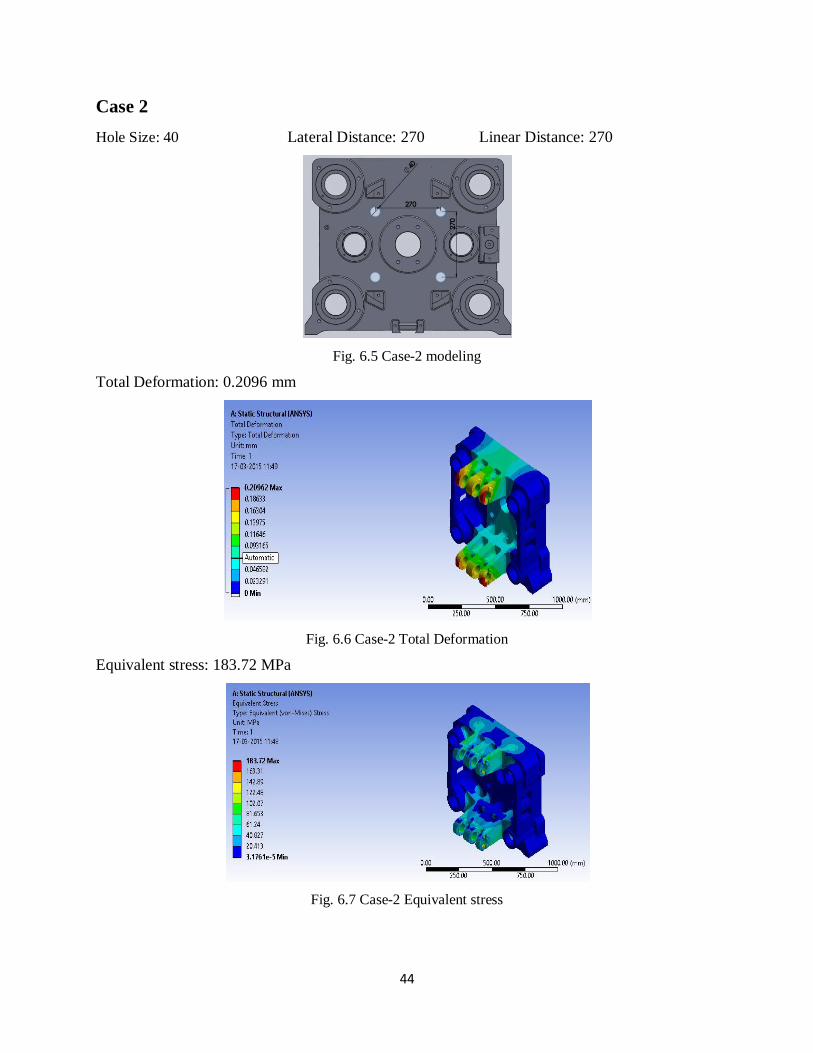
Case 2
Hole Size: 40 Lateral Distance: 270 Linear Distance: 270
Fig. 6.5 Case-2 modeling
Total Deformation: 0.2096 mm
Fig. 6.6 Case-2 Total Deformation
Equivalent stress: 183.72 MPa
Fig. 6.7 Case-2 Equivalent stress

45
Case 3
Hole Size: 40 Lateral Distance: 290 Linear Distance: 290
Fig. 6.8 Case-3 modeling
Total Deformation: 0.2098 mm
Fig. 6.9 Case-3 Total Deformation
Equivalent stress: 184.57 MPa
Fig. 6.10 Case-3 Equivalent stress

46
Case 4
Hole Size: 42 Lateral Distance: 250 Linear Distance: 270
Fig. 6.11 Case-4 modeling
Total Deformation: 0.2097 mm
Fig. 6.12 Case-4 Total Deformation
Equivalent stress: 186.01 MPa
Fig. 6.13 Case-4 Equivalent stress

47
Case 5
Hole Size: 42 Lateral Distance: 270 Linear Distance: 290
Fig. 6.14 Case-5 modeling
Total Deformation: 0.2094 mm
Fig. 6.15 Case-5 Total Deformation
Equivalent stress: 185.25 MPa
Fig. 6.16 Case-5 Equivalent stress

48
Case 6
Hole Size: 42 Lateral Distance: 290 Linear Distance: 250
Fig. 6.17 Case-6 modeling
Total Deformation: 0.2097 mm
Fig. 6.18 Case-6 Total Deformation
Equivalent stress: 185.72 MPa
Fig. 6.19 Case-6 Equivalent stress
49
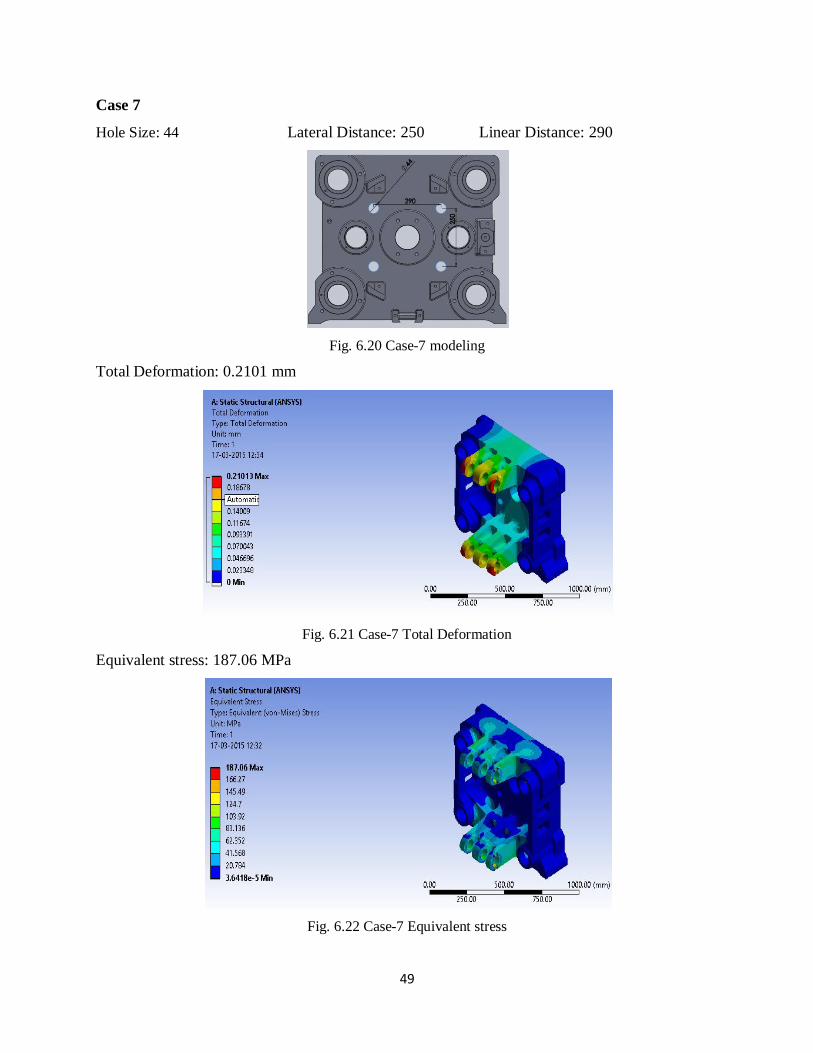
Case 7
Hole Size: 44 Lateral Distance: 250 Linear Distance: 290
Fig. 6.20 Case-7 modeling
Total Deformation: 0.2101 mm
Fig. 6.21 Case-7 Total Deformation
Equivalent stress: 187.06 MPa
Fig. 6.22 Case-7 Equivalent stress
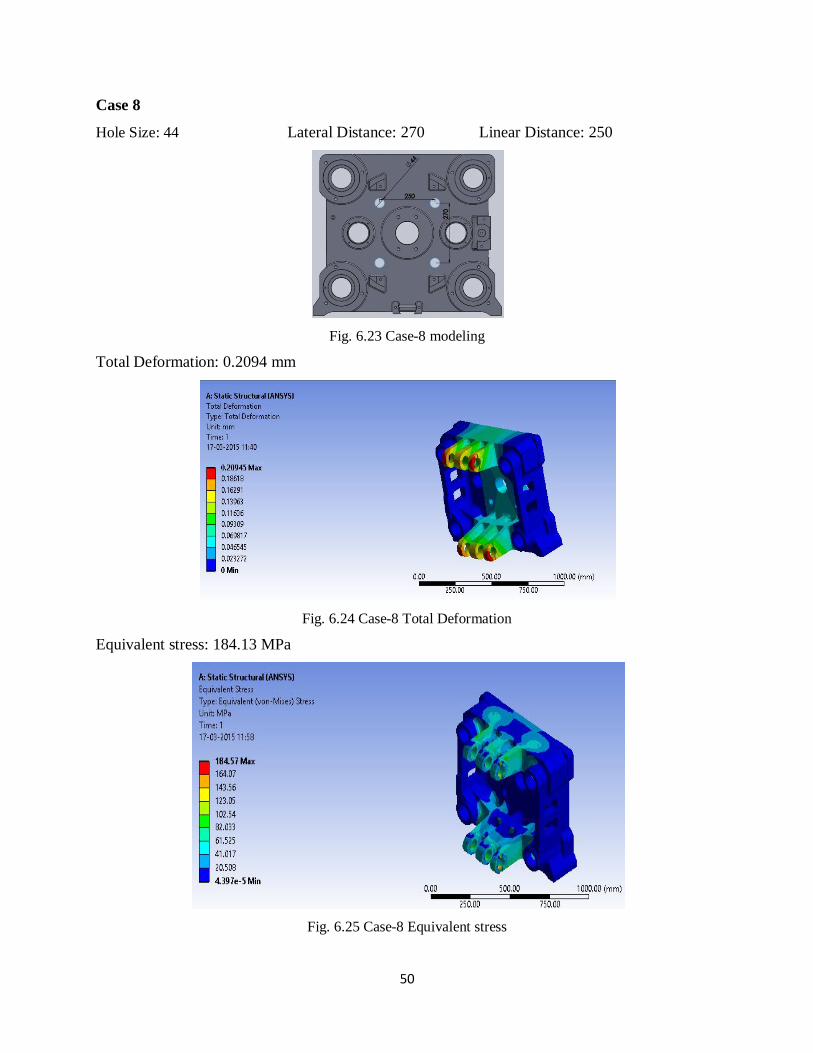
50
Case 8
Hole Size: 44 Lateral Distance: 270 Linear Distance: 250
Fig. 6.23 Case-8 modeling
Total Deformation: 0.2094 mm
Fig. 6.24 Case-8 Total Deformation
Equivalent stress: 184.13 MPa
Fig. 6.25 Case-8 Equivalent stress

51
Case 9
Hole Size: 44 Lateral Distance: 290 Linear Distance: 270
Fig. 6.26 Case-9 modeling
Total Deformation: 0.2108 mm
Fig. 6.27 Case-9 Total Deformation
Equivalent stress: 185.15 MPa
Fig. 6.28 Case-9 Equivalent stress
52
6.6 DATA ANALYSIS
A number of methods have been suggested by Taguchi for analyzing the data:
observation method, ranking method, column effect method, ANOVA, S/N ANOVA, plot of
average response curves, interaction graphs etc. However, in the present investigation the
following methods have been used:
ANOVA for S/N data
S/N response graphs
Interaction graphs
Residual graphs
The plot of average responses at each level of a parameter indicates the trend. It is a
pictorial representation of the effect of parameter on the response. The change in the response
characteristic with the change in levels of a parameter can easily be visualized from these curves.
Typically, ANOVA for OA„s are conducted in the same manner as other structured experiments
The S/N ratio is treated as a response of the experiment, which is a measure of the variation
within a trial when noise factors are present. A standard ANOVA can be conducted on S/N ratio
which will identify the significant parameters (mean and variation). Interaction graphs are used
to select the best combination of interactive parameters. Residual plots are used to check the
accuracy.
53
CHAPTER -7
ANALYSIS AND DISCUSSION OF RESULTS
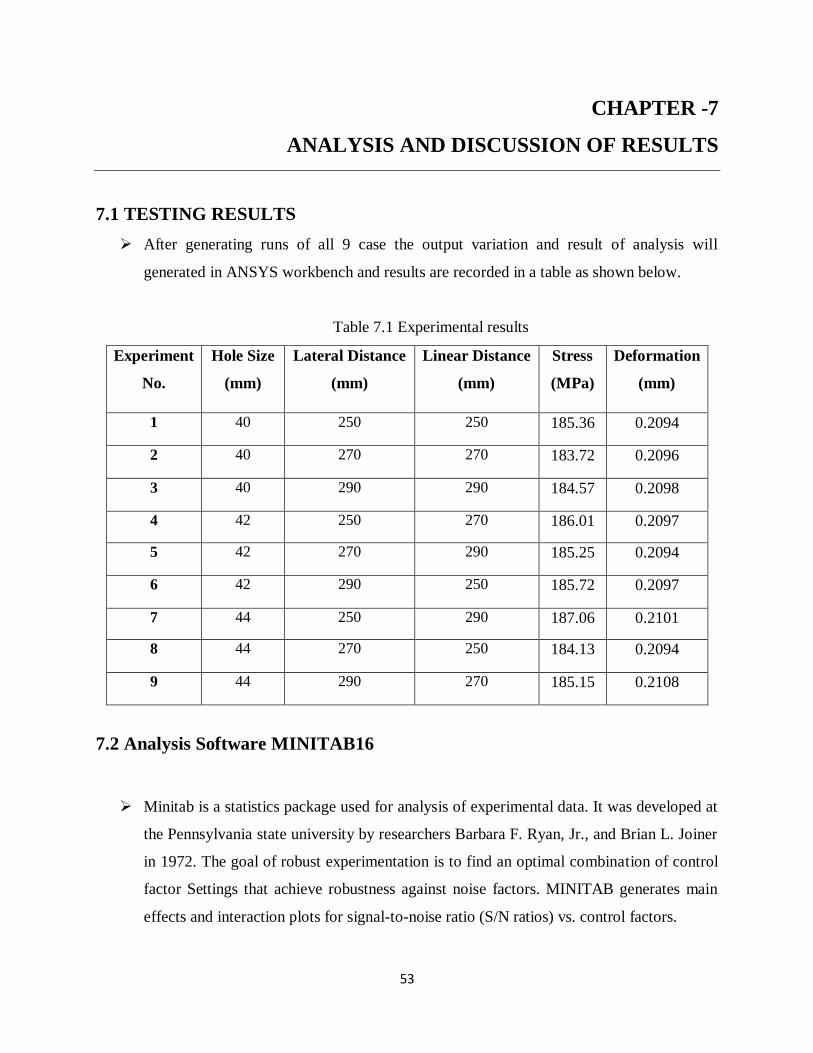
7.1 TESTING RESULTS
After generating runs of all 9 case the output variation and result of analysis will
generated in ANSYS workbench and results are recorded in a table as shown below.
Table 7.1 Experimental results
Experiment
No.
Hole Size
(mm)
Lateral Distance
(mm)
Linear Distance
(mm)
Stress
(MPa)
Deformation
(mm)
1 40 250 250 185.36 0.2094
2 40 270 270 183.72 0.2096
3 40 290 290 184.57 0.2098
4 42 250 270 186.01 0.2097
5 42 270 290 185.25 0.2094
6 42 290 250 185.72 0.2097
7 44 250 290 187.06 0.2101
8 44 270 250 184.13 0.2094
9 44 290 270 185.15 0.2108
7.2 Analysis Software MINITAB16
Minitab is a statistics package used for analysis of experimental data. It was developed at
the Pennsylvania state university by researchers Barbara F. Ryan, Jr., and Brian L. Joiner
in 1972. The goal of robust experimentation is to find an optimal combination of control
factor Settings that achieve robustness against noise factors. MINITAB generates main
effects and interaction plots for signal-to-noise ratio (S/N ratios) vs. control factors.

54
MINITAB is a powerful, easy-to-use, statistical software package that provides a wide
range of basic and advanced data analysis capabilities. MINITAB's straightforward
command structure makes it accessible to users with a great variety of background and
experience. MINITAB runs on PC and Macintosh computers, and most of the leading
workstations, minicomputers and mainframe computers. While MINITAB differs across
releases and computer platforms, the core of MINITAB - the worksheet and commands.
Fig.7.1 shows that screen view of MINITAB16 software described whole data which are
used in present study.
Fig 7.1 Screen view of MINITAB16 software
7.3 S/N Ratio Calculation for Stress and Deformation
In this the observe value of Stress and Deformation are transform in S/N ratio values to find out
the optimum combination of parameters for response variable. In stress and deformation
response ―smaller is better‖ is objective characteristics.
55
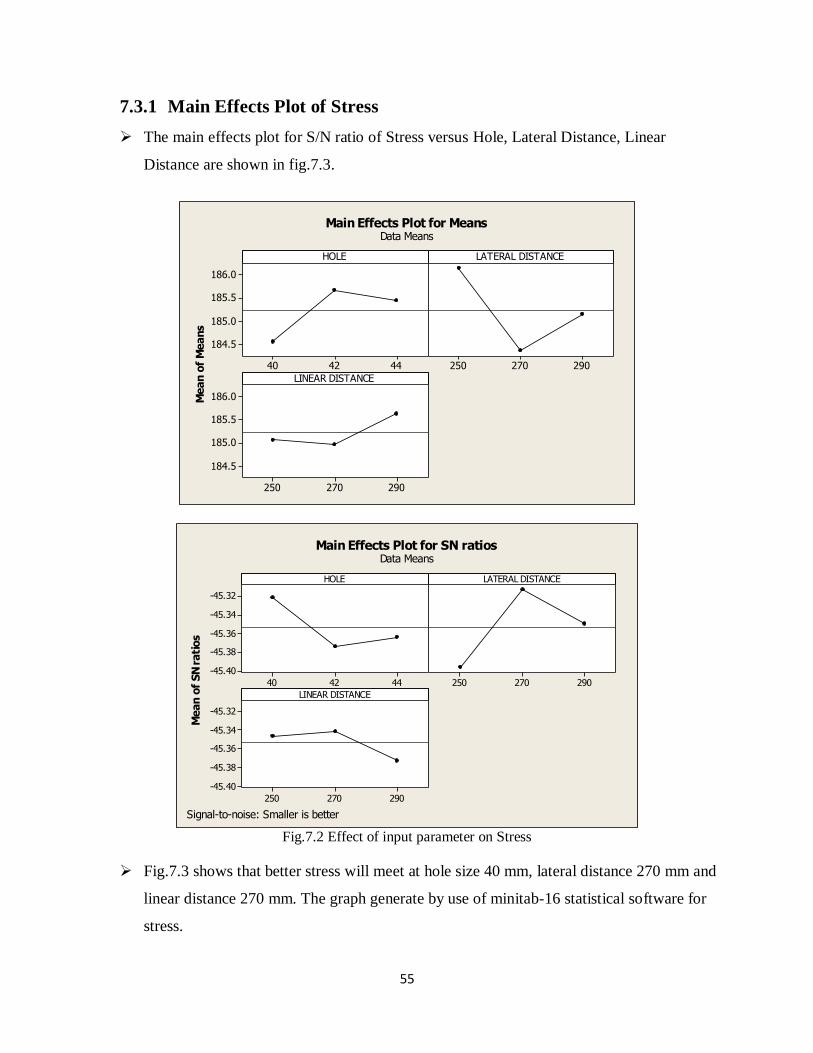
7.3.1 Main Effects Plot of Stress
The main effects plot for S/N ratio of Stress versus Hole, Lateral Distance, Linear
Distance are shown in fig.7.3.
444240
186.0
185.5
185.0
184.5
290270250
290270250
186.0
185.5
185.0
184.5
HOLE
Mean o
f M
eans
LATERAL DISTANCE
LINEAR DISTANCE
Main Effects Plot for MeansData Means
444240
-45.32
-45.34
-45.36
-45.38
-45.40
290270250
290270250
-45.32
-45.34
-45.36
-45.38
-45.40
HOLE
Mean o
f SN r
ati
os
LATERAL DISTANCE
LINEAR DISTANCE
Main Effects Plot for SN ratiosData Means
Signal-to-noise: Smaller is better
Fig.7.2 Effect of input parameter on Stress
Fig.7.3 shows that better stress will meet at hole size 40 mm, lateral distance 270 mm and
linear distance 270 mm. The graph generate by use of minitab-16 statistical software for
stress.

56
It has been conclude that the optimum combination of each process parameter for
stress will meet at hole size [A2], lateral distance [B2], linear distance [C2].
7.3.2 Main Effects Plot of Deformation
The main effects plot for S/N ratio of Deformation versus Hole, Lateral Distance,
Linear Distance are shown in fig.7.4.
444240
0.21000
0.20985
0.20970
0.20955
0.20940
290270250
290270250
0.21000
0.20985
0.20970
0.20955
0.20940
HOLE
Mean o
f M
eans
LATERAL DISTANCE
LINEAR DISTANCE
Main Effects Plot for MeansData Means
444240
13.58
13.57
13.56
13.55290270250
290270250
13.58
13.57
13.56
13.55
HOLE
Mean o
f SN r
ati
os
LATERAL DISTANCE
LINEAR DISTANCE
Main Effects Plot for SN ratiosData Means
Signal-to-noise: Smaller is better
Fig.7.3 Effect of input parameter on Deformation
57
Fig.7.4 shows that better Deformation will meet at hole size 40 mm, lateral distance 270
mm and linear distance 270 mm. The graph generate by use of minitab-16 statistical
software for Deformation.
It has been conclude that the optimum combination of each process parameter for
deformation will meet at hole size [A2], lateral distance [B2], linear distance [C2].
7.4 ANALYSIS OF VARIANCE (ANOVA)
In design of experiment the results are analyzed due to one or more of the following three
objectives. [14]
1. To establish the best or the optimum condition for a product or a process.
2. To estimate the contribution of individual factors.
3. To estimate the response under the optimum condition.
The main output from an analysis of variance study is arranged in a table. List the sources of
variation, their degrees of freedom, the total sum of squares, and the mean squares. The
analysis of variance table also includes the F-statistics and p-values. Use these to determine
whether the predictors or factors are significantly related to the response. ANOVA tables are
also used in regression and DOE analysis.
Analysis of variance (ANOVA) Terms & Notations:
n = Number of trials C.F. = Correction factor
E = Error P = Percentage contribution
F = Variance ratio T = Total of results
𝑓 = Degree of freedom S = sum of squares
𝑓E = Degree of freedom of error V = Mean squares (variance)
𝑓T = total degree of freedom
Total numbers of trail:
The total number of trial is the sum of numbers of trials at each level.
58
Degree of freedom:
It is a measure of amount of information that can be uniquely determined from a given set of
data. DOF for data concerning a factor equals one less than the number of levels.
Variance:
Variance measures the distribution of the data about the mean of the data.
Variance ratio:
Variance ratio is the ratio of variance due to the effect of a factor and variance due to the error
term. This ratio is used to measure the significance of the factor under investigation with respect
to the variance of all the factors included in the error term. The F value obtained in the analysis is
compared with a value from standard F – tables for a given level of significance.
When the computed value is less than the value determined from the F tables at the selected level
of significance, the factor does not contribute to the sum of squares within the confidence level.
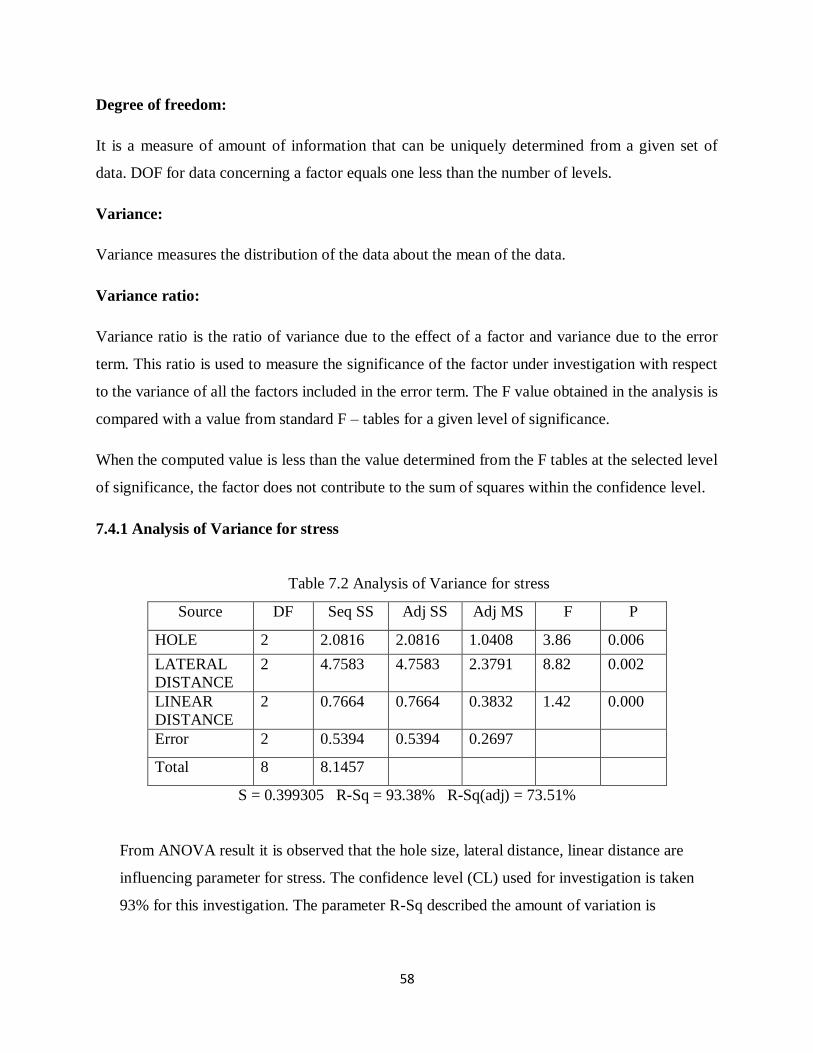
7.4.1 Analysis of Variance for stress
Table 7.2 Analysis of Variance for stress
Source DF Seq SS Adj SS Adj MS F P
HOLE 2 2.0816 2.0816 1.0408 3.86 0.006
LATERAL
DISTANCE
2 4.7583 4.7583 2.3791 8.82 0.002
LINEAR
DISTANCE
2 0.7664 0.7664 0.3832 1.42 0.000
Error 2 0.5394 0.5394 0.2697
Total 8 8.1457
S = 0.399305 R-Sq = 93.38% R-Sq(adj) = 73.51%
From ANOVA result it is observed that the hole size, lateral distance, linear distance are
influencing parameter for stress. The confidence level (CL) used for investigation is taken
93% for this investigation. The parameter R-Sq described the amount of variation is
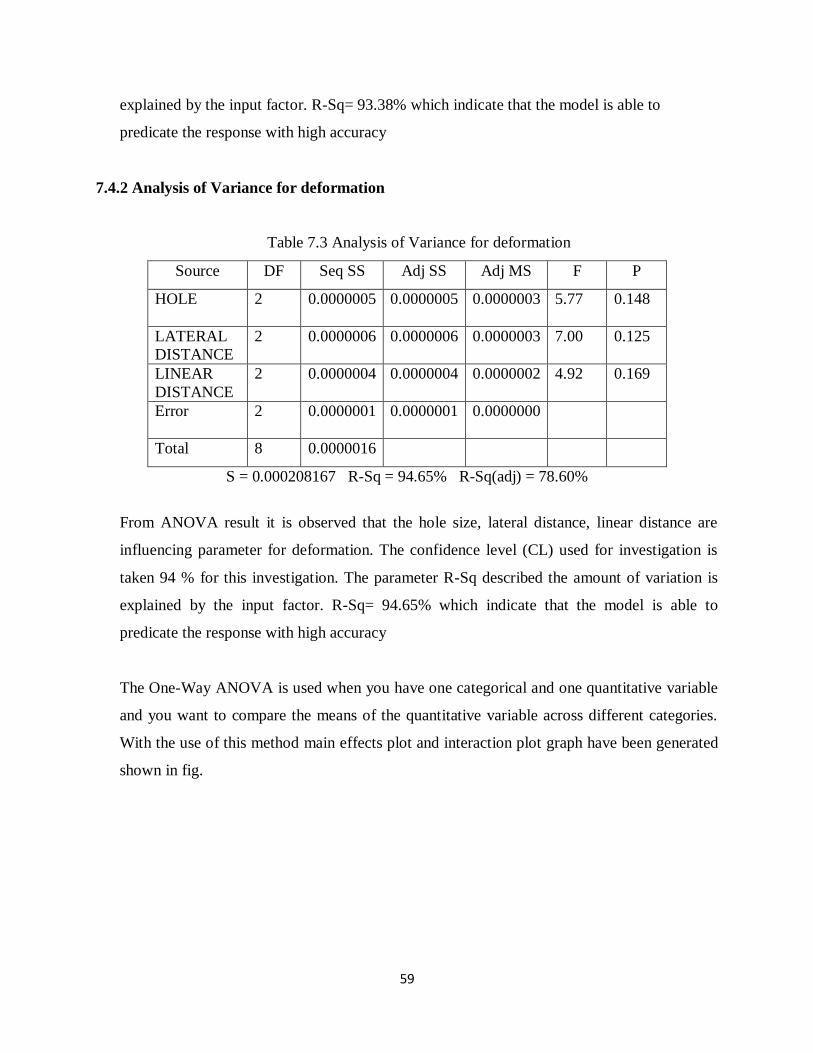
59
explained by the input factor. R-Sq= 93.38% which indicate that the model is able to
predicate the response with high accuracy
7.4.2 Analysis of Variance for deformation
Table 7.3 Analysis of Variance for deformation
Source DF Seq SS Adj SS Adj MS F P
HOLE 2 0.0000005 0.0000005 0.0000003 5.77 0.148
LATERAL
DISTANCE
2
0.0000006 0.0000006 0.0000003 7.00 0.125
LINEAR
DISTANCE
2
0.0000004 0.0000004 0.0000002 4.92 0.169
Error 2 0.0000001 0.0000001
0.0000000
Total 8 0.0000016
S = 0.000208167 R-Sq = 94.65% R-Sq(adj) = 78.60%
From ANOVA result it is observed that the hole size, lateral distance, linear distance are
influencing parameter for deformation. The confidence level (CL) used for investigation is
taken 94 % for this investigation. The parameter R-Sq described the amount of variation is
explained by the input factor. R-Sq= 94.65% which indicate that the model is able to
predicate the response with high accuracy
The One-Way ANOVA is used when you have one categorical and one quantitative variable
and you want to compare the means of the quantitative variable across different categories.
With the use of this method main effects plot and interaction plot graph have been generated
shown in fig.

60
444240
186.0
185.5
185.0
184.5
290270250
290270250
186.0
185.5
185.0
184.5
HOLE
Mean
LATERAL DISTANCE
LINEAR DISTANCE
Main Effects Plot for STRESSData Means
444240
0.21000
0.20985
0.20970
0.20955
0.20940
290270250
290270250
0.21000
0.20985
0.20970
0.20955
0.20940
HOLE
Mean
LATERAL DISTANCE
LINEAR DISTANCE
Main Effects Plot for DEFORMATIONData Means
Fig 7.4 Main effects plot for stress and deformation
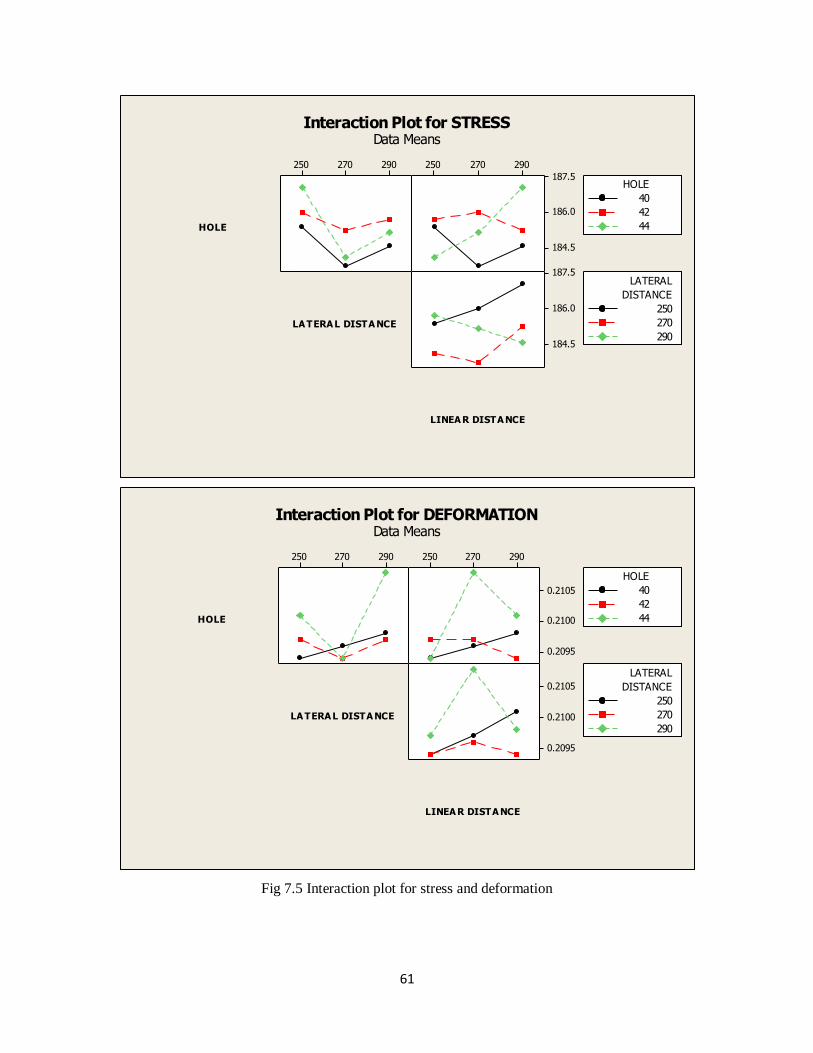
61
290270250 290270250
187.5
186.0
184.5
187.5
186.0
184.5
HOLE
LA TERA L DISTA NCE
LINEA R DISTA NCE
40
42
44
HOLE
250
270
290
DISTANCE
LATERAL
Interaction Plot for STRESSData Means
290270250 290270250
0.2105
0.2100
0.2095
0.2105
0.2100
0.2095
HOLE
LA TERA L DISTA NCE
LINEA R DISTA NCE
40
42
44
HOLE
250
270
290
DISTANCE
LATERAL
Interaction Plot for DEFORMATIONData Means
Fig 7.5 Interaction plot for stress and deformation

62
One-Way ANOVA: Hole, Lateral Distance, Linear Distance, Stress, Deflection
Table 7.4 Analysis of Variance for stress and deformation
Source DF SS MS F P
Factor 4 576727 144182 1193.52 0.000
Error 40 4832 121
Total 44 581559
S = 10.99 R-Sq = 99.17% R-Sq(adj) = 99.09%
Table 7.5 Analysis of Variance for stress and deformation
Level N Mean StDev
Hole 9 42.00 1.73
Lateral Distance 9 270.00 17.32
Linear Distance 9 270.00 17.32
Stress 9 185.22 1.01
Deflection 9 0.21 0.00
Pooled StDev = 10.99
In this method result it is observed that the parameter R-Sq described the amount of
variation. R-Sq= 78.60% which indicate that the model is able to predicate the response with
high accuracy. With use of this method optimized result has been predict.
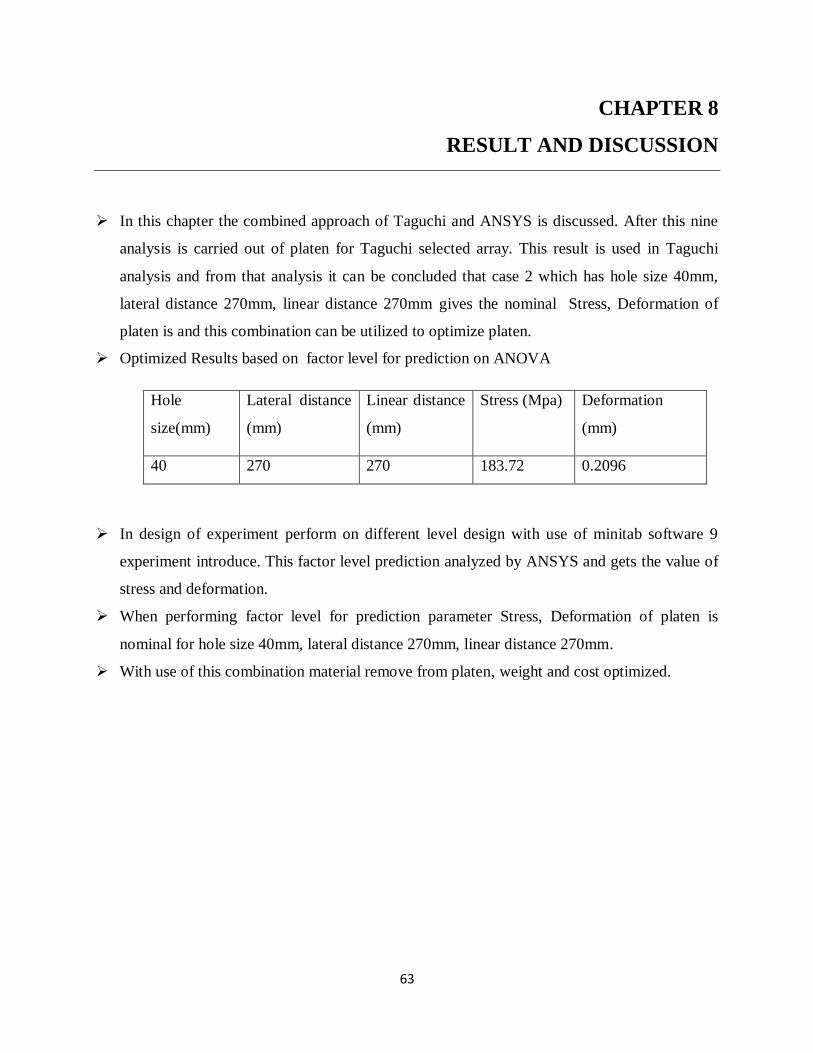
63
CHAPTER 8
RESULT AND DISCUSSION
In this chapter the combined approach of Taguchi and ANSYS is discussed. After this nine
analysis is carried out of platen for Taguchi selected array. This result is used in Taguchi
analysis and from that analysis it can be concluded that case 2 which has hole size 40mm,
lateral distance 270mm, linear distance 270mm gives the nominal Stress, Deformation of
platen is and this combination can be utilized to optimize platen.
Optimized Results based on factor level for prediction on ANOVA
Hole
size(mm)
Lateral distance
(mm)
Linear distance
(mm)
Stress (Mpa) Deformation
(mm)
40 270 270 183.72 0.2096
In design of experiment perform on different level design with use of minitab software 9
experiment introduce. This factor level prediction analyzed by ANSYS and gets the value of
stress and deformation.
When performing factor level for prediction parameter Stress, Deformation of platen is
nominal for hole size 40mm, lateral distance 270mm, linear distance 270mm.
With use of this combination material remove from platen, weight and cost optimized.

64
CHAPTER 9
CONSLUSION AND FUTURE SCOPE
In this research, three parameters: hole size, lateral distance, linear distance were analyzed
for material removal from platen. Taguchi method was used in this research to conduct an
experimentation plan to determine the optimum parameters settings that affect the output
characteristic responses as proposed in this study such as stress and deformation
Optimization of all responses has been carried out with help of ANOVA method and the best
factor setting obtained is hole size 40mm, lateral distance 270mm, linear distance 270mm.
This parameter gives optimum value of material removal from platen. Hence, with use of this
parameter we get 5% cost can optimized.
Future scope:
In present work, optimization of two responses, stress and deformation considered for
platen. Due to time constraints, we optimized only platen of injection molding machine
although clamping assembly optimization may be carried out in future. Moreover in this
work kinematic analysis of clamping system of injection molding machine, linear elastic
fracture mechanics analysis of platen also carried out in future.
65
REFERENCES:
RESEARCH PAPERS
1. Sasikumar, C and Srikanth, S and Das, S K, “Analysis of premature failure of a tie bar in
an injection molding machine” , Engineering Failure Analysis, 13 (8). pp. 1246-1259, Jan
2006. ISSN:2077-2455
2. Z.W.jiao,P.C.Xie, Y.An,X.T.Wang, W.M.Yang “Development of internal circulation
two-platen IMM for Thermoplastic Polymer” , Journal of Materials Processing
Technology 211 (2011) 1076-1084. ISSN:0924-0136
3. George Z. Voyiadjis and PawelWoelke: General non-linear finite element analysis of
thick plates and shells, International journal of solids and structures Vol. 32. 30th August
2005. ISSN:0020-7683
4. Patel Niral ,MihirChauhan “FEA and Topology Optimization of 1000T Clamp Cylinder
for Injection Molding Machine” Nirma University International Conference (NUiCONE
2012), Procedia Engineering 51 (2013)617-623. ISSN:1877-7058
5. DheerajMandliya, YogeshAgrawal, G.V.R SeshagiriRao “Design Optimization of
Stationary Platen of Plastic Injection Molding Machine Using FEA”, International
Journal Of Engineering Sciences & Research Technology, May-2014. ISSN:2277-9655
6. Shu Huang Sun “Optimum topology design for the stationary platen of a plastic injection
machine” ,Computers in Industry, Volume 55, Issue 2, Pages: 147 –158, Oct 2004.
ISSN:0166-3615
7. INSIGHT® (MPI®) 2005 MOLD FLOW CORPORATION, USA, “Simulation of core
shift and Injection Molding Machine clamp over-tonnage using Mold-flow plastics”.
ISSN:1778-1824
8. D. Papageorgiou , C. Medrea , N. Kyriakou : Failure analysis of H13 working die used in
plastic injection moulding, Engineering Failure Analysis 35 (2013) Pages: 355–359.
ISSN:1350-6307
9. Ph.D. Eng. Volodymyr Krasinskiy “Optimization of Injection Molding Manufacturing
For Automotive Industry” Transfer inovácií 24/2012, Pages: 200-204. ISSN 0322-7340.
10. Li-ping Ding, Jian-rong Tan, ZheWei “Multi-Objective Performance Design Of Injection
Molding Machine Via A New Multi-Objective Optimization Algorithm” International
Journal of Innovative Computing, 2011, Pages:3939-3949, ISSN 1349-4198
66
11. Xiaowei Li, Zhiming Jin, Yajun Zhang “Kinematic calculation analysis of micro
injection molding machine with double-toggle clamping mechanism based on
MATLAB” 2nd International Conference on Electronic & Mechanical Engineering and
Information Technology (EMEIT-2012) Pages. 1746-1750, ISSN 1349-4198
12. Amol J. Asalekar “Design & Analysis in Injection Moulding Machine System to Reduce
the Torsional Failure of Screw” International Journal of Engineering Research &
Technology (IJERT) , Pages: 1240-1243 ISSN: 2278-0181
13. Mr.G.V.Pujari “Defect by Applying Taguchi & Moldflow Method For Injection Molding
Component” International Journal of Advanced Technology in Engineering and Science,
Volume No.03, Issue No. 01, January 2015, Pages: 95-101 ISSN: 2348 – 7550
14. Kamaruddin , Zahid A. Khan,S. H. Foong. “Application of Taguchi Method in the
Optimization of Injection Moulding Parameters for Manufacturing Products from Plastic
BlendS” IACSIT International Journal of Engineering and Technology, Vol.2, No.6,
December 2010 Pages: 574-580, ISSN: 2678-0171
15. Dipl.-Ing. C. Hostert, Prof. Dr.-Ing. S. Maas, Prof. Dr.-Ing. A. Prof. Dr.-Ing.
R.Nordmann, TU-Darmstadt; “Dynamic Simulation of an Injection Molding Machine”
International Journal of Engineering and Technology, May 2006, Pages 130-139 ISSN:
3378-0185
16. S.Selvaraj,P.Venkataramaiah “Design and Fabrication of an Injection Moulding Tool”
International Conference on Design and Manufacturing, Volume 64, 2013 Pages:1310-
1319, ISSN: 1785-0151
17. G.C.A. DeRose Jr., A.R. Diaz, “Hierarchical solution of largescale three-dimensional
topology optimization problems” 1996 ASME Design Engineering Technical Conference
and Computers in Engineering Conference, Irvine, CA, 96-DETC/DAC-1486, August
1996.
18. B. Torstenfelt, A. Klarbring, Conceptual optimal design for modular car product families
using simultaneous size, shape and topology optimization”, Finite elements in analysis
and design, vol. 43, pp.1050-1061, June 2007.

67
DISSERTATIONS
19. Nirav B. Barevadiya “Optimization of Wax Tank Parameter In Injection Molding
Machine to Maintain Uniform Temperature of Wax” U. V. Patel College of Engiineeriing
Ganpat Uniiversiity Kherva, Mehsana, May-2012.
20. Rikard Johansson and Daniel Konijnendijk “Injection Moulding Simulation -A fnite
element approach to analyse the thermodynamics in an IM tool”, Lund University, Lund,
Sweden, March 2007
21. Andreas Östergren, Master‟s Thesis in the Applied Mechanics Department of Applied
Mechanics Division of Material and Computational Mechanics “Prediction of residual
stresses in injection moulded parts” Chalmers University Of Technology, Göteborg,
Sweden 2013, ISSN 1652-8557
BOOKS
22. Prof. sham Tickoo, Deepak maini “Solidworks 2007 for engineer and designers”,
Dreamtech press, First Edition 2007
23. Genichi Taguchi, “System of experimental design: engineering methods to optimize
quality and minimize costs”, Volume 1(1987).
WEB REFERENCES:
24. www.plasticsdom.com
25. http://www.dc.endr.scu.edu/cmdoc/dg_doc/develop/process/control/b1000002.htm
26. www.elitemachinerysystem.com
27. www.cheresources.com
28. www.sinotech.com


![ROBOSHOT @ + series - FANUC€¦ · FANUC standard CNC achieves superior molding repeatability Backflow monitor screen [Single platen] Expands mold area Magnetic clamping system](https://img.pdfslide.us/doc/110x75/612059acdbf09d6ce5540783/roboshot-series-fanuc-fanuc-standard-cnc-achieves-superior-molding-repeatability.jpg)