Embed Size (px)
Citation preview

Fingerprint-based
Maria PapadopouliAssociate Professor
University of Crete, FORTH, and KTHhttp://www.ics.forth.gr/mobile/
Seminar at SICS, September 18th, 2012
Joint research with D. Milioris, A. Papakonstantinou G. Tzagkarakis, and Panos TsakalidesUniversity of Crete and FORTH

Fast growth of location-based services e.g., 74% of US smartphone owners use location-based services
Several positioning systems have been proposed
Plethora of social networking location-based applications

Taxonomy of Positioning Systems
• Infrastructure & hardware• Signal modalities• Models & algorithms for estimating distances, orientation, position• Coordination system, scale and position description• Localized or remote computations• Mechanisms for device identification, classification or recognition• Cost, accuracy & precision requirements
• Radio (Radar, Ubisense, Ekahau)• Infrared (Active Badge) • Ultrasonic (Cricket, Active Bat)• Bluetooth • Vision (EasyLiving)• Physical contact with pressure (smart floor) or touch sensors

The main points of our research in positioning.
• Use fingerprinting & design various statistical fingerprints Not all fingerprints are created equal !
• Getting real! Challenges when experimenting under real-world scenarios
• The power of compressive sensing

No standardized relationship of any particular physical parameter to RSSINo defined relationship between RSSI value & power level in mW or dBmVendors provide their own accuracy, granularity, and range for the actual power (measured as mW or dBm) and their range of RSSI values (from 0 to RSSI_Max).
RSSI is acquired during only the preamble stage of receiving an 802.11 frame, not over the full frame
Received Channel Power Indicator(RCPI) measures the received RF power in a selected channel over the preamble and the entire received frame, and has defined absolute levels of accuracy and resolution
Received Signal Strength Indicator

The simplicity of RSSI Fingerprinting
• Grid-based representation of physical space (cells)• RSSI measurements collected from various APs @ cells of the space• Design of the fingerprint• Two phases: the training and the runtime
– Generation of fingerprints based on measurements collected at each phase
• Estimated position: the cell whose training fingerprint has the minimum distance from the runtime one

RSSI Statistical Fingerprinting for Positioning
AP1
APk
Signal-strength measurements per AP
cell
Distance of that cellRun-time fingerprint
Training-phase fingerprintcomparison
User position

Examples of RSSI Statistical Fingerprints
• Confidence intervals• Percentiles• Empirical distribution of the RSSI measurements• Theoretical distributions (e.g., Multivariate Gaussian)• Compressive sensing

Fingerprint based on Percentiles
number of percentiles
jth run-time percentile from the ith AP
Alternatively, K-Top weighted percentiles:Weighted centroid of the K cells with the smallest distance
number of APs
jth training percentile from the ith AP for cell c
Distance of cell c
(c) : vector with the percentiles based on the RSSI measurements collected during the training phase from i-th AP at cell c
i
jT
Euclidian distance

Fingerprint based on Empirical Distribution
• A vector whose entries correspond to APs• Each entry composed by all the RSSI measurements collected per AP • Only APs that appear in both training and runtime are used
• Distance: average Kullback-Leibler Divergence (KLDs)
• Reported position: the cell with the smallest distance

Statistical Fingerprint based on Confidence Interval
Each AP assigns a weight to cells based on the relative “placement” of the training vs. runtime confidence intervals
AP i assigns weight w(t) to cell t

Fingerprint based on Multivariate Gaussian
• Multivariate Gaussian for RSSI measurements collected from APs• Closed-form Kullback-Leibler Divergence (KLD) for distance estimation• Exploits the 2nd order spatial correlations between APs• Improves accuracy by iterating in multiple spatial scales (regions)

Multivariate Gaussian Distribution
Signature of cell i in training phase: – mean values of the received RSSI measurements per AP– : covariance matrix (measure of spatial correlation)
Signature of a cell in runtime phase:
APs from which measurements were collected at both training & runtime phases

Multi-layer Multivariate Gaussian Approach
Main idea:• Divide physical space into overlapping regions• Apply multivariate Gaussian model in each region• Select the region with the minimum distance
Iteratively• Divide the selected region into sub-regions• Repeat the process in that region
until the current region becomes a cell
The region-based aggregation and iterative process helps to• eliminate an incorrect region • increase the weight of the correct region

Experiment and it will lead you to the light
Cole Porter, 1930

At different premises:
• Lab & hallway at FORTH: 7m x 12m 10 APs (~ 5.4 on average @ cell) cell size 55cm x 55cm
• Aquarium: 1760m2, 40 tanks 7 APs (~ 3.4 on average @ cell) cell size 1m x 1m
Under different conditions:
• Presence of people or visitors quiet vs. busy periods
• Topological layout
Getting Real: Deployment of Testbeds.

Evaluation of RSSI Fingerprint Approaches
But what do we REALLY learn from these experiments ?

Fingerprinting is nice, but the devil is in the detail.

• Pathologies in fingerprint comparisons Sensitivity to the variations in RSSI measurements
• Large size of data that need to be sent by energy-constrained devices• When you suppress the noise-like features, do you still maintain the prominent information content?!
• Complexity and convergence issues

Pathology in the comparison of confidence interval fingerprints:
Sensitivity to the relative position of their endpoints (boundaries) : Even a small “displacement” may affect the value of the contribution assigned to a specific cell
Robustness with respect to RSSI Variations
Not all fingerprints are created equal: some are less robust than others.

Second thoughts are–in most cases–wiser.Euripides, 480-306 BC
Αι δεύτεραι πως φροντίδες σοφώτεραι. Ευριπίδης, 480-306 π.Χ.

Lots of Measurements: Energy consumption vs. Accuracy
Sparsity: the transform coefficients vector has a small number of large amplitude coefficients and a large number of small amplitude coefficients
Several natural signals are often sparse in a discrete cosine transformation or in a Fourier basis
Example:The 50 Hz powerline signal is sparse in the frequency-domain

Warming-up with Compressive Sensing
x: the vector with measurements
x : expressed in terms of the Ѱ basis x = Ѱ w, w: coefficients vector
x is K-sparse in Ѱ if it can be represented by K elements of this basis Theorem: if x is K-sparse, it can be reconstructed from M non-adaptive linear projections onto a second measurement basis (M = r K << N)

Compressive sensing in context
x: the vector with the RSSI measurements – x is not sparse
x can be expressed in terms of the Ѱ basis: x = Ѱ w Ѱ: created at training
Φ: measurement matrix Standard Gaussian Fixed
w: indicator vector {0,1}
compressed form of x
Optimization problem: find the
w: indicator vector {0,1}w is sparse

run-time RSSI measurements
run-time measurement matrix
compressed formof run-timemeasurements


Lessons Learned; Thou shalt not ignore radio propagation.
• The prominent impact of the presence of people and AP placement on accuracy.
• A proper pre-processing of the RSSI measurements is required.
• The ability to suppress the noise-like features is important.
• Reduce the amount of data sent to suppress the noise-like features but maintain the prominent information content!
• The iterative multi-layer spatial approach improves the accuracy by– eliminating distant incorrect cells – considering the neighboring cells around the user position

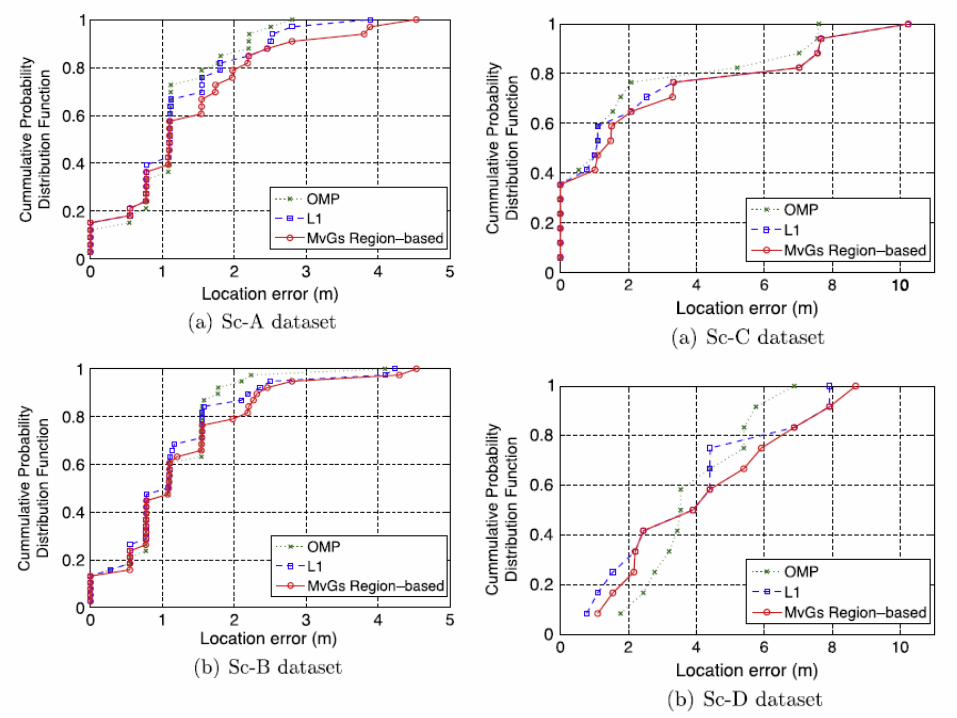
Summarizing the performance results …
• With less than 20% measurements, a reasonable accuracy can be achieved using compressive sensing (e.g., OMP)
• For the L1-norm optimization problem: Select an algorithm based on the convergence vs. accuracy tradeoff
Premise MvG OMP MvG OMP
FORTH 1.09 1.08 1.10 1.08
Aquarium 1.48 1.09 4.15 3.59
Quiet Period Busy Period
Δεί τά μέλλοντα τοίς γεγενημένοις τεκμαίρεσθαι.Ισοκράτης, 436-338 π.Χ.
Insight into future events is based on what happened in the past. Isocrates, 436-338 BC

Exploring the Power of Compressive Sensing
• New transform & measurement bases that are adaptive to the specific characteristics of the RSSI data
• Exploit the random nature of the measurement vectors for encryption without the extra computational cost of a separate encryption protocol
• Employing various modalities to enhance the accuracy • Reconsidering the problem of cooperative localization …
Exploring other directions

More information at http://www.ics.forth.gr/mobile/
Thank you!

Who is afraid of real-life measurements?
At different premises:• FORTH: 7m x 12m 10 APs (~ 5.4 on average @ cell) cell size 55cm x 55cm• Aquarium: 1760m2, 40 tanks 7 APs (~ 3.4 on average @ cell) cell size 1m x 1m
Under different conditions:• Presence of people or visitors relatively quiet vs. busy periods• Topological layout
Premise MvG OMP MvG OMP
FORTH 1.09 1.08 1.10 1.08
Aquarium 1.48 1.09 4.15 3.59
Quiet Period Busy Period

Lessons Learned; How the estimations per AP are used
• CS-based approach is carried out for each AP separately, using the compressed RSSI measurements, and the final estimate is given by the centroid of the individual estimated positions
• The confidence interval, percentiles, and empirical distributions perform an averaging over all APs of the values of the corresponding distance function before the final location estimation
• E.g., in the case of empirical distribution: Each cell is assigned a weight which corresponds to the average KLD of each AP (at that cell) from the runtime measurements collected at the unknown position from the same AP.Two cells with different KLD values between the individual APs may be reported erroneously to be close to each other after taking the average KLD, since the average operator eliminates the distinct contribution of each separate AP

• Mean sub-vectors and covariance sub-matrices are extracted according to
• Multivariate Gaussian density function:
• KLD between runtime and training of the ith cell:
Fingerprinting based on Multivariate Gaussian (cnt’d)
Estimated position: cell with minimum KLD

• Design of new transform and measurement bases that are adaptive to the specific characteristics of the RSSI data.
• A new sparsifying basis being able to increase the degree of sparsity of an RSSI measurements vector, represented in terms of this basis, is critical in the framework of CS, since the reconstruction accuracy increases as the sparsity increases.
• An improved performance can be guaranteed with high probability by employing an appropriate measurement matrix, which is highly incoherent with the sparsifying basis.

Who is afraid of real-life measurements?


• Pathologies in fingerprint comparisons• Sensitivity to the variations in RSSI measurements• Size of data that need to be exchanged! energy constraints of mobile devices
Fingerprinting is nice, but the devil is in the detail.
Evaluation of RSSI Fingerprint Approaches