Embed Size (px)
Citation preview
S1
SUPPLEMENTAL INFORMATION for
Fine-Tuning the Assemblies of Carbon Nanodots and Porphyrins
By
Tobias Scharl,a Alejandro Cadranel,a Philipp Haines,a Volker Strauss,a Sarah Bernhardt,a Sonia Vela,b Carmen Atienza,b
Franziska Gröhn,a Nazario Martín,*b and Dirk M. Guldi*a
Table of Contents
Experimental details …………………………………………………………………………………………………………………S2 Figure S1 …………………………………………………………………………………………………………………S3 Figure S2 …………………………………………………………………………………………………………………S4 Figure S3 …………………………………………………………………………………………………………………S5 Figure S4 …………………………………………………………………………………………………………………S6 Figure S5 …………………………………………………………………………………………………………………S7 Table S1 …………………………………………………………………………………………………………………S8 Figure S6 …………………………………………………………………………………………………………………S9 Figure S7 …………………………………………………………………………………………………………………S10 Table S2 …………………………………………………………………………………………………………………S11 Figure S8 …………………………………………………………………………………………………………………S12
Electronic Supplementary Material (ESI) for Chemical Communications.This journal is © The Royal Society of Chemistry 2018
S2
Experimental Details Physical Measurements
Steady state absorption and fluorescence spectroscopy measurements were performed with a Lambda 2 from
Perkin Elmer and a Fluoromax-3 from Horiba, respectively, keeping a strict argon atmosphere in contact with
the solutions. Electrochemical characterization was accomplished with a home- made three-electrode setup
connected to a μAutolabIII/FRA2 potentiostat from Metrohm-Autolab. A 3 mm glassy carbon disk served as a
working electrode and a platinum wire was used as a counter electrode. All potentials were measured against
a Ag/AgCl reference electrode.
Ultrafast transient absorption (TA) experiments were conducted using an amplified Ti:sapphire fs laser system
(Clark MXR CPA2101 and 2110, FWHM = 150 fs, exc = 420 nm, 200 nJ per pulse) with TA pump / probe
Helios detection systems from Ultrafast Systems. White light was generated focusing a fraction of the
fundamental 775 nm output onto a 2 mm sapphire disk. A magic angle configuration was employed to avoid
rotational dynamics. Excitation pulses of 420 nm wavelength were generated by a NOPA with subsequent
frequency doubling. Bandpass filters with ± 5 or ± 10 nm were used to ensure low spectral width and to
exclude 775 and 387 nm photons. All measurements were conducted in a 2 mm quartz cuvettes under argon
atmosphere. Obtained data were treated by global analyses using the R- package TIMP and GloTarAn. For
details please see references 21-23 in the manuscript.
DLS measurements were carried out using an ALV 5000 correlator with 320 channels, a CGS 3 goniometer
(ALV Langen, Germany) and a HeNe laser with a wavelength of λ = 632.8 nm with 22 mW output power. A
range of scattering angles of 30° < θ < 150° was covered in 5° steps. Data collection periods were 30 min to 2
h per scattering angle with 1 to 4 runs each. Data analysis was carried out by converting the measured
intensity autocorrelation function into the scattered electric field autocorrelation function using the Siegert
relation. The electric field autocorrelation functions were further analyzed by regularized inverse La Place
transformation using the program CONTIN by S. Provencher to obtain the intensity weighted distribution of
relaxation times. From this, the apparent diffusion coefficients were calculated using the relation Dapp = q-2 ∙
τ-1 for the mean τ of each process. To determine the hydrodynamic radius RH, the apparent diffusion
coefficient Dapp is extrapolated to zero scattering angle and then converted into RH through the Stokes-Einstein
relationship. In addition, volume-weighted size distributions were calculated from the electric field
autocorrelation functions through the corresponding regularized inverse La Place transformation.
Sample Preparation for DLS: The pCND sample was diluted 1:100, treated in an ultrasonic bath for 15 min and
filtered three times through 0.2 µm pore size filters. The ZnP-am•pCND sample was filtered twice through 0.2
µm pore size filters under Argon (filters: hydrophilic PTFE 0.2 µm Millipore Millex-LG).
S3
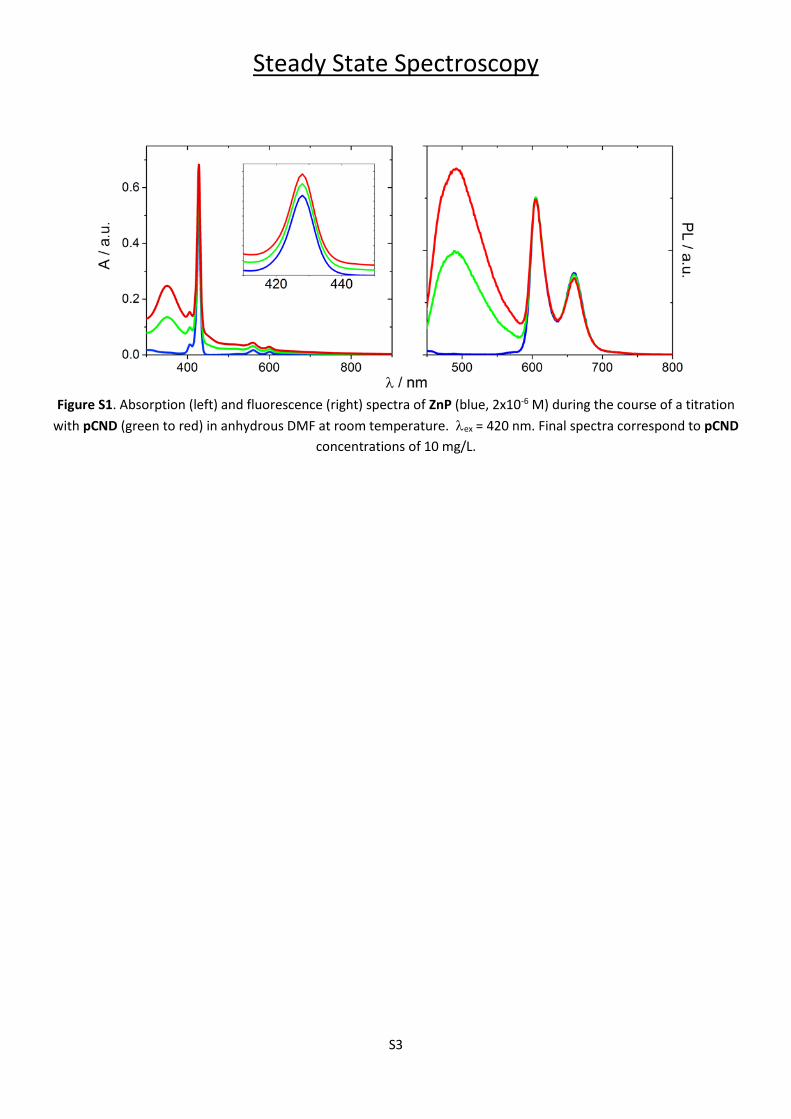
Steady State Spectroscopy
Figure S1. Absorption (left) and fluorescence (right) spectra of ZnP (blue, 2x10⁻⁶ M) during the course of a titration
with pCND (green to red) in anhydrous DMF at room temperature. ex = 420 nm. Final spectra correspond to pCND
concentrations of 10 mg/L.
S4
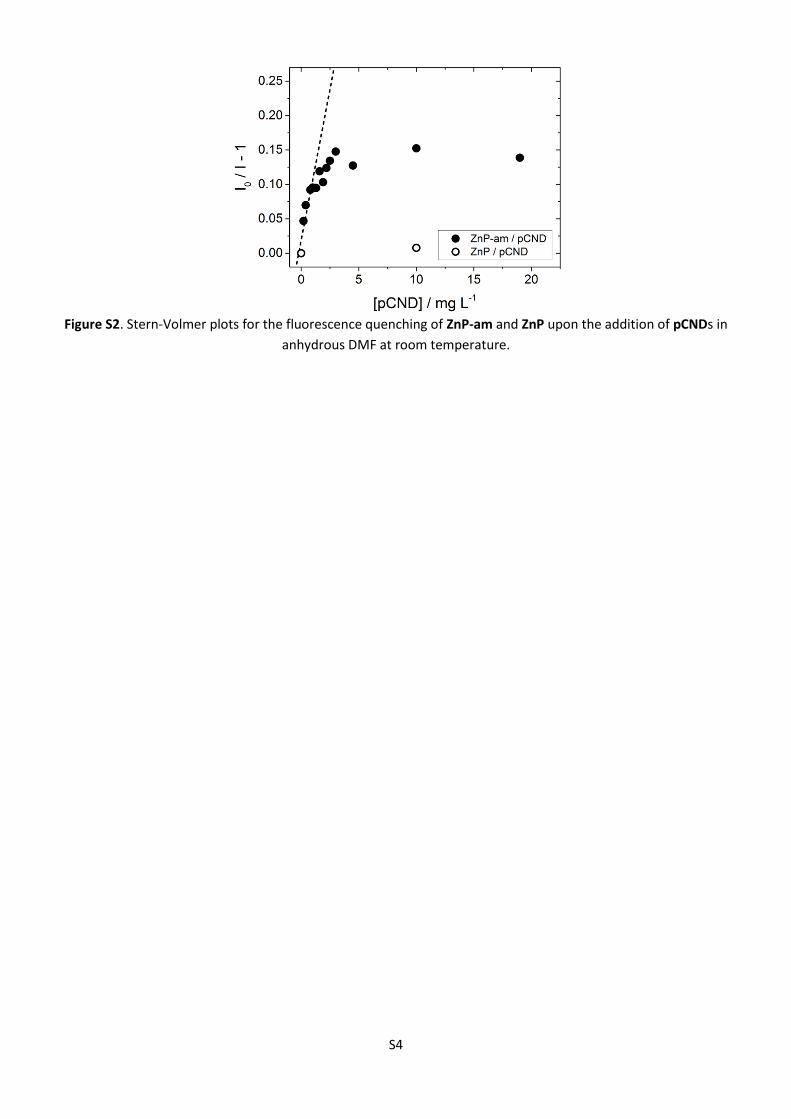
Figure S2. Stern-Volmer plots for the fluorescence quenching of ZnP-am and ZnP upon the addition of pCNDs in
anhydrous DMF at room temperature.

S5
Figure S3. Relative quenching of the fluorescence of of ZnP-am and ZnP upon the addition of pCNDs in anhydrous
DMF at room temperature.
S6
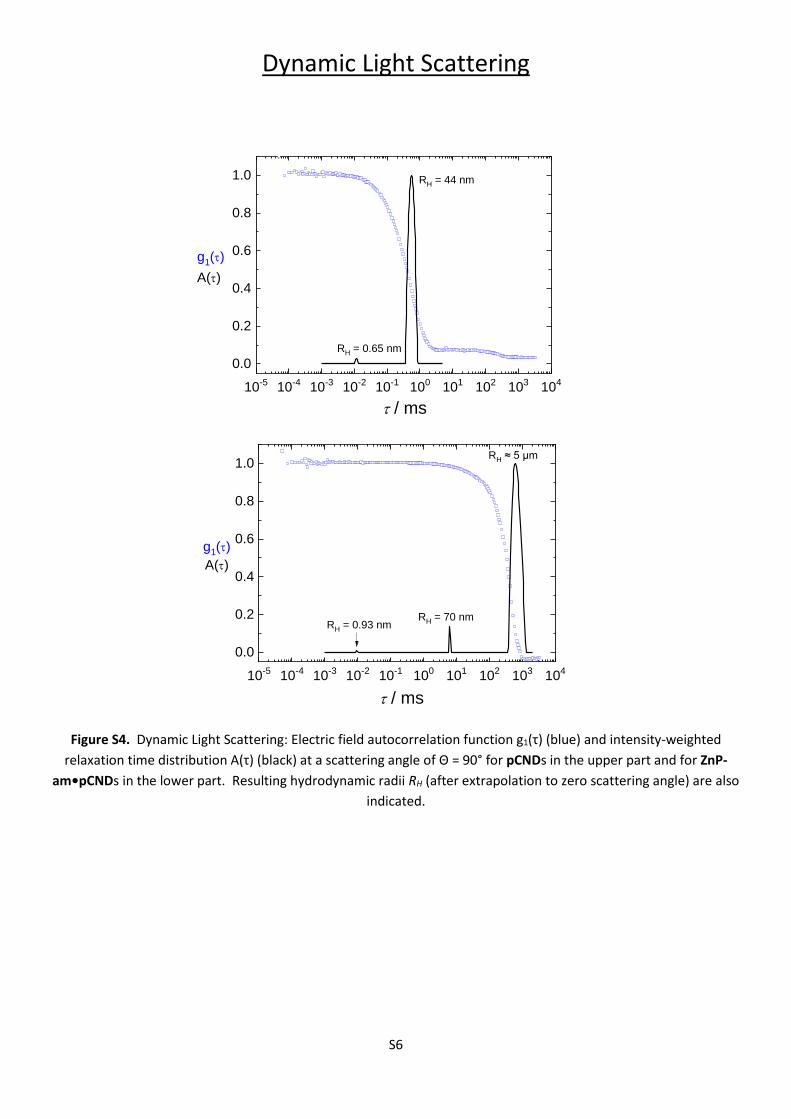
Dynamic Light Scattering
Figure S4. Dynamic Light Scattering: Electric field autocorrelation function g1(τ) (blue) and intensity-weighted
relaxation time distribution A(τ) (black) at a scattering angle of Θ = 90° for pCNDs in the upper part and for ZnP-
am•pCNDs in the lower part. Resulting hydrodynamic radii RH (after extrapolation to zero scattering angle) are also
indicated.
10-5 10-4 10-3 10-2 10-1 100 101 102 103 104
0.0
0.2
0.4
0.6
0.8
1.0
A(t)
g1(t)
t / ms
RH = 0.65 nm
RH = 44 nm
10-5 10-4 10-3 10-2 10-1 100 101 102 103 104
0.0
0.2
0.4
0.6
0.8
1.0RH ≈ 5 µm
A(t)
t / ms
RH = 0.93 nmRH = 70 nm
g1(t)
S7
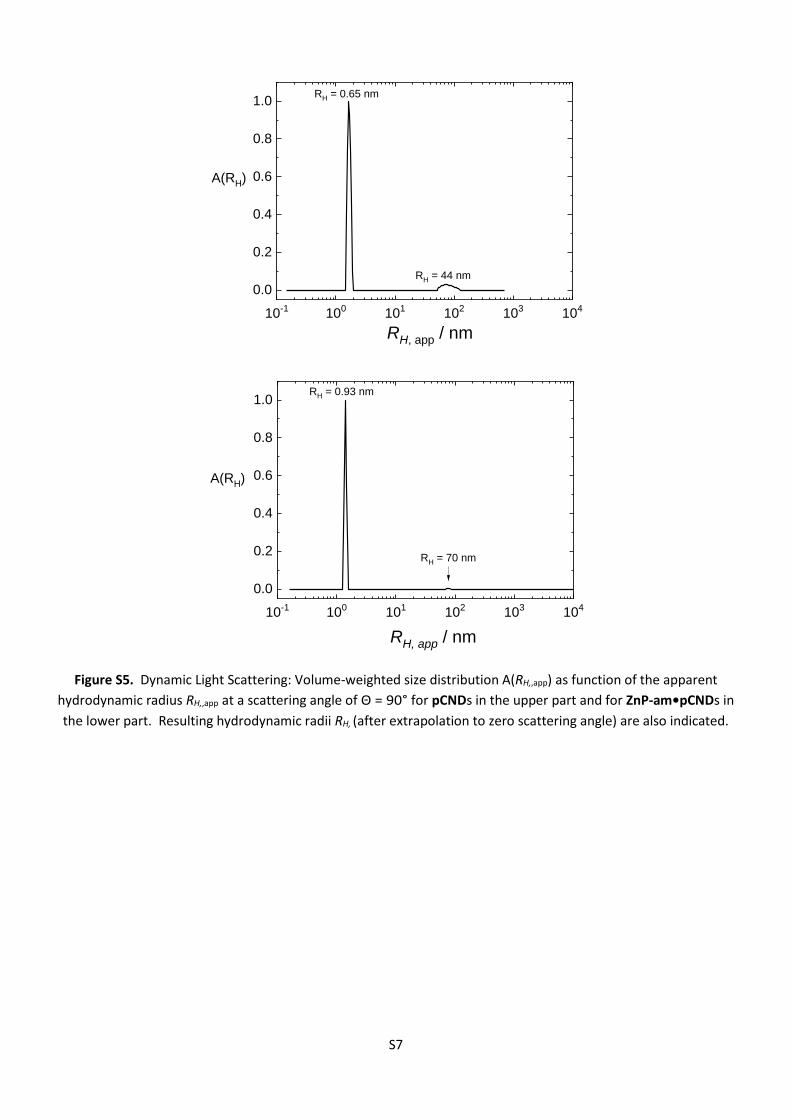
Figure S5. Dynamic Light Scattering: Volume-weighted size distribution A(RH,,app) as function of the apparent
hydrodynamic radius RH,,app at a scattering angle of Θ = 90° for pCNDs in the upper part and for ZnP-am•pCNDs in
the lower part. Resulting hydrodynamic radii RH, (after extrapolation to zero scattering angle) are also indicated.
10-1 100 101 102 103 104
0.0
0.2
0.4
0.6
0.8
1.0
A(RH)
RH, app / nm
RH = 44 nm
RH = 0.65 nm
10-1 100 101 102 103 104
0.0
0.2
0.4
0.6
0.8
1.0
A(RH)
RH, app / nm
RH = 70 nm
RH = 0.93 nm

S8
Table S1: DLS-Results for pCND and ZnP-am•pCND: Hydrodynamic radius RH, distribution width (standard deviation)
σ and relative amount of the species in the intensity and volume distribution. The error for RH, results from the
angular extrapolation of the mean apparent diffusion coefficient to zero scattering angle.
sample
RH
σ
Relative weight in
intensity distribution
Relative weight in volume
distribution
pCND (0.65 ± 0.42) nm 0.08 0.9 % 92 %
(44 ± 3) nm 0.32 99.1 % 8 %
ZnP-am•pCND (0.93 ± 0.34) nm 0.36 0.2 % 99.7 %
(70 ± 18) nm 0.43 0.13 % 0.3 %
5 µm 0.16 99.67 % -
S9
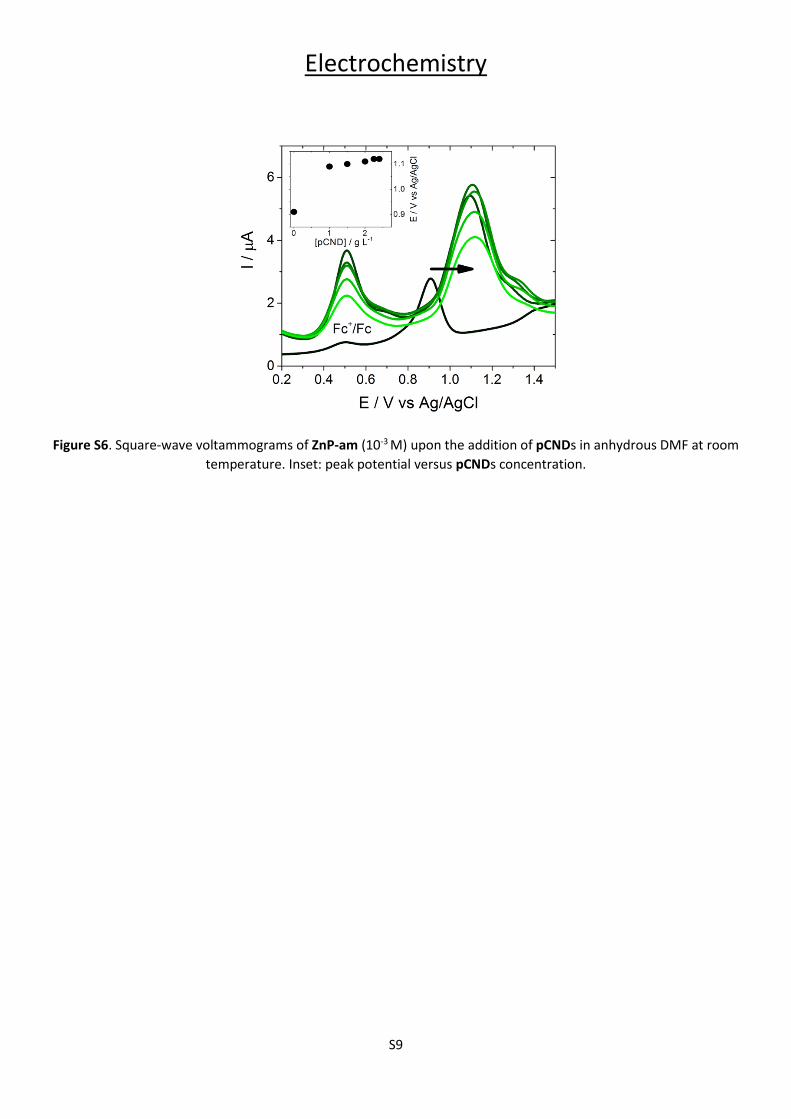
Electrochemistry
Figure S6. Square-wave voltammograms of ZnP-am (10-3 M) upon the addition of pCNDs in anhydrous DMF at room
temperature. Inset: peak potential versus pCNDs concentration.
S10
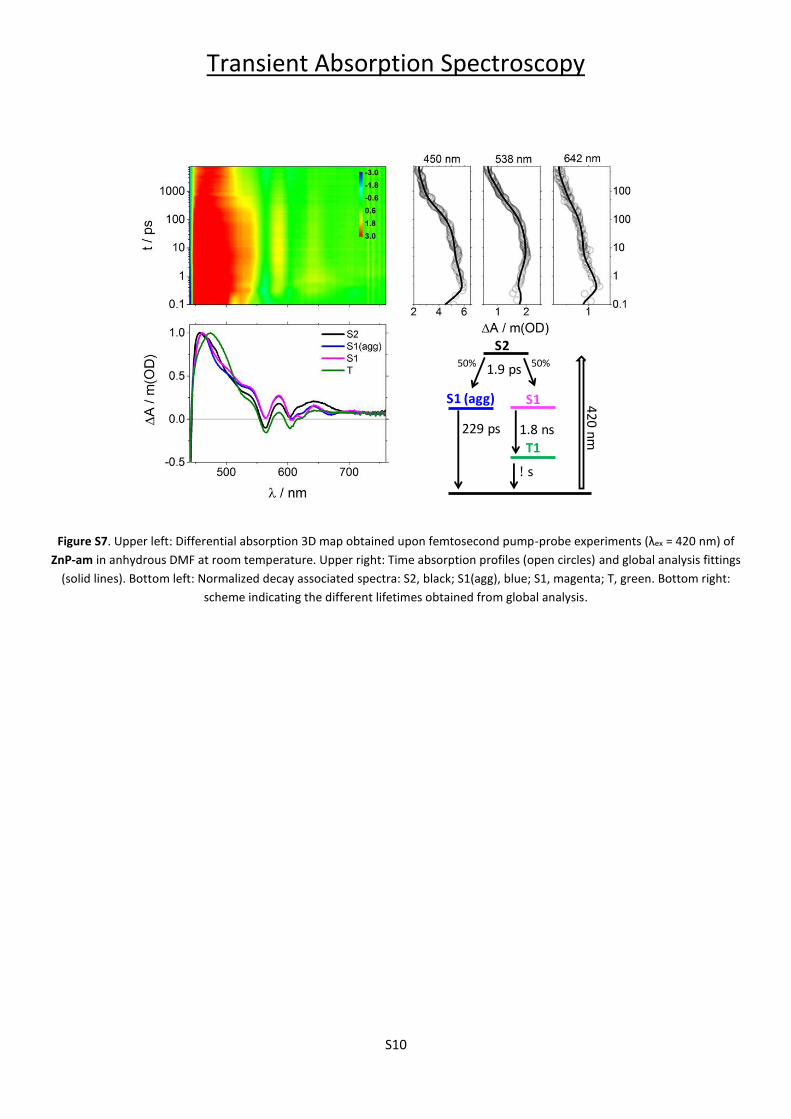
Transient Absorption Spectroscopy
Figure S7. Upper left: Differential absorption 3D map obtained upon femtosecond pump-probe experiments (λex = 420 nm) of
ZnP-am in anhydrous DMF at room temperature. Upper right: Time absorption profiles (open circles) and global analysis fittings
(solid lines). Bottom left: Normalized decay associated spectra: S2, black; S1(agg), blue; S1, magenta; T, green. Bottom right:
scheme indicating the different lifetimes obtained from global analysis.
S2
T1
S1 (agg) S1
! s
1.8 ns
1.9 ps
229 ps
420
nm
50% 50%

S11
Table S2. Lifetimes extracted from global analysis of the data for the different systems studied in this work, in anhydrous DMF at
room temperature.
Sample t1 / ps t2 / ps t3 / ps t4 / ps t5 / ps
ZnP-am 1.9 - 229 1800 >15000
ZnP-am•pCND 2.0 27.0 868 1300 >15000

S12
Spectroelectrochemistry
Figure S8. Difference absorption spectra of ZnP-am upon oxidation in anhydrous DMF at room temperature (from black to red,
0.8 V to 1.2 V). Supporting electrolyte: TBAPF6 0.1 M.