Embed Size (px)
Citation preview
Fine scale air quality modeling using dispersion and CMAQ
modeling approaches: An example application in
Wilmington, DE
Jason Ching
NOAA/ARL/ASMD
RTP, NC
Collaborators• Mohammed A Majeed
Delaware Department of Natural Resources and Environmental Conservation
New Castle, DE
• Vlad IsakovAtmospheric Sciences Modeling Division, NOAA
RTP, NC
• Andrey KhlystovDuke University,
Durham, NC
Outline of Presentation
• Background and Rationale of investigation• Conceptual Hybrid modeling approach• Description and role of EDATAS database
to fine scale air toxic modeling • Future Plans
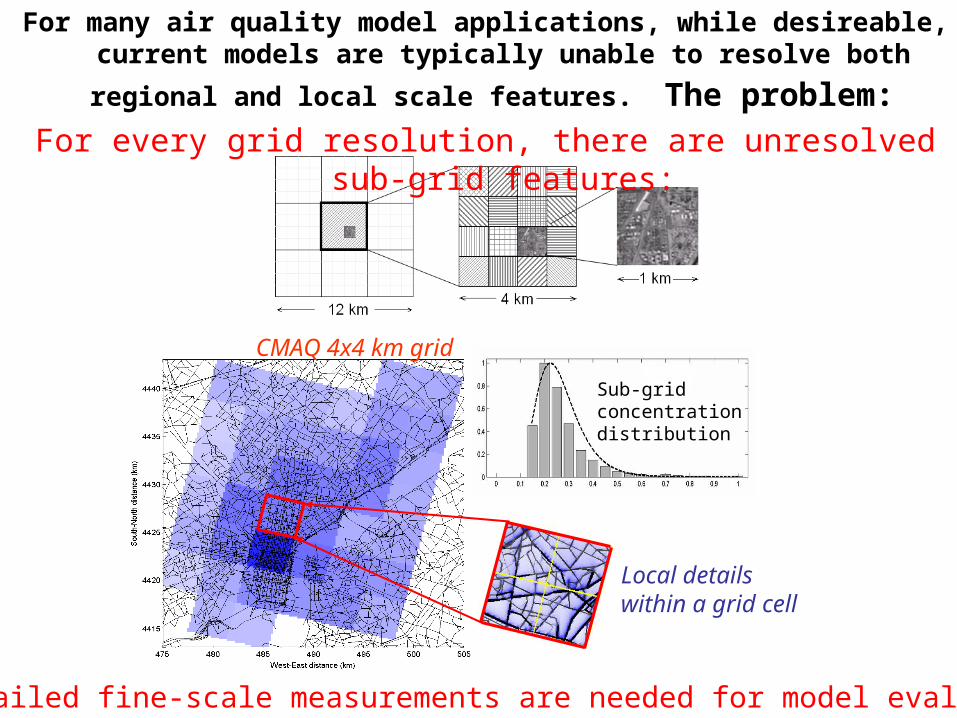
For many air quality model applications, while desireable, current models are typically unable to resolve both regional and local scale features.
The problem: For every grid resolution, there are unresolved sub-grid features:
CMAQ 4x4 km grid
Local details within a grid cell
Sub-grid concentrationdistribution
Detailed fine-scale measurements are needed for model evaluation
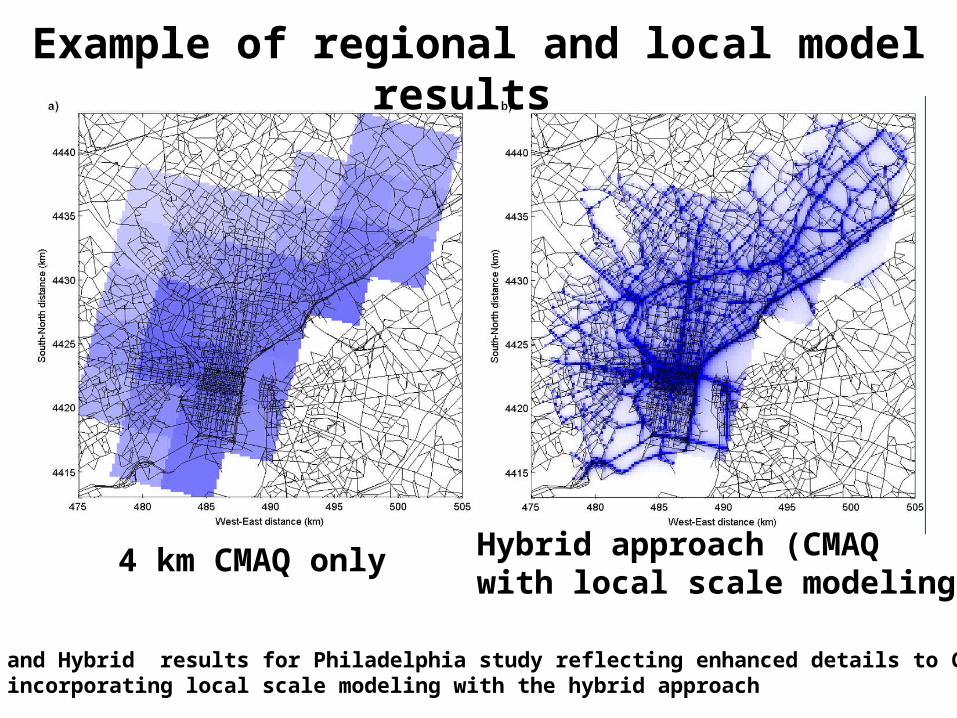
4 km CMAQ only Hybrid approach (CMAQ with local scale modeling)
Example of regional and local model results
CMAQ and Hybrid results for Philadelphia study reflecting enhanced details to CMAQ from incorporating local scale modeling with the hybrid approach
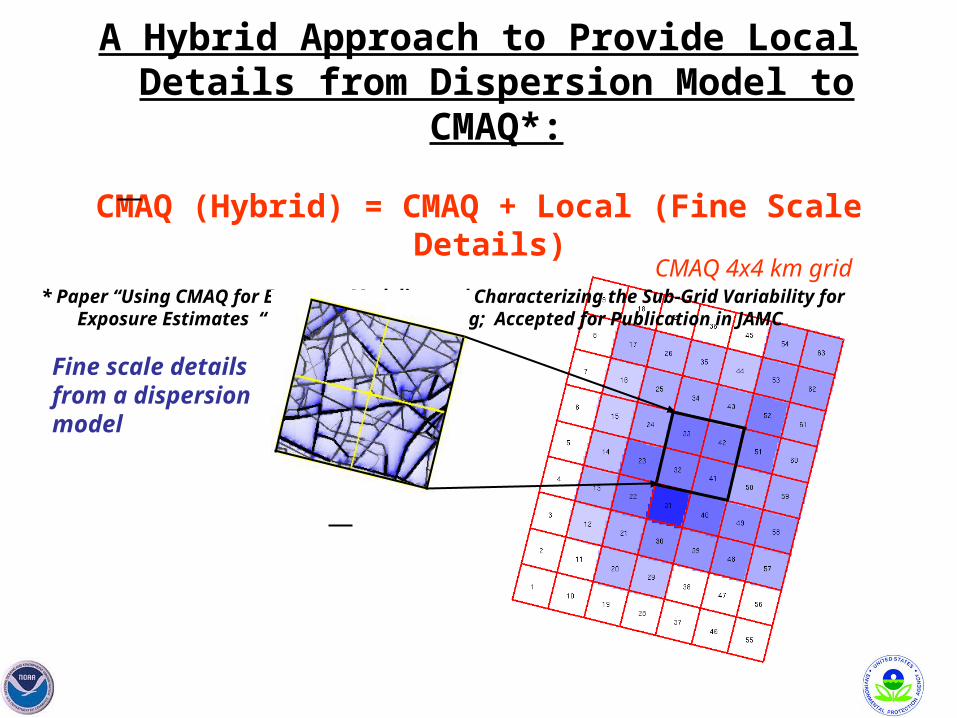
A Hybrid Approach to Provide Local Details from Dispersion Model to CMAQ*:
CMAQ (Hybrid) = CMAQ + Local (Fine Scale Details)
* Paper “Using CMAQ for Exposure Modeling and Characterizing the Sub-Grid Variability for Exposure Estimates “ Isakov, Irwin and Ching; Accepted for Publication in JAMC
CMAQ 4x4 km grid
Fine scale details from a dispersion model
• Hybrid approach provides a means for introducing fine scale concentration detail to regional scale model simulations
• This approach needs to be evaluated • A collaboration of opportunity!
– Field study monitoring program, EDATAS, Enhanced Delaware Air Toxics Assessment Study focus on Wilmington, DE
– Concurrent investigations to characterize fine scale fields of air toxics and PM
– Continue investigations toward advancing the development of advanced air quality modeling tools for air toxics and other applications.
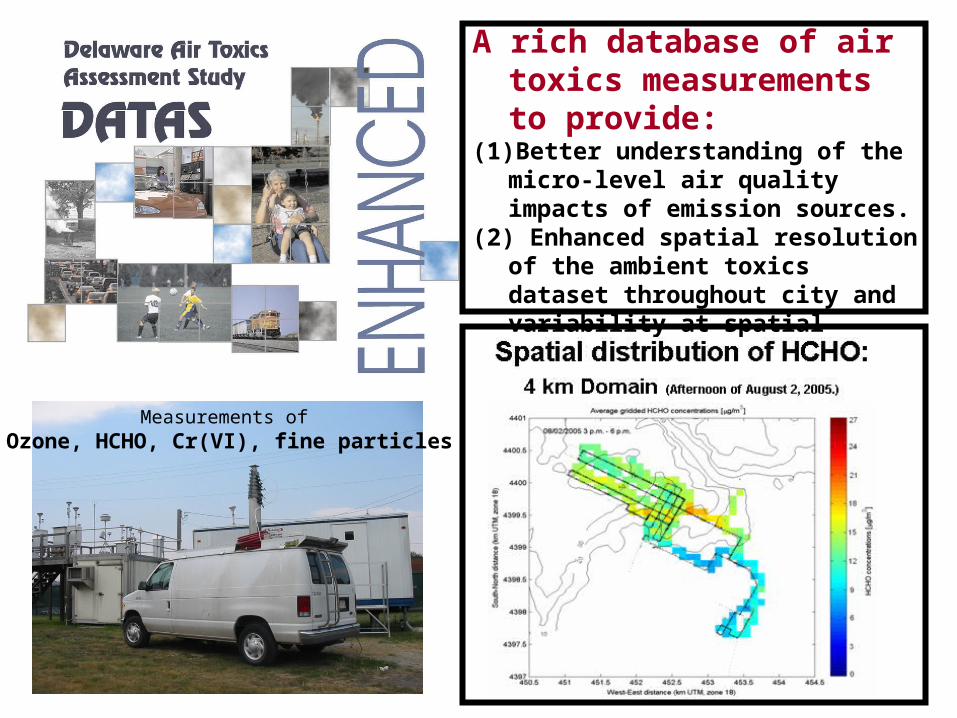
A rich database of air toxics measurements to provide:
(1) Better understanding of the micro-level air quality impacts of emission sources.
(2) Enhanced spatial resolution of the ambient toxics dataset throughout city and variability at spatial scales of order 100m by mobile measurements
(3) Means to evaluate our hybrid approach
Measurements of Ozone, HCHO, Cr(VI), fine particles
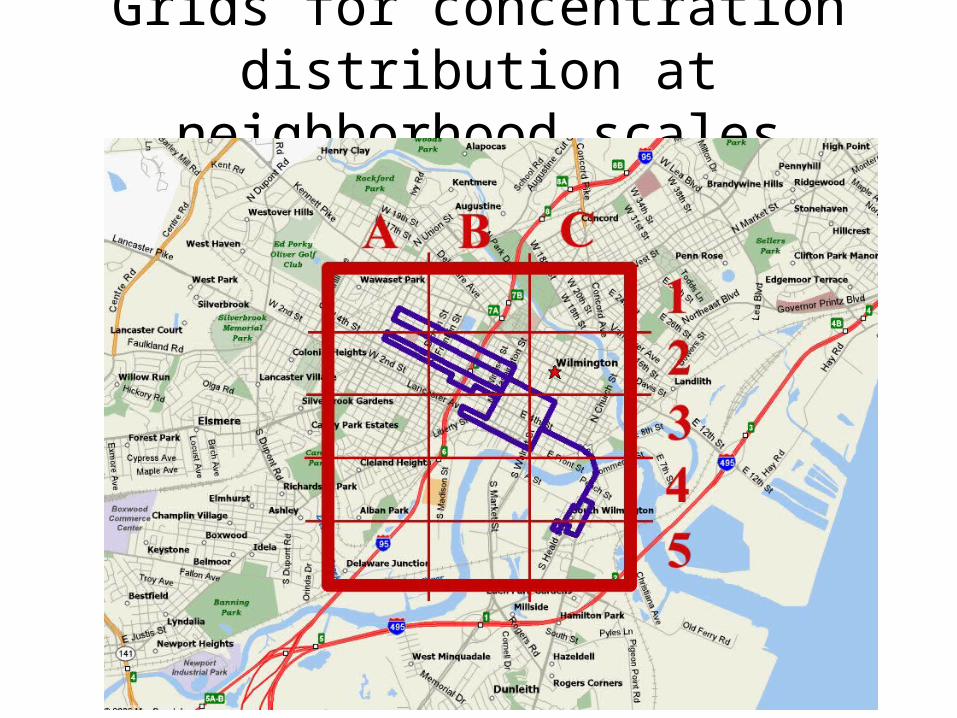
Grids for concentration distribution at neighborhood scales
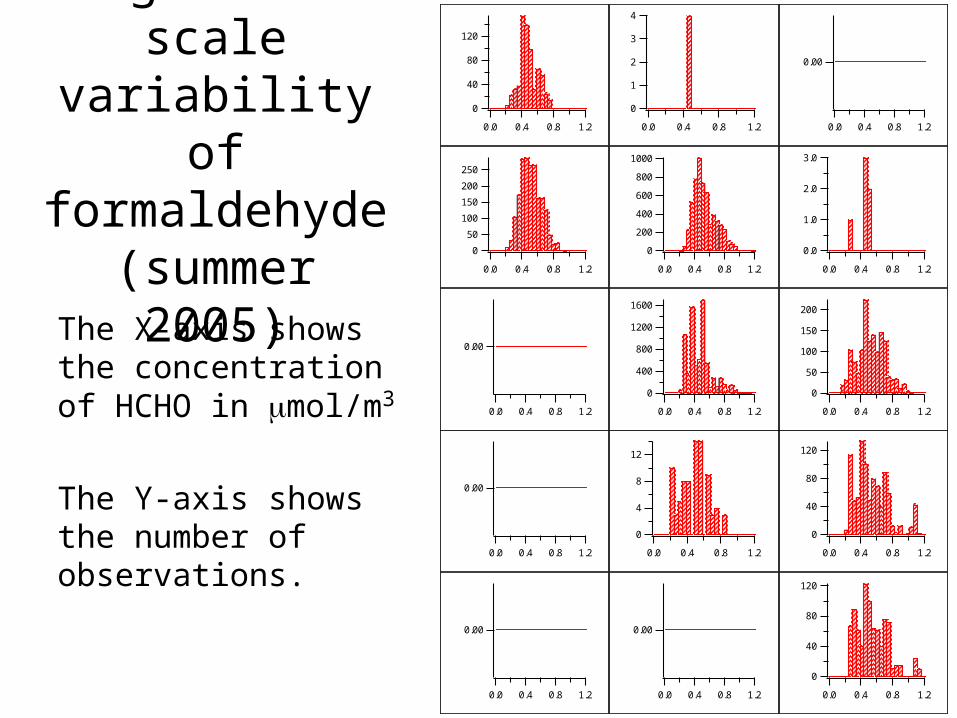
Neighborhood scale variability of formaldehyde(summer 2005)
The X-axis shows the concentration of HCHO in mol/m3
The Y-axis shows the number of observations. 120
80
40
0
1.20.80.40.0
120
80
40
0
1.20.80.40.0
250
200
150
100
50
0
1.20.80.40.0
0.00
1.20.80.40.0
0.00
1.20.80.40.0
0.00
1.20.80.40.0
4
3
2
1
0
1.20.80.40.0
1000
800
600
400
200
0
1.20.80.40.0
1600
1200
800
400
0
1.20.80.40.0
12
8
4
0
1.20.80.40.0
0.00
1.20.80.40.0
0.00
1.20.80.40.0
3.0
2.0
1.0
0.0
1.20.80.40.0
200
150
100
50
0
1.20.80.40.0
120
80
40
0
1.20.80.40.0
COMMENTS on EDATAS
• The EDATAS database of toxics (including HCHO and Cr(VI) measurements using mobile van transects provide a unique, albeit limited bases for characterizing air toxics at neighborhood scales.
• Future efforts will focus on utilizing such data for evaluating and assessing advanced air toxics modeling such as hybrid modeling approaches.
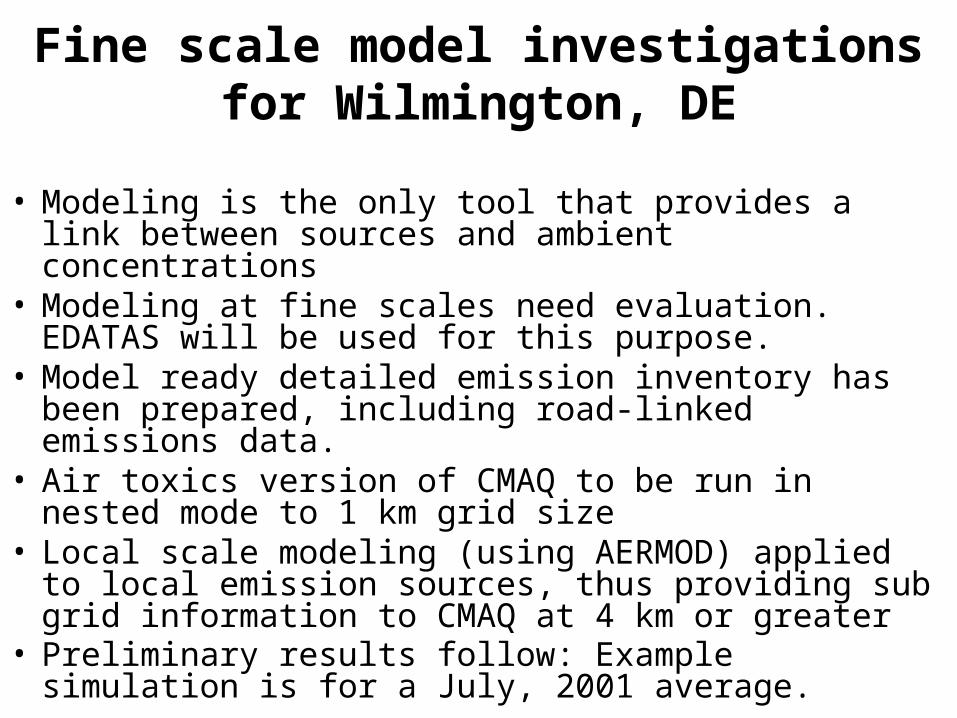
Fine scale model investigations for Wilmington, DE
• Modeling is the only tool that provides a link between sources and ambient concentrations
• Modeling at fine scales need evaluation. EDATAS will be used for this purpose.
• Model ready detailed emission inventory has been prepared, including road-linked emissions data.
• Air toxics version of CMAQ to be run in nested mode to 1 km grid size
• Local scale modeling (using AERMOD) applied to local emission sources, thus providing sub grid information to CMAQ at 4 km or greater
• Preliminary results follow: Example simulation is for a July, 2001 average.
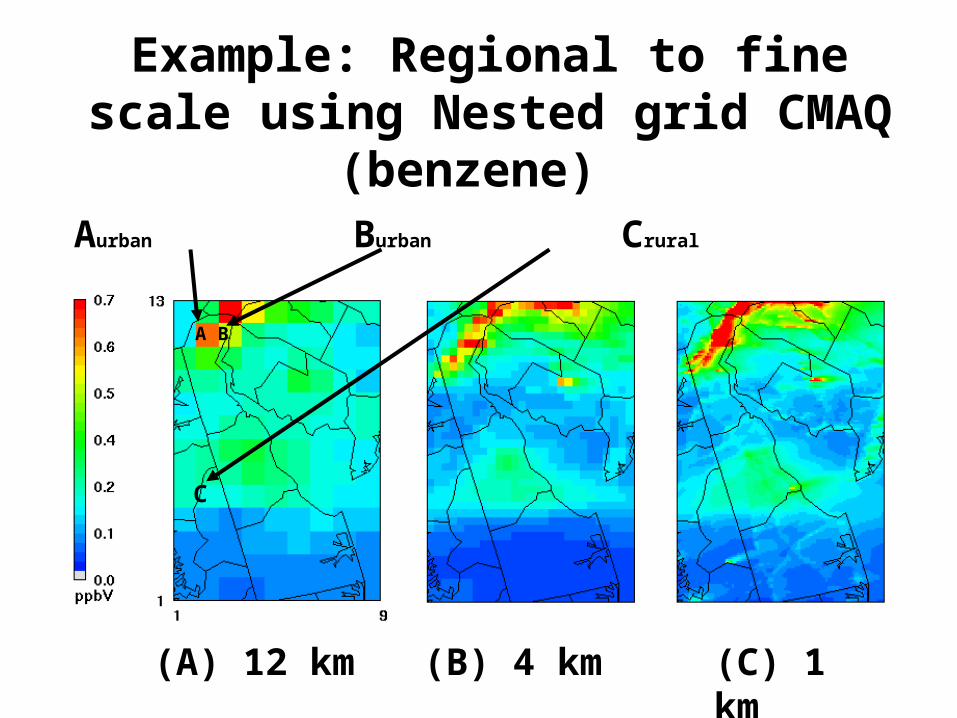
(A) 12 km (B) 4 km (C) 1 km
A B
C
Aurban Burban Crural
Example: Regional to fine scale using Nested grid CMAQ (benzene)
Time Series of SACs at Cell [12,2]1km Aggregated to 12km
Time in Hours
SA
C in
ppb
0 100 200 300 400 500 600 700
02
46
810
Conc95 Percentile
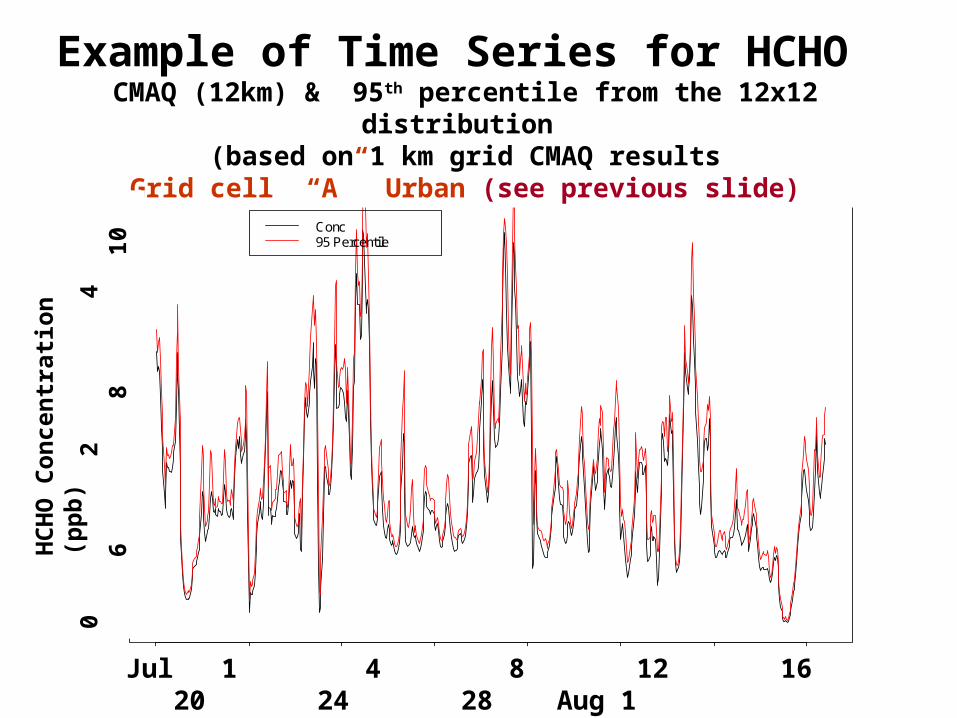
Example of Time Series for HCHO CMAQ (12km) & 95th percentile from the 12x12 distribution
(based on 1 km grid CMAQ resultsGrid cell “A” Urban (see previous slide)
Jul 1 4 8 12 16 20 24 28 Aug 1
0
2
4
6
8
10
HC
HO
Co
nce
ntr
atio
n
(pp
b)
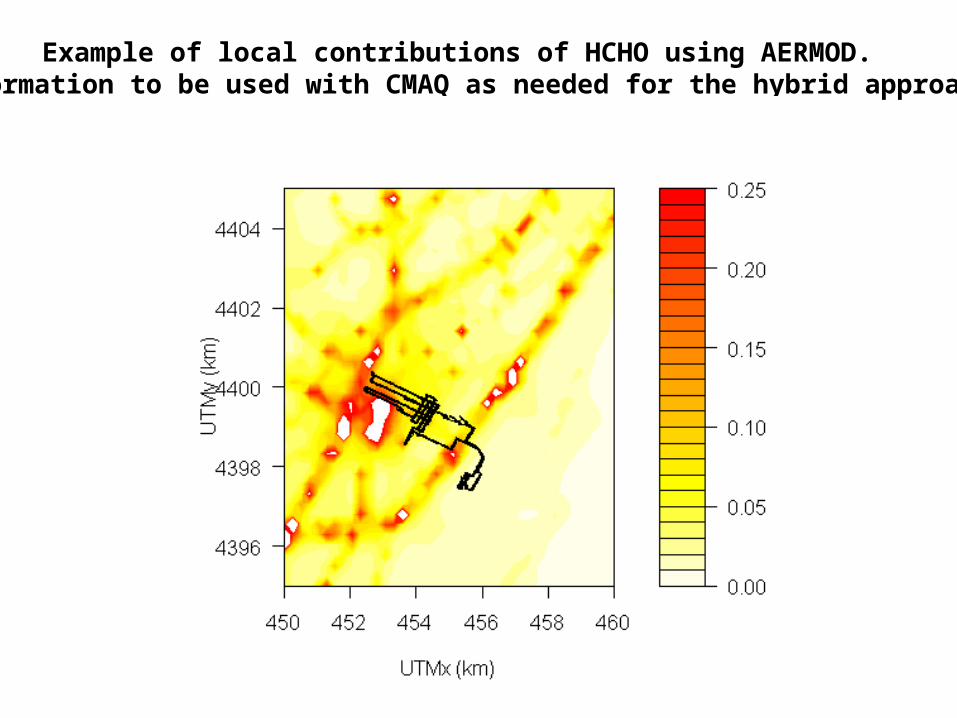
Example of local contributions of HCHO using AERMOD. Information to be used with CMAQ as needed for the hybrid approach
Next steps • Implement the hybrid approach by incorporating local
scale with CMAQ modeling • Evaluate and assess both such outputs with EDATAS
database (of mobile measurements)• Perform additional CMAQ modeling at 1 km grid size to
investigate fine scale resolution of combined regional and local scale contributions to investigate the characteristics of SGV and corresponding distribution functions as a complement to CMAQ at grids sizes of 4 and 12 km.
• Explore and examine the merits of applications that utilize (a) hybrid modeling approach as well as (b) an enhanced CMAQ system that is complemented with SGV distributions. e.g., – Performing exposure analyses, health risk assessments – Performing grid model evaluation– Weight of Evidence –RRF/DV(C&F) analyses for SIPS
The End
Thank you for your attention
Disclaimer: The research presented here was performed under the Memorandum of Understanding between the U.S. Environmental Protection Agency (EPA) and the U.S. Department of Commerce's National Oceanic and Atmospheric Administration (NOAA) and under agreement number DW13921548. This work constitutes a contribution to the NOAA Air Quality Program. Although it has been reviewed by EPA and NOAA and approved for publication, it does not necessarily reflect their policies or views.