Embed Size (px)
DESCRIPTION
wgfjiwo
Citation preview
ardening of steels and castirons represents the mostpopular application of induc-tion heat treatment (Fig. 1).
Induction hardening is a complex combina-tion of electromagnetic, heat transfer, andmetallurgical phenomena [1]. Due to thephysics of electromagnetic induction, heat-ing can be localized to areas where metal-lurgical changes are desired. The three mostcommon forms of induction hardening aresurface hardening, through hardening, andselective hardening. Depending on the spe-cific application, selective hardening issometimes considered a part of surface hard-ening or through hardening.
The first step in designing an induction-hardening machine is to specify the requiredhardness pattern including surface hardness,case depth and transition zone. Temperature
distribution in induction surface hardeningis controlled by selection of frequency, time,power and workpiece/coil geometry [1].
Hardening of steels and cast iron compo-nents may be done for the purpose ofobtaining certain properties including, butnot limited to, strength, fatigue and wearresistance. The traditional description ofthe steel hardening procedure involvesheating the entire component, or a part ofthe component that needs to be hardened,to the austenitizing temperature, holding itif necessary for a period long enough toachieve complete transformation to austen-ite, and then rapidly cooling it below themartensite start (Ms) temperature, wheremartensite transformation begins.
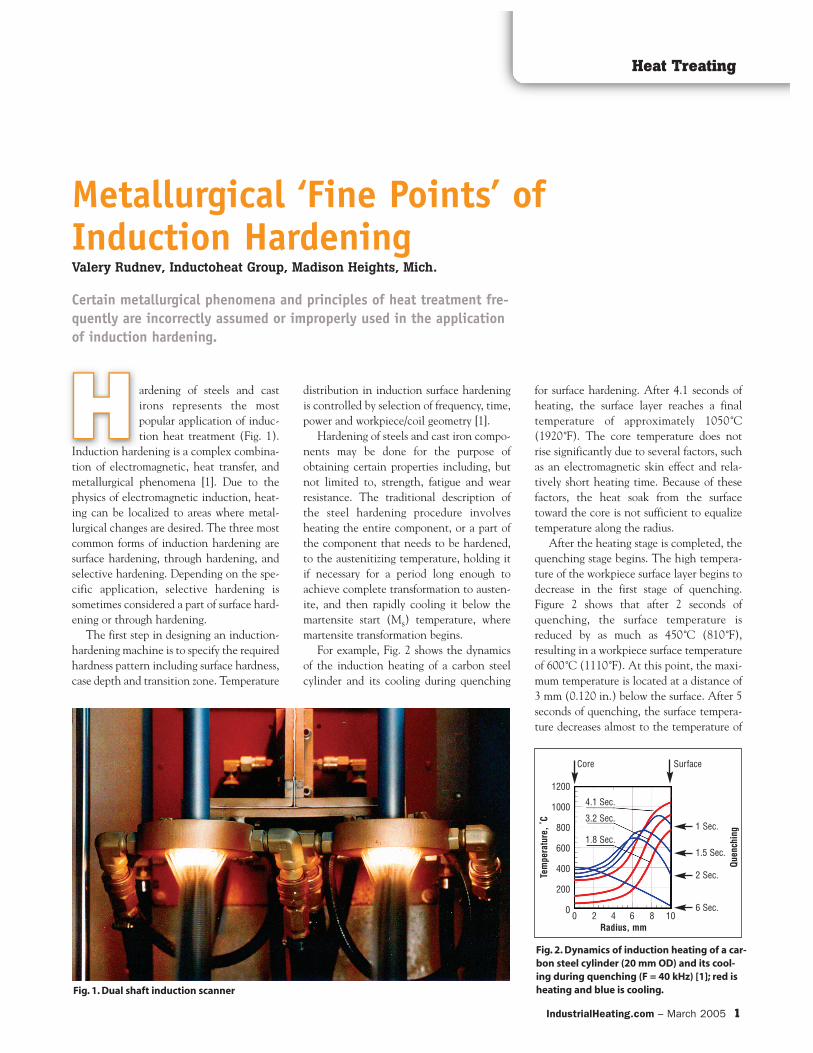
For example, Fig. 2 shows the dynamicsof the induction heating of a carbon steelcylinder and its cooling during quenching
for surface hardening. After 4.1 seconds ofheating, the surface layer reaches a finaltemperature of approximately 1050˚C(1920˚F). The core temperature does notrise significantly due to several factors, suchas an electromagnetic skin effect and rela-tively short heating time. Because of thesefactors, the heat soak from the surfacetoward the core is not sufficient to equalizetemperature along the radius.
After the heating stage is completed, thequenching stage begins. The high tempera-ture of the workpiece surface layer begins todecrease in the first stage of quenching.Figure 2 shows that after 2 seconds ofquenching, the surface temperature isreduced by as much as 450˚C (810˚F),resulting in a workpiece surface temperatureof 600˚C (1110˚F). At this point, the maxi-mum temperature is located at a distance of3 mm (0.120 in.) below the surface. After 5seconds of quenching, the surface tempera-ture decreases almost to the temperature of
Certain metallurgical phenomena and principles of heat treatment fre-quently are incorrectly assumed or improperly used in the applicationof induction hardening.
Metallurgical ‘Fine Points’ of Induction HardeningValery Rudnev, Inductoheat Group, Madison Heights, Mich.
Heat Treating
IndustrialHeating.com – March 2005 1
Fig. 1. Dual shaft induction scanner
Fig. 2. Dynamics of induction heating of a car-bon steel cylinder (20 mm OD) and its cool-ing during quenching (F = 40 kHz) [1]; red isheating and blue is cooling.
1 Sec.
4.1 Sec.
3.2 Sec.
1.8 Sec.1.5 Sec.
2 Sec.
6 Sec.
Core Surface
0 2 4 6 8 10
1200
1000
800
600
400
200
0
Tem
pera
ture
, ˚C
Quen
chin
g
Radius, mm
the quenchant, while the core still remainsquite warm at a temperature above 400˚C(750˚F).
In some cases, heat treaters do not coolthe part completely, and after unloading thepart from the induction coil, it is kept forsome time on the shop floor. During thattime, the heat of the warm core travelstoward the surface, eventually resulting in auniform temperature distribution within thepart. In this case, the remaining heat is usedfor a slight temper back (self-tempering),which imparts some ductility to the part.
At first glance, this operation is verystraightforward. However, in many cases,certain metallurgical phenomena and prin-ciples of heat treatment frequently areincorrectly assumed or improperly used ininduction hardening. It is important to lookcloser at the “fine points” of metallurgicaltheory to ensure optimal results. Followingare some examples that illustrate this.
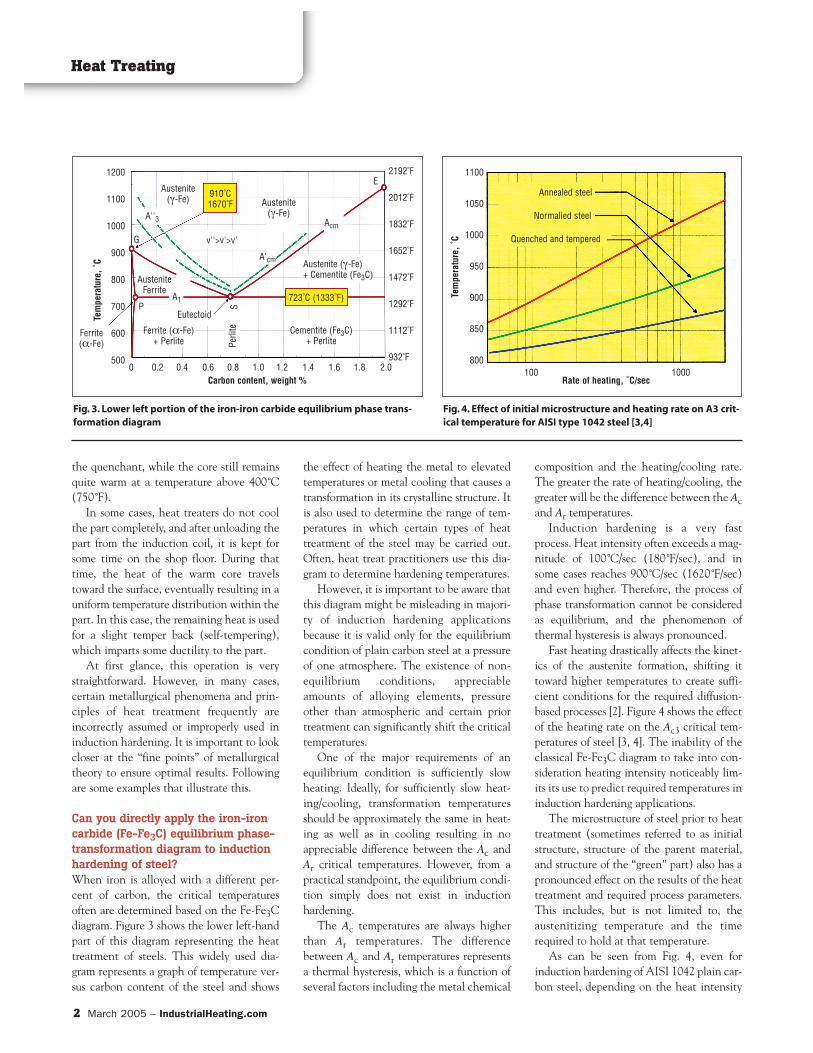
Can you directly apply the iron-ironcarbide (Fe-Fe3C) equilibrium phase-transformation diagram to inductionhardening of steel?When iron is alloyed with a different per-cent of carbon, the critical temperaturesoften are determined based on the Fe-Fe3Cdiagram. Figure 3 shows the lower left-handpart of this diagram representing the heattreatment of steels. This widely used dia-gram represents a graph of temperature ver-sus carbon content of the steel and shows
the effect of heating the metal to elevatedtemperatures or metal cooling that causes atransformation in its crystalline structure. Itis also used to determine the range of tem-peratures in which certain types of heattreatment of the steel may be carried out.Often, heat treat practitioners use this dia-gram to determine hardening temperatures.
However, it is important to be aware thatthis diagram might be misleading in majori-ty of induction hardening applicationsbecause it is valid only for the equilibriumcondition of plain carbon steel at a pressureof one atmosphere. The existence of non-equilibrium conditions, appreciableamounts of alloying elements, pressureother than atmospheric and certain priortreatment can significantly shift the criticaltemperatures.
One of the major requirements of anequilibrium condition is sufficiently slowheating. Ideally, for sufficiently slow heat-ing/cooling, transformation temperaturesshould be approximately the same in heat-ing as well as in cooling resulting in noappreciable difference between the Ac andAr critical temperatures. However, from apractical standpoint, the equilibrium condi-tion simply does not exist in inductionhardening.
The Ac temperatures are always higherthan Ar temperatures. The differencebetween Ac and Ar temperatures representsa thermal hysteresis, which is a function ofseveral factors including the metal chemical
composition and the heating/cooling rate.The greater the rate of heating/cooling, thegreater will be the difference between the Acand Ar temperatures.
Induction hardening is a very fastprocess. Heat intensity often exceeds a mag-nitude of 100˚C/sec (180˚F/sec), and insome cases reaches 900˚C/sec (1620˚F/sec)and even higher. Therefore, the process ofphase transformation cannot be consideredas equilibrium, and the phenomenon ofthermal hysteresis is always pronounced.
Fast heating drastically affects the kinet-ics of the austenite formation, shifting ittoward higher temperatures to create suffi-cient conditions for the required diffusion-based processes [2]. Figure 4 shows the effectof the heating rate on the Ac3 critical tem-peratures of steel [3, 4]. The inability of theclassical Fe-Fe3C diagram to take into con-sideration heating intensity noticeably lim-its its use to predict required temperatures ininduction hardening applications.
The microstructure of steel prior to heattreatment (sometimes referred to as initialstructure, structure of the parent material,and structure of the “green” part) also has apronounced effect on the results of the heattreatment and required process parameters.This includes, but is not limited to, theaustenitizing temperature and the timerequired to hold at that temperature.
As can be seen from Fig. 4, even forinduction hardening of AISI 1042 plain car-bon steel, depending on the heat intensity
Heat Treating
2 March 2005 – IndustrialHeating.com
Fig. 3. Lower left portion of the iron-iron carbide equilibrium phase trans-formation diagram
Fig. 4. Effect of initial microstructure and heating rate on A3 crit-ical temperature for AISI type 1042 steel [3,4]
910˚C1670˚F
Austenite(γ-Fe) Austenite
(γ-Fe)
E
AcmA''3
A1
A'cm Austenite (γ-Fe)+ Cementite (Fe3C)Austenite
Ferrite
Cementite (Fe3C)+ Perlite
Ferrite (α-Fe)+ Perlite
Eutectoid
Perli
teS
723˚C (1333˚F)
Ferrite(α-Fe)
0 0.2 0.4 0.6 0.8 1.0 1.2 1.4 1.6 1.8 2.0 100 1000
Annealed steel
Normalied steel
Quenched and tempered
1200
1100
1000
900
800
700
600
500
1100
1050
1000
950
900
850
800
2192˚F
2012˚F
1832˚F
1652˚F
1472˚F
1292˚F
1112˚F
932˚F
Tem
pera
ture
, ˚C
Carbon content, weight % Rate of heating, ˚C/sec
G
P
v''>v'>v'
Tem
pera
ture
, ˚C
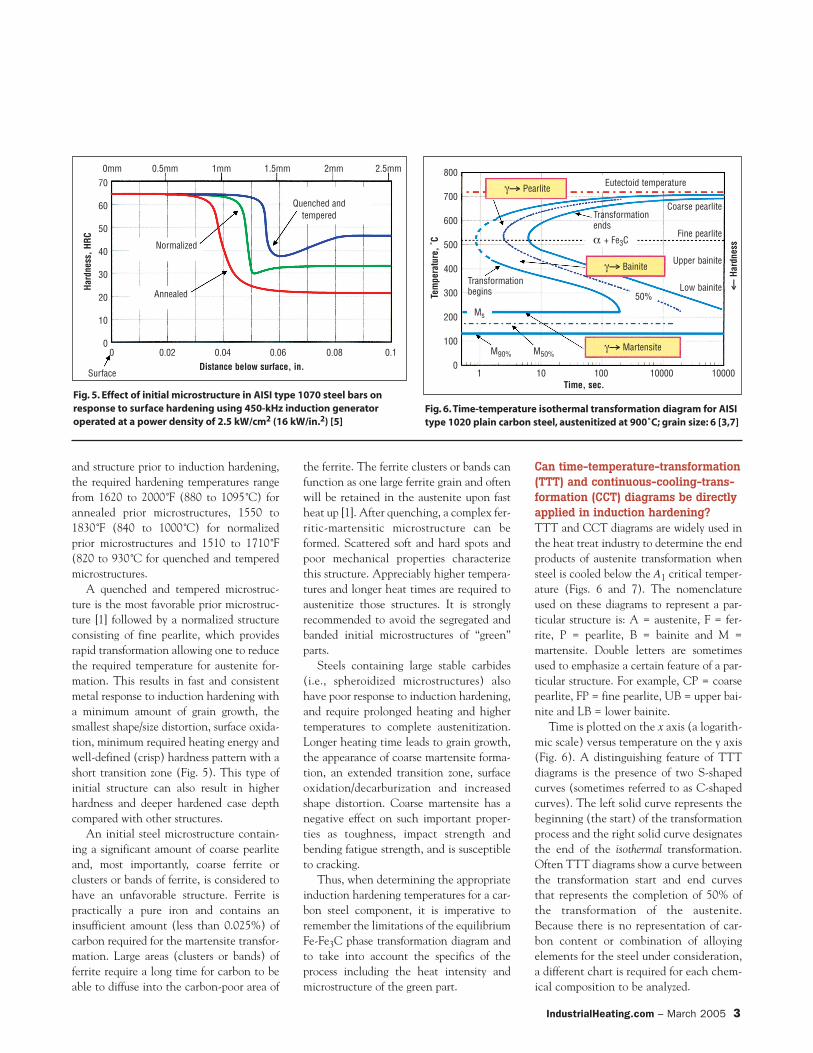
and structure prior to induction hardening,the required hardening temperatures rangefrom 1620 to 2000˚F (880 to 1095˚C) forannealed prior microstructures, 1550 to1830˚F (840 to 1000˚C) for normalizedprior microstructures and 1510 to 1710˚F(820 to 930˚C for quenched and temperedmicrostructures.
A quenched and tempered microstruc-ture is the most favorable prior microstruc-ture [1] followed by a normalized structureconsisting of fine pearlite, which providesrapid transformation allowing one to reducethe required temperature for austenite for-mation. This results in fast and consistentmetal response to induction hardening witha minimum amount of grain growth, thesmallest shape/size distortion, surface oxida-tion, minimum required heating energy andwell-defined (crisp) hardness pattern with ashort transition zone (Fig. 5). This type ofinitial structure can also result in higherhardness and deeper hardened case depthcompared with other structures.
An initial steel microstructure contain-ing a significant amount of coarse pearliteand, most importantly, coarse ferrite orclusters or bands of ferrite, is considered tohave an unfavorable structure. Ferrite ispractically a pure iron and contains aninsufficient amount (less than 0.025%) ofcarbon required for the martensite transfor-mation. Large areas (clusters or bands) offerrite require a long time for carbon to beable to diffuse into the carbon-poor area of
the ferrite. The ferrite clusters or bands canfunction as one large ferrite grain and oftenwill be retained in the austenite upon fastheat up [1]. After quenching, a complex fer-ritic-martensitic microstructure can beformed. Scattered soft and hard spots andpoor mechanical properties characterizethis structure. Appreciably higher tempera-tures and longer heat times are required toaustenitize those structures. It is stronglyrecommended to avoid the segregated andbanded initial microstructures of “green”parts.
Steels containing large stable carbides(i.e., spheroidized microstructures) alsohave poor response to induction hardening,and require prolonged heating and highertemperatures to complete austenitization.Longer heating time leads to grain growth,the appearance of coarse martensite forma-tion, an extended transition zone, surfaceoxidation/decarburization and increasedshape distortion. Coarse martensite has anegative effect on such important proper-ties as toughness, impact strength andbending fatigue strength, and is susceptibleto cracking.
Thus, when determining the appropriateinduction hardening temperatures for a car-bon steel component, it is imperative toremember the limitations of the equilibriumFe-Fe3C phase transformation diagram andto take into account the specifics of theprocess including the heat intensity andmicrostructure of the green part.
Can time-temperature-transformation(TTT) and continuous-cooling-trans-formation (CCT) diagrams be directlyapplied in induction hardening? TTT and CCT diagrams are widely used inthe heat treat industry to determine the endproducts of austenite transformation whensteel is cooled below the A1 critical temper-ature (Figs. 6 and 7). The nomenclatureused on these diagrams to represent a par-ticular structure is: A = austenite, F = fer-rite, P = pearlite, B = bainite and M =martensite. Double letters are sometimesused to emphasize a certain feature of a par-ticular structure. For example, CP = coarsepearlite, FP = fine pearlite, UB = upper bai-nite and LB = lower bainite.
Time is plotted on the x axis (a logarith-mic scale) versus temperature on the y axis(Fig. 6). A distinguishing feature of TTTdiagrams is the presence of two S-shapedcurves (sometimes referred to as C-shapedcurves). The left solid curve represents thebeginning (the start) of the transformationprocess and the right solid curve designatesthe end of the isothermal transformation.Often TTT diagrams show a curve betweenthe transformation start and end curvesthat represents the completion of 50% ofthe transformation of the austenite.Because there is no representation of car-bon content or combination of alloyingelements for the steel under consideration,a different chart is required for each chem-ical composition to be analyzed.
IndustrialHeating.com – March 2005 3
Fig. 5. Effect of initial microstructure in AISI type 1070 steel bars onresponse to surface hardening using 450-kHz induction generatoroperated at a power density of 2.5 kW/cm2 (16 kW/in.2) [5]
Fig. 6. Time-temperature isothermal transformation diagram for AISItype 1020 plain carbon steel, austenitized at 900˚C; grain size: 6 [3,7]
0 0.02 0.04 0.06 0.08 0.1
1 10 100 10000 10000
γ––> Pearlite
γ––> Bainite
Eutectoid temperature
α + Fe3C
Transformationends
Transformationbegins 50%
Coarse pearlite
Fine pearlite
Upper bainite
Low bainite
Ms
M90% M50%γ––> Martensite
0mm 0.5mm 1mm 1.5mm 2mm 2.5mm
Normalized
Annealed
Surface
Quenched and tempered
70
60
50
40
30
20
10
0
800
700
600
500
400
300
200
100
0Distance below surface, in.
Time, sec.
Hard
ness
, HRC
Tem
pera
ture
, ˚C
< ––
Hard
ness
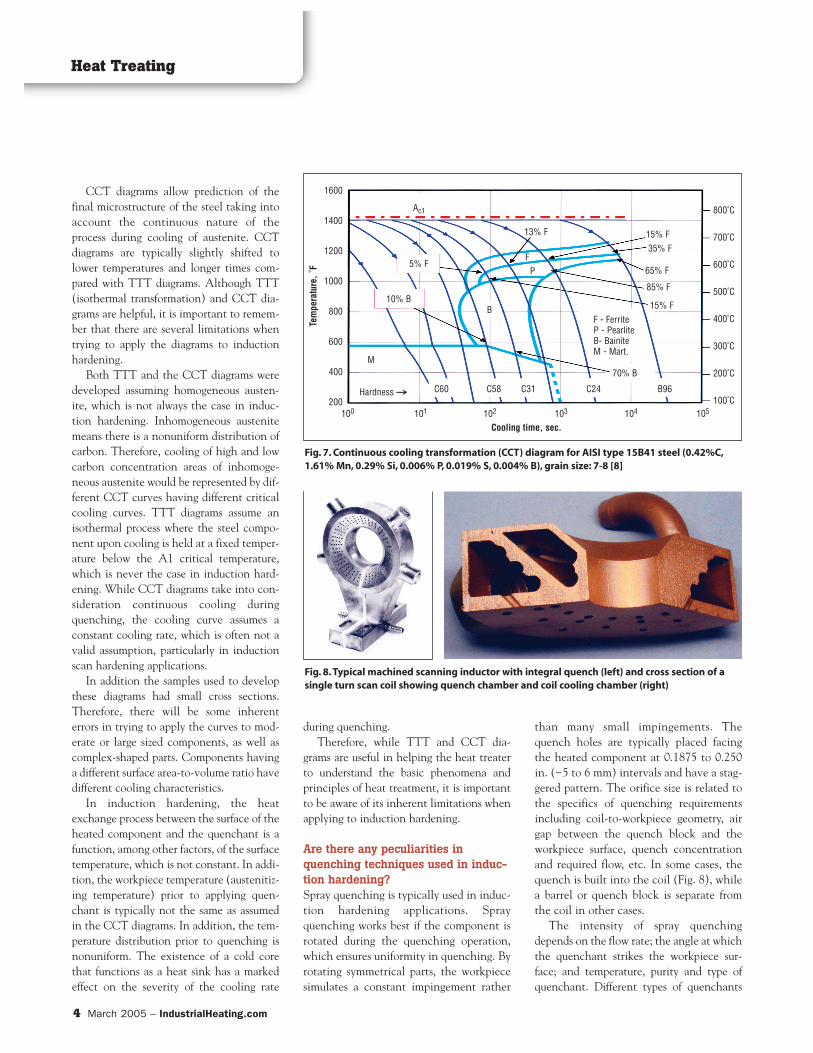
CCT diagrams allow prediction of thefinal microstructure of the steel taking intoaccount the continuous nature of theprocess during cooling of austenite. CCTdiagrams are typically slightly shifted tolower temperatures and longer times com-pared with TTT diagrams. Although TTT(isothermal transformation) and CCT dia-grams are helpful, it is important to remem-ber that there are several limitations whentrying to apply the diagrams to inductionhardening.
Both TTT and the CCT diagrams weredeveloped assuming homogeneous austen-ite, which is not always the case in induc-tion hardening. Inhomogeneous austenitemeans there is a nonuniform distribution ofcarbon. Therefore, cooling of high and lowcarbon concentration areas of inhomoge-neous austenite would be represented by dif-ferent CCT curves having different criticalcooling curves. TTT diagrams assume anisothermal process where the steel compo-nent upon cooling is held at a fixed temper-ature below the A1 critical temperature,which is never the case in induction hard-ening. While CCT diagrams take into con-sideration continuous cooling duringquenching, the cooling curve assumes aconstant cooling rate, which is often not avalid assumption, particularly in inductionscan hardening applications.
In addition the samples used to developthese diagrams had small cross sections.Therefore, there will be some inherenterrors in trying to apply the curves to mod-erate or large sized components, as well ascomplex-shaped parts. Components havinga different surface area-to-volume ratio havedifferent cooling characteristics.
In induction hardening, the heatexchange process between the surface of theheated component and the quenchant is afunction, among other factors, of the surfacetemperature, which is not constant. In addi-tion, the workpiece temperature (austenitiz-ing temperature) prior to applying quen-chant is typically not the same as assumedin the CCT diagrams. In addition, the tem-perature distribution prior to quenching isnonuniform. The existence of a cold corethat functions as a heat sink has a markedeffect on the severity of the cooling rate
during quenching.Therefore, while TTT and CCT dia-
grams are useful in helping the heat treaterto understand the basic phenomena andprinciples of heat treatment, it is importantto be aware of its inherent limitations whenapplying to induction hardening.
Are there any peculiarities inquenching techniques used in induc-tion hardening?Spray quenching is typically used in induc-tion hardening applications. Sprayquenching works best if the component isrotated during the quenching operation,which ensures uniformity in quenching. Byrotating symmetrical parts, the workpiecesimulates a constant impingement rather
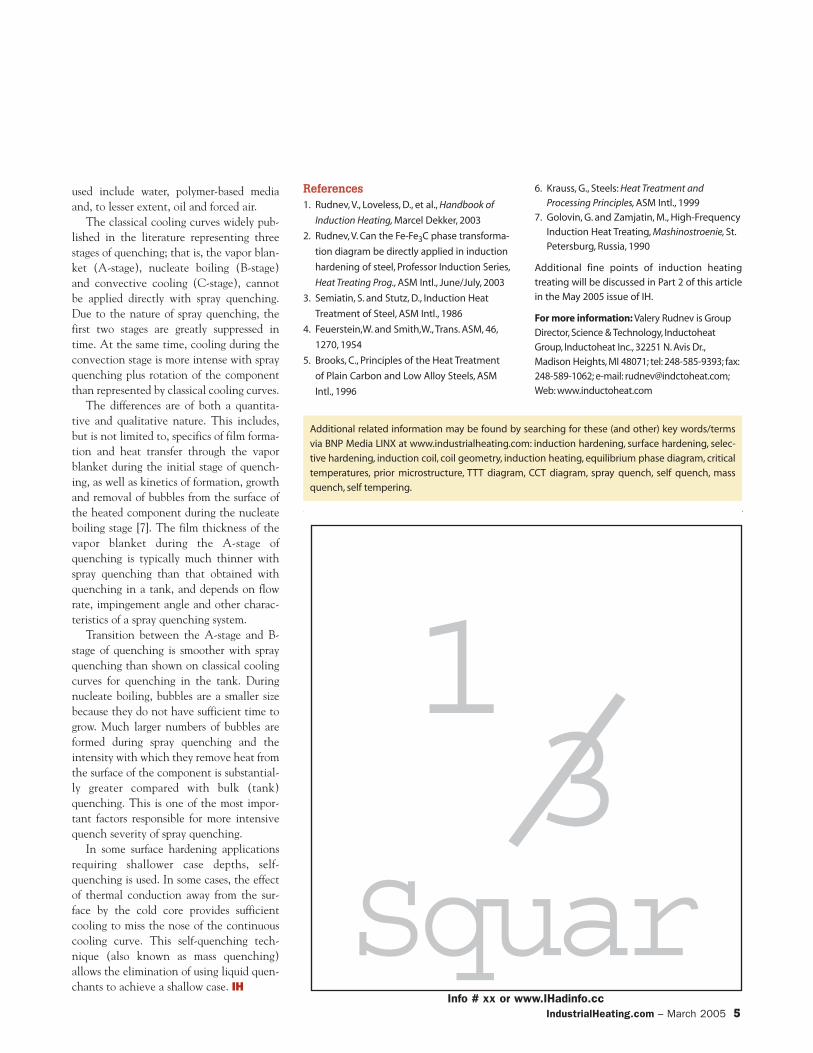
than many small impingements. Thequench holes are typically placed facingthe heated component at 0.1875 to 0.250in. (~5 to 6 mm) intervals and have a stag-gered pattern. The orifice size is related tothe specifics of quenching requirementsincluding coil-to-workpiece geometry, airgap between the quench block and theworkpiece surface, quench concentrationand required flow, etc. In some cases, thequench is built into the coil (Fig. 8), whilea barrel or quench block is separate fromthe coil in other cases.
The intensity of spray quenchingdepends on the flow rate; the angle at whichthe quenchant strikes the workpiece sur-face; and temperature, purity and type ofquenchant. Different types of quenchants
Heat Treating
4 March 2005 – IndustrialHeating.com
Fig. 7. Continuous cooling transformation (CCT) diagram for AISI type 15B41 steel (0.42%C,1.61% Mn, 0.29% Si, 0.006% P, 0.019% S, 0.004% B), grain size: 7-8 [8]
Fig. 8. Typical machined scanning inductor with integral quench (left) and cross section of asingle turn scan coil showing quench chamber and coil cooling chamber (right)
1600
1400
1200
1000
800
600
400
200
800˚C
700˚C
600˚C
500˚C
400˚C
300˚C
200˚C
100˚C
Cooling time, sec.
Tem
pera
ture
, ˚F
100 101 102 103 104 105
Ac1
13% F
FP
B
M
5% F
10% B
15% F35% F
65% F
85% F
15% F
70% B
C60 C58 C31 C24 B96Hardness ––>
F - FerriteP - PearliteB- BainiteM - Mart.
used include water, polymer-based mediaand, to lesser extent, oil and forced air.
The classical cooling curves widely pub-lished in the literature representing threestages of quenching; that is, the vapor blan-ket (A-stage), nucleate boiling (B-stage)and convective cooling (C-stage), cannotbe applied directly with spray quenching.Due to the nature of spray quenching, thefirst two stages are greatly suppressed intime. At the same time, cooling during theconvection stage is more intense with sprayquenching plus rotation of the componentthan represented by classical cooling curves.
The differences are of both a quantita-tive and qualitative nature. This includes,but is not limited to, specifics of film forma-tion and heat transfer through the vaporblanket during the initial stage of quench-ing, as well as kinetics of formation, growthand removal of bubbles from the surface ofthe heated component during the nucleateboiling stage [7]. The film thickness of thevapor blanket during the A-stage ofquenching is typically much thinner withspray quenching than that obtained withquenching in a tank, and depends on flowrate, impingement angle and other charac-teristics of a spray quenching system.
Transition between the A-stage and B-stage of quenching is smoother with sprayquenching than shown on classical coolingcurves for quenching in the tank. Duringnucleate boiling, bubbles are a smaller sizebecause they do not have sufficient time togrow. Much larger numbers of bubbles areformed during spray quenching and theintensity with which they remove heat fromthe surface of the component is substantial-ly greater compared with bulk (tank)quenching. This is one of the most impor-tant factors responsible for more intensivequench severity of spray quenching.
In some surface hardening applicationsrequiring shallower case depths, self-quenching is used. In some cases, the effectof thermal conduction away from the sur-face by the cold core provides sufficientcooling to miss the nose of the continuouscooling curve. This self-quenching tech-nique (also known as mass quenching)allows the elimination of using liquid quen-chants to achieve a shallow case. IH
References1. Rudnev, V., Loveless, D., et al., Handbook of
Induction Heating, Marcel Dekker, 2003
2. Rudnev, V. Can the Fe-Fe3C phase transforma-
tion diagram be directly applied in induction
hardening of steel, Professor Induction Series,
Heat Treating Prog., ASM Intl., June/July, 2003
3. Semiatin, S. and Stutz, D., Induction Heat
Treatment of Steel, ASM Intl., 1986
4. Feuerstein,W. and Smith,W., Trans. ASM, 46,
1270, 1954
5. Brooks, C., Principles of the Heat Treatment
of Plain Carbon and Low Alloy Steels, ASM
Intl., 1996
6. Krauss, G., Steels: Heat Treatment and
Processing Principles, ASM Intl., 1999
7. Golovin, G. and Zamjatin, M., High-Frequency
Induction Heat Treating, Mashinostroenie, St.
Petersburg, Russia, 1990
Additional fine points of induction heating
treating will be discussed in Part 2 of this article
in the May 2005 issue of IH.
For more information: Valery Rudnev is Group
Director, Science & Technology, Inductoheat
Group, Inductoheat Inc., 32251 N. Avis Dr.,
Madison Heights, MI 48071; tel: 248-585-9393; fax:
248-589-1062; e-mail: [email protected];
Web: www.inductoheat.com
IndustrialHeating.com – March 2005 5
1⁄3Squar
Info # xx or www.IHadinfo.cc
Additional related information may be found by searching for these (and other) key words/terms
via BNP Media LINX at www.industrialheating.com: induction hardening, surface hardening, selec-
tive hardening, induction coil, coil geometry, induction heating, equilibrium phase diagram, critical
temperatures, prior microstructure, TTT diagram, CCT diagram, spray quench, self quench, mass
quench, self tempering.