Embed Size (px)
Citation preview
ARTICLE IN PRESS
0278-4343/$ - see
doi:10.1016/j.csr
�CorrespondiE-mail addre
Continental Shelf Research 26 (2006) 2335–2351
www.elsevier.com/locate/csr
Fine-grained sediment spatial distribution on thebasis of a geostatistical analysis: Example of the
eastern Bay of the Seine (France)
Y. Meara,�, E. Poizota, A. Murata, P. Lesueurb, M. Thomasc
aCnam/Intechmer, BP 324 F50103 Cherbourg Cedex, FrancebUMR CNRS 6143 M2C, Universite de Caen, Esplanade de la Paix, F14032 Caen Cedex, France
cSchool of Applied Sciences, University of Glamorgan, Trefforest, Pontypridd, UK CF37
Received 16 December 2004; received in revised form 18 May 2006; accepted 12 June 2006
Available online 26 September 2006
Abstract
The eastern Bay of the Seine (English Channel) was the subject in 1991 of a sampling survey of superficial sediments.
Geostatistic tools were used to examine the complexity of the spatial distribution of the fine-grained fraction (o50mm). A
central depocentre of fine sediments (i.e. content up to 50%) oriented in a NW–SE direction in a muddy coastal strip, in a
very high energy hydrodynamical situation due to storm swells and its megatidal setting, is for the first time recognised and
discussed. Within this sedimentary unit, the distribution of the fine fraction is very heterogeneous, with mud patches of less
than 4000m diameter; the boundary between these mud patches and their substratum is very sharp.
The distribution of this fine fraction appears to be controlled by an anticyclonic eddy located off the Pays de Caux.
Under the influence of this, the suspended material expelled from the Seine estuary moves along the coast and swings off
Antifer harbour, towards the NW. It is trapped within this eddy because of the settling of suspended particulate matter.
Both at a general scale and a local scale the morphology (whether inherited or due to modern processes) has a strong
influence on the spatial distribution of the fine fraction. At the general scale, the basin-like shape of the area facilitates the
silting, and the presence of the submarine dunes, called ‘‘Ridins d’Antifer’’, clearly determines the northern limit of the
muddy zone. At a local scale, the same influence is obvious: paleovalleys trap the fine sediments, whereas isolated sand
dunes and ripples limit the silting. This duality of role of the morphology is therefore one of the reasons why the muddy
surface is extremely heterogeneous spatially. The presence of an important population of suspension feeding echinoderm,
the brittle-star Ophiothrix fragilis Abildgaard, has led to a local increase in the silting, and to the modification of the
physicochemical and sedimentological parameters. A complex relationship is shown to occur between the amount of fine
fraction and the number of brittle-stars (ind.m�2).
Classical statistical methods are not appropriate to study the spatial distribution of the mud fraction, because the spatial
component of the percentage of the distribution is not integrated in the analysis. On the other hand, this is the main
property of the geostatistic concepts.
The use of geostatistic tools within a strict and clearly identified procedure enables the proposal of an accurate
cartography. Further application of the proposed protocol (based on a semivariographic study and a conditional
front matter r 2006 Elsevier Ltd. All rights reserved.
.2006.06.009
ng author. Tel.: +33233887341; fax: +33233887339.
ss: [email protected] (Y. Mear).

ARTICLE IN PRESSY. Mear et al. / Continental Shelf Research 26 (2006) 2335–23512336
simulation interpolation) for surficial sediments mapping will help explain spatial and temporal variations of fine-grained
fraction. Then assessments of sedimentation and erosion stages allow highlighting signature of environmental processes.
r 2006 Elsevier Ltd. All rights reserved.
Keywords: Geostatistics; Semivariogram; Sediment transport; Mud; Fine-grained content; English Channel; Bay of the Seine
1. Introduction
The spatial and temporal expression of thevariations affecting nearshore sea-beds are at theorigin of many methodological difficulties inthe elaboration of cartographic documents. Thesedifficulties are partly solved by the development ofGeographical Information Systems and of theirassociated numerical databases. One of the funda-mental problems, solved by the implementation ofthe Geographical Information Systems, is thecomparison of maps. However, even when mapsappear comparable, their correlation remains verylow. This expresses the existence of various pro-blems related either to the creation of maps or to theinformation acquisition processes at sea.
Geostatistics, whose fundamental basis was de-fined by Matheron (1963, 1965), characterises theregular component of the variation of naturalobjects (Kuzyakova et al., 2001). With recentprogresses in automatic calculations, the use ofgeostatistics for the spatial analysis of environmen-tal data has become extremely common both onland and sea (Chang et al., 1998; Goovaerts, 1999;Atkinson and Lewis, 2000; Batista et al., 2001; Saitoand Goovaerts, 2001; Caeiro et al., 2003; Leecaster,2003).
Geostatistics include tools that establish mapsfrom the analysis of the spatial structure of data(Davis, 1986), and not simply by the application ofsimpler methods (IDW, spline, etc.) whose para-meterisation (number of neighbourhood, distancesof research, etc.) is the choice of the user and underno physical considerations. Therefore it adds a newdimension to the analysis.
In marine sedimentology, the study of the spatialdistribution is achieved by the creation of maps. Tooptimise their interpretation, maps must take intoaccount the spatial structure (regionalised phenom-enon) of the studied parameter (regionalised vari-able) and allow the description of the environmentalparameters that influence this spatial distribution.Temporal study is only possible if the cartographicdocuments compared are established using the samemethod and if it is possible to propose for each
point of the chart an estimation of the error(variance of the estimation) linked to the interpola-tion of the data. The information provided bygeostatistics is a fundamental asset compared to theother interpolation techniques (Aubry, 2000).
Sediments are being studied increasingly formonitoring the aquatic environment, because theycan integrate contaminants and therefore providevaluable information on source, dispersion andaccumulation of pollutants. As the majority ofcontaminants are usually associated with the finefraction of the sediment (Forstner et al., 1982),quantification of the fine fraction is necessary (Birchand Taylor, 2000).
This study gives an example of mapping the fine-grained content (often called mud fraction) in thesuperficial sediments to assess the distribution ofmuddy areas in the NE part of the Bay of the Seine.This study thus generalises the more limitedobservations by Dethleff et al. (1996) and bySpineanu (1998).
Geostatistical methods were used, first, to inter-polate the fine fraction variable and, second, toestimate errors arising from this process. Thevarious stages which mark out the geostatistic stepallow defining a robust protocol for the fine fractionmapping. Further application of the proposedprotocol (based on a semivariographic study and aconditional simulation interpolation) for surficialsediments mapping will help explain spatial andtemporal variations of fine-grained fraction.
The work started within the framework of theFrench coastal studies program (PNEC: Pro-gramme National d’Environnement Cotier) ‘‘Bayof the Seine’’, and will be used as a basis for thestudy of the variability of the deposition at varioustime scales.
2. Study area
2.1. Morphology
The Bay of the Seine, a wide shallow gulf, opensto the English Channel between the Cretaceouschalk cliffs of the Pays de Caux to the East and the
ARTICLE IN PRESSY. Mear et al. / Continental Shelf Research 26 (2006) 2335–2351 2337
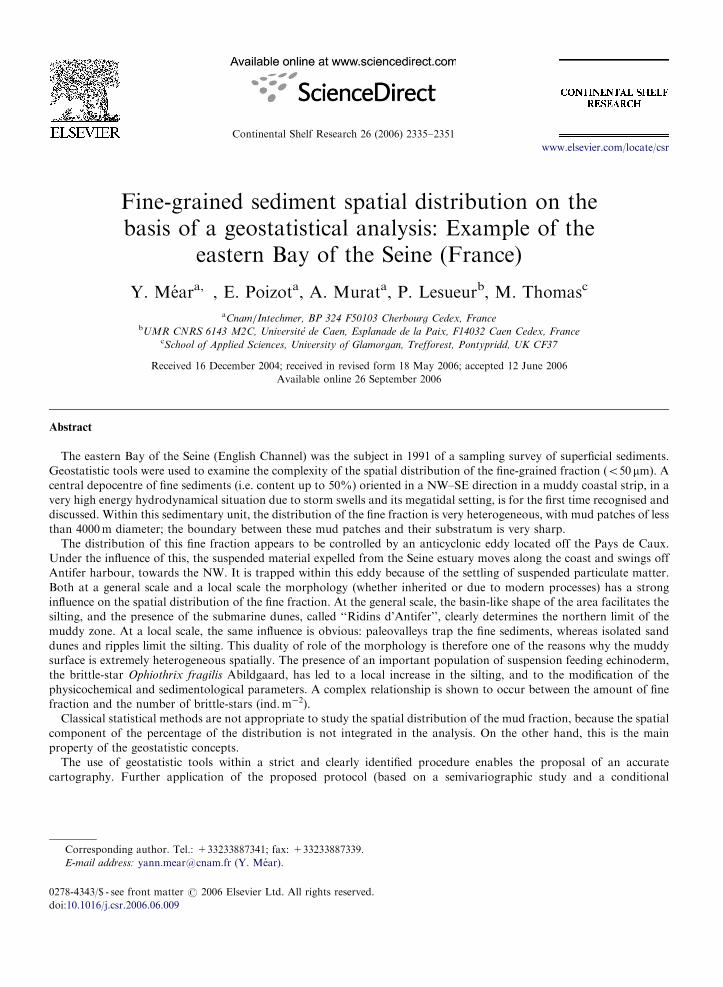
Palaeozoic peninsula of the Cotentin to the West. Ithas a surface area of approximately 5000 km2 and amaximum water depth of 40m (Fig. 1). This studyconcerns the eastern part of the Bay of the Seine,limited to the West by the Meridian passing throughCourseulles-sur-mer. The bathymetric contours areusually parallel to the shoreline but are disturbed bythe existence of a �15m deep depression, markedby the �30m isobath. This depression, namely ‘‘LeParfond’’, orientated NW–SE, is the relic of the pre-Holocene palo-valley of the Seine River (Larson-neur, 1971; Auffret et al., 1980). It is bordered northby the Banc de Seine, which consists of a successionof sand dunes. Other sand waves are observed
0°30′0′′W
0°30′0′′W
49°30′0′′N
50°0′0′′N
Ouistreham
Courseulles/Mer
0 2 5 5012.5km
30 m
20 m
15 m
10 m
FRANCE
UK
Plateau du Calvados
Banc de Sein
Parfond
Fig. 1. The eastern Bay of the Seine: main geographical locations. Plate
Banc de Seine is a sand bank with a depth less than 15m, Le Parfond is a
dunes). Black dots are for sample locations of superficial sediments.
offshore the Cap d’Antifer, namely ‘‘Ridins d’Anti-fer’’. Close to the coast, rocks locally disturbthe monotony of the seafloor (e.g. Plateau duCalvados).
2.2. Superficial sediments
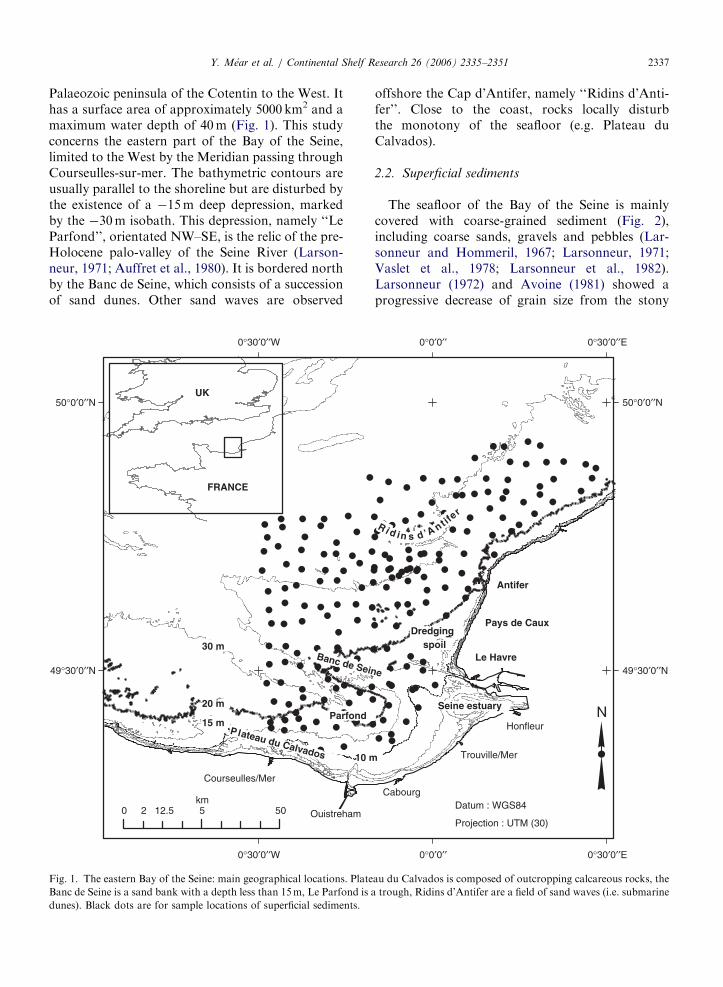
The seafloor of the Bay of the Seine is mainlycovered with coarse-grained sediment (Fig. 2),including coarse sands, gravels and pebbles (Lar-sonneur and Hommeril, 1967; Larsonneur, 1971;Vaslet et al., 1978; Larsonneur et al., 1982).Larsonneur (1972) and Avoine (1981) showed aprogressive decrease of grain size from the stony
0°0′0′′
0°0′0′′
0°30′0′′E
0°30′0′′E
49°30′0′′N
50°0′0′′N
Datum : WGS84
Projection : UTM (30)
Honfleur
Trouville/Mer
Cabourg
Le Havre
Antifer
Pays de Caux
e
Dredgingspoil
Seine estuary
R i d in s d ’ A nt ifer
au du Calvados is composed of outcropping calcareous rocks, the
trough, Ridins d’Antifer are a field of sand waves (i.e. submarine
ARTICLE IN PRESS
Fig. 2. A present-day sedimentological map of the eastern Bay of the Seine (modified from Larsonneur and Hommeril, 1967, Larsonneur
et al., 1982). This map shows evidence of the general tendency of decreasing grain-size from offshore toward the Seine estuary.
Y. Mear et al. / Continental Shelf Research 26 (2006) 2335–23512338
seafloor in the open sea to the subtidal and fineestuarine sediments of the Seine River. As iscommon throughout the English Channel, finesediments are found in sheltered bays and estuarieswhere the fine sediment can settle (Avoine, 1981,1986; Larsonneur et al., 1982). It also occurs in anarrow fringe between 13 and 20m water depthnear the coast of the Pays de Caux, from the mouthof the Seine to the Antifer harbour (Crevel, 1984,1986).
Recent studies (Lesueur and Lesourd, 1999;Lesourd, 2000; Lesourd et al., 2001, 2003a, b)showed that the mud deposits tend to extend intothe mouth of estuaries and that temporary fluidmud deposits often appear during high river flows ofthe Seine (Lesueur et al., 1997, 2003a, b; Garnaudet al., 2002). These permanent or temporary mud
deposits take the shape of diffuse patches. However,previous studies only cover the area of the mouth ofthe Seine or the adjacent seafloor near the Calvadoscoast, in areas shallower than 10m water depth.
The coastal fringe of muddy sediments betweenthe Seine estuary and Antifer Harbour has a finefraction content ranging from 5% to 10% and wasdescribed by Larsonneur and Hommeril (1967).Avoine (1981) mapped the same area but he showeda fine fraction content ranging from 10% to 25%.Crevel (1984, 1986) extended the studied area to theAntifer harbour and showed spatial and temporaryfluctuations in the mud content. This coastal fringeof fine sediments extended from the dredging spoildeposit of Octeville-sur-mer to the Cap d’Antifer,where it seems to be bounded towards the North bythe long breakwater (3.5 km) of the harbour. Fine
ARTICLE IN PRESSY. Mear et al. / Continental Shelf Research 26 (2006) 2335–2351 2339
material is generally found trapped in the coarse-grained substrate in proportions varying from 0.4%to 7% (Dethleff et al., 1996; Spineanu, 1998;Velegrakis et al., 1999).
2.3. Hydro-sedimentary processes
2.3.1. Water circulation
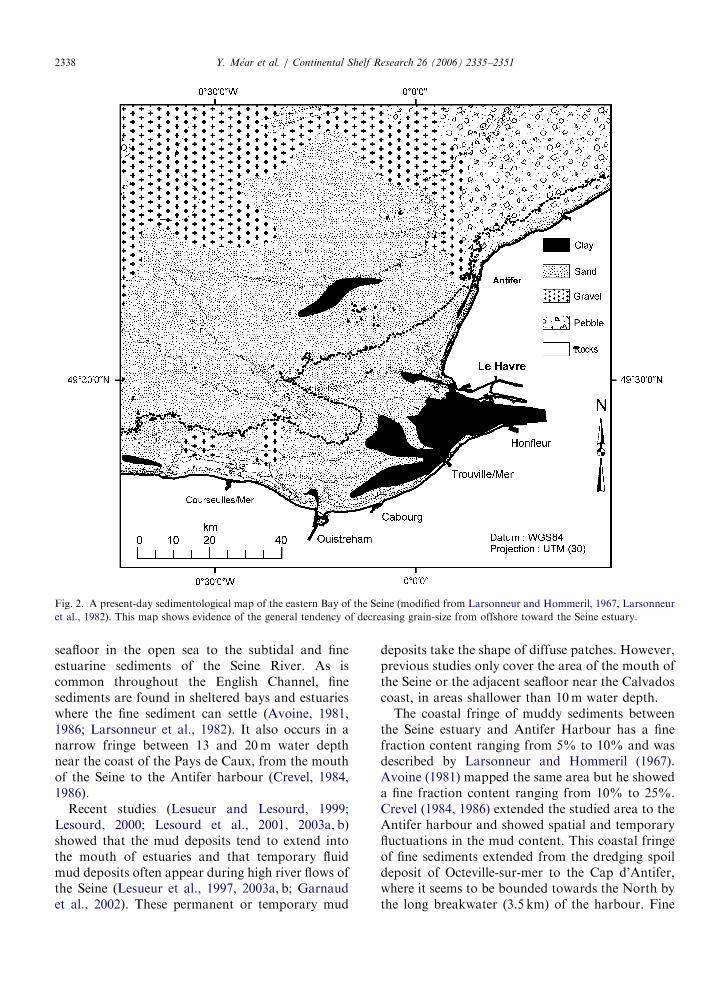
The Bay of the Seine, as is the English Channel, isa typical example of the macrotidal (even megatidal)setting, with spring tidal ranges up to 7.5m.
Tidal currents: The coastal fringe of the Pays deCaux is sheltered from the general ebb flow comingfrom the eastern English Channel. To the south of
Le Havre
Trouville
Dives
Ouistreham(B)
Flood tide
PM -1H
Tide current in the orientalpart of bay of Seine
(From Larsonneur 1971)
VERHAULE CURRENT
Fig. 3. Main tidal currents (Calvados current, Verhaule current and AN
Seine (modified from Larsonneur, 1971). (A) Flood tide: the flood tide st
current skirting along the coast to the Seine estuary. In the meantime, alo
(‘‘ANTIFER CURRENT’’) is parallel to the coast. They deviate toward
level): at the end of the flood tide, the Calvados current cannot go thr
moving along the coast of the Pays de Caux to the N (‘‘Verhaule Curr
water masses moves toward the W and the Seine estuary empties.
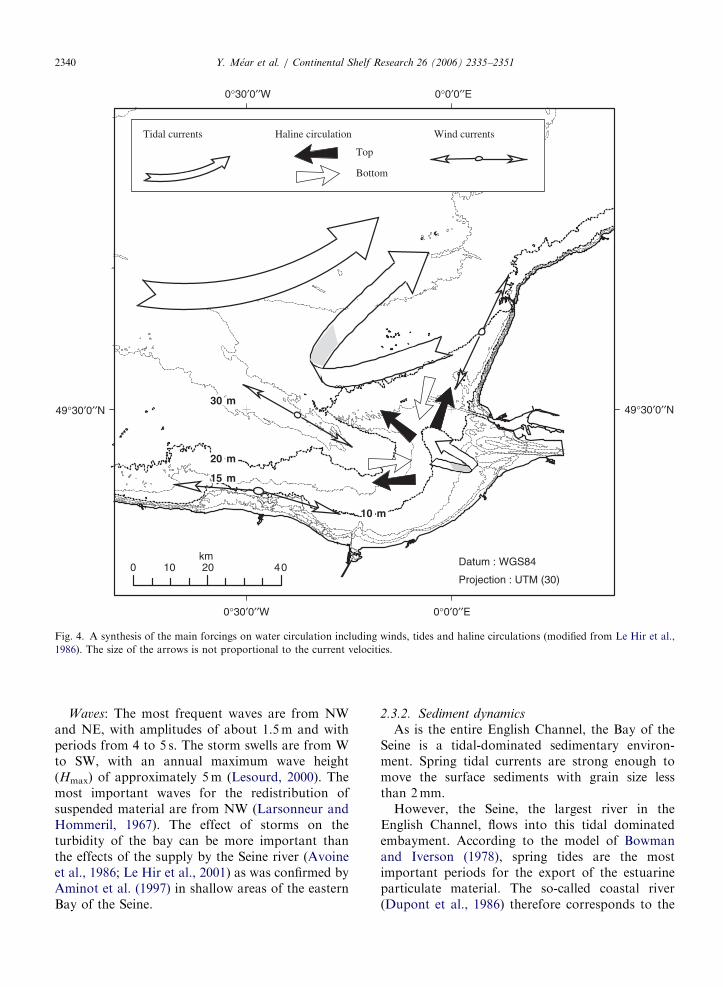
the Cap d’Antifer, this results in water flowingparallel to the coast (Fig. 3). This flow meetsthe estuarine water at the mouth of the Seine, andthe currents are then deflected towards the open sea.Le Hir et al. (1986) claimed that the residualcirculation was the result of stratification relatedto freshwater supplied by the Seine river, combinedwith wind-induced circulation (Fig. 4). Thus under-lining the complexity of the hydrodynamics in theeastern Bay of the Seine, these authors showed: (i) adifferential flow between surface and bottomwaters, (ii) the importance of the wind and (iii) theexistence of an anticyclonic eddy in front of thePays de Caux.
Le Havre
Trouville
Dives
Ouistreham
Le HavreANTIFER CURRENT
Trouville
Dives
Ouistreham
(A)
(C)
Flood tide
Ebb tide
PM -4H
PM +4H
CALVADOS CURRENT
TIFER CURRENT) affecting the eastern part of the Bay of the
arts off the Calvados coast, 5 h before high tide, with the Calvados
ng the coast of the Pays de Caux, a NNE–SSW orientated current
s the E to penetrate the estuary. (B) Flood tide (1 h before high tide
ough the estuary anymore; it is then directed towards the North,
ent’’). (C) Ebb tide (4 h after high tide level): during the ebb-tide,
ARTICLE IN PRESS
0°30′0′′W
0°30′0′′W
0°0′0′′E
0°0′0′′E
49°30′0′′N 49°30′0′′N
Datum : WGS84
Projection : UTM (30)0 20 4010
km
30 m30 m
20 m20 m
15 m15 m
10 m10 m
Top
Haline circulation
Bottom
Tidal currents Wind currents
Fig. 4. A synthesis of the main forcings on water circulation including winds, tides and haline circulations (modified from Le Hir et al.,
1986). The size of the arrows is not proportional to the current velocities.
Y. Mear et al. / Continental Shelf Research 26 (2006) 2335–23512340
Waves: The most frequent waves are from NWand NE, with amplitudes of about 1.5m and withperiods from 4 to 5 s. The storm swells are from Wto SW, with an annual maximum wave height(Hmax) of approximately 5m (Lesourd, 2000). Themost important waves for the redistribution ofsuspended material are from NW (Larsonneur andHommeril, 1967). The effect of storms on theturbidity of the bay can be more important thanthe effects of the supply by the Seine river (Avoineet al., 1986; Le Hir et al., 2001) as was confirmed byAminot et al. (1997) in shallow areas of the easternBay of the Seine.
2.3.2. Sediment dynamics
As is the entire English Channel, the Bay of theSeine is a tidal-dominated sedimentary environ-ment. Spring tidal currents are strong enough tomove the surface sediments with grain size lessthan 2mm.
However, the Seine, the largest river in theEnglish Channel, flows into this tidal dominatedembayment. According to the model of Bowmanand Iverson (1978), spring tides are the mostimportant periods for the export of the estuarineparticulate material. The so-called coastal river(Dupont et al., 1986) therefore corresponds to the

ARTICLE IN PRESSY. Mear et al. / Continental Shelf Research 26 (2006) 2335–2351 2341
part of the Seine estuarine water, expelled in theshape of surface plumes towards the North (Dupontet al., 1991; Brunet et al., 1996; Brylinski et al., 1996).Alternating tidal currents, parallel to the coast,govern the coastal waters and the sediment isexported out of the Bay of the Seine towards theNorth Sea through the Pas-de-Calais (Brylinski et al.,1991). Dupont et al. (1991) highlighted the temporalpersistence of this frontal structure that moves alongthe coast of the Pays de Caux to the NE. Also, atransfer of fine sediments expelled by the Seine Riveris carried towards the south-eastern part of the Bayof the Seine (Avoine, 1984; Lafite, 1990).
Sand: Generally, in the Bay of the Seine, wavesare the most important factor for the bed-loadtransport of sand in water depths lower than ca. 7m(Larsonneur, 1971). Bed-load transport is domi-nantly directed from offshore to onshore, towardthe Seine estuary, both on the Calvados coast andalong the coast of the Pays de Caux (Avoine, 1986).This transport was confirmed both by underwateracoustic imagery (Auffret and D’Ozouville, 1986)and by radioactive tracers (Avoine et al., 1986).
Fine fraction: Due to a lack of measurements atthe water–sediment interface, little is known aboutthe processes of transport, deposition and resuspen-sion of fine-grained sediments in the eastern Bay ofthe Seine. It is, however, assumed that the move-ment of suspended sediment is controlled bycombined action of tidal and wave-induced currentsand that optimum condition for transport probablyoccurs during stormy periods (Avoine, 1986). Themaximum water depth for storm action is stillunknown, but varies throughout the bay, betweenroughly 7 and 20m.
3. Methods
3.1. Field work
Two hundred samples of surface sediments weretaken (Fig. 1) in July 1991 during neap tides(Fluxmanche II cruise). During the previous months(April–June), the flow of the Seine River wascharacteristic of a period of low water level(200–300m3 s�1).
The samples were collected using a Shipek grab,which is a widely used sampler (Sly, 1981). Thisgrab produces a sufficient amount of sediment foranalyses in the laboratory. To avoid flushing thefine fraction by a shockwave as the grab reachedthe bottom, a great deal of care was paid to control
the grab’s speed and decelerate before impact. Thegrab samples that had only small quantities ofsediment or had lost sediment in transit wererejected. Care was taken to avoid water sloshingacross the water–sediment interface as the sampleswere lifted to the deck. In case of homogeneoussediment, the total sample was used. If the sampleshowed a layering, the sediment of the grab was sub-sampled according to the structure. In the latter case,only the superficial homogeneous deposit was used.
The positioning of each sampling point wascarried out with a SYLEDIS SR3 radiopositioningsystem that has an accuracy of less than 10m.Positioning modifications accounted for the dis-tances between antenna and winch.
3.2. Laboratory analyses
To reduce as much as possible the addition ofanalytical errors or distortion, a strict procedurewas defined and followed in laboratory analyses.The samples were filtered under water, on a 50 mmmesh in order to obtain the percentage of finefraction (o50 mm). To prevent the distortion of theresults, the various processes of the analysis(temperature of drying, quartering, suspension andduration of agitation) were strictly similar for allsamples. The volume of water evaporated duringthe drying phase was measured to account thedistortion of the results related to dissolved salts.
3.3. Data treatment
Until the late 1980s, geostatistics were primarilyused to describe the spatial organisation of environ-mental parameters (semivariogram) and to predictthe value (interpolation) of these parameters in non-sampled points (kriging or simulation). The com-plexity and the diversity of these tools can be, asAubry (2000) stated, the origin of many problems intheir use, weakening the credibility of the study. Topreserve all the power of the methods of carto-graphic estimation and description of environmen-tal parameter characteristics, it appears necessary toestablish and to follow a strict procedure for theimplementation of geostatistics tools (Ouyang et al.,2002). Such a procedure was applied to the study ofthe distribution of the muddy areas in the easternBay of the Seine. In this study, the fine fraction ofthe sediment represents the regionalised variable.The regionalised phenomenon gathers all theenvironmental parameters influencing the spatial

ARTICLE IN PRESSY. Mear et al. / Continental Shelf Research 26 (2006) 2335–23512342
distribution of the fine fraction of sediment. Theprocedure for this study includes several stages asfollows.
3.3.1. Gaussian transformation
No assumption can be made about the geostatis-tical interpolator method to be used to create themap. Gaussian methods assume the frequencydistribution data to be close to a theoreticalGaussian distribution (Webster and Oliver, 1990;Ouyang et al., 2002; Schnabel et al., 2004). In thecase of the fine fraction of sediment, many reasons(non-adapted sampling scale to spatial sedimentaryprocess scale, sampling of non-representative sam-ples, laboratory analytical errors, etc.) can be thecause of the non-normality of the data set. So, it isfirst necessary to do an appropriate transformationto obtain a normally distributed data set.
3.3.2. Trend analysis
While acquiring environmental data, analyticalskews can be introduced. The temporally variablecharacteristic of some environmental parameters(e.g. physicochemical, alternation of deposit andsediment erosion phases, etc.) can also introduceskew into measurements (Gringarten and Deutsch,2001). It is particularly true when environmentalmechanisms operate on smaller time scales than theduration of sampling. When skews have an orga-nised structure (spatial and/or temporal), they canlead to a trend in the measurements, which makesthe regionalised variable non-stationary; it is there-fore appropriate to remove the trend. In the case ofthe fine fraction of sediment, there can be manyreasons for the origin of a trend. Among these, someare natural (sampling time longer than naturalenvironmental sedimentological variations, i.e. de-position or erosion), man-made (inadequate techni-cal knowledge) or artefacts tied up with field andlaboratory procedures (grab or box corer; sieving orlaser diffractometer methods).
3.3.3. Anisotropic analysis
The spatial distribution of the fine fraction in asediment is governed by complex mechanisms suchas settling of suspended particles, accumulation bybenthic organisms, erosion by hydrodynamic pro-cesses, and human influences (i.e. sediment dump-ing, dredging, fisheries, etc). Complexity andinteractions of these mechanisms can induce spatialvariability of the sediment fine fraction in severalways. The description of this spatial difference in
the data is made by the study of the anisotropy(Cheng et al., 2000; Wang et al., 2002; Caeiro et al.,2003). Anisotropy means that the variance of thefine-grained fraction varies not only with distancebut also with direction. To conduct an anisotropystudy, there must be enough information present. Itrequires a significant number of data points, i.e.higher than 100 (Webster and Oliver, 1992a, b;Gascuel-Odoux and Boivin, 1994) or even 150(Webster and Oliver, 1993). The anisotropy, re-vealed by one-way semivariograms and which wascalculated from a too small number of samples, canbe regarded as none available (Goovaerts, 1997a).
3.3.4. Variographic study
The semivariogram (Matheron, 1965) is a basictool for the estimation and mapping of regionalisedvariables. It reveals the random and structuredaspects of spatial dispersion. The experimentalsemivariogram is defined as
gðhÞ ¼1
2Ef½Zðxþ hÞ � ZðxÞ�2g
and is normally estimated by the method ofmoments (Journel and Huijbregts, 1978):
gðhÞ ¼1
2NðhÞ
XNh
l¼1
½Zðxþ hÞ � ZðxÞ�2,
where N(h) is equal to the number of pairs of valuesin which the separation distance is equal to h, Z(x)and Z(x+h) are the values of the experimental dataseparated by the distance h. Practical details of thiscalculation may be found in Isaaks and Srivastava(1989).
The variographic study has been used to attributeto each characteristic (distance, direction, cyclicity,size, etc.) of the experimental semivariogram, someinformation relating to environmental structures(Gringarten and Deutsch, 2001). It represents themodeler’s quantitative understanding of the spatialvariability of the property of interest given the data.Variographic study has been conducted in twosteps, i.e., the establishment of the experimentalsemivariogram and the choice of a theoretical modelof adjustment.
3.3.5. Choices of the method of interpolation
Stochastic simulation does not take into accountany predetermined statistical law. It is preferred tokriging when the spatial variations of the field ofmeasurement must be conserved (Desbarats, 1996;
ARTICLE IN PRESSY. Mear et al. / Continental Shelf Research 26 (2006) 2335–2351 2343
Goovaerts, 1997b, 1999; Vanderborght et al., 1997;Bellehumeur et al., 2000). It is a geostatistical toolthat does not try to minimise the error variance(such as the simple or ordinary kriging), but focuseson the reproduction of statistics such as histogramsand semivariograms, with respect to the values ofthe original data (Asselman, 1999). This procedureinvolves the two following steps: (i) generation of anumber of n simulations covering the study area,(ii) averaging of the n simulations to produce thefinal map.
Each simulation produces a map, the number n isdefined according several aspects: to be able to fitthe results within a Gaussian distribution, to takeinto account the maximum of the total variance andminimise the computational time.
Normality analysis and statistical tests werecarried out using the scientific computational soft-ware R (http://www.r-project.org). In particular, R
was used for the computation of classical statistics(mean, variance, etc.), the study of the fine fractionpercentage data set for normality with the Shapirotest and Kolmogorov–Smirnov test. The variousgeostatistical treatments were carried out usingsoftware GSTAT (Pebesma, 2000). It has inparticular been used for the semivariogram studyand the definition of the theoretical model used forthe interpolation. The results, saved as raster data,were treated and analysed using Arc/Infos. Thislast application permits quick and efficient manage-ment and display of all the different grids obtainedafter the interpolation process. In particular,summations, computation of the mean on a set of
Fine fraction percent
Den
sity
0 10 20 30 40 50
0.00
0.05
0.10
0.15
0.20
(A) (
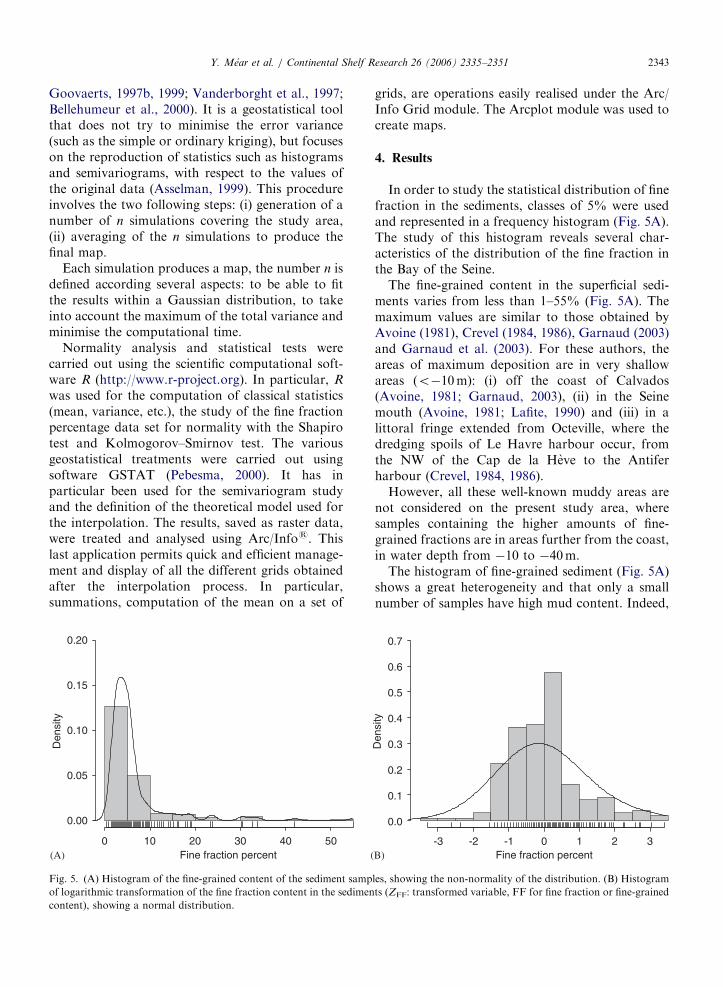
Fig. 5. (A) Histogram of the fine-grained content of the sediment samp
of logarithmic transformation of the fine fraction content in the sedimen
content), showing a normal distribution.
grids, are operations easily realised under the Arc/Info Grid module. The Arcplot module was used tocreate maps.
4. Results
In order to study the statistical distribution of finefraction in the sediments, classes of 5% were usedand represented in a frequency histogram (Fig. 5A).The study of this histogram reveals several char-acteristics of the distribution of the fine fraction inthe Bay of the Seine.
The fine-grained content in the superficial sedi-ments varies from less than 1–55% (Fig. 5A). Themaximum values are similar to those obtained byAvoine (1981), Crevel (1984, 1986), Garnaud (2003)and Garnaud et al. (2003). For these authors, theareas of maximum deposition are in very shallowareas (o�10m): (i) off the coast of Calvados(Avoine, 1981; Garnaud, 2003), (ii) in the Seinemouth (Avoine, 1981; Lafite, 1990) and (iii) in alittoral fringe extended from Octeville, where thedredging spoils of Le Havre harbour occur, fromthe NW of the Cap de la Heve to the Antiferharbour (Crevel, 1984, 1986).
However, all these well-known muddy areas arenot considered on the present study area, wheresamples containing the higher amounts of fine-grained fractions are in areas further from the coast,in water depth from �10 to �40m.
The histogram of fine-grained sediment (Fig. 5A)shows a great heterogeneity and that only a smallnumber of samples have high mud content. Indeed,
Fine fraction percent
Den
sity
-3 -2 -1 0 1 2 3
0.0
0.1
0.2
0.3
0.4
0.5
0.6
0.7
B)
les, showing the non-normality of the distribution. (B) Histogram
ts (ZFF: transformed variable, FF for fine fraction or fine-grained
ARTICLE IN PRESSY. Mear et al. / Continental Shelf Research 26 (2006) 2335–23512344
only 46 samples among 200 show mud contenthigher than the mean value of the studied zone(�6%) and only 24 samples have a content of mudhigher than 10%.
This heterogeneity also indicates the lack ofvarious percentage classes (20–22%; 24–30%;34–42% and 44–54%). The juxtaposition ofthese classes underlines the existence of intenselysilted sedimentary areas, marked by a very sharpboundary.
The first observations based on the analysis of thefrequency of the fine fraction are confirmed bystatistical parameters. The asymmetry (Skw ¼ 3.64)of the frequency distribution of the fine fractiondata and the result obtained (W ¼ 0:578) from theShapiro–Wilkcoxon test (95%) imply that datatransformation is needed to approach a normaldistribution. Because of the abnormal distributionand positively skewed histogram of the fine-grainedfraction, data were undergone logarithmic transfor-mation to satisfy the assumption of normality. Thereciprocity of the transformation (i.e. reversetransformation) was then checked.
A test of normality (W ¼ 0:952), conducted onthe transformed data, indicates a clear tendency tonormality. The shape of the histogram representingthe frequency distribution of the standardised data(Fig. 5B) confirms this tendency. The transformedvariable, noted ZFF (fine fraction or fine-grainedcontent) is used for the geostatistic analysis. Thesemivariogram of the transformed data (Fig. 6) doesnot show a continuous increase over the study area.There is therefore no discernable trend in the data,which permits the use of geostatistic tools without
Directional variogram with fitted model
Distance in decimal degree
sem
ivar
ianc
e
0.1 0.2 0.3
0.6
0.8
1.0
1.2
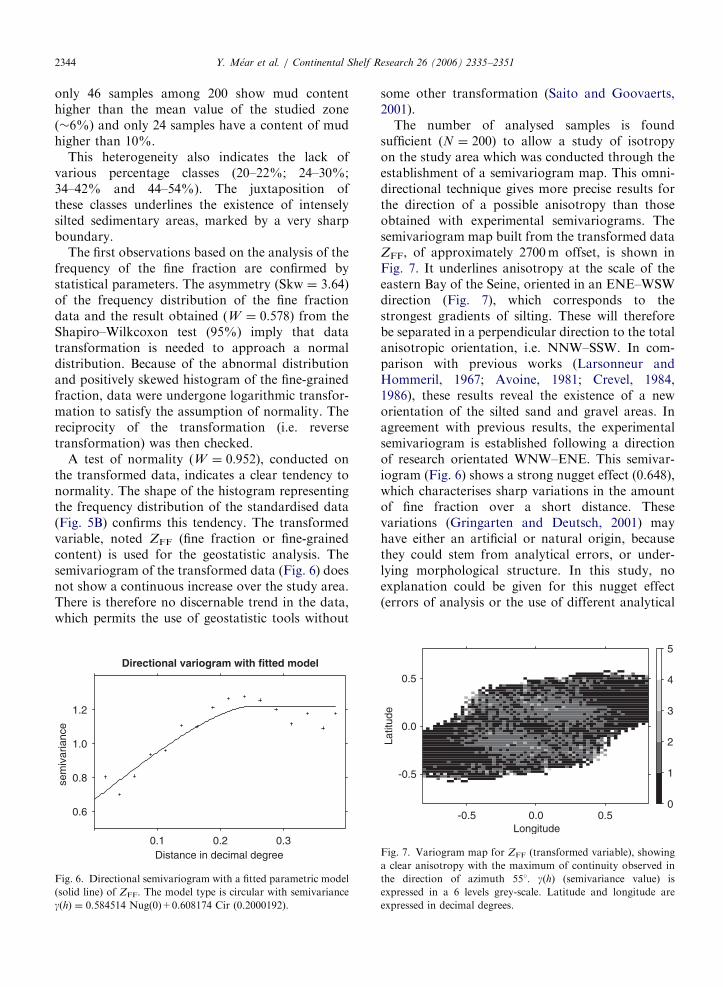
Fig. 6. Directional semivariogram with a fitted parametric model
(solid line) of ZFF. The model type is circular with semivariance
g(h) ¼ 0.584514 Nug(0)+0.608174 Cir (0.2000192).
some other transformation (Saito and Goovaerts,2001).
The number of analysed samples is foundsufficient (N ¼ 200) to allow a study of isotropyon the study area which was conducted through theestablishment of a semivariogram map. This omni-directional technique gives more precise results forthe direction of a possible anisotropy than thoseobtained with experimental semivariograms. Thesemivariogram map built from the transformed dataZFF, of approximately 2700m offset, is shown inFig. 7. It underlines anisotropy at the scale of theeastern Bay of the Seine, oriented in an ENE–WSWdirection (Fig. 7), which corresponds to thestrongest gradients of silting. These will thereforebe separated in a perpendicular direction to the totalanisotropic orientation, i.e. NNW–SSW. In com-parison with previous works (Larsonneur andHommeril, 1967; Avoine, 1981; Crevel, 1984,1986), these results reveal the existence of a neworientation of the silted sand and gravel areas. Inagreement with previous results, the experimentalsemivariogram is established following a directionof research orientated WNW–ENE. This semivar-iogram (Fig. 6) shows a strong nugget effect (0.648),which characterises sharp variations in the amountof fine fraction over a short distance. Thesevariations (Gringarten and Deutsch, 2001) mayhave either an artificial or natural origin, becausethey could stem from analytical errors, or under-lying morphological structure. In this study, noexplanation could be given for this nugget effect(errors of analysis or the use of different analytical
Longitude
Latit
ude
-0.5 0.0 0.5
-0.5
0.0
0.5
0
1
2
3
4
5
Fig. 7. Variogram map for ZFF (transformed variable), showing
a clear anisotropy with the maximum of continuity observed in
the direction of azimuth 551. g(h) (semivariance value) is
expressed in a 6 levels grey-scale. Latitude and longitude are
expressed in decimal degrees.
ARTICLE IN PRESSY. Mear et al. / Continental Shelf Research 26 (2006) 2335–2351 2345
methods). The nugget effect of the semivariogram,however, highlights the sharp transition between themuddy units and their sand/gravel substratum. Italso underlines the existence of morphologicalphenomena with dimensions lower than the averagesampling distance (4000m).
The semivariogram (Fig. 6) also shows a cyclicity(i.e. hole effect) characterised by the presence ofundulations after the distance where the curvereaches a sill; this attenuates gradually (i.e. dam-pened cyclicity). According to Pyrcz and Deutsch(2003), such a cyclicity shows the existence ofgroups of small muddy sedimentary structureswhich are variable in size; its progressive attenua-tion generally demonstrates: (i) an importantvariability in the distance between these regroupingsand/or (ii) the fact that different sedimentary unitsare superposed.
The choice of the interpolation method isgoverned by the information emphasised withinthe data set. In the case of the Bay of the Seine, oneof the most important results, found through thesemivariogram analysis, is the presence of smallmuddy structures separated by variable distances.As a consequence, the interpolation operator mustbe allowed to visualise these sedimentary units bytheir principal characteristics (i.e. fine-grained con-tent, dimension, geographic localisation).
Classical geostatistics interpolators, such as forexample ordinary kriging, simple kriging anduniversal kriging (Matheron, 1963, 1965), are not
0 10 20 3-50
-40
-30
-20
-10
0
Sediment fin
Wat
er d
epth
(m
eter
s)
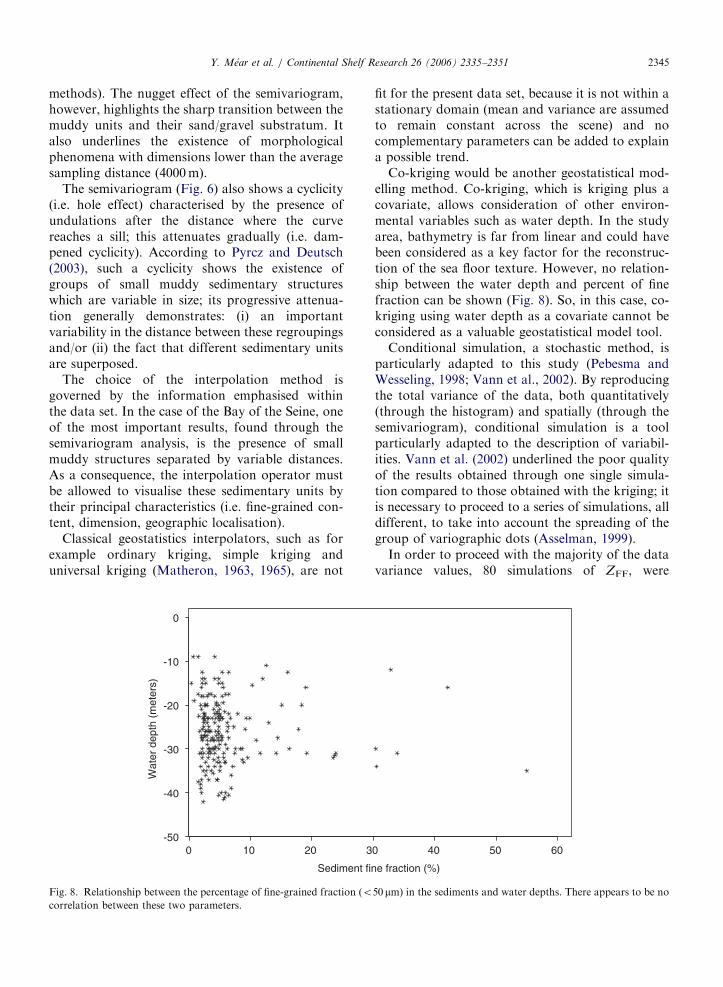
Fig. 8. Relationship between the percentage of fine-grained fraction (ocorrelation between these two parameters.
fit for the present data set, because it is not within astationary domain (mean and variance are assumedto remain constant across the scene) and nocomplementary parameters can be added to explaina possible trend.
Co-kriging would be another geostatistical mod-elling method. Co-kriging, which is kriging plus acovariate, allows consideration of other environ-mental variables such as water depth. In the studyarea, bathymetry is far from linear and could havebeen considered as a key factor for the reconstruc-tion of the sea floor texture. However, no relation-ship between the water depth and percent of finefraction can be shown (Fig. 8). So, in this case, co-kriging using water depth as a covariate cannot beconsidered as a valuable geostatistical model tool.
Conditional simulation, a stochastic method, isparticularly adapted to this study (Pebesma andWesseling, 1998; Vann et al., 2002). By reproducingthe total variance of the data, both quantitatively(through the histogram) and spatially (through thesemivariogram), conditional simulation is a toolparticularly adapted to the description of variabil-ities. Vann et al. (2002) underlined the poor qualityof the results obtained through one single simula-tion compared to those obtained with the kriging; itis necessary to proceed to a series of simulations, alldifferent, to take into account the spreading of thegroup of variographic dots (Asselman, 1999).
In order to proceed with the majority of the datavariance values, 80 simulations of ZFF, were
0 40 50 60
e fraction (%)
50 mm) in the sediments and water depths. There appears to be no

ARTICLE IN PRESSY. Mear et al. / Continental Shelf Research 26 (2006) 2335–23512346
calculated. This therefore represents 80 differentdistributions, which are, however, equiprobableregarding the spatial distribution of the percentageof fine fraction. The final document (Fig. 9), builtfrom the average of 80 simulations, can thus beregarded as robust.
5. Discussion
Two types of muddy lithofacies are distinguishedin the study area: (i) heterolithic oxidised sediments,grey–beige in colour, with a high water content,called ‘‘O’’ facies; (ii) a compact, reduced organicmud, called ‘‘R’’ facies.
In the open sea, sandy gravels are widelypredominant (‘‘O’’ facies) with a fine-grainedcontent on average of 4%, but with extreme valuesranging from 2% to 25%. A depocentre (‘‘O’’facies) located off Courseulles-sur-mer between 5and 10m water depths, is very marked. As describedby Avoine (1981), its contours had never beenspecified during previous surveys. This depocentre
Fig. 9. Spatial repartition of the fine-grained fraction (o50 mm) in the ea
with the clay extension on the Fig. 2.
has a very strong heterogeneity that is related to thefine sediments deposited on a rocky substrate. Itsorigin can be linked to the ebb-tidal delta of theOrne river: the fine estuarine sediments expelled tothe sea travel as suspended matter to settle in thisarea under favourable conditions (i.e. easterly windsand ebb currents). Due to the chaotic surface of therocky bottom, the waves cannot erode completelythese fine deposits.
The spatial distribution of the fine fraction in thesuperficial sediments shows also the existence of awide central deposit that had not been preciselymapped before this study, in spite of the variousinvestigations carried out in the area (Larsonneurand Hommeril, 1967, Avoine, 1981; Crevel, 1986).An E–W muddy zone, approximately 150 km2 inarea, extends off the Antifer harbour (where itconnects with the coastal silted fringe), fromapproximately 20m to more than 40m waterdepths. The western termination of this muddyzone is gradually directed towards the NW, givingto this central deposit a concave towards the N
stern part of the Bay of the Seine. This figure should be compared

ARTICLE IN PRESS
5 10 15 20
3
4
5
6
7
8
Sediment fine fraction (%)
Log
of th
e nu
mbe
r of
britt
le-s
tars
(in
d.m
-2)
Fig. 10. Relationship between the fine-grained content and the
number of brittle-stars Ophiothrix fragilis in ind.m�2 in the
superficial sediments. Triangles refer to samples taken off the
Antifer harbour in the inset of Fig. 9, stars refer to samples taken
elsewhere in the offshore part of the study area.
Y. Mear et al. / Continental Shelf Research 26 (2006) 2335–2351 2347
configuration. The shape of this unit is related to thepresence of a field of sand waves approximately 5mhigh, named the ‘‘Ridins d’Antifer’’ and this W–Eorientated field limits the extension of the muddyzone towards the N. The location of this muddyunit is closely linked to an eddy, which wasdescribed by Le Hir et al. (1986) and Cugier andLe Hir (2002). This eddy traps a part of thesuspended matter expelled from the Seine estuarytowards the north, and spreads it along the coast ofthe Pays de Caux. In this same zone, Cugier and LeHir (2002) stressed the existence of coastal down-welling, created by south-westerly winds. These twomechanisms may contribute to offshore transport offine-grained sediment. Furthermore, the wide shal-low depression in this area, which reflects sub-surface geology (i.e. soft unconsolidated Cretaceoussands), may favour settling of suspended particulatematter.
The geostatistic approach revealed the extremespatial heterogeneity of the area, where the mor-phology of the sea bottom plays a role on twodifferent scales. At a general scale, it influences theshape of the sedimentary unit; at a local scale, it isresponsible, to some extent, for its installation andits permanence. The detailed surface sedimentanalysis revealed that the most strongly silted zonesmake up small mud patches (o4000m wide), aspreviously stressed by the nugget effect of thesemivariogram (Fig. 6). These mud patches arelocated in various morpho-sedimentary settings.Sediments sampled within paleovalleys or betweenhydraulic dunes, are oxidised muddy gravely sands(‘‘O’’ facies); whose fine-grained content remainsmoderate (15–25%).
Other mud patches with analogous sizes do notseem to be influenced by morphology, because theyare located on flat areas. The mud content withinthese zones is very variable (10–450%); this type ofmud patches corresponds to the highest (450%)content of fine fraction. Some of them correspondto the ‘‘O’’ facies, but others to the ‘‘R’’ facies. Thesediments in areas of ‘‘O’’ facies are typicallyfloored by a high concentration (45000 ind.m�2)of the brittle-star Ophiothrix fragilis (Abildgaard).This population of echinoderms, whose concentra-tions had been reported by Davoult and Migne(2001), is never associated with ‘‘R’’ facies (i.e. blackmud). However, detailed observations of sedimentsfrom the latter show that they contain a very largeamount of needles of O. fragilis. The black-mudareas can be thus interpreted as loci where dense
populations of O. fragilis used to live but have nowabandoned. This desertion can have several origins,among which are: a too high content of finesediments in the bottom, or local changes inhydrodynamics. A desertion of the area related toa change in the physicochemical properties ofthe sediments under the action of the faeces ofO. fragilis should be significant, leading to anincrease in sulphate reduction.
An additional complicating parameter is theheterolithic gravel bottom that contributes to thevariable trapping of the fine sediments in the inter-granular voids of the surficial sediments.
Without ignoring the morphological aspect overall scales, i.e. from the sedimentary body to theinfra-metric ripple scales, the fluctuations in therates of fine fraction deposition appear stronglylinked to the presence or the absence of O. fragilis
which can reach a density higher than 7000 ind.m�2
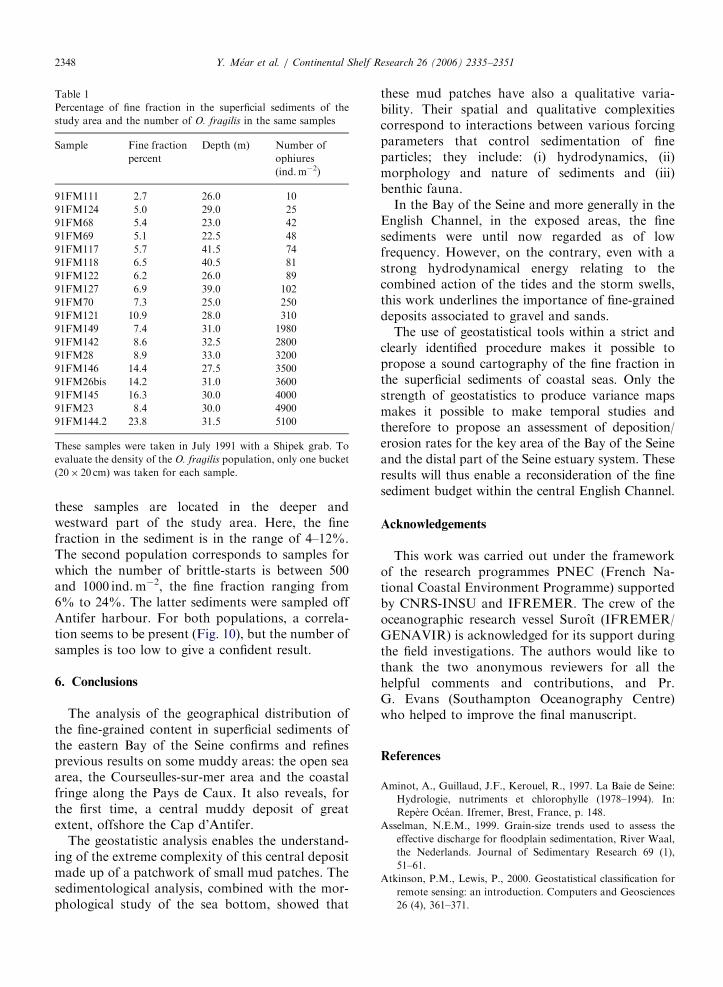
in this area of the Bay of the Seine (Davoult andMigne, 2001). This species is known to be primarilya suspension feeder (Vevers, 1952; Cabioch, 1968;Warner, 1971). While raising its arms to collectfood, it is responsible for a reduction of the bottomcurrent and thus favours the settlement of the finestparticles, accentuated by the expulsion of mucus-rich faeces. This study shows that the relationshipbetween brittle-stars and fine-grained content of thesediment is complex (Fig. 10). According to theresult of a non-parametric Shapiro–Wilcoxon test(P value: 0.0005 with a ¼ 0:05), two populations ofsamples can be distinguished. The first populationconsists of samples for which the number of brittle-stars is lower than 500 ind.m�2 (Table 1). All of
ARTICLE IN PRESS
Table 1
Percentage of fine fraction in the superficial sediments of the
study area and the number of O. fragilis in the same samples
Sample Fine fraction
percent
Depth (m) Number of
ophiures
(ind.m�2)
91FM111 2.7 26.0 10
91FM124 5.0 29.0 25
91FM68 5.4 23.0 42
91FM69 5.1 22.5 48
91FM117 5.7 41.5 74
91FM118 6.5 40.5 81
91FM122 6.2 26.0 89
91FM127 6.9 39.0 102
91FM70 7.3 25.0 250
91FM121 10.9 28.0 310
91FM149 7.4 31.0 1980
91FM142 8.6 32.5 2800
91FM28 8.9 33.0 3200
91FM146 14.4 27.5 3500
91FM26bis 14.2 31.0 3600
91FM145 16.3 30.0 4000
91FM23 8.4 30.0 4900
91FM144.2 23.8 31.5 5100
These samples were taken in July 1991 with a Shipek grab. To
evaluate the density of the O. fragilis population, only one bucket
(20� 20 cm) was taken for each sample.
Y. Mear et al. / Continental Shelf Research 26 (2006) 2335–23512348
these samples are located in the deeper andwestward part of the study area. Here, the finefraction in the sediment is in the range of 4–12%.The second population corresponds to samples forwhich the number of brittle-starts is between 500and 1000 ind.m�2, the fine fraction ranging from6% to 24%. The latter sediments were sampled offAntifer harbour. For both populations, a correla-tion seems to be present (Fig. 10), but the number ofsamples is too low to give a confident result.
6. Conclusions
The analysis of the geographical distribution ofthe fine-grained content in superficial sediments ofthe eastern Bay of the Seine confirms and refinesprevious results on some muddy areas: the open seaarea, the Courseulles-sur-mer area and the coastalfringe along the Pays de Caux. It also reveals, forthe first time, a central muddy deposit of greatextent, offshore the Cap d’Antifer.
The geostatistic analysis enables the understand-ing of the extreme complexity of this central depositmade up of a patchwork of small mud patches. Thesedimentological analysis, combined with the mor-phological study of the sea bottom, showed that
these mud patches have also a qualitative varia-bility. Their spatial and qualitative complexitiescorrespond to interactions between various forcingparameters that control sedimentation of fineparticles; they include: (i) hydrodynamics, (ii)morphology and nature of sediments and (iii)benthic fauna.
In the Bay of the Seine and more generally in theEnglish Channel, in the exposed areas, the finesediments were until now regarded as of lowfrequency. However, on the contrary, even with astrong hydrodynamical energy relating to thecombined action of the tides and the storm swells,this work underlines the importance of fine-graineddeposits associated to gravel and sands.
The use of geostatistical tools within a strict andclearly identified procedure makes it possible topropose a sound cartography of the fine fraction inthe superficial sediments of coastal seas. Only thestrength of geostatistics to produce variance mapsmakes it possible to make temporal studies andtherefore to propose an assessment of deposition/erosion rates for the key area of the Bay of the Seineand the distal part of the Seine estuary system. Theseresults will thus enable a reconsideration of the finesediment budget within the central English Channel.
Acknowledgements
This work was carried out under the frameworkof the research programmes PNEC (French Na-tional Coastal Environment Programme) supportedby CNRS-INSU and IFREMER. The crew of theoceanographic research vessel Suroıt (IFREMER/GENAVIR) is acknowledged for its support duringthe field investigations. The authors would like tothank the two anonymous reviewers for all thehelpful comments and contributions, and Pr.G. Evans (Southampton Oceanography Centre)who helped to improve the final manuscript.
References
Aminot, A., Guillaud, J.F., Kerouel, R., 1997. La Baie de Seine:
Hydrologie, nutriments et chlorophylle (1978–1994). In:
Repere Ocean. Ifremer, Brest, France, p. 148.
Asselman, N.E.M., 1999. Grain-size trends used to assess the
effective discharge for floodplain sedimentation, River Waal,
the Nederlands. Journal of Sedimentary Research 69 (1),
51–61.
Atkinson, P.M., Lewis, P., 2000. Geostatistical classification for
remote sensing: an introduction. Computers and Geosciences
26 (4), 361–371.
ARTICLE IN PRESSY. Mear et al. / Continental Shelf Research 26 (2006) 2335–2351 2349
Aubry, P., 2000. Le traitement des variables regionalisees en
ecologie. Apports de la geomatique et de la geostatistique.
Thesis, Universite Claude Bernard, Lyon, France, 480 pp.
Auffret, J.-P., D’Ozouville, L., 1986. Apports de l’imagerie
fournie par le sonar a balayage lateral a 1a connaissance de la
dynamique sedimentaire en Baie de Seine. In: La Baie de
Seine (GREC0-MANCHE). Ifremer, Universite de Caen,
Brest, France, pp. 201–209.
Auffret, J.-P., Alduc, D., Larsonneur, C., Smith, A.J., 1980.
Cartographie du reseau des paleovallees et de l’epaisseur des
formations superficielles meubles de la Manche orientale.
Annales de l’lnstitut Oceanographique 56, 21–35.
Avoine, J., 1981. L’estuaire de la Seine: sediments et dynamique
sedimentaire. Thesis, Universite de Caen, France, 236 pp.
Avoine, J., 1984. Evolution hydrodynamique et sedimentaire de
l’estuaire de la Seine. In: L’estuaire de la Seine, enjeux
ecologiques et economiques. Actes de colloques, Le Havre,
France, pp. 53–67.
Avoine, J., 1986. Sediment exchanges between the Seine estuary
and its adjacent shelf. Journal of the Geological Society,
London 144, 135–148.
Avoine, J., Caillot, A., Hoslin, R., Larsonneur, C., Massias, J.,
Quesney, M., 1986. Contribution des traceurs radioactifs a
l’etude des mouvements sedimentaires en Baie de Seine. In: La
Baie de Seine (GREC0-MANCHE). Ifremer, Universite de
Caen, Brest, France, pp. 211–218.
Batista, A.C., Sousa, A.J., Batista, M.J., Viegas, L., 2001.
Factorial kriging with external drift: a case study on the
Penedono Region, Portugal. Applied Geochemistry 16 (7–8),
921–929.
Bellehumeur, C., Marcotte, D., Legendre, P., 2000. Estimation of
regionalized phenomena by geostatistical methods: lake
acidity on the Canadian Shield. Environmental Geology 39
(3–4), 211–220.
Birch, G.F., Taylor, S.E., 2000. The use of size-normalised
procedures in the analysis of organic contaminants in
estuarine sediments. Hydrobiologia 431, 129–133.
Bowman, M.J., Iverson, R.I., 1978. Estuarine and plume fronts.
In: Coastal Processes. Springer, New York, USA, pp. 87–104.
Brunet, C., Brylinski, J.M., Bodineau, L., Thoumelin, G.,
Bentley, D., Hilde, D., 1996. Phytoplankton dynamics during
the spring bloom in the south-eastern English Channel.
Estuarine, Coastal and Shelf Science 43 (4), 469–483.
Brylinski, J.M., Lagadeuc, Y., Gentilhomme, V., Dupont, J.-P.,
Lafite, R., Dupeuble, P.-A., Huault, M.-F., Auger, Y.,
Puskaric, E., Wartel, M., Cabioch, L., 1991. Le fleuve cotier:
un phenomene hydrologique important en Manche orientale.
Oceanologica Acta (special issue) (11), 197–203.
Brylinski, J.M., Brunet, C., Bentley, D., Thoumelin, G., Hilde,
D., 1996. Hydrography and phytoplankton biomass in the
eastern English Channel in spring 1992. Estuarine, Coastal
and Shelf Science 43 (4), 507–519.
Cabioch, L., 1968. Contribution a la connaissance des peuple-
ments benthiques de la Manche occidentale. Cahiers de
Biologie Marine 9 (suppl.), 493–720.
Caeiro, S., Painho, M., Goovaerts, P., Costa, H., Sousa, S., 2003.
Spatial sampling design for sediment quality assessment in
estuaries. Environmental Modelling and Software 18 (10),
853–859.
Chang, Y.H., Scrimshaw, M.D., Emmerson, R.H.C., Lester,
J.N., 1998. Geostatistical analysis of sampling uncertainty at
the Tollesbury Managed Retreat site in Blackwater Estuary,
Essex, UK: Kriging and cokriging approach to minimise
sampling density. The Science of the Total Environment 221
(1), 43–57.
Cheng, K.S., Yeh, H.C., Tsai, C.H., 2000. An Anisotropic Spatial
Modeling Approach for Remote Sensing Image Rectification.
Remote Sensing of Environment 73, 46–54.
Crevel, L., 1984. Contribution a l’etude de la dynamique
sedimentaire dans la partie Nord-orientale de la Baie de
Seine. Thesis, Universite Paris XI, 185 pp.
Crevel, L., 1986. La dynamique sedimentaire en Baie de Seine
nord-orientale, fluctuations et evolution de la couverture
meuble. In: La Baie de Seine (GREC0-MANCHE). Ifremer,
Universite de Caen, Brest, France, pp. 193–200.
Cugier, P., Le Hir, P., 2002. Development of 3D hydrodynamic
model for coastal ecosystem modeling. Application to the
plume of the Seine River (France). Estuarine, Coastal and
Shelf Science 55 (5), 673–695.
Davis, J.-C., 1986. Statistics and Data Analysis in Geology.
Wiley, New York, USA, 646 pp.
Davoult, D., Migne, A., 2001. Respiration and excretion of a
dense Ophiothrix. fragilis population in the Bay of Seine
(English Channel, France). In: Barker, M.F. (Ed.), Echino-
derm 2000. Swets and Zeitlinger, Lisse, pp. 243–248.
Desbarats, A.J., 1996. Modeling spatial variability using geosta-
tistical simulation. In: Rouhani, S., Srivastava, R.M.,
Desbarats, A.J., Cromer, A.J., Johnson, A.I. (Eds.), Geosta-
tistics for Environmental and Geotechnical Applications.
American Society for Testing and materials STP 183,
Philadelphia, pp. 32–48.
Dethleff, D., Velegrakis, A., Lafite, R., Bishop, C., Collins, M.B.,
1996. Sedimentological investigations on sand and silt-sized
material in western English channel surface deposits and local
suspended particulate matter. Meeting of the Marine studies
group of geological Society of London, Southampton, UK,
Poster, pp. 24–25.
Dupont, J.-P., Lafite, R., Lamboy, M., 1986. Contribution de
l’etude des suspensions a la comprehension des mecanismes
hydrosedimentaires estuariens et littoraux en Manche centrale
et orientale. In: La Baie de Seine (GREC0-MANCHE).
Ifremer, Universite de Caen, Brest, France, pp. 145–154.
Dupont, J.-P., Lafite, R., Huault, M.-F., Dupeuble, P.-A.,
Brylinski, J.-M., Guegueniat, P., Lamboy, M., Cabioch, L.,
1991. La dynamique des masses d’eaux et des remises en
suspension en Manche orientale. Oceanologica Acta (special
issue) (11), 177–186.
Forstner, U., Calmano, W., Shoer, J., 1982. Metals in sediments
from the Elbe, Weser and Ems Estuaries and from the
German Bight: grain size effects and chemical forms.
Thalassia Jugosi 12, 30–38.
Garnaud, S., 2003. La sedimentation fine sur une plate-forme
interne actuelle macrotidale: la Baie de Seine sud-orientale
(France). Thesis, Universite de Caen, France, 278 pp.
Garnaud, S., Lesueur, P., Lesourd, S., Poupinet, N., Brun-
Cottan, J.-C., 2002. Caracterisation des variations lithologi-
ques saisonnieres des sediments de la Baie de Seine orientale;
impact des crues de la Seine (France). Comptes Rendus
Geosciences 334 (5), 323–330.
Garnaud, S., Lesueur, P., Lesourd, S., Garlan, T., Clet, M.,
Brun-Cottan, J.-C., 2003. Holocene to modern fine-grained
sedimentation on a macrotidal shoreface-to-inner shelf (east-
ern Bay of the Seine, France). Marine Geology 202 (1–2),
33–54.
ARTICLE IN PRESSY. Mear et al. / Continental Shelf Research 26 (2006) 2335–23512350
Gascuel-Odoux, C., Boivin, P., 1994. Variability of variograms
and spatial estimates due to soil sampling: a case study.
Geoderma 62 (1–3), 165–183.
Goovaerts, P., 1997a. Geostatistics for natural resources evalua-
tion. Oxford University press, New York, USA, 483 pp.
Goovaerts, P., 1997b. Kriging vs stochastic simulation for risk
analysis in soil contamination. In: Soares, A., Gomez-
Hernandez, J., Froidevaux, R. (Eds.), geoENV I-Geostatistics
for Environmental Applications. Kluwer, Dordrecht,
pp. 247–258.
Goovaerts, P., 1999. Geostatistics in soil science: state-of-the-art
and perspectives. Geoderma 89 (1–2), 1–45.
Gringarten, E., Deutsch, C.V., 2001. Teacher’s Aide. Variogram
interpretation and modelling. Mathematical Geology 33,
507–534.
Isaaks, E.H., Srivastave, R.M., 1989. An introduction to applied
geostatistics. Oxford University Press, New-York, US, 561
pp.
Journel, A.G., Huijbregts, C.J., 1978. Mining Geostatistics.
Academic Press, New York, 600 pp.
Kuzyakova, I.F., Romanenkov, V.A., Kuzyakov, Y.V., 2001.
Application of geostatistics in processing the results of soil
and agrochemical studies. Eurasian Soil Science 34,
1219–1228.
Lafite, R., 1990. Caracterisation et dynamique des particules en
suspension dans un domaine marin macrotidal influence par
un estuaire : l’exemple de la Baie de Seine orientale (France).
Thesis, Universite de Rouen, France, 294 pp.
Larsonneur, C., 1971. Manche centrale et Baie de Seine : geologie
du substratum et des depots meubles. Thesis, Universite de
Caen, France, 394 pp.
Larsonneur, C., 1972. Le modele sedimentaire de la Baie de Seine
a la Manche centrale dans son cadre geographique
et historique. Memoire du B.R.G.M 79, 241–255.
Larsonneur, C., Hommeril, P., 1967. Sediments et sedimentation
dans la partie orientale de la Baie de Seine. Revue des societes
savantes de Haute-Normandie 47, 45–75.
Larsonneur, C., Bouysse, P., Auffret, J.-P., 1982. The superficial
sediments of the English Channel and its Western Ap-
proaches. Sedimentology 29 (6), 851–864.
Leecaster, M., 2003. Spatial analysis of grain size in Santa
Monica bay. Marine Environmental Research (56), 67–78.
Le Hir, P., Salomon, J.-C., Le Provost, C., Chabert d’Hieres, G.,
Mauvais, J.-L., 1986. Approche de la circulation residuelle en
Baie de Seine. In: La Baie de Seine (GREC0-MANCHE).
Ifremer, Universite de Caen, Brest, France, pp. 63–72.
Le Hir, P., Ficht, A., Silva-Jacinto, R., Lesueur, P., Dupont, J.-
P., Lafite, R., Brenon, L., Thouvenin, B., Cugier, P., 2001.
Fine sediment transport and accumulations at the mouth of
the Seine estuary (France). Estuaries 24 (6B), 950–963.
Lesourd, S., 2000. Processus d’envasement d’un estuaire macro-
tidal: zoom temporel du siecle a l’heure; application a
l’estuaire de la Seine. Thesis, Universite de Caen, France,
280 pp.
Lesueur, P., Lesourd, S., 1999. Sables, chenaux, vasieres.
Dynamique des sediments et evolution morphologique.
Scientific Report, Seine-Aval program, 3. Ifremer (Ed.), Brest,
France, 39 pp.
Lesueur, P., Lesourd, S., Auffret, J.-P., Avoine, J., Brun-Cottan,
J.-C., Levoy, F., 1997. Etat des connaissances sur la
distribution et l’evolution des sediments fins dans l’estuaire
de la Seine. Scientific Report, Seine-Aval program, 1996/FIN
1, Hydrodynamique et transport sedimentaire. Ifremer (Ed.),
Brest, France, pp. 82–115.
Lesourd, S., Lesueur, P., Brun-Cottan, J.-C., Auffret, J.-P.,
Poupinet, N., Laignel, B., 2001. Morphosedimentary evolu-
tion of a macrotidal estuary subjected to human impact; the
example of the Seine (France). Estuaries 24 (6B), 940–949.
Lesourd, S., Lesueur, P., Brun-Cottan, J.-C., Garnaud, S.,
Poupinet, N., 2003a. Seasonal variations in the characteristics
of the superficial sediments characteristics in a macrotidal
estuary (the Seine inlet, France). Coastal and Shelf Science 58
(1), 3–16.
Lesueur, P., Lesourd, S., Lefebvre, D., Garnaud, S., Brun-
Cottan, J.-C., 2003b. Holocene and modem sedimentation in
the Seine estuary (France): a synthesis. Journal of Quaternary
Science 18 (3–4), 339–349.
Matheron, G., 1963. Principles of geostatistics. Economic
Geology 58, 1246–1266.
Matheron, G., 1965. Les Variables Regionalisees et Leur
Estimation. Masson, Paris, France, 305 pp.
Ouyang, Y., Higman, J., Thompson, J., O’Toole, T., Campbell,
D., 2002. Characterization and spatial distribution of heavy
metals in sediment from Cedar and Ortega rivers subbasin.
Journal of Contaminant Hydrology 54 (1–2), 19–35.
Pebesma, E.J., 2000. Gstat user’s manual. 100+ pp; PDF
available from /http://www.gstat.org/S.
Pebesma, E.J., Wesseling, C.G., 1998. Gstat: a program for
geostatistical modelling, prediction and simulation. Compu-
ters and Geosciences 24 (1), 17–31.
Pyrcz, M.J., Deutsch, C.V., 2003. The Whole Story on the Hole
Effect. WWW Page, /http://www.gaa.org.au/html/gaa-main.
htmlS.
Saito, H., Goovaerts, P., 2001. Accounting for source location
and transport direction into geostatistical prediction of
contaminants. Environmental Science and Technology 35
(24), 4823–4829.
Schnabel, U., Tietje, O., Roland, W., Scholz, R.W., 2004.
Uncertainty assessment for management of soil contaminants
with sparse data. Environmental Management 33 (6),
911–925.
Sly, P.G., 1981. Equipment and techniques for offshore survey
and site investigations. Canadian Geotechnical Journal 18,
230–249.
Spineanu, A., 1998. Mobilite des sediments fins en Baie de Seine
orientale (Manche). DEA report, Universite de Lille, France,
56 pp.
Vanderborght, J., Jacques, D., Mallants, D., Tseng, P.H., Feyen,
J., 1997. Analysis of solute redistribution in heterogeneous
soil. II. Numerical simulation of solute transport. In: Soares,
A., Gomez-Hernandez, J., Froidevaux, R. (Eds.), geoENV I-
Geostatistics for environmental applications. Kluwer, Dor-
drecht, pp. 283–295.
Vann, J., Bertoli, O., Jackson, S., 2002. An overview of
geostatistical simulation for quantifying risk. Geostatistical
Association of Australasia symposium ‘‘Quantifying Risk and
Error’’. WWW Page, /http://www.quantitativegeoscience.-
comS.
Vaslet, D., Larsonneur, C., Auffret, J.-P., 1978. Carte des
Sediments Superficiels de la Manche au 1:500,000e et Notice
Explicative. BRGM, Orleans, France, 17 pp.
Velegrakis, A.F., Michel, D., Collins, M.B., Lafite, R., Oikono-
mou, E.K., Dupont, J.-P., Huault, M.F., Lecouturier,
M.J., Salomon, C., Bishop, C., 1999. Sources, sinks and
ARTICLE IN PRESSY. Mear et al. / Continental Shelf Research 26 (2006) 2335–2351 2351
resuspension of suspended particulate matter in the eastern
English Channel. Continental Shelf Research 19 (15–16),
1933–1957.
Vevers, H.G., 1952. A photographic survey of certain areas of the
sea floor near Plymouth. Journal of the Marine Biological
Association of the United Kingdom 31, 215–222.
Wang, G., Gertner, G., Singh, V., Shinkareva, S., Parysow, P.,
Anderson, A., 2002. Spatial and temporal prediction and
uncertainty of soil loss using the revised universal soil loss
equation: a case study of the rainfall–runoff erosivity R
factor. Ecological Modelling 153 (1–2), 143–155.
Warner, G.F., 1971. On the ecology of a dense bed of the brittle-
star Ophiothrix fragilis. Journal of the Marine Biological
Association of the United Kingdom 51, 267–282.
Webster, R., Oliver, M.A., 1990. Statistical Methods in Soil and
Land Resources Survey. Oxford University Press, Oxford,
UK, 316 pp.
Webster, R., Oliver, M.A., 1992a. Sample adequately to estimate
variograms of soil properties. Journal of Soil Science 43,
177–192.
Webster, R., Oliver, M.A., 1992b. Confidence intervals on
variograms for samples of various sizes. Science de la Terre,
Serie Informatique Geologique 31, 11–23.
Webster, R., Oliver, M.A., 1993. How large a sample is
needed to estimate the regional variogram adequatly.
In: Soraes, A. (Ed.), Geostatistic Troia’92. Kluwer
Academic Publishers, Dordrecht, The Netherlands,
pp. 155–166.


![Conditional simulations of Brown–Resnick processescdombry.perso.math.cnrs.fr/[D20].pdf · Although some progress has been made to develop a geostatistic of extremes, conditional](https://img.pdfslide.us/doc/110x75/5aaedacd7f8b9a59478c990e/conditional-simulations-of-brownresnick-d20pdfalthough-some-progress-has-been.jpg)


![LubiaConhecerNIgnorar.ppt [Modo de Compatibilidade]wiki.dpi.inpe.br/lib/exe/fetch.php?media=conhecer:... · 1. Keyword search against GCMD using PROJECT=CWIC. 2. Response is a collection](https://img.pdfslide.us/doc/110x75/5f84101a4c6c5565d627a9f2/l-modo-de-compatibilidadewikidpiinpebrlibexefetchphpmediaconhecer.jpg)