Embed Size (px)
Citation preview

Findings on the climate change impact on flood discharge on the Sava river and preliminary
identification of adaptation measures:
Mitja Brilly, University of Ljubljana
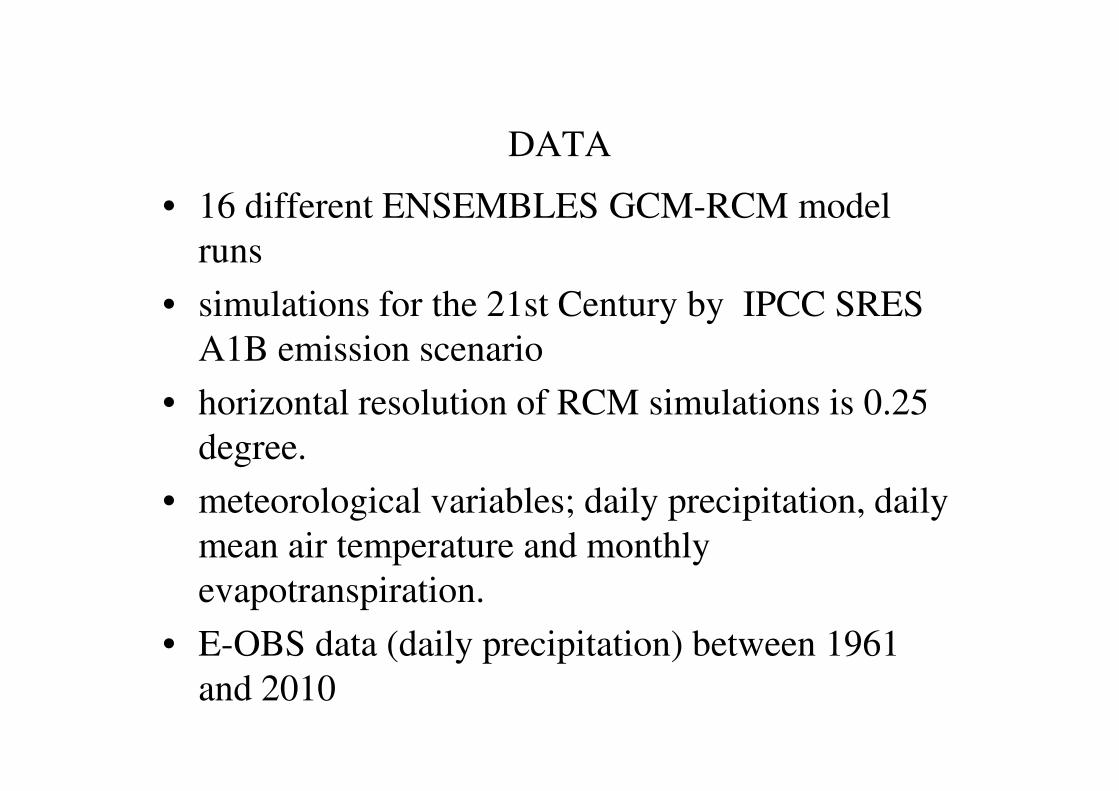
DATA
• 16 different ENSEMBLES GCM-RCM model
runs
• simulations for the 21st Century by IPCC SRES
A1B emission scenario
• horizontal resolution of RCM simulations is 0.25 • horizontal resolution of RCM simulations is 0.25
degree.
• meteorological variables; daily precipitation, daily
mean air temperature and monthly
evapotranspiration.
• E-OBS data (daily precipitation) between 1961
and 2010

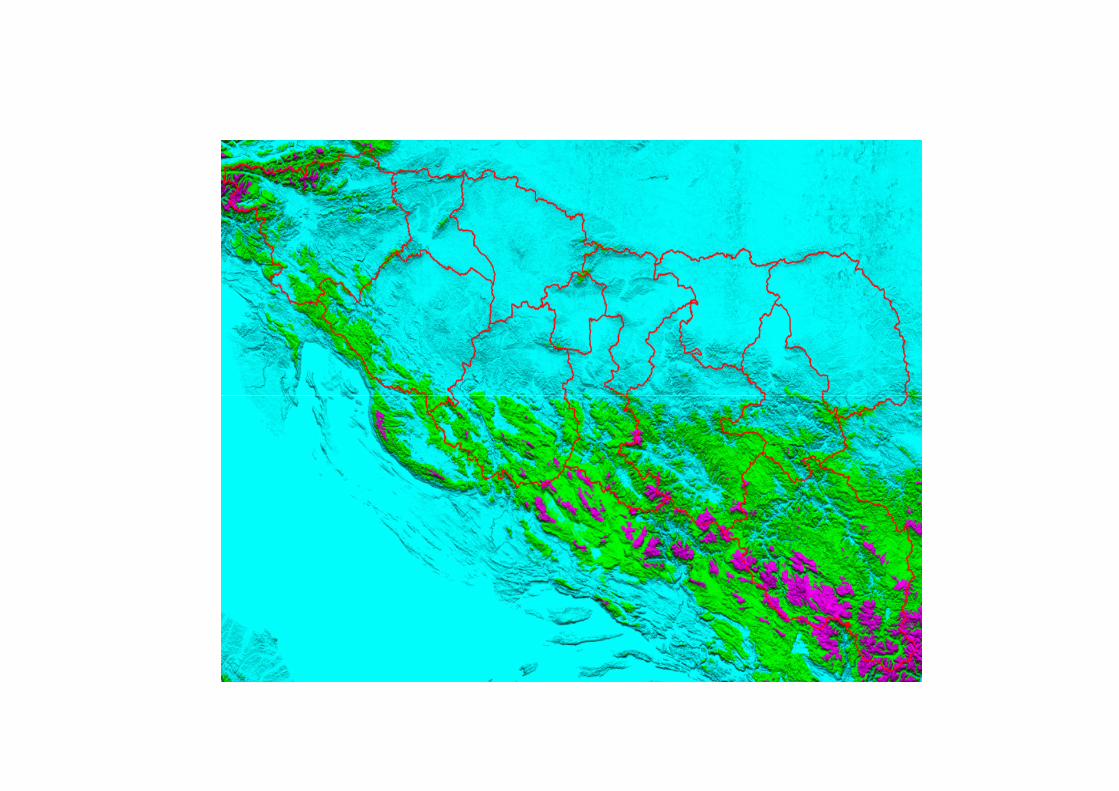
climate projections for Sava River Basin
• transfer functions from the period 1961-1990
• validation period 1991-2010,
• Three periods were used for assessing future climate
change: 2011-2040, 2041-2070 and 2071-2100. change: 2011-2040, 2041-2070 and 2071-2100.
• Daily maximum values for seasonal precipitation with 20
and 100 return period were determined

Input data
The following input data are required to calibrate/run the
model:
- precipitation (32 measurement stations
- temperatures (8 measurement stations - temperatures (8 measurement stations
- discharge data (12 measurement stations
- potential evapotranspiration (8 stations)
For the calibration - period from June 1 to December 31,
1974.
For verification - period September 1, 1978 to November 30,
1978

Precipitation data
Probability of maximum daily precipitation (mm) in a year and data from Table 8.
Max prec. V1 V2 V3 V4
Station name 1.000 100 20 in 1974 EOBS_20 EOBS_100 20_41-70 100_41-70
Ljubljana 190,7 106,3 72,2 95,8 88,5 110,0 110,0 148,0
Rateče 214,9 121,2 83,2 42,6 131,9 171,1 147,5 191,3
return period
Rateče 214,9 121,2 83,2 42,6 131,9 171,1 147,5 191,3
Zagreb 117,2 65,9 45,2 34,5 43,6 50,3 52,0 67,4
Slavonski brod 104,1 59,1 40,9 31,6 31,1 38,6 36,3 47,8
Bihač 155,3 89,5 62,8 82,9 69,7 83,4 81,0 101,8
Bugojno 119,9 66,2 44,5 40,4 38,0 50,4 44,8 66,6
Sarajevo 120,0 67,0 45,5 36,0 37,6 42,6 49,6 66,5
Banja luka 86,0 57,4 45,8 56,2 34,0 44,0 38,9 53,4
Beograd 126,8 66,3 41,9 39,4 36,0 46,1 46,4 66,7
Sjenica 89,9 53,3 38,5 45,1 42,9 51,3 55,9 77,6

Result of modelling recent climate flood peaks (in m3/s).
Sub-basins WS measured calibrated EOBS_ret20 EOBS_ret100
Sava I Čatež 2294 2308 2308 2780
Kolpa Šišinec 1250 1419 1473 1522
Sava II Crnac 2147 2295 2350 2510
Una Kostajnica 1370 1445 1382 1407
Sava III Jasenovac 2580 2515 2561 2718
Vrbas Delibašino selo 691 762 620 707
Vrbas Delibašino selo 691 762 620 707
Sava IV Slavonski Brod 3460 3422 3411 3573
Bosna Doboj 1095 753 742 767
Sava V Županja 3930 4057 4068 4227
Drina I Bajina Bašta 3359 2715 2336 2474
Drina II Kozluk 3041 2640 2276 2407
Sava V Sremska Mitrovica 6275 6540 6328 6603
confluence with Danube 6653 6432 6715

Results of modelling climate change flood peaks with EOBS data of the 100-year return
period (in m3/s and %).
Sub-
basins
WS
EOBS
m3/s
11-40
m3/s
41-7
m3/s 0
71-2100
m3/s
11-40
%
41-70
%
71-2100
%
Sava I Čatež 2780 3297 3770 4134 1.43 1.63 1.79
Kolpa Šišinec 1522 1595 1664 1722 1.08 1.13 1.17
Sava II Crnac 2510 2670 2817 2929 1.14 1.20 1.25
Una Kostajnica 1407 2060 2245 2188 1.49 1.63 1.58
Sava III Jasenovac 2718 2863 2993 3086 1.12 1.17 1.21
Vrbas Delibašino selo
707 813 845 825 1.31 1.36 1.33
Sava IV Slavonski Brod
3573 3895 4062 4142 1.14 1.19 1.21 Brod
Bosna Doboj 767 985 1025 1103 1.33 1.38 1.49
Sava V Županja 4227 4699 4957 5270 1.16 1.22 1.30
Drina I Bajina Bašta
2474 2683 3087 2719 1.15 1.32 1.16
Drina II Kozluk 2407 2639 3059 2686 1.16 1.34 1.18
Sava VI Sremska Mitrovica
6603 7143 7580 7409 1.13 1.20 1.17
confluence
6715 7253 7695 7509 1.13 1.20 1.17
average 1.21 1.31 1.31
max. 1.49 1.63 1.79
min 1.08 1.13 1.16


Probability function - WS Crnac


Labor force - by occupation (CIA) 2008-2012
country agriculture industry services
Slovenia 2,2 35 62,8
Croatia 2,1 29 69 Croatia 2,1 29 69
Serbia 21,9 19,5 58,6
BiH 20,5 32,6 47
Montenegro 6,3 20,9 72,8

Criteria for trans boundary impact assessment
No. Criterion Questions to be asked
1 Side-effects Does the measure have potentially negative effects on other riparian countries? riparian countries?
2 Efficiency / costs and benefits
Is the measure beneficial for the basin as a whole? Is this measure taken at an effective and efficient location considering the entire basin?

Program to mitigate the impact of climate change:
• Institutional strengthening
• Determination of cross sections for monitoring changes in the
morphology
• The development of hydrologic and hydraulics models
• Increase protection of major cities along the Sava River
• Protection of other cities and populated areas
• Protection of agricultural areas
• Integration of flood protection measures with water management,
Water Framework Directive and sustainable development.

Cost in EUR/meter

Development and cost
• Phase A: The short-term measures –
50 million EUR
Phase B: The medium-term measures Phase B: The medium-term measures
1 billion EUR
Phase C: The long-term measures
2 billion EUR

Always Plan with the Big Picture in Mind!