Embed Size (px)
Citation preview

FINDINGS OF MOI UNIVERSITY AgSHARE PILOT PROJECT ON DAIRY FINDINGS OF MOI UNIVERSITY AgSHARE PILOT PROJECT ON DAIRY FINDINGS OF MOI UNIVERSITY AgSHARE PILOT PROJECT ON DAIRY FINDINGS OF MOI UNIVERSITY AgSHARE PILOT PROJECT ON DAIRY
VALUE CHAINVALUE CHAINVALUE CHAINVALUE CHAIN
Mr. Francis Onyango Mr. Francis Onyango Mr. Francis Onyango Mr. Francis Onyango Oduor Oduor Oduor Oduor ---- Student (M.Phil Agricultural Student (M.Phil Agricultural Student (M.Phil Agricultural Student (M.Phil Agricultural EconomicsEconomicsEconomicsEconomics and and and and
Resource Resource Resource Resource ManagementManagementManagementManagement, Moi University), Moi University), Moi University), Moi University)
Abstract
The dairy sub-sector plays an important role in the overall economic growth of the country.
Dairy sub sector is a male dominated with 85% of farmers being male. 70% of the dairy farmers
have no formal employment. 33% of the farmers with formal education are female. Farmers with
advanced level of education do dairy farming. 55% of the farmers had tertiary education. 50% of
the farmers supplement their farm income with transfers from relatives and friends. The state of
poor marketing strategies and prices is well explained by the fact that only 35% were members
of a cooperative. There was an average of 4.4 animals in an average of 5.03 acres piece of land.
This is ideal in the high potential areas. The milk yield was 13.75L per cow per day as opposed
to what is recommended of 18L per cow per day. This meant that the production was at 76% and
needed to be increased. The total milk production had 7.5 % consumed at home, 76% sold, 11%
given to calves and 5.5% got spoiled. The major cost of production was labour (29%), forage
(24%) and concentrates (17%). The gross margin per cow per day was found to Ksh 158.79 as
opposed to recommended practices of Ksh 267.15 per day per cow. This meant that farmers’
income was at 59.4% and ought to be increased. This shows that vigorous activities aimed at
creating awareness to farmers to do the recommended practices in order to improve their income
ought to be done. Increase in farm income would reduce the dependence of transfers from
relatives and friends.
The study found two major challenges. The first was in productions which were high cost and
low quality of feeds, poor access to good breeds, high incidences of pests and diseases,
inadequate credit facilities, high cost of AI and inefficient distribution mechanism, inadequate
extension and training services among others. The second challenge was in marketing which
included poor infrastructure, inadequate milk collection and marketing systems, high transport
cost among others.
The farmers gave their remedies to the challenges. They said that there was a need to have
strategic milk reserve, absorption of excess milk production and speedy implementation of the
national livestock feed policy.

1
Background
Kenya has the largest dairy herd in SSA, with estimated 4 million milking cows (MoLP). Dairy
contributes 14% of Agr GDP and 3.5% of total GDP. In Africa, Kenya is the only country, after
South Africa that produces enough milk for both domestic consumption and export. Sudan is the
largest producer of milk in the COMESA, but it does not produce enough to satisfy both
domestic and export markets.
The dairy sub-sector plays an important role in the overall economic growth of the country. It
accounts for 10% of the county’s GDP and over 30% of the farm gate value of agricultural
commodities. It also employs over 50% of the agricultural labour force (GOK 1997).
Furthermore, the sector provides raw materials for the local dairy processing industries. Kenya’s
dairy production is dominated by small-scale producers who contribute 80% of the marketed
milk output (Peeler and Omore, 1997). 84% of the Kenyan marketed milk comes from cattle,
12% from camel and 4% from goats.
The dairy herd is mainly confined within the high potential areas and is composed of Friesian,
Aryshire, Guernsey, and Jersey as pure breeds and their crosses which make up over 50% of the
total herd (Muriuki, 2001). In the low potential areas, milk production is mainly from indigenous
zebu and sahiwal breeds, while in the arid areas, camels and goats are the most important
producers of milk. The dairy cattle population has grown tremendously from about 0.8m in 1960
to about 4m in 2005. According to 2009 population and housing census, Rift Valley held 44% of
the national dairy herd followed by central and eastern provinces with 26% and 10%
respectively.
Small holders produce about 56% of total milk and contribute up to 80% of the marketed milk
(Peeler and Omore, 1997) and are therefore the most important sources of milk in the country.
The supply of milk closely follows the rainfall pattern in such a way that peak-supply does not
match with peak-demand. This mismatch in supply-demand is largely bridged through
importation of powdered milk to the country thereby loosing the much needed foreign currency.
The dairy sub-sector is fully liberalized.
Milk constitutes an important component of the diet of Kenyan families. The estimated per
capita consumption is 125 and 19 liters in urban areas respectively (Thorpe et al, 2000 and
Muriuki, 2000). There is need therefore, to stimulate the domestic dairy sub-sector. The rising
trend of demand for dairy products is being intensified by the rising levels of population (at 3% /
year) and urbanization (7% / yr), income and income elasticity of demand for dairy products
(Thorpe et al 1998)
Stotz 1983 has defined 4 milk production systems practiced by the Kenya small holders.
• Open grazing (a) with zebu cattle. Cattle are herded on own or other people’s farms or on
communal lands. (b) With upgraded cows. Involves use of cultivated pastures with some
minerals and concentrates.

2
• Semi-zero grazing. Cows are identified by pure exotic or highly up-graded dairy cows.
Cows are grazed on open fields for most of the day and supplemented with concentrates
and fodder or hay.
• Zero grazing. Has the highest milk yield. Feeds are brought to the cows kept in stalls. The
system is labour intensive, requires heavy initial capital investment but maximizes the
use of land resource.
Purpose of the study
One of Kenya’s food policy objectives is to have the county sustain her-self-sufficiency in the
supply of milk and other dairy products (GoK 2001). Dairy farming remains the economic
backbone of livestock farmers in high potential areas like Uasin Gishu. However, in such areas,
milk production has been quite low. This is an indication that there are constraints which results
in low milk production. For potential milk yields to be realized, all production constraints and
their individual effects on milk production must be identified.
Objectives
The broad objective of the study was to compare the dairy farmers’ practices with the
recommended practices. The specific objectives were;
1. The establish the marketing structure of milk marketing
2. To investigate the farmers’ practices vis a vis the recommended best practices
Methodology
1. Study area
The study was taken in the high and low potential areas. The high potential areas were Trans
Nzoia, Uasin Gishu, Keiyo and Nandi. The low potential areas were Machakos, Baringo and
Bungoma. Most dairy cows in the high potential areas are normally high yielding breeds. Forage
is relatively available throughout the year. Semi-grazing and zero grazing are the major systems
in the high potential areas. In the low potential areas, all the systems of dairy production are
present. There is low investment in the dairy sector.
2. Research design.
The analysis is quantitative in nature and allows generalization and inferences to be made. The
study fitted well the case descriptive design.
3. Types and sources of data.
Both primary and secondary data were used. Interviewing dairy farmers on their own farms
generated the primary data, while the secondary data was obtained from existing database.
Primary data was obtained in the month of November 2010. Questions asked were both
structured and open ended. To reduce the memory bias, questions asked were restricted to the
one year period preceding the date of data collection. Data collected included information on
3
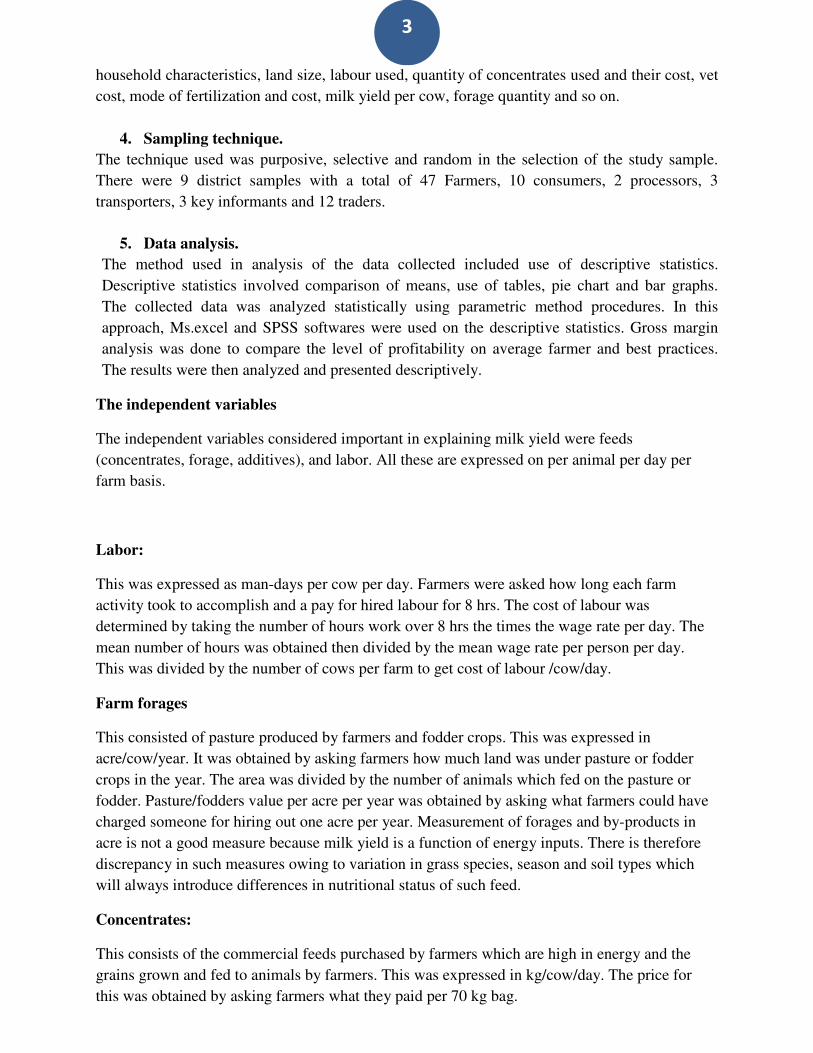
household characteristics, land size, labour used, quantity of concentrates used and their cost, vet
cost, mode of fertilization and cost, milk yield per cow, forage quantity and so on.
4. Sampling technique.
The technique used was purposive, selective and random in the selection of the study sample.
There were 9 district samples with a total of 47 Farmers, 10 consumers, 2 processors, 3
transporters, 3 key informants and 12 traders.
5. Data analysis.
The method used in analysis of the data collected included use of descriptive statistics.
Descriptive statistics involved comparison of means, use of tables, pie chart and bar graphs.
The collected data was analyzed statistically using parametric method procedures. In this
approach, Ms.excel and SPSS softwares were used on the descriptive statistics. Gross margin
analysis was done to compare the level of profitability on average farmer and best practices.
The results were then analyzed and presented descriptively.
The independent variables
The independent variables considered important in explaining milk yield were feeds
(concentrates, forage, additives), and labor. All these are expressed on per animal per day per
farm basis.
Labor:
This was expressed as man-days per cow per day. Farmers were asked how long each farm
activity took to accomplish and a pay for hired labour for 8 hrs. The cost of labour was
determined by taking the number of hours work over 8 hrs the times the wage rate per day. The
mean number of hours was obtained then divided by the mean wage rate per person per day.
This was divided by the number of cows per farm to get cost of labour /cow/day.
Farm forages
This consisted of pasture produced by farmers and fodder crops. This was expressed in
acre/cow/year. It was obtained by asking farmers how much land was under pasture or fodder
crops in the year. The area was divided by the number of animals which fed on the pasture or
fodder. Pasture/fodders value per acre per year was obtained by asking what farmers could have
charged someone for hiring out one acre per year. Measurement of forages and by-products in
acre is not a good measure because milk yield is a function of energy inputs. There is therefore
discrepancy in such measures owing to variation in grass species, season and soil types which
will always introduce differences in nutritional status of such feed.
Concentrates:
This consists of the commercial feeds purchased by farmers which are high in energy and the
grains grown and fed to animals by farmers. This was expressed in kg/cow/day. The price for
this was obtained by asking farmers what they paid per 70 kg bag.

4
RESULTS AND DISCUSSION
(a) Socio-economic characteristics
1. Gender. The respondents in the sample had 15% female and 85% male. This means that dairy sub-
sector is a male dominated area. In addition, most men are the owners of assets in the
household and the same time heads. Thus any enquiry on the dairy industry is best
handled by the males.
GENDER OF THE RESPONDENTS
Percent
FEMALE 15.0
MALE 85.0
2. Occupation. The study found that 70% of the sample respondents were just engaged in farming while
30% had formal employment although did dairy farming. 33% with formal employment
were female while 67% were male. Among the female respondents, 67% had formal
employment explaining why they were able to get capital to start the investment. 24% of
the male respondents had formal employment while 76% were just farmers. The dairy
animals might have been inherited explaining their acquisition of the capital.
OCCUPATION OF THE RESPONDENT
Percent
FARMER 70.0
CIVIL SERVANT 30.0
GENDER OF THE RESPONDENTS Vs OCCUPATION OF THE
RESPONDENT
OCCUPATION OF THE
RESPONDENT
FARMER
CIVIL
SERVANT
GENDER OF THE FEMALE 1 2

5
RESPONDENTS MALE 13 4
Total 14 6
3. Education level
55% of the respondents had tertiary education, 40% secondary education and 5% primary
education. Tertiary education level respondents had 55% practicing farming without any
formal employment and 45% farmers with formal employment. The higher percentage of
Tertiary education level respondents who were farmers might mean that either the
educated has taken dairy farming as a business hence source of employment or that the
formal employment was not available hence resorted to farming a coping mechanism.
87.5% of the secondary level respondents were farmers. This might also mean that
secondary education leaver had less chances of getting formal employment.
HIGHEST EDUCATION LEVEL
Percent
PRIMARY 5.0
SECONDARY 40.0
TERTIARY 55.0
GENDER OF THE RESPONDENTS , HIGHEST EDUCATION LEVEL AND OCCUPATION
OF THE RESPONDENT
OCCUPATION OF THE RESPONDENT
HIGHEST EDUCATION LEVEL
Total PRIMARY SECONDARY TERTIARY
FARMER GENDER OF THE
RESPONDENTS
FEMALE 0 0 1 1
MALE 1 7 5 13
Total 1 7 6 14
CIVIL
SERVANT
GENDER OF THE
RESPONDENTS
FEMALE 1 1 2
MALE 0 4 4
Total 1 5 6
4. Other sources of income
50% of the respondents get transfers from friends and relatives to supplement on-farm
income. This indicated high dependency level suggesting that on-farm income was not

6
adequate. 30% have formal employment while those who had no off-farm sources of
income and those running petty business were 10% each.
OFF FARM SOURCES OF INCOME
Percent
NONE 10.0
FORMAL EMPLOYEMENT 30.0
BUSINESS 10.0
TRANSFERS FROM FRIENDS AND RELATIVES 50.0
5. Cooperative membership
65% of the respondents were not members of any farmers’ cooperatives while 35% were
members. This is a recipe of the informal milk marketing and the poor prices being experienced
by the farmers. Cooperatives are important intermediaries who link the smallholder dairy farmers
to market. In addition, there is a collective bargaining in cooperatives for economies of scale.
MEMBER OF COOPERATIVE
Percent
NO 65.0
YES 35.0
6. Family farm size
Land is one of the factors of production. Land is required in all systems of dairy production. The
mean farm size was found to be 5.03 acres with minimum size of 0.5 acres and maximum of 15
acres. Due to shortage of land, some practiced zero or semi-zero grazing. Farm size is one of the
determinants of dairy production.
7. Family size
The mean family size was found to be 6.15 persons with minimum size of 4 persons and
maximum of 12 persons. Dairy production is labour intensive.
(b) Milk production
7
1.0 Number of cows
The mean number of animals was found to be 4.4 animals. The minimum was 2 animals and
maximum 12 animals. This study found that dairy farmers were within the recommendation of
high potential areas of 1 acre to one dairy livestock unit i.e. mean farm size of 5.03 acres to mean
dairy animals of 4.4nimals. The farmers could also consider reducing the number of animals in
the herd by selling any unproductive cows or old animals. Although this study did not deal with
other characteristics of the animals, it was assumed here that average weight of the animals was
400 Kg.
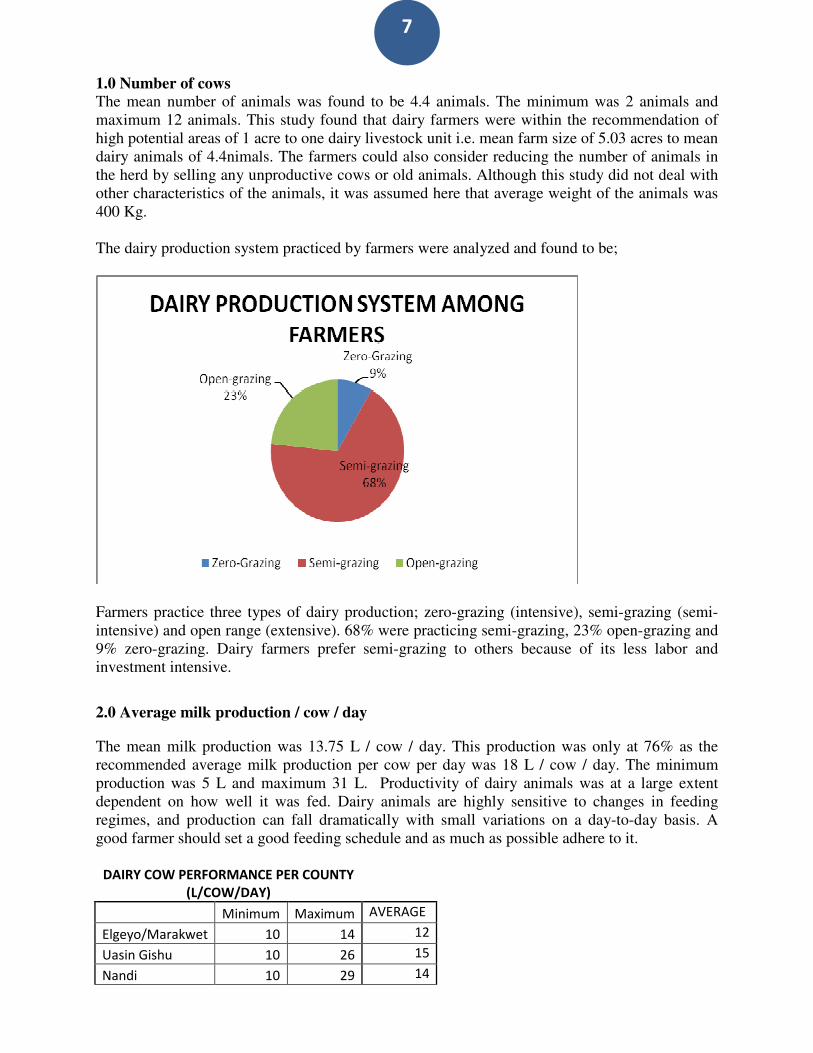
The dairy production system practiced by farmers were analyzed and found to be;
Farmers practice three types of dairy production; zero-grazing (intensive), semi-grazing (semi-
intensive) and open range (extensive). 68% were practicing semi-grazing, 23% open-grazing and
9% zero-grazing. Dairy farmers prefer semi-grazing to others because of its less labor and
investment intensive.
2.0 Average milk production / cow / day
The mean milk production was 13.75 L / cow / day. This production was only at 76% as the
recommended average milk production per cow per day was 18 L / cow / day. The minimum
production was 5 L and maximum 31 L. Productivity of dairy animals was at a large extent
dependent on how well it was fed. Dairy animals are highly sensitive to changes in feeding
regimes, and production can fall dramatically with small variations on a day-to-day basis. A
good farmer should set a good feeding schedule and as much as possible adhere to it.
DAIRY COW PERFORMANCE PER COUNTY
(L/COW/DAY)
Minimum Maximum AVERAGE
Elgeyo/Marakwet 10 14 12
Uasin Gishu 10 26 15
Nandi 10 29 14

8
Baringo 13 14 13
Samburu 5 7 6
Bungoma 10 14 11
Machakos 8 10* 9
Nakuru 7 10 8
Trans Nzoia 18 31 21
*Mr. Kyalo produces about 50L / Cow/ Day
Samburu had the least production at 5L /cow/day while Trans Nzoia had the Highest at
31L/cow/day.
3.0 Milk disposal
3.1 Milk price
Prices in the market varied significantly. The minimum price was Ksh 15 / L, recorded in
Elgeyo-Marakwet County, with the maximum price of Ksh 40 / L recorded in Bungoma County.
The mean price was Ksh 27.525 / L.
3.2 Milk disposal channels
The study had four ways of milk disposal;
(i) Home consumption
The mean home milk consumption was 4.925 L. The average home milk consumption per capita
per day was found to be 0.801L i.e. 4.925L / 6.15persons. This finding indicated that the
consumption per person was 400% more than the recommended milk consumption per day of
200ml. The excess consumption could be cut to increase revenue to farm families. However, the
consumed milk represented the income saved for the farm families. The value of the milk
consumed per day per cow was Ksh 30.809. Given that the mean number of animals was 4.4
cows, milk consumed per cow per person per day was approximately 0.2L.This was Ksh 7 per
cow per day for one family member.
ANALYSIS OF HOME CONSUMED MILK PER DAY

9
Mean
Home Consumption (L) 4.925
No. of animals 4
Price / L (Ksh) 27.525
Value of home consumption / day (Ksh) 135.561
Amount of Home Consumption/ cow / day (L) 1.119
Value of home consumption / cow / day (Ksh) 30.809
(ii) Sold milk
The mean quantity of milk sold was 50.125L worth Ksh 1379.691 per farm per day. Quantity of
milk sold per cow was 11.392 worth Ksh 313.566. The highest quantity of milk sold per cow was
25.83L and the minimum was 2L per animal. Make sales represented 82.85% of the total milk
harvested.
ANALYSIS OF MILK SOLD PER DAY
Mean
Sold milk / day (L) 50.125
No. of animals 4
Price / L (Ksh) 27.525
Revenue / day (Ksh) 1379.691
Quantity of milk sold / cow / day (L) 12.5
Value of quantity sold / cow / (Ksh) 344.9
(iii) Milk consumed by calves
The mean quantity of milk given to calves was 1.65L per calve per day. The amount was 33% of
the recommended 5 L / Calve per day. The value of the milk consumed by the calves was Ksh
45.42. This value forms part of the production cost.
(iv) Spoiled/spilled milk
The study recorded quantities of spoiled milk per day for the dairy farmers. The mean quantity
was 0.08L / animal per day. This represented loss of revenue to the farmer hence a cost to the
production process. The value was Ksh 2.20
However, the total value of milk produced per cow per day(MV)= value of milk consumed at
home(MH) + value of milk sold(MS) + value of milk consumed by calves(MC) + value of milk
spoiled/ spilled(MB)
MV = 30.80 + 301.1 + 45.40 + 2.20
= Ksh 379.10

10
A presentation of milk disposal modes
79% is sold while 1% is spoiled or spilled. Therefore, the milk marketing channels was
found to be;

11
The channels above show a successful non- formal milk market. The major reason for this
success is the immediate cash flow requirement by farmers which results to dairy farming being
viewed as subsistence farming and not a business hence generating a poverty trap.
4.0 Cost of milk production.
(a) Transport
The mean milk transport cost to the market from the farm was Ksh 2.175 per litre. The minimum
cost was Ksh 0. The buyer came to the farm gate. This had a consequence in that the farmers
were being offered low prices. The maximum cost was Ksh 4. Dairy farmers who had the milk
market a distance away had to incur more cost to deliver the milk to the market.
(b) Water
The study found that farmers were giving 20L of water per day. It cost Ksh 5 for 20L. Ideally,
water should be available to dairy cattle at all times. If this is not possible a rule of thumb is to
Total
production
13.75L
Market
79%
Non-
Market
21%
Formal
28% Domestic
8%
Non-
formal
52%
Spoil
1%
Calve
12%

12
supply one litre for every ten kilograms of bodyweight plus one and a half litres per litre of milk
produced. The study assumed that the cows had an average of 400kg per cow hence should be
given a minimum of: (400/13.75) + (1.5 x 13.75) litres = 29.09 + 20.625 = 49.715 litres daily
(approx 50L)
(c) Repairs & Maintenances
Repair and maintenance cost had a mean value of Ksh 4.25. However, 50% of dairy farmers did
not carry regular repairs and maintenance in the dairy farm.
(d) Labour
Labour as a factor of production is crucial in dairy production. The mean value of labour cost per
day was Ksh 63.5775. The activities involved by this cost were forage cultivation and harvesting,
milking and marketing, watering etc.
Types of feeds can be divided into:
Forages: these include Napier grass, hay, grass, maize (Stover and residues) plants, and banana
pseudo stems. Fodder legumes like leucaene (Leucaena leucocephala), calliandra (Calliandra
calothyrsus), sesbania (Sesbania sesban) and gliricidia (Gliricidia sepium). Different types of
forages have different nutritional value to the animal. It is therefore necessary to mix or change
between forages over time. Forages can be easily grown in your farm (if space is available) or
purchased from neighboring farms. Although forages are relatively cheaper to buy than other
types of feeds, a commercial dairy enterprise should endeavor to produce at least a proportion of
the required forages.
Concentrates: these include wheat bran, maize germ, dairy meal, and pollard or maize bran.
These types of feeds cannot be produced on small or medium scale farms, as they require large
capital investments. However, in almost all areas where dairy farming is suitable there are
industries that specialize in producing and selling these types
Feed additives: e.g. minerals and vitamins, livestock salts, buffers, enzymes, probiotics yeast
and urea. These also have to be purchased and are an essential component of costs in a dairy
enterprise. For example, the enzymes cellulose and xylanase increase fiber digestibility by
reducing fiber and Dry Matter intake; probiotics (bacterial direct-fed microbes) produce
metabolic compounds that destroy undesirable organisms, provide enzymes that improve nutrient

13
availability, or detoxify harmful metabolites. Sodium Bicarbonate/Sodium Sesquicarbonate
(Buffer) increases dry matter intake and stabilizes rumen pH.
(e) Forage
The selected forages used in the study were as follows;
SELECTED FORAGES
LEGUME GRASS SILAGE HAY NAPPIER GRASS AVERAGE
PRICE PER KG 7.5 1.9 15 13.9 0.55 9.6
LAND: MEAN (Acre) 0.0713 1.915 0.0812 0.65 0.6275 0.7
FEEDING: KG/COW/DAY 1 36 2.2 7.175 22.5 68.9
FEEDING DURATION / YEAR (MONTHS) 3.3 11.3 0.825 3.8 5.8 4.8
FEEDING COST / COW / DAY 7.5 68.4 33 99.7325 12.375 52.2
The graph sows the cost per forage.
It was more expensive to feed cows on hay. The cost of hay was about Ksh 100 per day per cow.
The least expensive, but realy used was the legumes for protein. However, if legumes were to be
taken as grass, the cost could be higher because of the quantity needed.

14
The graph shows the prefered forage.
Fresh grass (36kg/cow/day) was more used to feed dairy cow than any other forage. This was
followed by napier grass at 27kg/cow/ day and the least used was the legumes at about
2kg/cow/day. Open grazing is prefered to others because of the limited cash flow by farmers.
However, farmers are faced with effects of weather patterns. In addition, low production results
to low income thus preveting investment in good feeds.
Land allocation for forages
Grass had the largest size of land allocation at a mean of 1.9 acres. Farmers had a located the hay
and nappier grass the same sizes of land. The least was legumes.
15
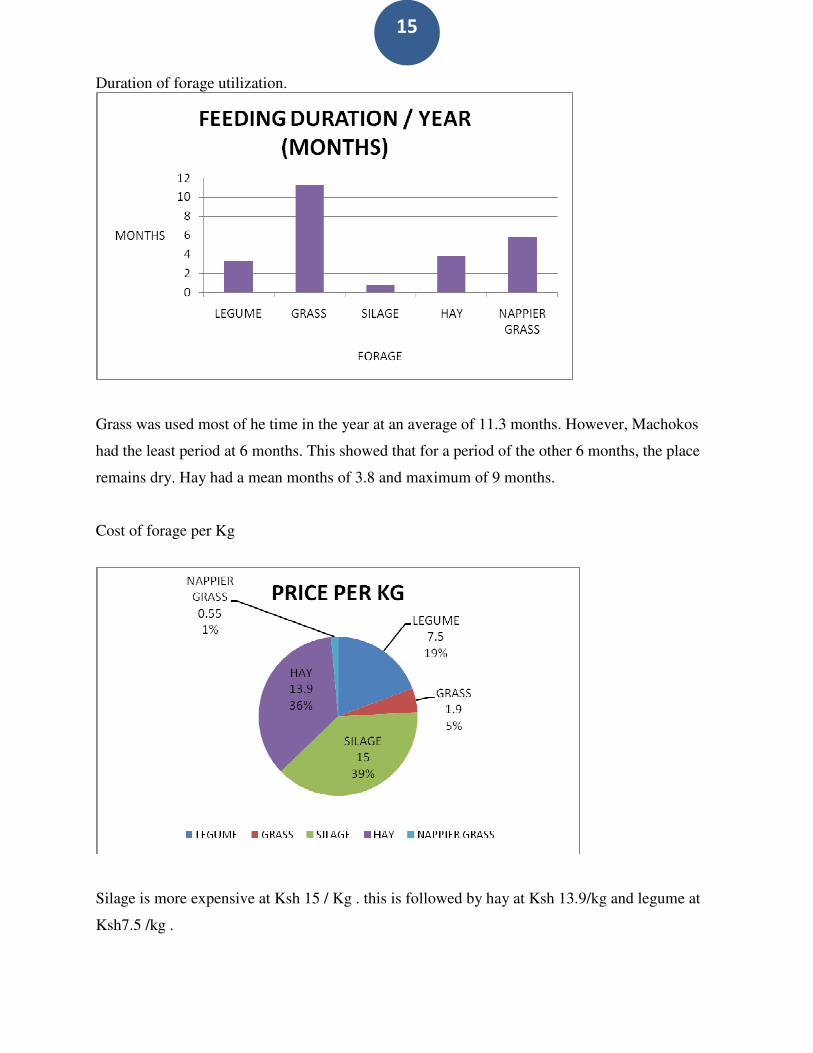
Duration of forage utilization.
Grass was used most of he time in the year at an average of 11.3 months. However, Machokos
had the least period at 6 months. This showed that for a period of the other 6 months, the place
remains dry. Hay had a mean months of 3.8 and maximum of 9 months.
Cost of forage per Kg
Silage is more expensive at Ksh 15 / Kg . this is followed by hay at Ksh 13.9/kg and legume at
Ksh7.5 /kg .

16
(f) Concentrates
The survey found that 90% of dairy farmers used concentrate e.g. dairy meal. The mean
concentrate used was 1.955kg per cow per day. This is below the recommended practice.
Furthermore, the mode of feeding is flat rate as opposed to target. Lactation period is 10 months
which takes 720kg of dairy meal. However, the mean month by farmers was found to be 8.4
months. This meant that cows were under fed which resulted to loss of milk production hence
farm income. Mean price of dairy meal was found to be Ksh 18.625 per kg which translated to
Ksh 36.4 per cow per day.
DAIRY MEAL QUANTITY /COW /DAY (Kg)
Mean 1.9550
Median 2.0000
Minimum .00
Maximum 4.00
Alternative approaches to feeding concentrates
Challenge feeding: This method of concentrate feeding is traditionally recommended for cows
in early lactation. Begin with a low level of concentrates, such as four kilograms of dairy meal
per day, and gradually increase the amount of concentrates fed each day until the point is reached
when adding more concentrate does not result in an increase in the next day’s milk production.
Continue with this level of feeding for the first 12 weeks of the lactation. After 12 weeks, the
amount of concentrates fed should depend on the milk yield. If the cow is fed on good quality
forage it should be able to produce five to ten litres of milk per day on forage alone. For every
litre of milk produced over and above five litres, feed half to one kilogram of concentrate. So, for
a cow producing eight litres of milk per day after 12 weeks, feed one to two kilograms of
concentrate per day.
Flat rate feeding: Feeding a constant amount of concentrates, for example two kilograms per
day, throughout the entire lactation is not recommended. During early lactation the concentrate
fed is insufficient, while during late lactation it will be too much.

17
Targeted concentrate feeding: If financial constraints mean it is not possible to feed as much
concentrates as would be ideal, then it is best to feed all the concentrates available during early
lactation. Cows produce more milk during early lactation and they need plenty of nutrients to
support this. Also, the amount of milk they produce during this period influences the amount of
milk they will produce later in the lactation - the more milk they produce in early lactation, the
more milk they will give in late lactation.
A comparison between flat rate and targeted feeding is shown in following box. Targeted feeding
is probably the simplest and most effective way for most smallholder farmers to feed
concentrates.
FLAT RATE Vs TARGETED FEEDING
FLAT RATE
TARGETED
FEEDING
Concentrates
2.4 kg per day for 10
months
8 kg per day for first 3
months only
During the first 3 months
cow gives 8 litres milk
per day
cow gives 15 litres milk per
day
During next 7 months
cow gives 6 litres milk
per day cow gives 5.5 litres per day
Total milk yield over 10 month lactation 1,980 litres 2,505 litres
Total amount concentrate fed 720 kg 720 kg
Cost of concentrate fed (@KSh1500/70kg) Ksh 15,429 Ksh 15,429
Value of milk produced over entire lactation
(@KSh25 per litre) Ksh 49,500 Ksh 62,625
Profit: value of milk less cost of feed Ksh 34,071 Ksh 47,196
Benefit from targeted feeding _ Ksh 13,125
Source: ILRI, Manual and Guide No. 2
(g) Feed additives
The survey dwelt on mineral salt. The mean per day was 95.63g per cow worth Ksh 15.8 per day.
(h) Vet services
AI or Bull was not amortized. Vet services cost Ksh 21.9 per day
18
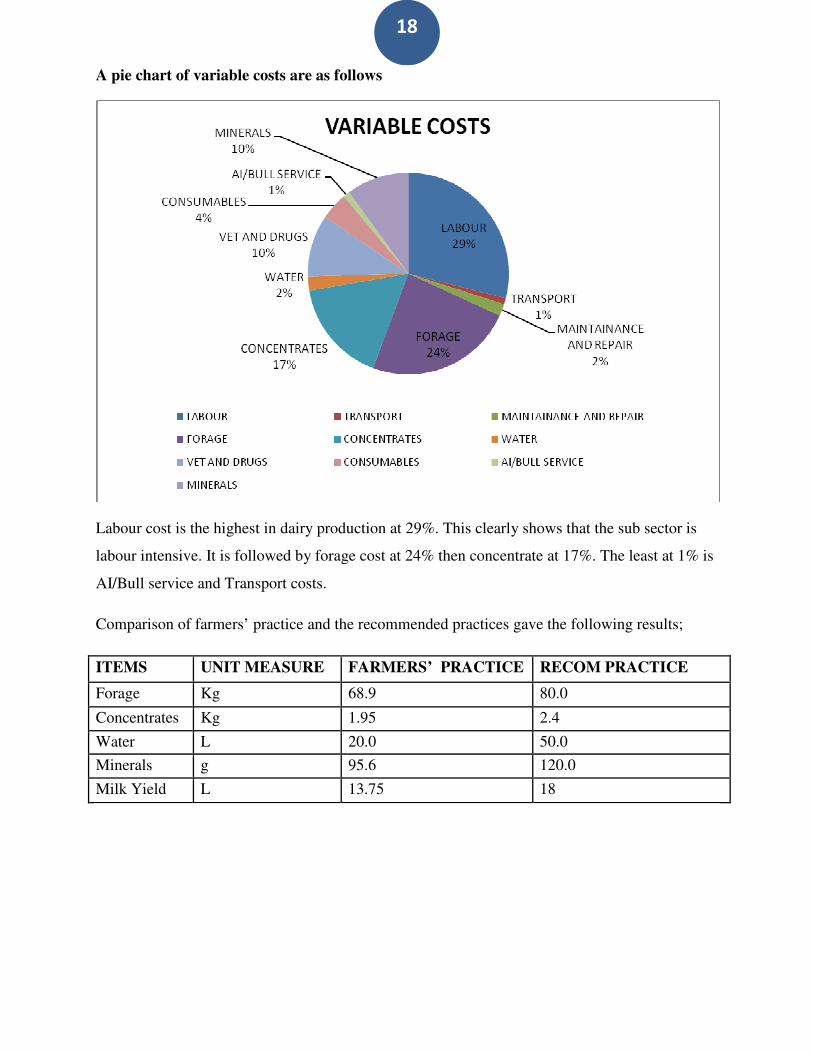
A pie chart of variable costs are as follows
Labour cost is the highest in dairy production at 29%. This clearly shows that the sub sector is
labour intensive. It is followed by forage cost at 24% then concentrate at 17%. The least at 1% is
AI/Bull service and Transport costs.
Comparison of farmers’ practice and the recommended practices gave the following results;
ITEMS UNIT MEASURE FARMERS’ PRACTICE RECOM PRACTICE
Forage Kg 68.9 80.0
Concentrates Kg 1.95 2.4
Water L 20.0 50.0
Minerals g 95.6 120.0
Milk Yield L 13.75 18

19
GROSS MARGIN
A summary of gross margin analysis is as give;
FARMERS'
PRACTICE
RECOMMENDED
PRACTICE
Total Revenue 379.10 495.45
Total Variable Expenses 219.67 228.30
Gross margin/cow/day 158.79 267.15
Gross margin/variable expenses 0.72 1.17
Gross margin / Labour cost 2.50 4.45
Gross margin/concentrates cost 4.36 5.98
Average milk produced per cow per day 13.75 18.00
Variable cost of production per litre 15.98 12.68
As shown, farmers spend more in producing one litre of milk (Ksh 15.98) as compared to
recommended practices (Ksh 12.68). The higher cost of production means the profitability of
farmers’ practice is less.
The recommended practices give more revenues and hence gross margin than what the farmers
practice.
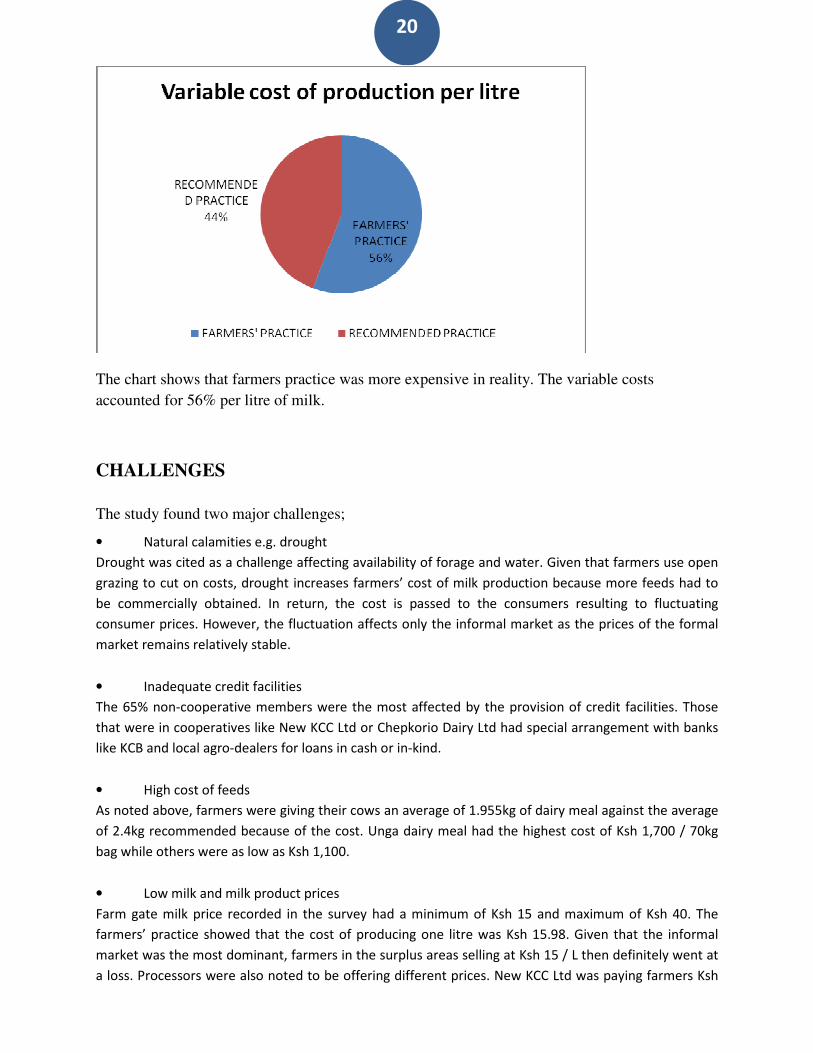
20
The chart shows that farmers practice was more expensive in reality. The variable costs
accounted for 56% per litre of milk.
CHALLENGES
The study found two major challenges;
• Natural calamities e.g. drought
Drought was cited as a challenge affecting availability of forage and water. Given that farmers use open
grazing to cut on costs, drought increases farmers’ cost of milk production because more feeds had to
be commercially obtained. In return, the cost is passed to the consumers resulting to fluctuating
consumer prices. However, the fluctuation affects only the informal market as the prices of the formal
market remains relatively stable.
• Inadequate credit facilities
The 65% non-cooperative members were the most affected by the provision of credit facilities. Those
that were in cooperatives like New KCC Ltd or Chepkorio Dairy Ltd had special arrangement with banks
like KCB and local agro-dealers for loans in cash or in-kind.
• High cost of feeds
As noted above, farmers were giving their cows an average of 1.955kg of dairy meal against the average
of 2.4kg recommended because of the cost. Unga dairy meal had the highest cost of Ksh 1,700 / 70kg
bag while others were as low as Ksh 1,100.
• Low milk and milk product prices
Farm gate milk price recorded in the survey had a minimum of Ksh 15 and maximum of Ksh 40. The
farmers’ practice showed that the cost of producing one litre was Ksh 15.98. Given that the informal
market was the most dominant, farmers in the surplus areas selling at Ksh 15 / L then definitely went at
a loss. Processors were also noted to be offering different prices. New KCC Ltd was paying farmers Ksh

21
24.80 / L when Brookside was offering Ksh 27.00. Informal market had fluctuating prices resulting to
farmer income fluctuation which causes poor planning for the dairy business.
• Pest and diseases
Pest and diseases lowered the productivity of a cow. This meant that the income of the dairy farmer
went down. Some vaccines like one for foot and mouth disease were reported exhausted from the
DVO’s office, Ksh 20 per dose, and the cost of acquiring the same elsewhere was out of reach for most
farmers.
• Poor infrastructure
Most rural roads were marrum roads. These roads lowered the quality of milk through time taken to
reach the buyer. During wet seasons, they become impassible making farmers fail to deliver their milk to
the processors or other buyers. Milk chillers were only noted in three counties i.e. Elgeyo/marakwet,
Uasin Gishu and Nandi.
• Exploitation by middlemen
Middlemen were offering between Ksh 17 – 20. The exploitation came as a result of lack or ineffective
dairy farmers’ cooperatives.
• Late payment by buyers
New KCC Ltd was cited as one of the buyers who paid the dairy farmers very late i.e. past mid month.
• Poor breeds
Most cows were crosses. The high yielding pure breeds were left to the well-off farmers.
• Inadequate market during peak periods
Milk demand tends to be inelasticity. In addition, the capacity of processors is limited.
• Inadequate extension services

22
50% of the dairy farmers were occassionally (once in three months) visited by the
extension agents. 25% had never (once or not all in a year) been visited nor had they
seen extension agents. According to DLPO, Keiyo South District, this had been occasion
by the inadequate staff in the Ministry of Livestock Production. The 10% farmers who
were been visted very often (atleast once per week) had the highest milk production with
a maximum of 31L/cow/day. This indicates a positive relationship between extension and
milk production.
SUCCESS SECRETS
THE farmers who had 18L and above of milk listed their success secrets as;
(a) Putting the acquired knowledge into practice
(b) Attending workshops, seminars and other forms to improve the knowledge
(c) Being a model farmer
(d) Practice zero-grazing
RECOMMENDATIONS/ POLICY
The study gives an implication that the smallholder dairy system is can improve profitability
under current conditions. Dairy sector is thus an important area for public and donor investment
for income and employment generation. However, some specific policy themes could have a
major positive impact on smallholder dairying cost structure and profitability in future
1. Strategic milk reserve
(a) to stabilize milk production shortfalls in the dry season
(b) Invest in processing of long life dairy products
2. Absorb excess production
(a) Expand to nontraditional markets
(b) Investment in infrastructure
3. Speedy implementation of the national livestock feed policy- to guide and promote on
farm feed preservation

23
TRANSPORTERS
45% of the transporters used either bicycles or motorcycles. 30% used foot, 10% used tractor and
pickup each while 5% used Lorries. Given the remoteness of most of the producers and the poor
state of infrastructure, the first transportation mean used is usually a bike, foot or for particularly
inaccessible areas a donkey. However, none acknowledged using a donkey to transport milk
citing the consequences in the public health rules.
Most milk purchased by bike hawkers is sold to larger traders who operate pickups or Lorries
and collect milk from milk surplus areas to transport it to milk deficit areas. Some of the pick-up
and lorries also operate on behalf of processors. In order to meet the costs, the pick-ups and
lorries buy milk at a lower price and sell at a higher price since the pick-ups and lorries need to
transport back the milk aluminum containers, the return trip cannot be used to generate
additional revenues.
The illegality of informal market is a barrier to entry for the establishment of a large transport
company. For the formal market, processors have trucks to with upto 30 ton capacity. According
to KDB, ferrying milk in unregistered transporter is illegal.
CHILLING / BULKING
According to KDB, milk should be cooled within 2 hours from the moment it is milked. The
main objective of chilling is to preserve the quality of raw milk and reduce spoilage before milk
is subjected to further processing. Chilling plants are either established by processors (Brookside
chiiling plant in Eldoret, New KCC Ltd chilling plant at Cheptiret or Kamariny e.t.c.) or owned
in at least some percentage by producers - sometimes they are donor funded – like the ones in
Lessos, Metkei, Chepkorio e.t.c.

24
Milk is either collected by the plant or delivered by producers or brokers. Milk is tested for
quality upon delivery and if accepted, milk is placed in a cooling tank to reduce its temperature
to approximately 40C. After the milk is cooled, it is usually dispatched to processors and
transported to their chilling or processing plant. Most of the costs of chilling are fixed in the
short term, making utilization the main driver of profitability. The main components of operating
expenses are salaries and electricity/power. Labor cost is fixed in the short term, and the
electricity needed to run the cooling operation is somewhat lower if volume is lower, but it is not
proportional to the milk in the tank. Additionally, some chilling plants are not connected to the
power grid, or have unreliable power supply and thus need to use diesel powered generators.
This additionally increases the cost of operation.
CHEPKORIO DAIRY LTD
GROSS MARGIN ANALYSIS PER LITRE
QTY
UNIT
PRICE TOTAL
REVENUE
SALES OF MILK (New KCC
Ltd) 1 32.5 32.5
TOTAL REVENUE 32.5
VARIABLE COSTS
TRANSPORT 1 2.5 2.5
ADMINISTRATION 1 2.8 2.8
CESS -KDB 1 0.2 0.2
CHILLING COST 1 1 1
Payment to farmers 26
TOTAL VARIABLE COST 32.5
GROSS MARGIN 0
To be sustainable a chilling plant needs to be either forward or backward integrated as a cost
center of producers or processors.
Processors Currently, the quality of the milk produced in Kenya hardly reaches the regional standards, and
falls substantially short of international standards. According to the information from New KCC
Ltd, milk accounted for the largest cost. Confidentiality occasioned by competition made it
difficult to obtain information. The firm has a capacity of 80,000L per day but was operating at

25
56.25% capacity. Milk deliveries had 67% from farmers’ cooperatives, 16% from farmers’ direct
deliveries, 13% from chilling plants and 4% from subsidiary plants.
80% of farmers met minimum milk quality standards. Since milk collection is conducted only in
the morning, evening milk in particular is of poor quality when received by processors and
hawkers the following morning. A poor cold chain also lowers the quality of processed milk and
prevents processors from producing long life products that need the high quality input.
Milk purchasing price were arrived at through negotiation but fell within government regulatory.
The major customers for the processed milk were schools, supermarkets, army barracks and
major hotels. The processors do the deliveries to the points of sale every morning.
The challenges the processor faces were fluctuating weather pattern resulting to supply
fluctuation and under capacity utilization (56.25% for New KCC Ltd, 94% for Chepkorio Dairy
Ltd etc), the taxation policy distort dairy investment decisions (high level of taxation for yogurt
processing versus other forms of processing), less flexibility in pricing decisions unlike informal
market and purchasing milk per volume and not quality hence stiff competition from the
informal market.
The coping mechanism during periods of acute shortage of milk supply is to import milk powder
to produce fresh milk. It was recommended that farmers be taught on dry period milk
production.
Distributors/Agents
Once milk is processed, agents or distributors deliver it to a point of sale. These actors are
numerous and spread all over the country. They have target and ready market for the processed
milk. Most of the clients are urban retailers. More of long life products are stocked. The
challenges were on storage facilities and competition from the informal market.
Retailers/ hawkers
Hawkers are mobile and large in number selling milk door to door. They source their milk from
farmers or brokers. Milk handled by hawkers face low quality levels occasioned by poor milk
handling and transportation, adulteration by means of addition foreign matters like water,
peroxide, margarine, wheat flour etc. hawkers have no financial credit incentive from financial
institutions. However, they have formed their merry-go-rounds to meet their financial demands.

26
Although according to KDB it is illegal to sell raw milk to consumers in municipalities, market
is striving. Hawkers are flexible to price changes. Their motivation is on customer loyalty and
cash basis of payment although some sell on credit.
Retailers are stationary and rely on customer loyalty. They face competition from hawkers who
are mobile. They operate in kiosks, stores, supermarkets and so on. Have credit access in the
financial institutions. Challenges are the milk perishability coupled by inadequate storage
facilities, high levies from KDB and public health and milk adulteration by farmers or brokers.
Unlike hawkers, 87% of retailers knew milk quality requirements.
Attempts to justify the difference of Ksh 10 between the buying price and the selling price were
done by Kalyet Daries, a milk bar, as follows;
COST JUSTIFICATION - KALYET DAIRIES
QTY UNIT PRICE VALUE
REVENUE 1500 35 52500
TOTAL REVENUE 52500
RENT 1 1500 1500
DETERGENT 1 500 500
POLYTHENE 15 17 255
WATER 1 500 500
LABOUR 1 2500 2500
ELECTRICITY 1 300 300

27
CHARCOAL 2 400 800
RAW MILK 1500 25 37500
TRANSPORT 1500 2 3000
TOTAL VARIABLE COSTS 46855
GROSS MARGIN /MONTH 5645
It was noted that variable costs increased the value of milk by Ksh 6. Other fixed costs were
given as follows;
MUNICIPAL PERMIT 4000
KDB 3100
HEALTH PERMIT 150
CONSUMERS
Informal market connects producers to consumers normally via a number of brokers. Informal
market thrives because raw milk is more attractive to a large number of consumers. 100% of the
consumers interviewed consumed fresh milk. The reasons for this was that , first, most milk is
consumed immediately, usually mixed with tea, so most Kenyans buy milk in small quantities
when needed due to lack of storage facilities like refrigerators . Secondly, raw milk is perceived
as creamer and richer and lastly, consumers believe that boiling makes raw milk safe for
consumption, reducing the willingness to pay a premium for pasteurized milk.
Quantity of milk and milk products consumed per week and unit prices.
QUANTITY OF
FRESH MILK
CONSUMED / WEEK
(L)
PRICE OF
FRESH MILK
CONSUMED / L
(Ksh)
QUANTITY OF
YOGHURT
CONSUMED /
WEEK (L)
PRICE OF
YOGHURT
CONSUMED / L
(Ksh)
QUANTITY OF
MALA
CONSUMED /
WEEK (L)
PRICE OF
MALA
CONSUMED / L
(Ksh)
Mean 11.8500 29.3000 2.0000 70.0000 5.2500 35.0000
Minimum 3.00 20.00 2.00 70.00 1.00 30.00
Maximum 21.00 45.00 2.00 70.00 10.00 40.00
On average, 11.85L of fresh milk is consumed per week with a mean price per liter at Kshs
29.30. The highest price of Ksh 45 / L was recorded in Bungoma, while the least price per liter of
Ksh 20 in Baringo, Eldama Ravine. However, the amount of fresh milk consumed per week
depends on the size of the family.
70% of the consumers were aware of the milk quality requirement. Challenges cited by the
consumers were milk supply flactuation, poor hygeinic milk handling conditions, non-
observance of clinical regulations e.g. milking during the fisrt 3 days of vaccinationand 7 days
after birth and price flactuations.

28
70% of the consumers favoured government intervention in the sector. Reasons for this was to
ensure standards are maintained and elimination of consumer exploitation. The recommedation
was the enforcement of laws afeetciong milk marketing.
KEY INFORMANTS (institutions)
1. KDB
It is the enforcement agent for the Dairy Industry Act Cap 336. It also implements the
Public Health Act (Cap. 242) through traders and processors licensing. There is a policy
in place that determines the quality standards on dairy marketing. These standards were
developed by a board for the East Africa. However, 90% of market actors comply with
these minimum quality standards requirements. The consequence for non-compliance to
the minimum quality standards requirements is the enforcement of the law (court,
warnings, confiscation and destruction). Licensing of the dairy industry is as follows;
Size of trader License cost
(Ksh)
Mini-dairies (less than 5,000L per
day)
3,100
Mini dairy (5,000 to 100,000L Per
day)
6,000
Large Processor (100,000L per day) 25,000
Lack of license fetches a fine of Ksh 3,000.
Ksh 0.20 per liter levy is charged to the farmers against milk delivered to a processor.
Another Ksh 0.20 per liter levy is charged to processors. The processors’ levy was
effective January 2010.
The milk industry is operating in a free market hence no proper price determining
mechanism. The distribution channels in Kenya are not adequate because of poor roads.
Challenges in maintaining the minimum quality standards requirements are;
• Most of the containers used by farmers are plastic
• Low hygiene among farmers
• Large informal sector
• Competition e.g. Zambia is insisting on medical certification from Kenyan
farmers hence locking the Kenyan milk products out of the market.
• High prevalence of diseases.
2. KEBS
It enforces the Standards Act Cap 496 laws of Kenya. KEBS does the certification of
milk processors. The procedure is as follows;
Steps Activity Processor Fees
(Ksh)
Remarks
1 Registration Small
firms
5,800

29
Big firms 20,000 Ksh 7,500 is charged for every
product
2 Assessment of the
processing exercise
3 Collection of the
sample
4 Recommendation &
certification
5 Issue of 1 year permit
Non-compliance to the minimum standard requirements results to a firm being barred
from the market and a maximum fine of Ksh 1.5m.
The challenge is that KEBS lacks the resources and capacity to adequately monitor the
milk industry starting from feed quality, creating loopholes for some feed manufacturers
to reduce quality standards, especially when certain feed ingredients are expensive in the
market.
3. EXTENSIONISTS
• The roles of the Ministry of Livestock Development in milk marketing are the group
formation and value addition.
• 30% of farmers comply with the minimum standard requirement. Farmers use;
(a) Plastic containers
(b) Poor milking conditions e.g. minimal milk sheds are being used.
(c) Adding water to milk and other chemical substances
(d) Use of informal market to dispose their milk
(e) Not observing clinical directions
(f) Use of poor feeds hence milk causing human diseases.
• Challenges in the dairy industry
(a) Poor roads
(b) Poor livestock breeds
(c) Improper feeding
(d) Pests and diseases
• Remedies
Training of farmers
RECOMMENDATION
The Dairy Value Chain faces the economics and challenges. Some of the challenges arise
because of non –enforcement of existing laws. Quality awareness needs to be enhanced across
the actors. The productivity also should be improved and cut on informal market share by
reviving the collapsed or dormant cooperatives.

30
CONCLUSION
This study aimed at finding whether there is a gap between farmers’ practice and the
recommended practices and the challenges along the milk value chain. The study has shown that
farmers’ practice was the most expensive with 56% of variable costs going for the production of
one litre of milk. It has also shown that farmers’ profitability could be increased. The farmers got
a gross margin of Ksh 158.79 as opposed to recommended of Ksh 267.15. There is unexploited
potential in dairy production. The farmers were earning only 59.4% of the potential income.
Milk handling from farmers needs a strong intervention like milk coolers. The handling and
feeding has affected milk quality across the value chain. There is a need therefore to enhance the
existing laws to improve the milk quality to enable Kenya reach the external markets.
Value chain
FARMER
TRANSPORT

31
REFERENCES

32
(i) GOK 1997: District Development Plan, Uasin Gishu Distrcit, Government printer,
Nairobi
(j) Peeler, E.J. and A.O. Omore (1997): Manual of Livestock Production Sytems in Kenya
2nd
Edition KARI/DFID, NARP II, National Veterinary Reaserch Centre, Kikuyu, Kenya
(k) Muriuki, H.G 2001: Kenya Country Paper. Apaper presented at the South-South
Workshop on mall holder dairy production and marketing – constraints and opportunities, 13th
–
16th
March 2001, Anand, Gujarat.
(l) Thorpe,W, H.G Muriuki, A. Omore, M.O. Owango and S. Staal 2000: dairy development
in Kenya dairy. The past, the present and the future. Paper prepared for the annual symposium of
animal production society of Kenya 22nd
– 23rd
March 2000. Nairobi, Kenya
(m) Thorpe, W, P.N. De Leeuw, A. Omore and S. Staal 1998: dairy production systems in the
Tropics, ILRI, Niarobi.
(n) Stotz, D 1983: production techniques and economics of smallholder livestock production
system in kenya. Nairobi, kenya
(o) GOK (2001) Ministry of agriculture and rural development. Proposed dairy development
policy. Unpublished.
(p) Margaret Lukuyu et al(2007): Feeding Dairy Cattle: A manual for smallholder dairy
farmers and extension workers in East Africa. ILRI Manual and guide No. 2. Nairobi, Kenya
APPENDIX
33
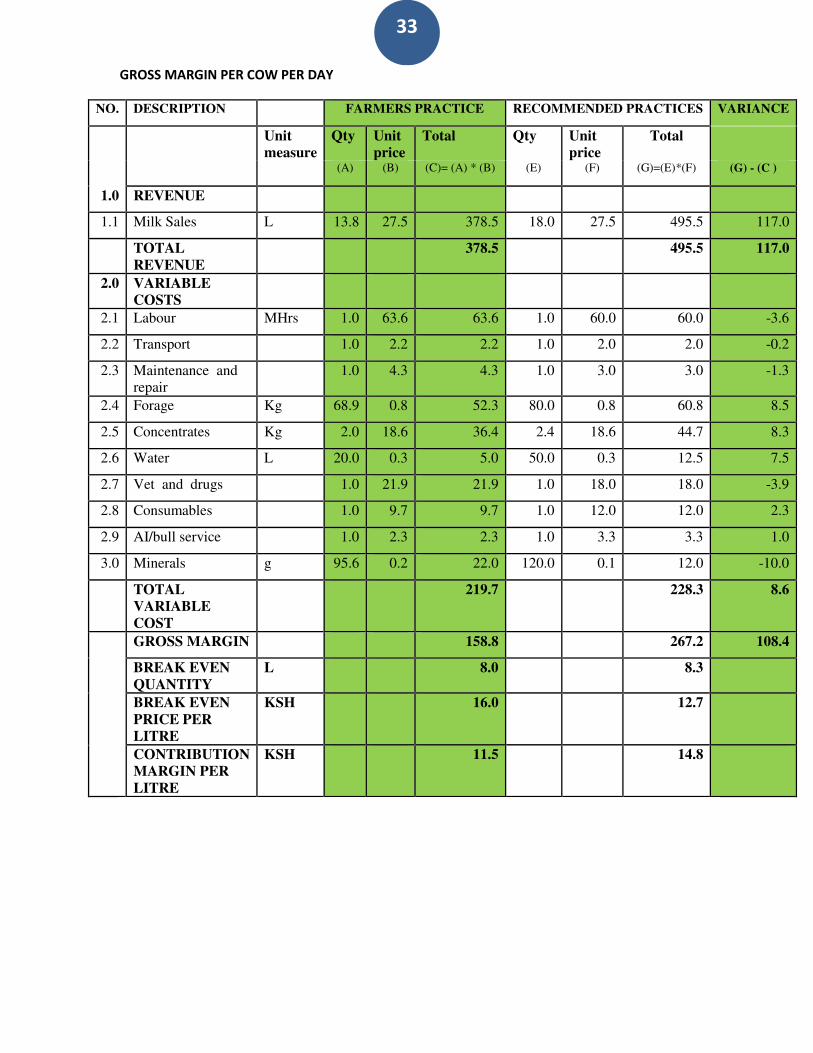
GROSS MARGIN PER COW PER DAY
NO. DESCRIPTION FARMERS PRACTICE RECOMMENDED PRACTICES VARIANCE
Unit
measure
Qty Unit
price
Total Qty Unit
price
Total
(A) (B) (C)= (A) * (B) (E) (F) (G)=(E)*(F) (G) - (C )
1.0 REVENUE
1.1 Milk Sales L 13.8 27.5 378.5 18.0 27.5 495.5 117.0
TOTAL
REVENUE
378.5 495.5 117.0
2.0 VARIABLE
COSTS
2.1 Labour MHrs 1.0 63.6 63.6 1.0 60.0 60.0 -3.6
2.2 Transport 1.0 2.2 2.2 1.0 2.0 2.0 -0.2
2.3 Maintenance and
repair
1.0 4.3 4.3 1.0 3.0 3.0 -1.3
2.4 Forage Kg 68.9 0.8 52.3 80.0 0.8 60.8 8.5
2.5 Concentrates Kg 2.0 18.6 36.4 2.4 18.6 44.7 8.3
2.6 Water L 20.0 0.3 5.0 50.0 0.3 12.5 7.5
2.7 Vet and drugs 1.0 21.9 21.9 1.0 18.0 18.0 -3.9
2.8 Consumables 1.0 9.7 9.7 1.0 12.0 12.0 2.3
2.9 AI/bull service 1.0 2.3 2.3 1.0 3.3 3.3 1.0
3.0 Minerals g 95.6 0.2 22.0 120.0 0.1 12.0 -10.0
TOTAL
VARIABLE
COST
219.7 228.3 8.6
GROSS MARGIN 158.8 267.2 108.4
BREAK EVEN
QUANTITY
L 8.0 8.3
BREAK EVEN
PRICE PER
LITRE
KSH 16.0 12.7
CONTRIBUTION
MARGIN PER
LITRE
KSH 11.5 14.8